1. Introduction
In the last years, a number of on-site characterization tests allowed for models to be defined to study the effects of seismic motion on real existing buildings, designed to sustain vertical loads only. The poor performances of the large part of the existing construction portfolio built before the development of consolidated seismic codes and standards, as underlined by the last seismic events, is surely one of the main motivations for these researches (e.g., [
1,
2,
3]).
The experimental study of seismic response of such buildings has often been carried on inside laboratories by means of static and dynamic tests on full scale or large-scale building models (e.g., [
4,
5,
6,
7,
8,
9,
10,
11,
12,
13,
14,
15]).
In situ tests on complete buildings are instead very limited because of both economic and practical issues, but advantages of testing actual buildings instead of mock-up specimens is an undoubtful added value to this research topic. Working on actual buildings allows knowledge to be widened because: (i) Uncertainties of a construction built in a not controlled environment are included and (ii) tested structures are subjected to real ageing and actual degradation. In addition, the presented case study considers private house building while most testing in literature is about public buildings, which usually has different characteristics for geometry, typology, and materials. The main problems of on-site testing of real structures are the availability of a building to be tested and the design of the reaction system for the application of the lateral force. In some cases the latter problem has been solved constructing additional structures, placed externally or connected to the building to be tested (such as steel frames or RC elements). In other cases, the reaction structure was obtained from the specimen itself, separating and reinforcing a part of it. Depending on the actuation system, tests can be static, cyclic, or dynamic, and the response is usually analyzed accordingly, i.e., in terms of pushover curves, distribution of damage and plastic hinges, vibration modes, and equivalent damping.
A few examples are available in literature, with different objectives and testing approaches. An interesting study was carried out to assess the effects of different retrofit strategies on a building in Bagnoli (Italy) built in the ‘70s [
16]: The structure was cut into 6 parts, each of which were reinforced with a different seismic retrofit technique, and cyclic quasi-static and free dynamic vibration tests were carried out. In Yangmei Town [
17], one of the schools damaged by the 1998 earthquake was cut into four parts in order to obtain two specimens and two reaction structures for static pushover tests and dynamic tests. In the cities of Huliaen and Yulin [
18] four pushover tests were completed on site on two existing schools to test the criticalities of the construction methods and the different techniques for seismic retrofit. In L’Aquila [
19], on-site dynamic tests were conducted on one of the 185 seismically isolated buildings belonging to the C.A.S.E project. In Solarino [
20], an RC building designed in accordance with the regulations in force in 1975 and never completed was adapted to the technical standards through the construction of a hybrid base isolation system, and dynamically tested letting it be free to oscillate after imposing an initial displacement.
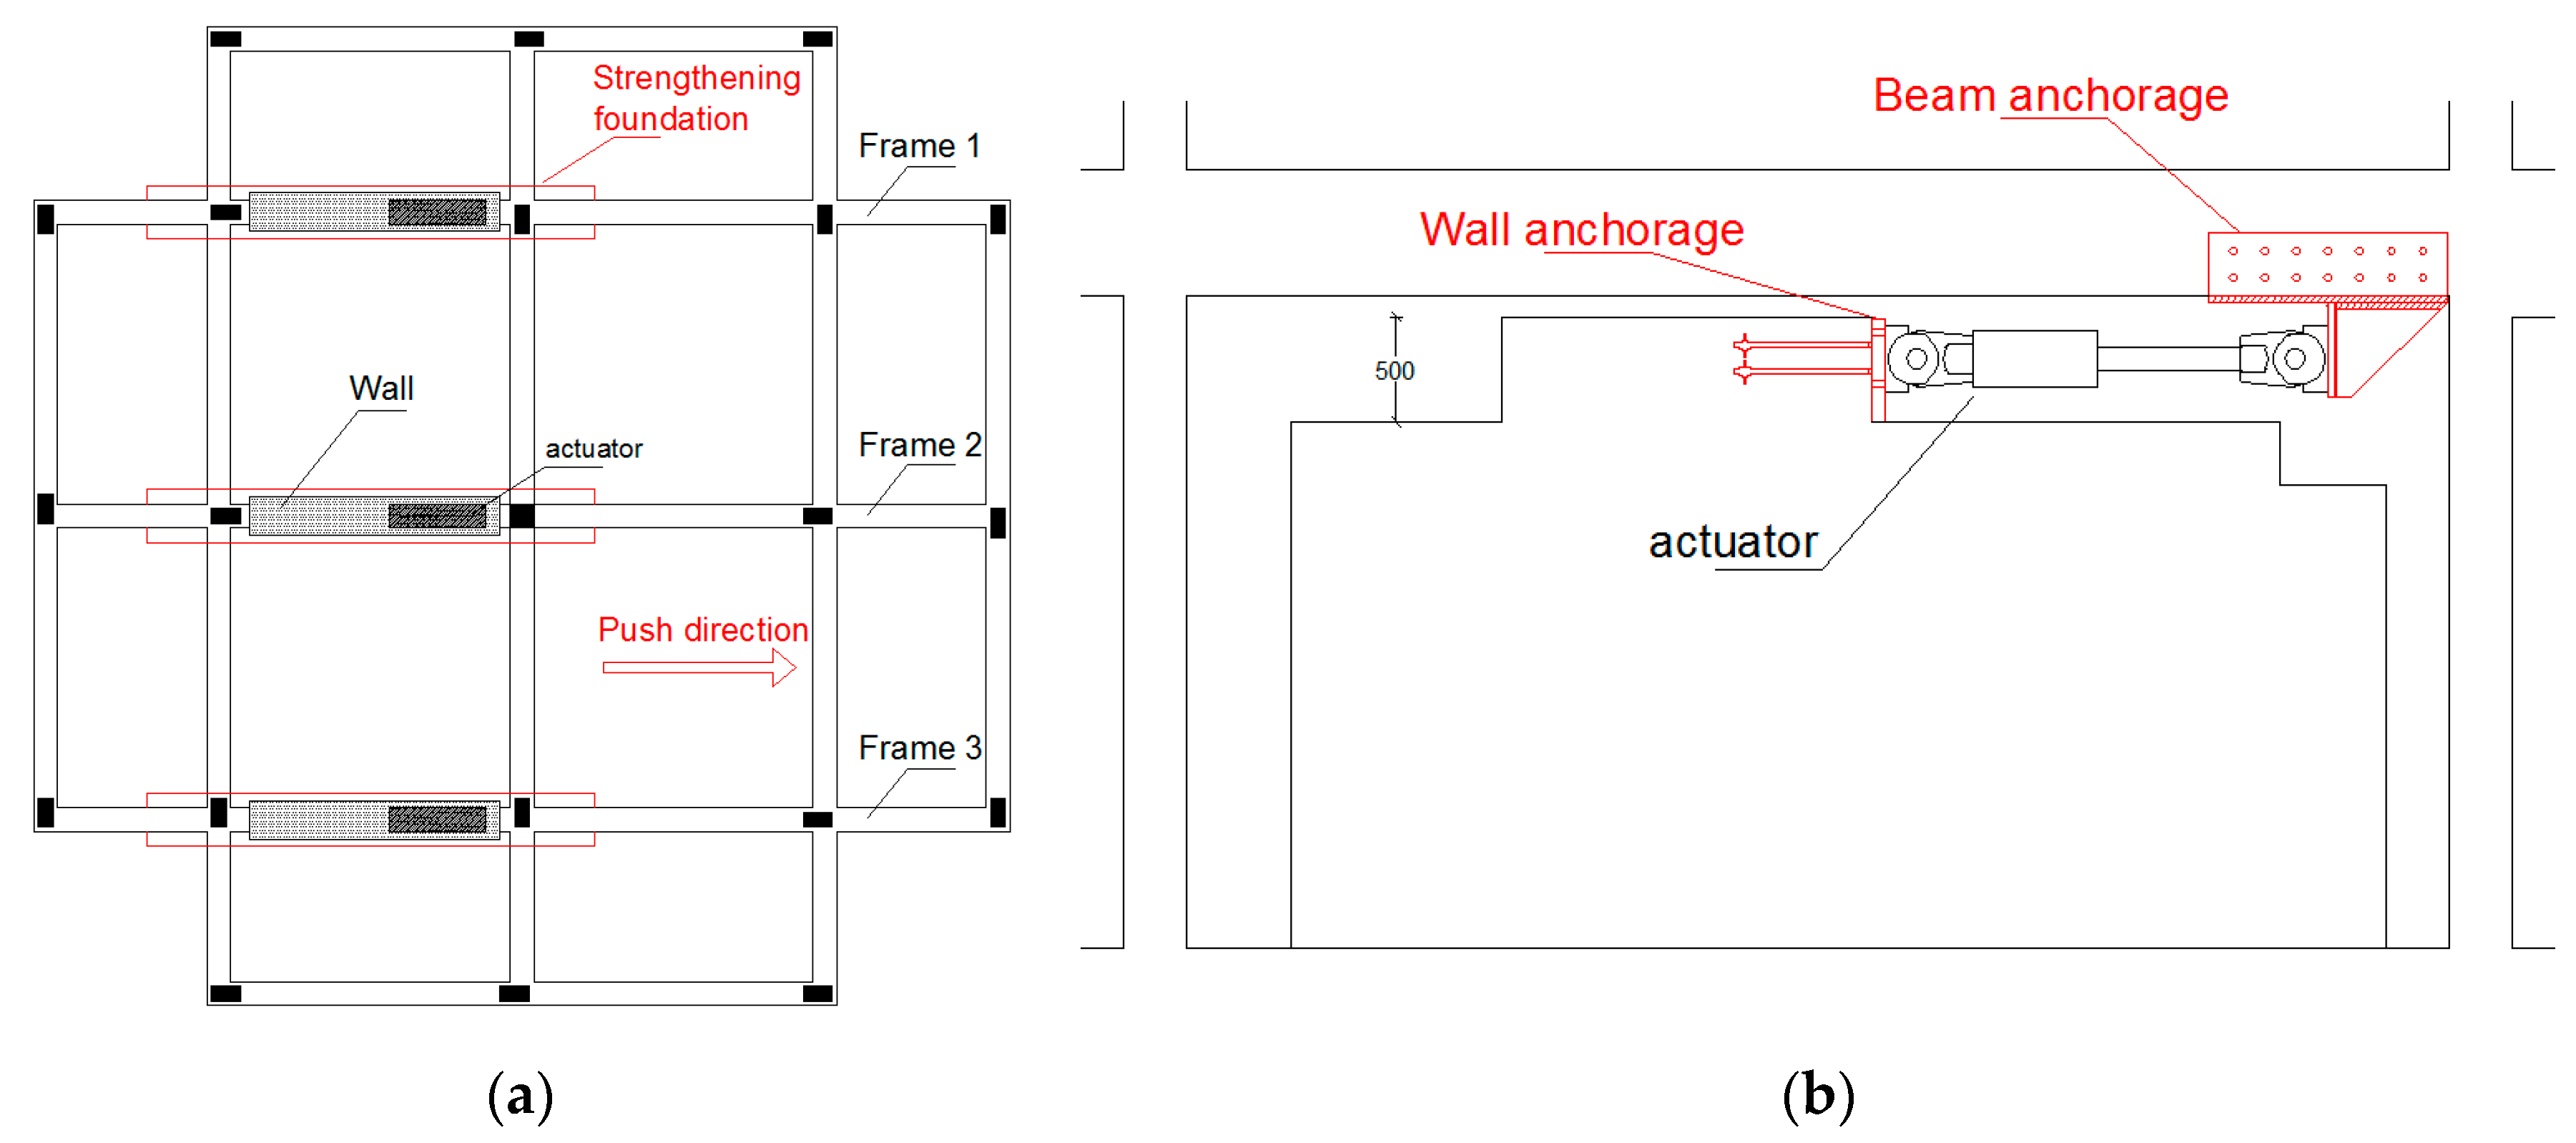
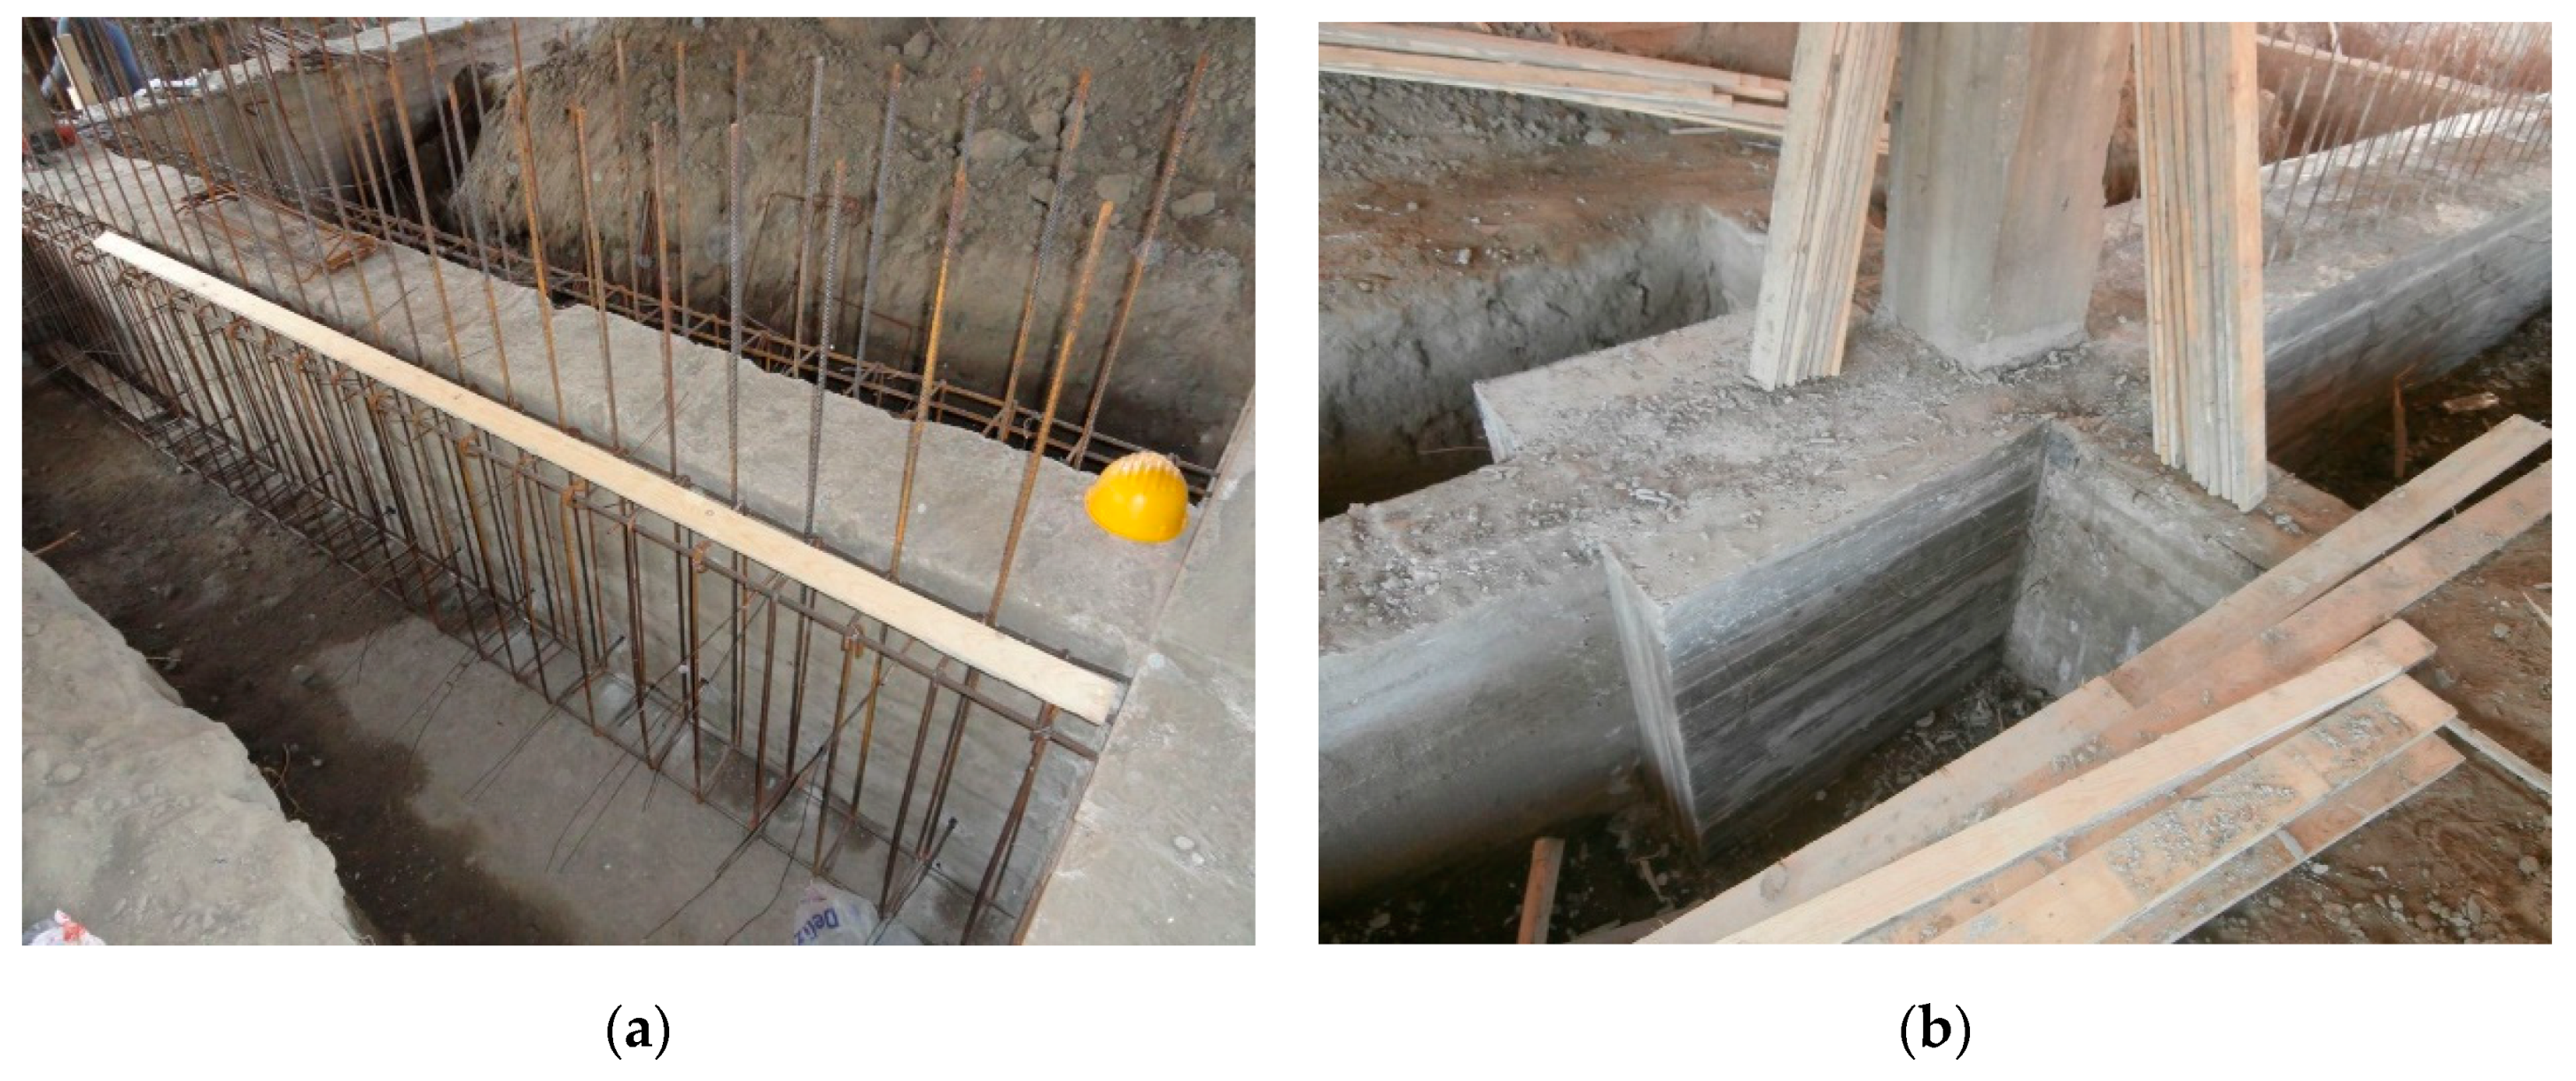
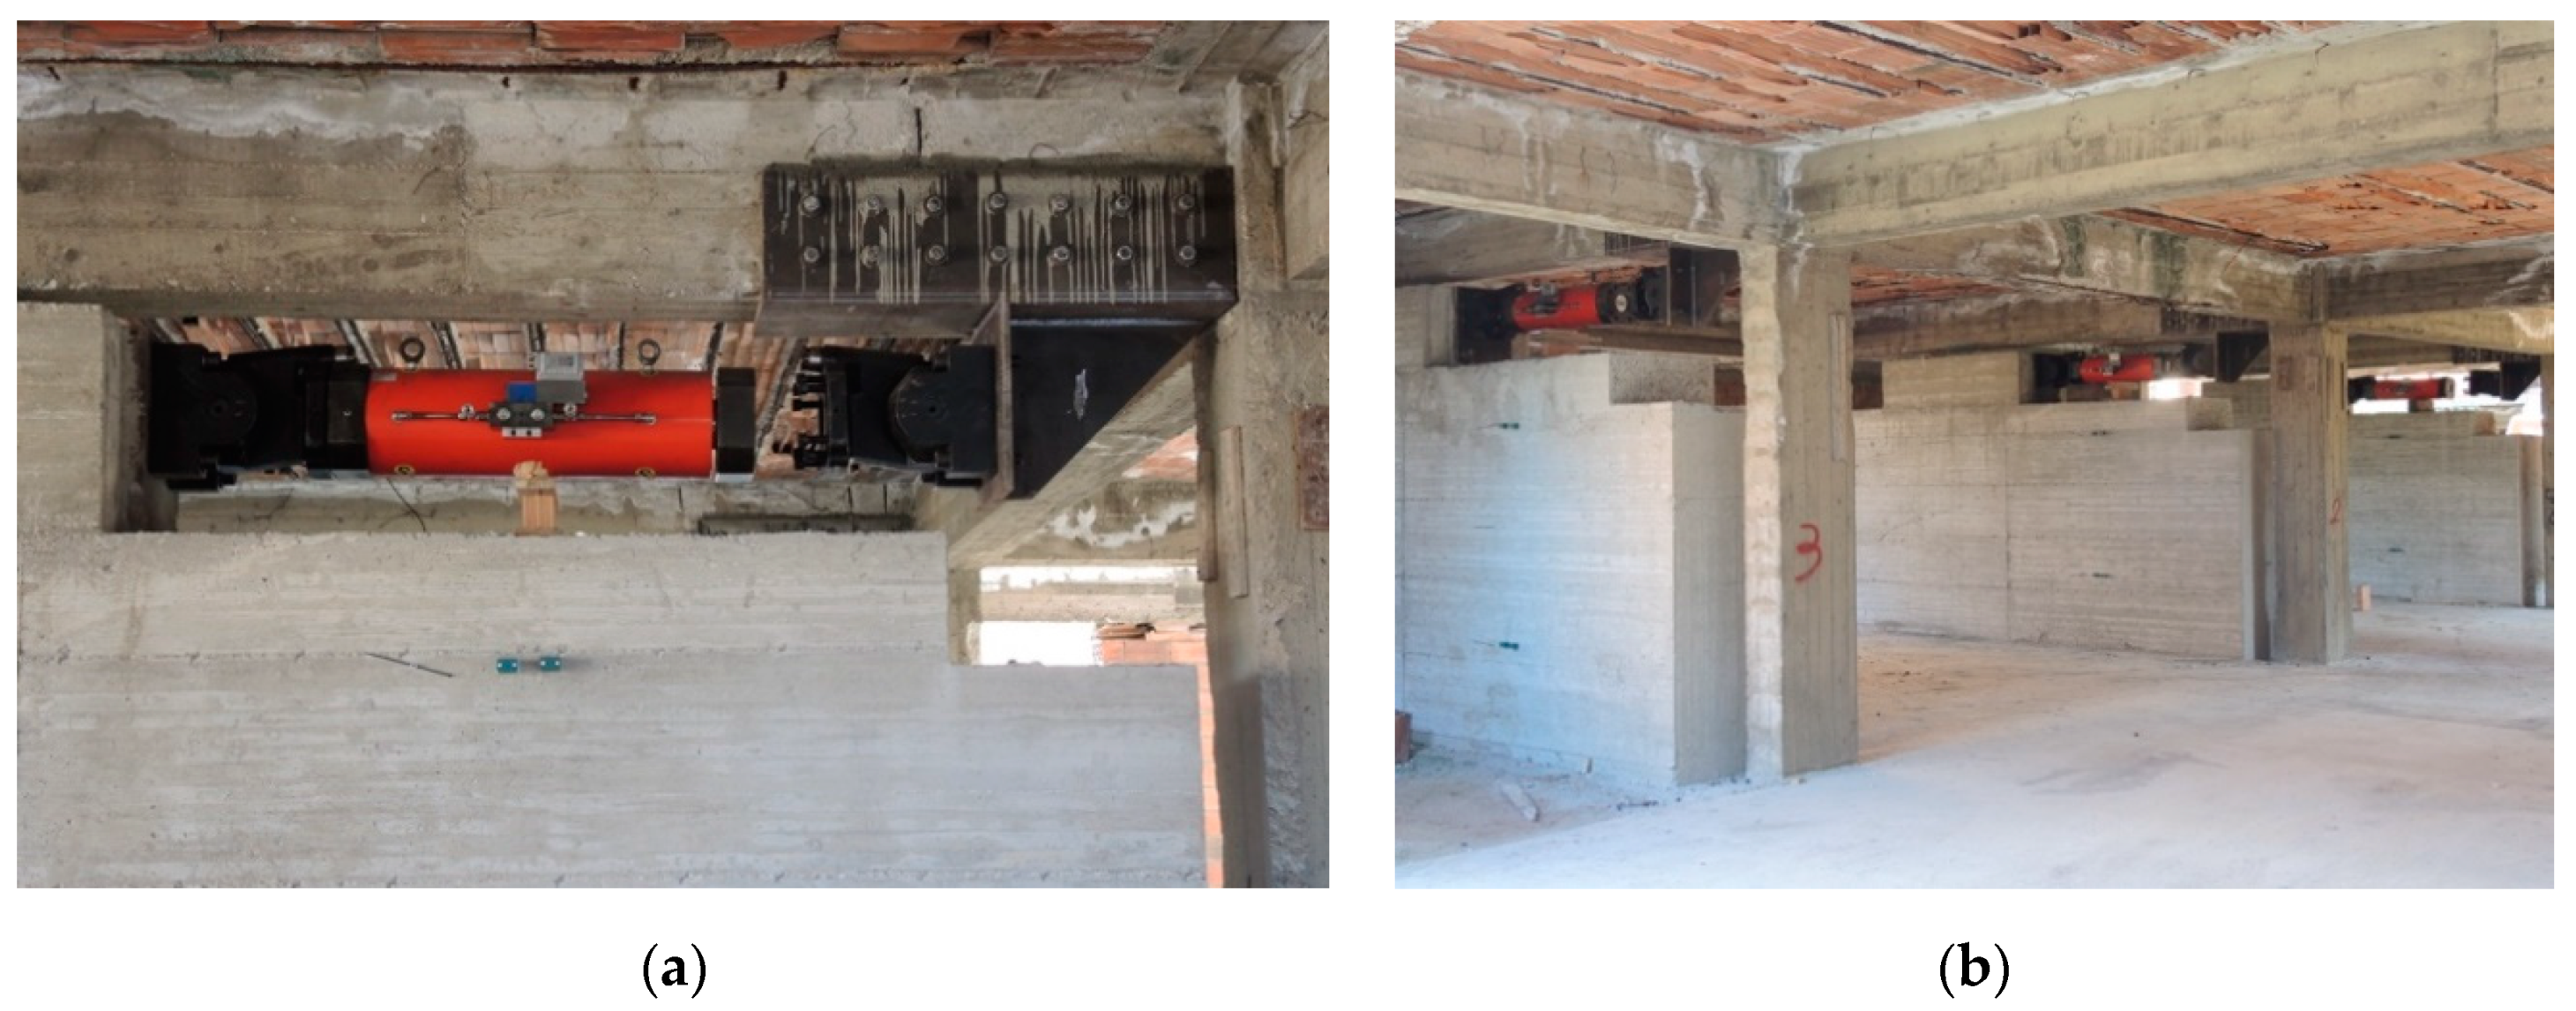
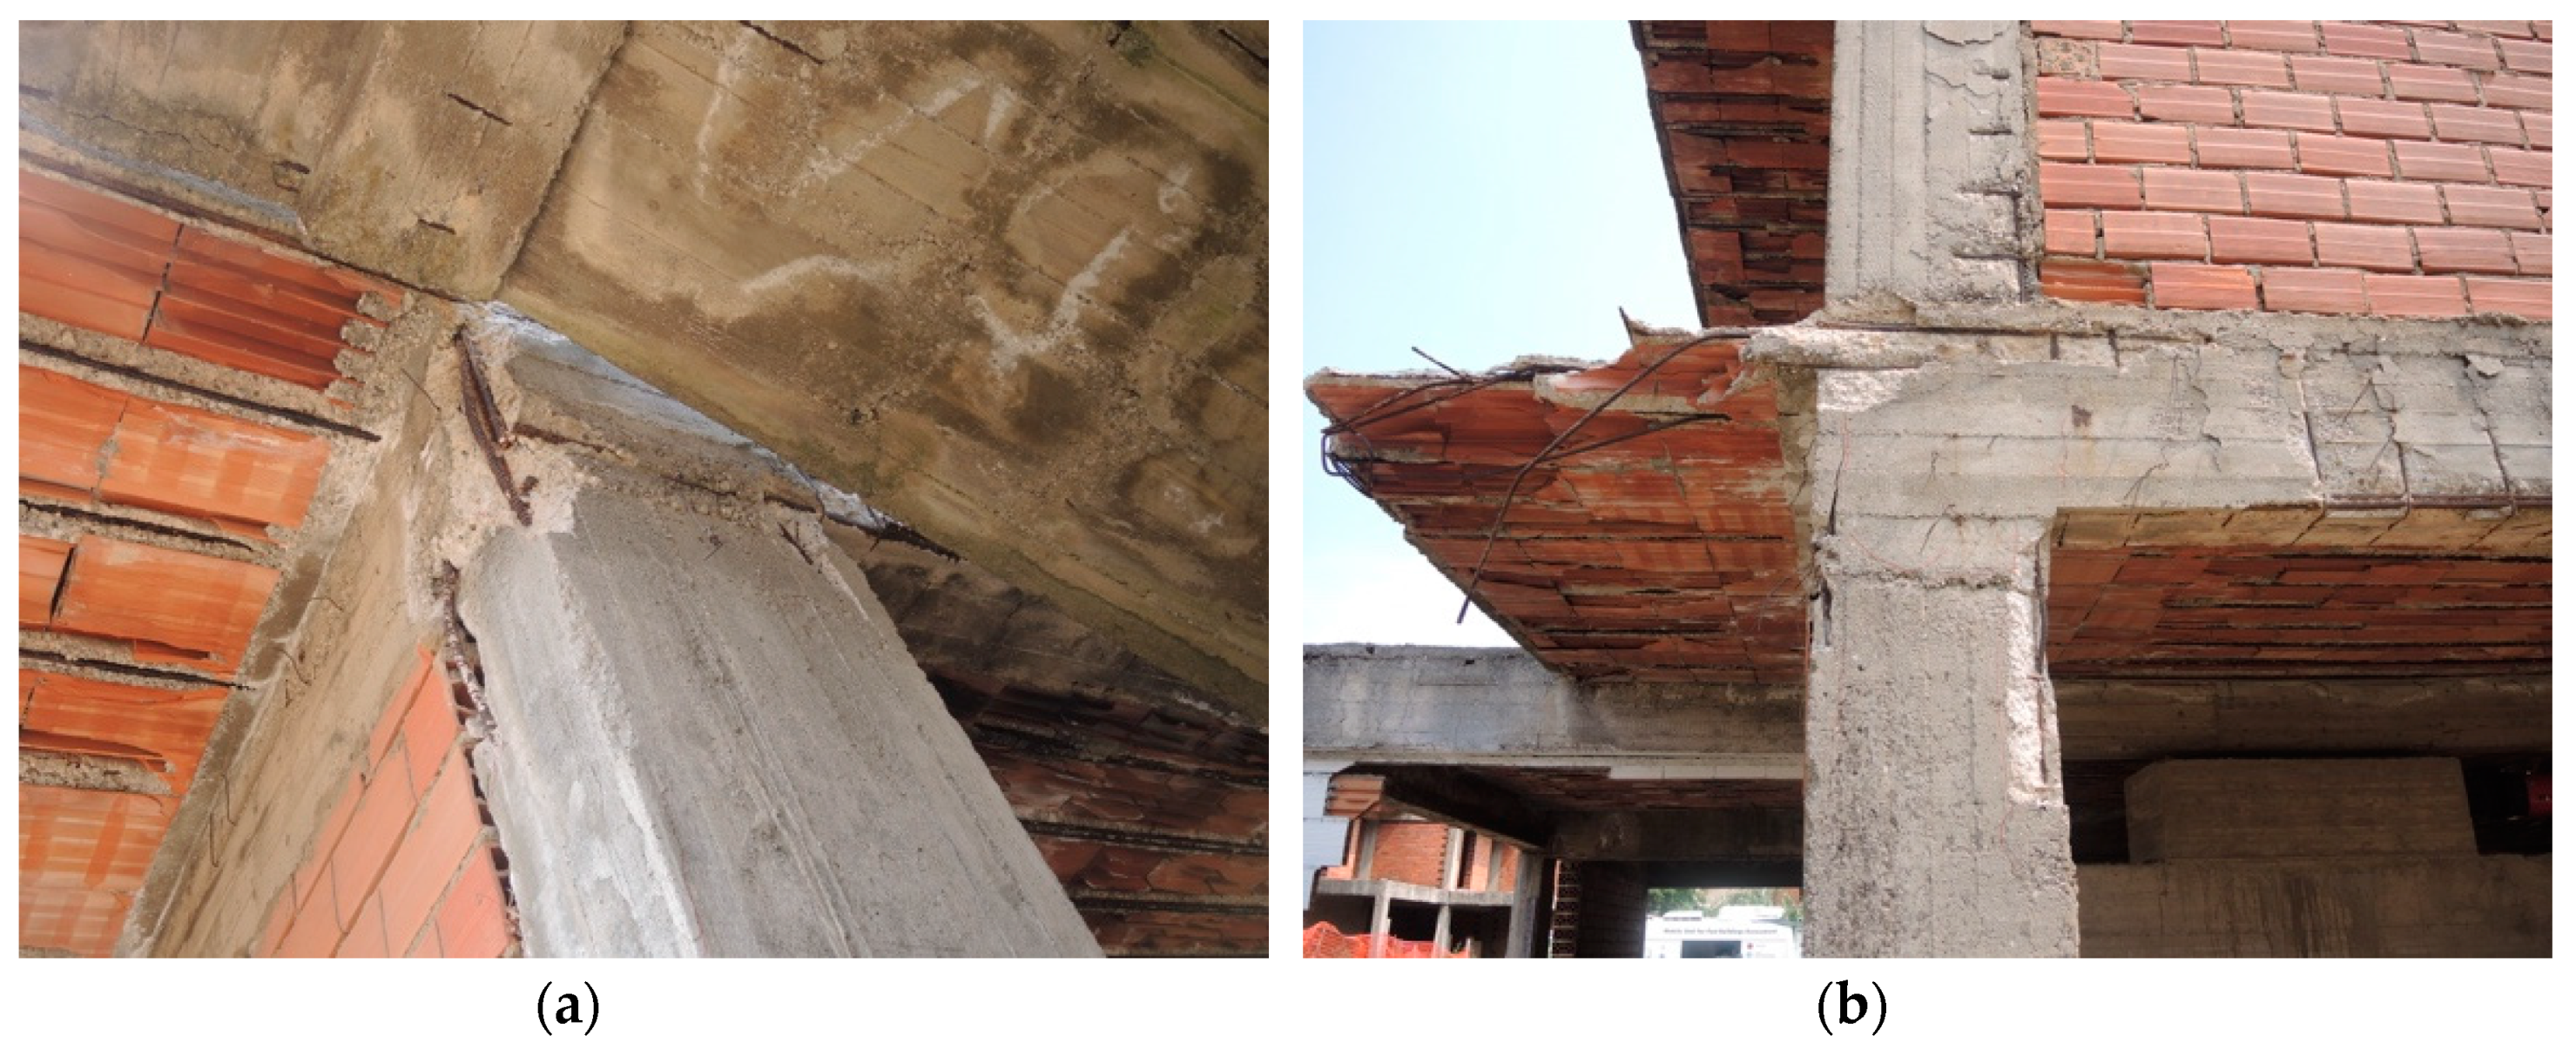
The pseudo-static test, described in this article, consisted of the application of push–pull cycles to a real frame building to study the response of a structure designed in the ‘80s for gravity loads only. The design was done according to out-of-date regulations that did not properly consider the seismic demand either at the input level or in the building detailing. Three walls were built inside the structure and connected with the existing foundation (
Figure 1a) in order to counteract the forces applied to the beams of the first floor (
Figure 1b). To predict the response and design the test setup, a number of numerical models and pushover analysis of the structure have been carried out, in order to account for the uncertainties related to the mechanical characteristics of the materials, to the deformable/rigid floor response, and to the contribution of the infill panels. The numerical analyses were finalized to obtain the capacity of the structure in terms of both force and displacement, the ductility reserve, and the most likely sequence of formation of plastic hinges.
2. Case Study
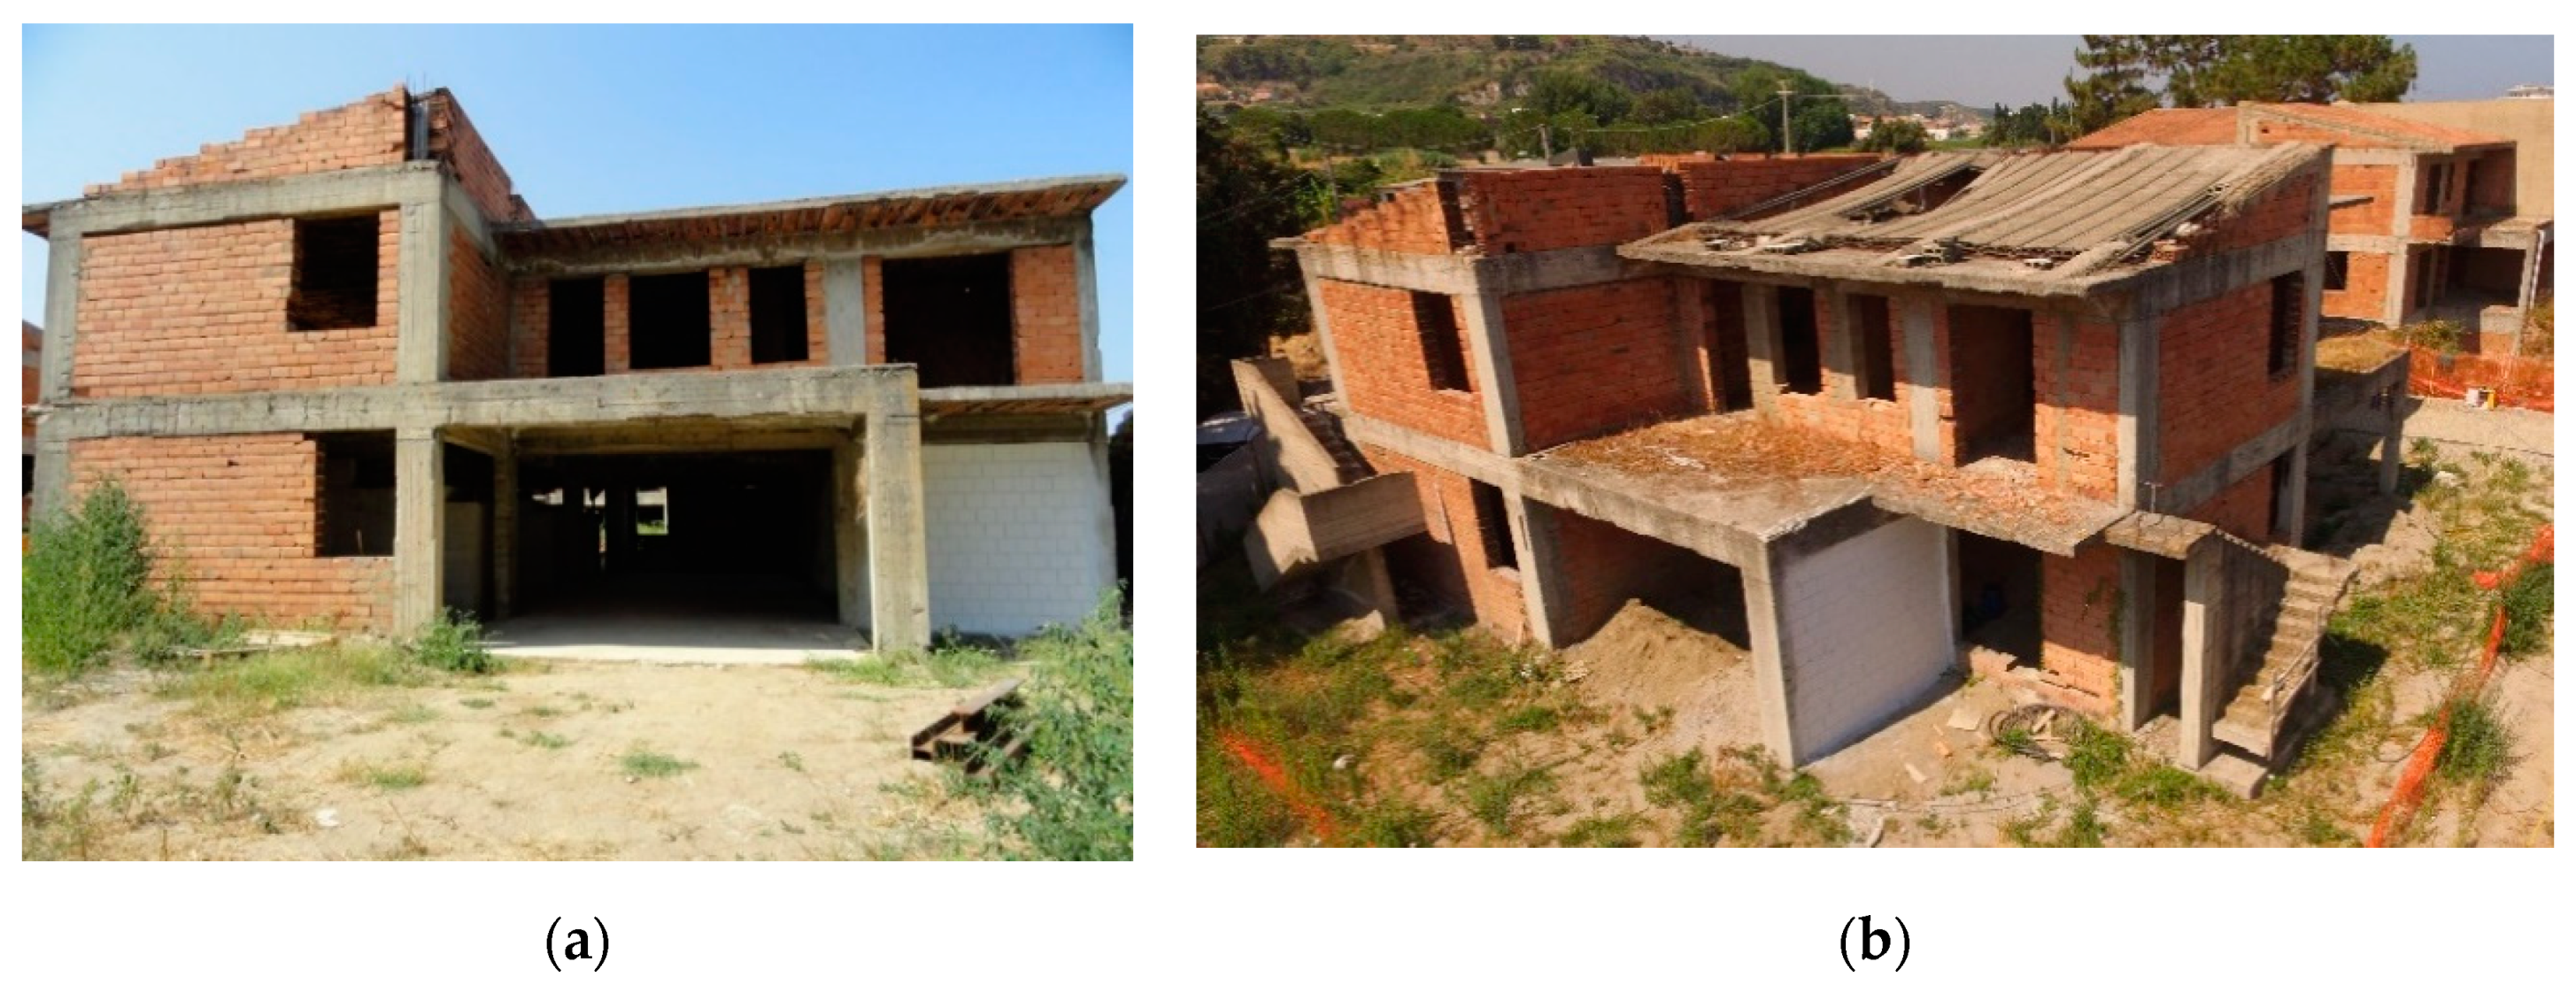
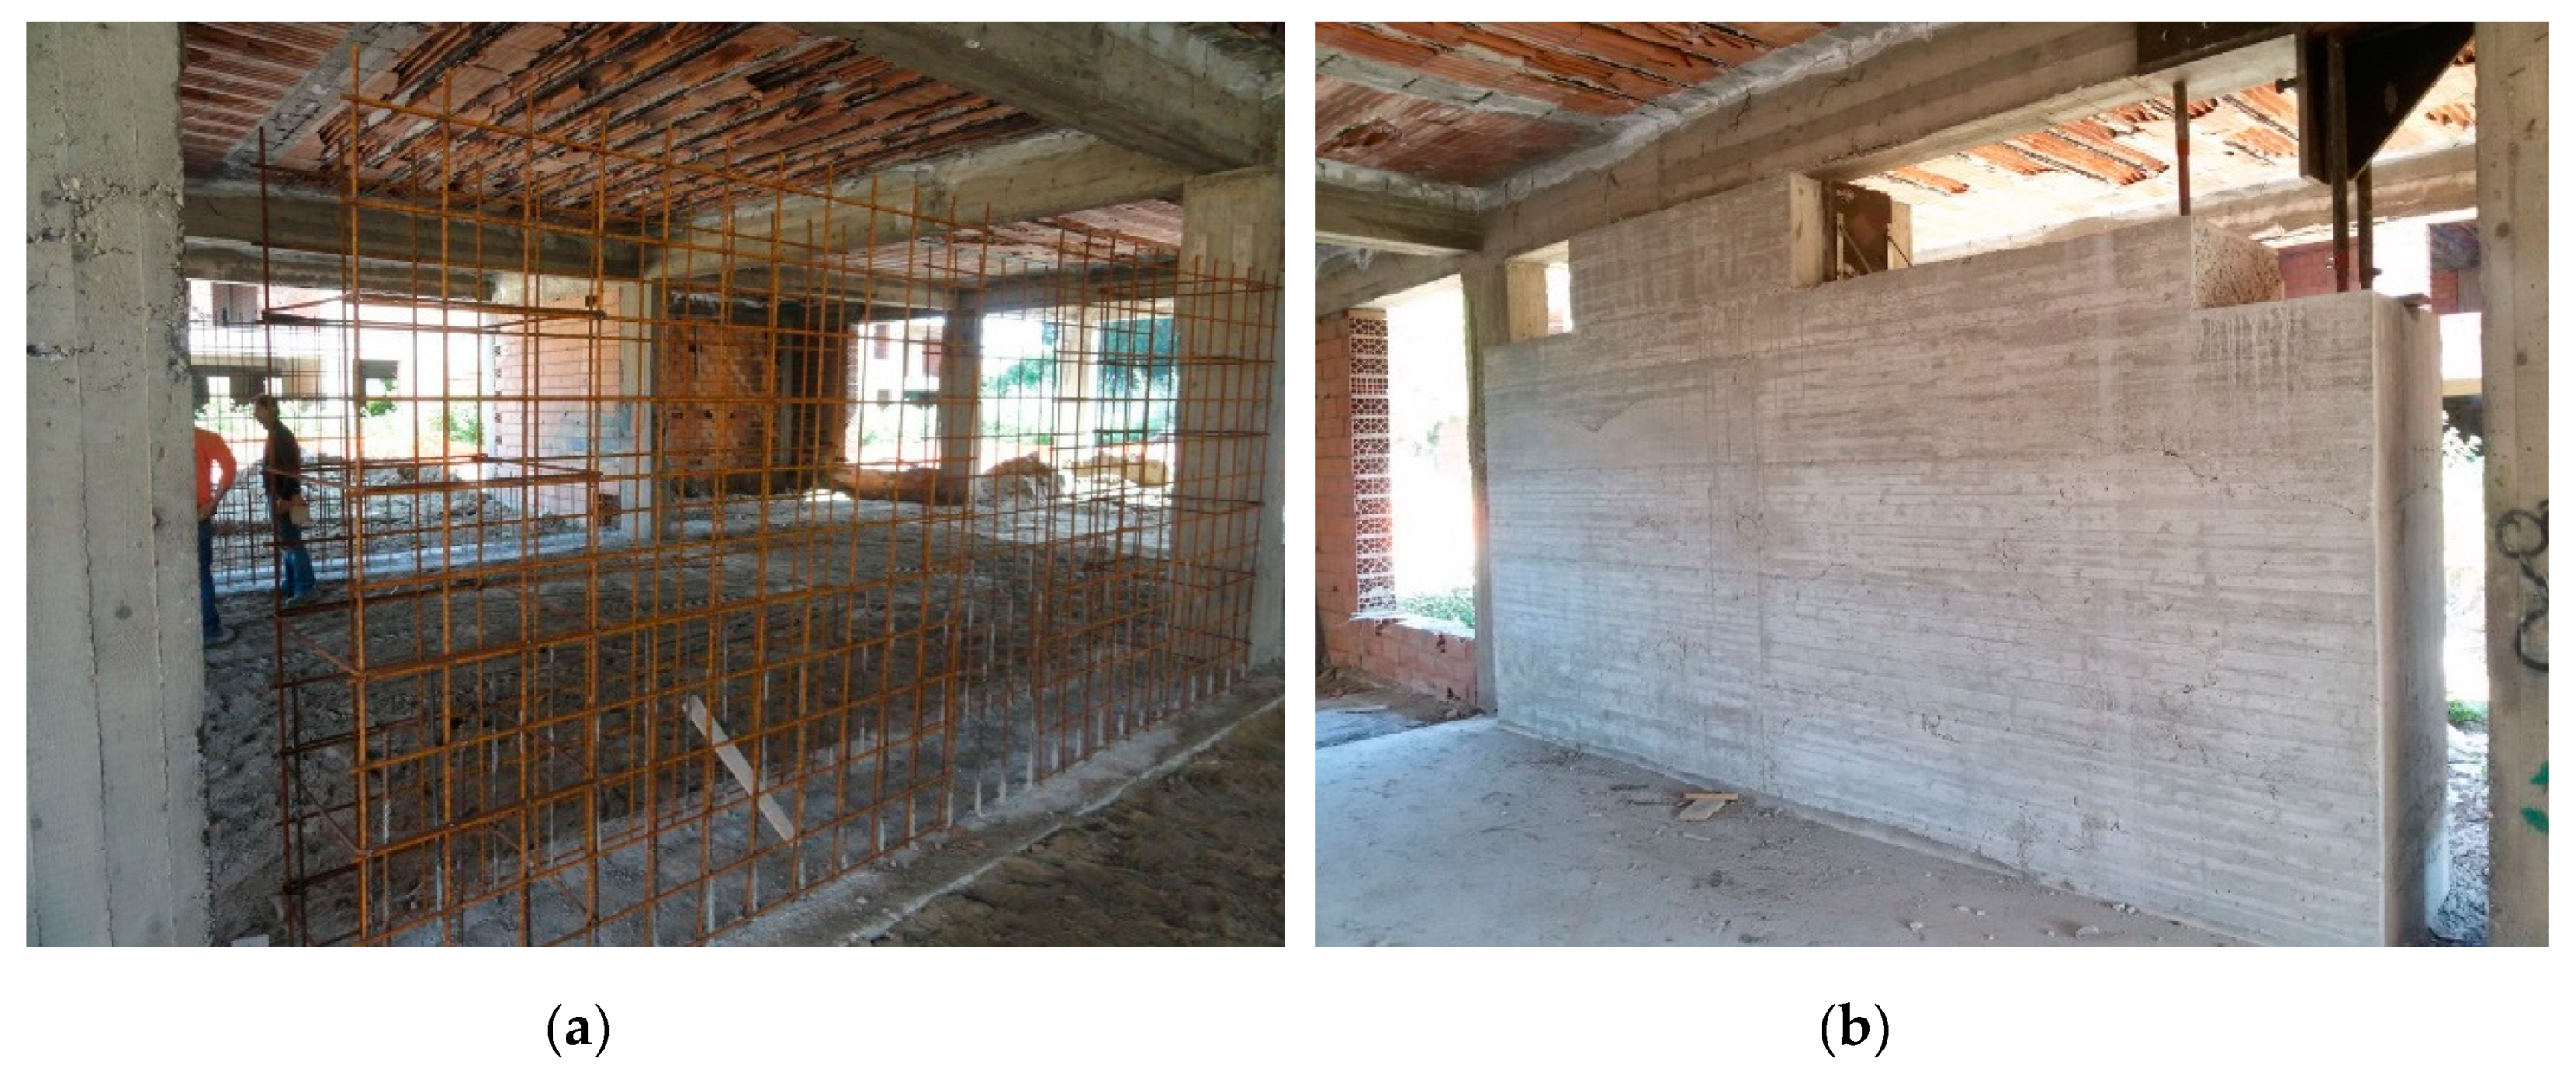
The tested building is a four-apartment house built in the early ‘80s [
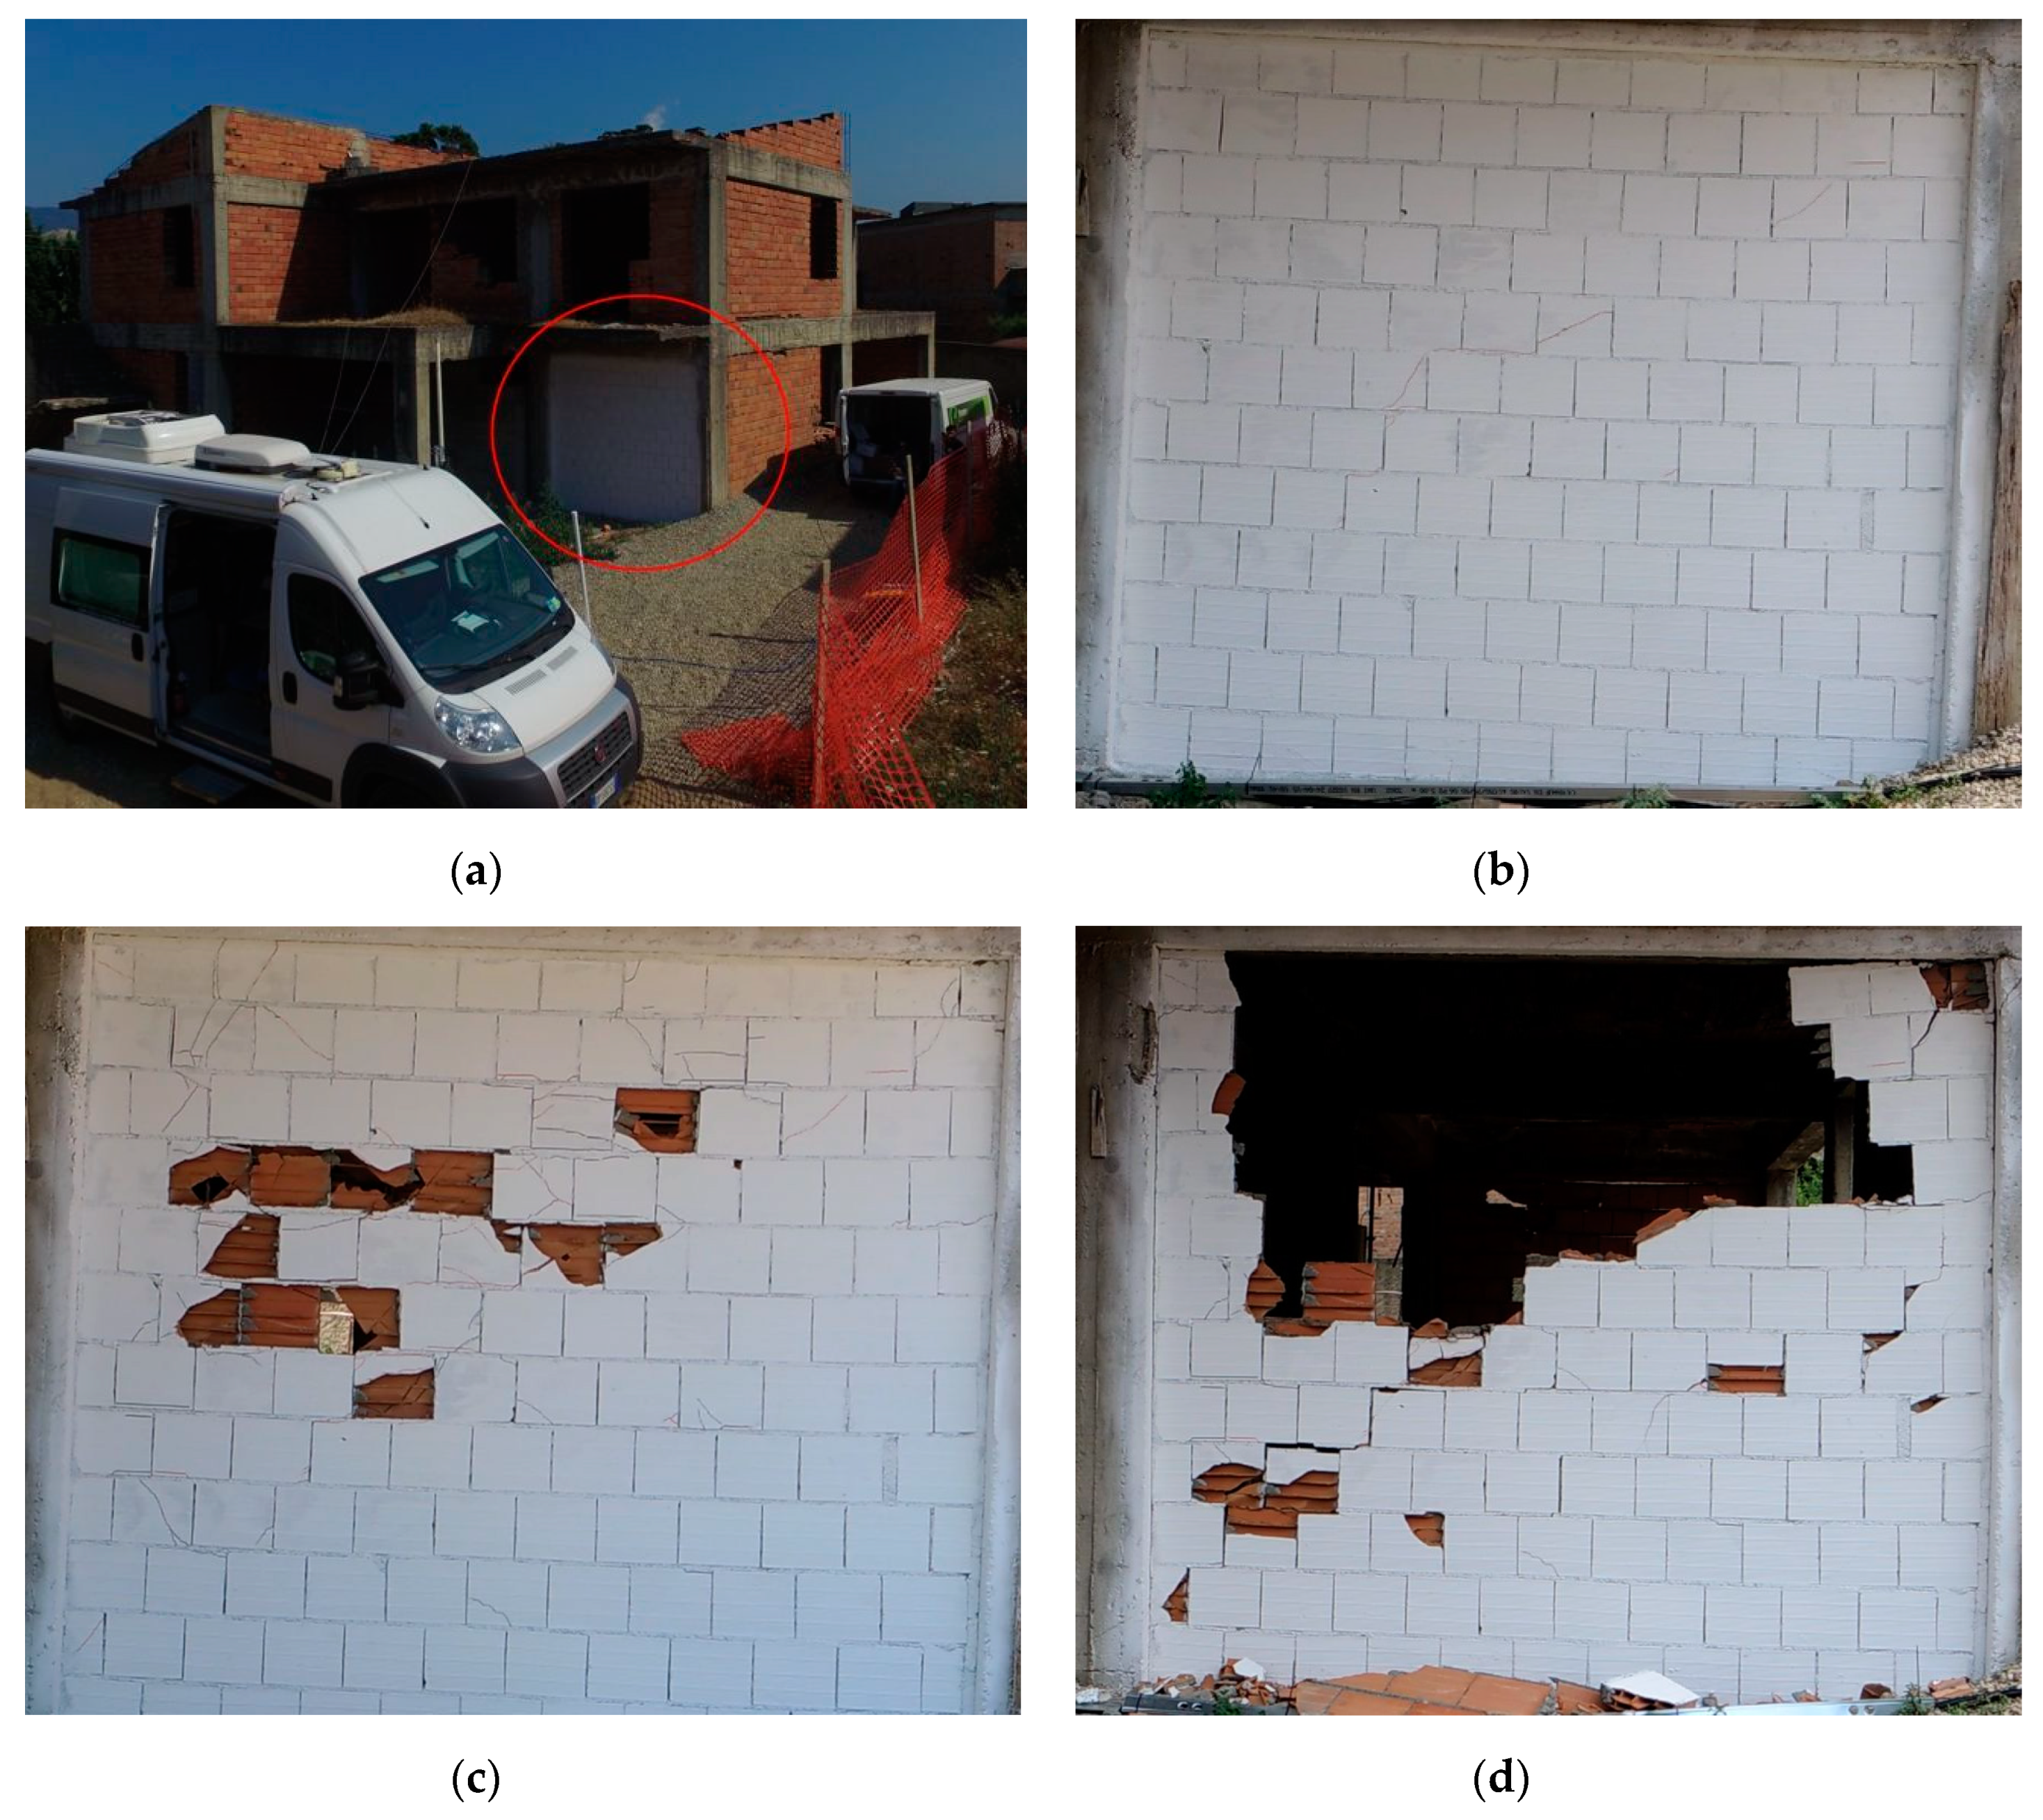
21], representative of one the typical building typologies in this area. In particular, the construction started in 1981 and was interrupted in 1983, after the completion of the supporting structure, the slabs, and the infills. As evident in
Figure 2, the building was in a state of total abandonment. The building is a two-story RC structure, about 8 m high, with an inter-story height of 3.70 and 3.20 m at the first and second floors, respectively.
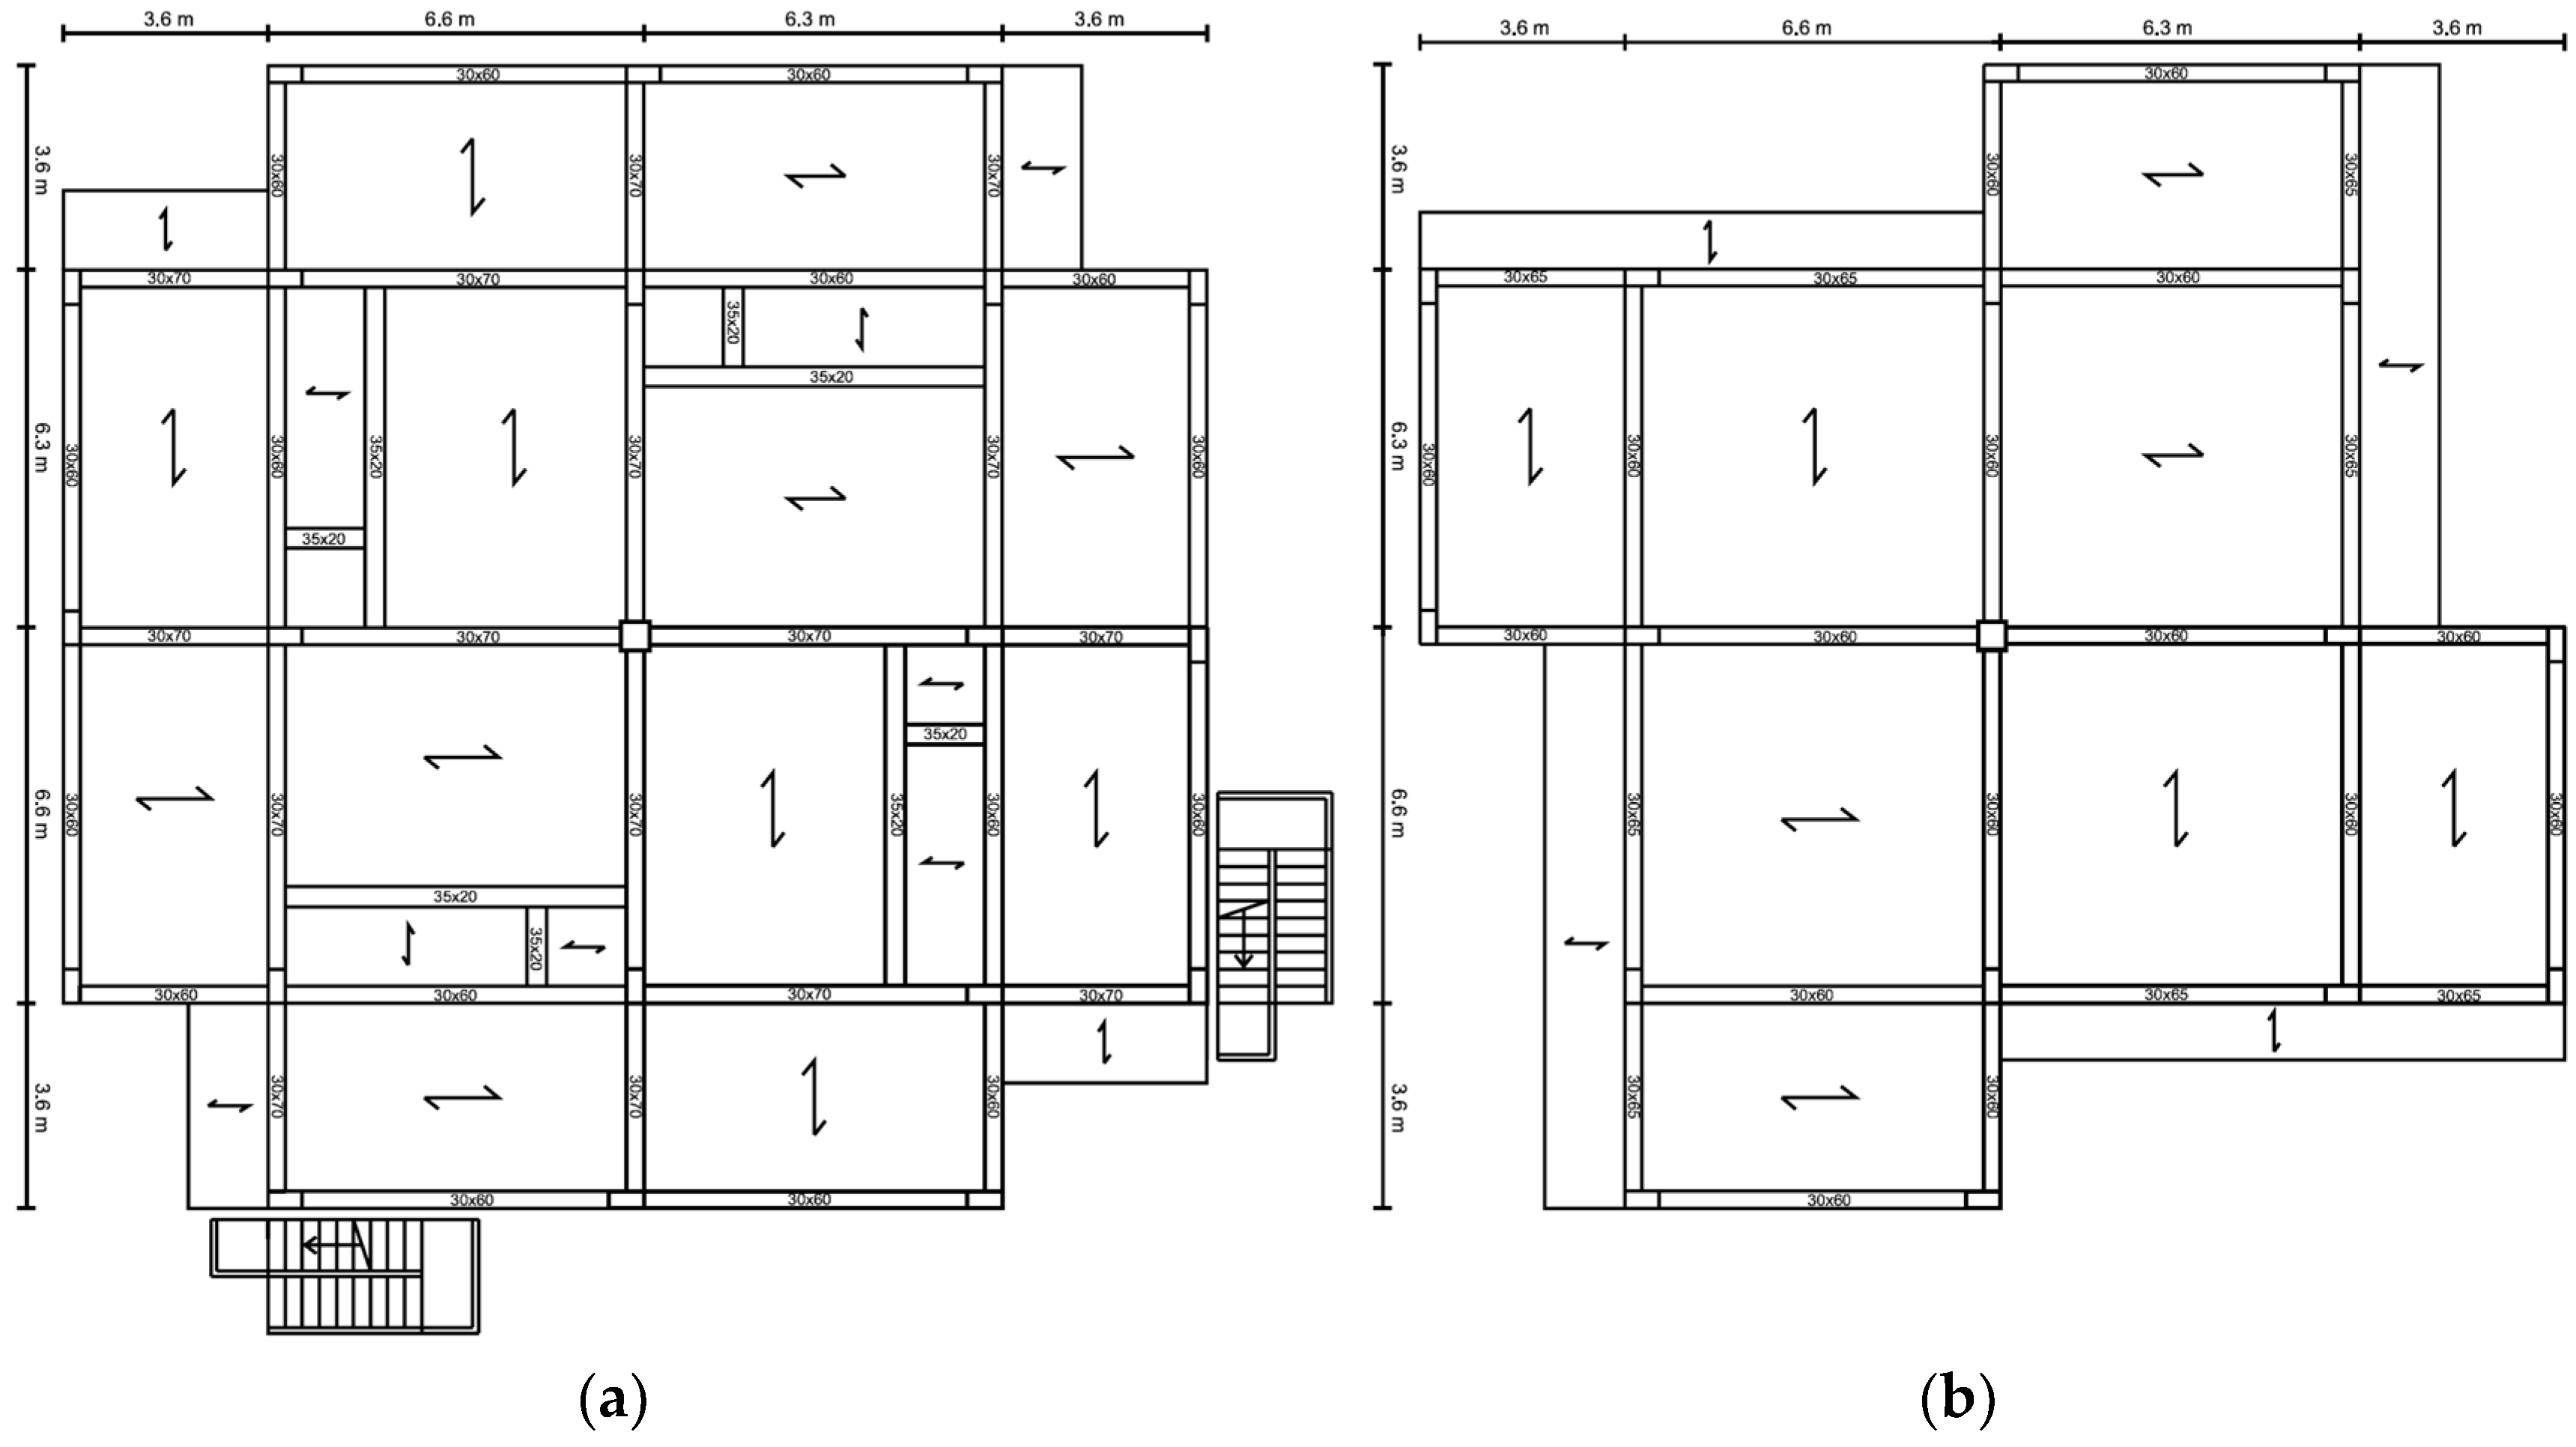
The building’s plan is fairly regular, about 20 by 20 m, for a gross floor area of approximately 350 m
2 (
Figure 3). Slabs on the first floor and roof, which were in a state of advanced degradation, were ordinary casted RC and hollow block clay elements with a total thickness of 0.2 m. Stairs were external and not connected to the building.
The project drawings were available, but geometric and instrumental survey of the structure was carried out to verify its actual geometry. The actual steel reinforcement distributions were checked using a pacometer, and a few reinforcement bar samples were tested to rupture. Information about the characteristics of beams, columns, and foundation concrete was assessed by means of the SonReb test method (“Sonic-Rebound”, combining ultrasonic pulse velocity and rebound hammer test results), leading to the results summarized in
Table 1.
It is worth mentioning that part of the standard dead loads were not present as the building was not finished. This is, for instance, the case of plasters and pavements, fixtures, and roof tiles. To the same extent, live loads were not present during the testing phases, not even in the percentage normally included in the seismic design combination. The decision to neglect the missing dead and live loads was mainly due to budget constraints. Nevertheless, it is authors’ opinion that (i) on the side of the building response, adding such supported weights would have not been enough to modify the damage sequence while (ii) on the modeling side, for the goal of the research, the congruence between actual testing conditions and numerical models was obviously crucial.
3. Numerical Model
Numerical modeling allowed the assessment of the structural performance. The results of the analyzes, validated a posteriori by the experimental data, were used for the design of the testing system and for the definition of the experimental protocol.
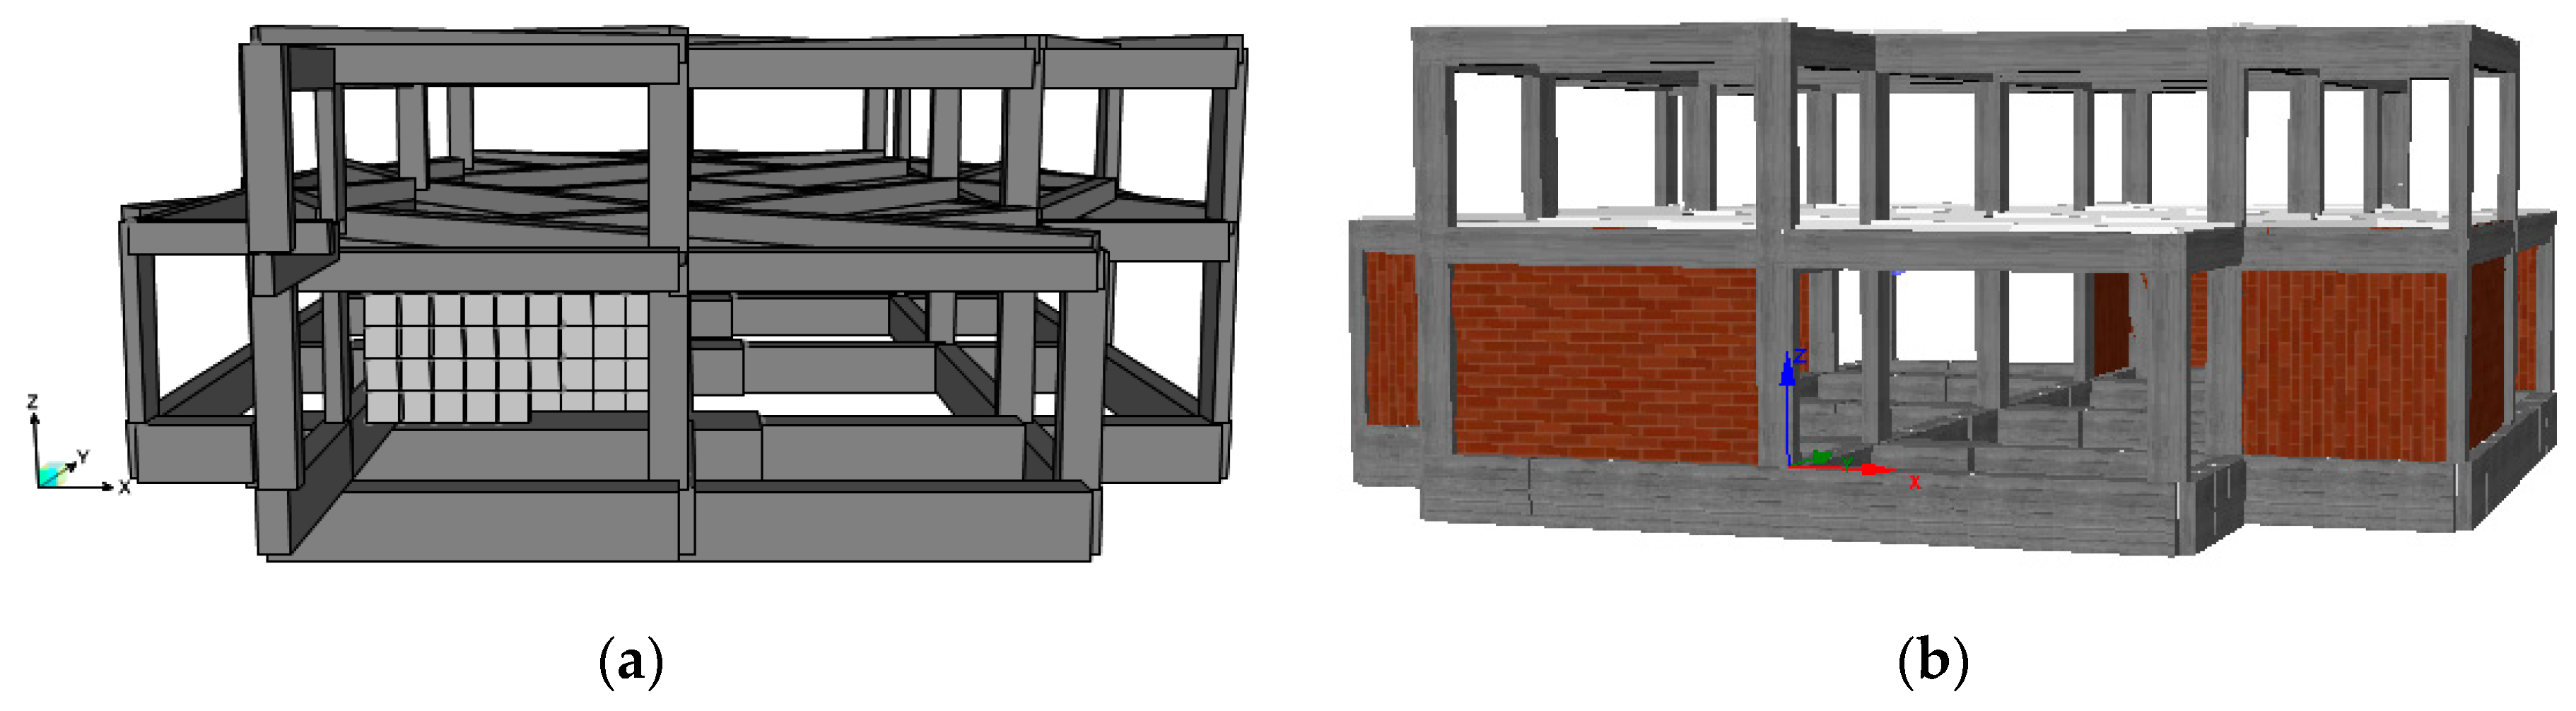
The whole structure-reaction system was modeled by means of two analysis software (
Figure 4): SAP2000 v22.1.0 [
22] and SeismoStruct v2020 [
23]. Double modeling, elastic and non-linear, respectively, considered several hypotheses and different combinations of those variables affecting the structural behavior, in order to study various critical aspects. In this way, it was possible to optimize the design of the test, balancing costs and feasibility issues, accounting for the estimated building capacity and the interaction with the reaction system.
The SonReb tests results, characterizing the median values of elastic moduli and material strength, were used to set the parameters of the materials in the numerical models. This approach was used for beams, columns, and foundation elements. For coherence between the two analysis software, massless and weightless rigid trusses modeled the in-plane rigid behavior of the slabs.
The main goal of the SAP2000 modeling was to assess the demand on the reaction system, supposed to work in the elastic range, and the evaluation of additional structural settlements along the foundation during the test. Two models were created using elastic frame elements. A first model of the structure was made without the reaction walls in order to obtain the stress state and the foundation settlements that the building encountered in its lifetime, as the initial condition of the test. The structure was then modeled as during the test, i.e., adding the reaction walls, the strengthened footings, and a self-balanced force system representing the forces applied by the actuators to the specimen and to the reaction structure.
The comparison between the models allowed for the estimation of the increase of stresses in the foundation beams and the additional building settlements.
The building was then modeled within SeismoStruct, using inelastic frame elements. Several models were made, considering rigid and flexible slabs, with and without infills, during the pushing and pulling phases. While the strengthened sections of the foundation beams were included in all these models, the reaction walls were neglected because they were not deemed to influence the structural capacity of the building. Pushover analyses were performed in order to simulate the actual testing conditions, assigning an inter-story drift equal to 3% (i.e., 0.12 m) to the beams of the first slab.
Since the behavior of the structure was unknown, four different models were analyzed: With rigid and deformable slabs, with and without infills. Such a modeling approach was chosen because slabs were deteriorated and the effectiveness of infills’ connections with the frame was questionable, rendering it difficult to assess the real contribution of both types of elements to the structural stiffness. Infills have been modeled as inelastic elements according to the strut-and-tie model by Crisafulli [
24]. During the analyses, the panels no longer contributed to the strength and rigidity of the structure when the element reached either the maximum strength or the out-of-plane drift limit, set to 0.5%.
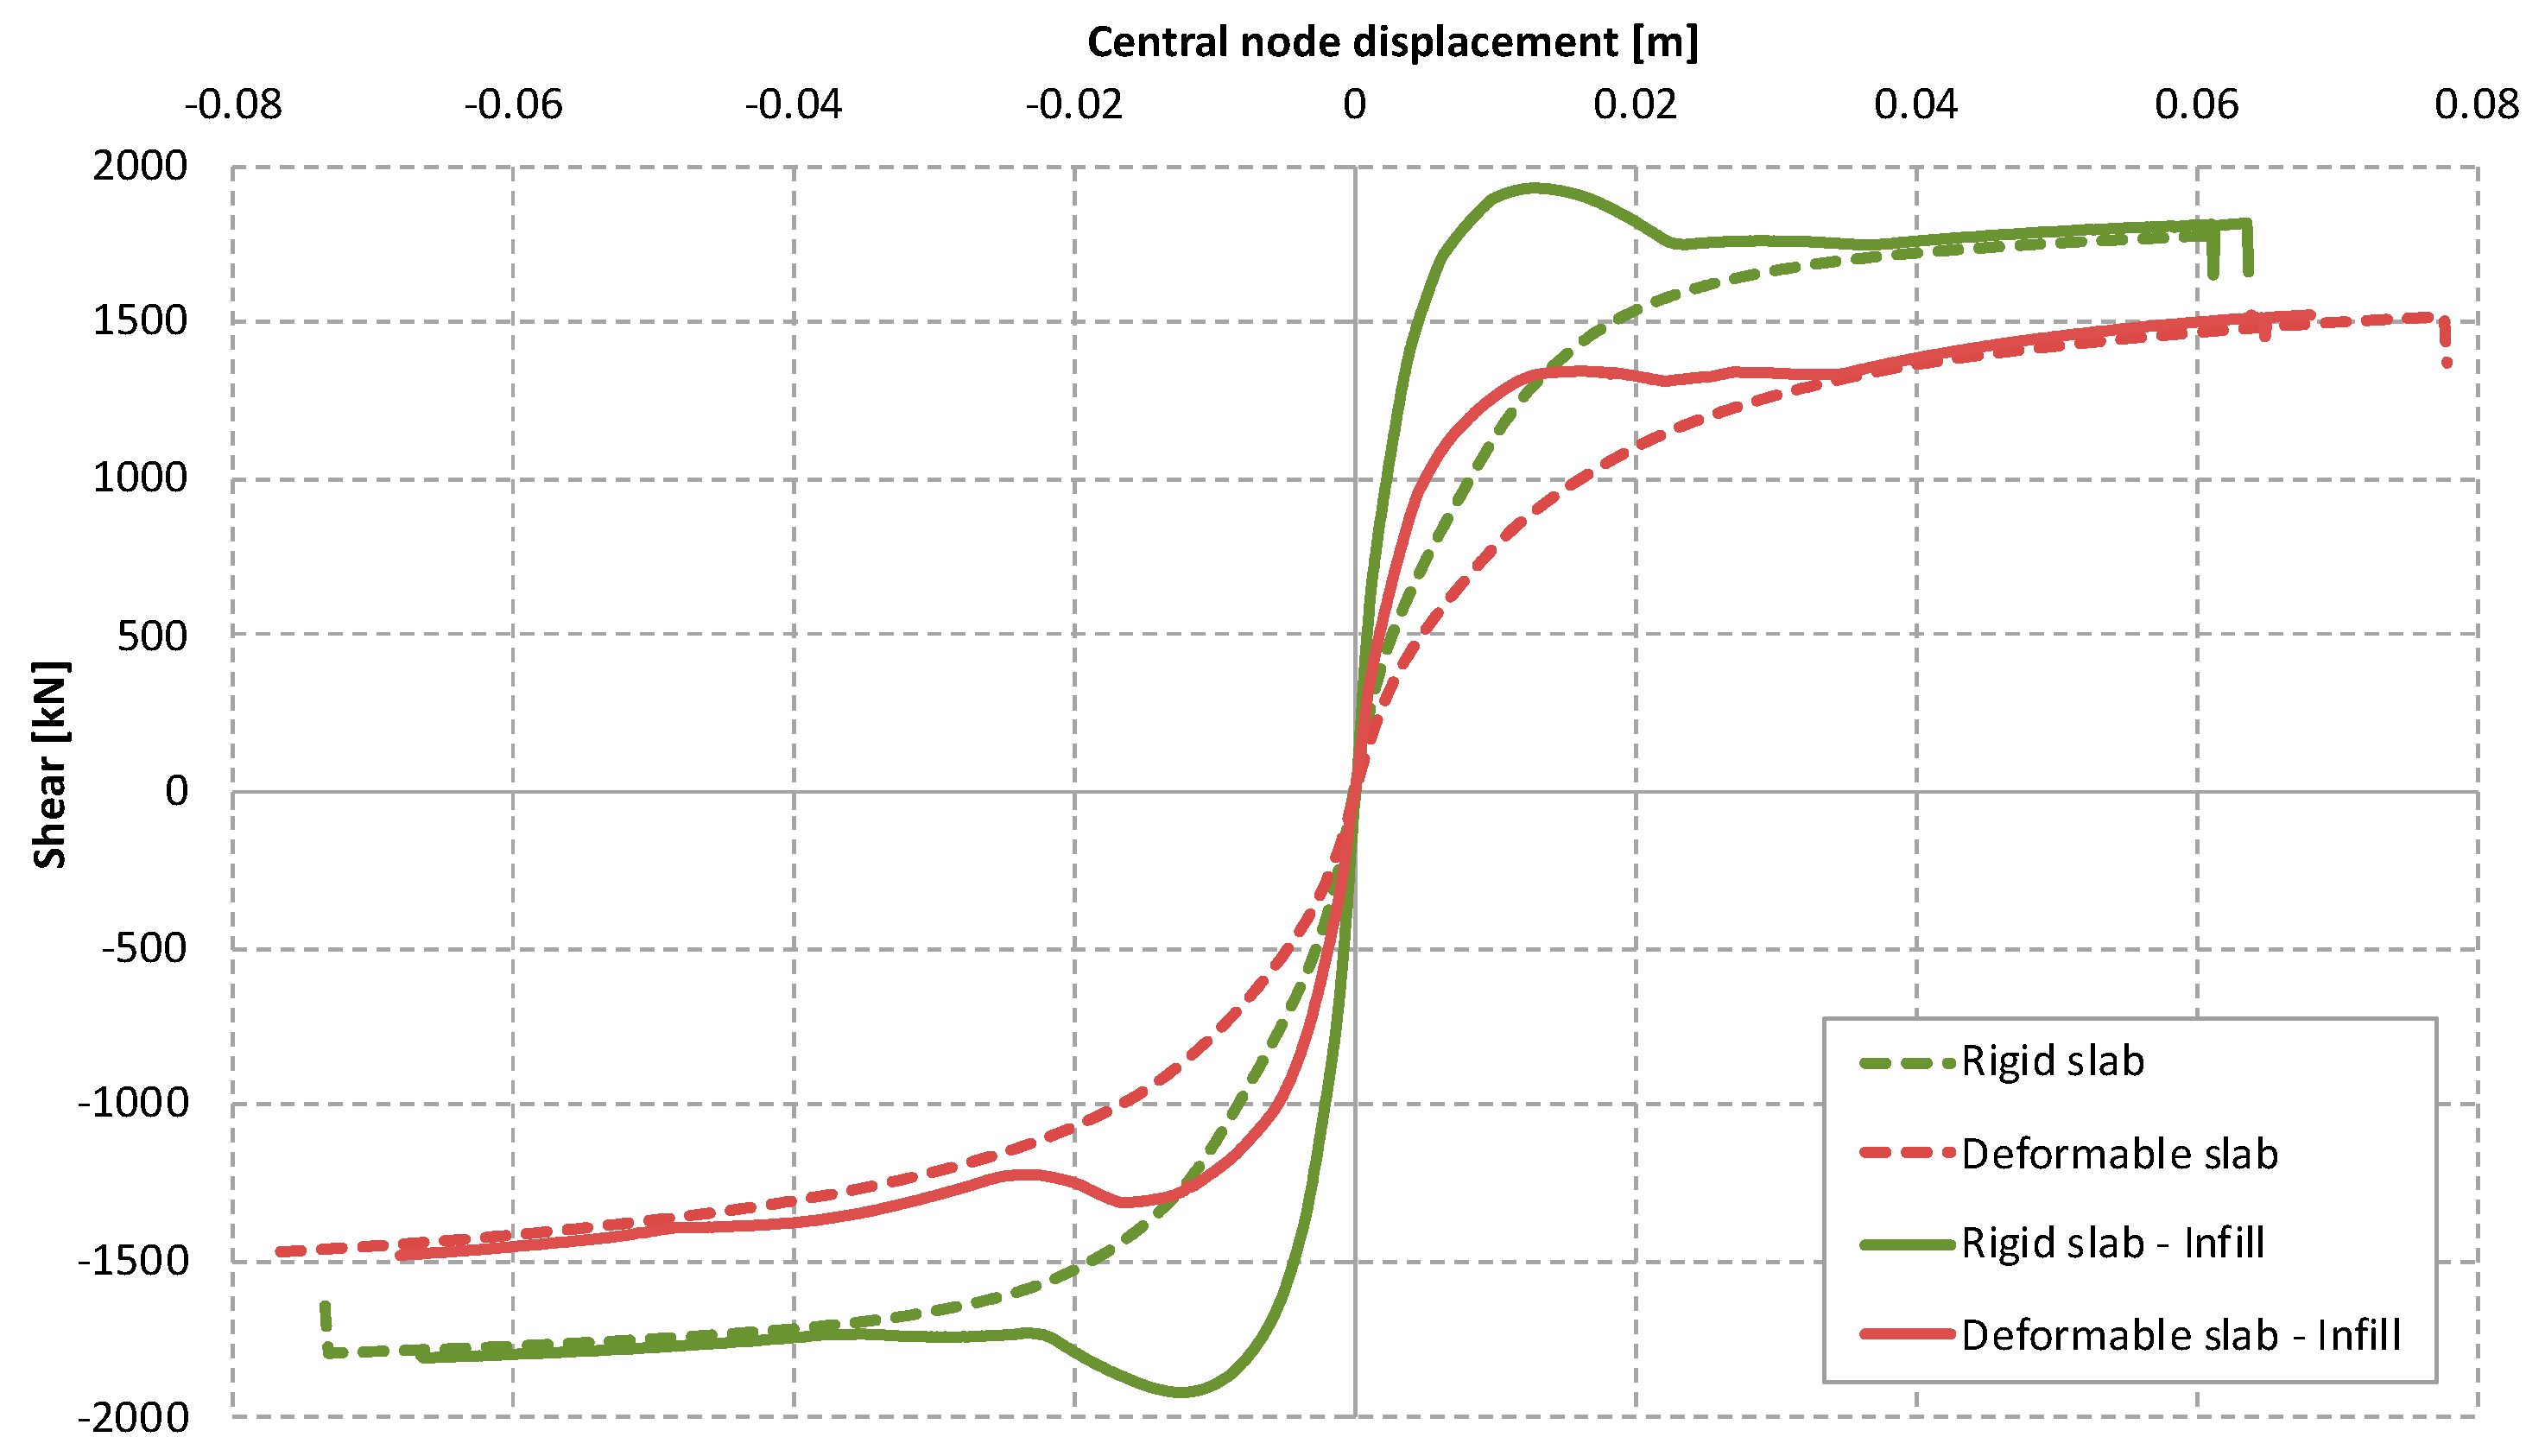
Figure 5 shows the pushover curves of the different models in both push and pull directions.
Table 2 shows the numerical results obtained from the analyses, in terms of maximum base shear and maximum displacement measured at the central node of the first slab. In all cases, the target displacement of 0.12 m was not reached. The model with deformable slabs and infills reached the maximum displacement of about 0.08 m. As expected, the presence of infills significantly influenced the structural response, stiffening the elastic part of the capacity curve, up to the reaching of the breakout limit value of the infills themselves, beyond which the two curves obviously coincide progressively. In the model with rigid slabs, the presence of infills had a great influence on the maximum reached shear value, occurring at the infills breakdown limit value.
The range of maximum response force obtained from the numerical simulation was therefore between 1500 and 2000 kN. With this data, it was possible to design the capacity of the test system, i.e., the foundation reinforcement, the reaction walls, and the actuation system.
Since numerical modeling did not include possible shear failures of the elements, columns, and beams, shear strength assessment was then performed in order to predict the failure mode of the structural elements. The actual transversal reinforcement of the columns consisted of bars Φ6 with a spacing of 200 mm on columns and 150 to 250 mm on beams. Strength assessment considered bars 6 and Φ5.5 in order to account for the evident corrosion, which in the years reduced the net section of the bars. Mean strength values have been used for materials, i.e., a steel yield strength of up to 410 MPa, obtained from tensile testing on some bars sampled from the structure.
5. Experimental Results and Comparison with Numerical Modeling
The testing protocol used for the experimental campaign included a series of three quasi-static cycles at increasing amplitude. The nine runs, one for each target displacement, were completed over three days. Each cycle was performed with constant loading rate in displacement control, in both directions (pull and push).
Table 3 summarizes the main characteristics of the testing sequence. It has to be noted that the cycle amplitudes shown here were the actual reached amplitudes, averages of the feedback values sensed by the displacement transducers. For safety reasons, due to the triggering of brittle failures on a number of elements, it was decided to limit the last run to a single cycle at the maximum displacement of about 63 mm. The initial direction of the test cycles was “pushing”.
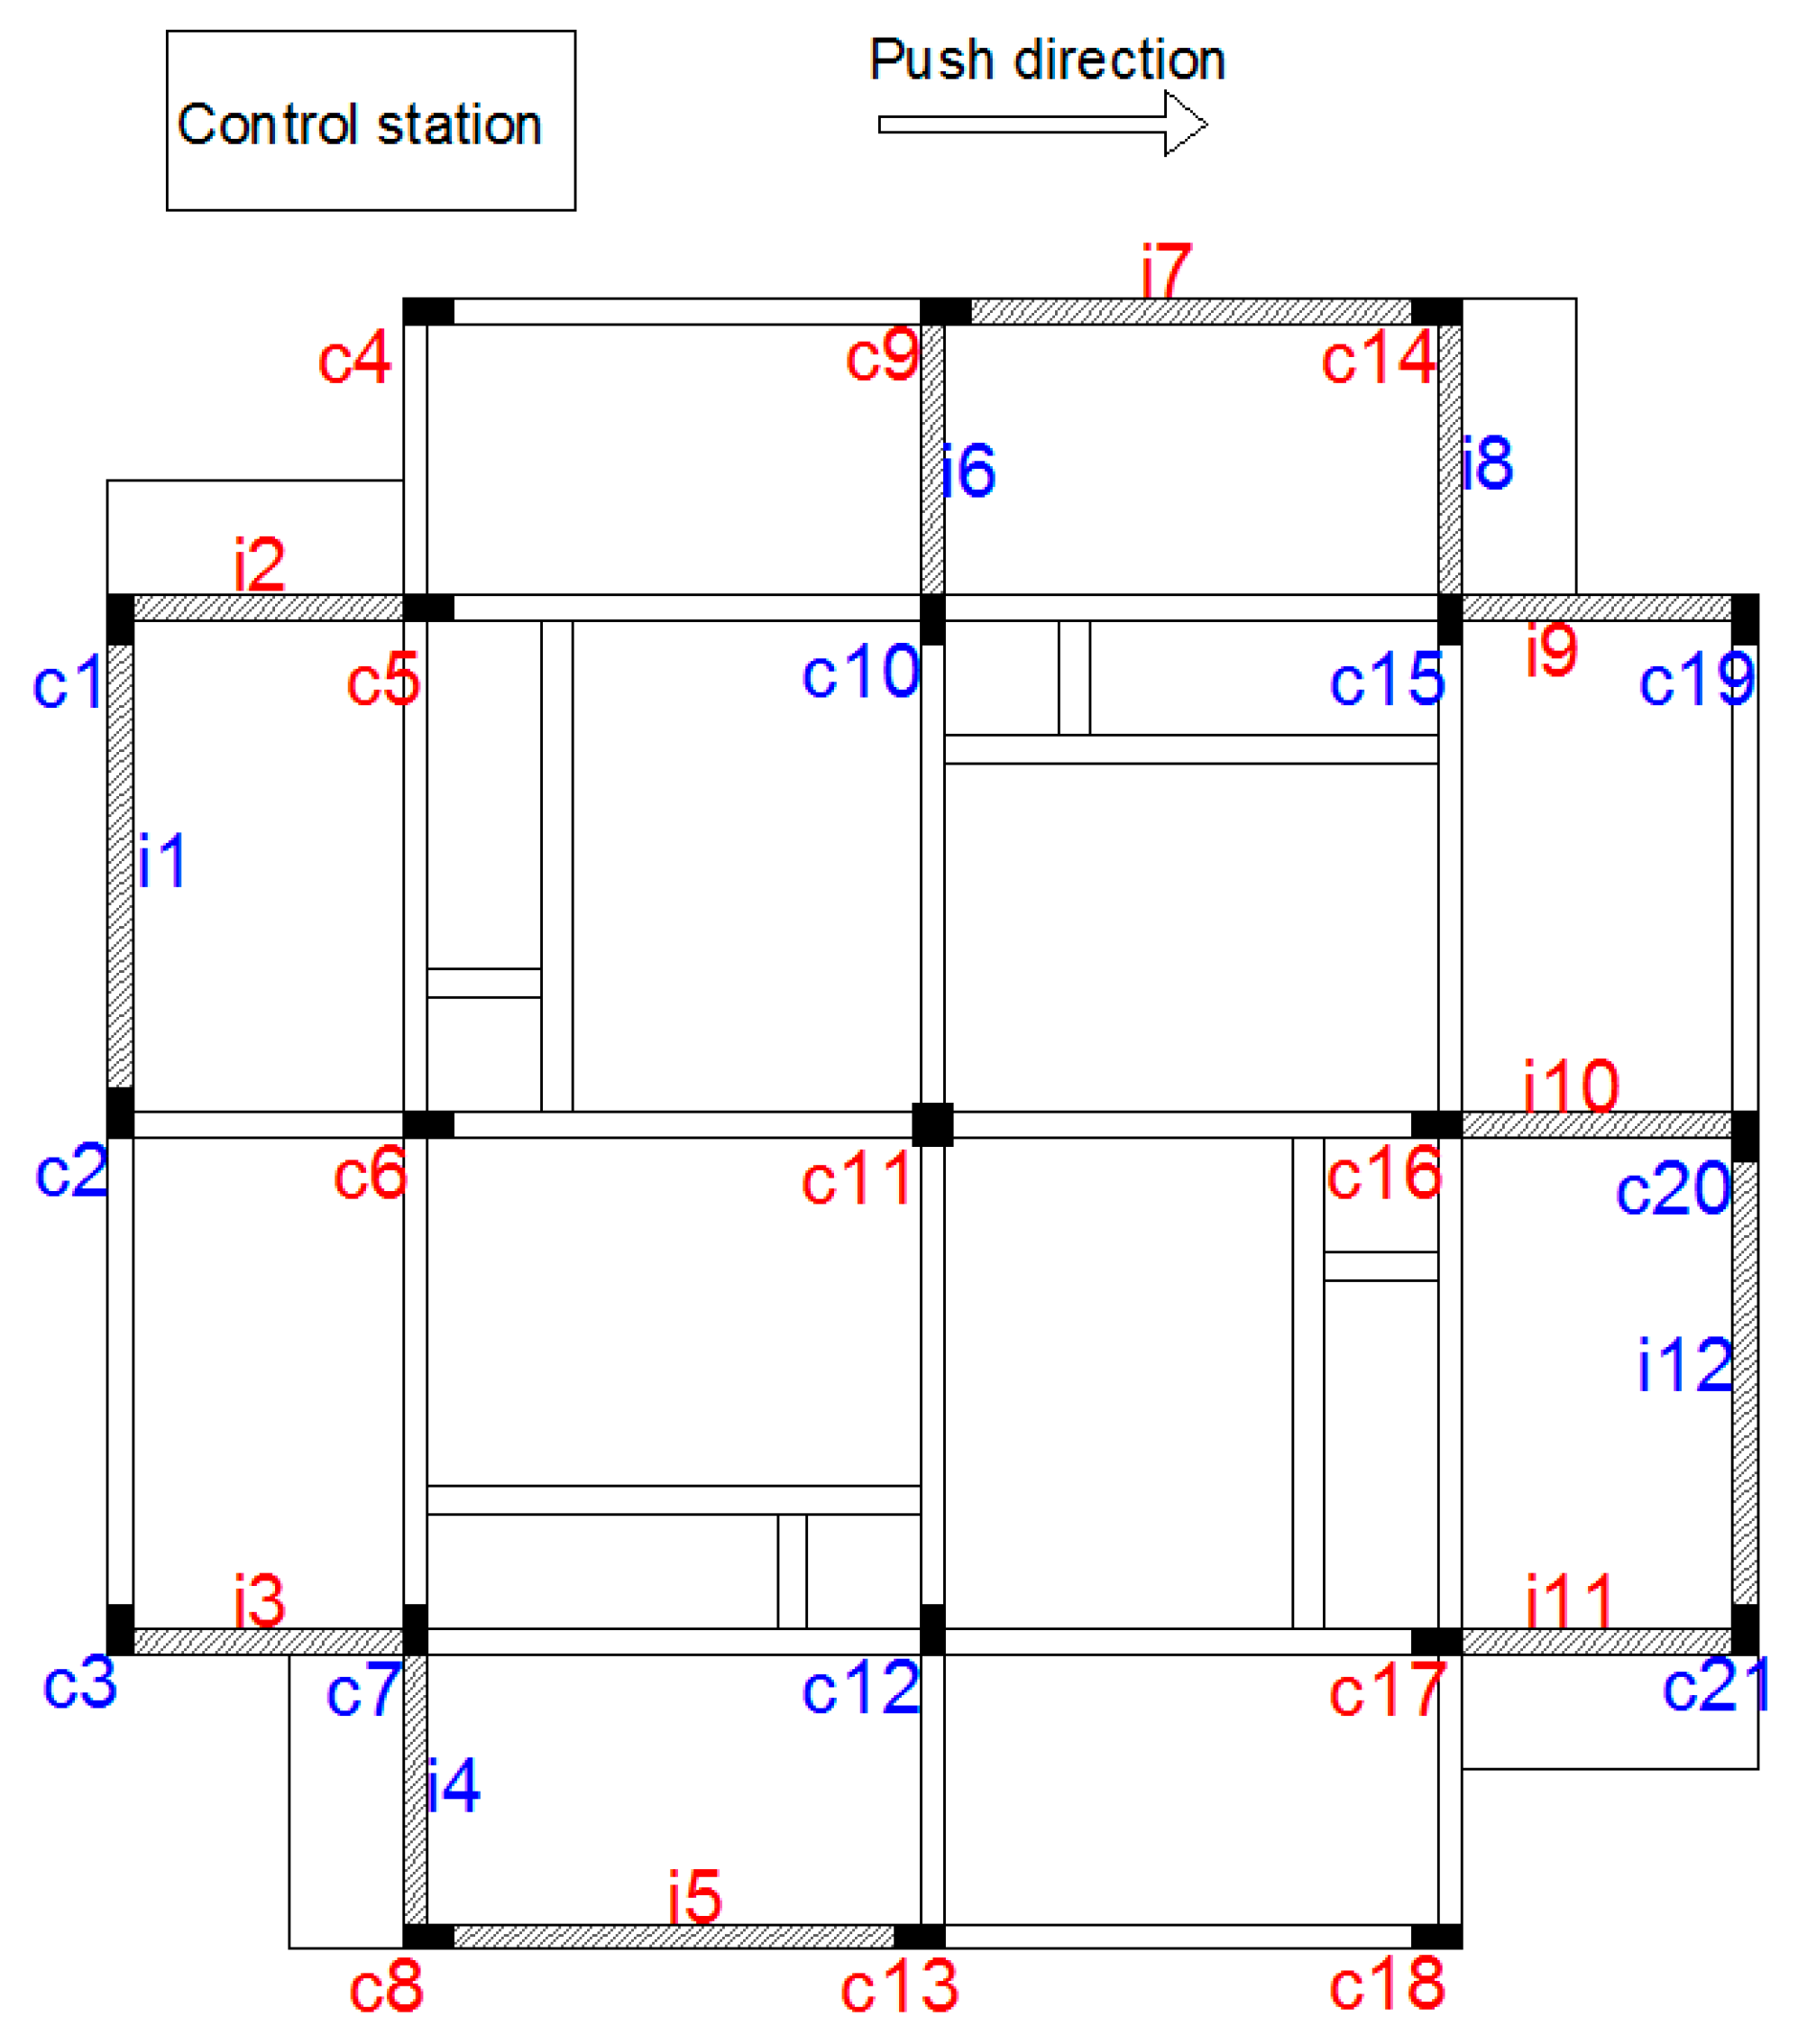
Figure 11 shows the plan view with the numbering of the columns (prefix “c”) and the infills (prefix “i”), useful to locate the elements in what follows. Elements were divided into two categories, i.e., those aligned to the test direction (stronger resistance, red color) and those aligned perpendicularly (blue color). After each run, damages were checked on both structural and non-structural elements, that is, on whitened infills, where the evolution of the cracking pattern is shown as an example in
Figure 12.
As a general observation, beams did not report important cracks, as expected from this type of construction designed according to the “strong beams–weak columns” approach. On the contrary, almost all the columns showed concrete cover spalling, yielding, and instability of the reinforcement bars at the base and at the top of the element. In what follows, results were shown starting from run #4 (9.6 mm, drift 0.26%), because during the first three runs no significant damages were observed.
At run test #4, the infill i5 overturned unexpectedly, probably due to bad connection with the frame, while the other infills panels reported minor damages (
Figure 13), and no damage to structural elements was detected. After run #4, the infills began to be progressively damaged. It should be noticed that the current Italian code [
25] sets a limit of 0.2%, 0.5%, and 0.75% for the damage limit state of ordinary bearing masonry, brittle, and ductile infills, respectively, and that recent experimental studies ([
26,
27]) showed that a reasonable damage limit for poor quality or weak infills (e.g., horizontal holes laying) is in the order of magnitude of 0.3%.
Figure 14 shows the main damage that occurred at run test #6 (21.6 mm, 0.58%). No critical cracks were observed along beams and columns, but the damage at the infills increased, with some partial collapse. Obviously, as the damage increased, the strength and stiffness contribution offered by the infills decreased progressively. It is expected that at the larger drift levels, the bare frame strength reserves would be activated, i.e., damages would be extended to the structural elements.
Figure 15,
Figure 16,
Figure 17,
Figure 18,
Figure 19,
Figure 20 and
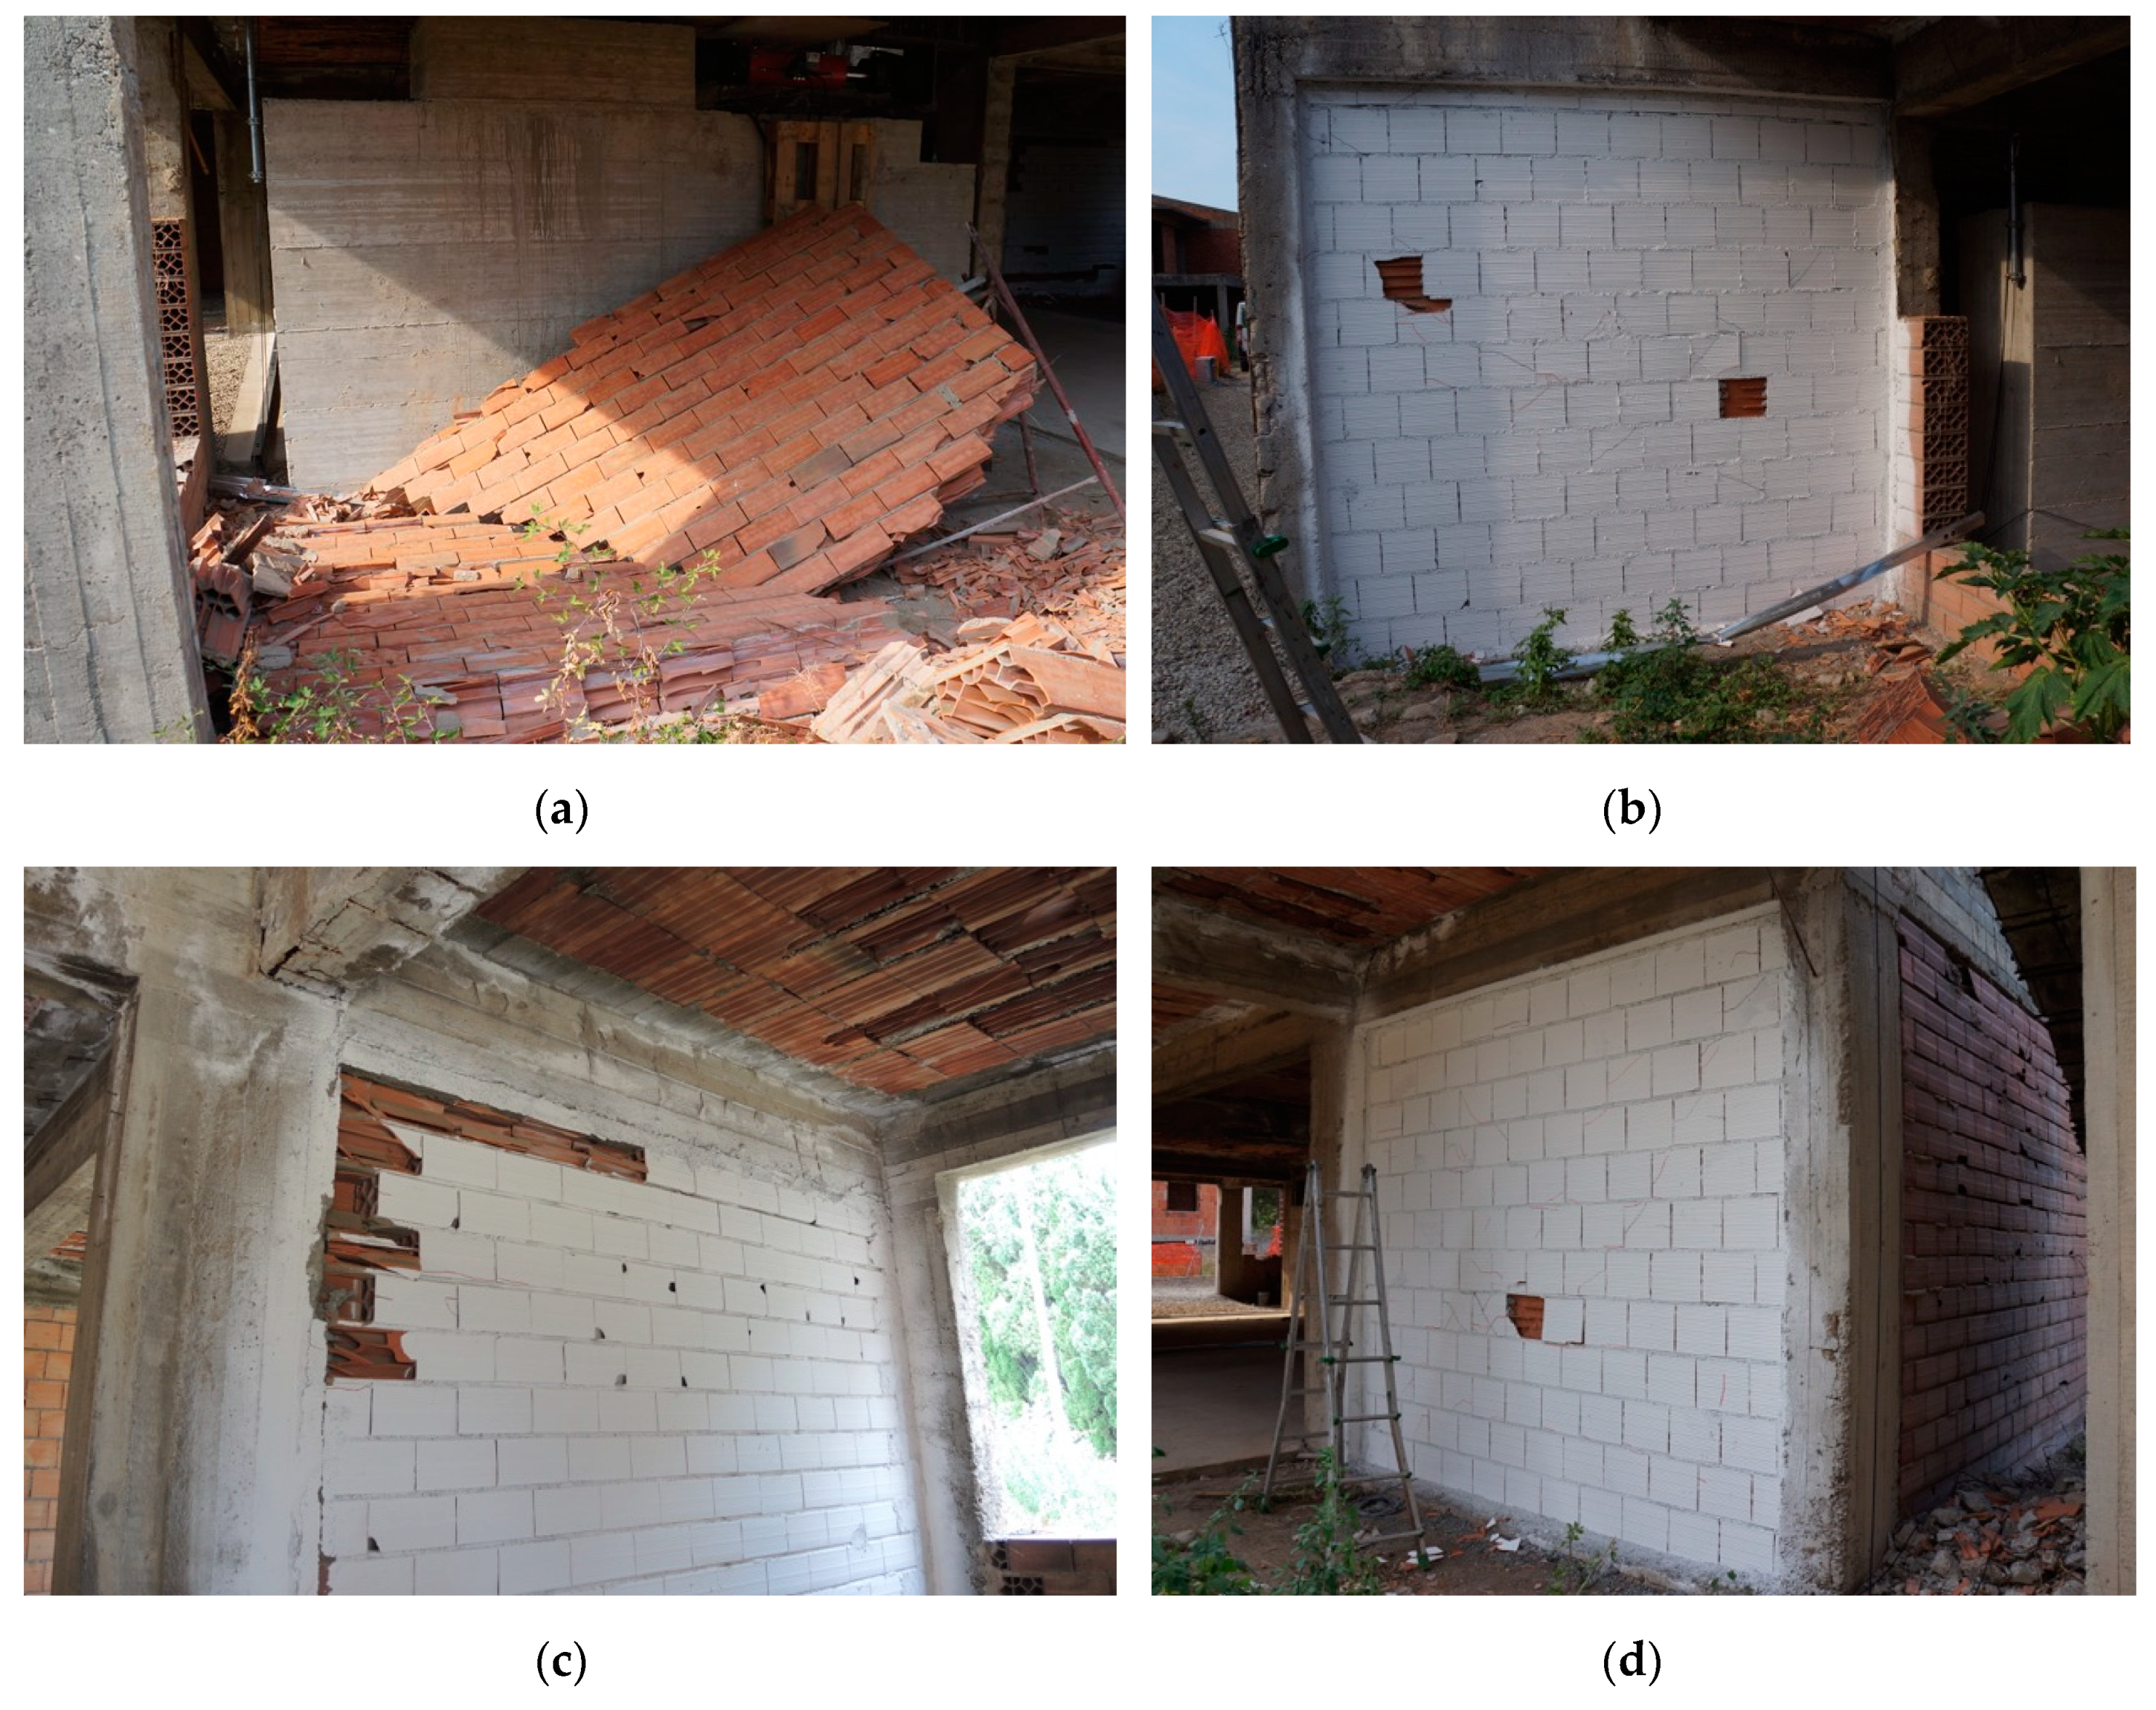
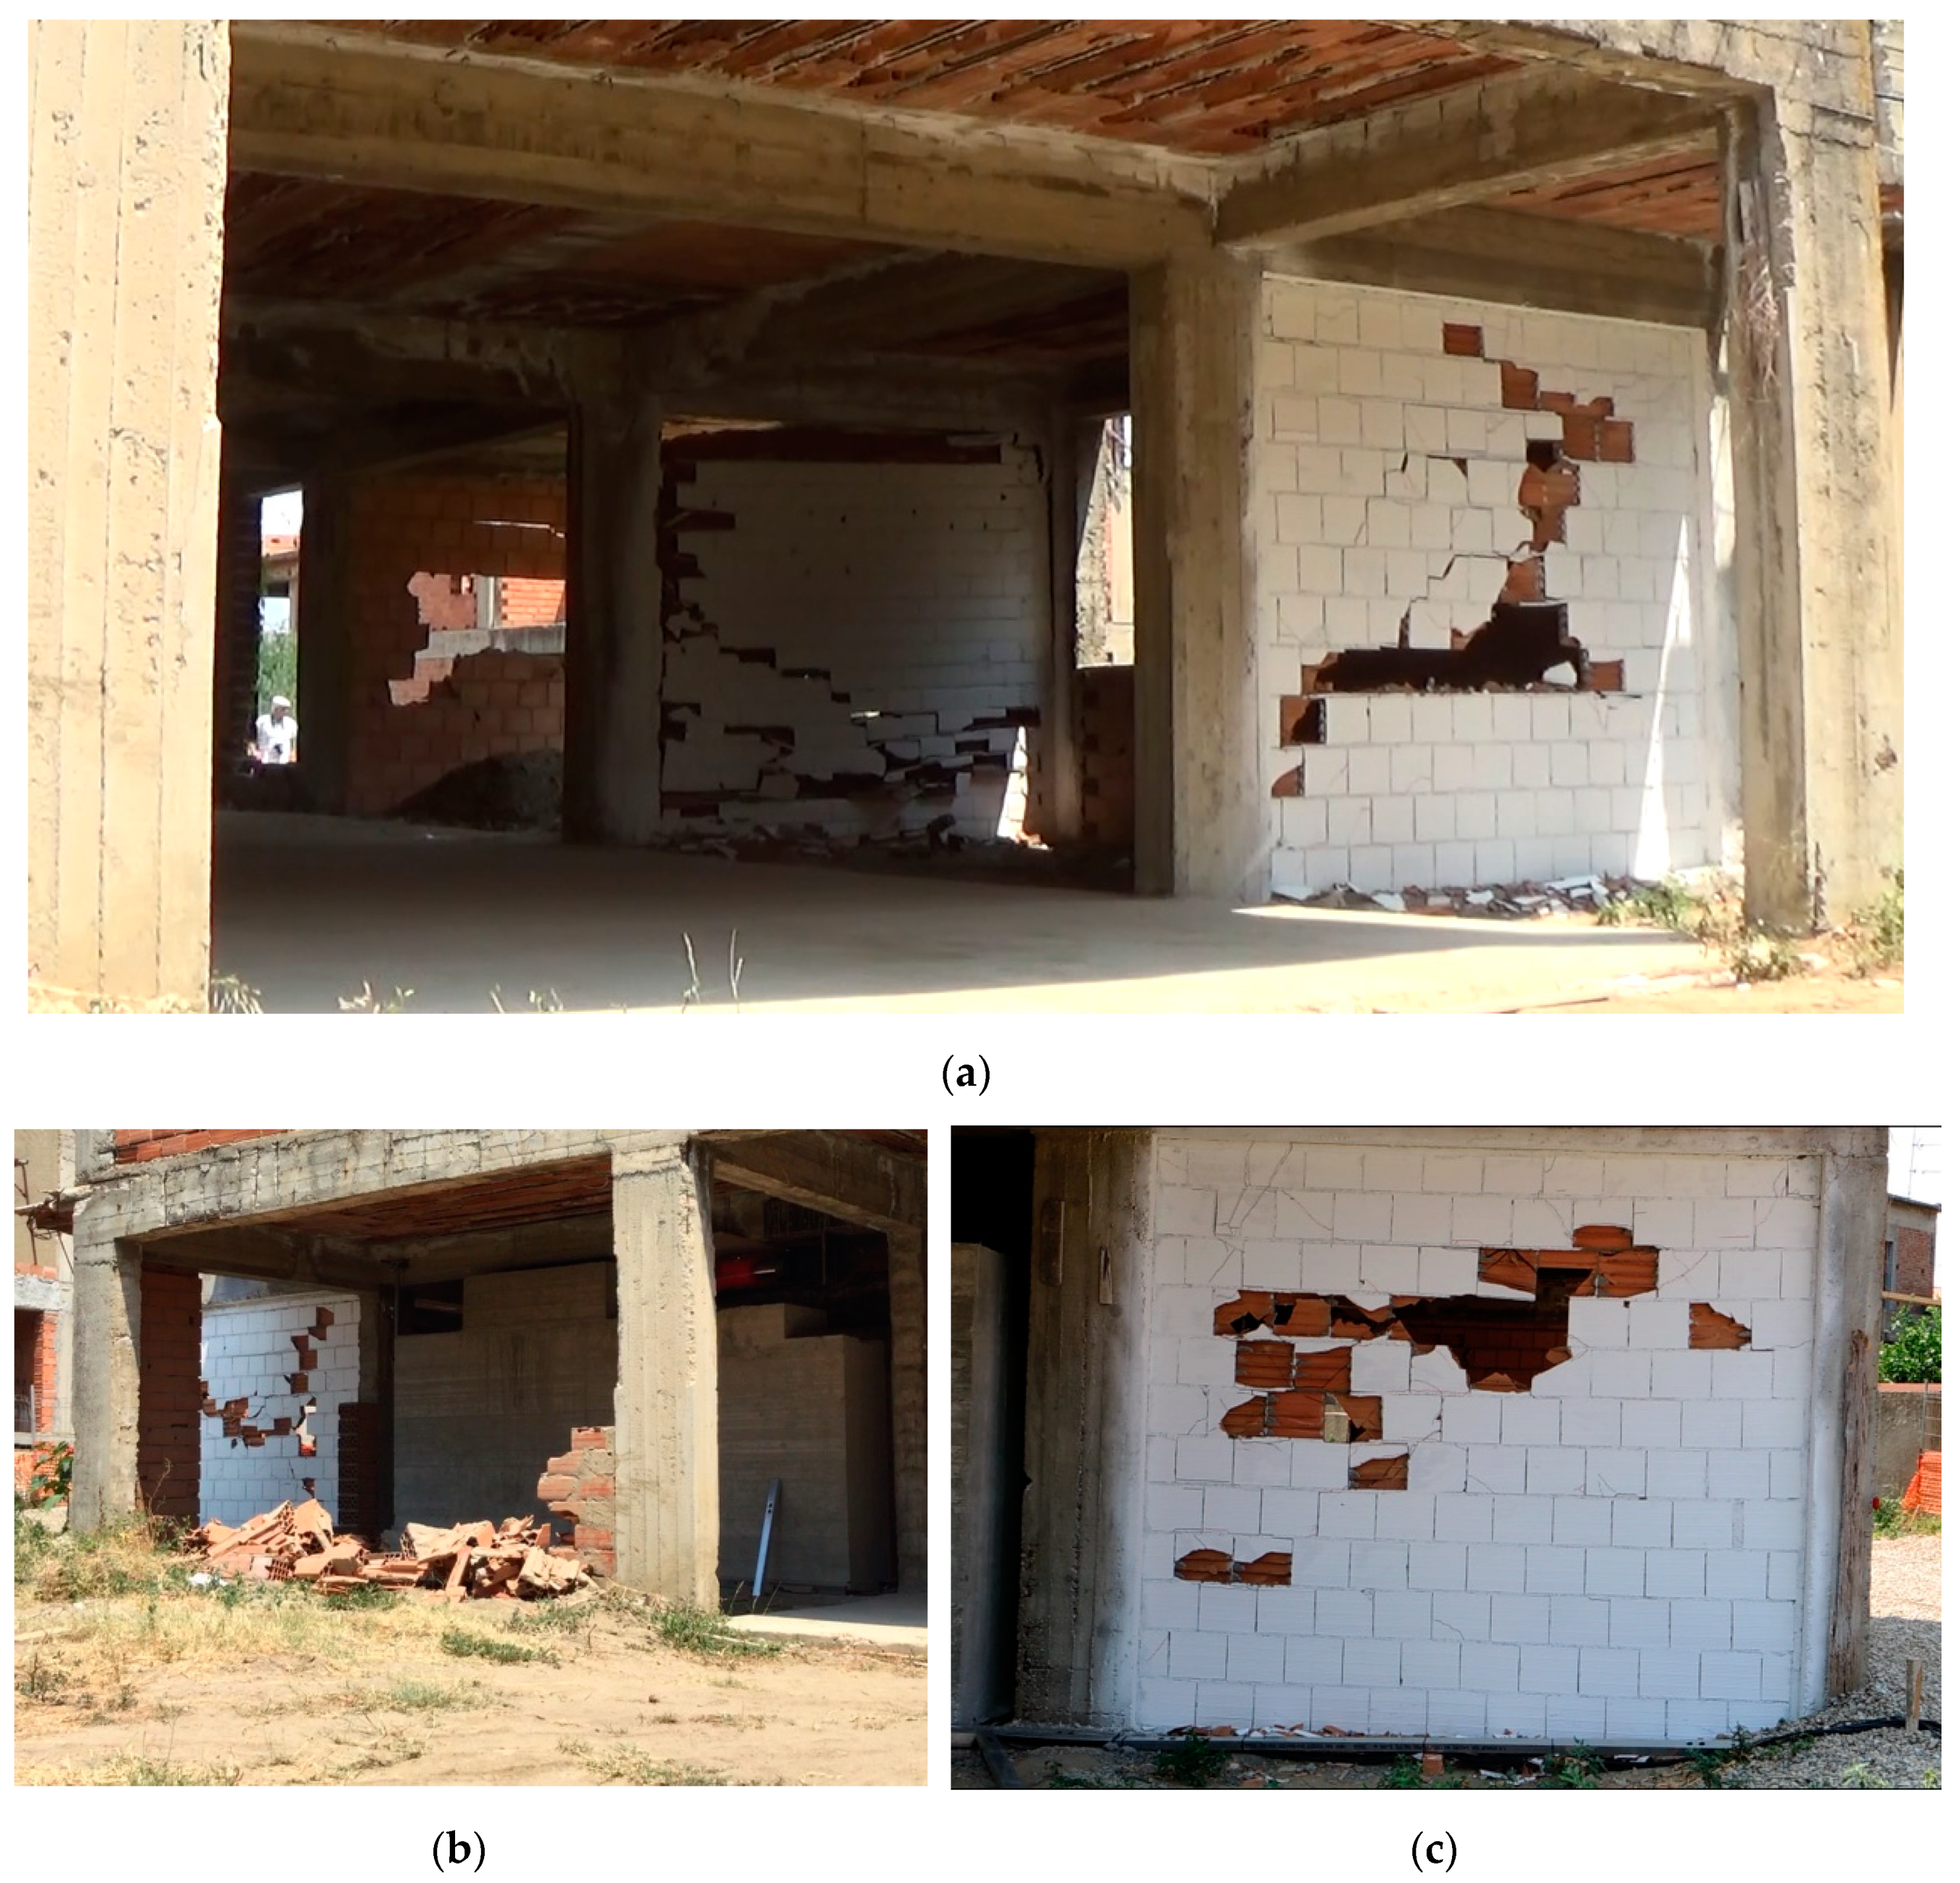
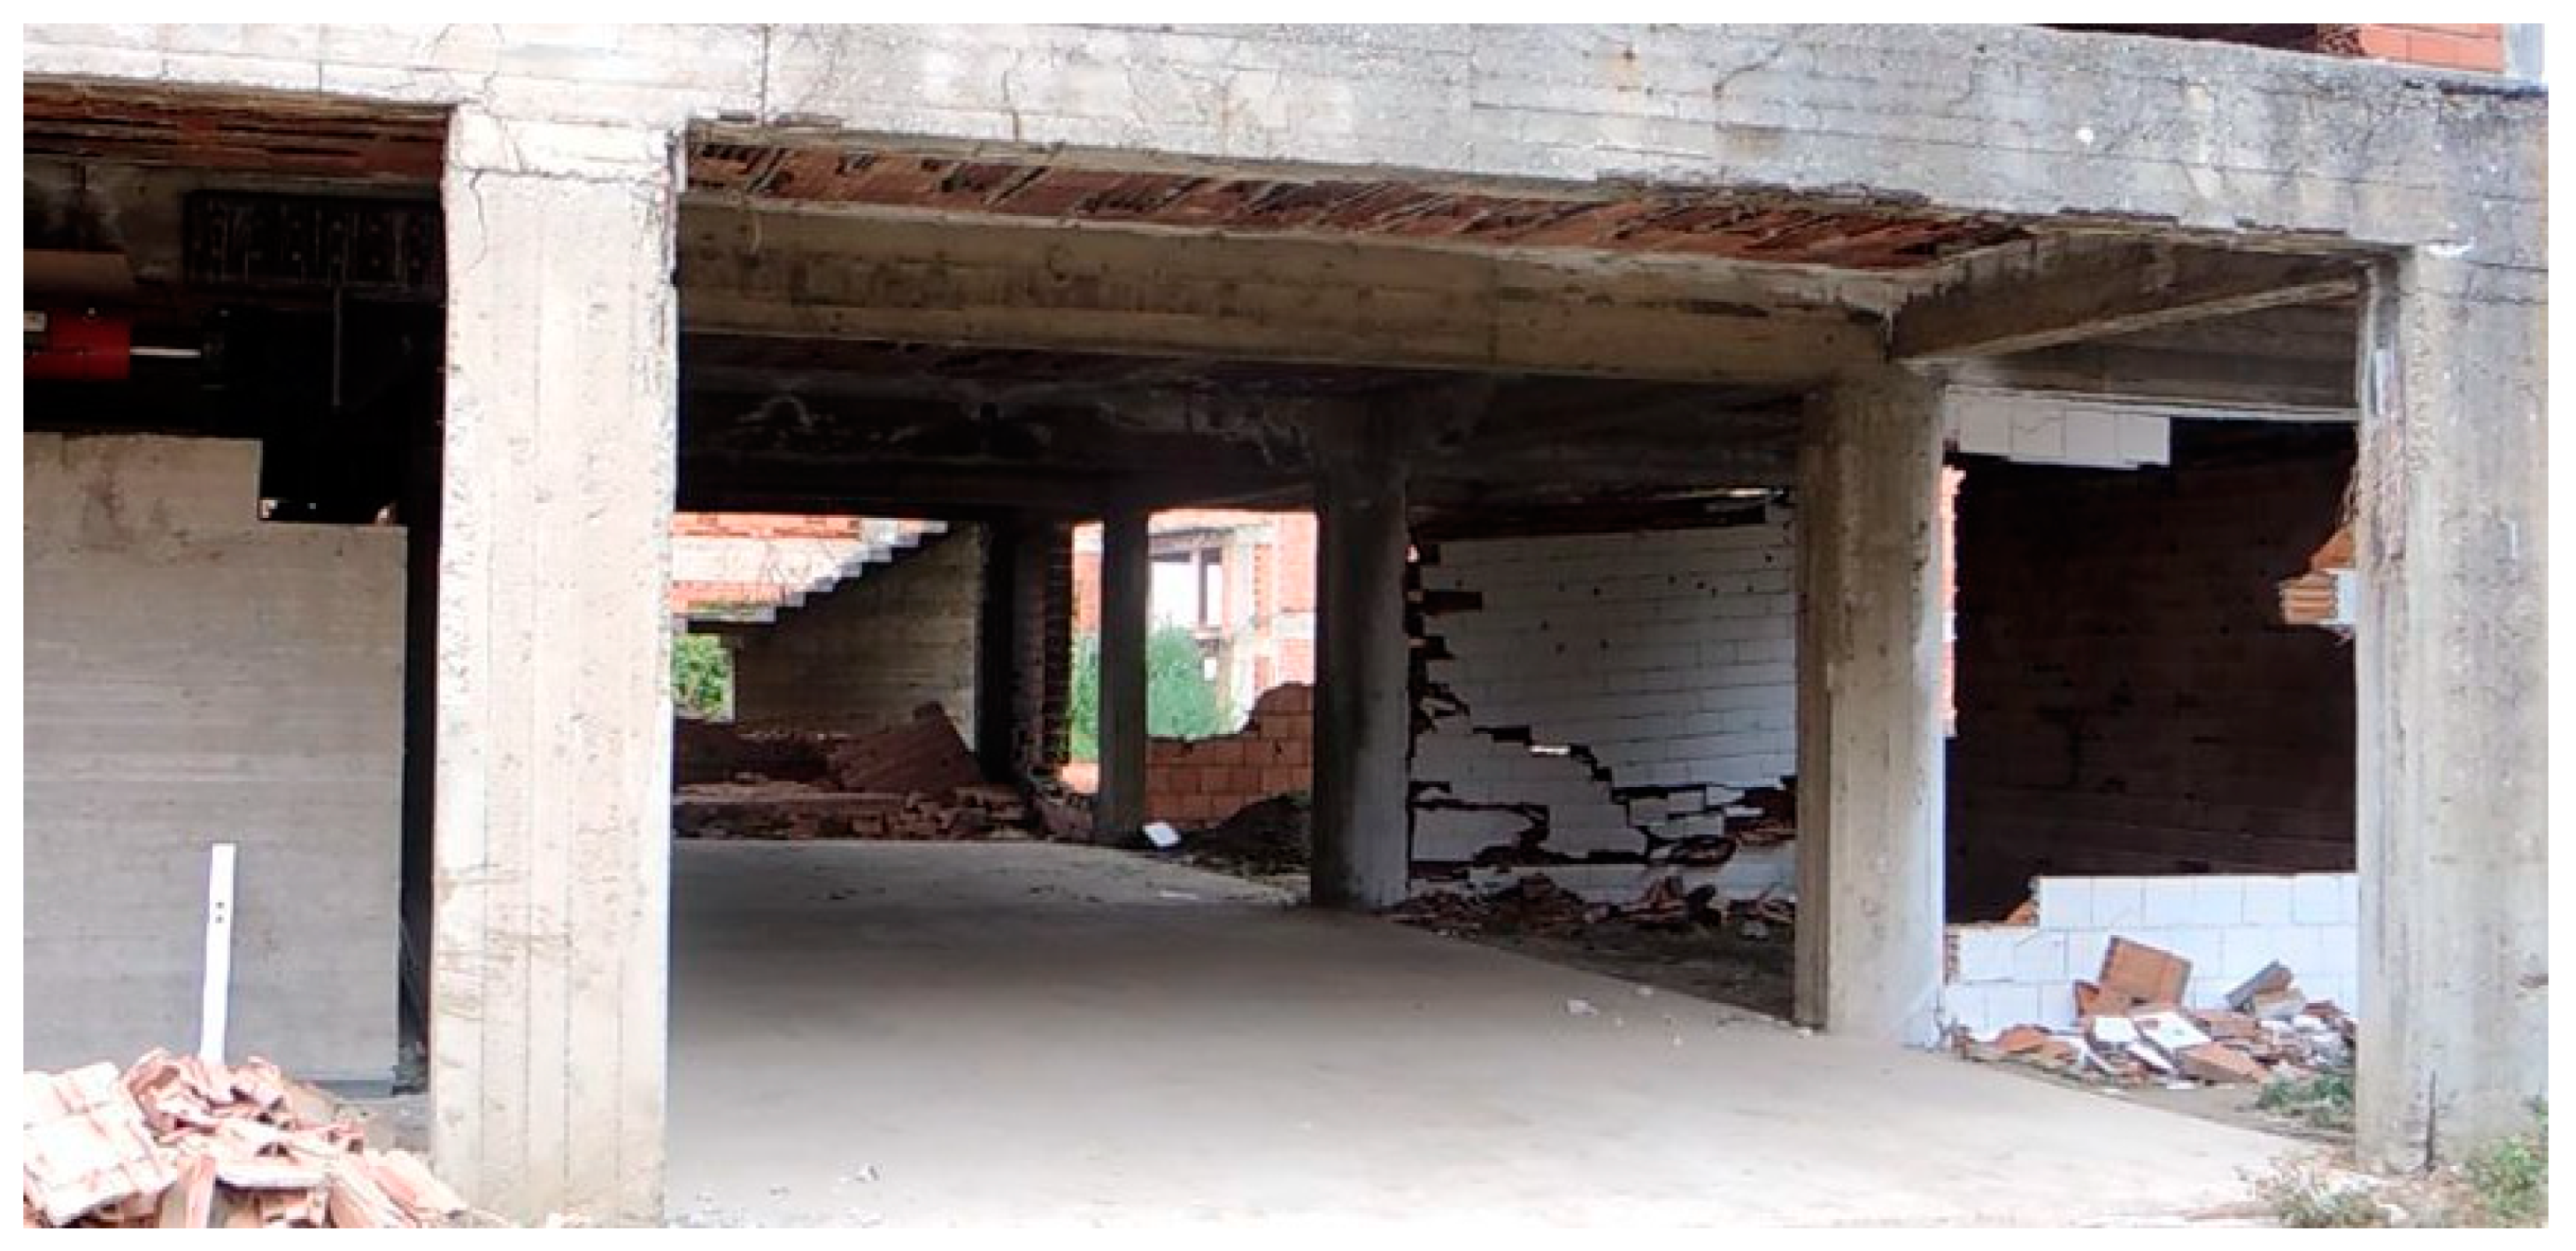
Figure 21 show the major damages that occurred at the end of the last test, run #9 (62.4 mm, 1.69%). As expected, beams did not show significant damage, while all the infills along the push direction, heavily damaged by the previous tests, collapsed completely (
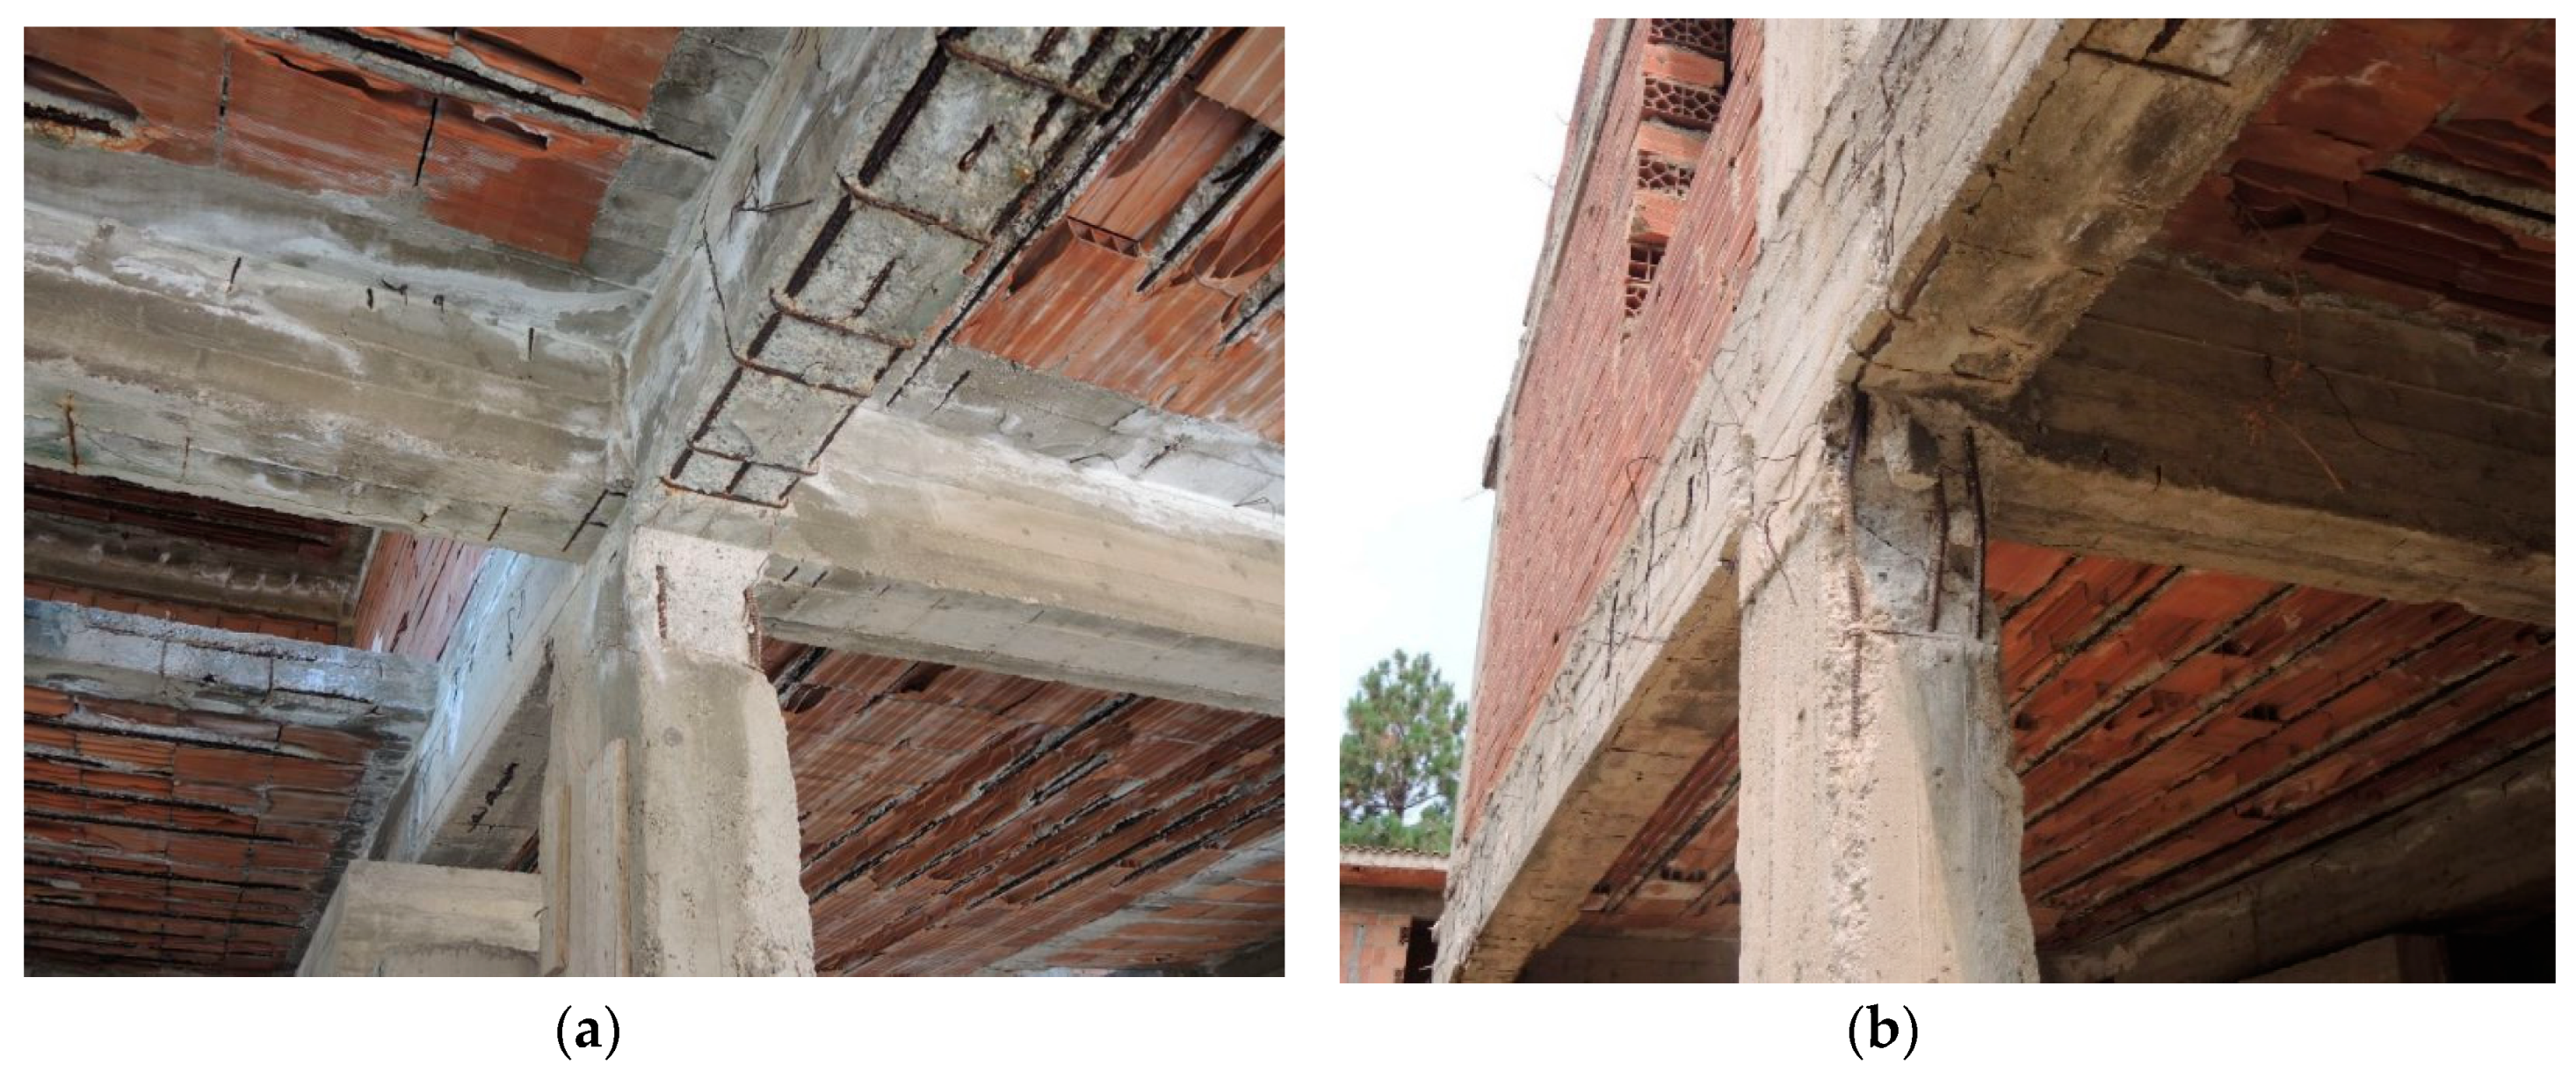
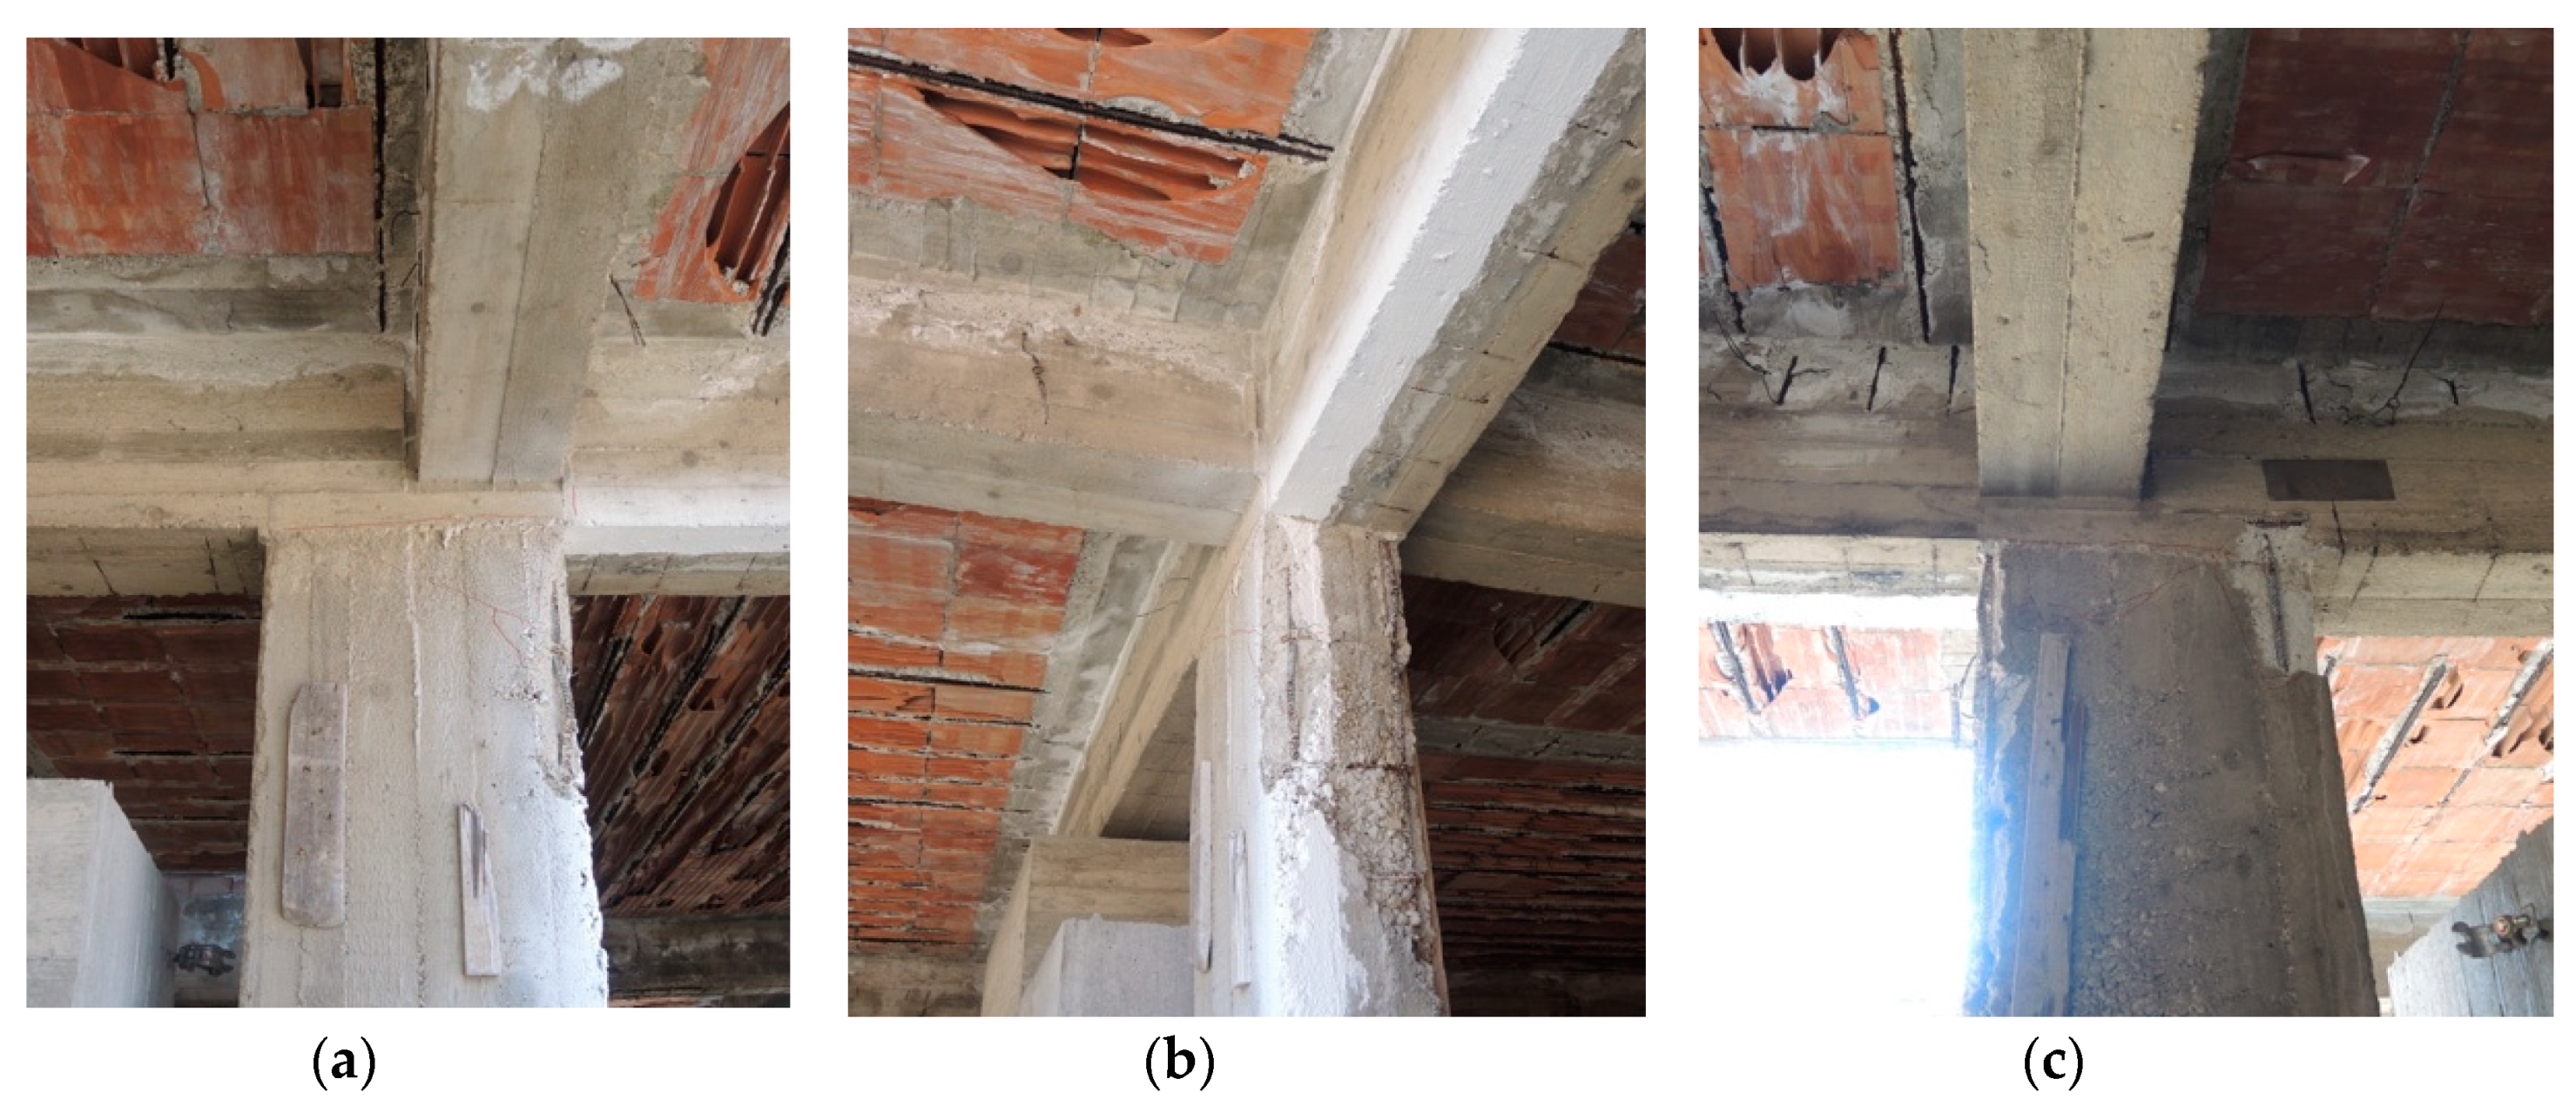
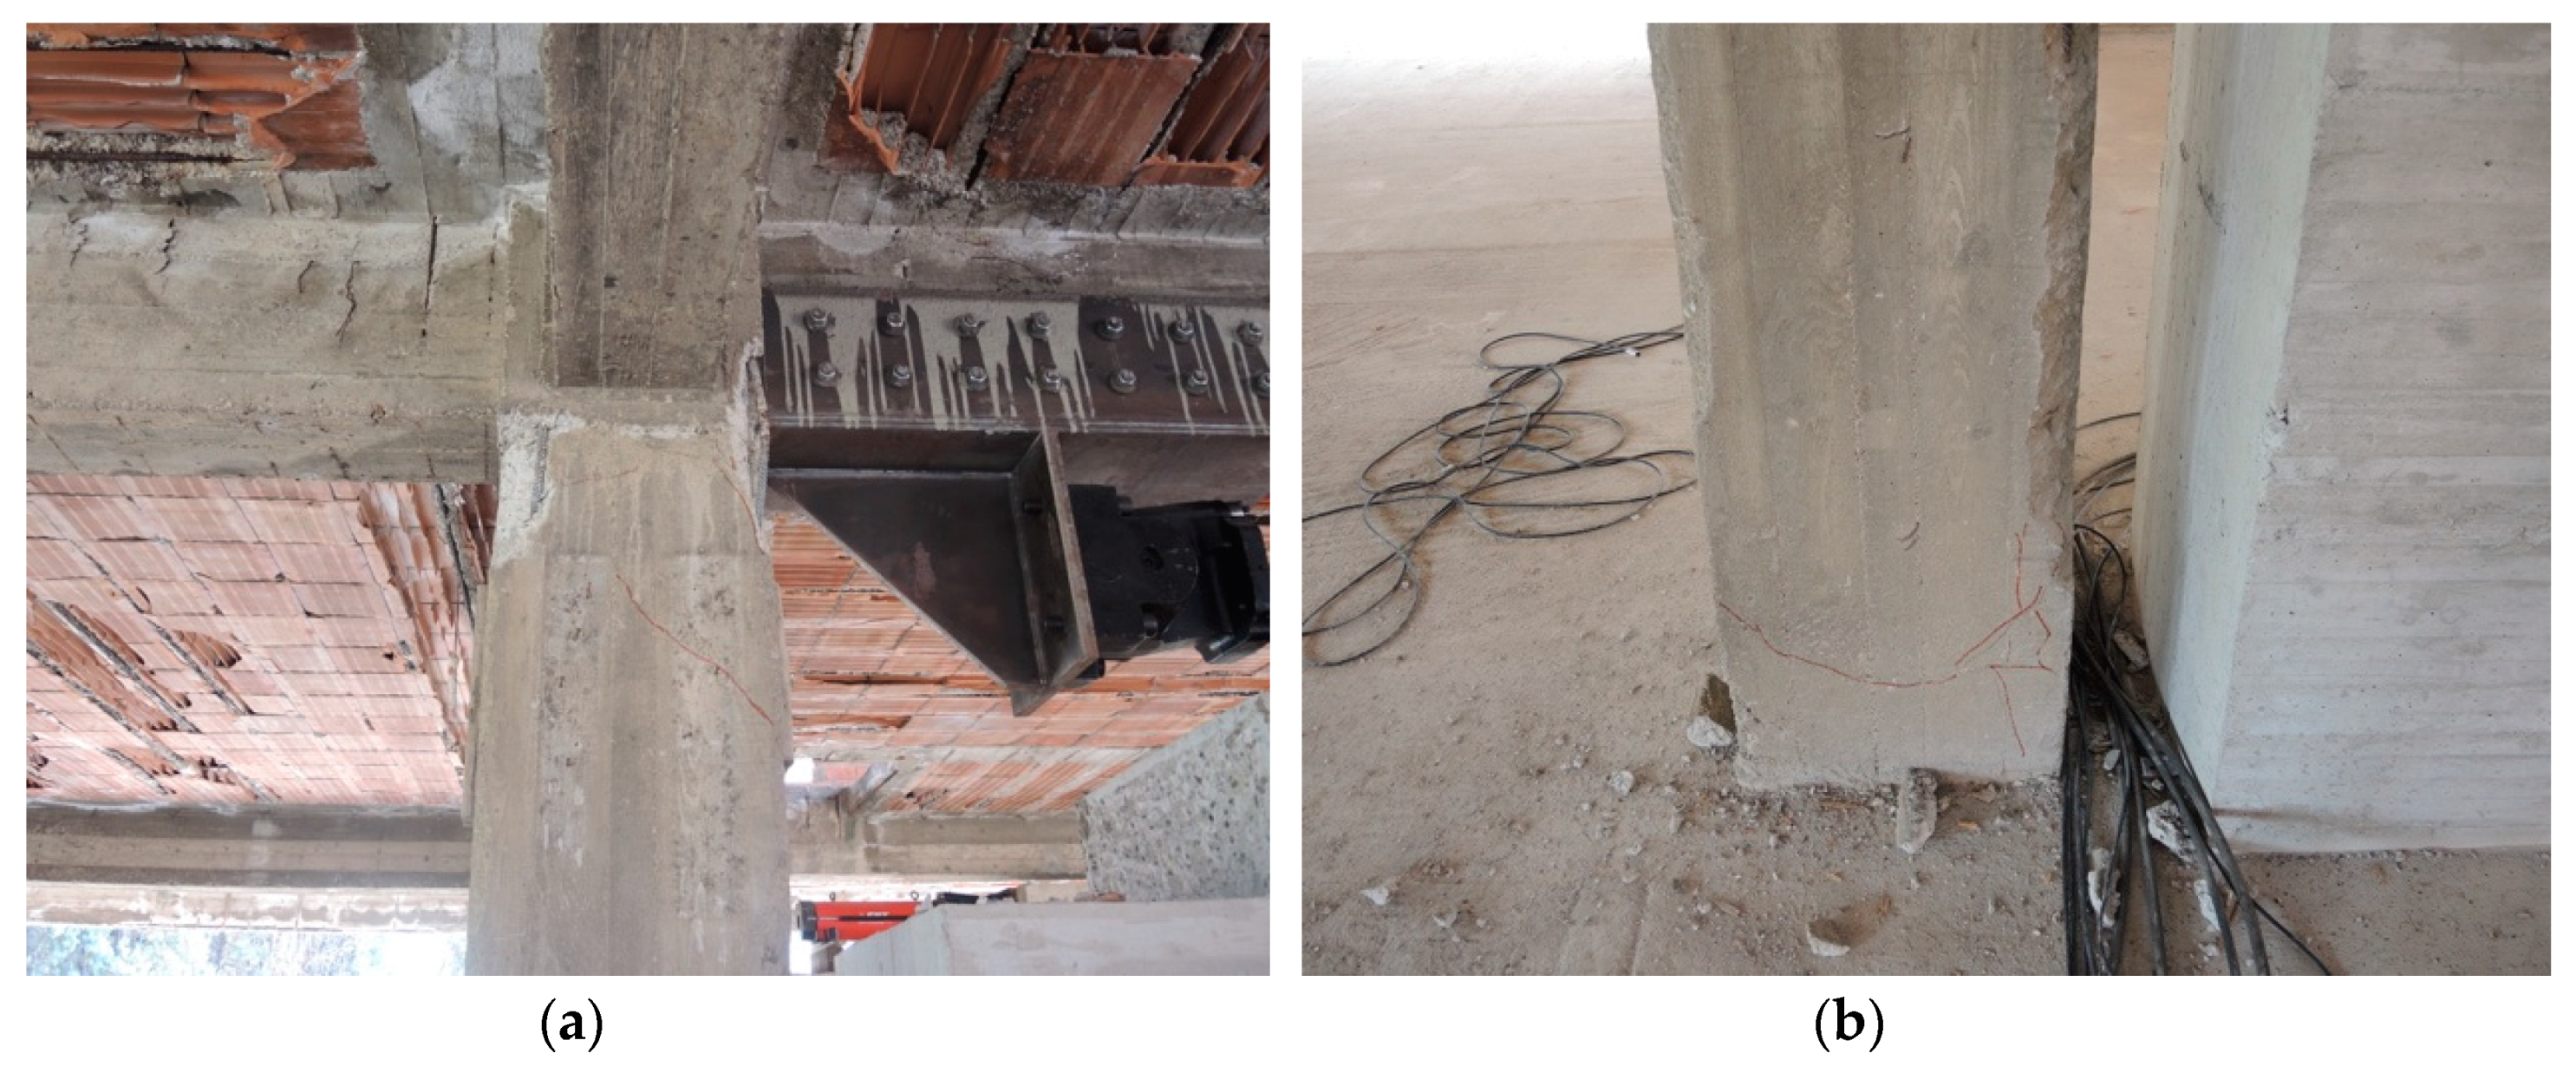
Figure 15). The most damaged columns were those with the larger size parallel to the push direction, since they attracted larger forces. Most of these elements featured mixed shear and flexural failures at the base and at the top, with concrete spalling and longitudinal rebars buckling (e.g.,
Figure 16 and
Figure 17). The same applies to the central column c11 (
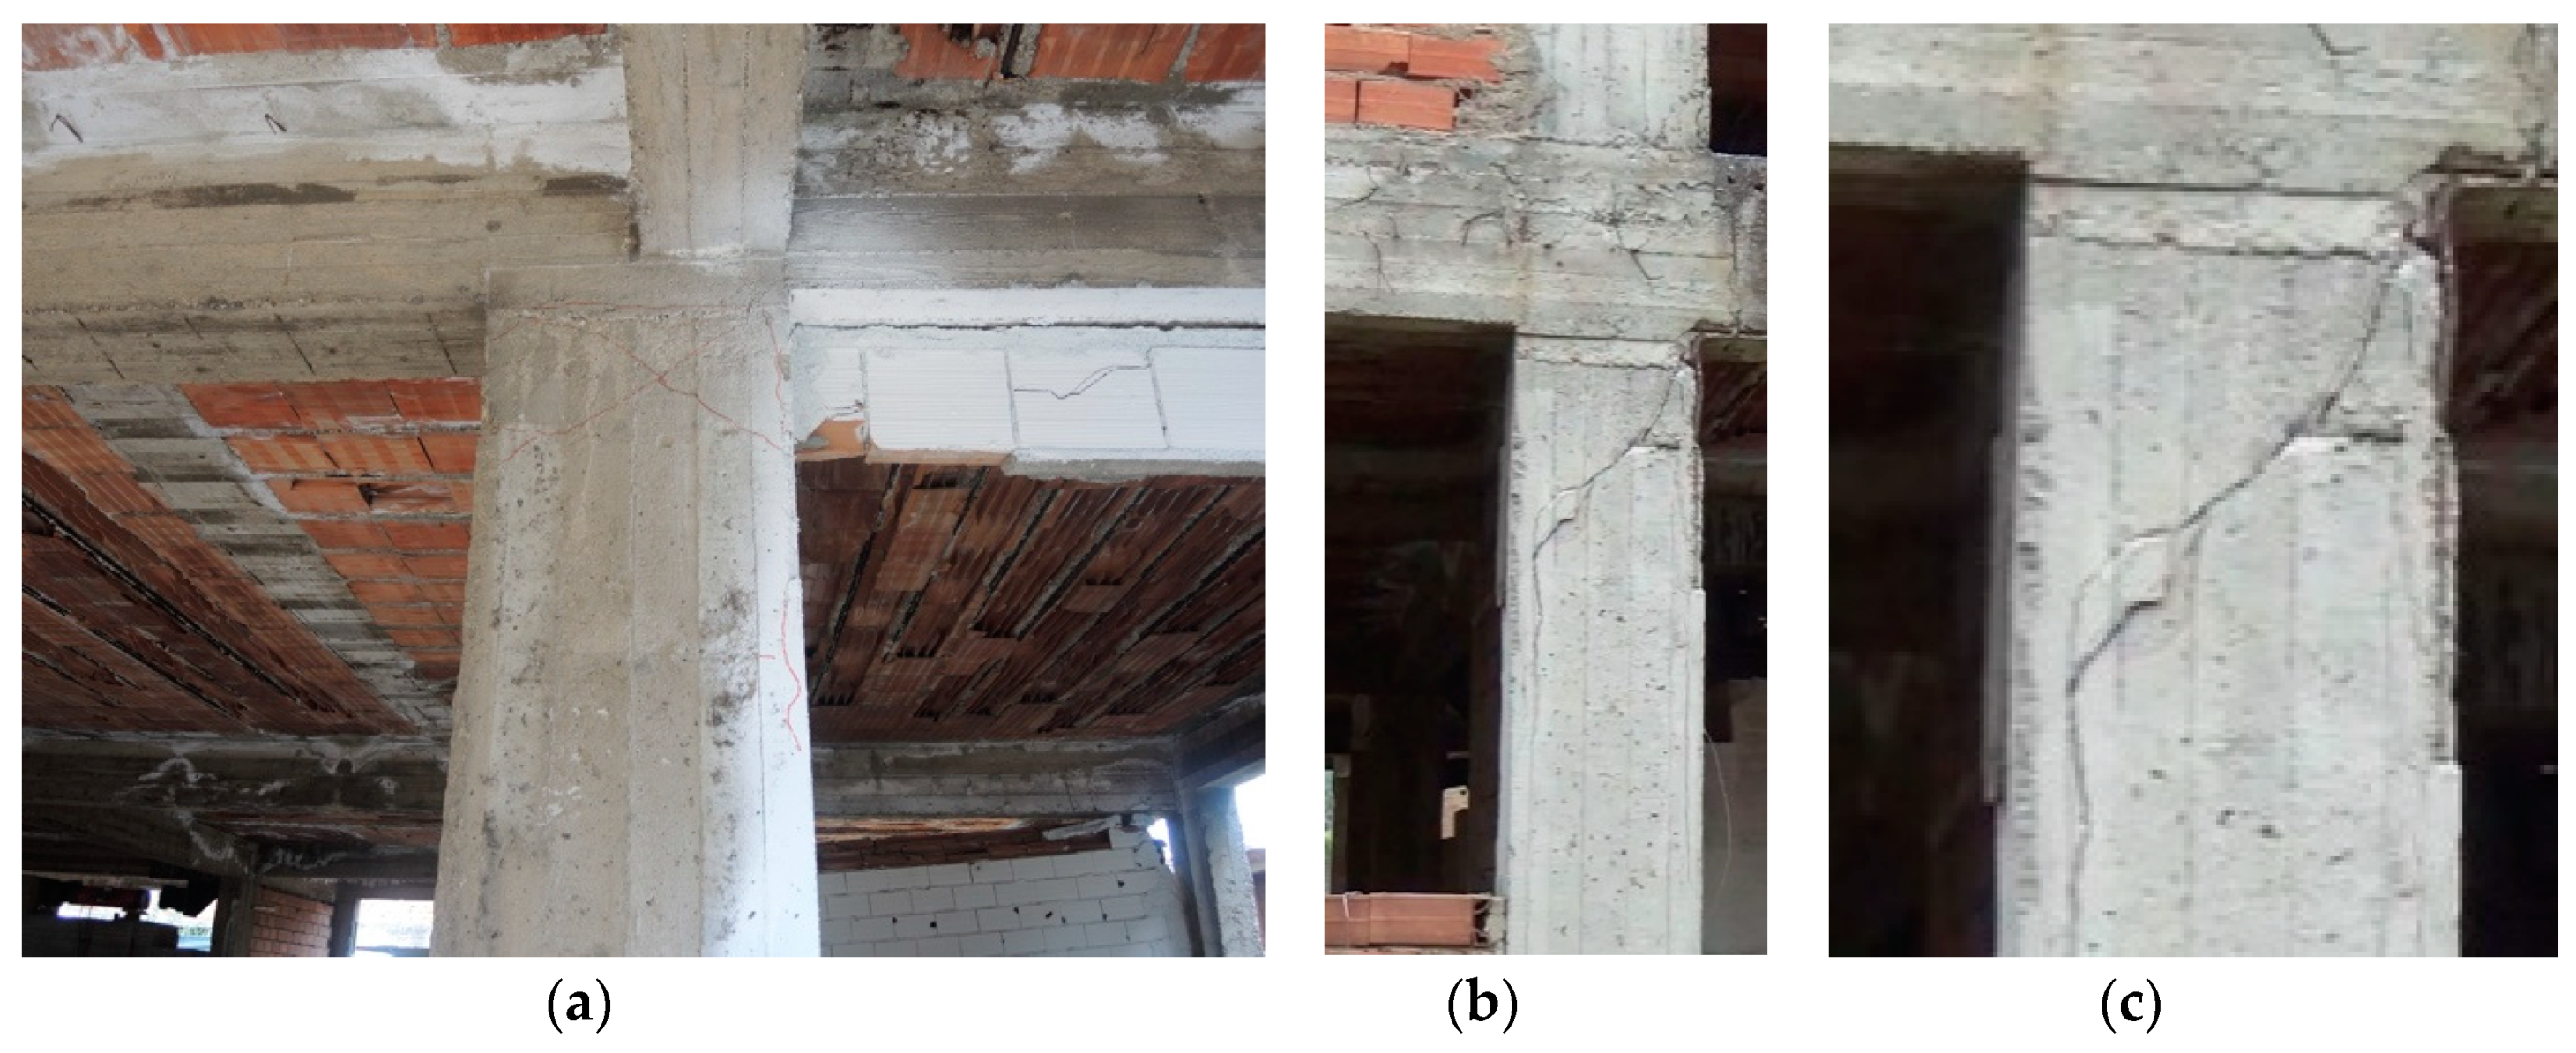
Figure 18). A particularly severe shear failure occurred at column c9 (
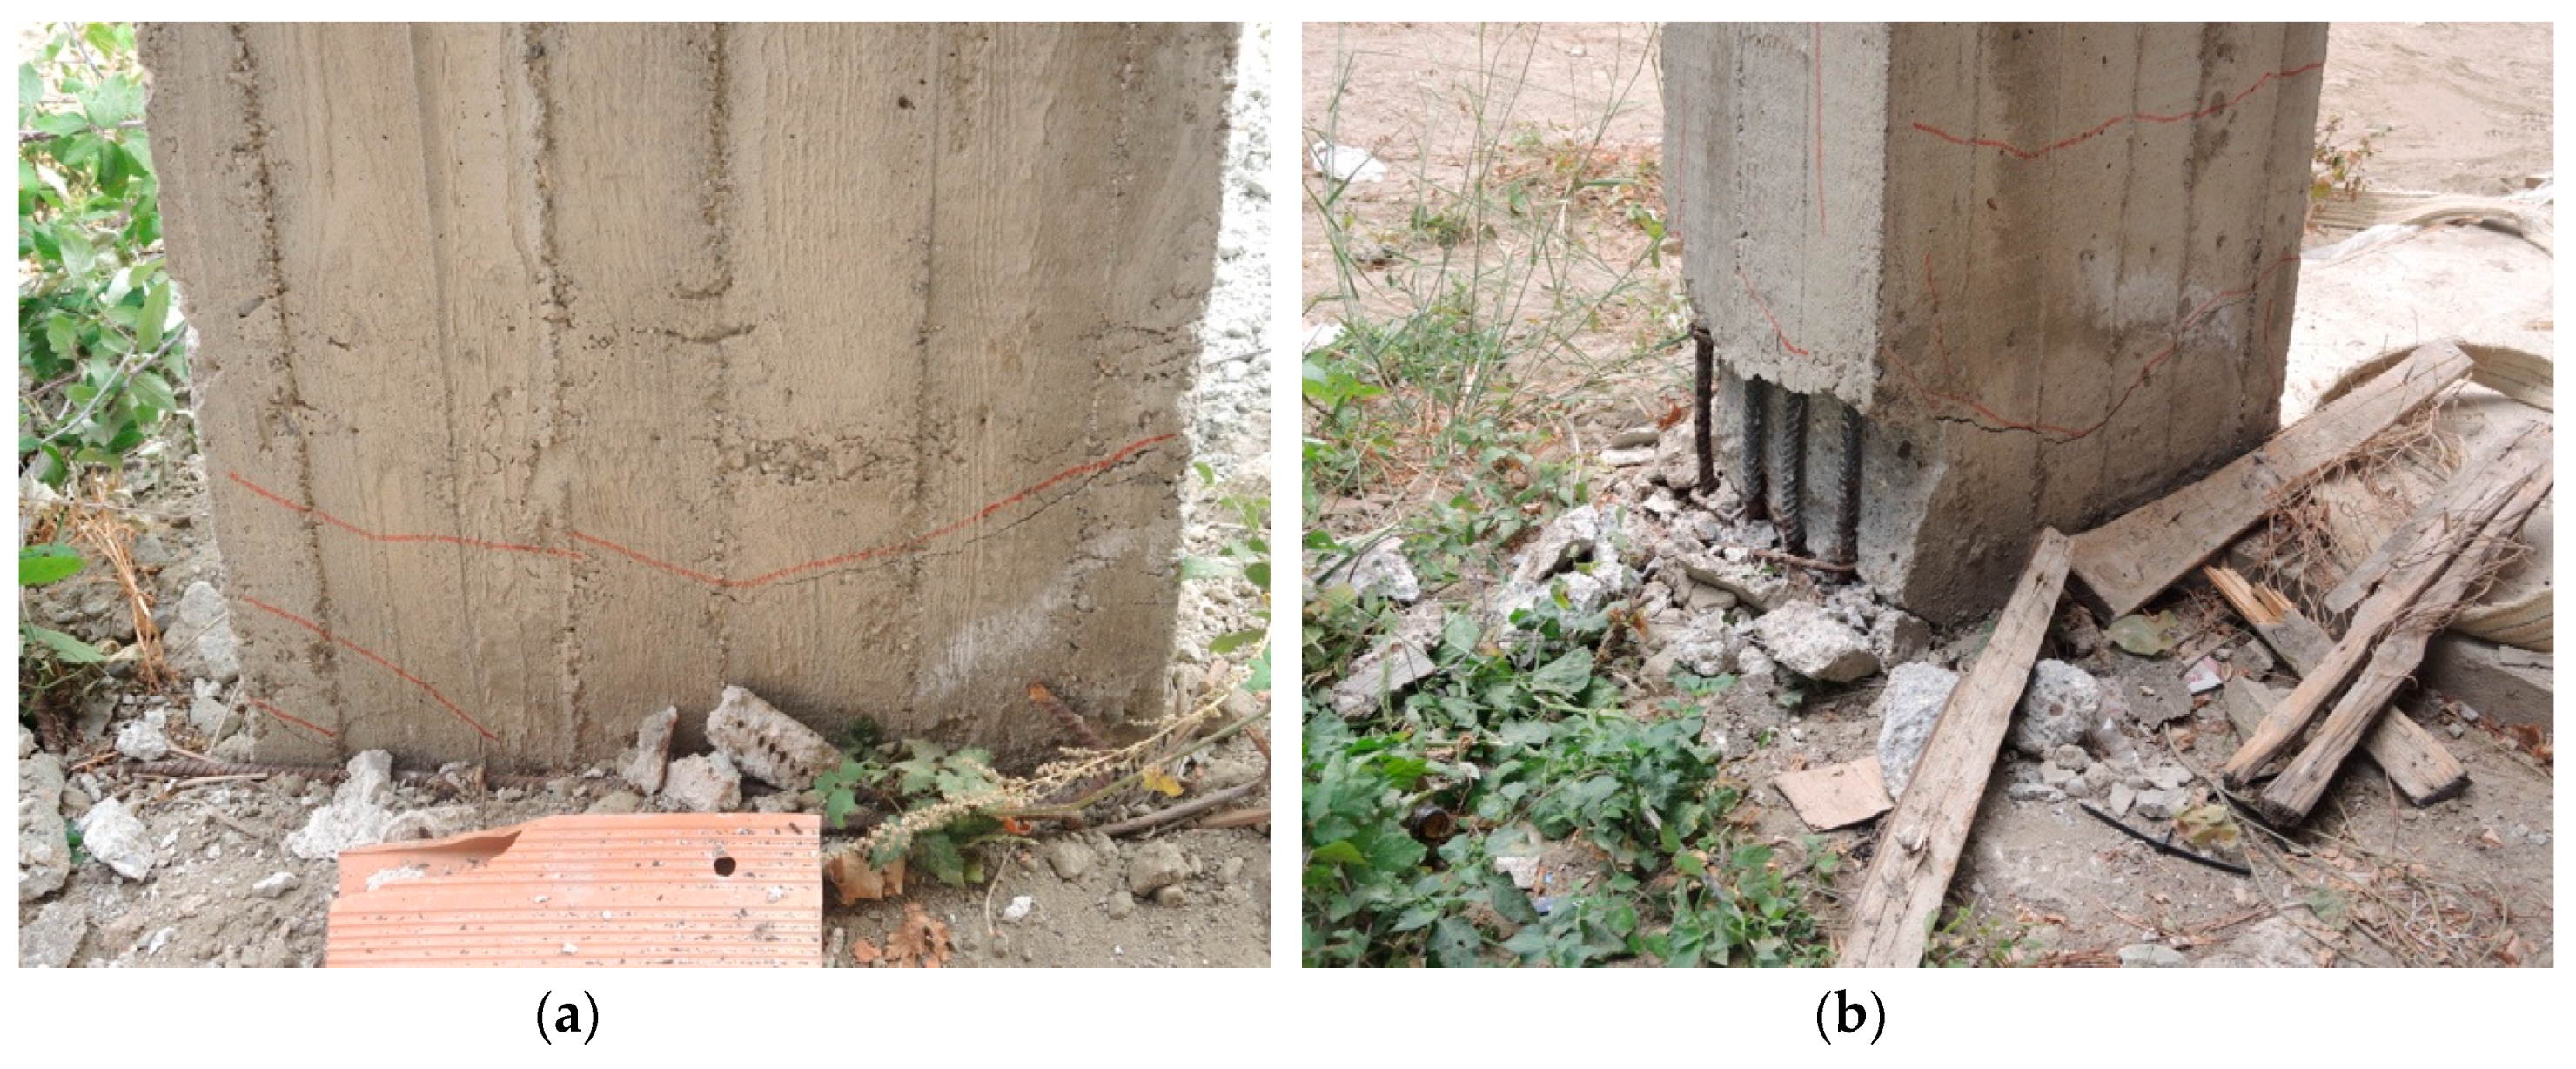
Figure 20, right). Failure modes connected to bending behavior occurred mainly at the base of the columns c4 and c18 (
Figure 19): The lower axial load probably shifted the strength hierarchy in favor of the flexural collapse mode. Less damage, in general, was found on the perimeter columns (#3, 4, 18, 19), whose bays were not directly pushed by actuators, and by the columns aligned perpendicularly to the test direction, with an exception done for columns c20 and c3 which showed some shear and flexural cracks, respectively. Some of the not fully confined joints, i.e., those on the perimeter, showed shear failure (
Figure 21).
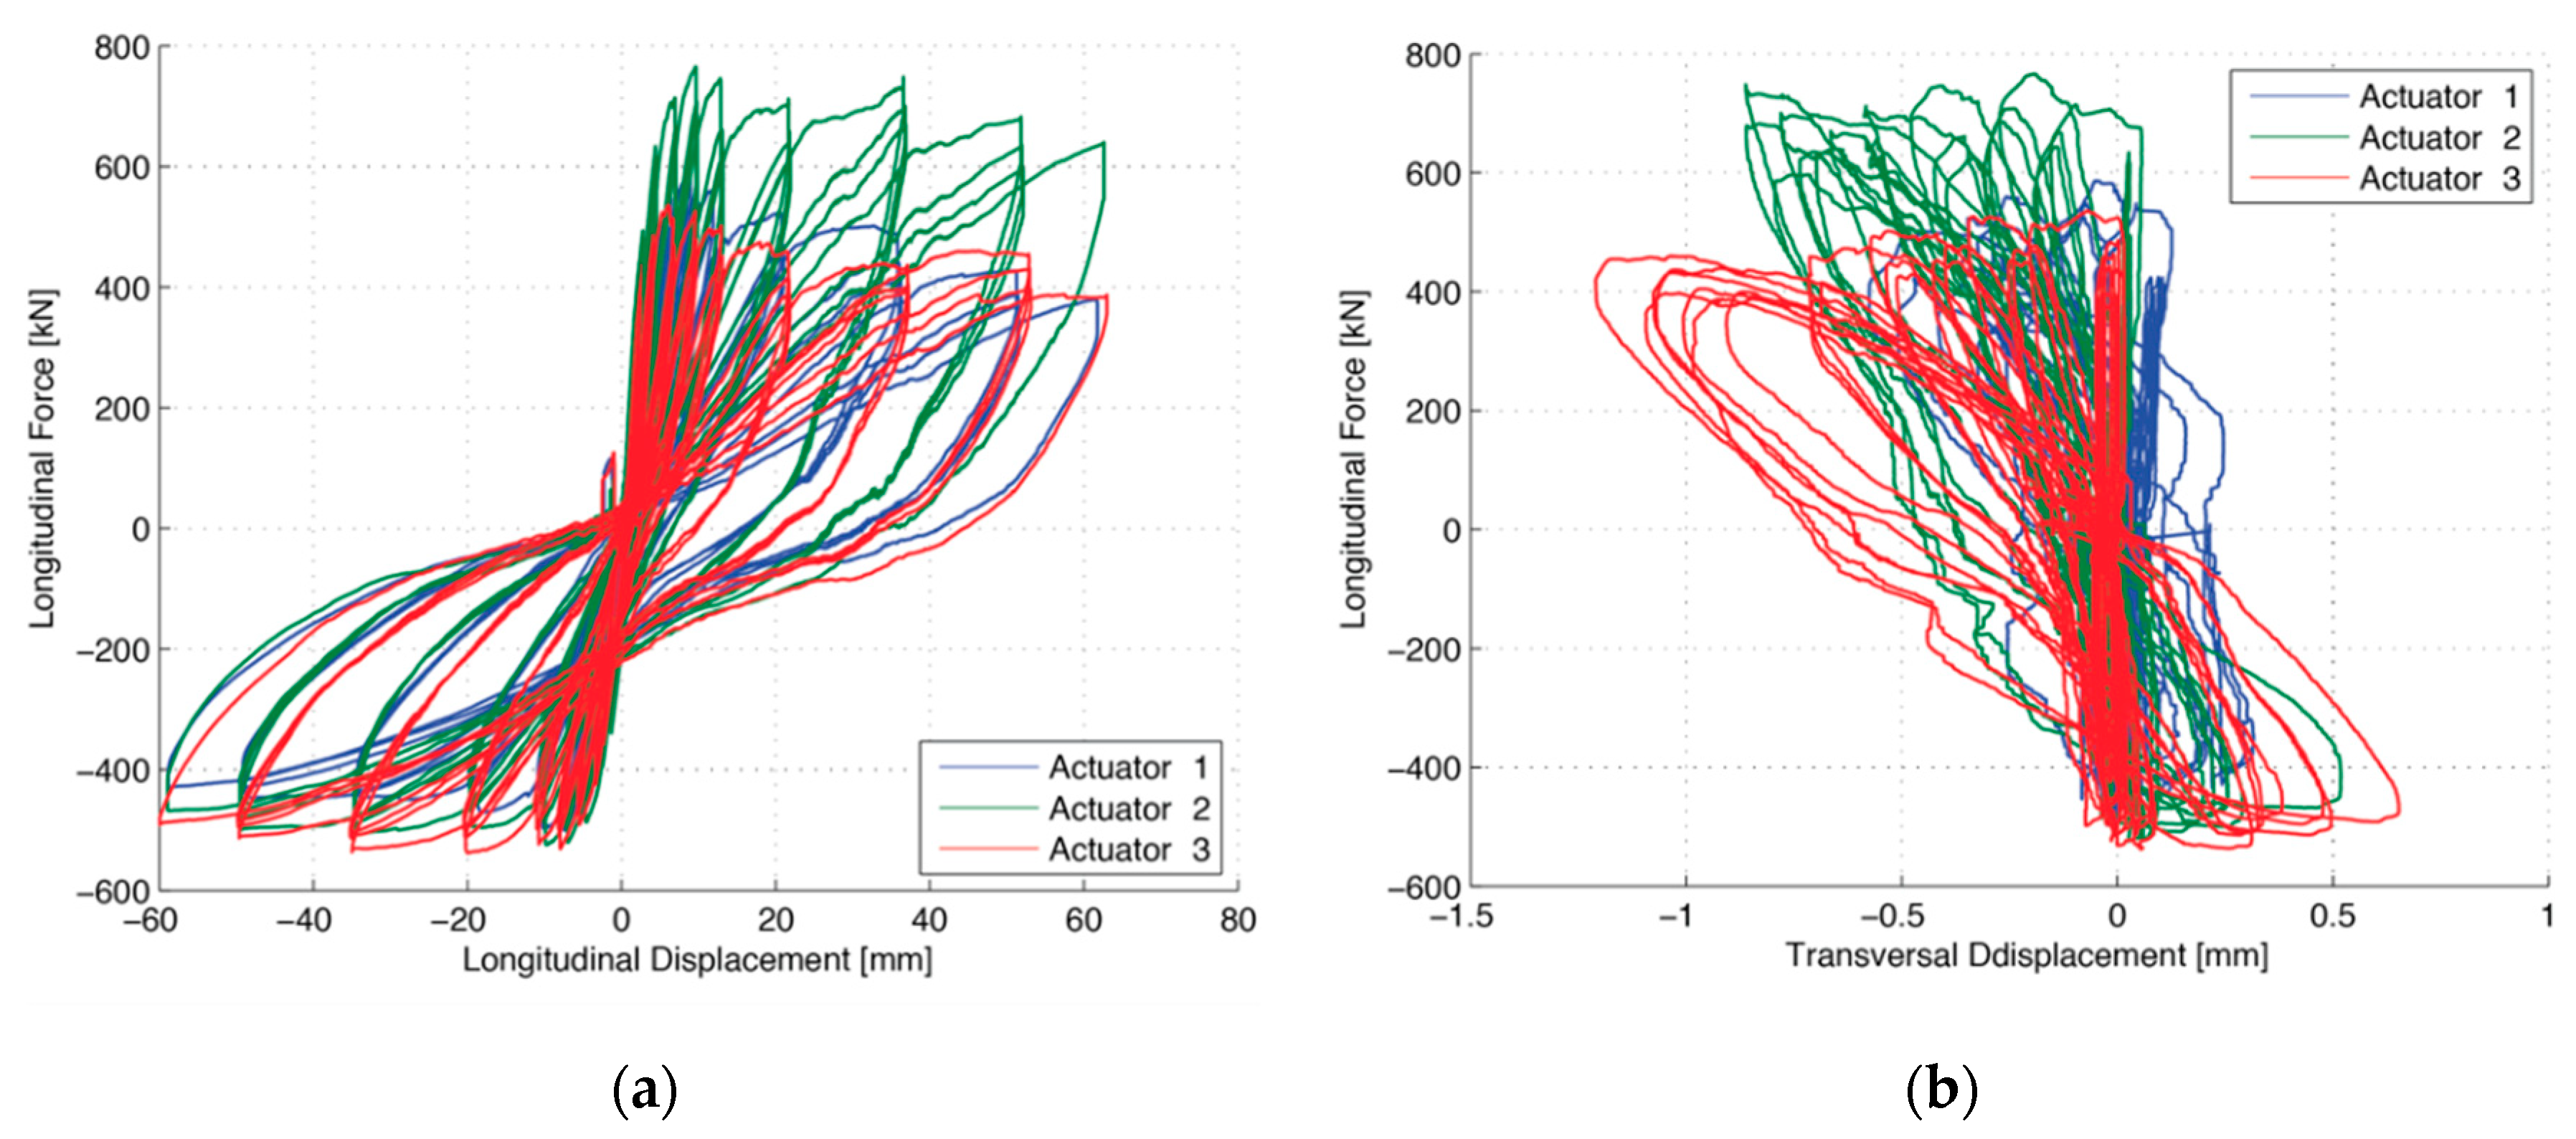
Figure 22 shows the force record of the individual actuators, plotted versus displacement along the test direction (a) and orthogonal to the test direction (b). In
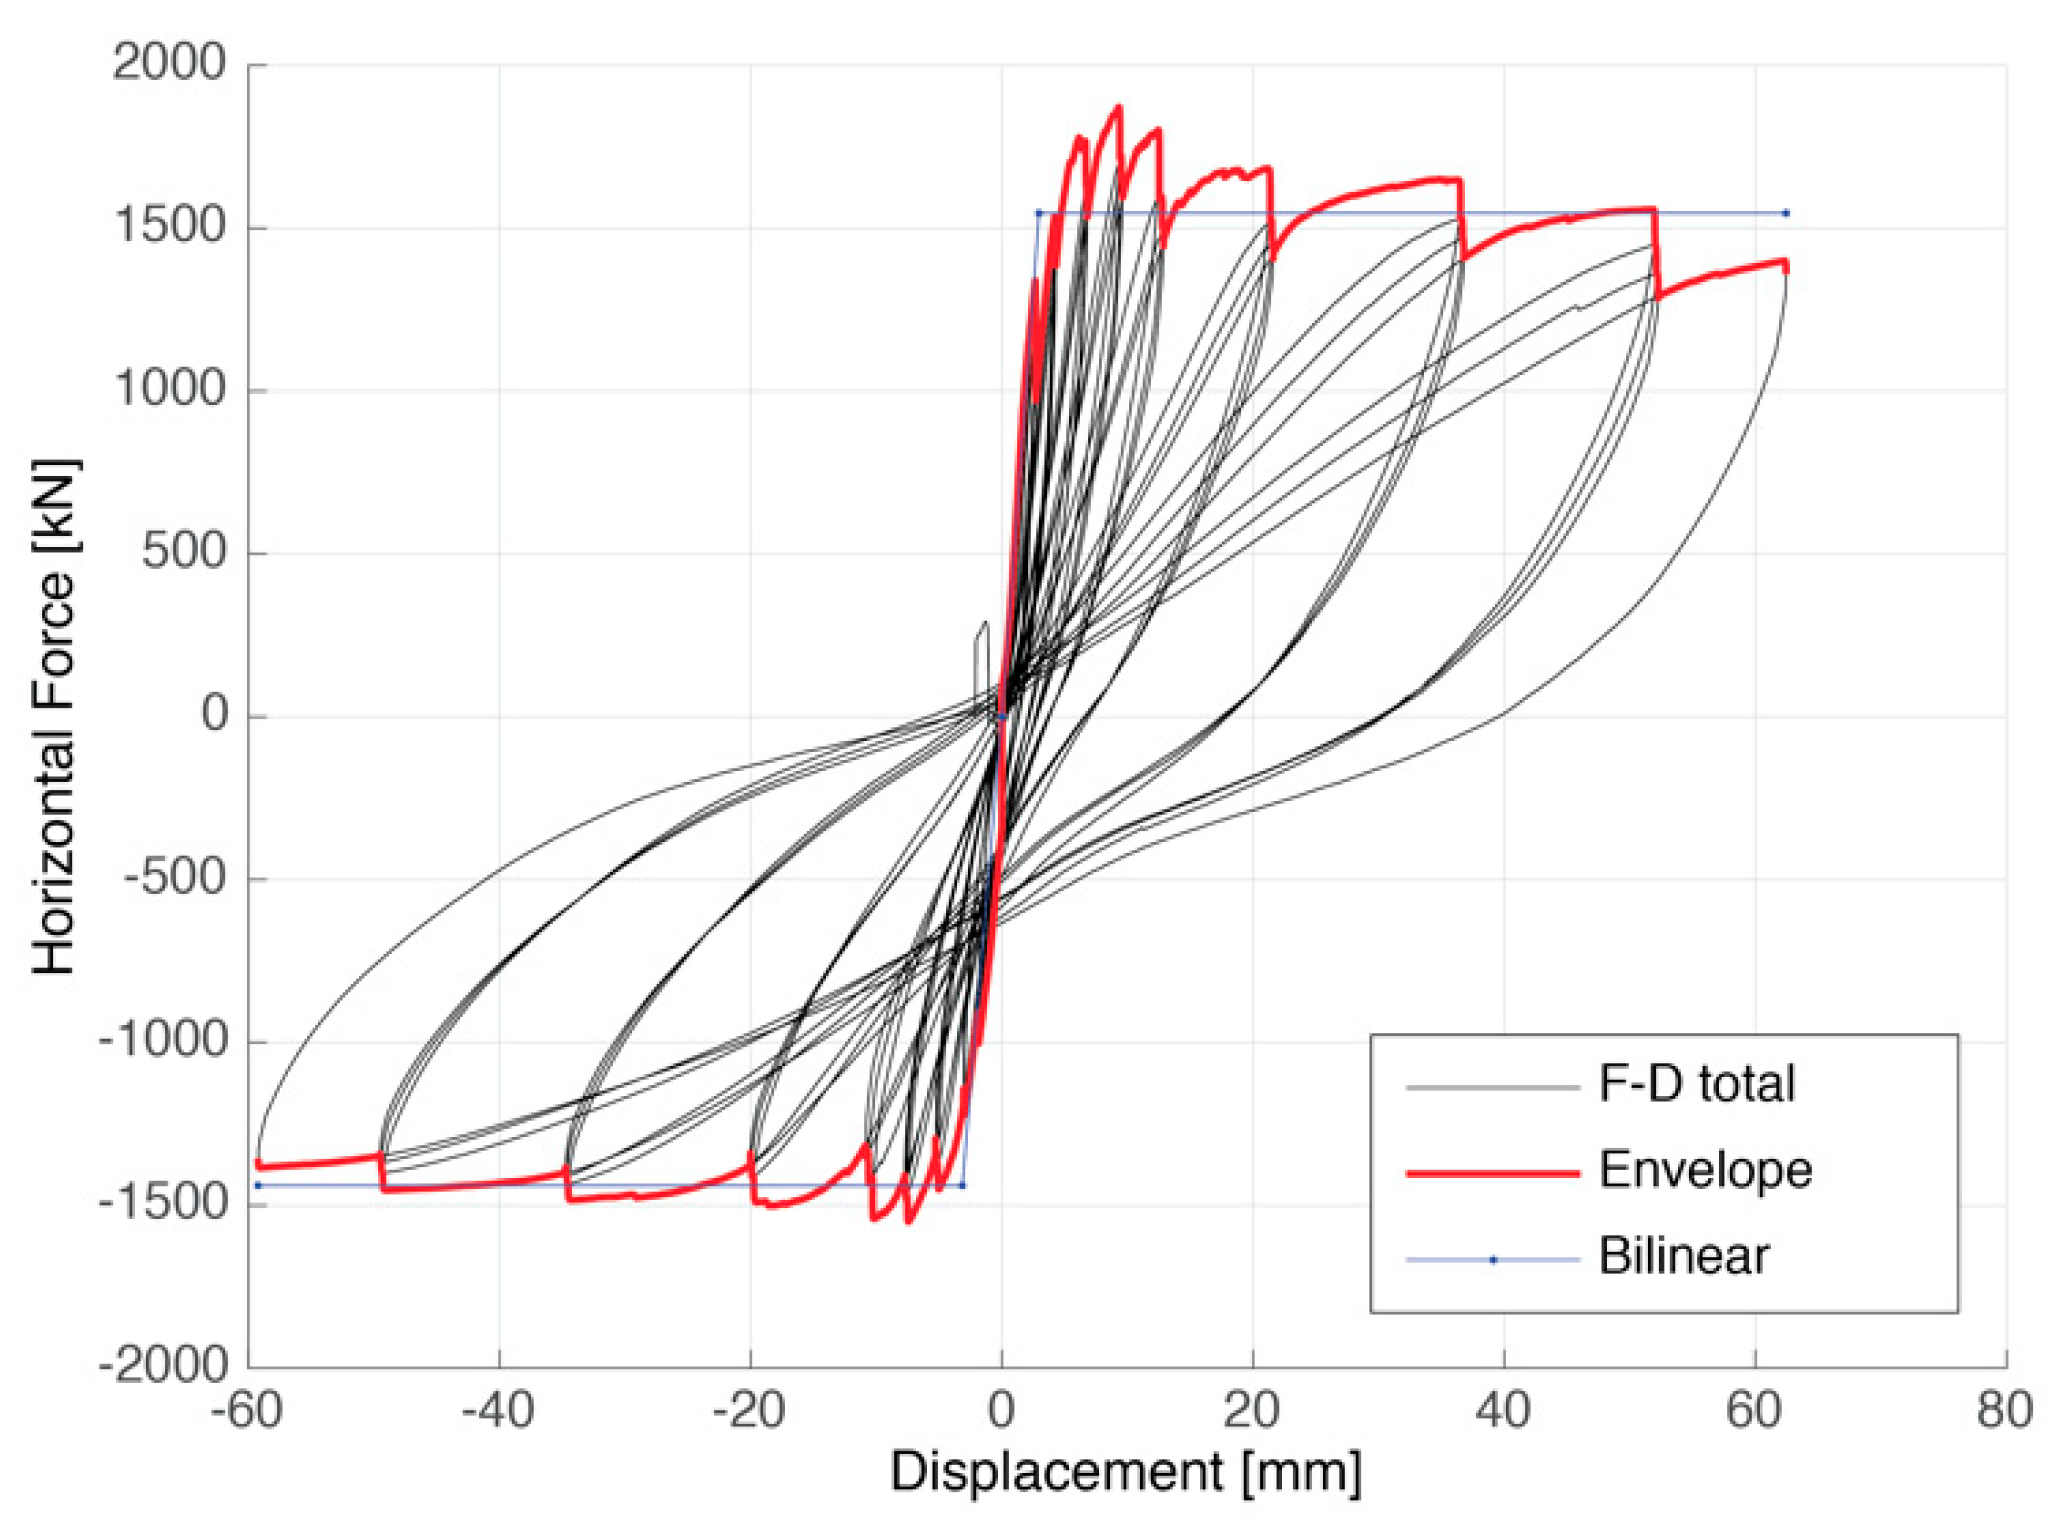
Figure 23, the total force-average displacement loops are shown together with the skeleton curve, on which the energy balanced bilinear approximation is plotted. Finally,
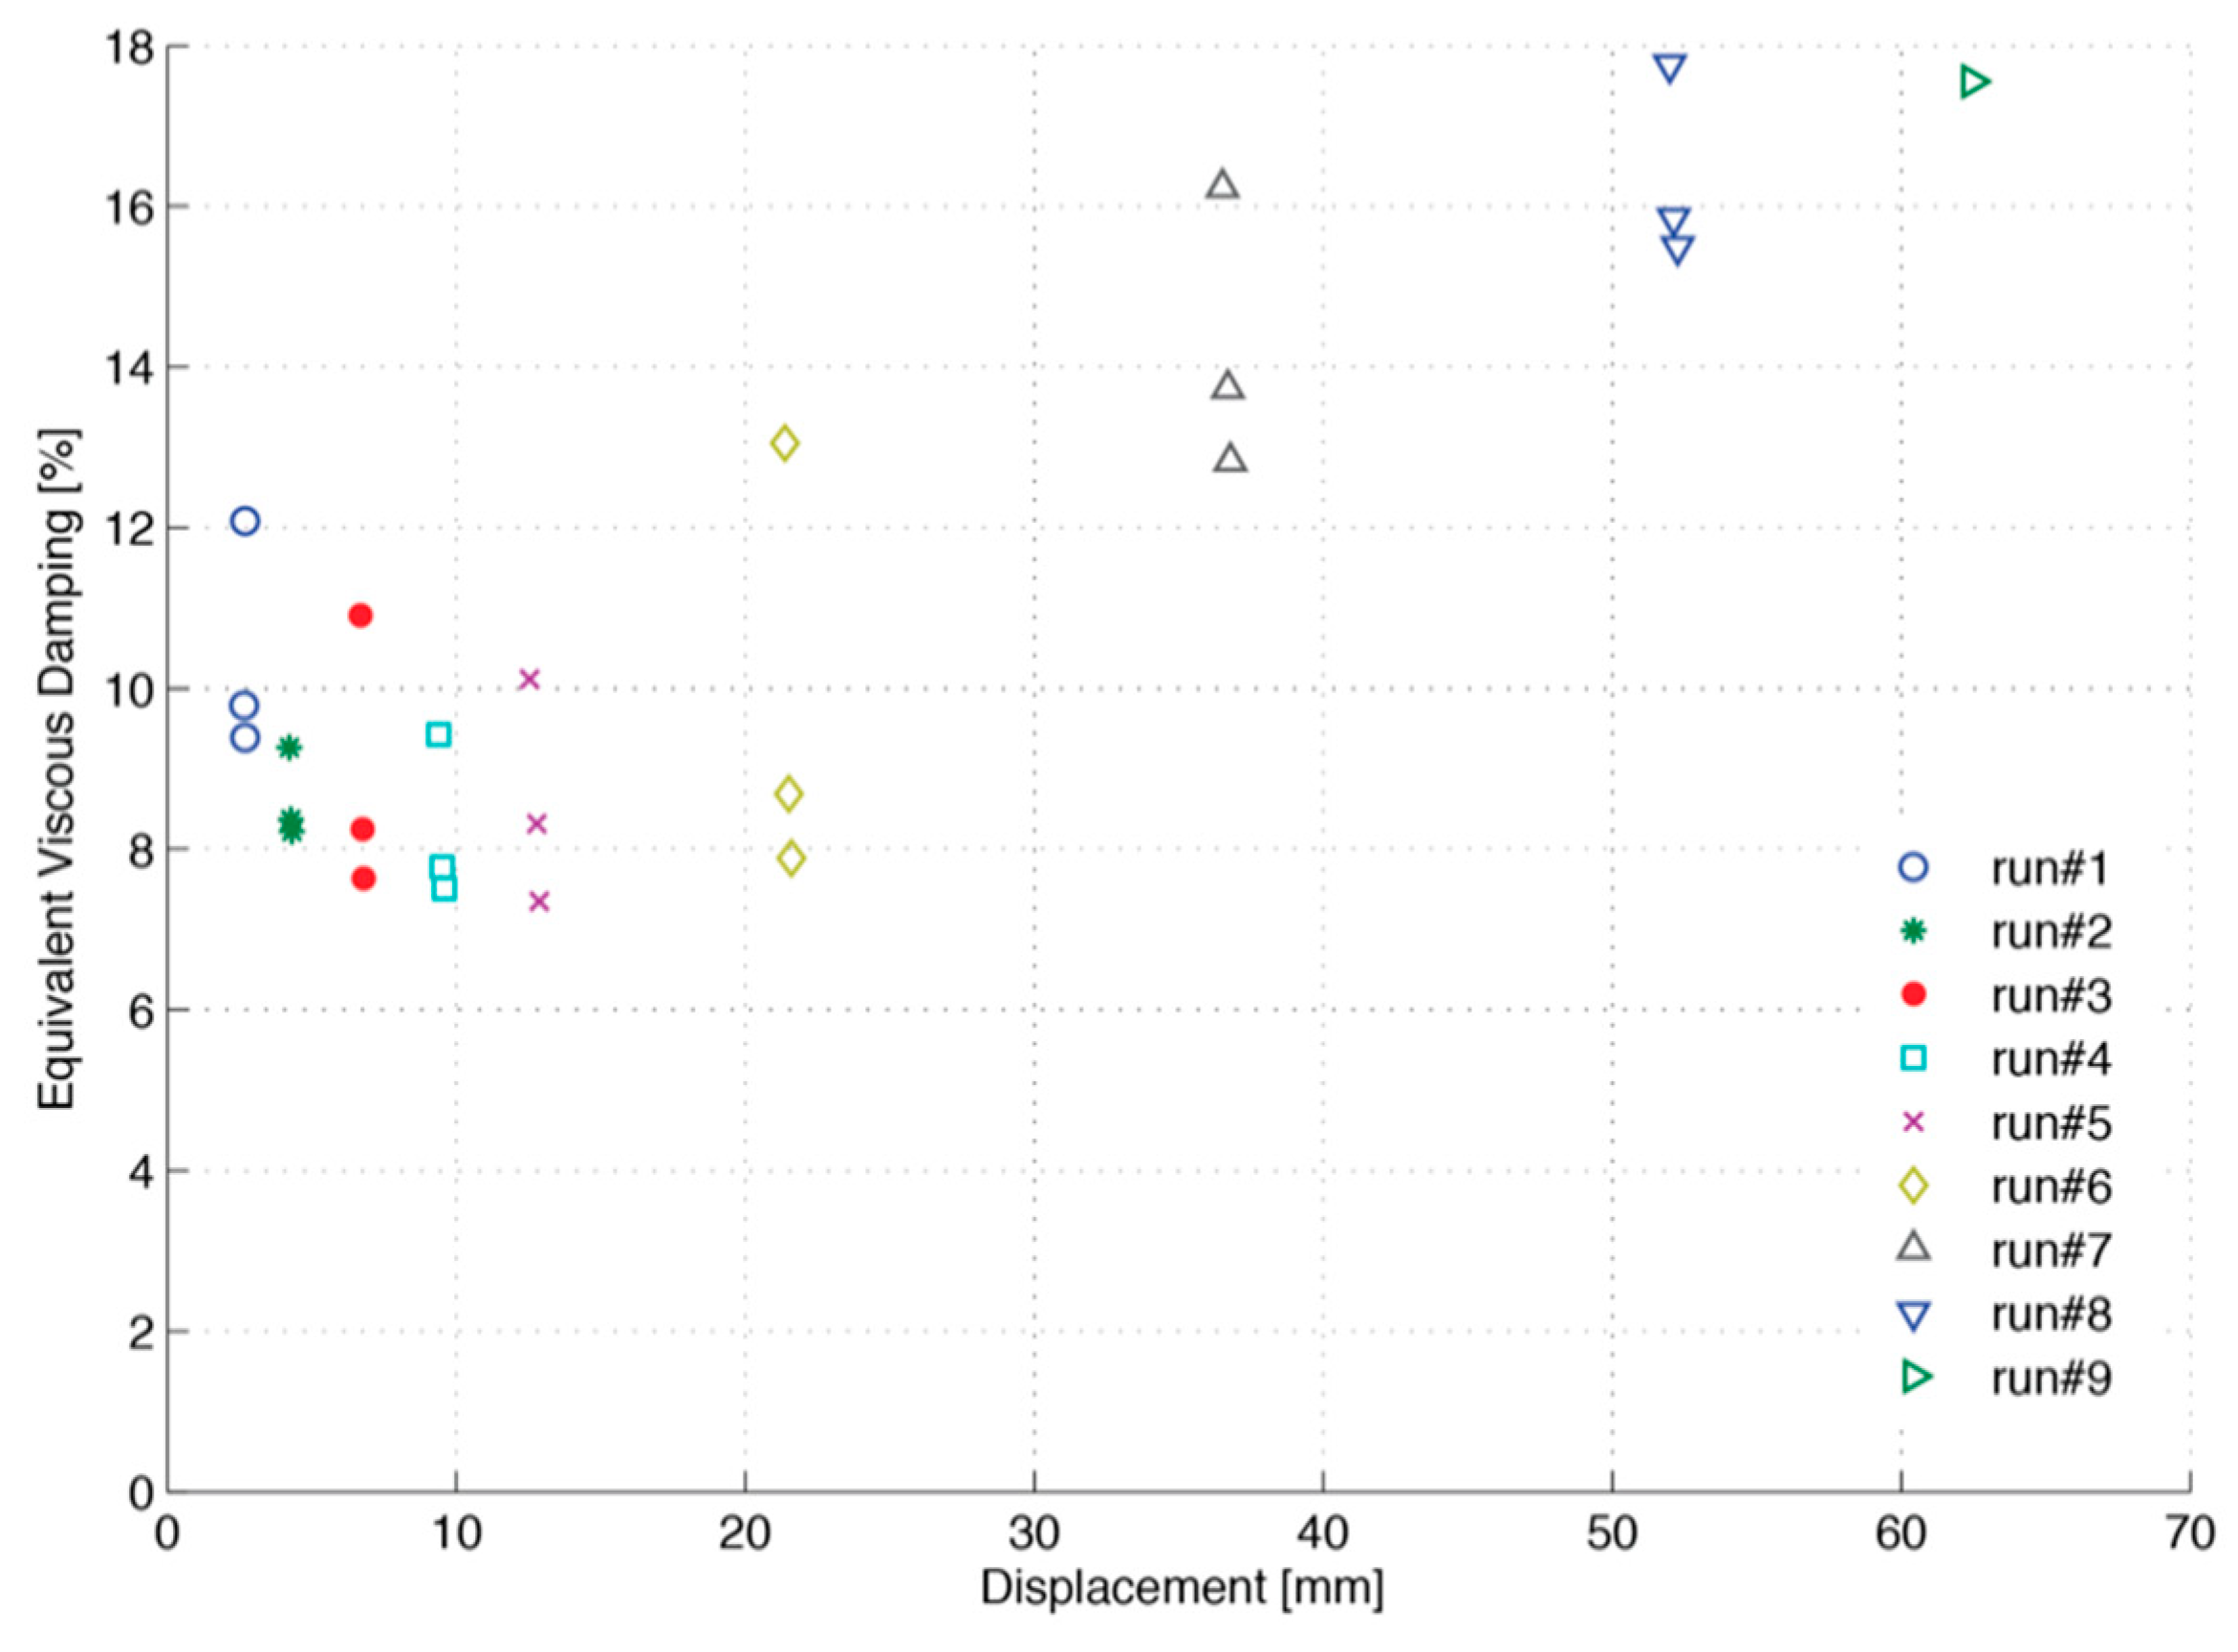
Figure 24 shows the relation between displacement and equivalent viscous damping: One point for each cycle at every displacement amplitude. These values were evaluated using the well-known Jacobsen’s approach on the basis of the hysteretic energy of each cycle. Considering that, due to damages, the equivalent viscous damping was mainly due to the hysteretic contribution, the calculated values appeared to be reasonable.
The analysis of the recorded data substantially confirms what was previously observed on structural damage. The maximum force is achieved at a displacement equal to 9.6 mm. Beyond this threshold, infills began to show significant damages, the maximum force decreased, and the damping increased. When infills were completely damaged, beyond 22 mm displacement, the damping increased considerably because of the increasing hysteretic contribution of the RC frame. Consistently with the progress of the damage, even within the same run, the damping was higher at the first cycle and decreased in the following two cycles of the same amplitude. At the last single-cycle run, the damping did not increase any longer, likely due to the brittle failure of the RC elements, implying the possibility of an incipient global collapse.
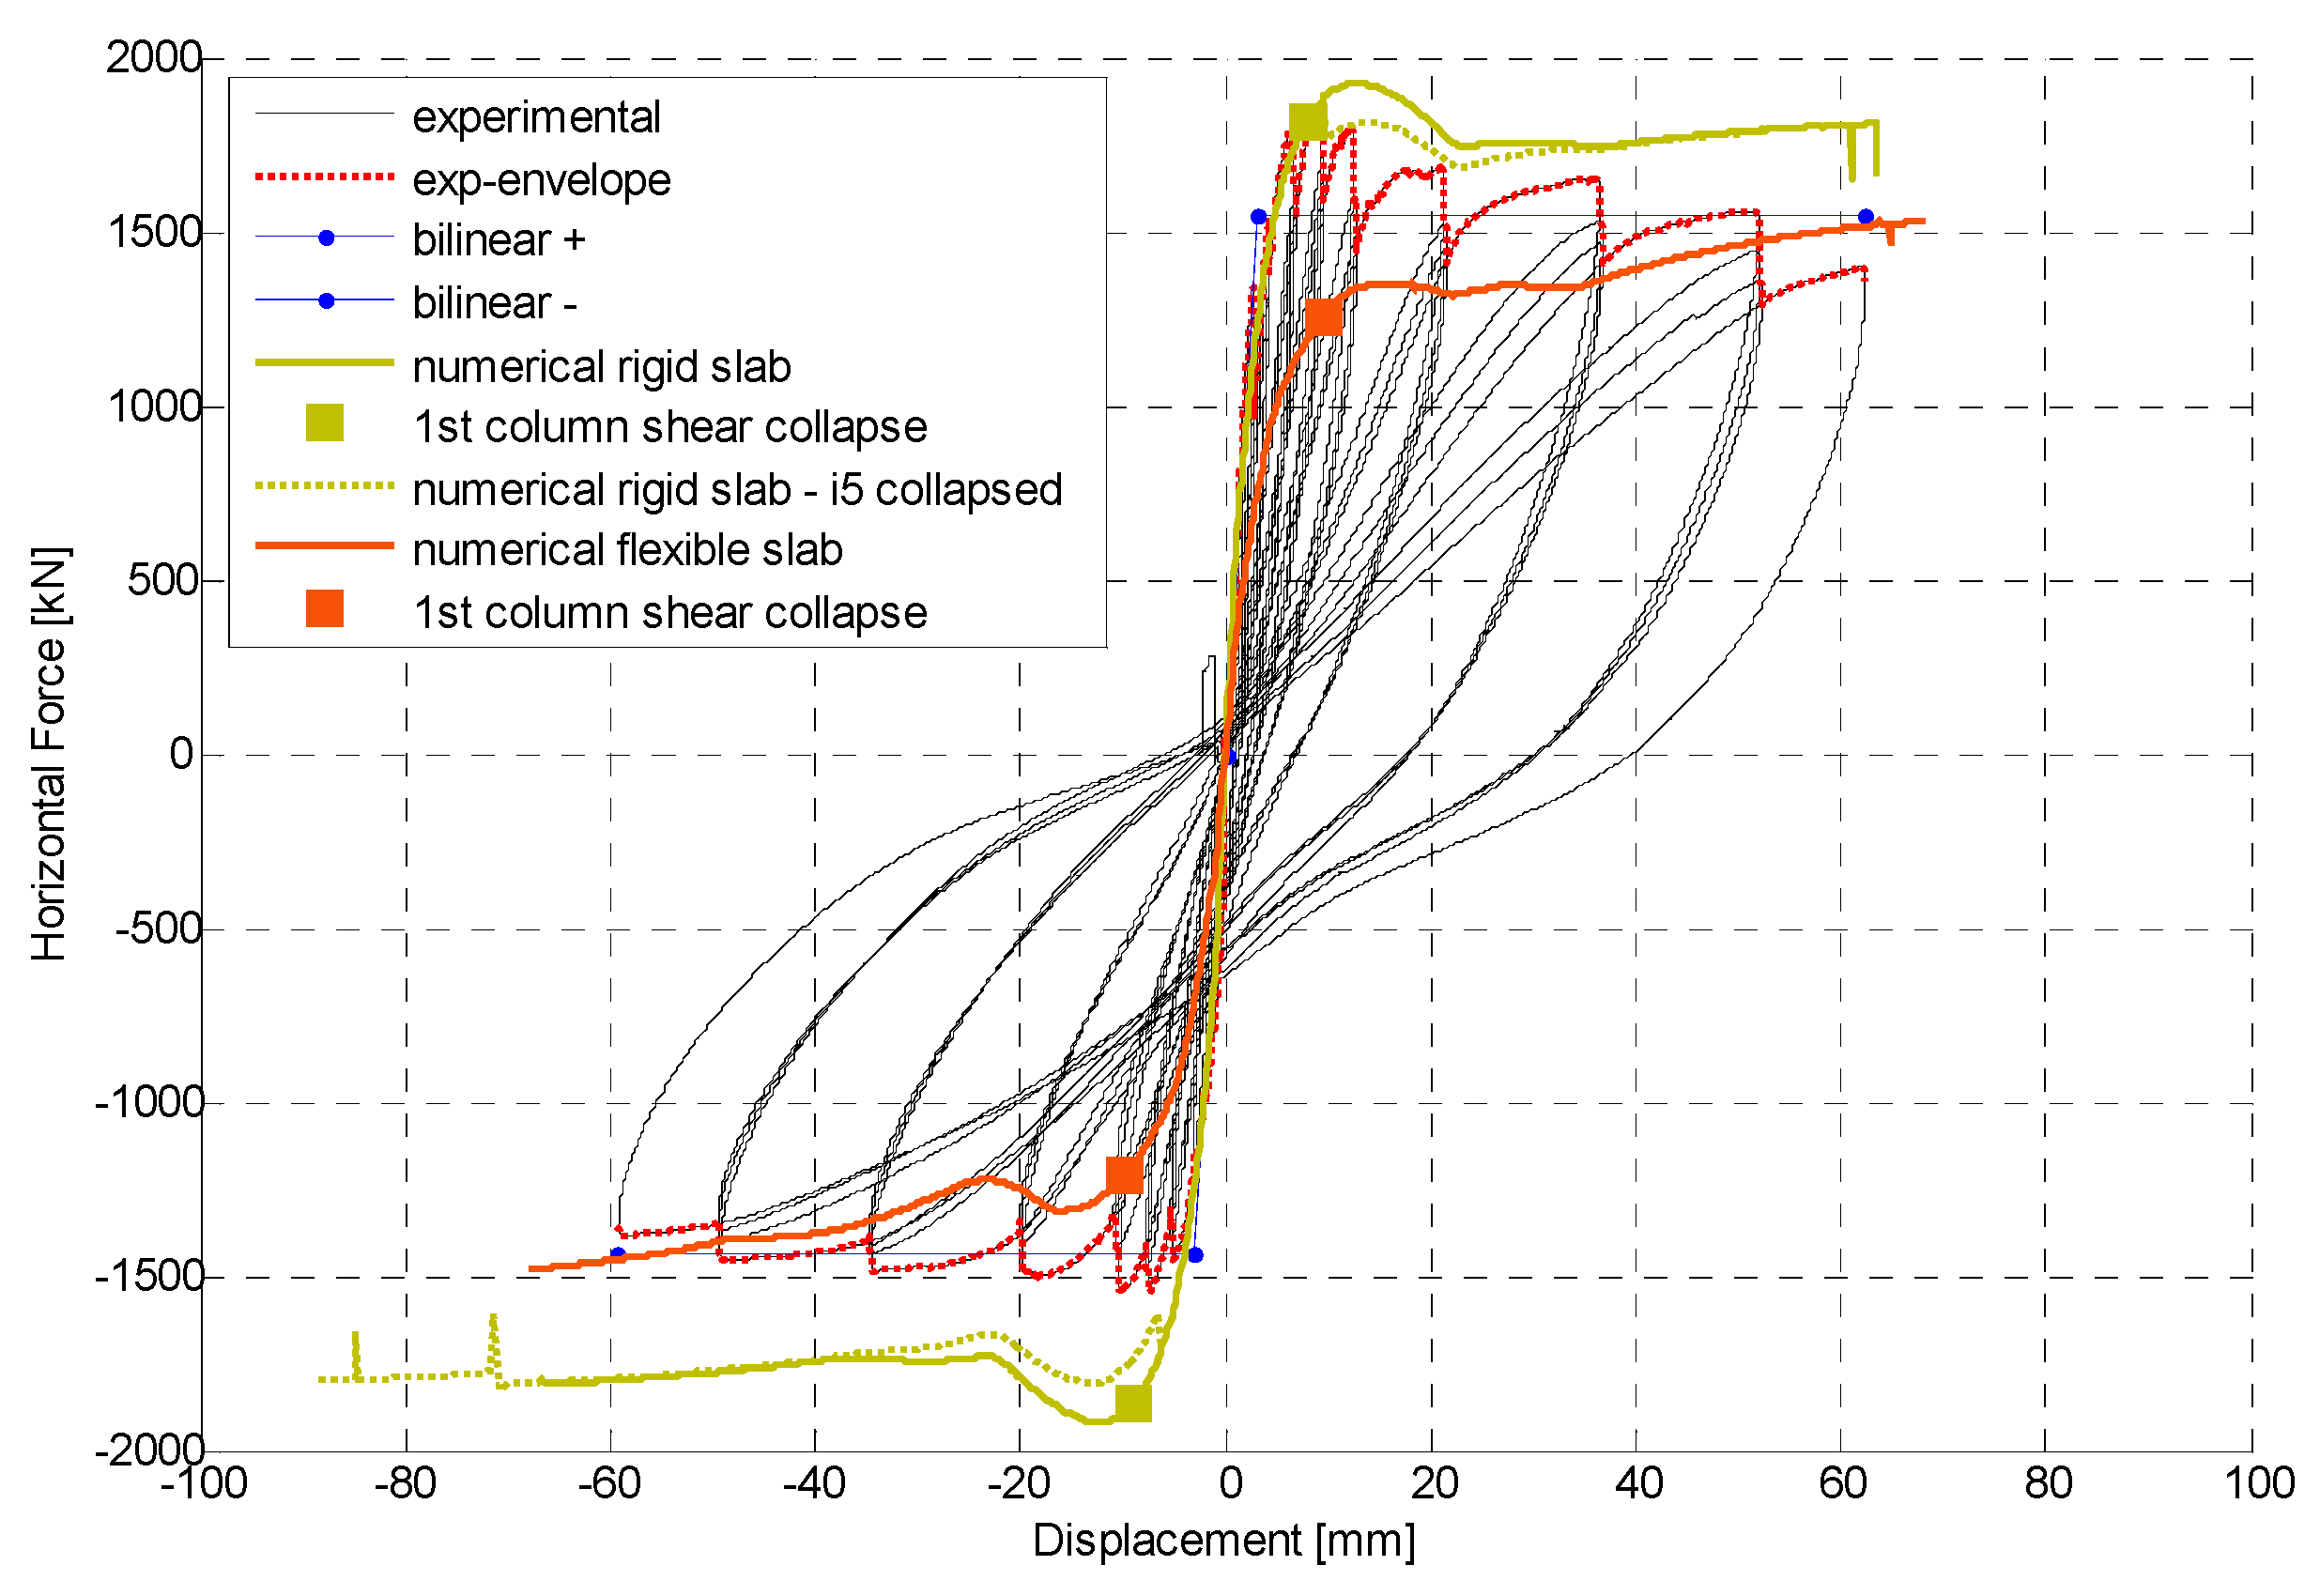
Figure 25 shows the comparison between the experimental skeleton curve the numerical capacity curves modeling infills, with and without the rigid slab assumption. The results of the numerical simulations are in fair agreement with the experimental response. The analytical curve closest to the actual behavior was the one modeling rigid slabs: The maximum base shear value was achieved at the infill break-down limit, and afterwards the base shear decreased until the full exhaustion of the infills’ resistance. Henceforth, the resistance was completely entrusted to the structural elements. It was noted that in the experimental curve there was a more pronounced decay in structural capacity, probably due to the shear failures and joints damage, which were not modeled within the software. Markers on the numerical capacity curves indicated when the first column reached its shear resistance, i.e., the displacement level after which modeling was less accurate.
For the sake of completeness, the same figure shows, as a dashed green line, the simulation considering the out of the plane collapse of infill i5 which happened when applying a few millimeters of displacement. Such a failure mode, sudden and very different from the other failed infills, was likely due to the bad connection of the infill itself, and could not be foreseen by modeling; thus, it was introduced after the experimental evidence.
Additionally,
Table 4 summarizes the numerical values of the base shear recorded during the test and the corresponding values of the upper- and lower-bound models, i.e., rigid and flexible slabs models, respectively. Together with the numerical values,
Table 4 reports the evaluated average errors, or average between the pulling and pushing directions of the discrepancies between the experimental recorded values and the corresponding numerical estimates. According to what in also depicted in
Figure 25, the first model featuring rigid slab (upper-bound model) better approximates the initial response, while the final portion of the experimental behavior is better estimated by the lower-bound model.
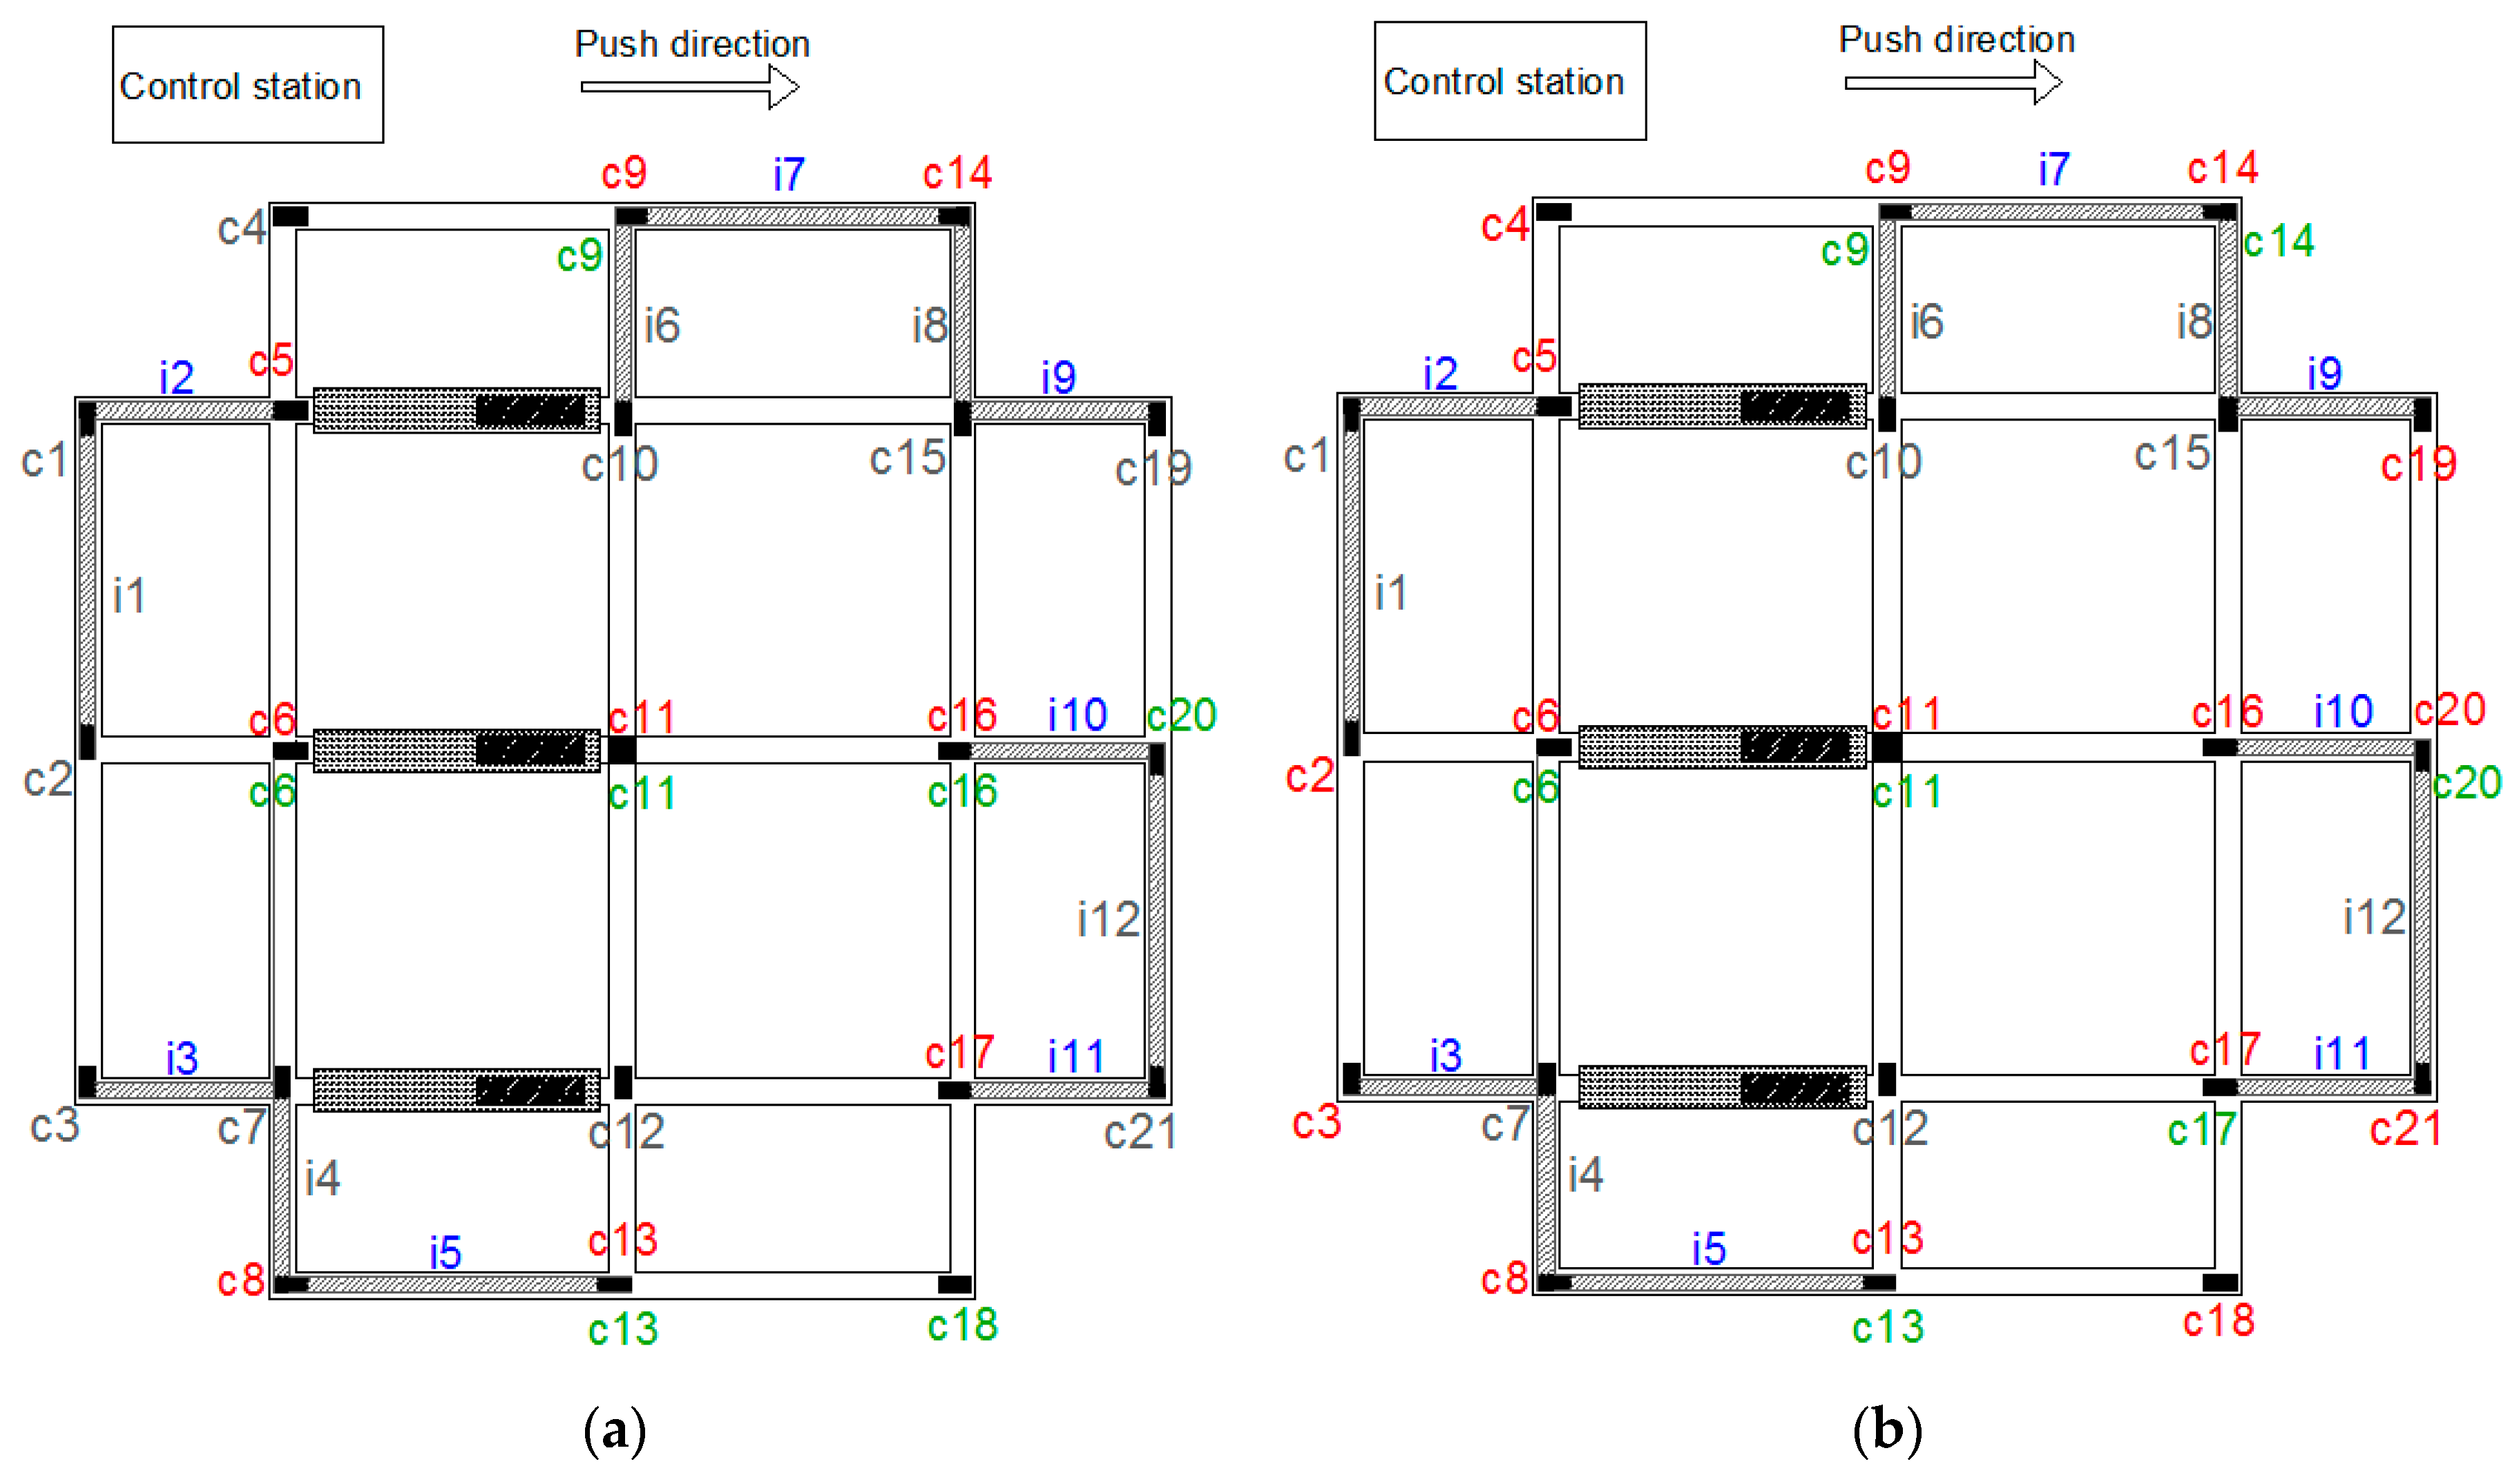
Figure 26 shows the comparison of elements failure modes between this last model (a) and the experimental results (b): Red and green colors indicate structural elements failing for flexure and shear, respectively, while collapsed infills are marked in blue. The shear failure, not modeled at the element level, has only been included in the software as a performance criterion (achievement of the resistance value calculated according to the DM 2018 [
25] using Φ5.5 stirrups).
In the numerical model, the first infill (i10) began damaging at about 6 mm. At a displacement of 23 mm, five infill panels (i2, i3, i9, i10, i11) were collapsed, while at 37 mm all the infill panels along the push direction failed, substantially confirming experimental results. Concerning structural frame elements, beams did not show any shear or flexural failure, while columns aligned to the test direction developed plastic hinges, except for columns c4 and c18 (external and in the single floor portions of the building). Most of them also reached their shear resistance. The columns perpendicular to the push direction did not reach their strength or deformation limit, except for the column c20 failing for shear. In addition, for structural elements, such results were in fair agreement with the experimental ones.
6. Conclusions
Large and full-scale tests on structures provided a precious chance to study the behavior of real buildings and to verify the reliability of analytical methods by comparing numerical predictions to experimental evidence. “Fully controlled conditions”, as for laboratory testing, allow for information to be gathered about all details and processes including design and construction phases, while, on the other hand, “real world conditions”, as per in situ tests, allow for the consideration of a number of effects (e.g., ageing, environmental exposure, wear, actual construction methods) neglected in the first case. The work presented in this paper dealt with data deriving from this latter kind of tests. This type of experimental data is highly needed in literature since the opportunities to work on real structures are quite rare but the possibility to push them deep in the non-linear range is even rarer, mainly because of cost restraints and limited availability of specimens. The numerous and valuable data produced through the experimental work and analyzed in this paper allowed for the observation of a number of evidences, including the damage evolution pattern due to the effects of cyclic loading, the structural softening after reaching the maximum strength, and the collapse mode inferable from the failure pattern triggering.
The present work was carried out with the aim of studying the seismic response of existing constructions designed for vertical loads only according to past Italian regulations, in a region with important seismic hazard. For this purpose, a two-story reinforced concrete building located in the province of Messina (Sicily, Italy) was chosen as representative of a typical building class, featuring an evident “strong beams–weak column” design approach. The design of the test and of the setup was based on the geometric and instrumental surveys on the structure and on the information gathered from the original design documents of the building. The force demand was simulated running pushover analyses on different numerical models considering uncertain aspects of the structural behavior such as rigid/deformable slabs and contribution of the infills. As already highlighted, one partial limitation possibly jeopardizing the modeling of real structures was the limited knowledge about the structure itself (e.g., structural detailing and construction processes). Nevertheless, this limit is actually affecting the evaluation of the existing buildings in the everyday practice. It appears to be therefore crucial to understand how accurately a model could predict the seismic behavior of a structure despite the lacking information.
Comparison between the experimental results and the outcomes of the numerical simulations showed that the model with rigid slabs and infills best approximated the real behavior of the tested structure. The contribution of the slabs and infills to the initial stiffness of the structure was important, notwithstanding the slabs showing visible signs of degradation and poor connection between the infills and the RC frame. The elastic part of the numerical curve was in very good agreement with the experimental results, and the damage distribution and sequence were quite comparable. Besides, it appeared that few and wise modeling hypotheses could be sufficient to bind the force-displacement estimate in a quite narrow range.
At the end of the tests, all the infills undergoing in plane deformation (already heavily damaged by the cycles at smaller amplitudes) collapsed completely, while the transverse partitions reported modest damages. The columns aligned along the push direction, attracting larger forces, showed flexural/shear cracks with concrete cover spalling, yielding, and instability of the reinforcement bars at the base and at the top of the element. The columns with strong axes perpendicular to the test direction, featuring larger deformability, reported minor damages. Some of the perimeter beam-to-column joints, being not fully confined, developed shear cracks. According to the principles of strength hierarchy, beams did not report significant damages. The experimental response confirmed the simulated results and the expected typical damages of “strong beam–weak column” structures subjected to horizontal load patterns.


