Experimental Data and Simulations of Performance and Thermal Comfort in a Patient Room Equipped with Radiant Ceiling Panels

 , , ,
, , ,
Abstract
:1. Introduction
1.1. Hydronic Heating Systems
1.2. Hydronic Radiant Systems
2. Methodology
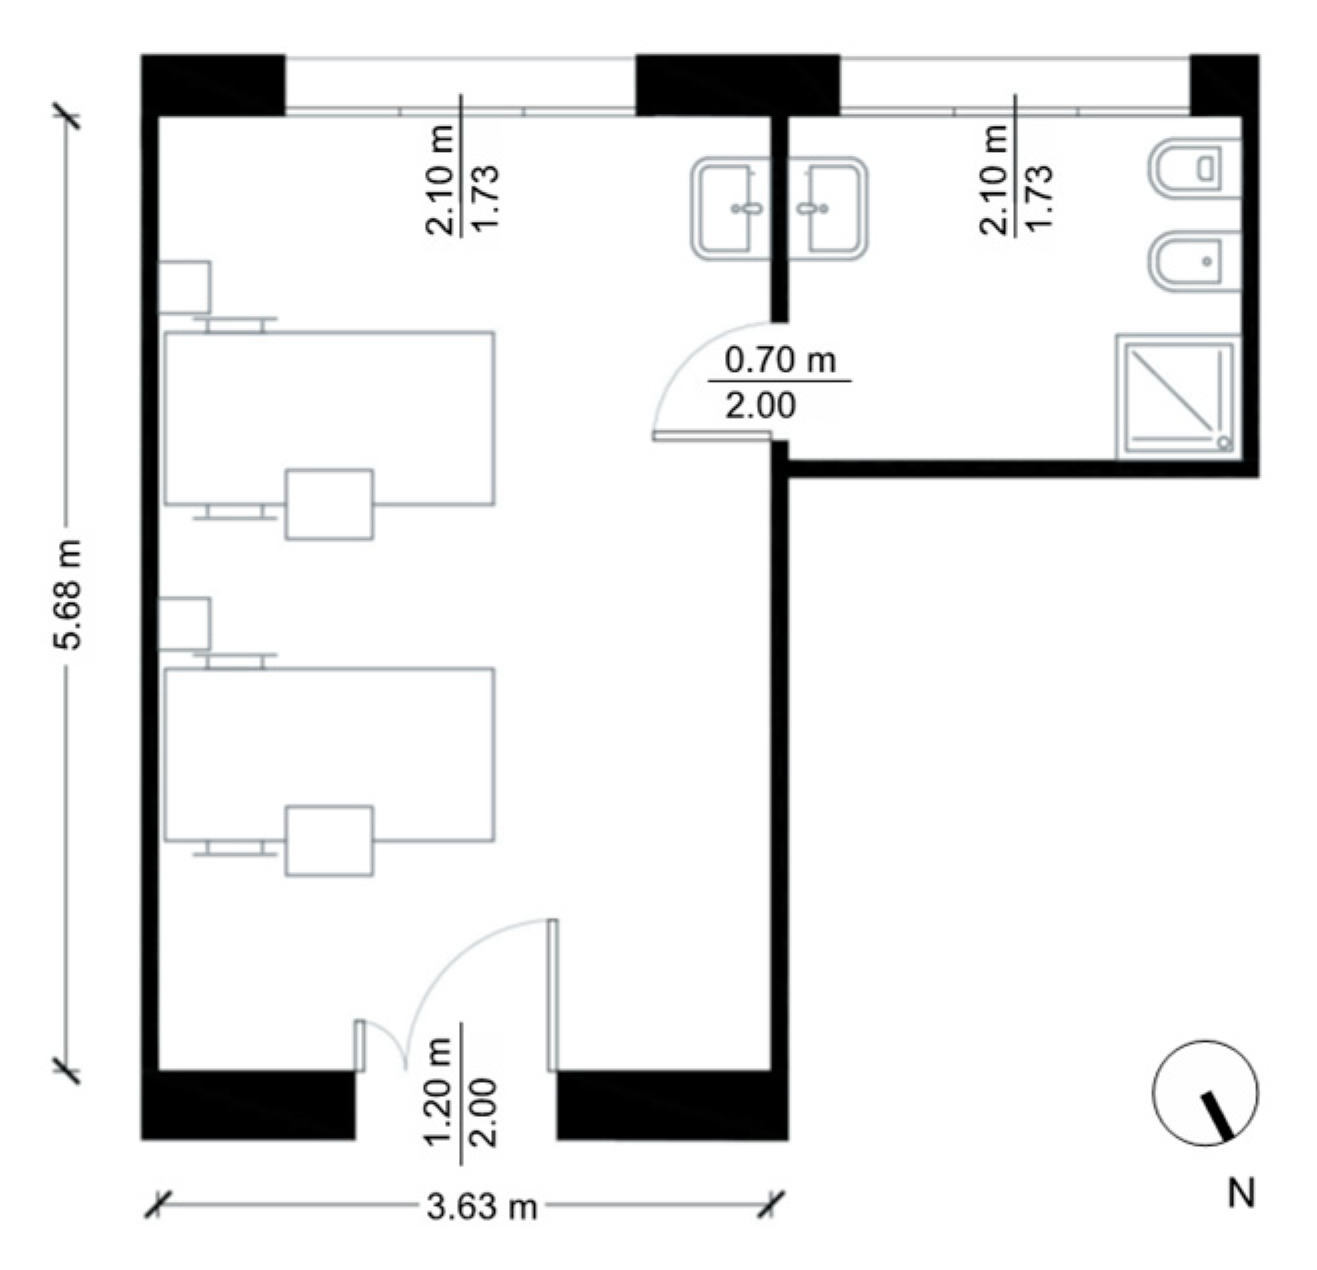
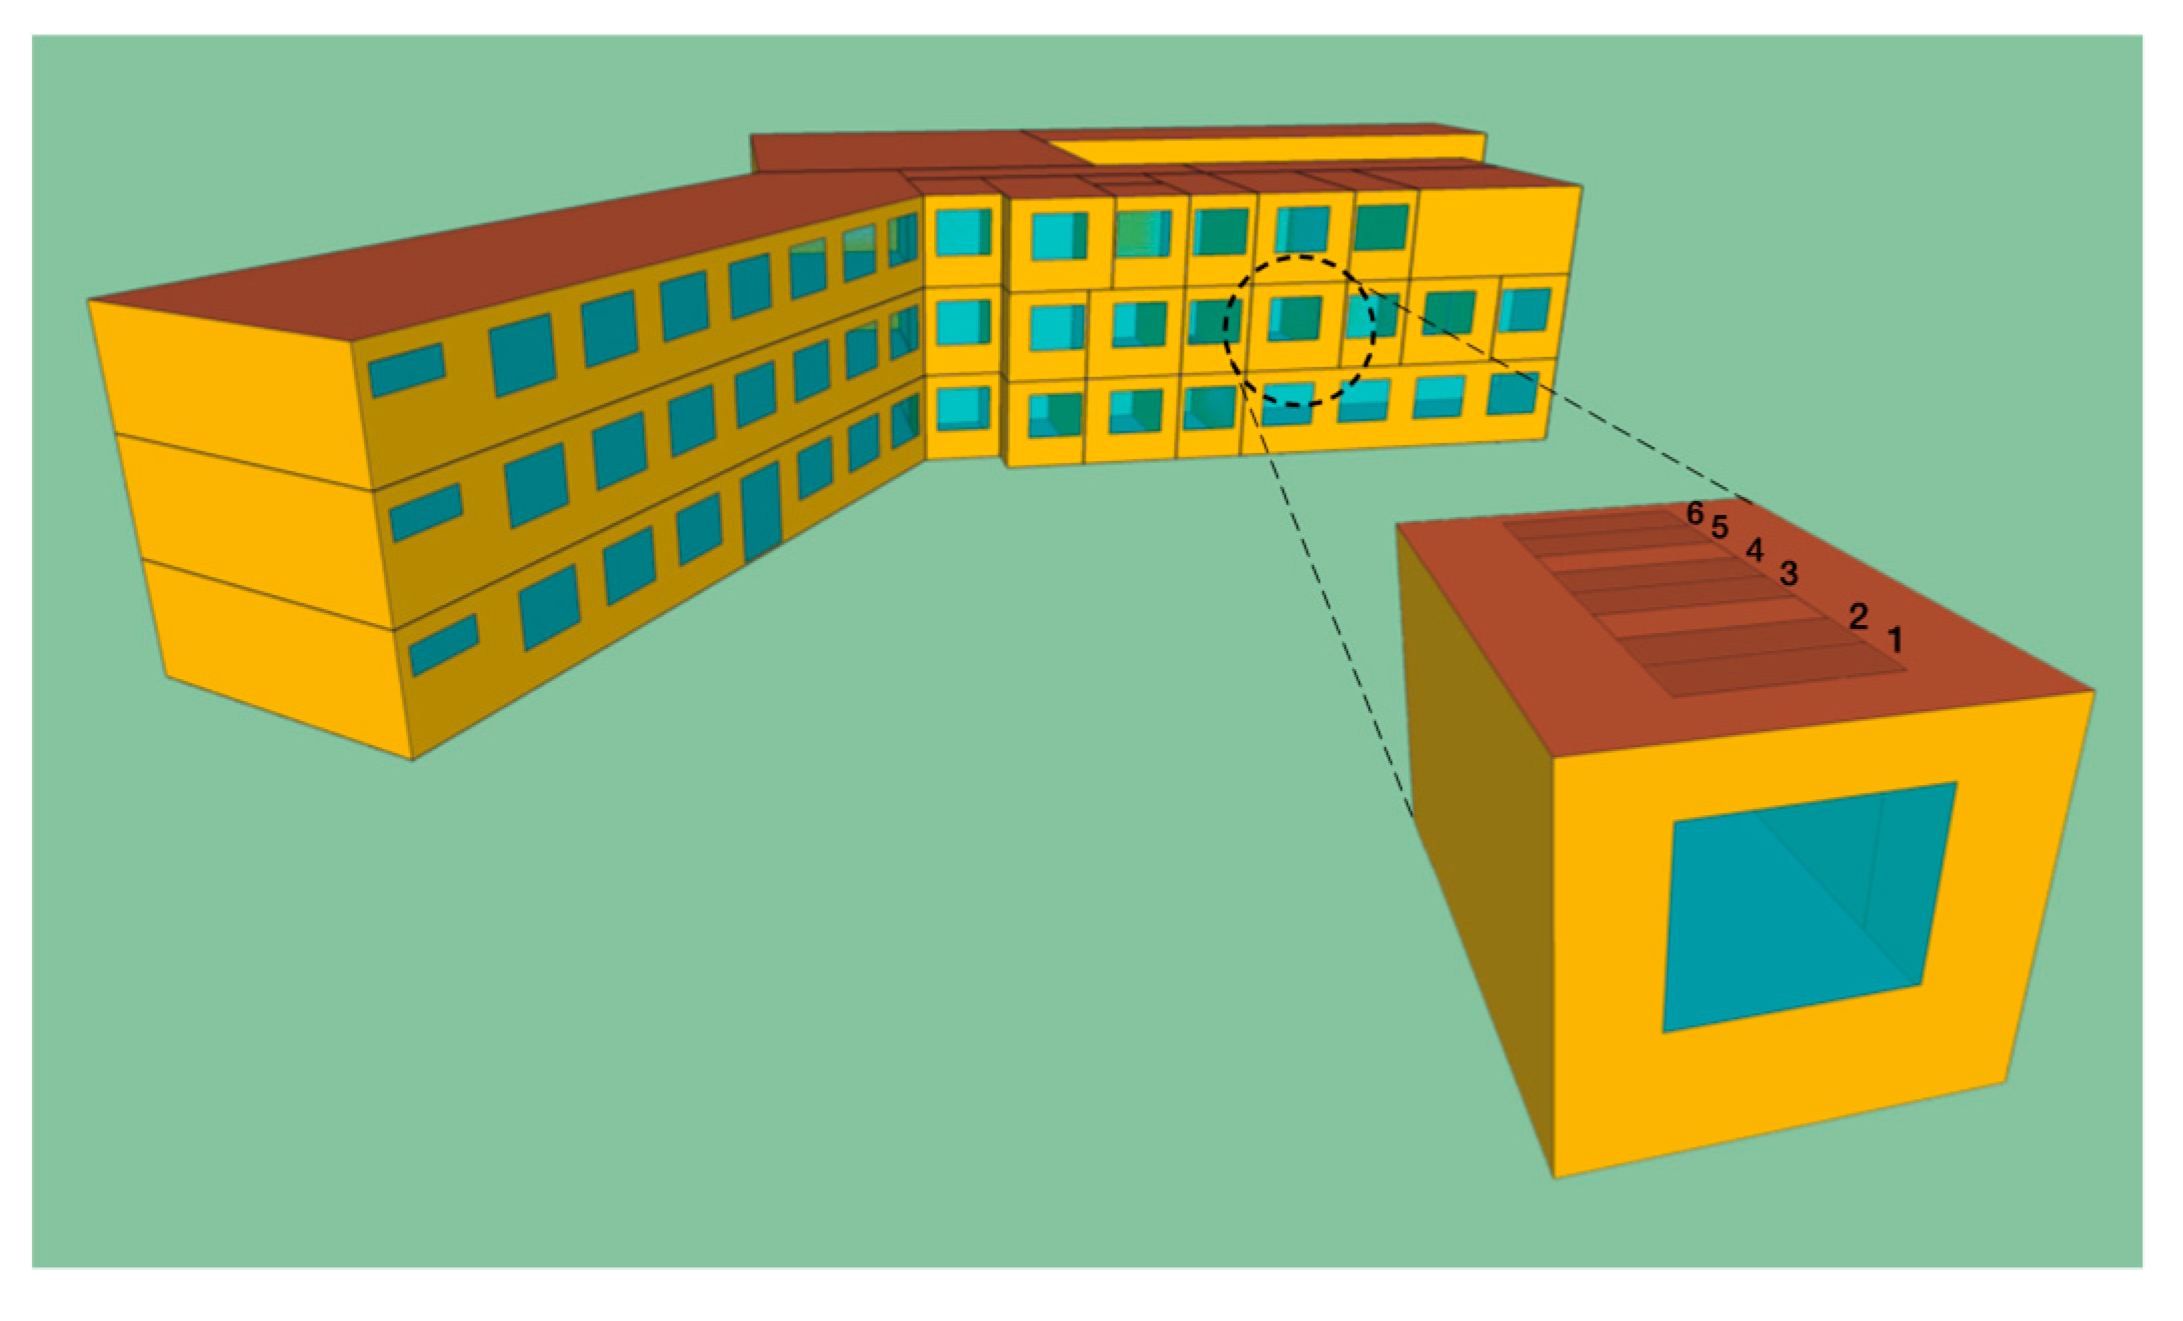
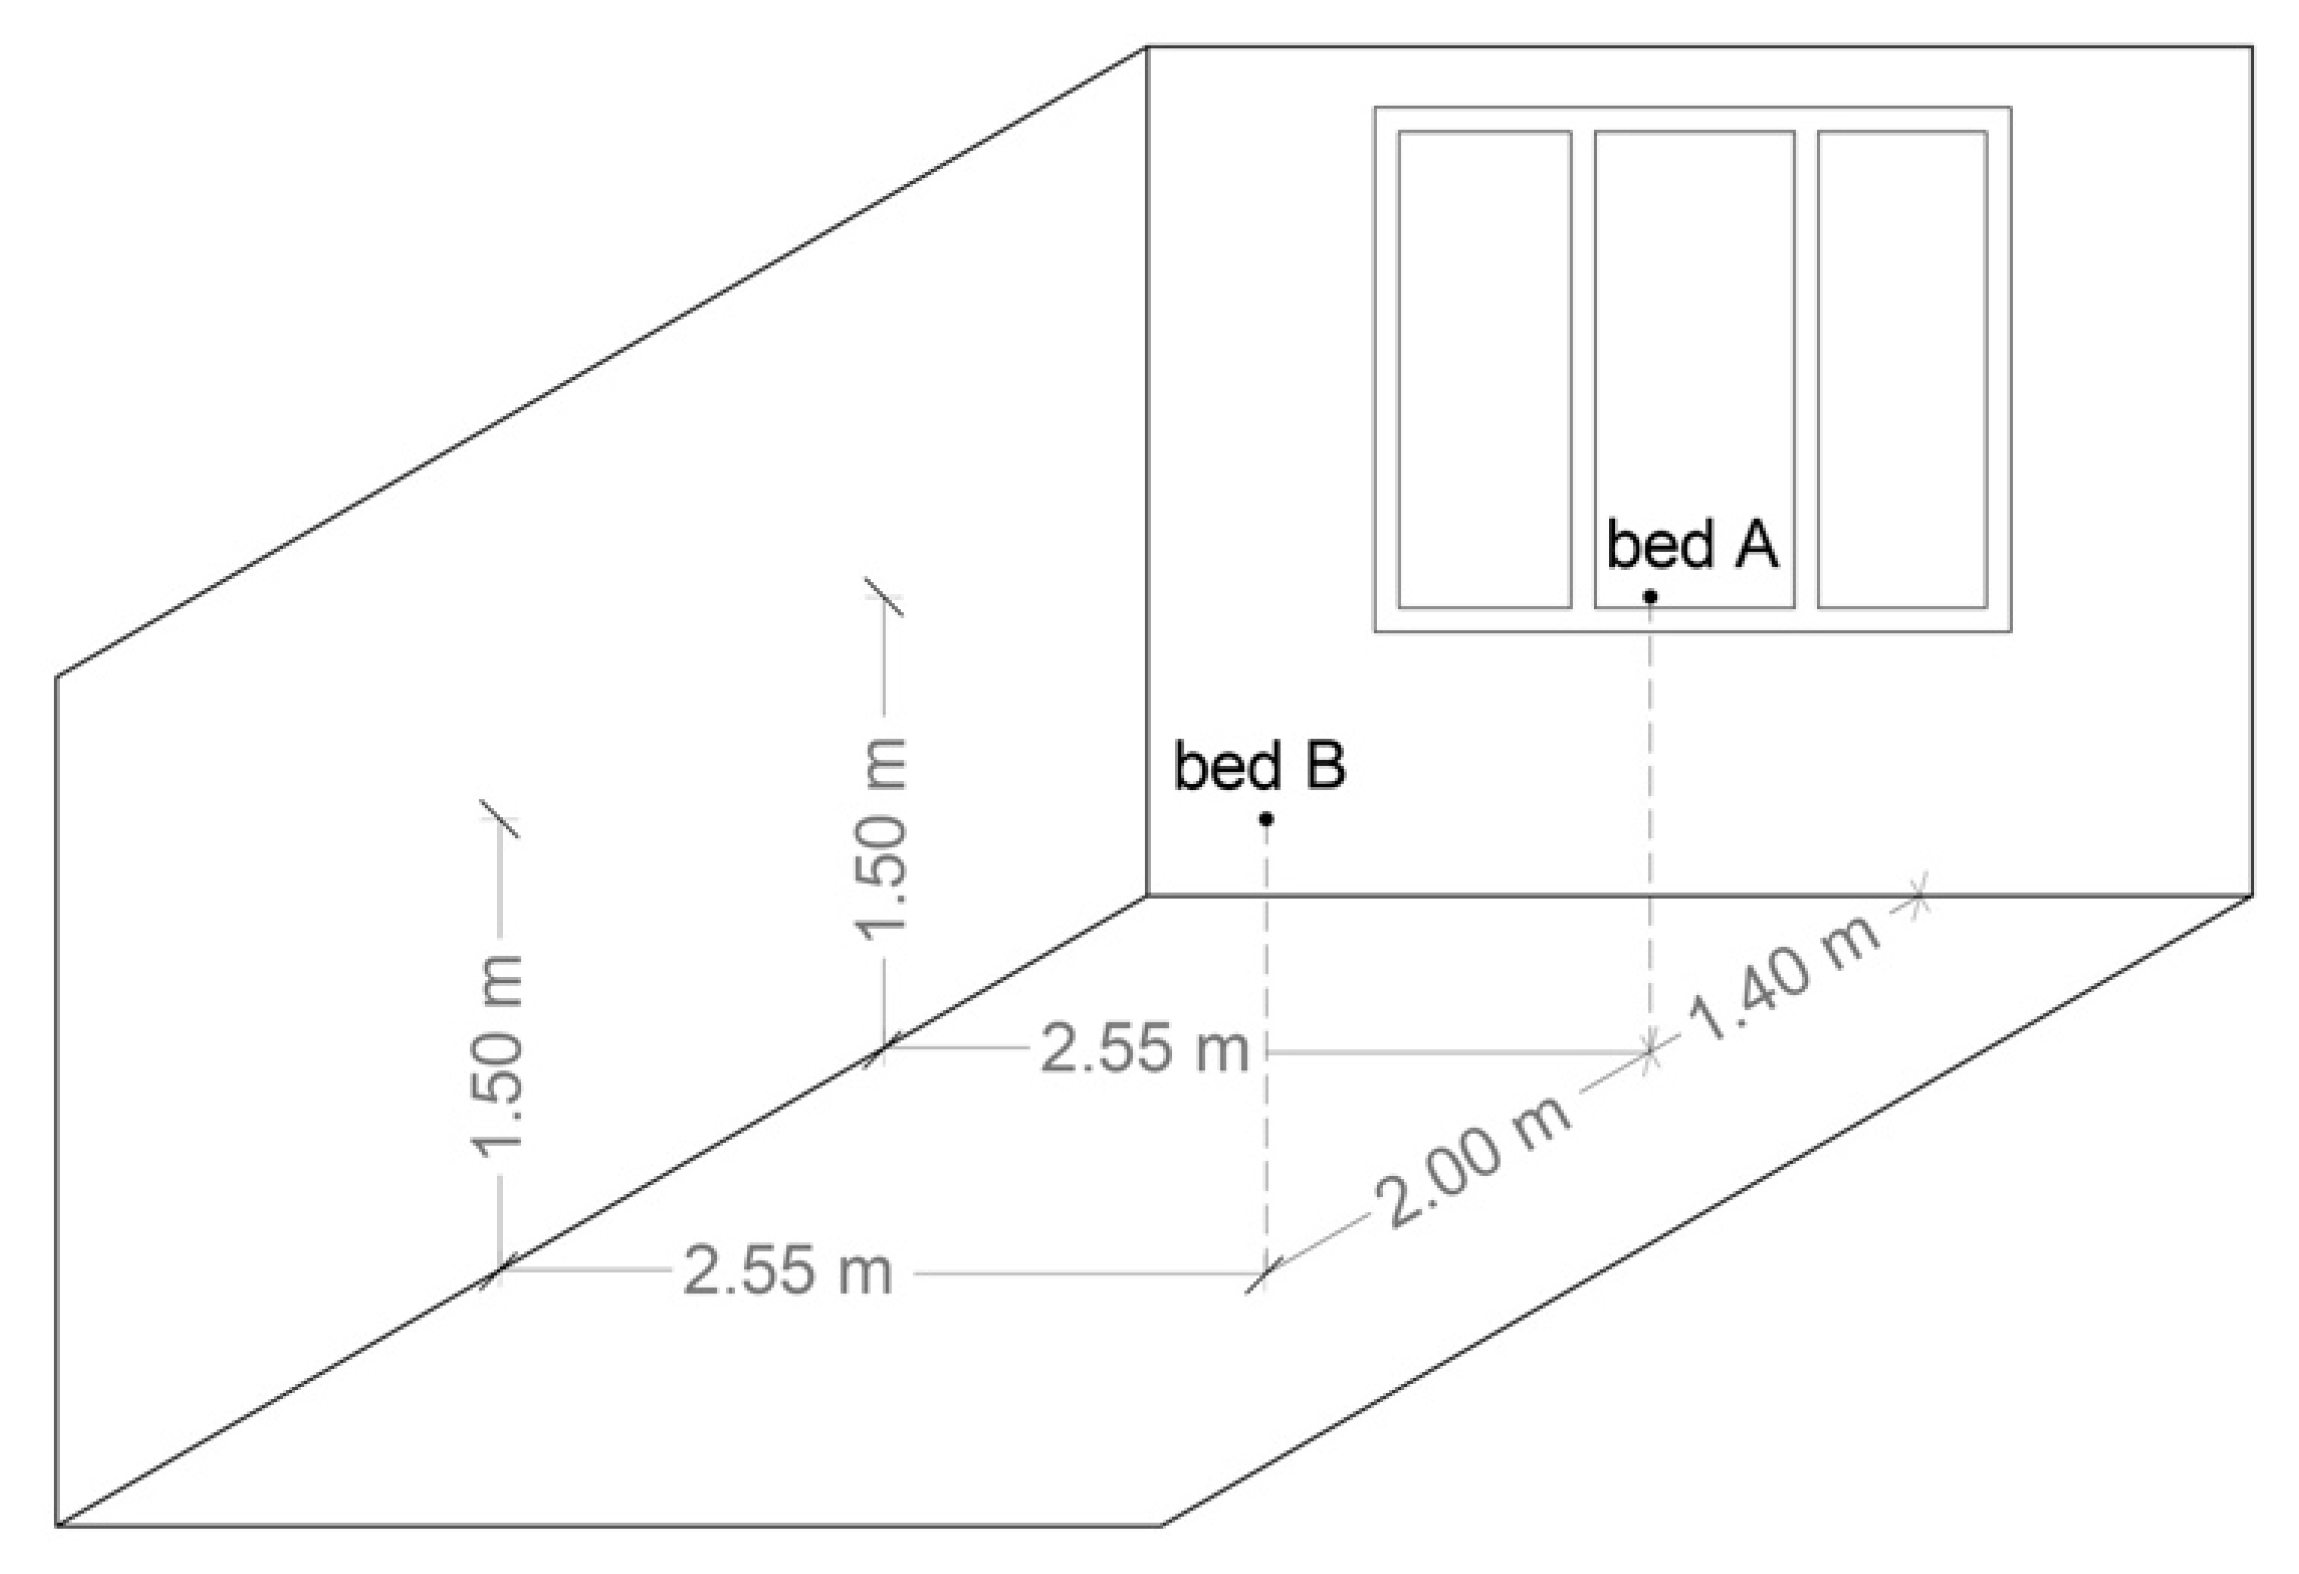
2.1. Description of the Case Study Analysed
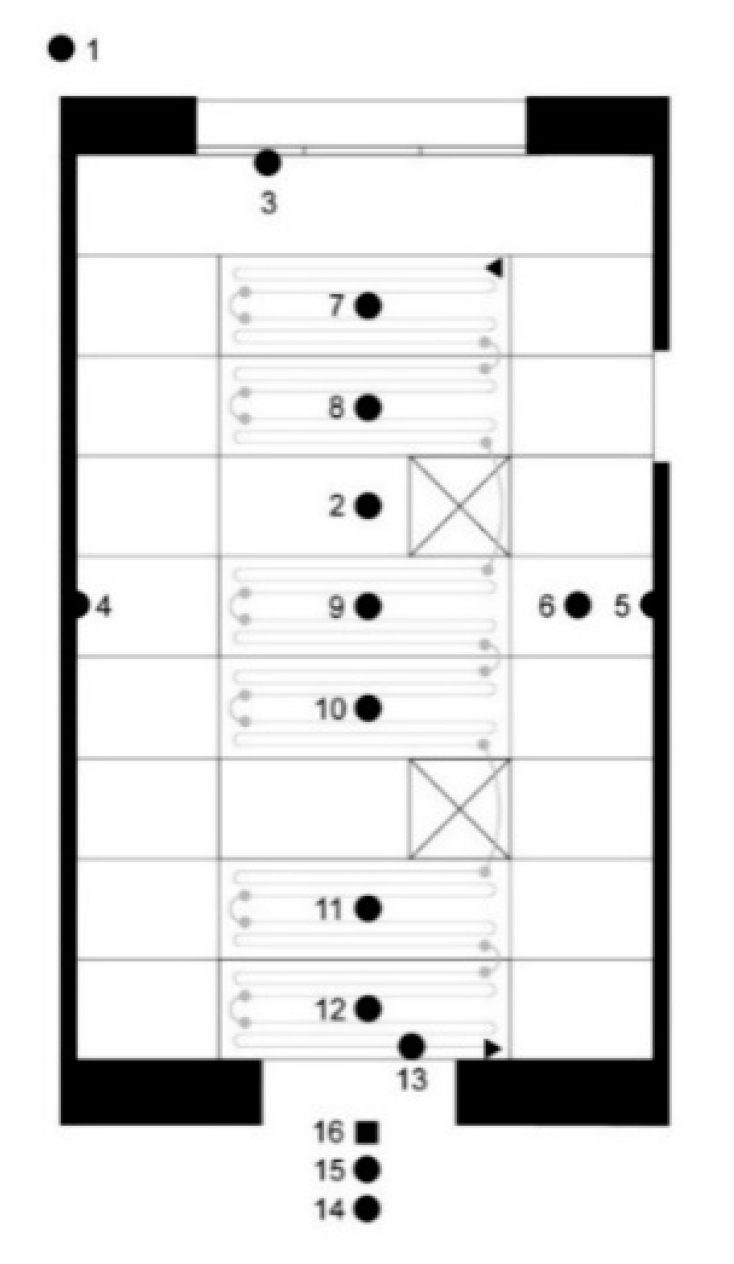
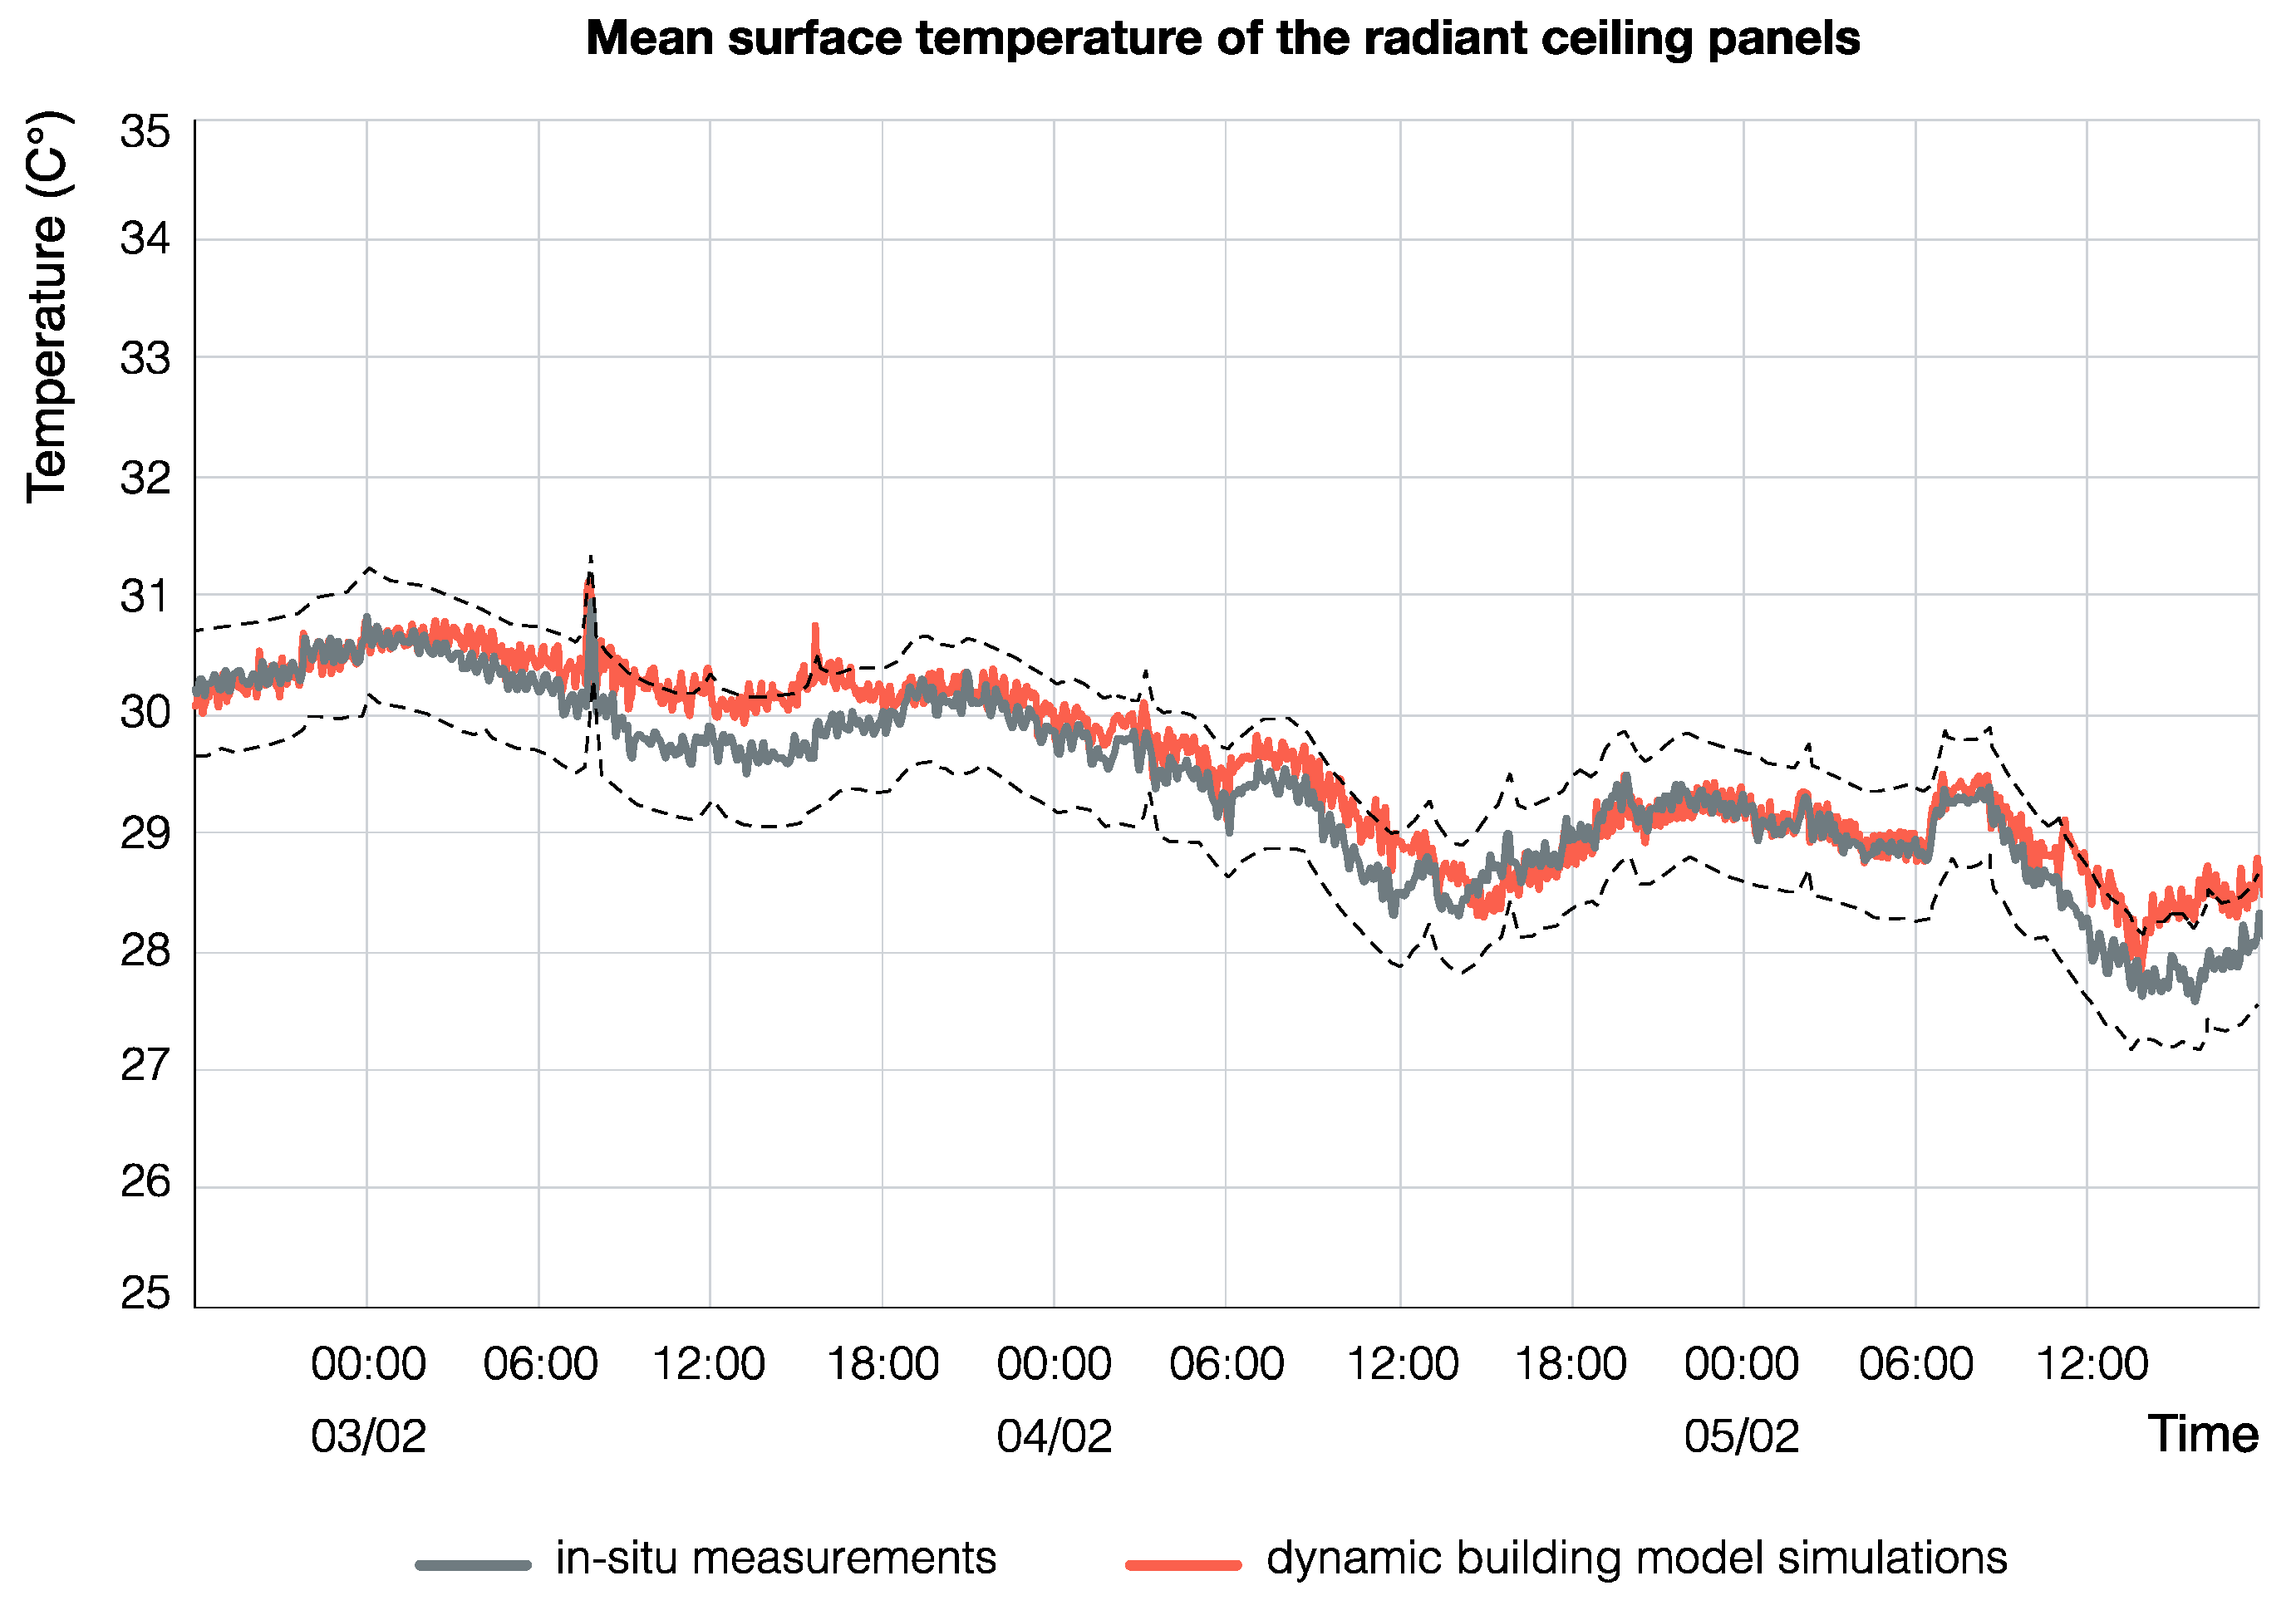
2.2. Monitoring
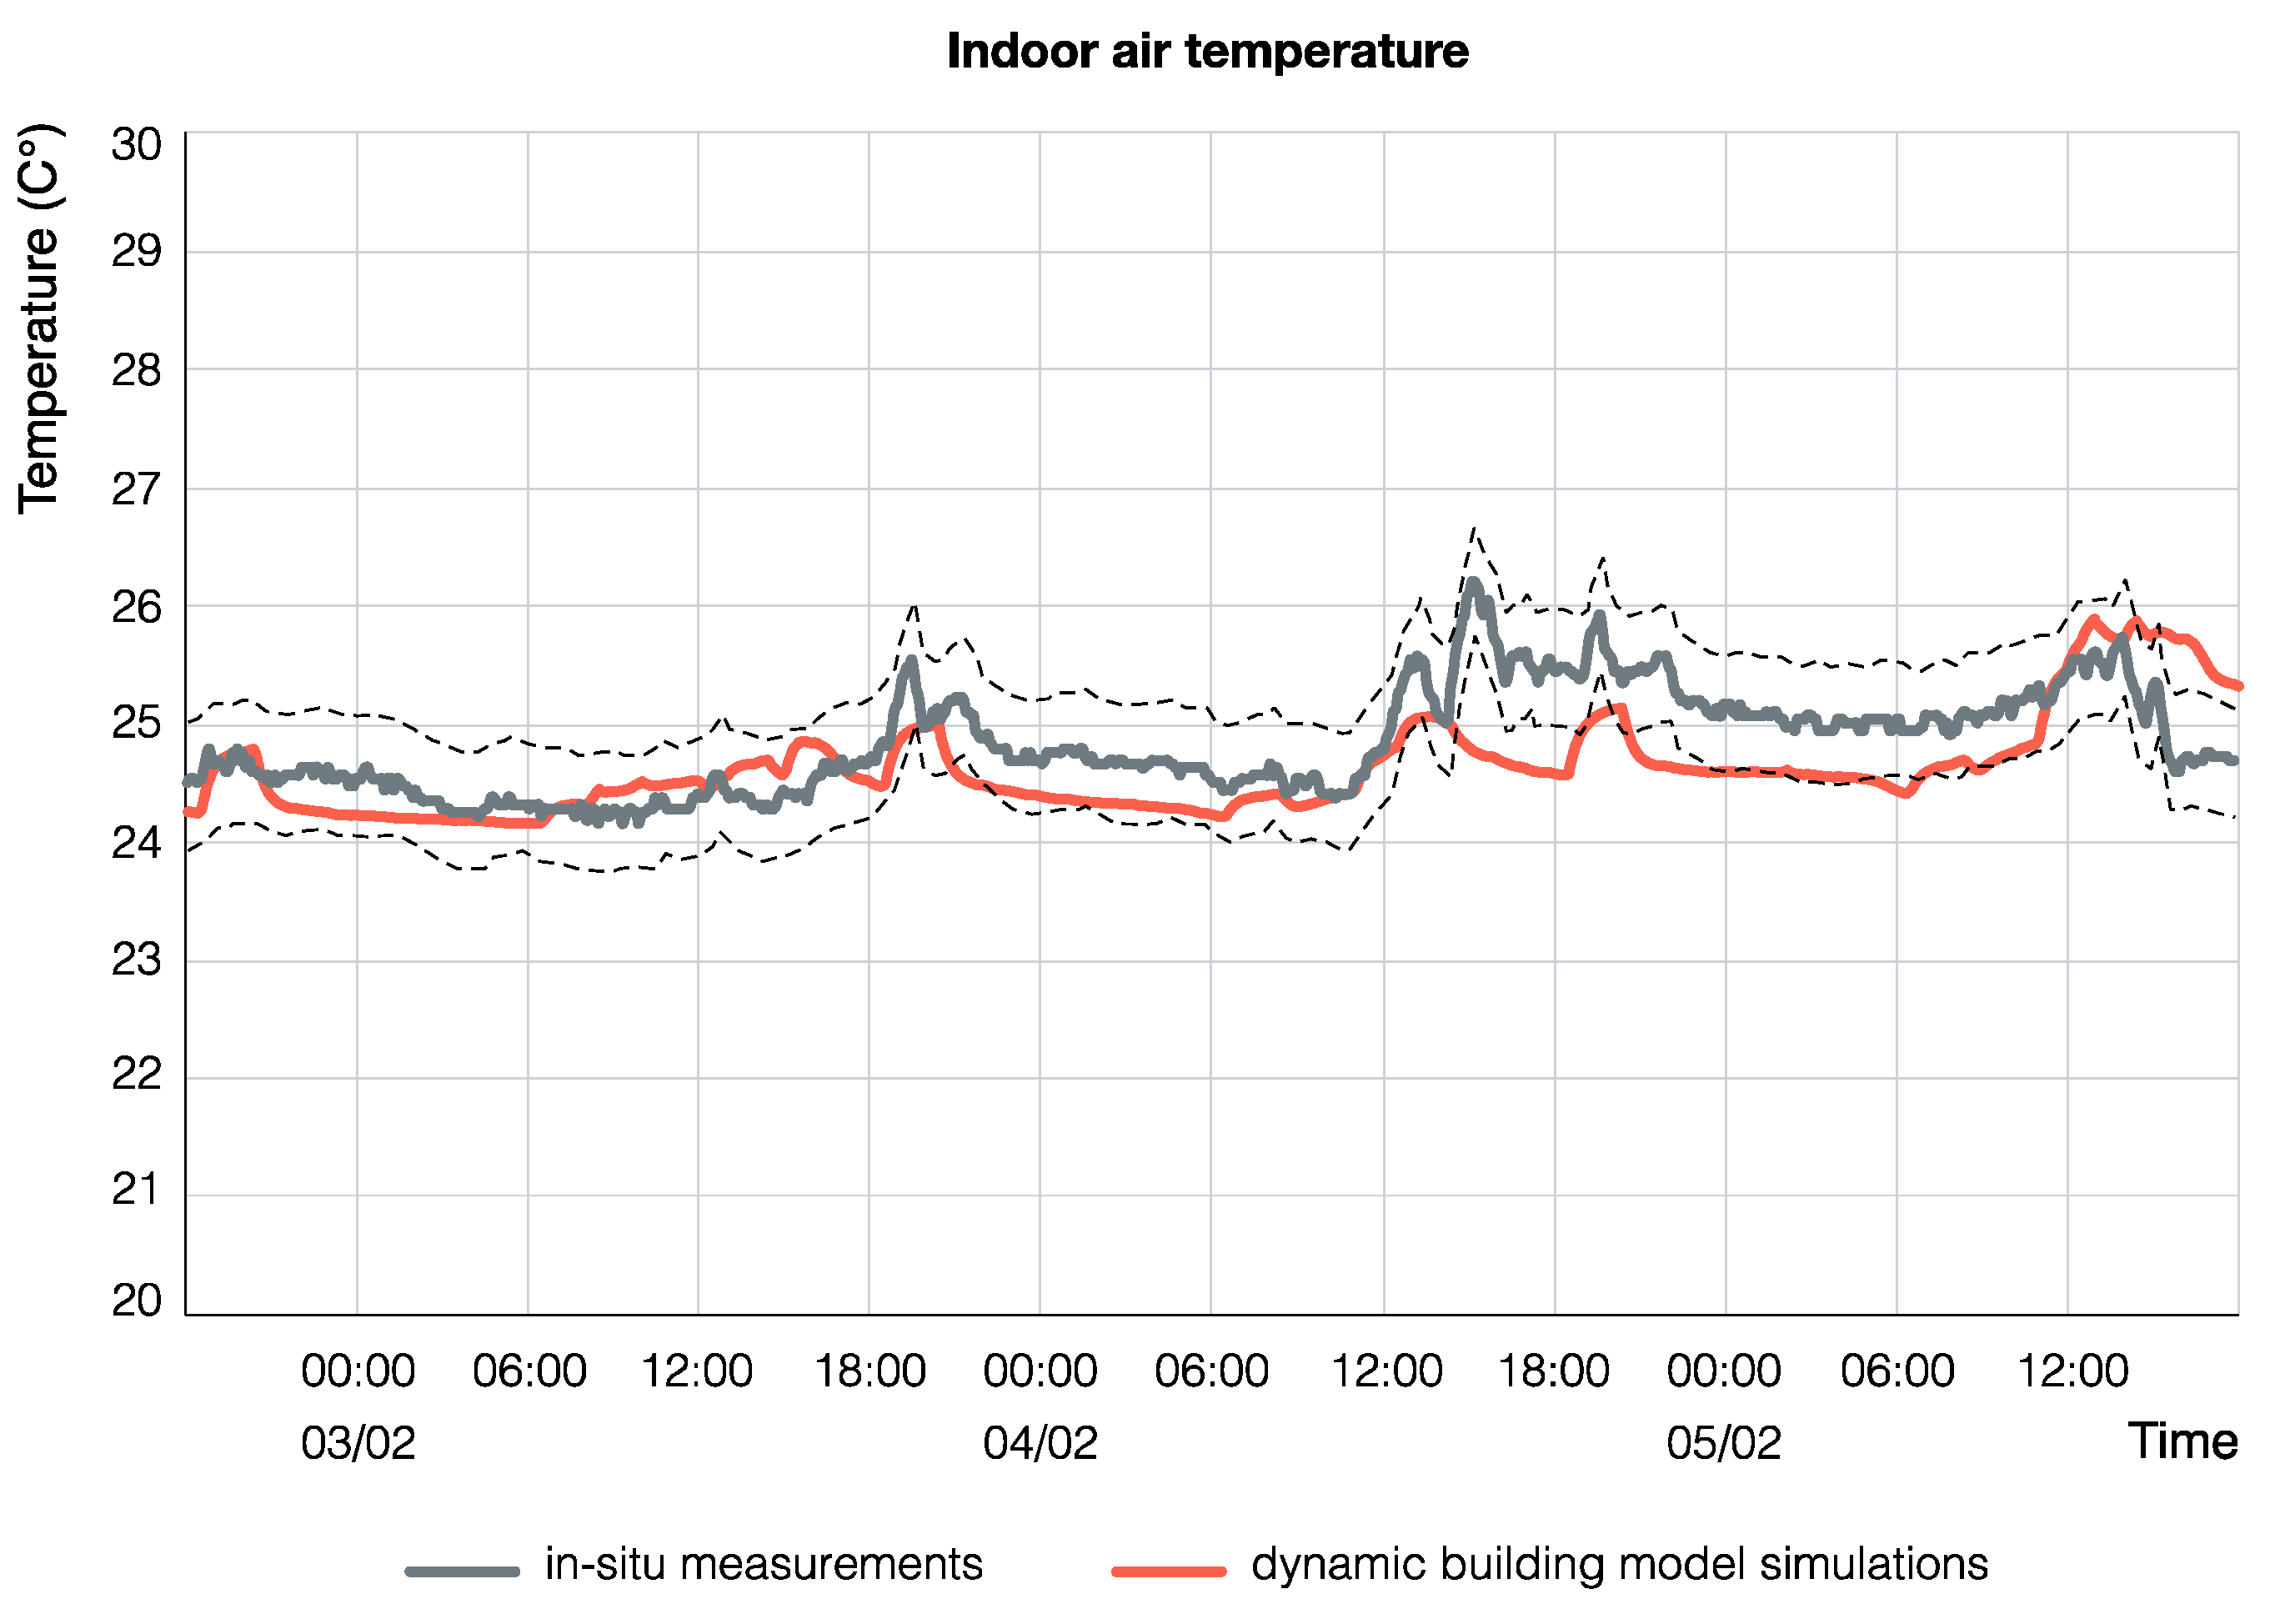
2.3. Calibration of the Building Simulation Model
2.4. Dynamic Building Energy Simulations
3. Results
4. Discussion and Conclusions
Author Contributions
Funding
Conflicts of Interest
References
- Buildings Performance Institute Europe (BPIE). Europe’s Buildings under the Microscope. A Country-by-Country Review of the Energy Performance of Buildings; Buildings Performance Institute Europe: Brussels, Belgium, 2011. [Google Scholar]
- Eckelman, M.J.; Sherman, J. Environmental impacts of the U.S. health care system and effects on public health. PLoS ONE 2016, 11, e0157014. [Google Scholar] [CrossRef] [PubMed] [Green Version]
- National Health Service (NHS) Sustainable Development Unit. Sustainable Development Strategy for the NHS, Public Health and Social Care System 2014–2020; Sustainable Development Unit: Cambridge, UK, 2014; Available online: https://www.sduhealth.org.uk/policy-strategy/engagement-resources.aspx (accessed on 16 November 2020).
- Pichler, P.P.; Jaccard, I.S.; Weisz, U.; Weisz, H. International comparison of health care carbon footprints. Environ. Res. Lett. 2019, 14, 064004. [Google Scholar] [CrossRef] [Green Version]
- Papadopoulos, A.M. Energy Efficiency in Hospitals: Historical Development, Trends and Perspectives. In Energy Performance of Buildings; Boemi, S.N., Irulegi, O., Santamouris, M., Eds.; Springer: Cham, Switzerland, 2016; pp. 217–234. [Google Scholar]
- Prada, M.; Prada, I.F.; Cristea, M.; Popescu, D.E.; Bungău, C.; Aleya, L.; Bungău, C.C. New solutions to reduce greenhouse gas emissions through energy efficiency of buildings of special importance—Hospitals. Sci. Total Environ. 2020, 718, 137446. [Google Scholar] [CrossRef]
- Cesari, S.; Valdiserri, P.; Coccagna, M.; Mazzacane, S. The energy saving potential of wide windows in hospital patient rooms, optimizing the type of glazing and lighting control strategy under different climatic conditions. Energies 2020, 13, 2116. [Google Scholar] [CrossRef]
- Cesari, S.; Valdiserri, P.; Coccagna, M.; Mazzacane, S. Energy savings in hospital patient rooms: The role of windows size and glazing properties. Energy Procedia 2018, 148, 1151–1158. [Google Scholar] [CrossRef]
- Department of Health. Sustainability in Healthcare. Victoria Department of Health. 2012. Available online: https://www2.health.vic.gov.au/hospitals-and-health-services/planning-infrastructure/sustainability (accessed on 10 October 2020).
- Kapoor, R.; Kumar, S. Energy Efficiency in Hospitals: Best Practice Guide; USAID, ECO-III Project; International Resource Group: Delhi, India, 2011. [Google Scholar]
- Thinate, N.; Wongsapai, W.; Damrongsak, D. Energy performance study in Thailand hospital building. Energy Procedia 2017, 141, 255–259. [Google Scholar] [CrossRef]
- Verheyen, J.; Theys, N.; Allonsius, L.; Descamps, F. Thermal comfort of patients: Objective and subjective measurements in patient rooms of a Belgian healthcare facility. Build. Environ. 2011, 46, 1195–1204. [Google Scholar] [CrossRef]
- Maroni, M. (Ed.) Ventilation and Indoor Air Quality in Hospitals; Springer: Dordrecht, The Netherlands, 1996. [Google Scholar]
- Buonomano, A.; Calise, F.; Ferruzzi, G.; Palombo, A. Dynamic energy performance analysis: Case study for energy efficiency retrofits of hospital buildings. Energy 2014, 78, 555–572. [Google Scholar] [CrossRef]
- Hashiguschi, N.; Hirakawa, M.; Tochihara, Y.; Kaji, Y.; Karaki, C. Effects of setting up of humidifiers on thermal conditions and subjective responses of patients and staff in a hospital during winter. Appl. Ergon. 2008, 39, 158–165. [Google Scholar] [CrossRef]
- Hashiguschi, N.; Hirakawa, M.; Tochihara, Y.; Kaji, Y.; Karaki, C. Thermal environment and subjective responses of patients and staff in a hospital during winter. J. Physiol. Anthropol. Appl. Hum. Sci. 2005, 24, 111–115. [Google Scholar] [CrossRef] [Green Version]
- Skoog, J.; Johansson, A. Indoor Environment in Hospital Wards—Requirements on Thermal Climate, Air Quality, Light and Color; Chalmers University of Technology: Gothenburg, Sweden, 2002. [Google Scholar]
- Nordstrom, K.; Norbäck, D.; Akselsson, R. Subjective indoor air quality in hospitals—The influence of building age, ventilation flow, and personal factors. Indoor Built Environ. 1995, 4, 37–44. [Google Scholar] [CrossRef]
- Skoog, J. Relative air humidity in hospital wards - User perception and technical consequences. Indoor Built Environ. 2006, 15, 93–97. [Google Scholar] [CrossRef]
- Skoog, J.; Fransson, N.; Jagemar, L. Thermal environment in Swedish hospitals: Summer and winter measurements. Energy Build. 2005, 37, 872–877. [Google Scholar] [CrossRef]
- Ozyogurtcu, G.; Mobedi, M.; Ozerdem, B. Economical assessment of different HVAC systems for an operating room: Case study for different Turkish climate regions. Energy Build. 2011, 43, 1536–1543. [Google Scholar] [CrossRef] [Green Version]
- Balaras, C.A.; Dascalaki, E.; Gaglia, A. HVAC and indoor thermal conditions in hospital operating rooms. Energy Build. 2007, 39, 454–470. [Google Scholar] [CrossRef]
- Liu, C.; Zhou, G.; Li, H. Analysis of thermal environment in a hospital operating room. Energy Build. 2015, 121, 735–742. [Google Scholar] [CrossRef] [Green Version]
- Nastase, I.; Croitoru, C.; Vartires, A.; Tataranu, L. Indoor environmental quality in operating rooms: An European standards review with regard to Romanian guidelines. Energy Procedia 2016, 85, 375–382. [Google Scholar] [CrossRef] [Green Version]
- Dascalaki, E.G.; Gaglia, A.G.; Balaras, C.A.; Lagoudi, A. Indoor environmental quality in Hellenic hospital operating rooms. Energy Build. 2009, 41, 551–560. [Google Scholar] [CrossRef]
- Nastase, I.; Croitoru, C.; Dan, M.; Ursu, I.; Meslem, A. Experimental study for the integration of an innovative air distribution system in operating rooms. Energy Procedia 2017, 112, 613–620. [Google Scholar] [CrossRef]
- Lee, S.T.; Liang, C.C.; Chien, T.Y.; Wu, F.J.; Fan, K.C.; Wan, G.H. Effect of ventilation rate on air cleanliness and energy consumption in operation rooms at rest. Environ. Monit. Assess. 2018, 190, 178. [Google Scholar] [CrossRef]
- Christiansen, N.; Kaltschmitt, M.; Dzukowski, F.; Isensee, F. Electricity consumption of medical plug loads in hospital laboratories: Identification, evaluation, prediction and verification. Energy Build. 2015, 107, 392–406. [Google Scholar] [CrossRef]
- Adamu, Z.A.; Price, A.D.F.; Cook, M.J. Performance evaluation of natural ventilation strategies for hospital wards—A case study of Great Ormond Street Hospital. Build. Environ. 2012, 56, 211–222. [Google Scholar] [CrossRef] [Green Version]
- Short, C.A.; Lomas, K.J.; Giridharan, R.; Fair, A.J. Building resilience to overheating into 1960’s UK hospital buildings within the constraint of the national carbon reduction target: Adaptive strategies. Build. Environ. 2012, 55, 73–95. [Google Scholar] [CrossRef] [Green Version]
- Lomas, K.J.; Giridharan, R. Thermal comfort standards, measured internal temperatures and thermal resilience to climate change of free-running buildings: A case-study of hospital wards. Build. Environ. 2012, 55, 57–72. [Google Scholar] [CrossRef] [Green Version]
- Ahmadzadehtalatapeh, M.; Yau, Y.H. The application of heat pipe heat exchangers to improve the air quality and reduce the energy consumption of the air conditioning system in a hospital ward—A full year model simulation. Energy Build. 2011, 43, 2344–2355. [Google Scholar] [CrossRef]
- Christiansen, N.; Kaltschmitt, M.; Dzukowski, F. Electrical energy consumption and utilization time analysis of hospital departments and large scale medical equipment. Energy Build. 2016, 131, 172–183. [Google Scholar] [CrossRef]
- Short, C.A.; Giridharan, R.; Lomas, K.J. A medium-rise 1970s maternity hospital in the east of England: Resilience and adaptation to climate change. Build. Serv. Eng. Res. Technol. 2015, 36, 247–274. [Google Scholar] [CrossRef] [Green Version]
- Morgenstern, P.; Li, M.; Raslan, R.; Ruyssevelt, P.; Wright, A. Benchmarking acute hospitals: Composite electricity targets based on departmental consumption intensities? Energy Build. 2016, 118, 277–290. [Google Scholar] [CrossRef]
- Iddon, C.R.; Mills, T.C.; Giridharan, R.; Lomas, K.J. The influence of hospital ward design on resilience to heat waves: An exploration using distributed lag models. Energy Build. 2015, 86, 573–588. [Google Scholar] [CrossRef] [Green Version]
- ENERGY STAR. Healthcare: An Overview of Energy Use and Energy Efficiency Opportunities. Available online: https://www.energystar.gov/ia/partners/publications/pubdocs/Healthcare.pdf (accessed on 10 October 2020).
- Kljajić, M.; Anđelković, A.S.; Mujan, I. Assessment of relevance of different effects in energy infrastructure revitalization in non-residential buildings. Energy Build. 2016, 116, 684–693. [Google Scholar] [CrossRef]
- Principi, P.; Fioretti, R.; Carbonari, A.; Lemma, M. Evaluation of energy conservation opportunities through Energy Performance Contracting: A case study in Italy. Energy Build. 2016, 128, 886–899. [Google Scholar] [CrossRef]
- Vanhoudt, D.; Desmedt, J.; Van Bael, J.; Robeyn, N.; Hoes, H. An aquifer thermal storage system in a Belgian hospital: Long-term experimental evaluation of energy and cost savings. Energy Build. 2011, 43, 3657–3665. [Google Scholar] [CrossRef]
- Coccagna, M.; Cesari, S.; Valdiserri, P.; Romio, P.; Mazzacane, S. Impact of morphological and functional features on hospitals’ energy consumption: A comparative analysis of six case studies. WSEAS Trans. Environ. Dev. 2018, 14, 212–225. [Google Scholar]
- Fifield, L.J.; Lomas, K.J.; Giridharan, R.; Allinson, D. Hospital wards and modular construction: Summertime overheating and energy efficiency. Build. Environ. 2018, 141, 28–44. [Google Scholar] [CrossRef]
- Ovchinnikov, P.; Borodiņecs, A.; Strelets, K. Utilization potential of low temperature hydronic space heating systems: A comparative review. Build. Environ. 2017, 112, 88–98. [Google Scholar] [CrossRef]
- Myhren, J.A.; Holmberg, S. Flow patterns and thermal comfort in a room with panel, floor and wall heating. Energy Build. 2008, 40, 524–536. [Google Scholar] [CrossRef]
- Truüschel, A. Hydronic heating systems the effect of design on system sensitivity. Dr. Chalmers Tek. Högskola 2002, 1857, 1–226. [Google Scholar]
- Jangsten, M.; Kensby, J.; Dalenbäck, J.-O.; Trüschel, A. Survey of radiator temperatures in buildings supplied by district heating. Energy 2017, 137, 292–301. [Google Scholar] [CrossRef] [Green Version]
- Embaye, M.; AL-Dadah, R.K.; Mahmoud, S. Effect of flow pulsation on energy consumption of a radiator in a centrally heated building. Int. J. Low-Carbon Technol. 2016, 11, 119–129. [Google Scholar] [CrossRef] [Green Version]
- Maivel, M.; Kurnitski, J. Low temperature radiator heating distribution and emission efficiency in residential buildings. Energy Build. 2014, 69, 224–236. [Google Scholar] [CrossRef]
- Hasan, A.; Kurnitski, J.; Jokiranta, K. A combined low temperature water heating system consisting of radiators and floor heating. Energy Build. 2009, 41, 470–479. [Google Scholar] [CrossRef]
- Myhren, J.A.; Holmberg, H. Performance evaluation of ventilation radiators. Appl. Therm. Eng. 2013, 51, 315–324. [Google Scholar] [CrossRef] [Green Version]
- Hesaraki, A.; Bourdakis, E.; Ploskić, A.; Holmberg, S. Experimental study of energy performance in low-temperature hydronic heating systems. Energy Build. 2015, 109, 108–114. [Google Scholar] [CrossRef]
- Ma, H.; Li, C.; Lu, W.; Zhang, Z.; Yu, S.; Du, N. Investigation on a solar-groundwater heat pump unit associated with radiant floor heating. Renew. Sustain. Energy Rev. 2017, 75, 972–977. [Google Scholar] [CrossRef]
- Ala-Juusela, M. Heating and Cooling with Focus on Increased Energy Efficiency and Improved Comfort—Guidebook to IEA ECBCS Annex 37, Low Exergy Systems for Heating and Cooling of Buildings; VTT Technical Research Centre of Finland: Espoo, Finland, 2003. [Google Scholar]
- Atienza Márquez, A.; Cejudo López, J.M.; Fernández Hernández, F.; Domínguez Muñoz, F.; Carrillo Andrés, A. A comparison of heating terminal units: Fan-coil versus radiant floor, and the combination of both. Energy Build. 2017, 138, 621–629. [Google Scholar] [CrossRef]
- Legg, R. Unitary Systems. In Air Conditioning System Design, 1st ed.; Legg, R., Ed.; Butterworth-Heinemann: Oxford, UK, 2017; pp. 137–150. [Google Scholar]
- Karmann, C.; Schiavon, S.; Bauman, F. Thermal comfort in buildings using radiant vs. all-air systems: A critical literature review. Build. Environ. 2017, 111, 123–131. [Google Scholar] [CrossRef] [Green Version]
- Rhee, K.-N.; Olesen, B.W.; Kim, K.W. Ten questions about radiant heating and cooling systems. Build. Environ. 2017, 112, 367–381. [Google Scholar] [CrossRef] [Green Version]
- Lin, B.; Wang, Z.; Sun, H.; Zhu, Y.; Ouyang, Q. Evaluation and comparison of thermal comfort of convective and radiant heating terminals in office buildings. Build. Environ. 2016, 106, 91–102. [Google Scholar] [CrossRef]
- ASHRAE. 2016 ASHRAE Handbook-HVAC Systems and Equipment, Ch.6 Radiant Heating and Cooling; American Society of Heating, Refrigerating and Air-Conditioning Engineers: Atlanta, GA, USA, 2016. [Google Scholar]
- Bojić, M.; Cvetković, D.; Marjanović, V.; Blagojević, M.; Djordjević, Z. Performances of low temperature radiant heating systems. Energy Build. 2013, 61, 233–238. [Google Scholar] [CrossRef] [Green Version]
- Martinopoulos, G.; Papakostas, K.T.; Papadopoulos, A.M. A comparative review of heating systems in EU countries, based on efficiency and fuel cost. Renew. Sustain. Energy Rev. 2018, 90, 687–699. [Google Scholar] [CrossRef]
- Kazanci, O.B.; Shukuya, M.; Olesen, B.W. Exergy performance of different space heating systems: A theoretical study. Build. Environ. 2016, 99, 119–129. [Google Scholar] [CrossRef] [Green Version]
- Bojić, M.; Cvetković, D.; Miletić, M.; Malešević, J.; Boyer, H. Energy, cost, and CO2 emission comparison between radiant wall panel systems and radiator systems. Energy Build. 2012, 54, 496–502. [Google Scholar] [CrossRef] [Green Version]
- Dovjak, M.; Shukuya, M.; Krainer, A. Exergy Analysis of Conventional and Low Exergy Systems for Heating and Cooling of Near Zero Energy Buildings. Stroj. Vestn. J. Mech. Eng. 2012, 58, 453–461. [Google Scholar] [CrossRef]
- Catalina, T.; Virgone, J.; Kuznik, F. Evaluation of thermal comfort using combined CFD and experimentation study in a test room equipped with a cooling ceiling. Build. Environ. 2009, 44, 1740–1750. [Google Scholar] [CrossRef]
- Li, R.; Yoshidomi, T.; Ooka, R.; Olesen, B.W. Field evaluation of performance of radiant heating/cooling ceiling panel system. Energy Build. 2015, 86, 58–65. [Google Scholar] [CrossRef]
- Su, L.; Li, N.; Zhang, X. Experimental study on cooling characteristics of concrete ceiling radiant cooling panel. Procedia Eng. 2015, 121, 2168–2175. [Google Scholar] [CrossRef] [Green Version]
- Sui, X.; Zhang, X.; Han, X. Performance analysis on a residential radiant chilled ceiling system and evaluation on indoor thermal environment in summer: An application. Build. Serv. Eng. Res. Technol. 2012, 34, 317–331. [Google Scholar] [CrossRef]
- Imanaria, T.; Omoria, T.; Bogakib, K. Thermal comfort and energy consumption of the radiant ceiling panel system: Comparison with the conventional all-air system. Energy Build. 1999, 30, 167–175. [Google Scholar] [CrossRef]
- Khan, Y.; Khare, V.R.; Mathur, J.; Bhandari, M. Performance evaluation of radiant cooling system integrated with air system under different operational strategies. Energy Build. 2015, 97, 118–128. [Google Scholar] [CrossRef] [Green Version]
- Syed, A. Advanced Building Technologies for Sustainability; John Wiley & Sons: Hoboken, NJ, USA, 2012. [Google Scholar]
- Miriel, J.; Serres, L.; Trombe, A. Radiant ceiling panel heating-cooling systems: Experimental and simulated study of the performances, thermal comfort and energy consumptions. Appl. Therm. Eng. 2002, 22, 1861–1873. [Google Scholar] [CrossRef]
- CIBSE. Module 5: Radiant Heating Panel. CIBSE Journal. 2009. Available online: https://www.cibsejournal.com/cpd/modules/2009-06 (accessed on 10 October 2020).
- Moslehi, S.; Maerefat, M.; Arababadi, R. Applicability of radiant heating-cooling ceiling panels in residential buildings in different climates of Iran. Procedia Eng. 2016, 145, 18–25. [Google Scholar] [CrossRef] [Green Version]
- Stefiu, C. Energy and peak power savings potential of radiant cooling systems in US commercial buildings. Energy Build. 1999, 30, 127–138. [Google Scholar]
- Maxim Integrated. DS1923. Available online: https://datasheets.maximintegrated.com/en/ds/DS1923.pdf (accessed on 10 October 2020).
- Maxim Integrated. DS1921H. Available online: https://datasheets.maximintegrated.com/en/ds/DS1921H-DS1921Z.pdf (accessed on 10 October 2020).
- Shortridge Instruments. AirData Multimeter ADM-850L. Available online: http://shortridge.com/adm850l.html (accessed on 10 October 2020).
- FLEXIM. FLUXUS ADM 6725. Available online: http://www.aysix.com/files/Flexim%206725en.pdf (accessed on 10 October 2020).
- FLIR. ThermaCAM PM675. Available online: https://www.termogram.com/pdf/675.pdf (accessed on 10 October 2020).
- Fanger, P.O. Thermal Comfort: Analysis and Applications in Environmental Engineering; Danish Technical Press: Copenhagen, Denmark, 1970. [Google Scholar]
- EN-ISO 7730. Ergonomics of the thermal Environment—Analytical Determination and Interpretation of Thermal Comfort Using Calculation of the PMV and PPD Indices and Local Thermal Comfort Criteria; International Standardization Organisation: Geneva, Switzerland, 2005. [Google Scholar]
- ANSI/ASHRAE. Standard 55-2013: Thermal Environmental Conditions for Human Occupancy; American Society of Heating, Refrigerating and Air-Conditioning Engineers: Atlanta, GA, USA, 2013. [Google Scholar]
- Athienitis, A.; O’Brien, W. Modeling, Design, and Optimization of Net-Zero Energy Buildings; Ernst & Sohn: Berlin, Germany, 2015. [Google Scholar]
- Klein, S.A.; Beckman, W.A.; Mitchell, J.W.; Duffie, J.A.; Duffie, N.A.; Freeman, T.L.; Mitchell, J.C.; Braun, J.E.; Evans, B.L.; Kummer, J.P.; et al. TRNSYS Version 18; Solar Energy Laboratory, University of Wisconsin-Madison: Madison, WI, USA, 2018. [Google Scholar]
- ISO 8996. Ergonomics of the Thermal Environment—Determination of Metabolic Rate; International Standardization Organisation: Geneva, Switzerland, 2004. [Google Scholar]
- ISO 9920. Ergonomics of the Thermal Environment—Estimation of the Thermal Insulation and Evaporative Resistance of a Clothing Ensemble; International Standardization Organisation: Geneva, Switzerland, 2009. [Google Scholar]


| Sensor Type | Model | Accuracy | Resolution | Operating Range |
|---|---|---|---|---|
| Outdoor and indoor air temperature (°C) | Dallas Semiconductors DS1923 [76] | ±0.5 °C | 0.0625 °C | −20 °C to +85 °C |
| RH (%) | Dallas Semiconductors DS1923 [76] | ±0.5% | 0.04% | 0 to 100% |
| Surface temperature (°C) | Dallas Semiconductors DS1921H [77] | ±1.0 °C | 0.125 °C | +15 °C to +46 °C |
| Inlet air temperature (°C) | Shortridge ADM-850L [78] | ±0.5 °C | 0.1 °C | 0 °C to +70 °C |
| Supply and return water temperature (°C) | FLEXIM FLUXUS ADM 6725 [79] | ±(0.02K + 0.1% of reading) | 0.1 K | −50 °C to 400 °C |
| Supply water velocity (m/s) | FLEXIM FLUXUS ADM 6725 [79] | ±0.5% of reading ± 0.01 m/s | 0.025 cm/s | 0.01 m/s to 25 m/s |
| Measuring Point | Parameter | Min | Max |
|---|---|---|---|
| 1 | Outdoor air temperature (°C) | 2.6 | 22.8 |
| 2 | Indoor air temperature (°C) | 22.7 | 26.2 |
| 2 | RH (%) | 27% | 57% |
| 3 | Window surface temperature (internal) (°C) | 15.6 | |
| 4 | Left wall surface temperature (°C) | 22.6 | 25.2 |
| 5 | Right wall surface temperature (°C) | 22.4 | 24.7 |
| 6 | Inactive ceiling panel temperature (°C) | 22.7 | 25.7 |
| 7 | Active radiant panel 1 temperature (°C) | 22.1 | 32.8 |
| 8 | Active radiant panel 2 temperature (°C) | 22.4 | 32.0 |
| 9 | Active radiant panel 3 temperature (°C) | 22.7 | 31.4 |
| 10 | Active radiant panel 4 temperature (°C) | 22.4 | 30.6 |
| 11 | Active radiant panel 5 temperature (°C) | 23.5 | 30.0 |
| 12 | Active radiant panel 6 temperature (°C) | 22.8 | 29.2 |
| 13 | Inlet air temperature (°C) | 23.2 | 25.2 |
| 14 | Supply water temperature (°C) | 25.4 | 36.0 |
| 15 | Return water temperature (°C) | 22.9 | 30.8 |
| 16 | Supply water velocity (m/s) | 0.000 | 0.168 |
| From | Until | People |
|---|---|---|
| 00:00 | 06:30 | 2 |
| 06:30 | 08:30 | 3 |
| 08:30 | 12:30 | 2 |
| 12:30 | 14:30 | 3 |
| 14:30 | 18:30 | 2 |
| 18:30 | 20:30 | 4 |
| 20:30 | 24:00 | 2 |
| Input Data | Value | Element Informed |
|---|---|---|
| outdoor air temperature (°C) | field measurements | heating coil (type 754), building (type 56) |
| inlet air temperature (°C) | field measurements | heating coil (type 754) |
| supply water temperature (°C) | field measurements | first radiant panel (type 56) |
| water flow rate (kg/s) | field measurements | all radiant panels (type 56) |
| total heat gain from artificial lighting (W/m2) | 9 | internal heat gains (type 56) |
| power of medical monitoring equipment (W) | 80 | internal heat gains (type 56) |
| patient metabolic rate (met) [82,86] | 0.7 | internal heat gains (type 56) |
| visitor metabolic rate (met) [82,86] | 1 | internal heat gains (type 56) |
| number of occupants | occupancy schedule (Table 3) | internal heat gains (type 56) |
| external wall U-value (W/m2 K) | 1.25 | building envelope (type 56) |
| window U-value (W/m2 K) | 2.80 | building envelope (type 56) |
| window g-value | 0.75 | building envelope (type 56) |
| air infiltration rate (vol/h) | 0.2 | building envelope (type 56) |
| ventilation rate (vol/h) | 2 | heating coil (type 754), building (type 56) |
| Inlet Air Temperature 20 °C | |||||||
|---|---|---|---|---|---|---|---|
| Month & RCP Mode | RCP Operating Hours (h) | Mean Indoor Air Temperature (°C) | Mean RH (%) | Mean PMV Bed A | Mean PMV Bed B | Mean PPD Bed A | Mean PPD Bed B |
| October | – | 24.5 | 48.9 | +0.54 | +0.56 | 12.96 | 13.30 |
| RCP ON mode | 0 | – | – | – | – | – | – |
| RCP OFF mode | 744 | 24.5 | 49.0 | +0.54 | +0.56 | 12.96 | 13.30 |
| November | – | 22.4 | 50.3 | −0.04 | +0.00 | 5.25 | 5.19 |
| RCP ON mode | 392 | 22.2 | 50.1 | −0.08 | −0.04 | 5.16 | 5.06 |
| RCP OFF mode | 328 | 22.6 | 50.5 | +0.01 | +0.04 | 5.36 | 5.35 |
| December | – | 22.1 | 49.1 | −0.10 | −0.06 | 5.39 | 5.22 |
| RCP ON mode | 604 | 22.0 | 49.3 | −0.13 | −0.08 | 5.38 | 5.17 |
| RCP OFF mode | 140 | 22.6 | 48.0 | +0.01 | +0.05 | 5.44 | 5.44 |
| January | – | 22.2 | 48.5 | −0.08 | −0.03 | 5.35 | 5.22 |
| RCP ON mode | 574 | 22.1 | 48.9 | −0.11 | −0.06 | 5.33 | 5.14 |
| RCP OFF mode | 170 | 22.7 | 47.5 | +0.03 | +0.07 | 5.45 | 5.49 |
| February | – | 22.3 | 48.6 | −0.07 | −0.03 | 5.28 | 5.17 |
| RCP ON mode | 505 | 22.1 | 48.9 | −0.10 | −0.05 | 5.24 | 5.09 |
| RCP OFF mode | 167 | 22.7 | 47.8 | +0.02 | +0.05 | 5.42 | 5.41 |
| March | – | 22.7 | 48.1 | +0.03 | +0.06 | 5.43 | 5.44 |
| RCP ON mode | 172 | 22.3 | 48.6 | −0.06 | −0.02 | 5.11 | 5.04 |
| RCP OFF mode | 572 | 22.8 | 47.9 | +0.06 | +0.09 | 5.53 | 5.56 |
| April | – | 24.0 | 48.3 | +0.39 | +0.41 | 10.49 | 10.71 |
| RCP ON mode | 43 | 22.3 | 49.5 | −0.06 | −0.03 | 5.10 | 5.03 |
| RCP OFF mode | 677 | 24.1 | 48.2 | +0.42 | +0.44 | 10.83 | 11.07 |
| Inlet Air Temperature 21 °C | |||||||
|---|---|---|---|---|---|---|---|
| Month & RCP Mode | RCP Operating Hours (h) | Mean Indoor Air Temperature (°C) | Mean RH (%) | Mean PMV Bed A | Mean PMV Bed B | Mean PPD Bed A | Mean PPD Bed B |
| October | – | 24.8 | 49.4 | +0.60 | +0.62 | 14.27 | 14.68 |
| RCP ON mode | 0 | – | – | – | – | – | – |
| RCP OFF mode | 744 | 24.8 | 49.4 | +0.60 | +0.62 | 14.27 | 14.68 |
| November | – | 22.5 | 52.1 | −0.01 | +0.02 | 5.26 | 5.23 |
| RCP ON mode | 296 | 22.3 | 51.6 | −0.06 | −0.02 | 5.09 | 5.02 |
| RCP OFF mode | 424 | 22.6 | 52.4 | +0.02 | +0.05 | 5.37 | 5.38 |
| December | – | 22.3 | 51.1 | −0.06 | −0.01 | 5.24 | 5.15 |
| RCP ON mode | 554 | 22.2 | 51.4 | −0.08 | −0.04 | 5.17 | 5.05 |
| RCP OFF mode | 190 | 22.6 | 50.5 | +0.01 | +0.05 | 5.45 | 5.46 |
| January | – | 22.4 | 50.7 | −0.05 | +0.00 | 5.25 | 5.19 |
| RCP ON mode | 522 | 22.2 | 50.9 | −0.08 | −0.02 | 5.15 | 5.04 |
| RCP OFF mode | 222 | 22.7 | 50.0 | +0.03 | +0.07 | 5.49 | 5.53 |
| February | – | 22.4 | 50.9 | −0.04 | +0.00 | 5.23 | 5.17 |
| RCP ON mode | 424 | 22.2 | 51.0 | −0.07 | −0.02 | 5.13 | 5.03 |
| RCP OFF mode | 248 | 22.6 | 50.6 | +0.00 | +0.04 | 5.41 | 5.39 |
| March | – | 22.9 | 50.0 | +0.07 | +0.10 | 5.61 | 5.66 |
| RCP ON mode | 116 | 22.3 | 50.8 | −0.05 | −0.01 | 5.07 | 5.02 |
| RCP OFF mode | 628 | 23.0 | 49.8 | +0.10 | +0.12 | 5.71 | 5.78 |
| April | – | 24.2 | 48.9 | +0.44 | +0.46 | 11.45 | 11.73 |
| RCP ON mode | 27 | 22.3 | 51.4 | −0.05 | −0.01 | 5.06 | 5.01 |
| RCP OFF mode | 693 | 24.3 | 48.8 | +0.46 | +0.48 | 11.70 | 11.99 |
| Inlet Air Temperature 22 °C | |||||||
|---|---|---|---|---|---|---|---|
| Month & RCP Mode | RCP Operating Hours (h) | Mean Indoor Air Temperature (°C) | Mean RH (%) | Mean PMV Bed A | Mean PMV Bed B | Mean PPD Bed A | Mean PPD Bed B |
| October | – | 25.1 | 49.8 | +0.67 | +0.69 | 15.98 | 16.44 |
| RCP ON mode | 0 | – | – | – | – | – | – |
| RCP OFF mode | 744 | 25.1 | 49.8 | +0.67 | +0.69 | 15.98 | 16.44 |
| November | – | 22.6 | 54.1 | +0.01 | +0.04 | 5.30 | 5.30 |
| RCP ON mode | 209 | 22.3 | 53.7 | −0.04 | +0.00 | 5.04 | 5.01 |
| RCP OFF mode | 511 | 22.7 | 54.3 | +0.03 | +0.06 | 5.40 | 5.42 |
| December | – | 22.4 | 53.5 | −0.03 | +0.02 | 5.20 | 5.17 |
| RCP ON mode | 479 | 22.3 | 53.5 | −0.05 | +0.00 | 5.07 | 5.01 |
| RCP OFF mode | 265 | 22.6 | 53.4 | +0.01 | +0.05 | 5.44 | 5.45 |
| January | – | 22.4 | 53.1 | −0.02 | +0.03 | 5.24 | 5.22 |
| RCP ON mode | 444 | 22.3 | 53.2 | −0.05 | +0.00 | 5.07 | 5.02 |
| RCP OFF mode | 301 | 22.6 | 52.9 | +0.01 | +0.06 | 5.50 | 5.52 |
| February | – | 22.4 | 53.3 | −0.03 | +0.02 | 5.23 | 5.19 |
| RCP ON mode | 341 | 22.3 | 53.3 | −0.05 | +0.00 | 5.06 | 5.01 |
| RCP OFF mode | 331 | 22.6 | 53.4 | +0.00 | +0.04 | 5.40 | 5.38 |
| March | – | 23.0 | 52.0 | +0.12 | +0.15 | 5.89 | 5.98 |
| RCP ON mode | 68 | 22.3 | 53.3 | −0.04 | +0.01 | 5.04 | 5.01 |
| RCP OFF mode | 676 | 23.1 | 51.9 | +0.13 | +0.16 | 5.97 | 6.08 |
| April | – | 24.5 | 49.8 | +0.50 | +0.52 | 12.71 | 13.04 |
| RCP ON mode | 15 | 22.4 | 53.5 | −0.03 | +0.01 | 5.02 | 5.01 |
| RCP OFF mode | 705 | 24.5 | 49.7 | +0.50 | +0.53 | 12.88 | 13.22 |
| Inlet Air Temperature 23 °C | |||||||
|---|---|---|---|---|---|---|---|
| Month & RCP Mode | RCP Operating Hours (h) | Mean Indoor Air Temperature (°C) | Mean RH (%) | Mean PMV Bed A | Mean PMV Bed B | Mean PPD Bed A | Mean PPD Bed B |
| October | – | 25.4 | 50.4 | +0.74 | +0.76 | 18.25 | 18.80 |
| RCP ON mode | 0 | – | – | – | – | – | – |
| RCP OFF mode | 744 | 25.4 | 50.4 | +0.74 | +0.76 | 18.25 | 18.80 |
| November | – | 22.7 | 56.4 | +0.03 | +0.07 | 5.38 | 5.41 |
| RCP ON mode | 134 | 22.4 | 56.3 | −0.02 | +0.02 | 5.02 | 5.02 |
| RCP OFF mode | 586 | 22.7 | 56.4 | +0.04 | +0.08 | 5.46 | 5.50 |
| December | – | 22.5 | 56.0 | −0.01 | +0.03 | 5.24 | 5.24 |
| RCP ON mode | 386 | 22.4 | 55.9 | −0.03 | +0.02 | 5.03 | 5.02 |
| RCP OFF mode | 358 | 22.6 | 56.2 | +0.01 | +0.05 | 5.46 | 5.47 |
| January | – | 22.5 | 55.7 | −0.01 | +0.04 | 5.27 | 5.28 |
| RCP ON mode | 361 | 22.3 | 55.7 | −0.03 | +0.02 | 5.03 | 5.02 |
| RCP OFF mode | 383 | 22.6 | 55.7 | +0.01 | +0.06 | 5.50 | 5.52 |
| February | – | 22.5 | 55.9 | −0.01 | +0.04 | 5.26 | 5.25 |
| RCP ON mode | 267 | 22.4 | 55.7 | −0.03 | +0.02 | 5.02 | 5.02 |
| RCP OFF mode | 405 | 22.6 | 56.0 | +0.00 | +0.04 | 5.41 | 5.41 |
| March | – | 23.2 | 54.1 | +0.16 | +0.19 | 6.29 | 6.44 |
| RCP ON mode | 36 | 22.4 | 55.9 | −0.02 | +0.02 | 5.02 | 5.02 |
| RCP OFF mode | 708 | 23.2 | 54.0 | +0.17 | +0.20 | 6.35 | 6.51 |
| April | – | 24.8 | 50.9 | +0.57 | +0.59 | 14.39 | 14.79 |
| RCP ON mode | 6 | 22.4 | 56.3 | −0.02 | +0.02 | 5.02 | 5.02 |
| RCP OFF mode | 714 | 24.8 | 50.8 | +0.58 | +0.60 | 14.47 | 14.88 |
| Inlet Air Temperature 24 °C | |||||||
|---|---|---|---|---|---|---|---|
| Month & RCP Mode | RCP Operating Hours (h) | Mean Indoor Air Temperature (°C) | Mean RH (%) | Mean PMV Bed A | Mean PMV Bed B | Mean PPD Bed A | Mean PPD Bed B |
| October | – | 25.7 | 51.2 | +0.83 | +0.85 | 21.06 | 21.72 |
| RCP ON mode | 0 | – | – | – | – | – | – |
| RCP OFF mode | 744 | 25.7 | 51.2 | +0.83 | +0.85 | 21.06 | 21.72 |
| November | – | 22.8 | 58.8 | +0.06 | +0.10 | 5.51 | 5.59 |
| RCP ON mode | 76 | 22.4 | 59.1 | −0.01 | +0.03 | 5.01 | 5.03 |
| RCP OFF mode | 644 | 22.8 | 58.7 | +0.07 | +0.11 | 5.57 | 5.65 |
| December | – | 22.5 | 58.9 | +0.00 | +0.04 | 5.30 | 5.31 |
| RCP ON mode | 287 | 22.4 | 58.6 | −0.01 | +0.04 | 5.01 | 5.04 |
| RCP OFF mode | 457 | 22.6 | 59.1 | +0.00 | +0.05 | 5.48 | 5.49 |
| January | – | 22.5 | 58.5 | +0.00 | +0.05 | 5.33 | 5.36 |
| RCP ON mode | 274 | 22.4 | 58.5 | −0.01 | +0.04 | 5.01 | 5.05 |
| RCP OFF mode | 470 | 22.6 | 58.6 | +0.01 | +0.06 | 5.51 | 5.54 |
| February | – | 22.5 | 58.7 | +0.00 | +0.05 | 5.32 | 5.33 |
| RCP ON mode | 190 | 22.4 | 58.5 | −0.01 | +0.04 | 5.01 | 5.04 |
| RCP OFF mode | 483 | 22.6 | 58.8 | +0.01 | +0.05 | 5.44 | 5.45 |
| March | – | 23.4 | 56.2 | +0.22 | +0.25 | 6.86 | 7.08 |
| RCP ON mode | 16 | 22.4 | 58.8 | −0.01 | +0.03 | 5.01 | 5.03 |
| RCP OFF mode | 728 | 23.4 | 56.2 | +0.23 | +0.26 | 6.90 | 7.12 |
| April | – | 25.1 | 52.2 | +0.65 | +0.67 | 16.59 | 17.09 |
| RCP ON mode | 0 | – | – | – | – | – | – |
| RCP OFF mode | 720 | 25.7 | 52.2 | +0.83 | +0.85 | 21.05 | 21.71 |
Publisher’s Note: MDPI stays neutral with regard to jurisdictional claims in published maps and institutional affiliations. |
© 2020 by the authors. Licensee MDPI, Basel, Switzerland. This article is an open access article distributed under the terms and conditions of the Creative Commons Attribution (CC BY) license (http://creativecommons.org/licenses/by/4.0/).
Share and Cite
Valdiserri, P.; Cesari, S.; Coccagna, M.; Romio, P.; Mazzacane, S. Experimental Data and Simulations of Performance and Thermal Comfort in a Patient Room Equipped with Radiant Ceiling Panels. Buildings 2020, 10, 235. https://doi.org/10.3390/buildings10120235
Valdiserri P, Cesari S, Coccagna M, Romio P, Mazzacane S. Experimental Data and Simulations of Performance and Thermal Comfort in a Patient Room Equipped with Radiant Ceiling Panels. Buildings. 2020; 10(12):235. https://doi.org/10.3390/buildings10120235
Chicago/Turabian StyleValdiserri, Paolo, Silvia Cesari, Maddalena Coccagna, Pasquale Romio, and Sante Mazzacane. 2020. "Experimental Data and Simulations of Performance and Thermal Comfort in a Patient Room Equipped with Radiant Ceiling Panels" Buildings 10, no. 12: 235. https://doi.org/10.3390/buildings10120235