1. Introduction
During the last decade, the development of intermittent renewable energy systems (RES)—mainly photovoltaic (PV) systems—and increasingly decentralized production have been observed in many countries. Accordingly, the number of small to medium scale plants has increased, and they are often installed in residential buildings [
1].
In principle, this is considered to be a good result. However, in complex energy systems, maintaining the balance between energy production and energy demand when large fluctuations in renewable energy occur is a difficult task. Therefore, increasing the penetration of RES needs to be combined with the development of strategies aimed at increasing direct utilization of the energy produced, in order to achieve effective energy savings for the whole system. Without this, the significant effort expended to promote these energy systems will not lead to real reductions in the dependence on fossil fuel and carbon dioxide emissions.
Several studies have shown that the penetration of RES, in particular PV plants, seemed to be limited to an upper level of technical considerations. A further increase in the level could be possible by integrating various energy uses (thermal, mobility, and electrical), which could be obtained mainly at the local level, for example, in civil and residential sectors.
This requires an important shift from thermal energy production to the field of electricity. From this perspective, for example, a heat pump (HP) for hot and cold temperature production and electric mobility can directly and indirectly play a relevant role in the shift from fossil fuel use to renewable source supply, as the necessary electricity for a HP in an electric vehicle can be produced with RES [
2,
3,
4].
Franco et al. [
5] analyzed the problem in connection with the Italian energy system, which was characterized by an important modification to the structure from 2005 to 2020 as a consequence of an increase in the number of PV plants, other renewable energies, and the number of energy producers. In a complex energy system, one method to increase the system’s capability of introducing an increased share of intermittent RES, such as PV plants, depends on the possibility of increased electricity demand and the promotion of self-consumption schemes. For some years, at small power-generating facilities, with all the electricity produced from RES, a form of priority dispatch has been granted via a specific priority order. However, in the near future, this may not be maintained, and in any case, it must be compatible with participation in the electricity market.
The simultaneous utilization of HP and PV modules yields a positive synergy, with respect to a shift from using fuel-based systems (such as natural gas in Italy) to electricity produced by means of renewable energies, as well as a consistent reduction in local pollution and carbon dioxide (CO
2) emissions. This would guarantee the economical sustainability of investments in renewable energy sources without the need for subsidiary mechanisms [
6]. The system involves the favorable integration of PV modules with a HP, and thereby generates heat and electricity in self-consumption schemes, with a reasonably high overall efficiency [
7].
Regarding the typology of heat pumps, both air source and ground source heat pumps should be considered. One of the main limitations of air source heat pumps (ASHP) is the fact that the thermal power delivery curve is opposite to the environmental conditions, and the maximum PV electricity production occurs during daytime hours with higher ambient temperatures, while there is no production during evening hours when the maximum thermal power demand occurs. The use of more stable seasonal temperature ground source heat pumps (GHP) offers, in principle, considerable opportunities for reducing global energy consumption, due to their potentially higher efficiency. The efficiency of a HP is represented by the coefficient of performance (COP), which can move from values of 3–4 to even higher values, even though the installation is more complicated and significantly increases the investment cost [
8,
9]. However, the shift from PV production to a GHP energy use profile still remains, occurring mainly during the cold season.
In all cases, the promotion of integrated solutions of solar-assisted heat pumps (both the air type and the geothermal type) and a PV plant to support a system producing electricity to supply the HP can, in principle, add “flexibility” to the system. In this case, a relevant problem is represented by the bidirectional energy flows of the external power grid, due to the electricity exported to the grid from a renewable-based system and the electricity imported from the grid depending on the electricity demand of a building. For public buildings, this is a minor problem because the peak energy consumption occurs during the daytime when peak energy is typically generated by the PV plant. It is a more important issue in the case of residential buildings, as discussed in [
10].
If a building is equipped with photovoltaic (PV) modules, the use of electric storage could be particularly important to mitigate the effects of the time mismatch between the electrical production peak, which occurs between 11:00 and 15:00, and the thermal power demand peak, which occurs in the early morning or the late evening. In principle, a further increase in the number of PV plant installations is expected in the near future. Notably, during summertime, heat pumps typically contribute to an increase in the flexibility of the system, as they can consume electricity during hours of excess production, while they can also be effective during the winter. For this reason, it is important to consider the possible connection between the production of electricity and use of thermal energy, as obtained in the case of integrated PV and HP systems for building services [
11,
12].
Over recent years, several studies have proposed designs for solar-assisted HPs that have been tested using modelling. This has especially been the case for smart energy systems, which are considered an important element of the development of net zero-energy building (nZEB) systems— systems able to produce all of the energy required by a building using renewable energies.
A recently published review article, [
13], has been published in recent years on the topic, considering the different system boundaries and the main performance indicators used for assessing energetic and economic optimization, including economic assessment of solar photovoltaic and heat pump systems.
The possibility of experimentally monitoring the behavior of different types of building–plant systems that cover the most widespread typologies, such as residential buildings, or that are considered “strategic” by the various energy efficiency programs, such as office buildings, supermarkets and educational buildings, is of fundamental importance to evaluate heat pump (HP) system performance in real conditions.
Depending on the building typology and envelope characteristics, lay-out and use, it is important to properly select the size of each single component. The development of design methods for these systems could be particularly relevant for engineers and designers. The sizing of PV systems was considered in some recent papers [
14,
15], and it is usually based on various technical and economic criteria. The problem of energy flows from and to the grid was only considered occasionally and no boundary conditions were considered for energy flows to the grid.
In this paper, we analyze data obtained from a real case in which a PV plant was used in a residential building to produce electricity for the operation of an HP, which provides heating and cooling, and for the miscellaneous energy loads of the house.
Moving from the analysis of the data acquired during the long-term experimental analysis of the system, we then focus our analysis on the specific problem of energy flows to and from the power grid. In the second part of the paper, considering that in the near future plants will be sized to maximize the self-consumption capacity of a system, we propose guidelines for an optimum design strategy of the system under analysis to increase the share of energy produced by the PV plant and directly used in the building. The objective is to define the size of a PV plant necessary to maximize the direct use of the energy produced and minimize energy flows. The possibility of using a “small size” storage system is also considered.
Starting from the analysis of the particular system considered here, some general guidelines for the design of such systems are discussed. The data analyzed in this paper can also provide insights both on the operation of the PV system and the operation of the GHP. General criteria and guidelines for the optimum design of PV plants for buildings, providing the use of HP for heating and cooling service are considered in the final part.
While in general the possibility of using the electrical grid as a “buffer” for the energy produced is deemed optimal, we attempt to reconsider the perspective of obtaining effective self-consumption configurations. In this case, the electrical grid can be used for energy import and not for exporting the excess energy. This will support further increases in RES while avoiding state interventions, which are often designed in an uncoordinated manner and have led to increasing distortions of the wholesale electricity market, with negative consequences for investors.
2. Integrated PV-HP System for Residential Building: A General Description
One of the methods used to transform a complex energy system and increase the amount of energy produced with intermittent RES, such as PV plants, is to increase the electricity demand and promote the in situ strategies for the direct utilization of the energy produced, minimizing the amount of energy flowing from and to the grid. An interesting solution is the use of solar-assisted heat pumps for heating and cooling purposes in residential buildings.
The Energy Performance of Buildings Directive (EPBD) is the main legislative instrument at the European Union level for improving the energy efficiency of buildings. A fundamental element of this directive is represented by the requirements relating to zero-energy buildings (ZEB) or net zero-energy buildings (nZEB) and the related integration of renewable sources in the implementation of the relevant provisions.
At the level of definition of nZEB buildings, the European Directive does not contain specific prescriptions in terms of the minimum absorbed energy, but provides a generic definition, that is, an nZEB is considered a building with very high energy performance, characterized by very low or almost zero energy needs, which should be covered to a very significant extent by energy from renewable sources present on site.
The concept of a nearly zero-energy building therefore contains the notion of a synergy of interventions in terms of energy production from renewable sources and energy efficiency. Energy efficiency refers to the amount of energy, calculated or measured, necessary to meet the energy needs associated with normal use of the building, including, in particular, the reduction in energy used for heating, cooling, ventilation, the production of domestic hot water and lighting. In this definition, important factors come into play: the type of heating and conditioning system, the use of energy from renewable sources, the passive elements of heating and cooling, the shading systems, the quality of indoor air, adequate natural lighting, and the architectural features of the building.
Considering the concept of nearly zero-energy buildings, interesting theoretical studies have been proposed based on experimental data [
16,
17]. Some articles deal with the topic of nearly zero-energy buildings from the perspective of regulatory interpretation [
18], while others provide a descriptive collection of exemplary cases [
19,
20,
21].
One solution considered in various cases as fundamental to the concept of nZEBs is the solar-assisted heat pump, consisting of a HP system assisted by a PV plant installed on the building. This solution enables the direct use of excess energy produced to operate the HP.
During the last decade, a number of studies have investigated the design, modelling and testing of solar-assisted HP systems [
22,
23]. A recent review on the topic presents problems and perspectives of this solution [
24]. The design criteria differ among papers and are often based on economic criteria. In general, the technical solutions proposed are not optimized from the point of view of the “energy system”. In particular, the size of the PV plant is not always correctly defined in this perspective.
This problem is a consequence of the fact that, until some years ago, in many countries the electricity produced by renewable systems from small power-generating facilities had priority dispatch. In the near future, it is expected that priority dispatch should be deemed to be compatible with the participation in the electricity market of power-generating facilities using renewable energy sources.
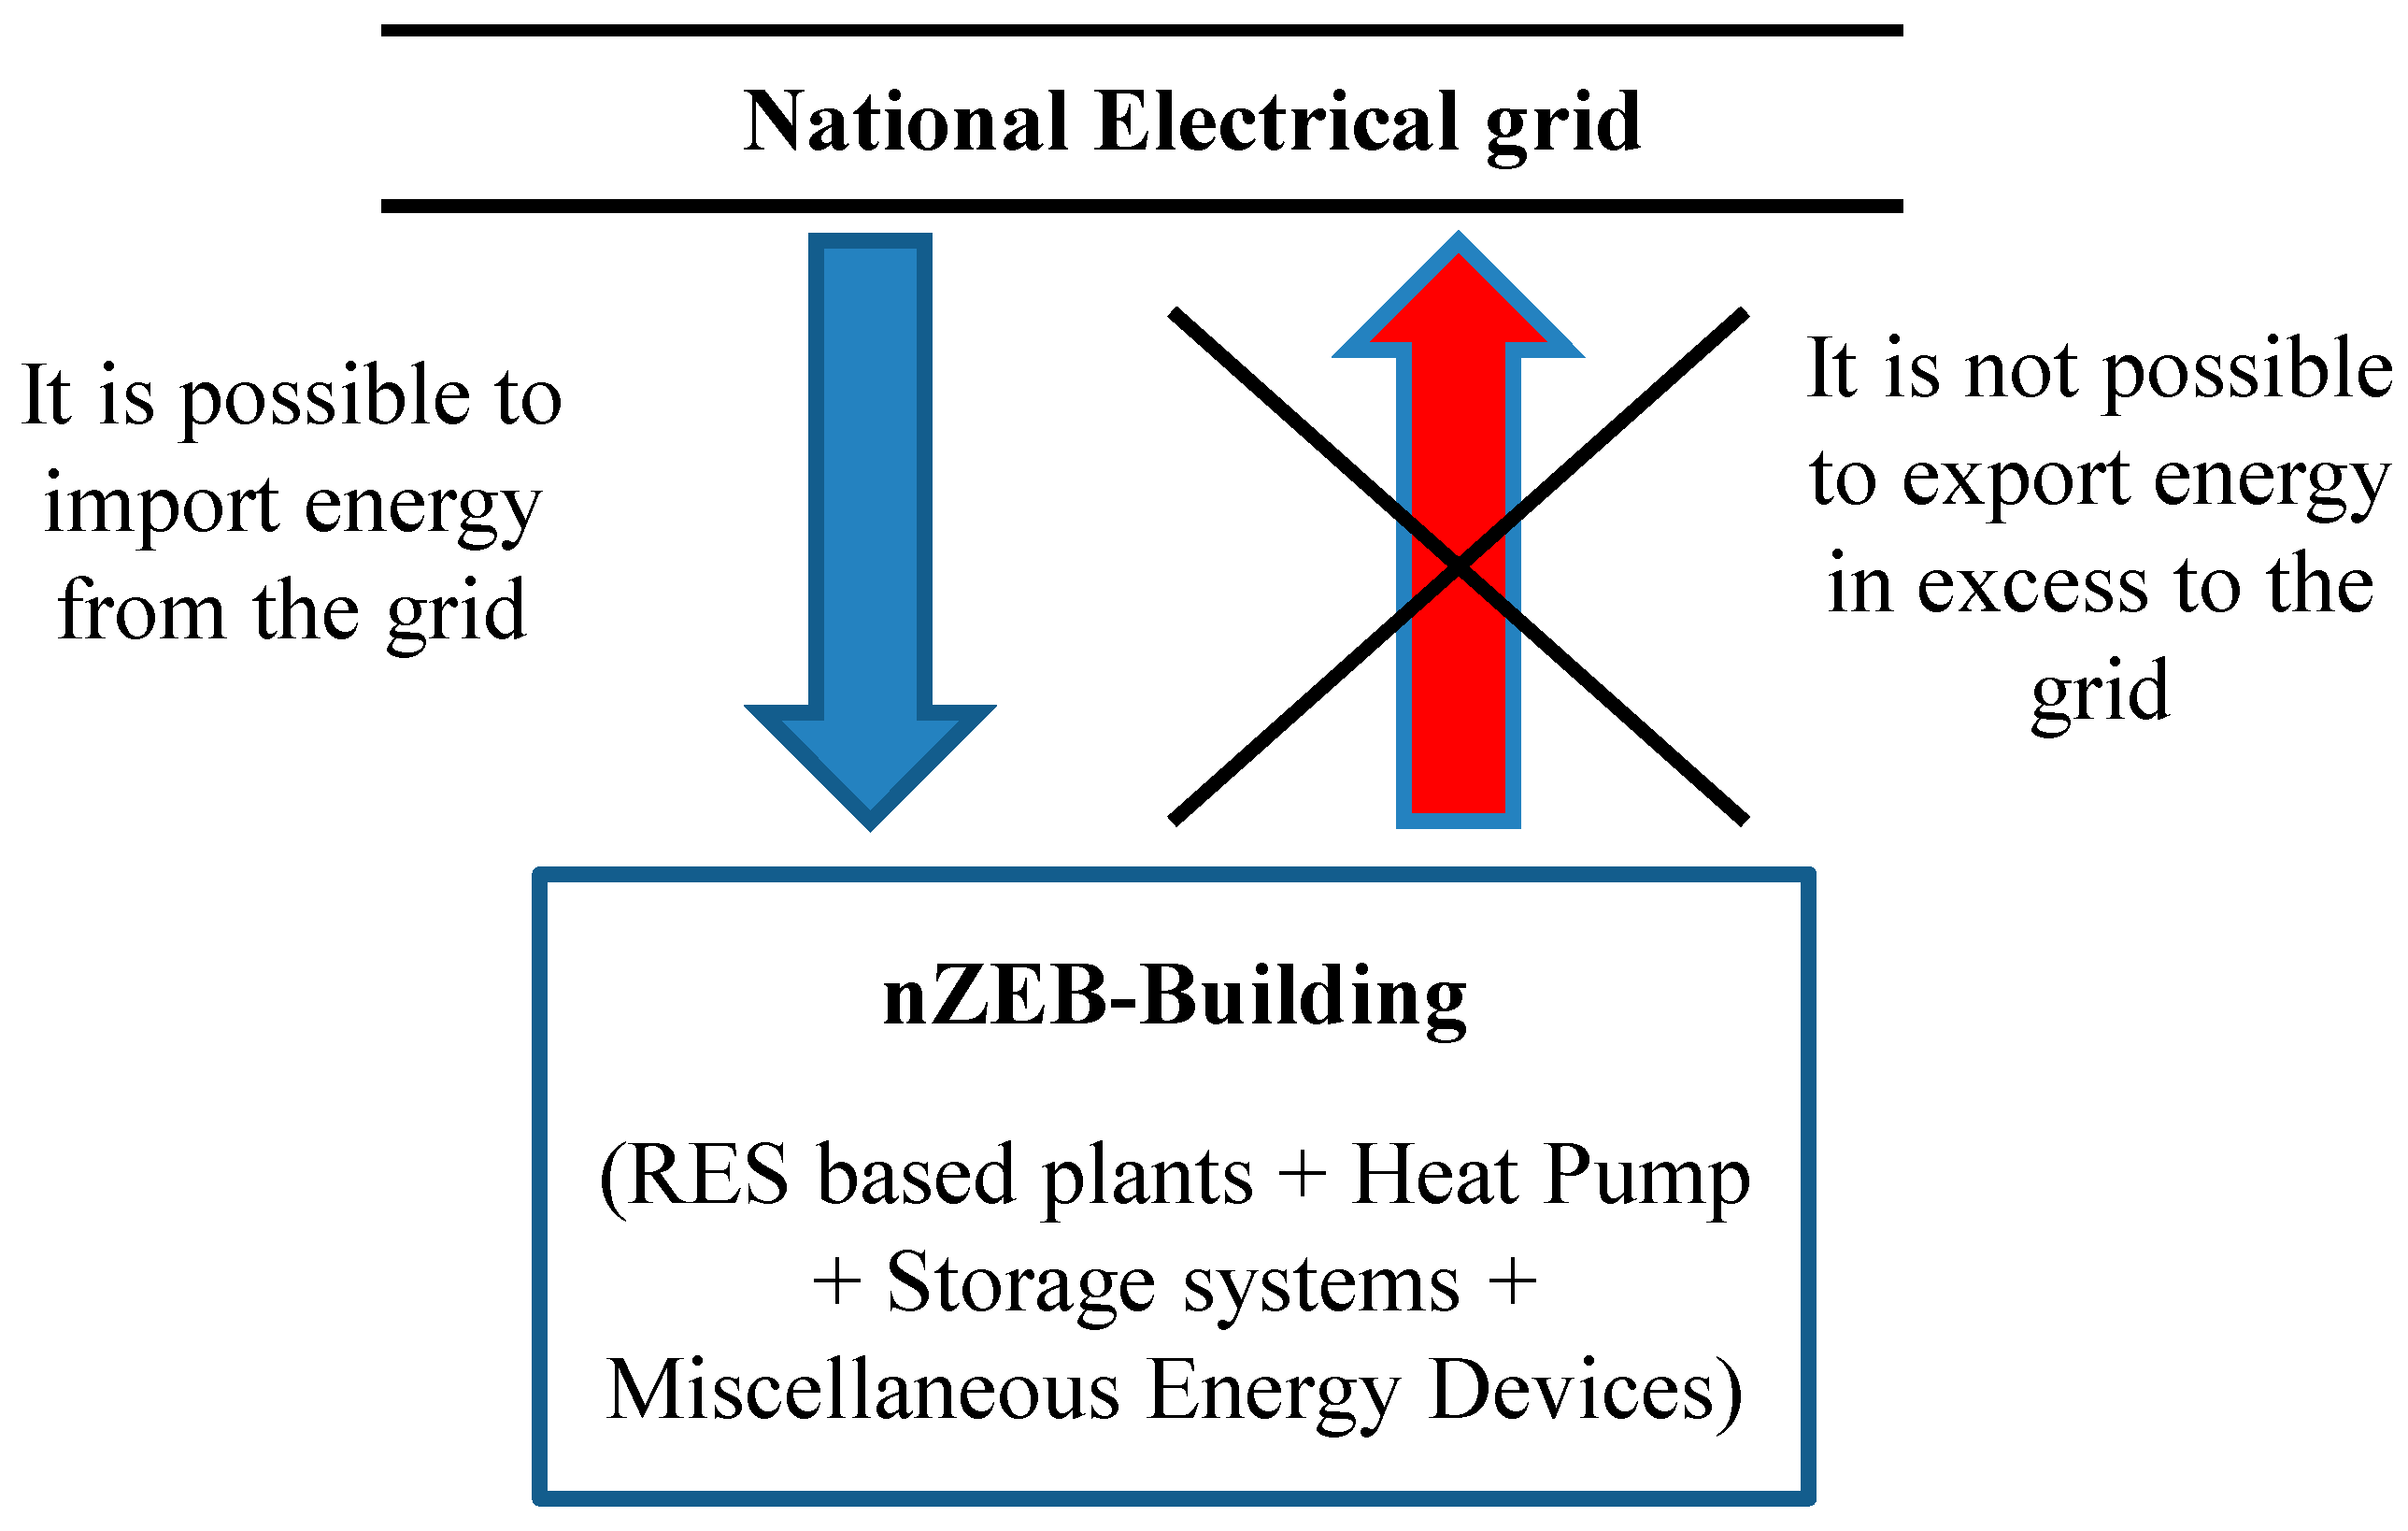
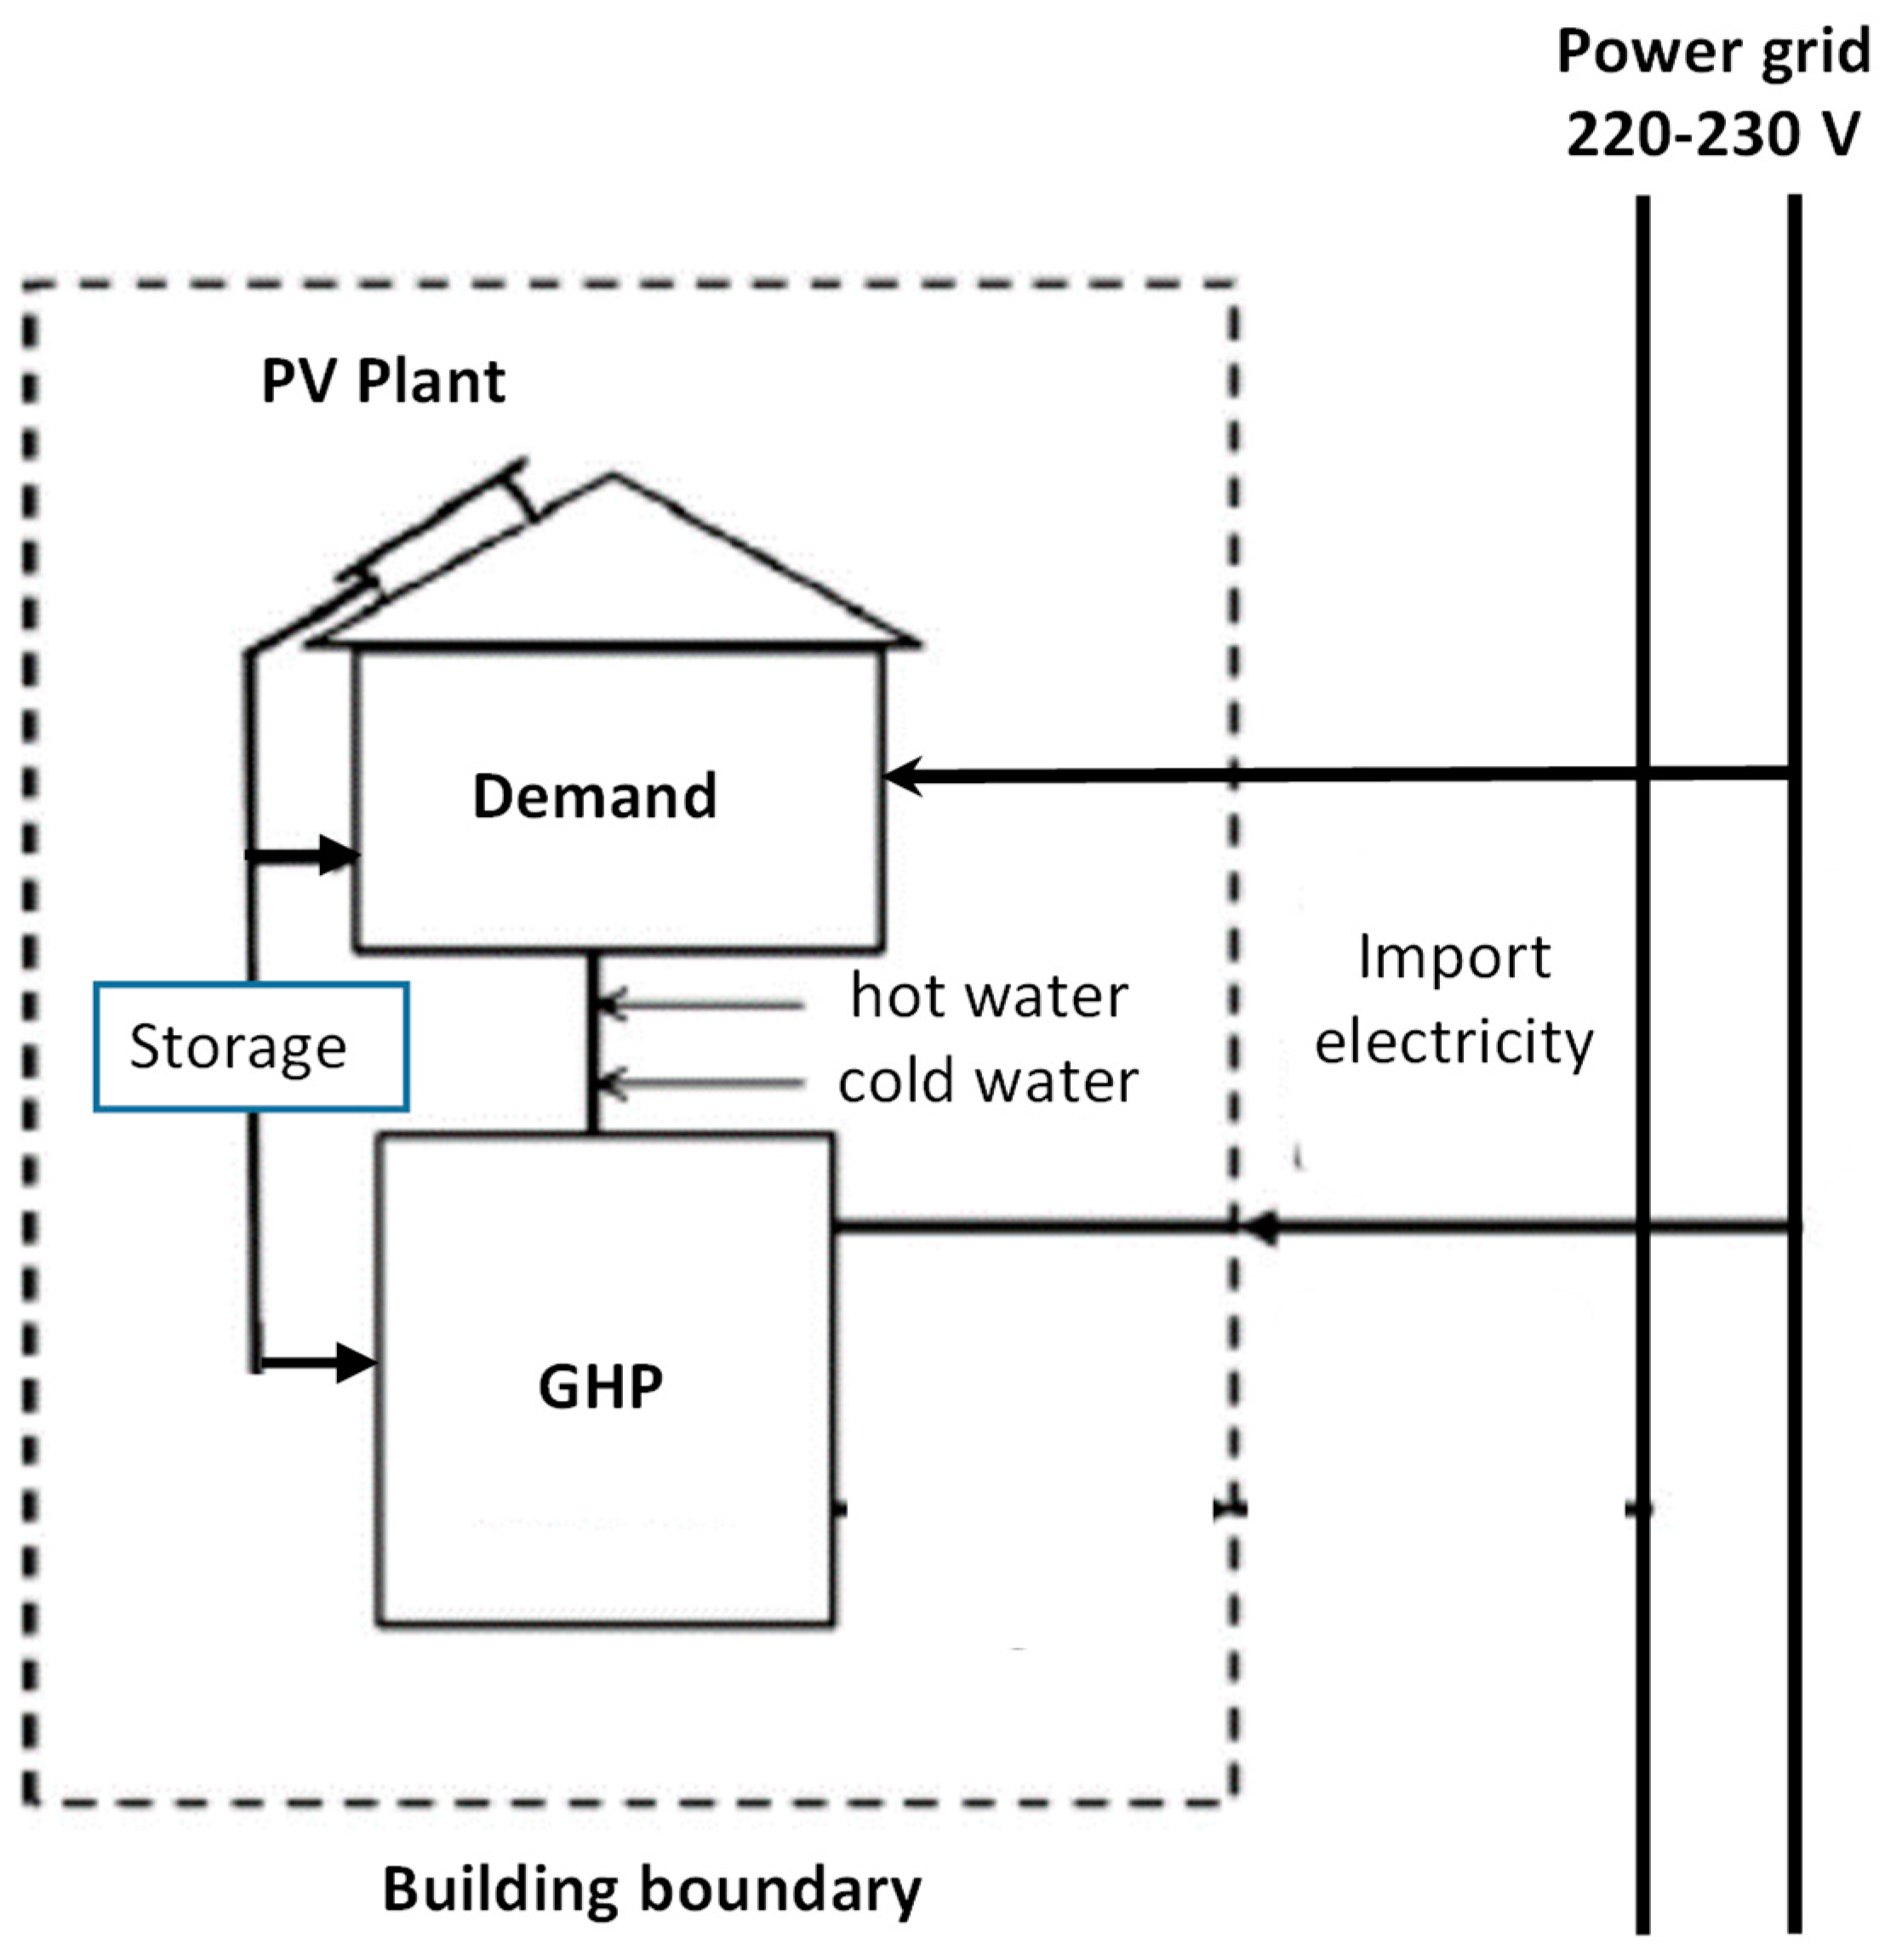
Plants can be optimized with the utilization of a consistent storage energy system. Moreover, the joint operation of a PV plant and HP does not permit a profitable use of energy during the winter period, therefore in a lot of cases an oversizing of the PV plant is observed, thus it is necessary for energy to be exported to the electrical grid. It is expected that in the near future, the utilization of such solutions could be connected with self-consumption schemes, in which only the import of energy will be possible, as shown in
Figure 1. Consequently, energy produced and not directly used or stored inside can be considered wasted energy, and it is not possible (or convenient) to export excess energy to the grid. The ideal condition is clearly the one in which all of the energy required by the building can be produced within, so that the level of energy imported approaches zero, as required in the ZEB configuration.
Taking into account two of the most diffused technologies (i.e., ground source heat pumps (GHP) and the small size PV system) and the recent developments in terms of economic support policies, there has been strong growth in the use of both PV plants (determined by the effect of the feed-in tariff) and HP systems (aided by the effect of fiscal incentives) [
25,
26].
The typical integration proposed by [
27] may contribute in the medium to long term to a relevant reduction in the use of conventional fossil fuels (e.g., natural gas) for heating purposes and to an increase in the production of solar energy.
3. Integrated PV-GHP System for Residential Buildings: Experimental Analysis of a Specific Case
The possibility of monitoring the behavior of different types of building–plant systems to cover the most widespread typologies, such as residential buildings, is of fundamental importance to be able to analyze the performance of those systems under real operating conditions. For this reason, we began with the analysis of data obtained from an experimental system.
The experimental system under analysis (described in [
4]) is located in Pisa, Italy, a town with a typical Mediterranean climate. The building has a floor surface area of about 150 m
2 and a volume of 450 m
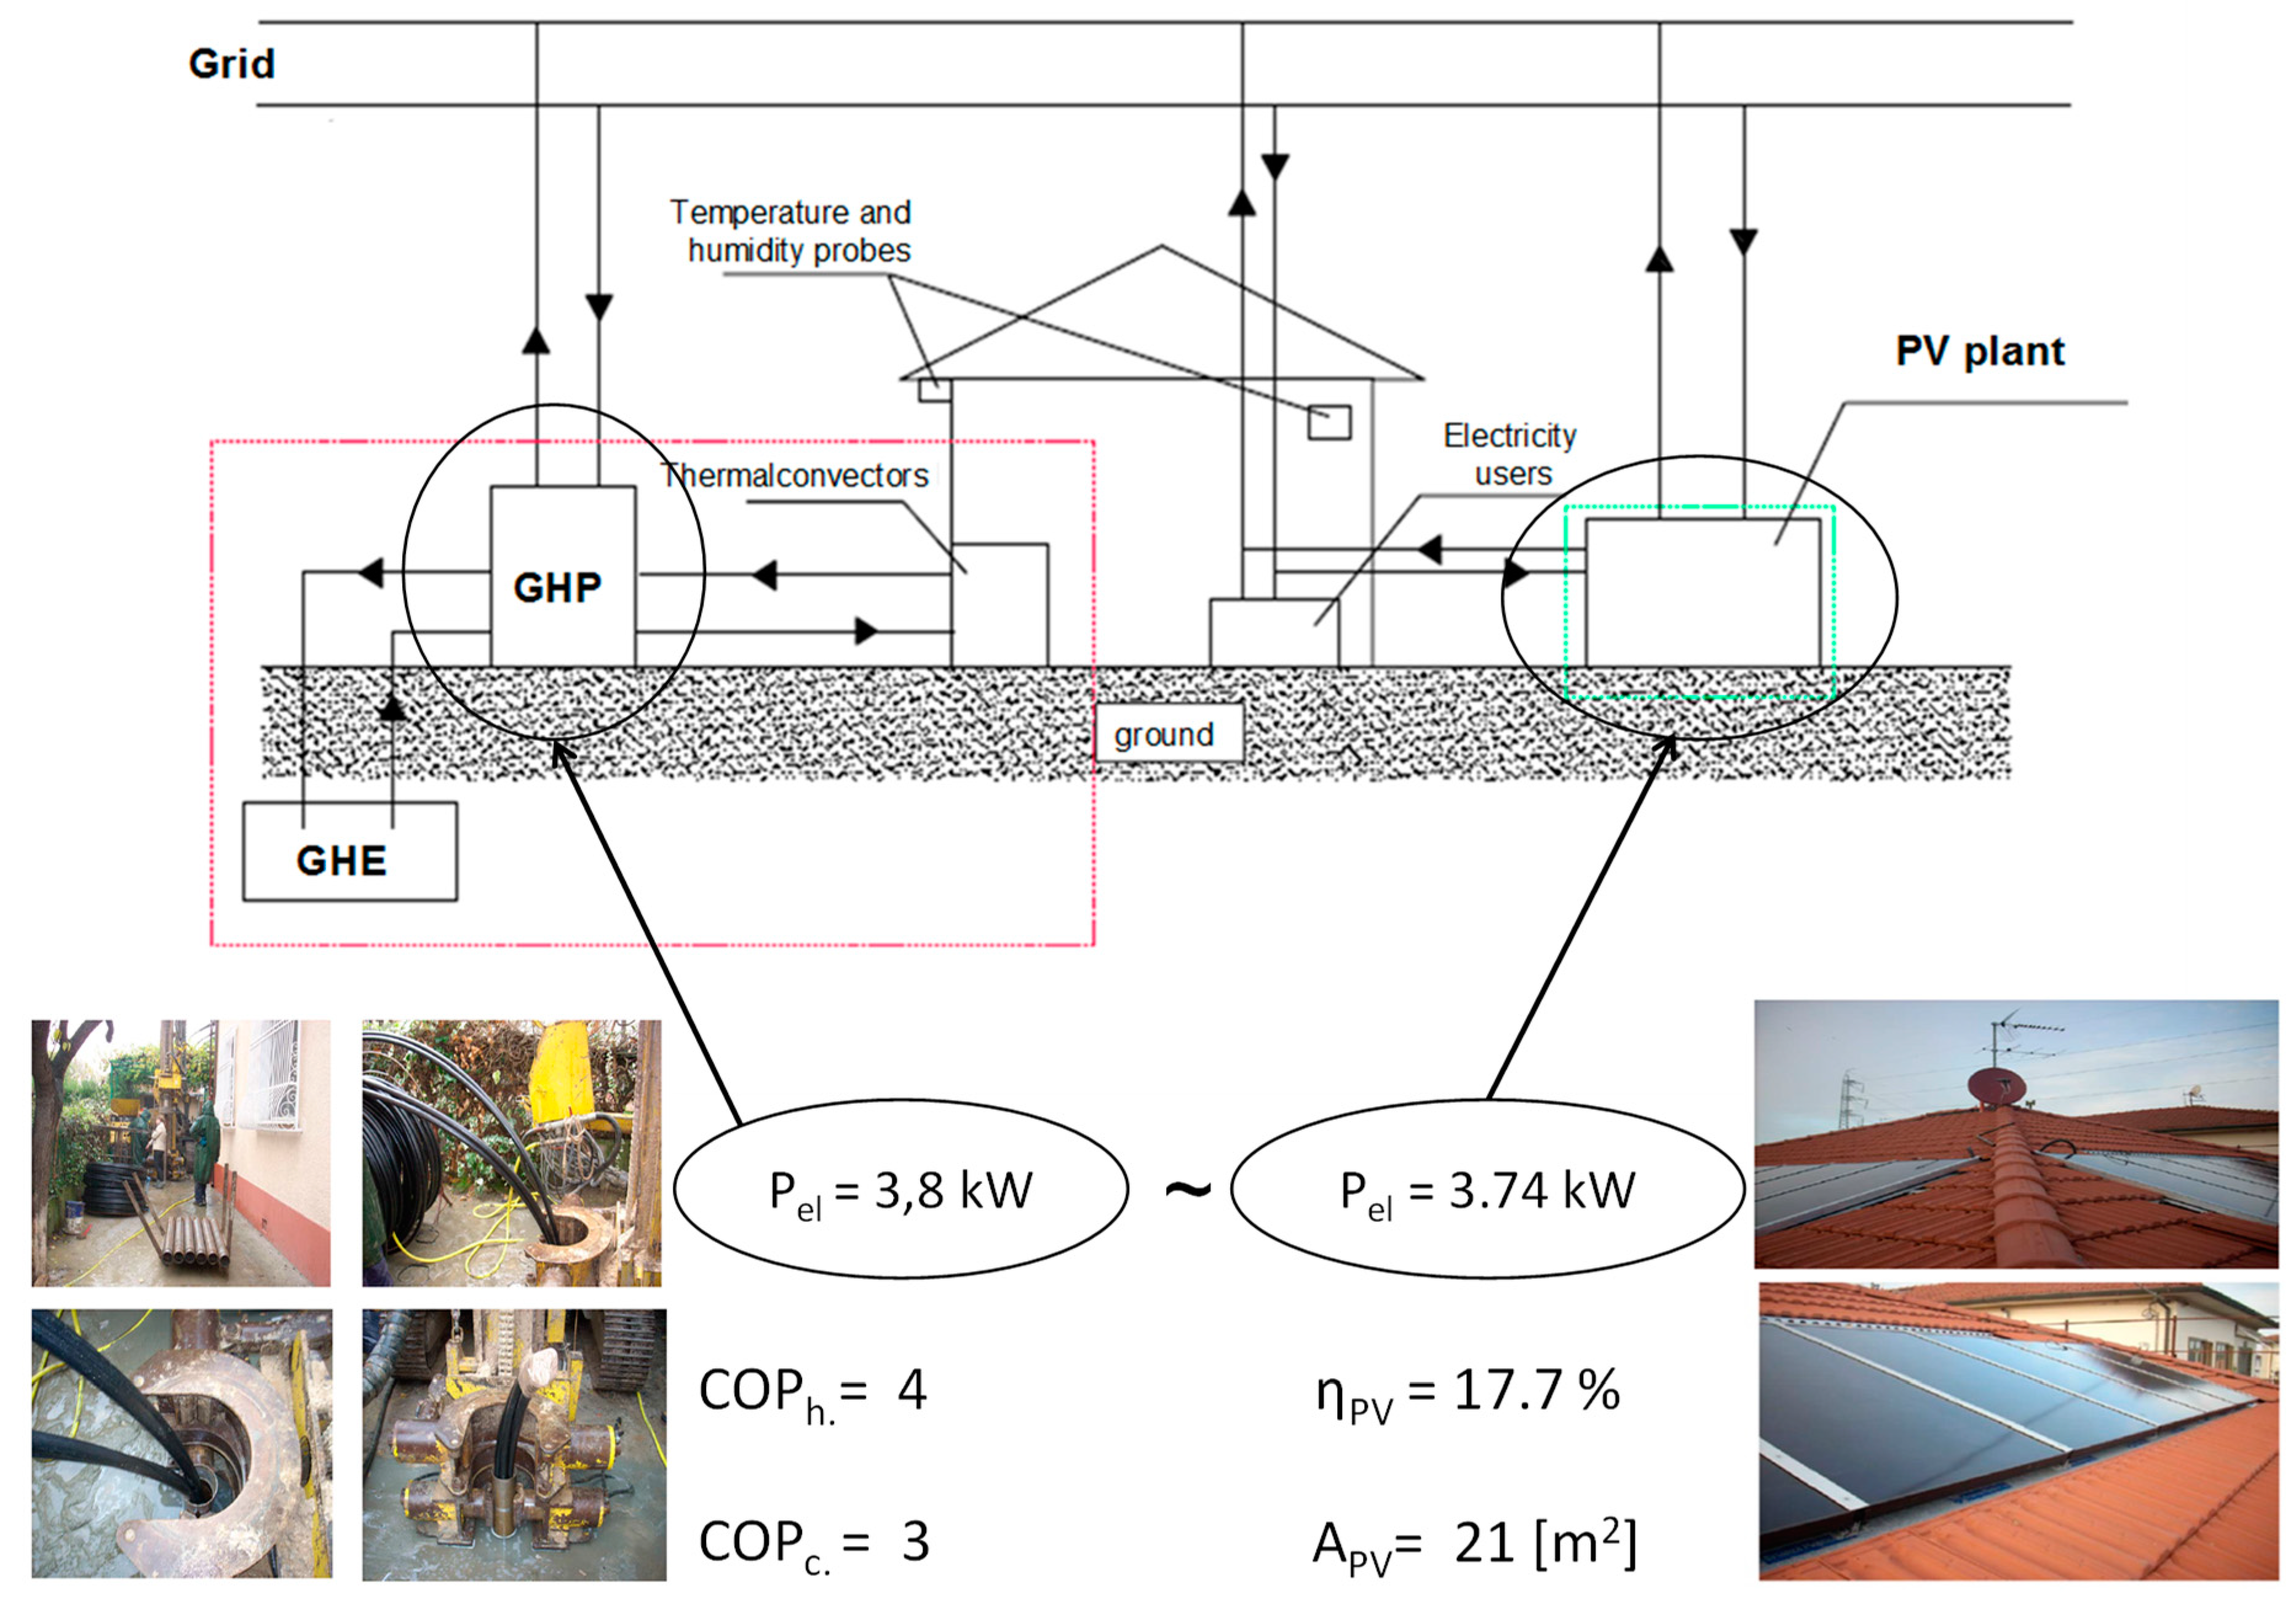
3. The heat pump installed is a typical “three circuit” type ground heat pump (GHP) system, in which the fluid (water and salt) that circulates in the borehole heat exchanger is different to the fluid circulating in the HP (R407) and the water that circulates inside the house.
The nominal electric power of the HP is 3.8 kW and it provides up to 15.2 kWh of space heating for the entire building, while reverse cycle technology will also provide cooling during summer with a maximum load of 11.4 kWh. The plant is composed of the HP and ground probes as well as a PV system directly connected to the power grid by means of an inverter. The plant was realized in the framework of the “Conto-Energia” support policy, active in Italy from 2006 to 2015. No storage systems had been installed at the time because the priority dispatch policy active in Italy permitted the export of excess electricity produced by the PV plant to the electric grid. The PV plant was sized according to the maximum output power required by the heat pump; thus, the peak power of the PV plant (3.7 kW) and peak electric power required by the heat pump (3.8 kW) are similar. The main characteristics and nominal data of the modules used for the PV plant are provided in
Table 1. As additional data, it is possible to include the temperature coefficient of the plant, that is, the value of 0.38%/°C is declared for the modules if the operating temperature of the module is above 25 °C. Specifically, the nominal operating temperature of the module is 46 °C.
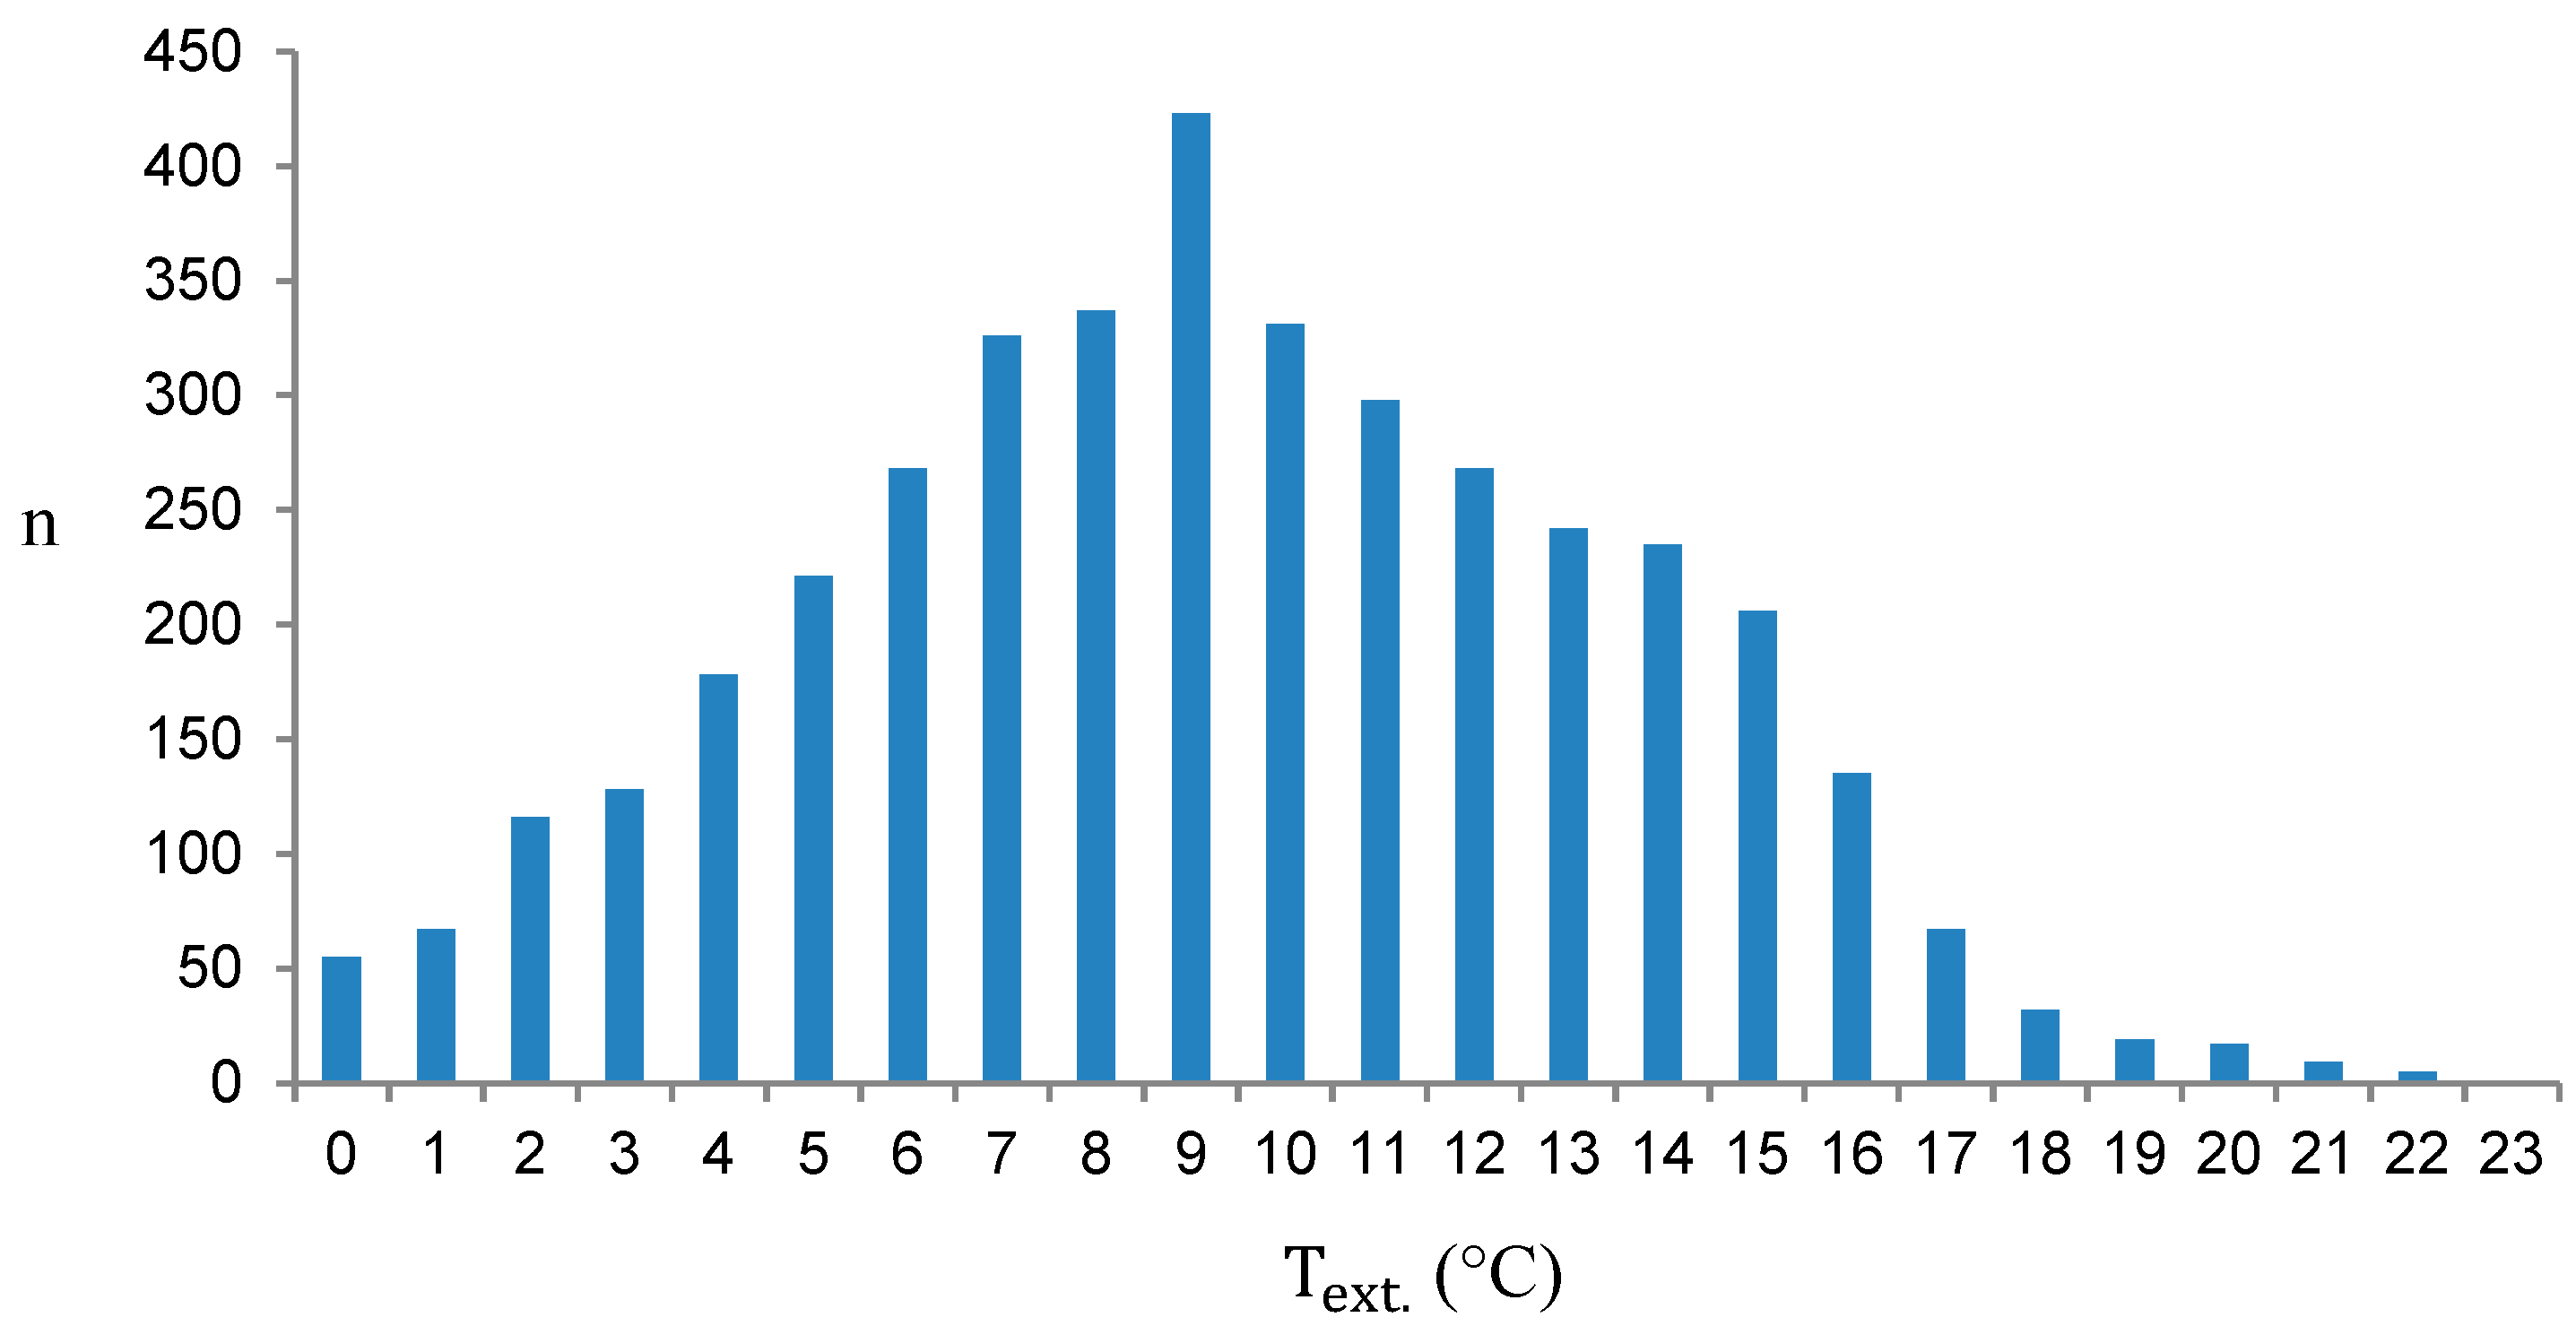
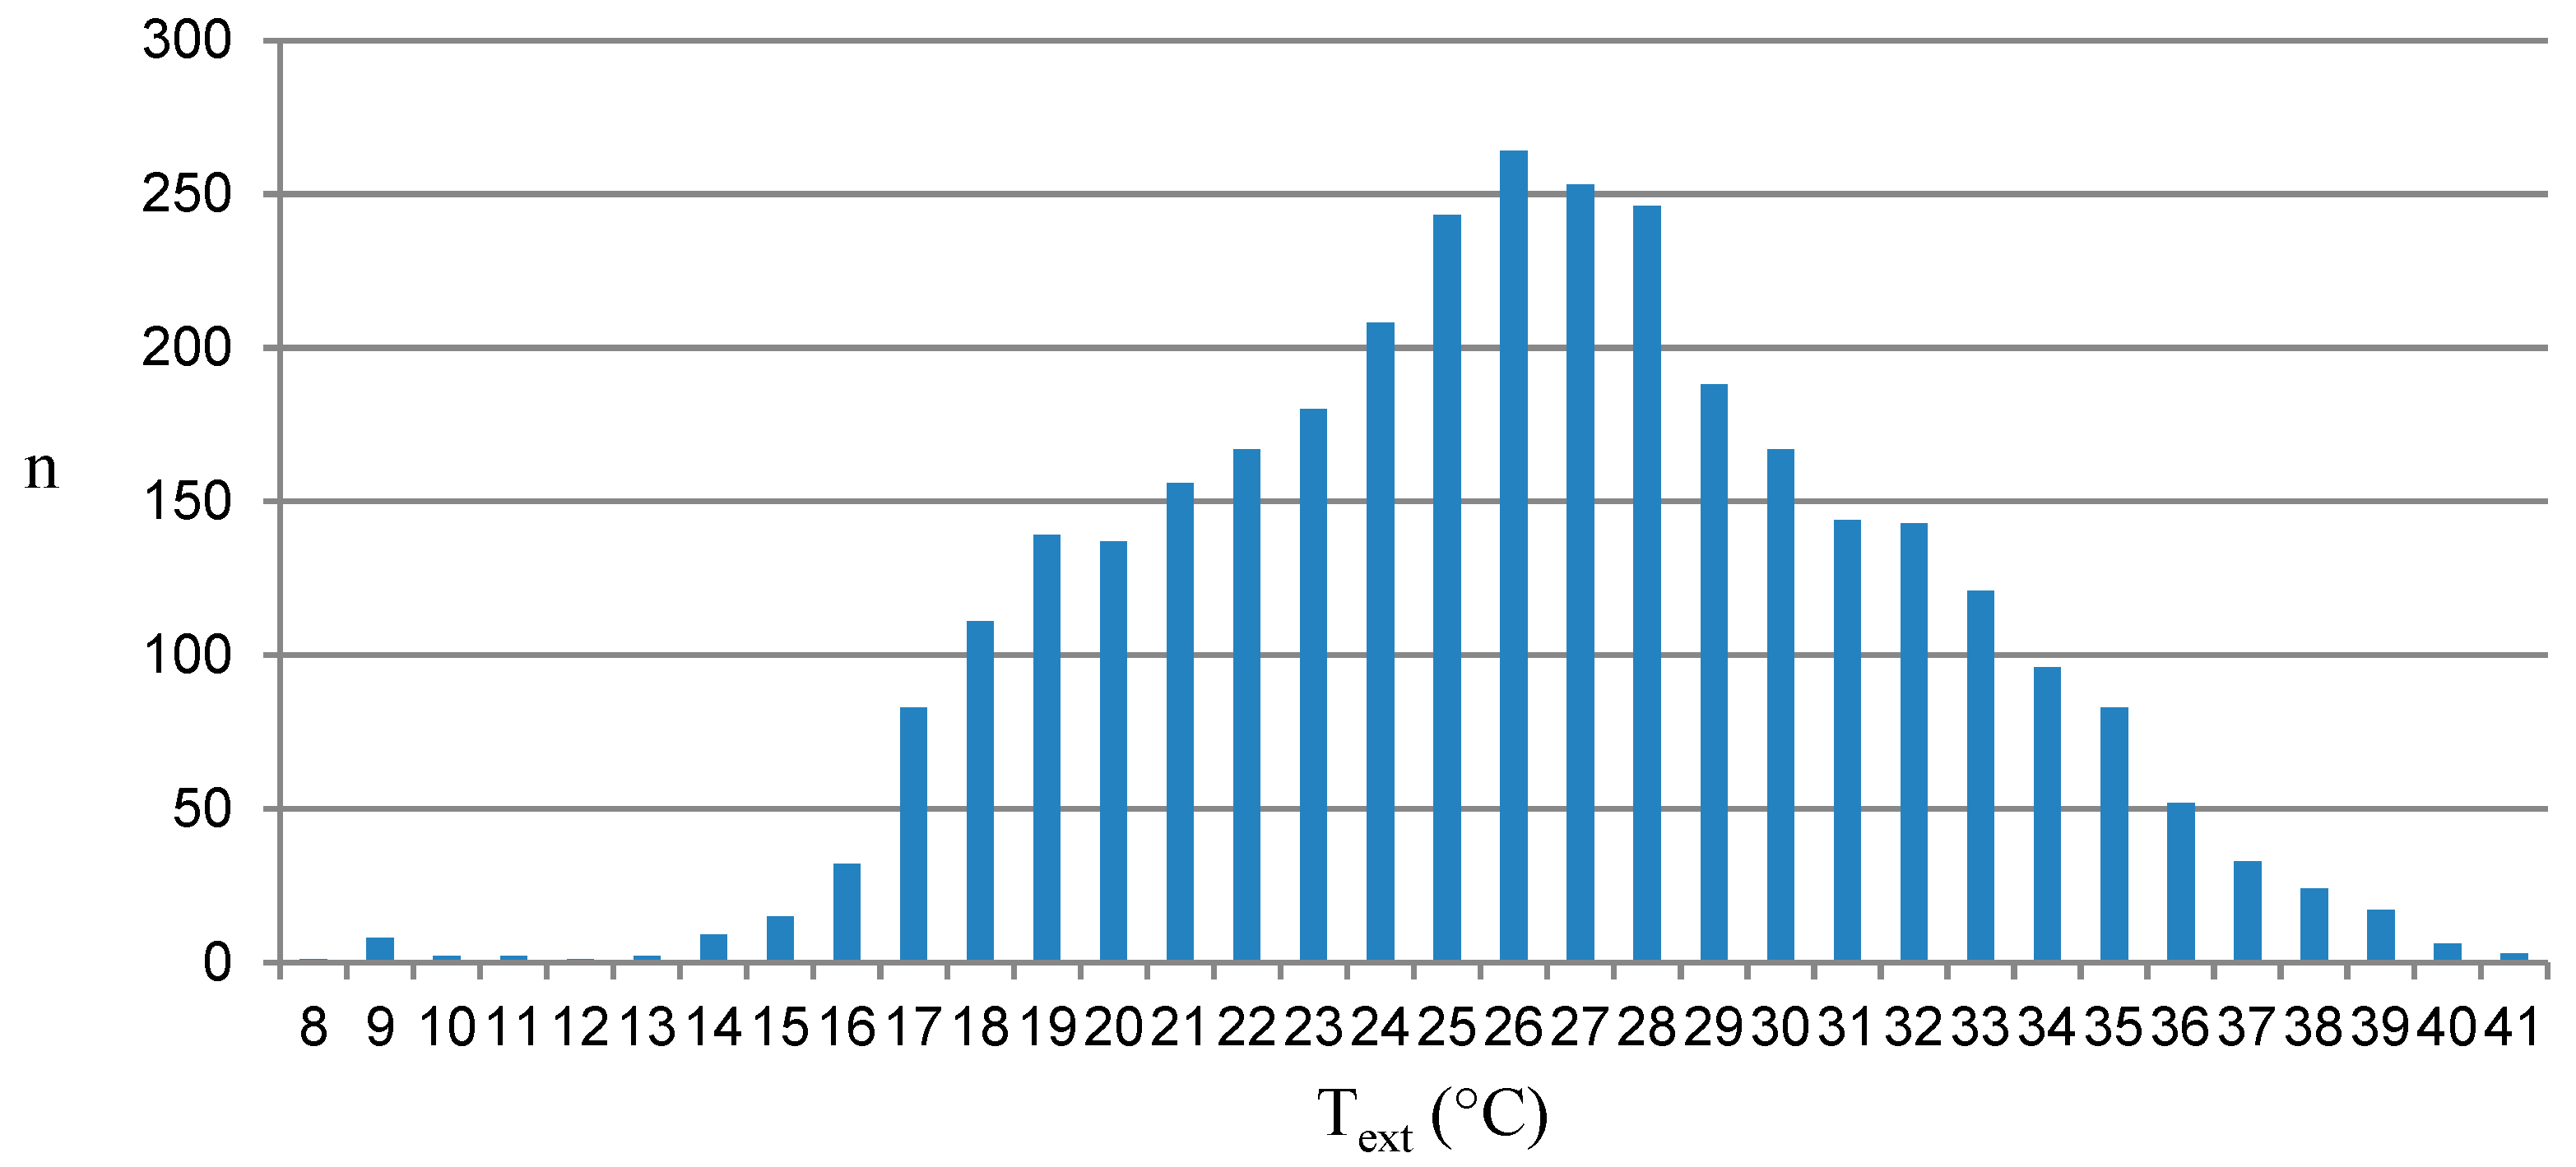
The typical climatic conditions of Pisa are shown in
Figure 2 and
Figure 3 for the heating and cooling period, respectively.
Figure 2 provides the distribution of the external temperature, showing the number of hours the selected temperature can be observed. The value of the temperature is provided considering a range of variation of 1 °C, while on the ordinate axis, the number of hours is characterized by a well-defined average temperature value. The period from 15 October to 15 April is considered.
Figure 3 provides the same distribution for the hot season (considering the period from 15 May to 30 September).
Pisa is characterized by a total annual irradiance of 1500 kWh/m
2, for a surface with a south-facing aspect. Using modules of high quality that are well exposed, the expected PV value could correspond to 1100–1150 kWh for each kW of peak power installed for each year of operation for a poly-crystalline high-quality PV plant. Considering the HP used, this is a commercial heat pump that uses R-407 as the refrigerant; the heating COP in nominal conditions is four, while the cooling COP is approximately three. In terms of the HP, the condenser temperature was 35/30 °C while the evaporator temperature was considered 0 °C. The geothermal heat exchanger is of the borehole type with a total depth of 50 m. The total length of the borehole heat exchanger is 200 m, this value was obtained using a reference value of 50 W/m for the heat transfer value. The criterion used for the design was that the energy output from the PV plant should be able to completely assist the operation of the GHP (for cooling purposes) and the consumption of all remaining electrical devices during the hot period. In the remaining part of the year, a relevant exchange of energy (from and to the power grid) could be possible. A schematic diagram of the system and its operational logic are provided in
Figure 4. According to the description, the energy produced by the PV plant, as measured by a counter, can be directly used by the various electrical devices or exported to the electrical grid. Energy used by the HP is measured with an additional counter. Other relevant additional data can be measured including the internal and external temperature (using thermocouples) and relative humidity inside the house.
Some relevant data concerning the operation of the system can be directly measured or derived. The total energy imported from the power grid, ETOT, corresponds to the whole energy used in the house. The energy imported from the grid, EIMP, corresponds to the periods during which no production of the PV plant was available, or there was less energy than the total required. The energy exported to the power grid, EEXP, reflects periods of excess energy production. A specific counter enabled us to directly measure the energy used by the GHP (EGHP) and another counter measured the energy produced by the PV plant, EPV, and directly exported to the power grid.
The energy produced can be easily compared with the value that was estimated as the product of the annual solar irradiation typical for the specific place at a given exposure,
HSN, of a balance of system efficiency,
ηBOS, taking into account the various electrical losses in the system, and the peak power of the PV plant,
PPV.
The maximum production of a PV system expressed in kWh/kW in the specific place and the annual solar irradiation is a consequence of the fact that the nominal power of the PV plant is calculated considering a specific solar power of 1000 W/m2, a value referred to in the standard test conditions.
Considering the two values of the energy used in the house,
ETOT, and energy used by the GHP,
EGHP, it is easy to evaluate the energy used by the other electrical devices.
For each day and each period of the year, using the results of the measurement, it was possible to evaluate the energy exchanged with the power grid to understand how close the system is to the model of a zero-energy building (ZEB) and the amount of energy exported,
EEXP, or imported from the power grid,
EIMP, according to the following definitions:
The value of the energy produced with the PV plant and directly used,
ED, can be calculated by
The share of the energy produced by the PV plant and directly used in the building, measured with the dimensionless coefficient,
IU, can be defined as
where values range from zero to one. The ideal system would be the one in which the energy produced is directly used in the building, so that
IU approaches unity.
The energy consumption, energy required by the HP, E
GHP, and energy required by the rest of the household devices, E
DEV, as well as the size of the operation, are reported in
Table 2.
In a reference period of operation of the plant, it is possible to understand how the total production of the PV plant, EPV, is approximately the same as that required both for the operation of GHP and of the other devices (1399 kWh and 1448 kWh, respectively). While during the period from April to June the PV production was higher than the total energy consumption, during the other periods (autumn: from October–December, and winter: January–March) the PV production was insufficient to power the GHP and all the other devices.
In order to obtain a kind of parity, considering the energy totally produced along the whole year, an oversizing of the PV plant of a factor 1.5 (with a peak power of 5.5 kW corresponding to a 25 modules), while in the perspective of covering the electricity required in the period from October to March, could be necessary to increase the size of the PV plant. In this last case, it would be necessary to install a power plant with a power over 10 kW (for example, 13.4 kW—equivalent to 61 modules). In this case, the energy exported to the grid would drastically increase, causing an impact on the power grid.
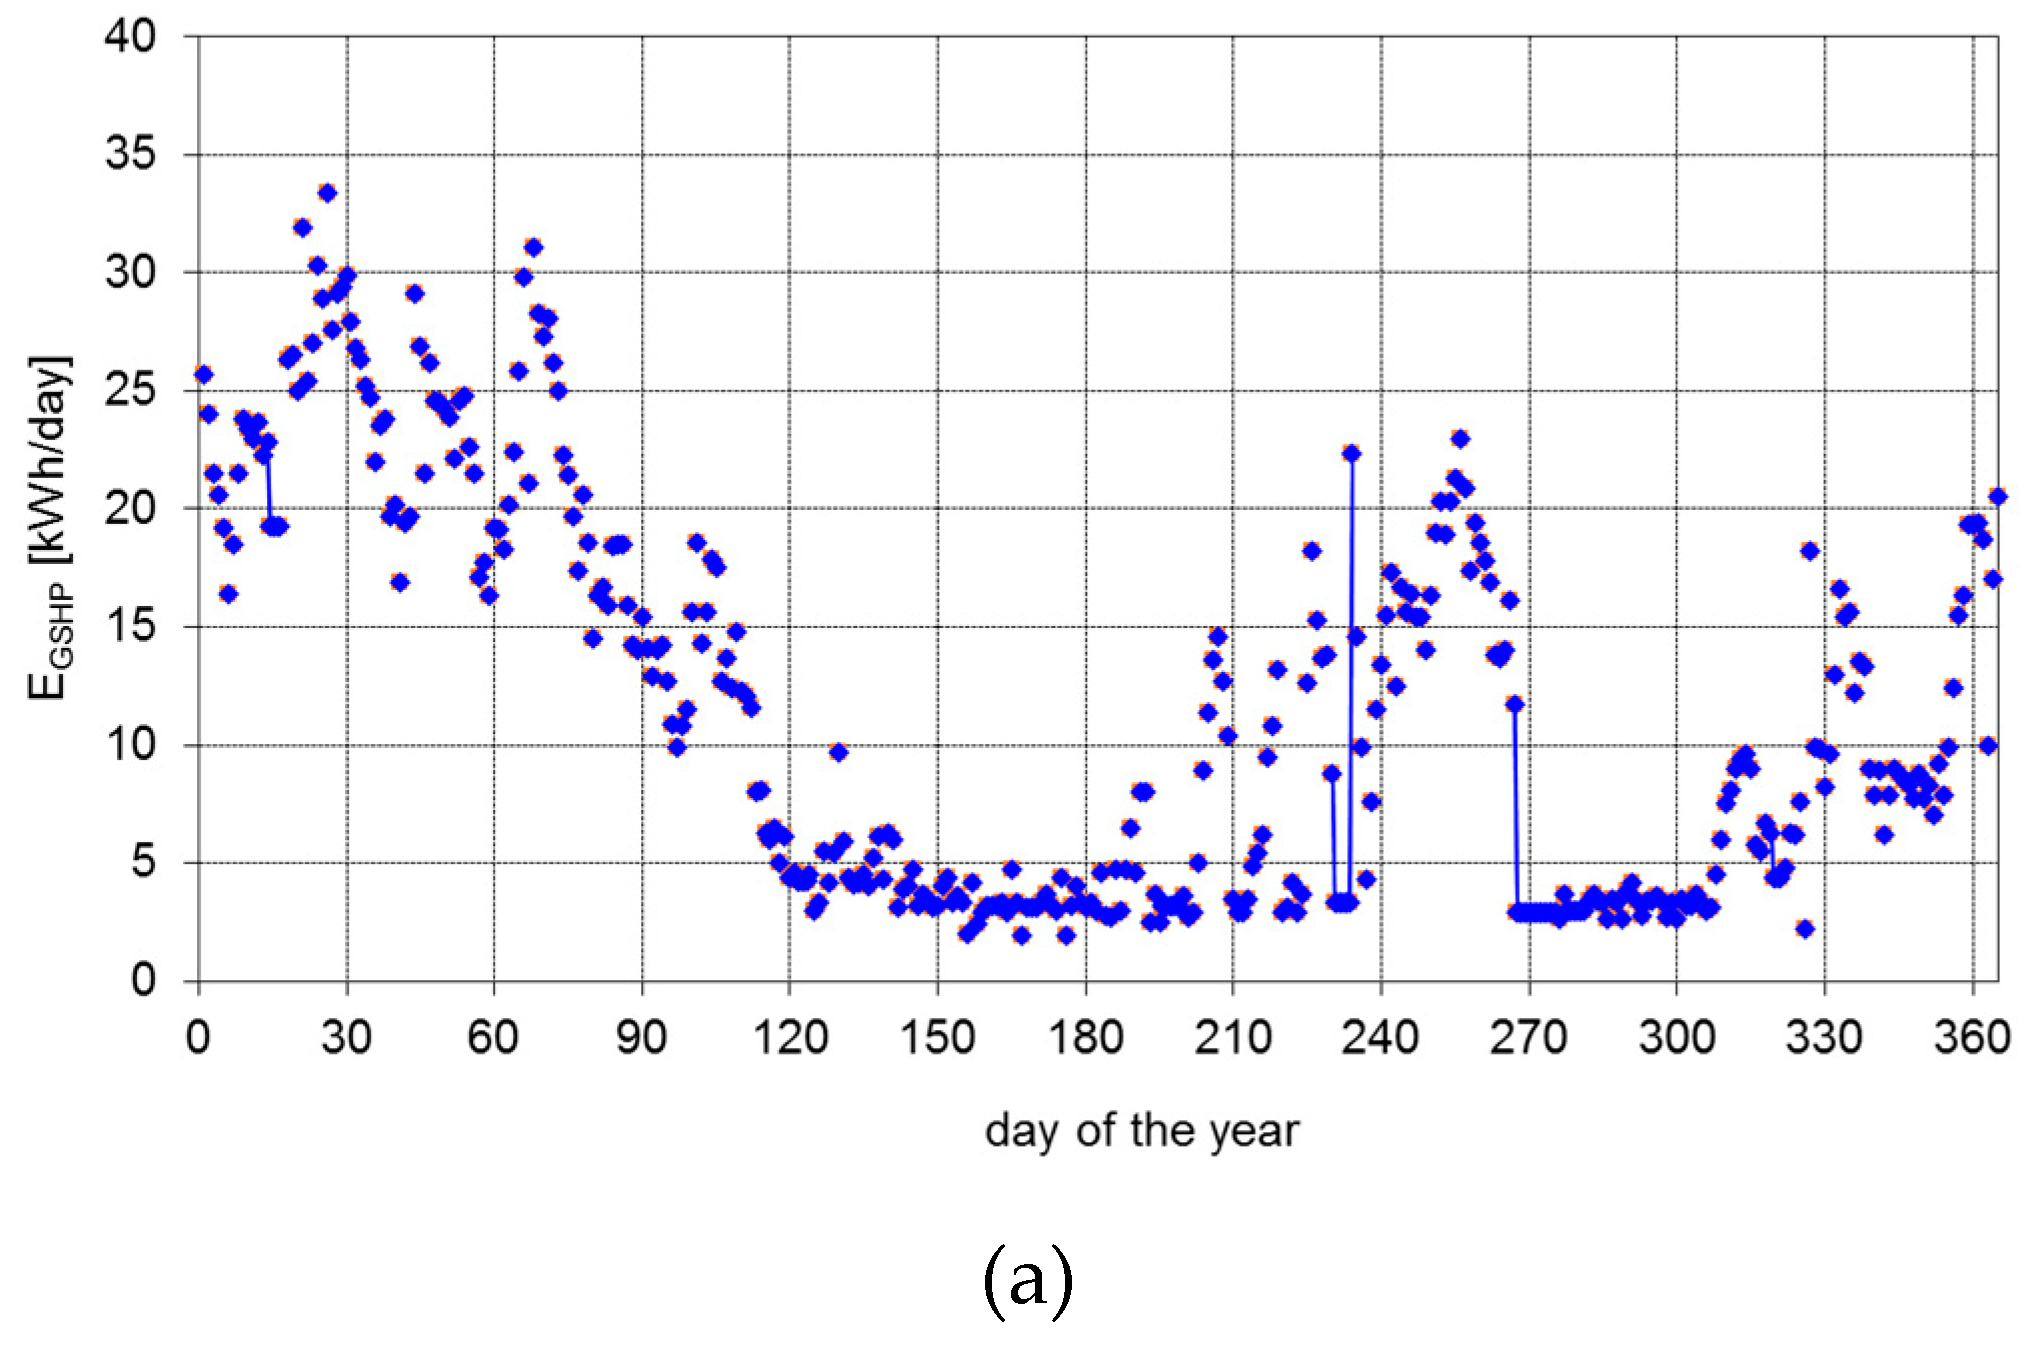
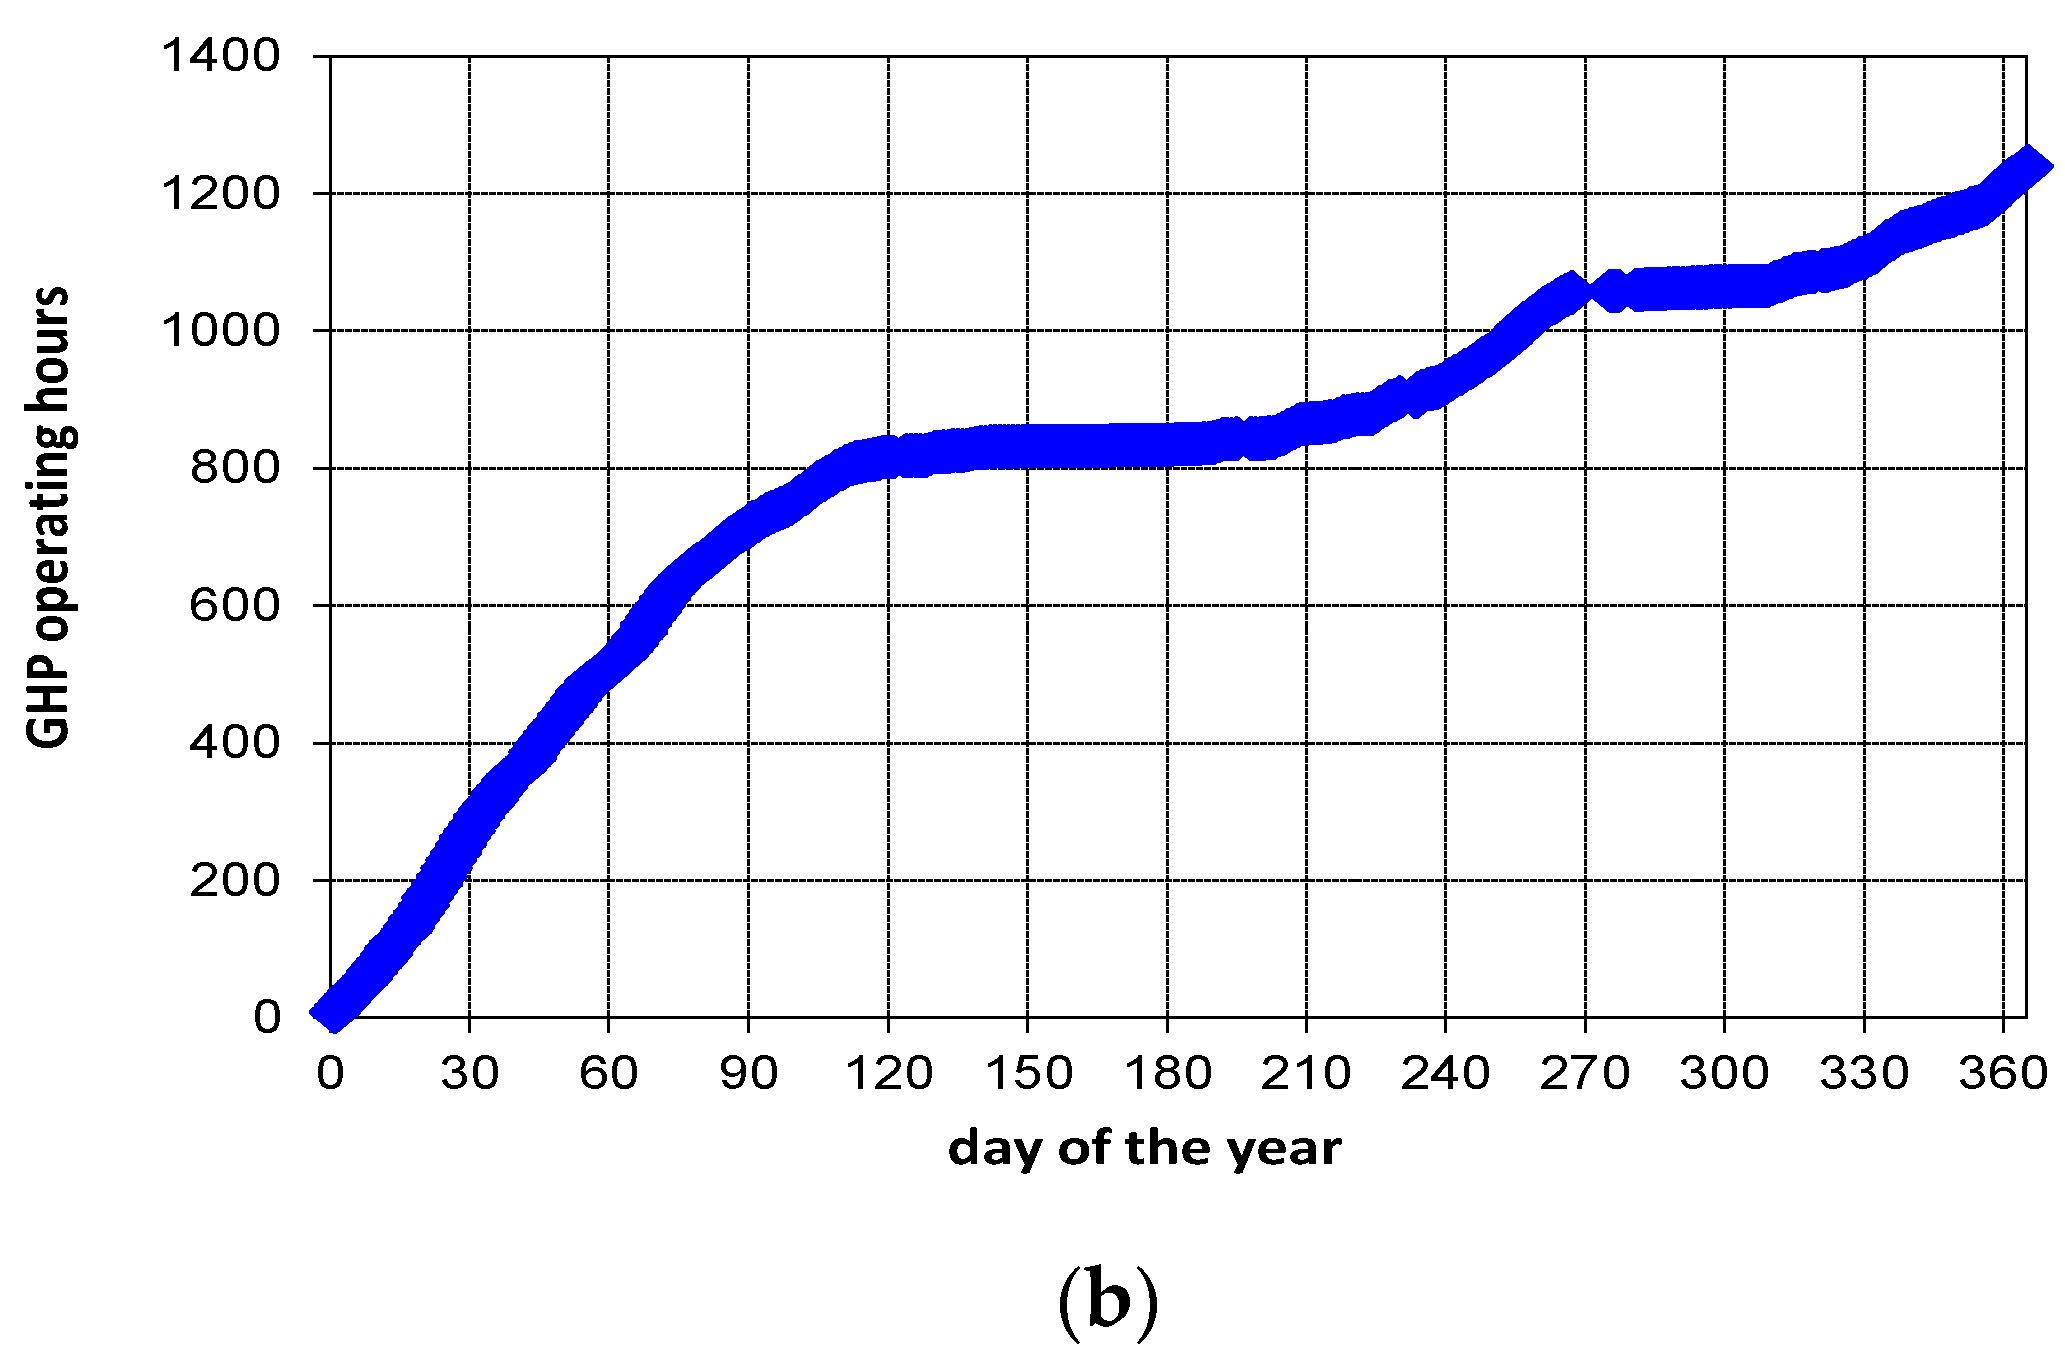
The operation of the HP during the year, including both the heating mode and cooling mode, is described in
Figure 4. The electricity consumption values range from a lower value of 2–3 kWh/day, typical of the mid-season period, when the heat pump is used only for the production of sanitary hot water, up to values just below 35 kWh/day, typical of the winter season, when there may be 10 h of operation per day. A good operation of the heat pump was evaluated in the winter phase, while during the summer cooling period, the COP value was slightly lower than the nominal one. During the heating phase, a monthly average power value was found to be very close to the nominal value, which does not exist in the cooling phase when the heat pump works frequently in ON–OFF mode and the transient phase is therefore not negligible.
Figure 5 provides the daily consumption and corresponding operating hours of the GHP throughout the year. The energy required for summer air conditioning is approximately a third of the energy required for the winter period, and the maximum energy required for the operation of the HP occurs during the winter period, when the production of the PV plant is at its lowest levels.
A further element of discussion concerns the results of the data obtained during long-term monitoring of a building–plant system.
Table 3 shows the distribution of the various energy flows in the different years of operation of the experimental plant to verify the weak points and possible improvements that could be obtained for the integrated system under analysis. It can be observed that, while during winter (mainly in December and January) PV production was insufficient for supporting the operation of GHP, in summer (from June to September) the production of PV is sometimes excessive. It is interesting to analyze the behavior of the system during the period between the hot and cold seasons, that is, from February to May and from October to November. The data reported in
Table 3 provide a summary of the various electricity consumptions within the system. We evaluated the electricity consumption of the house and the production of the PV system, during the years from 2013 to 2017, to compare them with 2009, the first year of operation. Considering the energy produced by the PV plant, the values are similar to those calculated using Equation (1), considering a value of
ηBOS approximately equal to 0.75–0.8. As is evident from the analysis of the data, the PV plant has operated in quite a satisfactory way, even though some differences among the various years can be observed. Differences can be measured by the value of the difference between the maximum and the minimum value of the production, divided by the average production rate, defined as
Based on the data in
Table 4, this value was about 8.5%, which could be connected to the different weather conditions and the degradation of the modules over time.
With regard to the HP, it appears to be oversized for the particular operating conditions. As discussed before, the longest daily running time is 12 h during the coldest day of the year, but on most days the heat pump operates for a reduced number of hours (usually less than two).
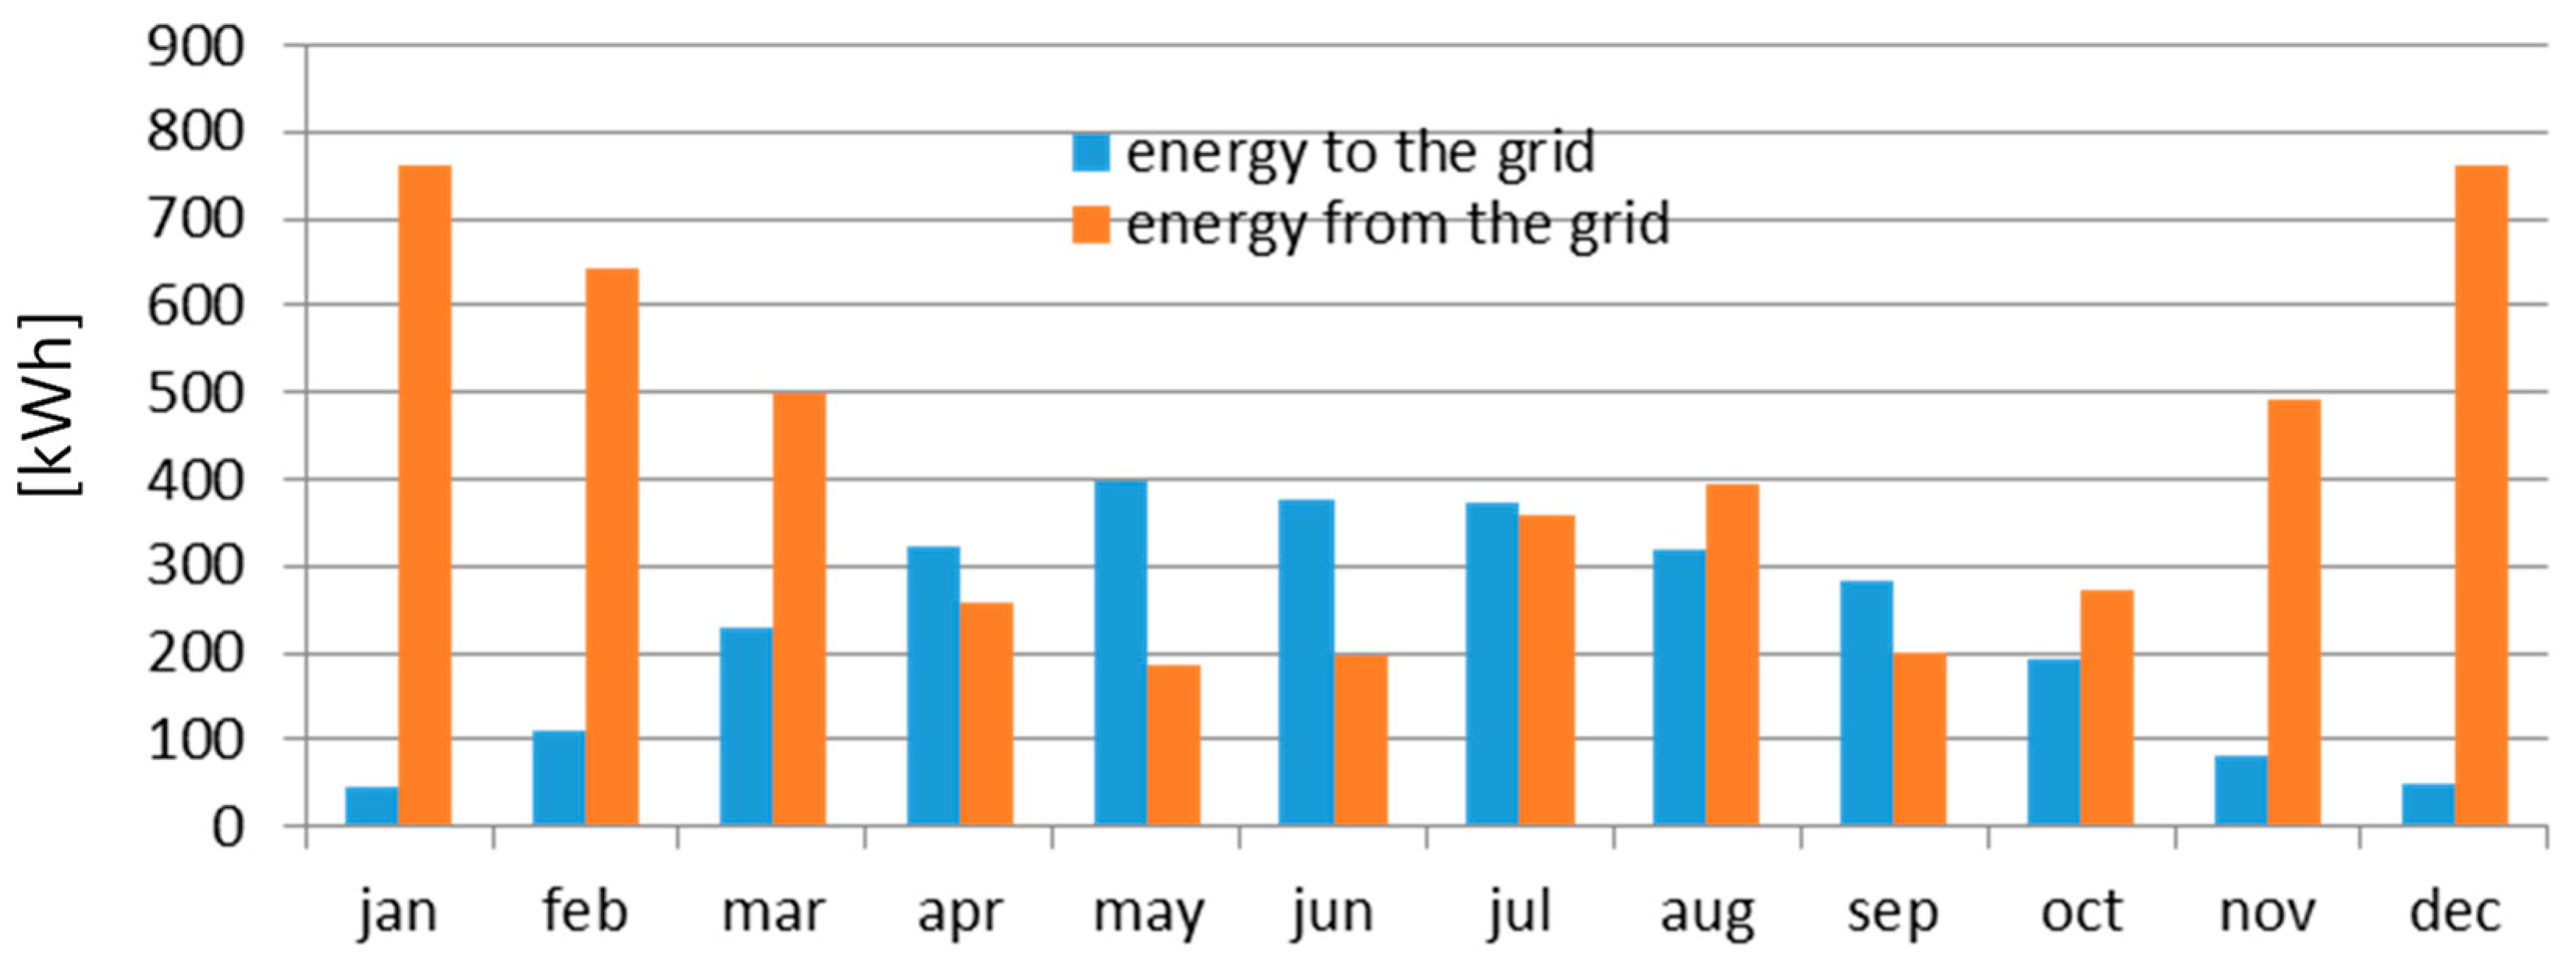
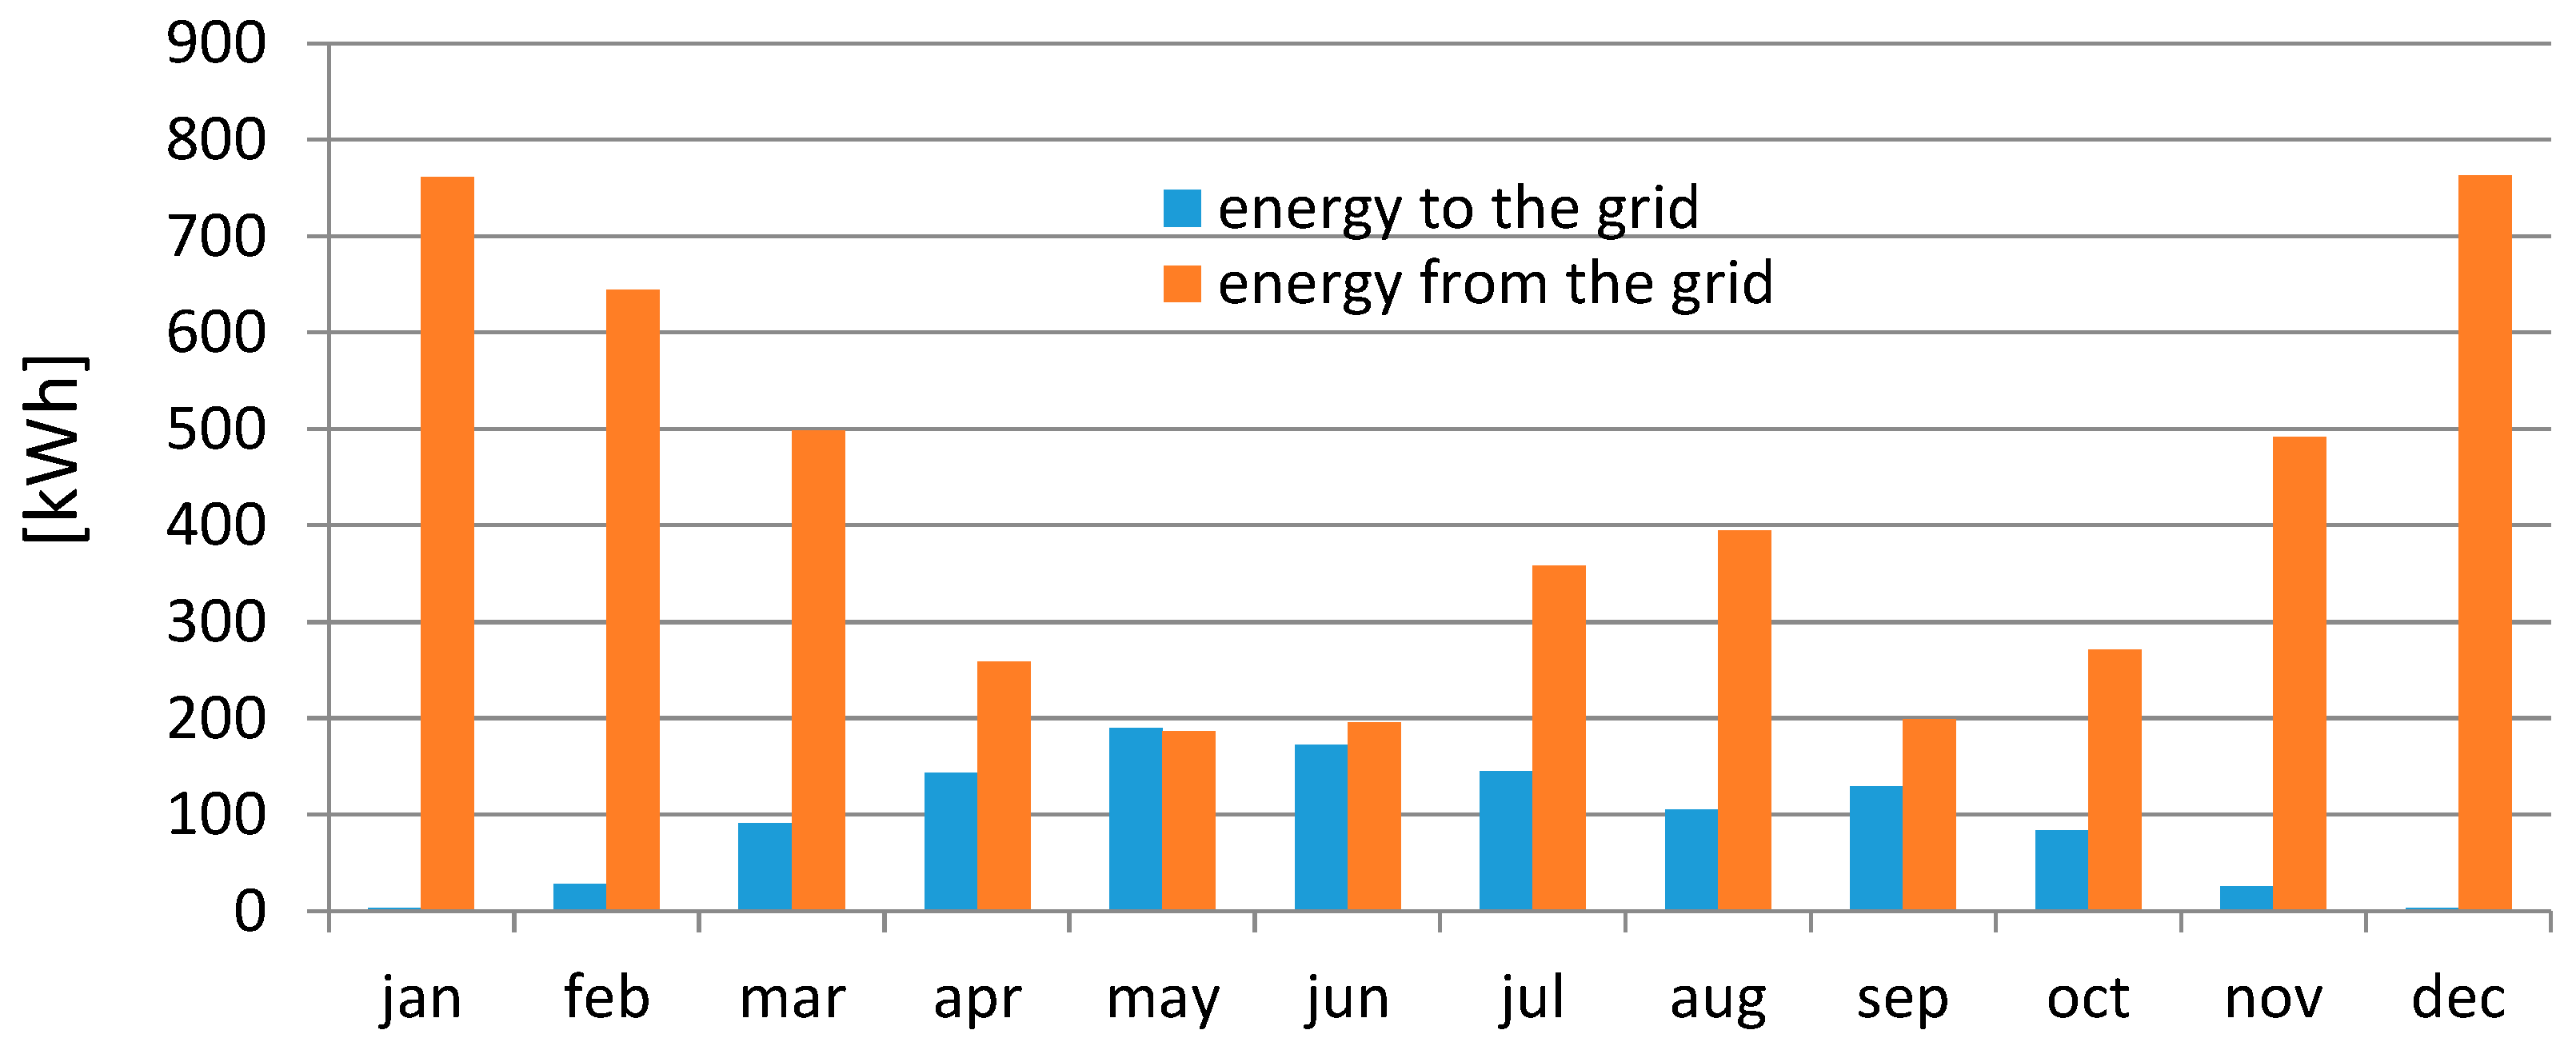
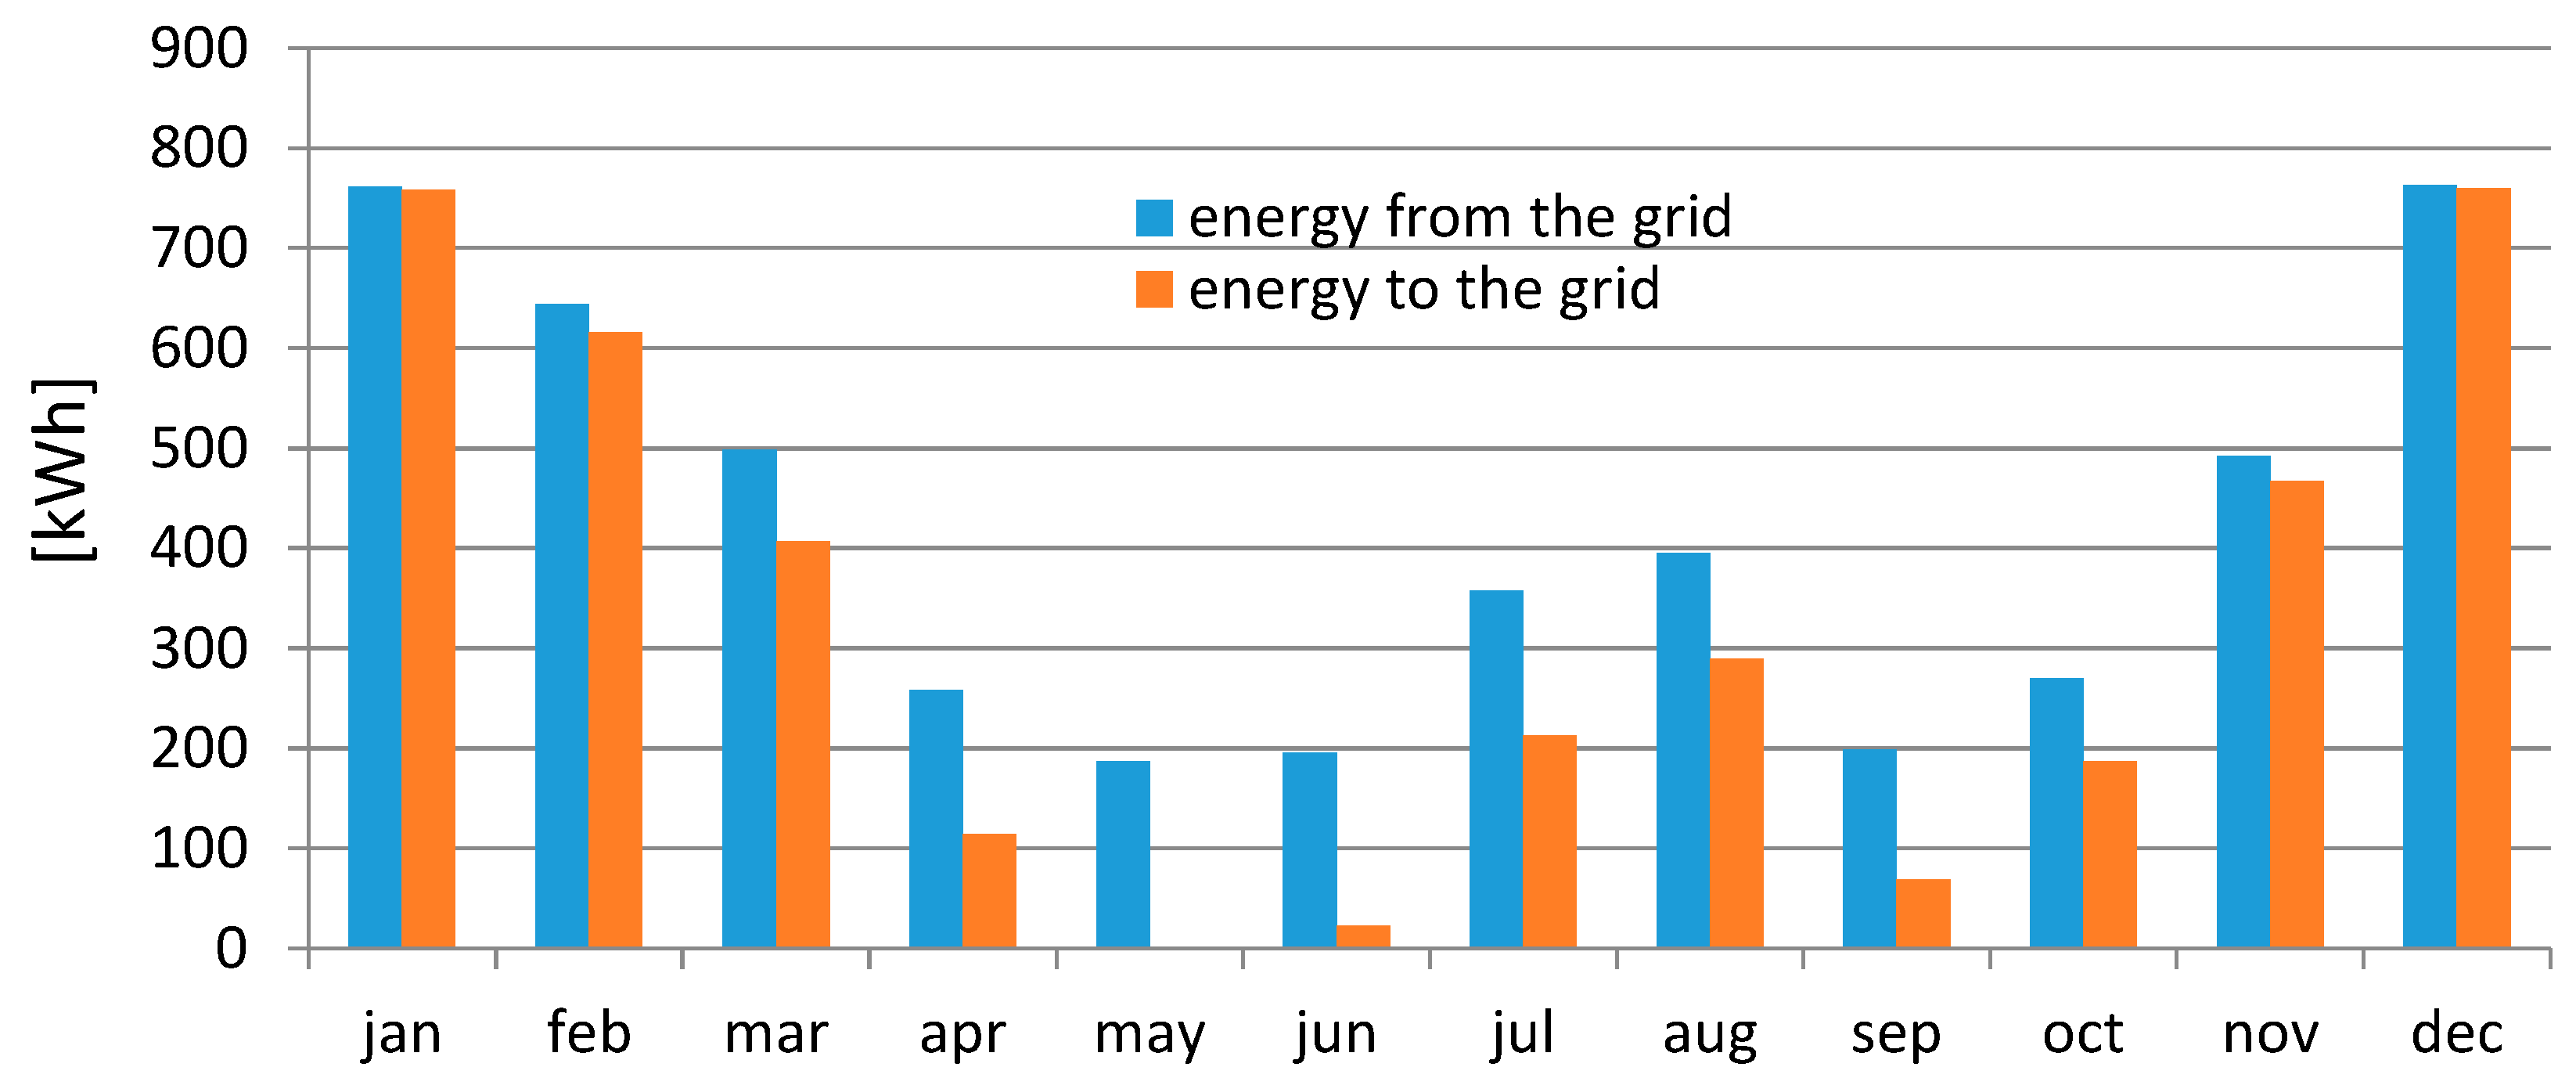
The data, acquired over more than eight years of operation, demonstrate that the energy consumed by the GHP and the energy produced by the PV array are similar if the total amount is considered, and that the energy exchange with the electricity grid is relevant. Considering an average year of the five from 2013 to 2017, the average values of the energy exported to and imported from the grid in the various months of the year are provided in
Figure 6.
Table 5 provides the average values of the energy flows from January to December. Considering the data of
Table 5, the index of direct utilization of the energy produced by the PV plant, I
U, can be approximately estimated with a maximum level (0.55–0.56) in the winter and the minimum value occurring in May (average, 0.21).
5. Discussion and Guidelines for the Sustainable Sizing of a PV-HP System
As a result of the analysis we carried out, here we pick out the general elements of discussion and criteria that may help set guidelines for the design of similar systems, that is, an integrated system including a heat pump (HP) and photovoltaic (PV) system, with the possible addition of storage (either electrical or thermal).
An important preliminary step is the definition of the thermal load of the building and its fluctuations over the annual cycle. This can be achieved by means of a dynamic simulation or considering a typical value of the heat transmission, which defines the type of building and the test reference year (TRY), which defines the climate in the area, given by an average value of the heat trasmittance of the building (UA expressed in W/K). This information facilitates the determination of the average power of the heat pump and it is possible to calculate the electricity that is needed to supply the building to meet its thermal demand. Once the size of the HP has been determined, it is possible to define various options to satisfy the project’s specific objectives:
- (1)
The nominal power of the PV plant is similar to the nominal power of the HP: in this case, a relevant amount of the energy produced needs to be exported to the grid or will be wasted.
- (2)
The nominal power of the PV plant can be considered as about 70% of the peak power of the GHP to reduce the amount of energy exported to the grid (or wasted), without increasing the energy imported from the grid.
- (3)
The nominal power of the PV plant must be about 70% of the peak power of the GHP and an electricity storage system of 3 kWh for each kW of PV plant installed would be required to reduce energy waste to a level below 10%.
- (4)
The energy produced with the PV plant is approximately the same as that required by the GHP and the other devices: in this case, the peak power of the PV plant is approximately 50% over the electric power of the GHP and a storage system of 2 kWh for each kW of PV plant installed would be necessary.
- (5)
The PV plant energy production needs to cover the total energy use of the house: in this case, an oversizing of the PV plant is necessary (9–10 times the peak power of the HP), and a storage system (about 0.7 kWh for each kW installed) must be introduced.
Obviously, the previous statements are fairly specific to the case under analysis. To discuss more general elements, it could be necessary to take into account the variation of solar radiation, the type of PV module selected (and its relative performances), and all the other constraints. In general, two different optimization criteria can be considered. The first leads us to minimize energy losses by introducing an additional penalty to the surplus energy produced by the modules, which cannot be directly used in the building. In this case, a reduction in the PV plant size is desirable. An alternative criterion considers not the relevant the energy losses and the overproduction of the PV plant, but is particularly dependent on the cost of the electricity imported from the grid. In both cases, the definition of the size of the storage system is particularly important.
It should be noted that these considerations are primarily connected with the specific climatic condition under analysis. While one might discuss the potential change to our findings in the case of different climatic conditions, it seems clear that the considerations outlined here will be quite similar regardless of climatic conditions.
6. Conclusions
We first analyzed data obtained from the real operation of a building–plant system consisting of a domestic PV plant of reduced size that was supporting a GHP for heating and cooling. We attempted to develop criteria and guidelines for the correct sizing of such systems from the perspective of obtaining effective self-production of energy.
The experimental analysis in Pisa, Italy, with typical Mediterranean-climate conditions, covers a period of about ten years of operation (2009–2018), with particular attention to the last five years. From the analysis, it is possible to conclude that it is difficult to obtain self-consumption schemes and real net zero-energy building configurations due to the time between energy production and energy use. Considering the experimental data acquired during the 10 years of operation, it was observed that 30% of the energy produced by the PV plant was directly used by the GHP and the other miscellaneous devices during the year (a minimum of 26.5% was recorded in 2014 and a maximum of 33% was recorded in 2009). A large amount of the energy required by the GHP was imported from the electrical grid, mainly during winter, while an important amount of energy produced by the PV plant (67%–73.5%) was exported or lost, depending on whether or not electricity could be exported to the national electric grid.
In the second part of the paper, we concentrated on finding a solution to mitigate the effects of the time between the electrical production peak and the thermal power demand peak through the reduction in the size of the PV plant, and by the introduction of a storage system.
A reduction of about 30%–35% in the peak power of the PV plant (in this case using a plant with a peak power of between 2.2 and 2.6 kW ), combined with using a storage system of 6 kWh capacity, could reduce the need for exporting energy to the grid to almost zero. In this case, the majority of energy produced by the PV plant was directly used by the house appliances and energy was only imported from the grid. Solutions that considered using larger PV plants were also discussed. Excluding the case of a completely self-sufficient system (with a PV power of about 36 kW and a storage system of 26 kWh), an interesting compromise can be obtained with a PV plant of a larger size, in particular from 4.5 to 6 kW peak power. In all those cases, a combined use of a storage system of appropriate dimensions would be necessary. For a final comparison among the various optimized solutions, an economic analysis is required. Considering the pre-covid-19 pandemic scenario, the plant with a reduced size may be preferred for general development and promotion. Nevertheless, the new financial support for renewables applied to buildings (for example, Italy’s recent 110% “Ecobonus” financial support mechanism) leads us to consider the benefits of larger sized PV plants.
From a critical analysis of the experimental data collected from an existing system and based on our further analytical consideration, we provided some guidelines for the optimal combination of power rating of PV generators and energy capacities of thermal and electrochemical storage systems, and we outlined how to determine the size of the system in order to pursue specific design objectives. In any case, it will be important to make use of the energy produced, reducing the energy wasted.


