3. Results and Discussion
Figure S1 shows the typical X-ray diffraction pattern of the as-prepared Zr-Cu-Ag-Al alloy. It is clear that only a broad diffraction peak can be detected, which represents a crystal free structure. The representative creep load versus displacement (
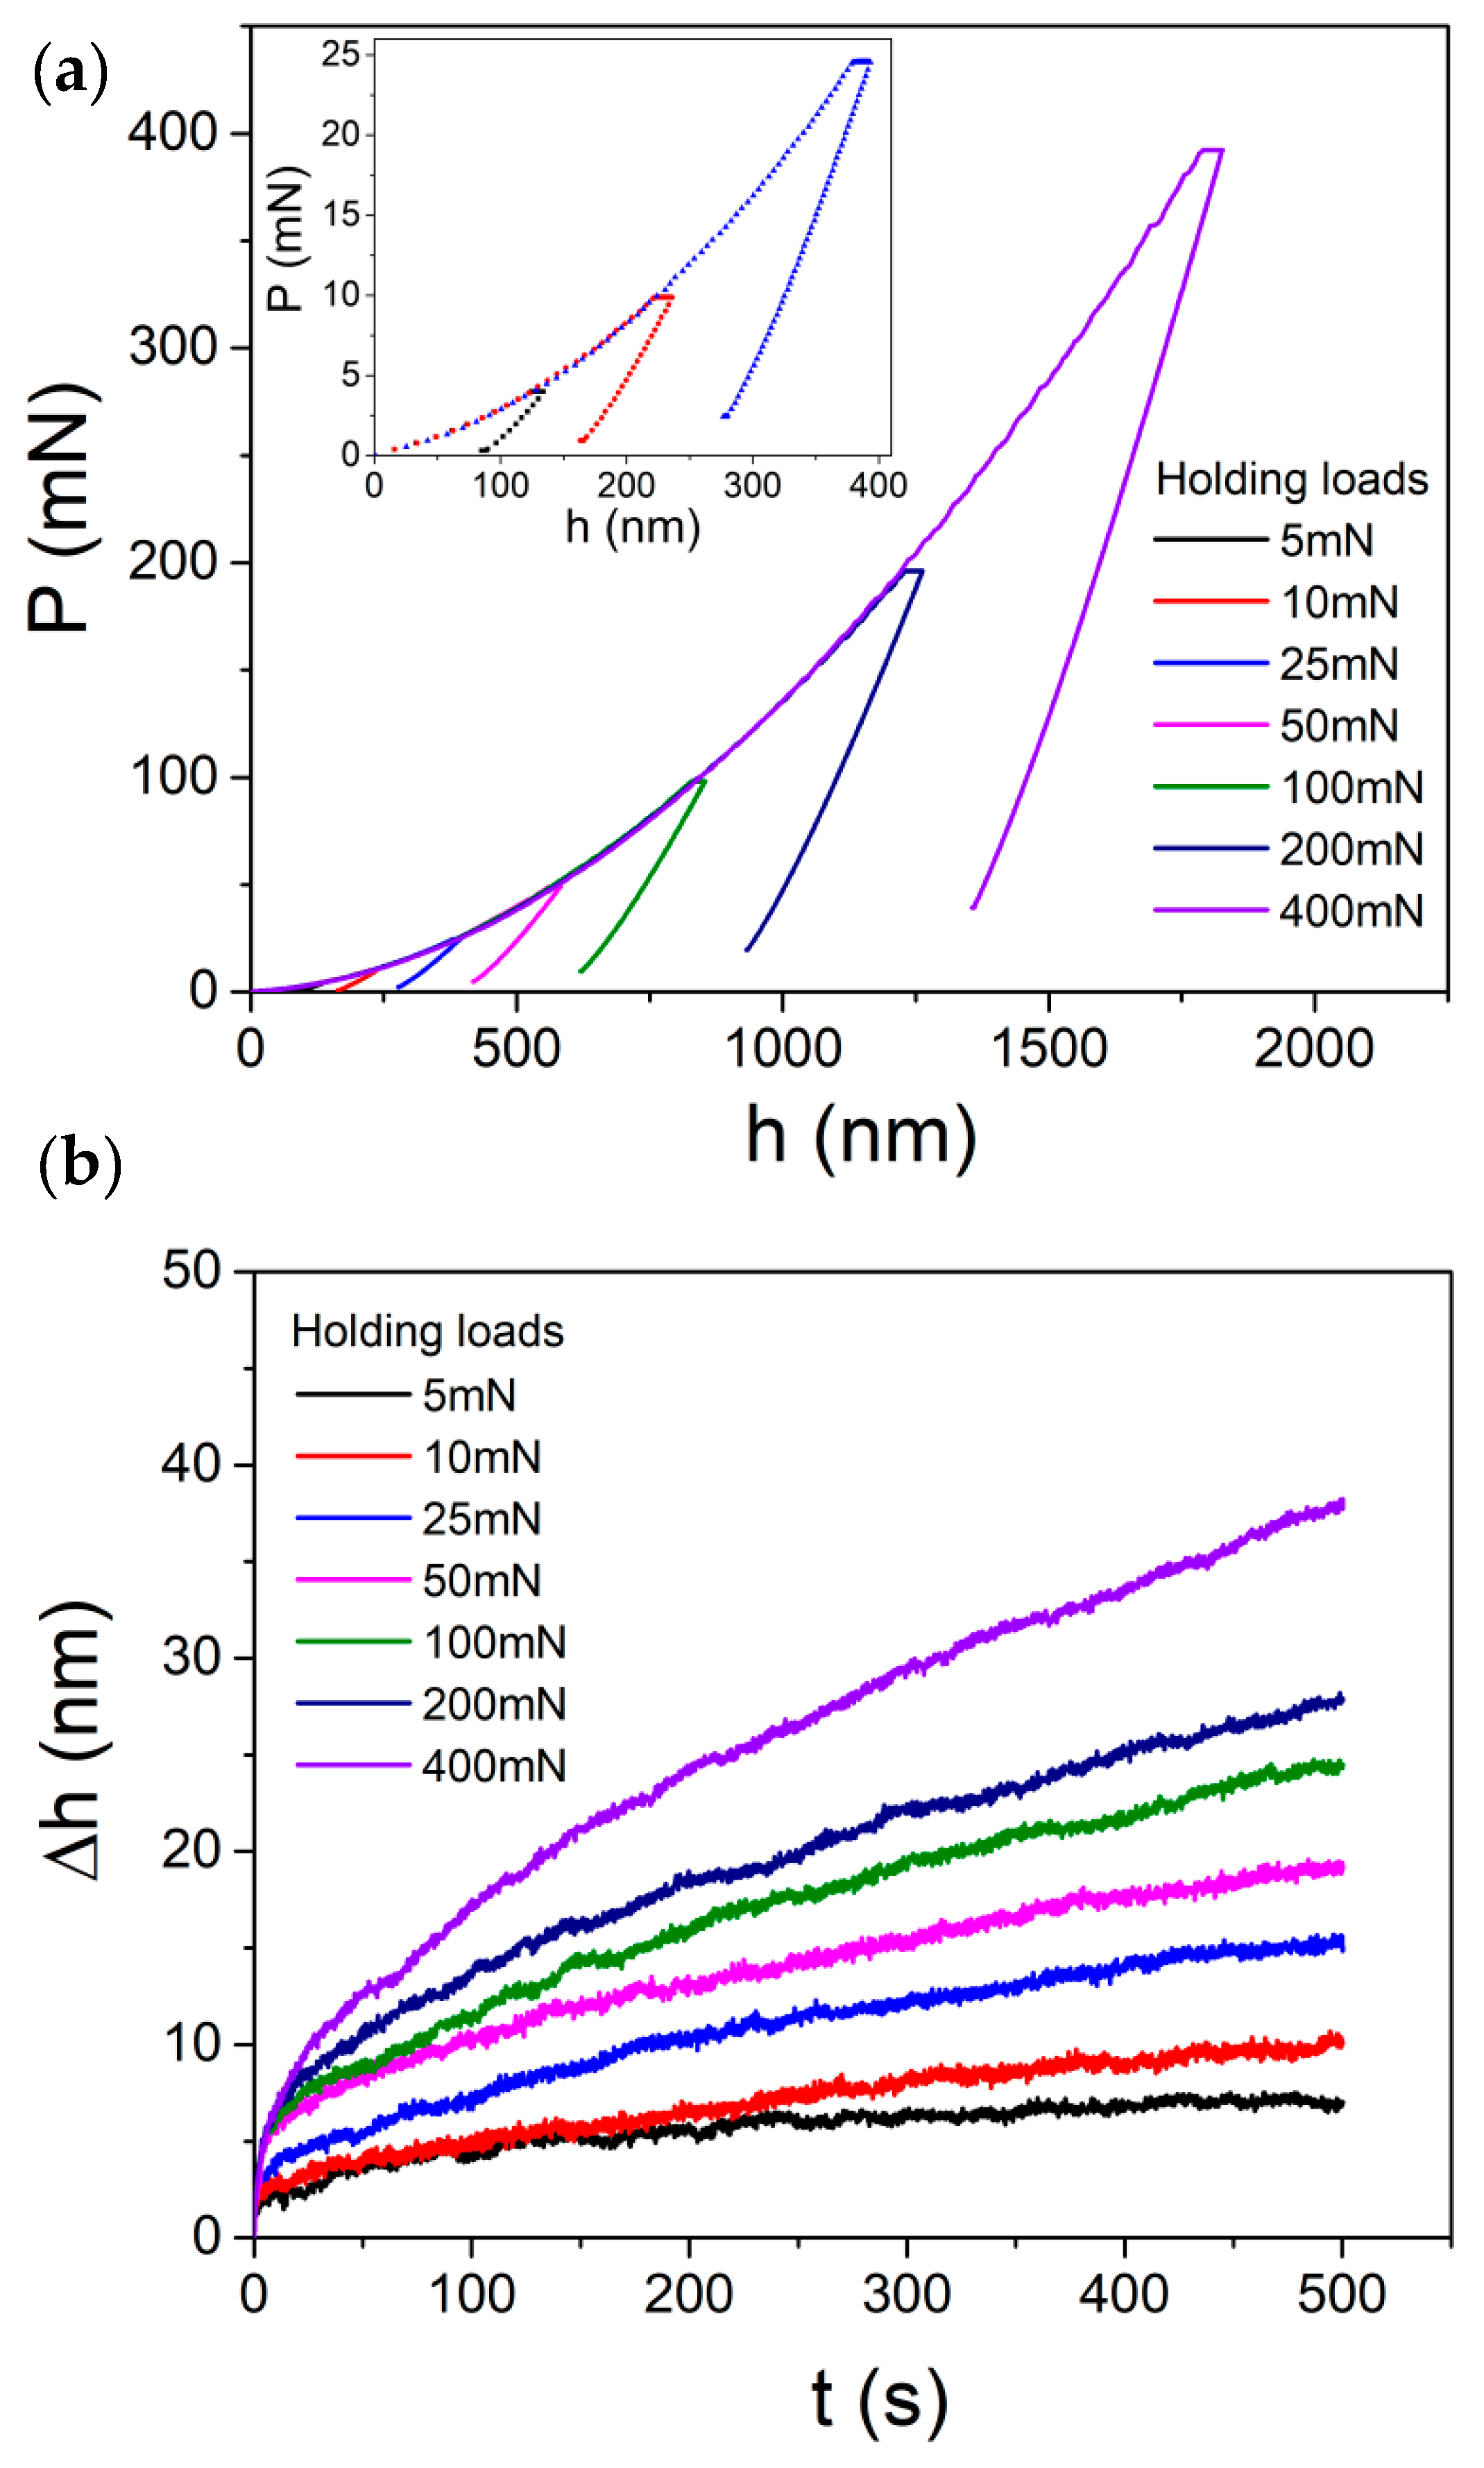
P-h) curves at various holding loads under a Berkovich indenter are exhibited in
Figure 1a. The
P-h curves at shallow depths were enlarged, as shown in the insets. The permanent displacement, i.e., creep flow, could be observed in the holding stage, though it was subtle particularly under small loads. As exhibited in
Figure 1b, the creep displacement during the holding stage was plotted as a function of holding time. For a clear view, the onsets of both
x-axis (holding time) and
y-axis (displacement) in graph were set to zero. The creep
P-h curves and creep flow curves under spherical indenter were similar to those under Berkovich indenter, as exhibited in
Figure S2 in the
Supplementary Materials. For both indenters, creep displacement was more pronounced at larger holding loads and/or depths.
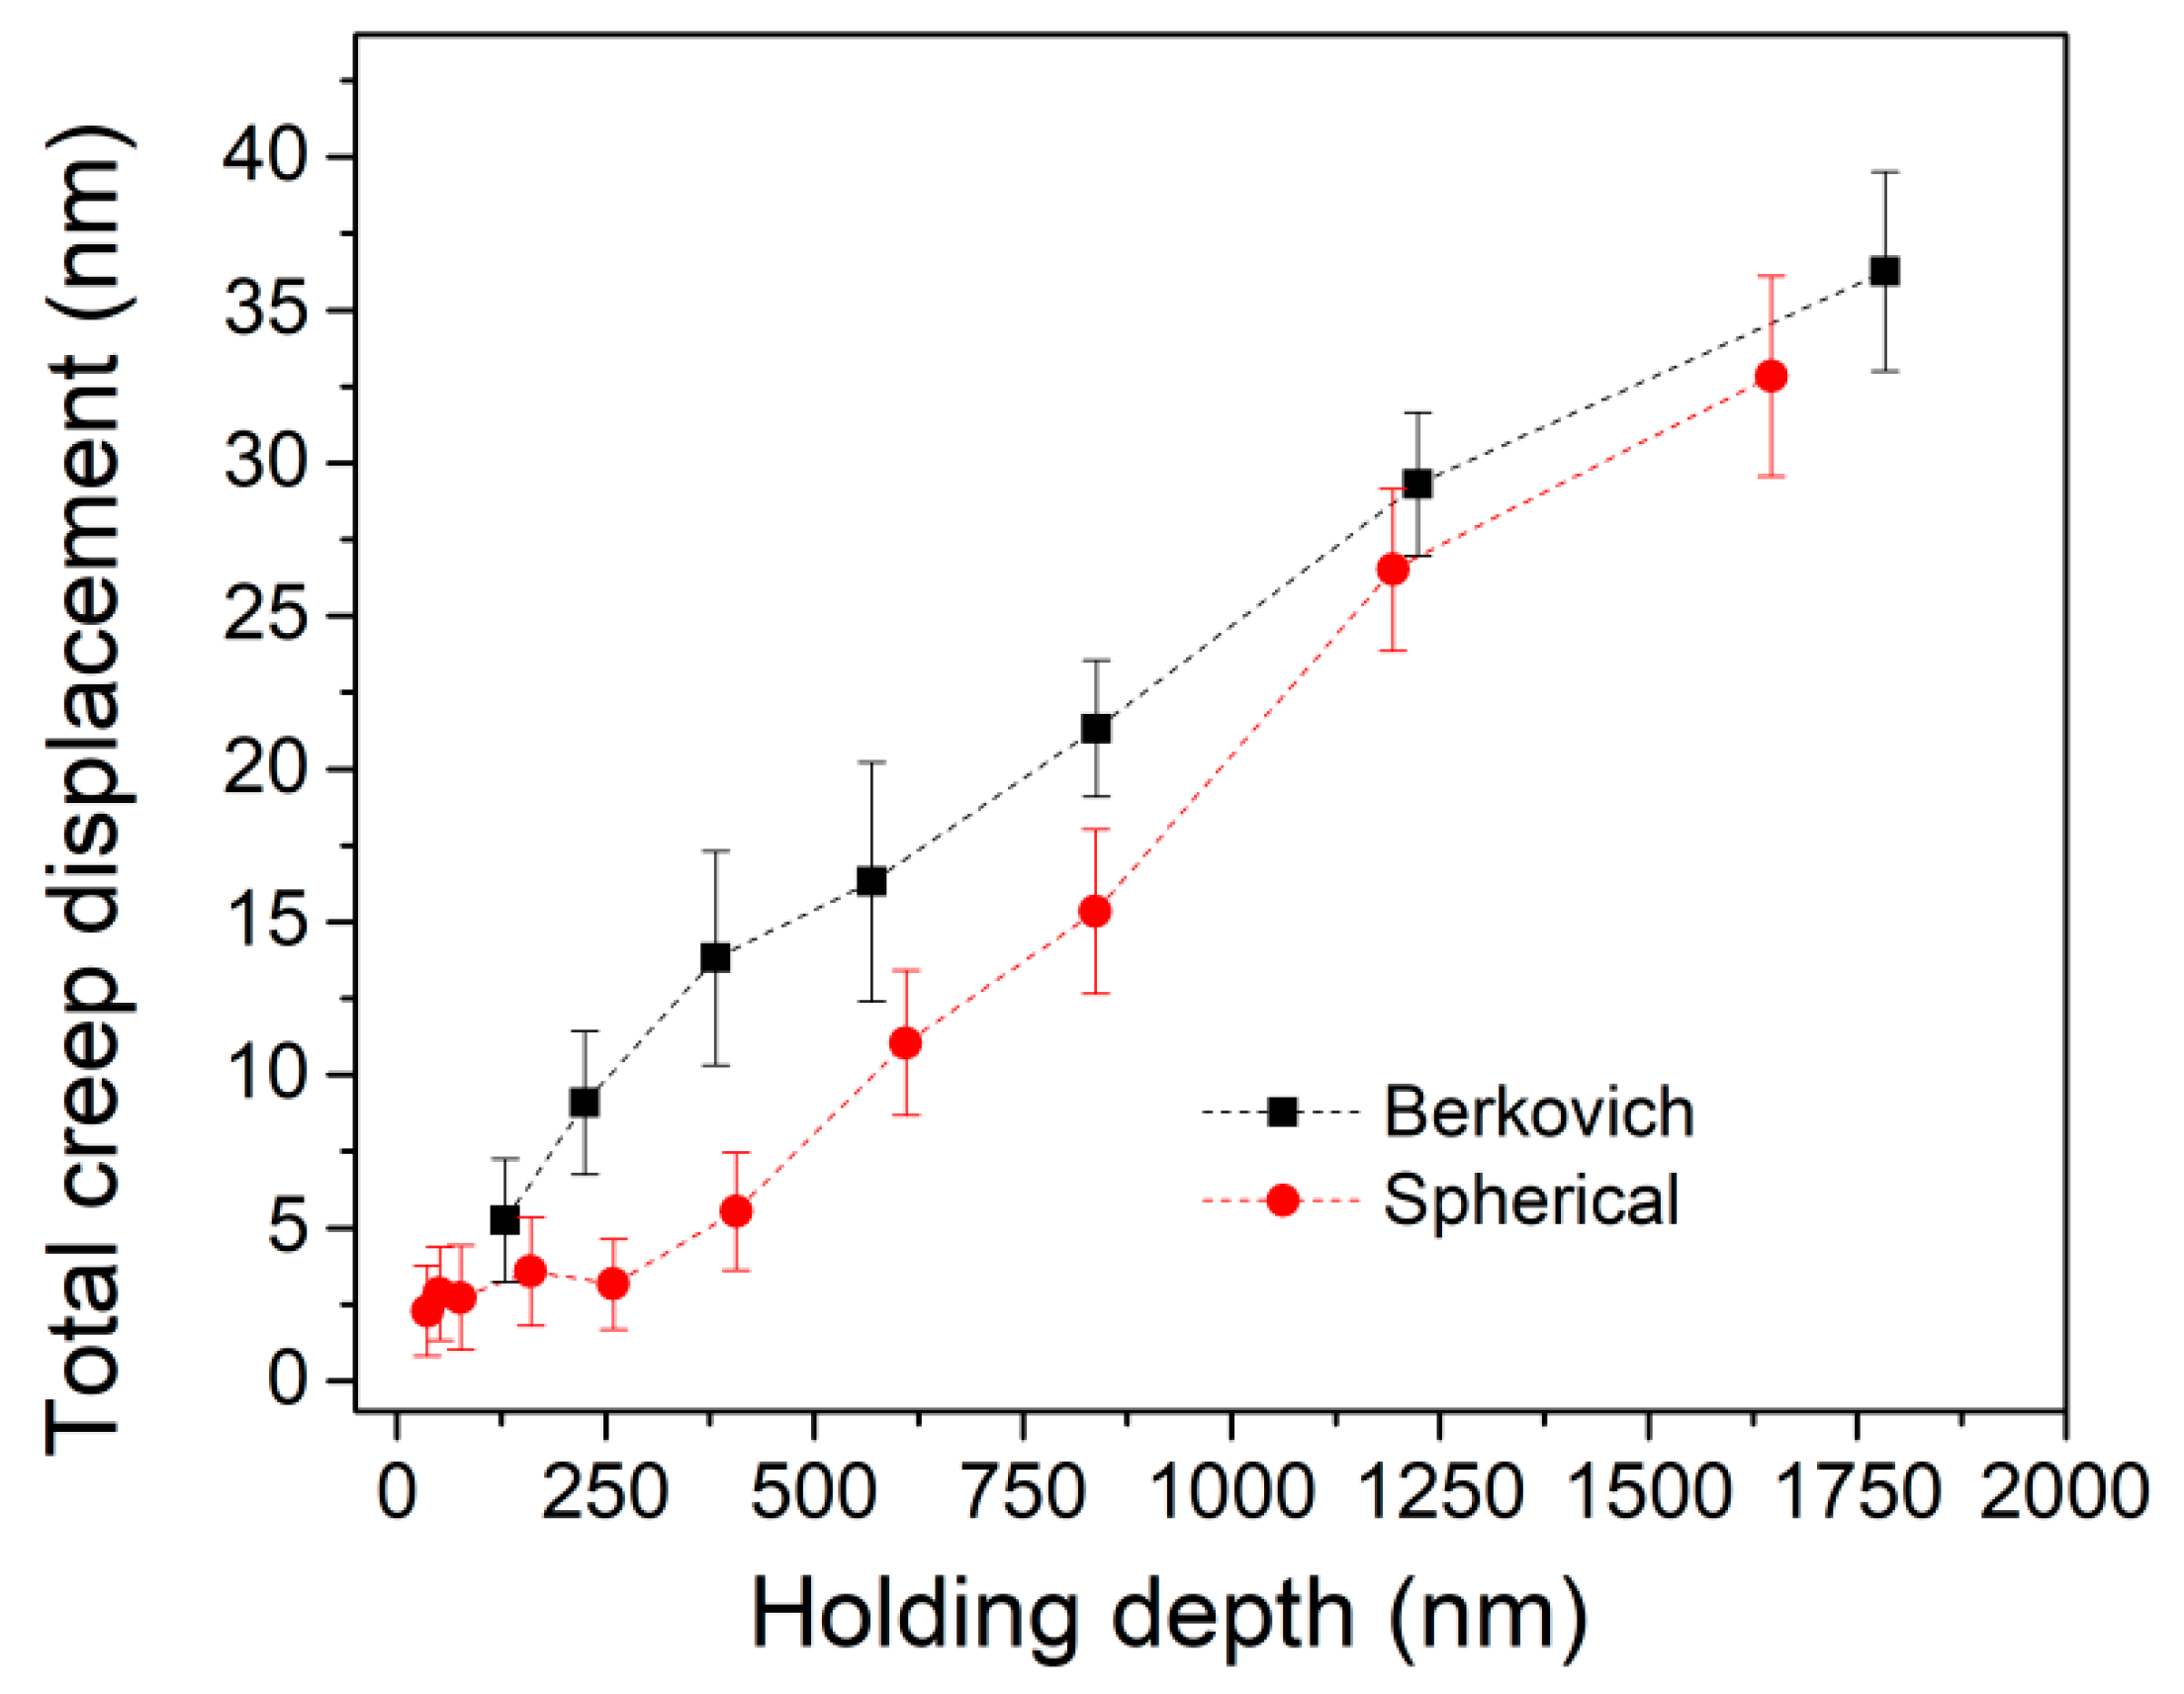
The total creep displacements at the end of the holding stage were recorded, which were plotted with holding depths, as shown in
Figure 2. The creep displacement in the Berkovich nanoindentation was increased with holding depth, while in spherical nanoindentation, creep displacement was almost independent of holding depth at first and then quickly increased. Creep deformations under Berkovich indenter were more pronounced than those under spherical indenter. The holding-depth-facilitated nanoindentation creep displacements were consistent with previous reports in metallic glasses.
For a standard Berkovich indenter (without tip bluntness), the imposed plastic volume and stress distribution during nanoindentation are self-similar at various pressed depths. Nanoindentation strains at various holding depths were constant, equal to 7.1% (0.2cot70.5°). Theoretically, creep displacement under a Berkovich indenter would be in proportion to the holding depth whilst creep strain would be invariable, regardless of structure agitation at various holding depth. Furthermore, the anticipation that more excess free volume could be generated at deep nanoindentation lacks strict verification, while for a spherical indenter, the deformation zone gradually evolved from elastic to elastoplastic with increasing pressed depth. The nanoindentation strain was continuously increased to the limit about 11% (the configuration of spherical indenter is a conical body with spherical tip, the maximum indentation strain would be approaching to 11% by 0.2cot61°). Under spherical nanoindentation, more severe structural agitation and better atomic mobility could be expected due to the increased plastic strain at deeper location. Thus, the situation under spherical indenter was more complicated than that under a Berkovich indenter. The increased creep displacement could be attributed to the combined effects of deformation volume, holding strain, and atomic mobility. The creep deformation under spherical indenter needs to be discussed separately at elastic and plastic holdings.
According to Bei’s work [
25], the first pop-in event on the loading sequence could be linked to incipient plasticity.
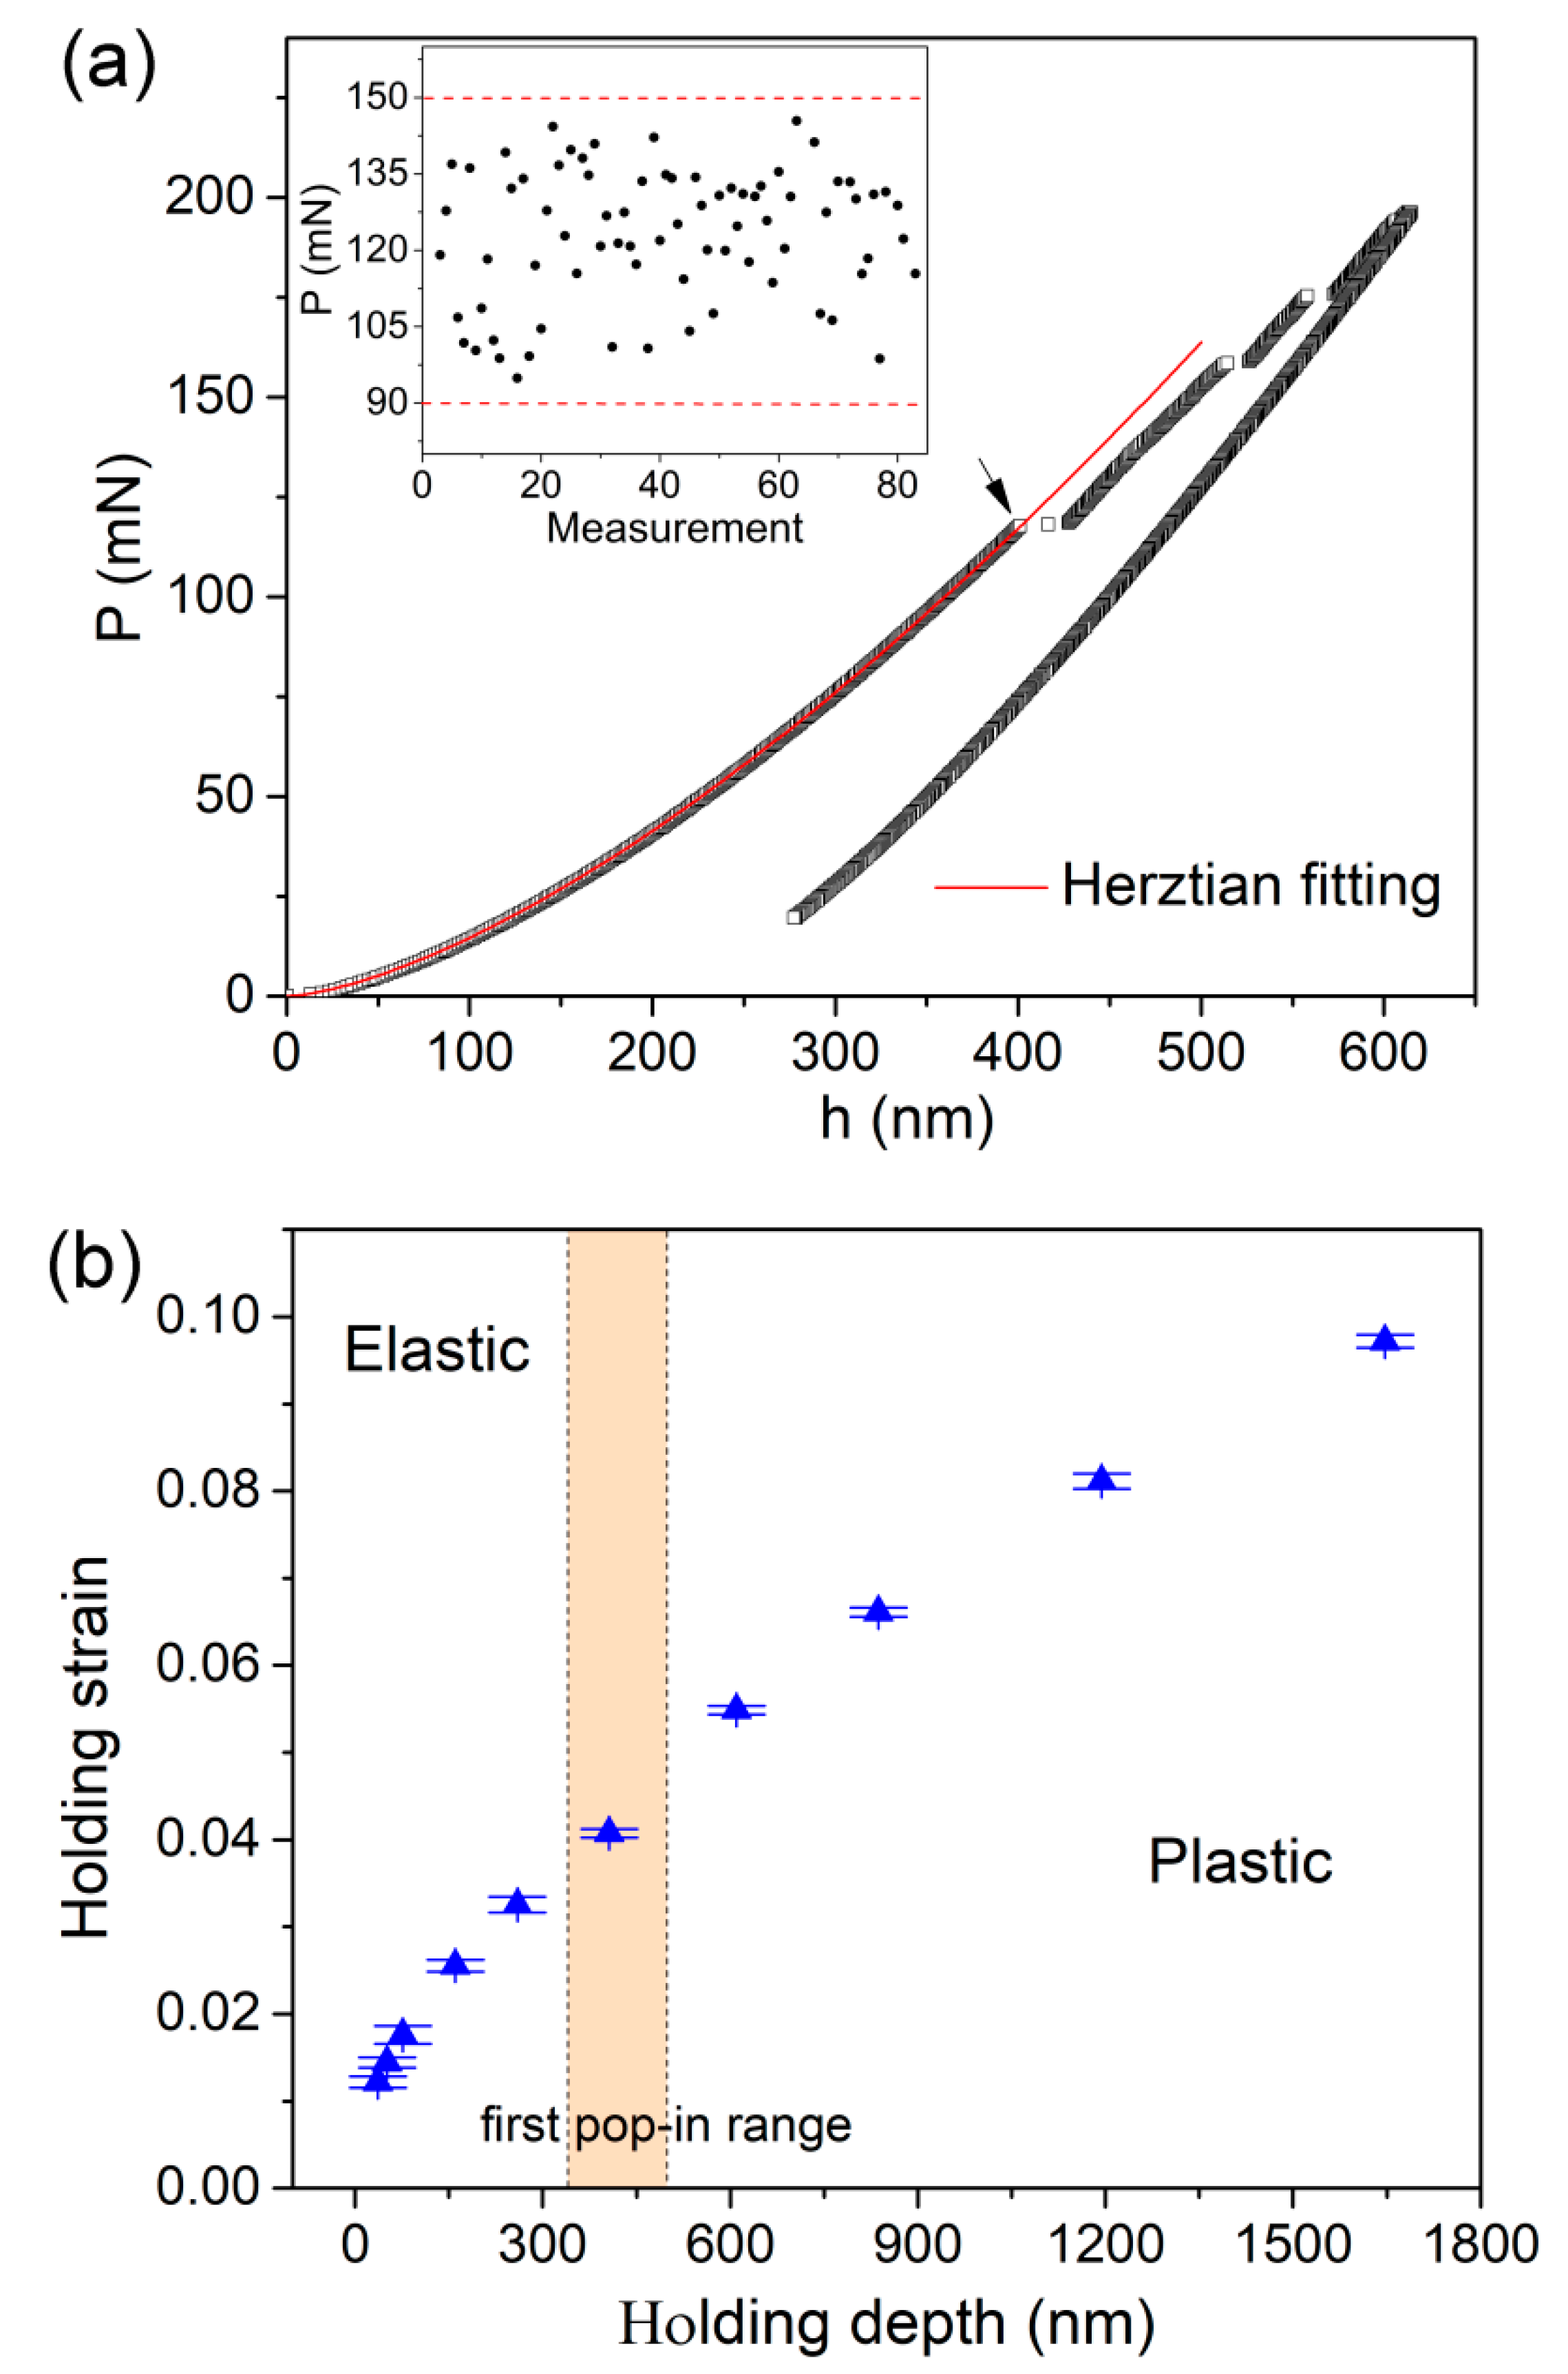
Figure 3a shows the typical spherical
P-h curve at 200 mN (holding time was 5 s) with loading rate of 2 mN/s. The pop-in events with length scales of 20~30 nm clear occurred, which represent the generation of shear bands. The initial loading sequence could be well fitted by the Hertzian elastic contact equation [
26], given by
where
Er is the reduced elastic modulus which accounts for the elastic displacement occurred in both the tip and sample, given by
where
E and
ν are the elastic modulus and Poisson’s ratio, and the subscripts
s and
i represent the sample and the indenter, respectively. For commonly used diamond tip,
Ei = 1141 GPa and
νI = 0.07. For the Zr-Cu-Ag-Al metallic glass, elastic modulus was measured as 110 GPa as shown in
Figure S3 in the
Supplementary Materials and the Poisson’s ratio is 0.36 [
27]. The Hertzian fitting line deviated from the
P-h curve at the position of the first pop-in. This clearly indicates the transition from elastic deformation to plastic deformation once the first pop-in emerges. Shear banding nucleation in metallic glass is a stochastic process, which could result in a scatter distribution of the first pop-in event [
28]. By conducting 81 measurements at a 9 × 9 matrix at intervals of 50 µm, the critical loads at first pop-in events were detected to be uniformly scattered in the range between 90 and 150 mN, as shown in the inset of
Figure 3a. Thus, 2–60 mN holdings were at elastic regions and 200–700 mN holdings were at plastic regions under spherical indenter. The 120 mN holding was exactly around the yielding point of Zr-Cu-Ag-Al sample. We can regard approximately 120 mN holding as the elastic holding because plastic deformation was still negligible. The holding strains at various holding depths were estimated for spherical indenter by
,
is the contact radius. As exhibited in
Figure 3b, the holding strain increased from 1.2% to 10% as peak load increased from 2 to 700 mN. The elastic limit under 9.8 µm spherical indenter was about 4%, which was far beyond the typical ~2% for bulk metallic glasses. This could be explained from the complicated stress distribution beneath the indenter where incipient plasticity is unable to be triggered immediately when the maximum stress attains yield stress [
29]. To form a shear band during nanoindentation, there needs a certain space along the shear path of which stress has been beyond the yield stress.
For creep deformation under Berkovich indenter, we defined creep strain as Δ
h/
hc, in which Δ
h is the total creep displacement and
hc is the contact displacement at the beginning of holding stage. Contact displacement was estimated by
hc =
h-
ε × P/S, in which
ε = 0.72,
S is the stiffness deduced from the unloading curve. The creep strain rate of steady-state part was estimated by
. The mean value of creep strain rate at the last 200 s segment of holding stage was adopted.
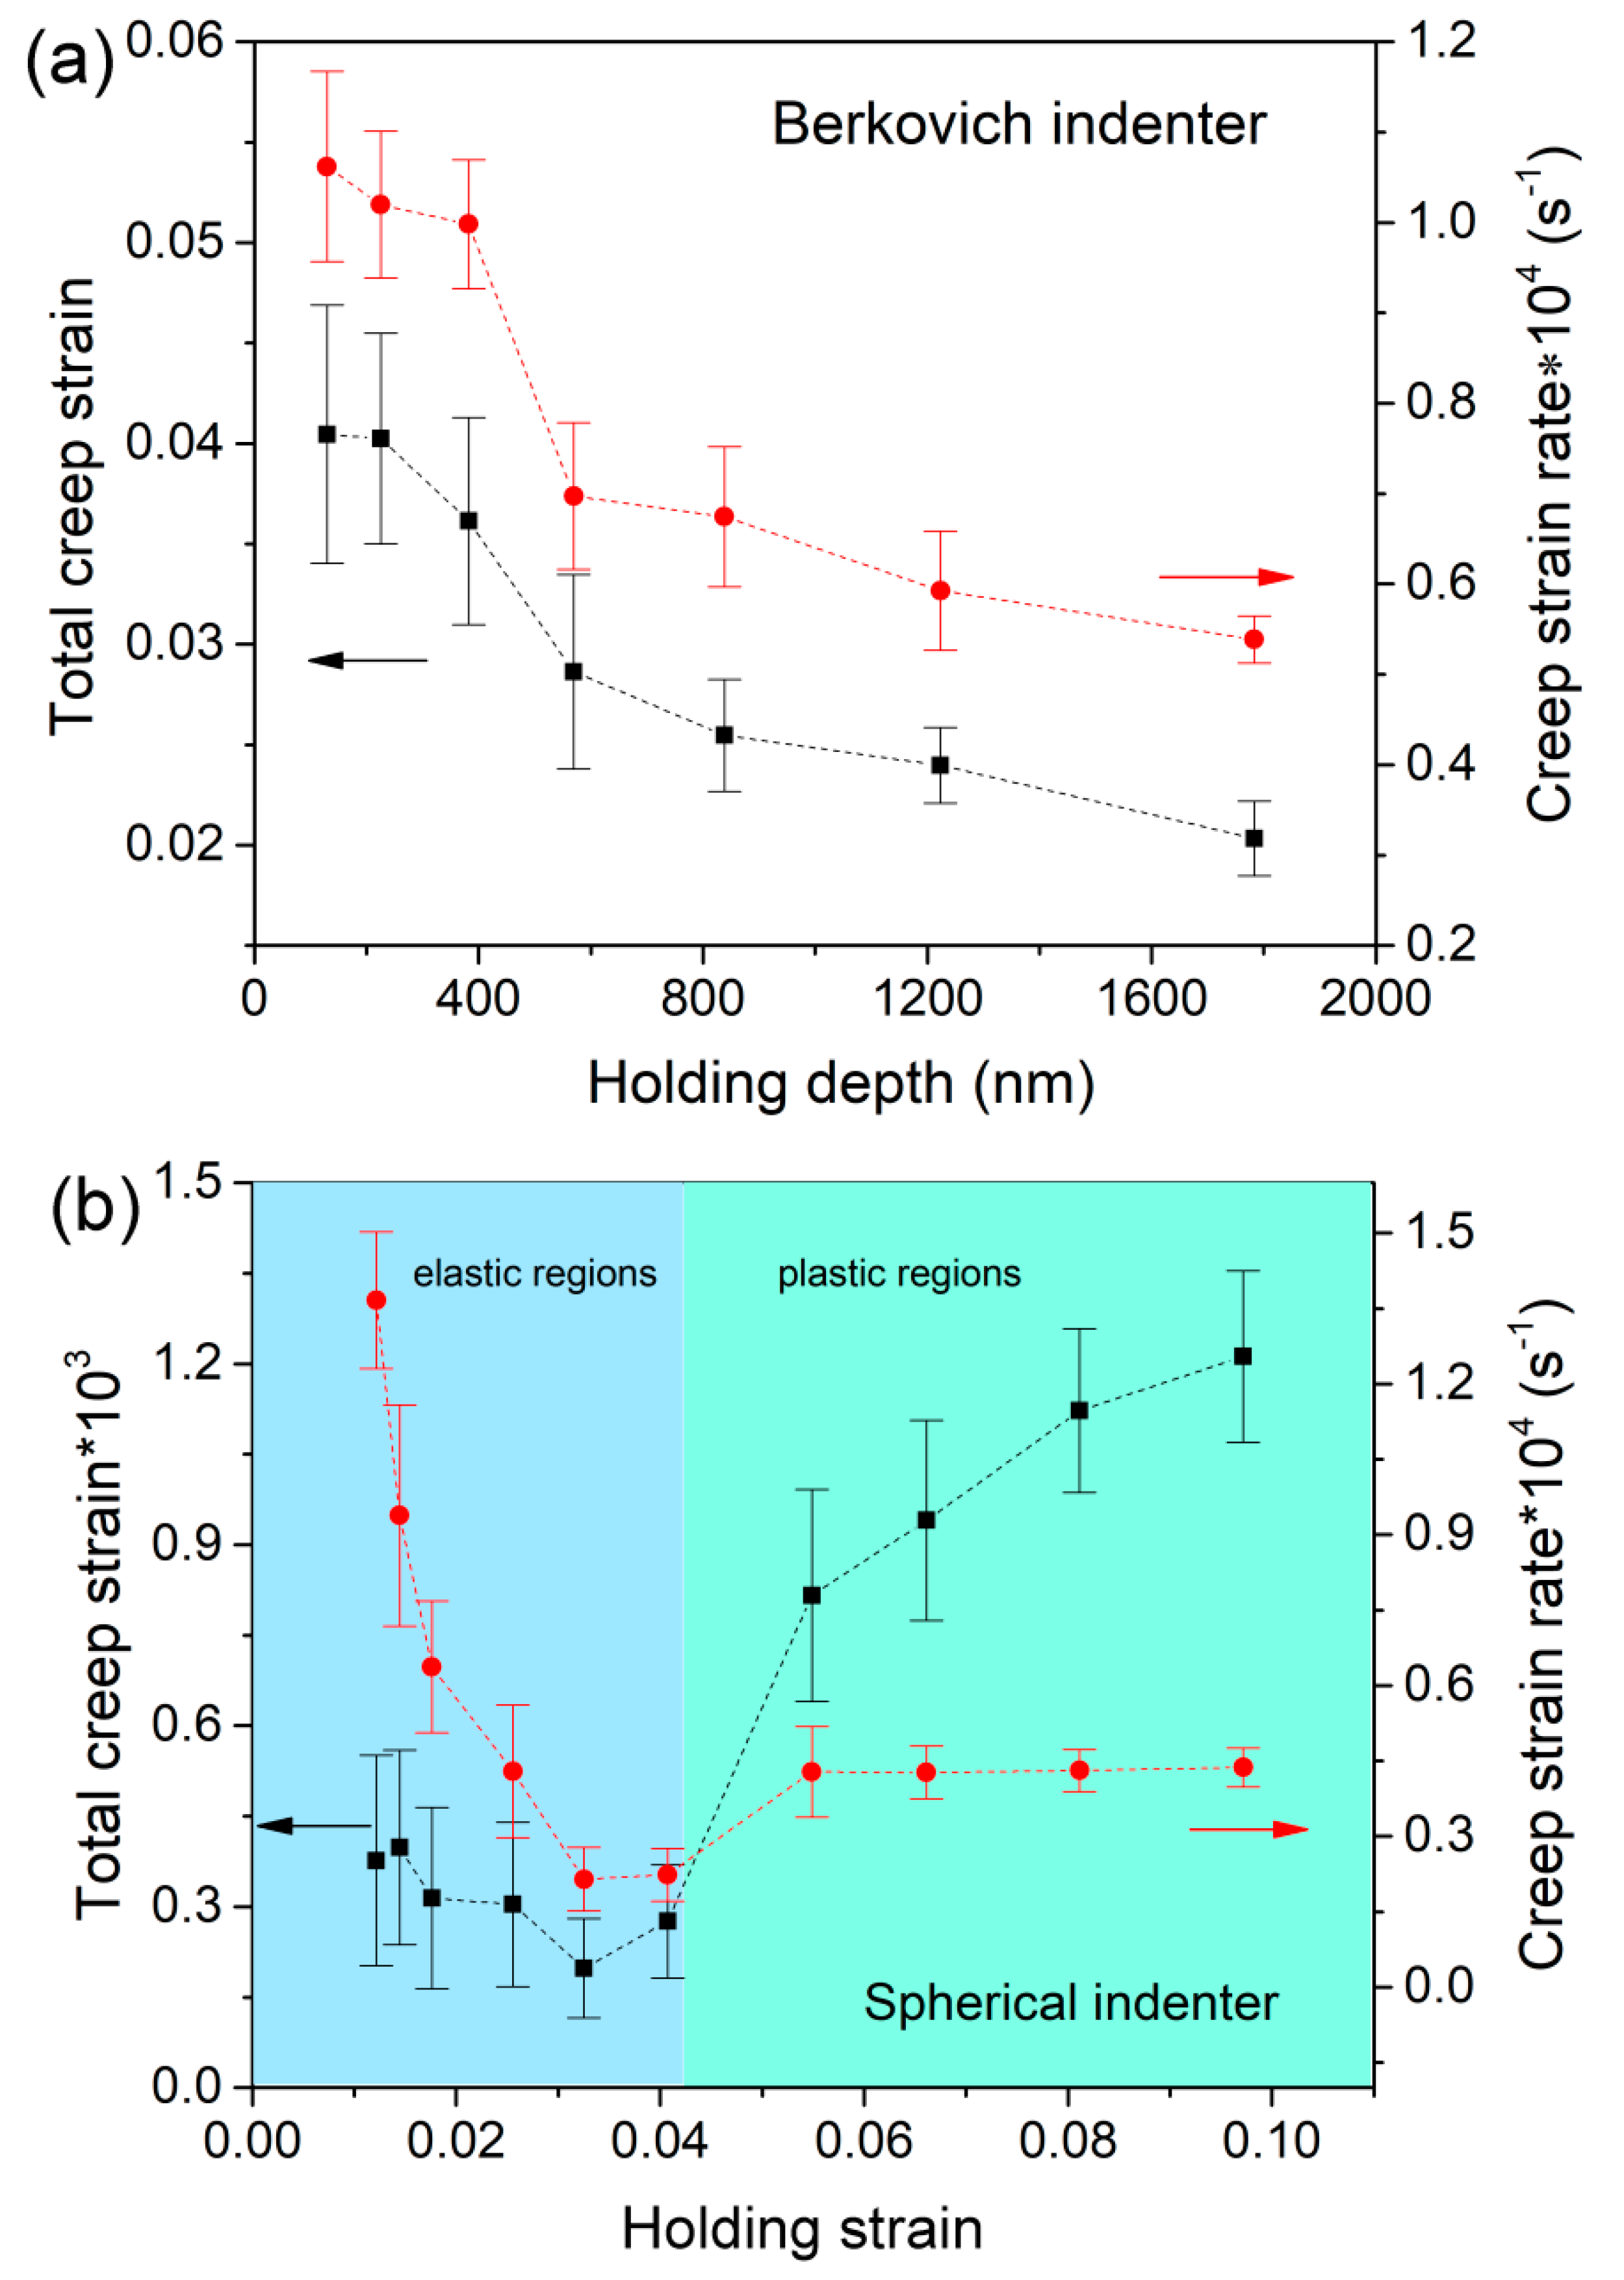
Figure 4a exhibits creep strain and strain rate of steady-state creep under Berkovich indenter at various holding depths. The creep strain was continuously decreased from 0.04 to 0.02 with increasing holding depth from 130 to 1780 nm. Meanwhile, creep strain rate decreased from 1.1 × 10
−4 to 5.4 × 10
−5 s
−1. That is to say, creep deformation was actually depressed with increasing nanoindentation depth under a Berkovich indenter. This result confirms previous reports about sample-size-dependent creep flow [
17,
18,
19,
20]. From the perspective of structure agitation, the density of shear bands could be decreased at deep nanoindentation, i.e., lower density of excess free volume. On the other hand, size effect on plastic deformation has been largely reported in metallic glass that plastic flow is facilitated at the nanoscale [
7,
8,
9], which suggests a better atomic mobility. Therefore, the enhanced creep deformation at shallow depth under a Berkovich indenter could be explained qualitatively.
Creep strain under spherical indenter was calculated by
, where
a and
a0 are the contact radii at the beginning and ending of holding stage, respectively. Creep strain rate was calculated by
=
, where
A is the contact area, equal to
at plastic region and
at elastic region.
Figure 4b depicts the correlations between creep strain, creep strain rate, and holding strain under spherical indenter. At elastic regions, creep strains were insignificant (lower than 0.04%) and slightly decreased as increasing holding strain. It is rational that creep flow hardly occurred under elastic holding at room temperature for the high-melting bulk metallic glass in such short duration (compared to conventional creep measurement). The present result indicates that creep deformation at elastic region is mainly dependent on structure state, rather than holding strain. Atomic diffusion on the contact surface and the migration of pre-existing free volume could be the creep mechanism at elastic holdings. As the holding strain turned to plastic, a sudden increase of creep strain was observed. At plastic regions, creep strain was greatly increased from about 0.04% to 0.1% as holding strain increased from 4% to 10%. For plastic holdings, the evolution of shear transformation zone (STZ) dominated during creep deformation. With increasing holding strain, plastic zone beneath indenter increased and more STZs were activated to carry creep flow. In this scene, the increased plastic strain and more severe structure agitation jointly stimulated creep deformation as increasing holding strain. On the other hand, creep strain rate precipitously decreased as increasing holding strain at elastic regions and was independent on holding strain at plastic regions. As holding strain increased from elastic to plastic, the enlargement of creep strain rate was apparently less dramatic than the increase of creep strain. The unexpected high creep strain rates at shallow depths below 100 nm (2–10 mN holdings) were mysterious, probably due to the thermal drift effect on such weak creep deformations. Furthermore, it was indicated that steady-state creep deformation was holding-depth-independent at plastic regions, which represented the true creep resistance.
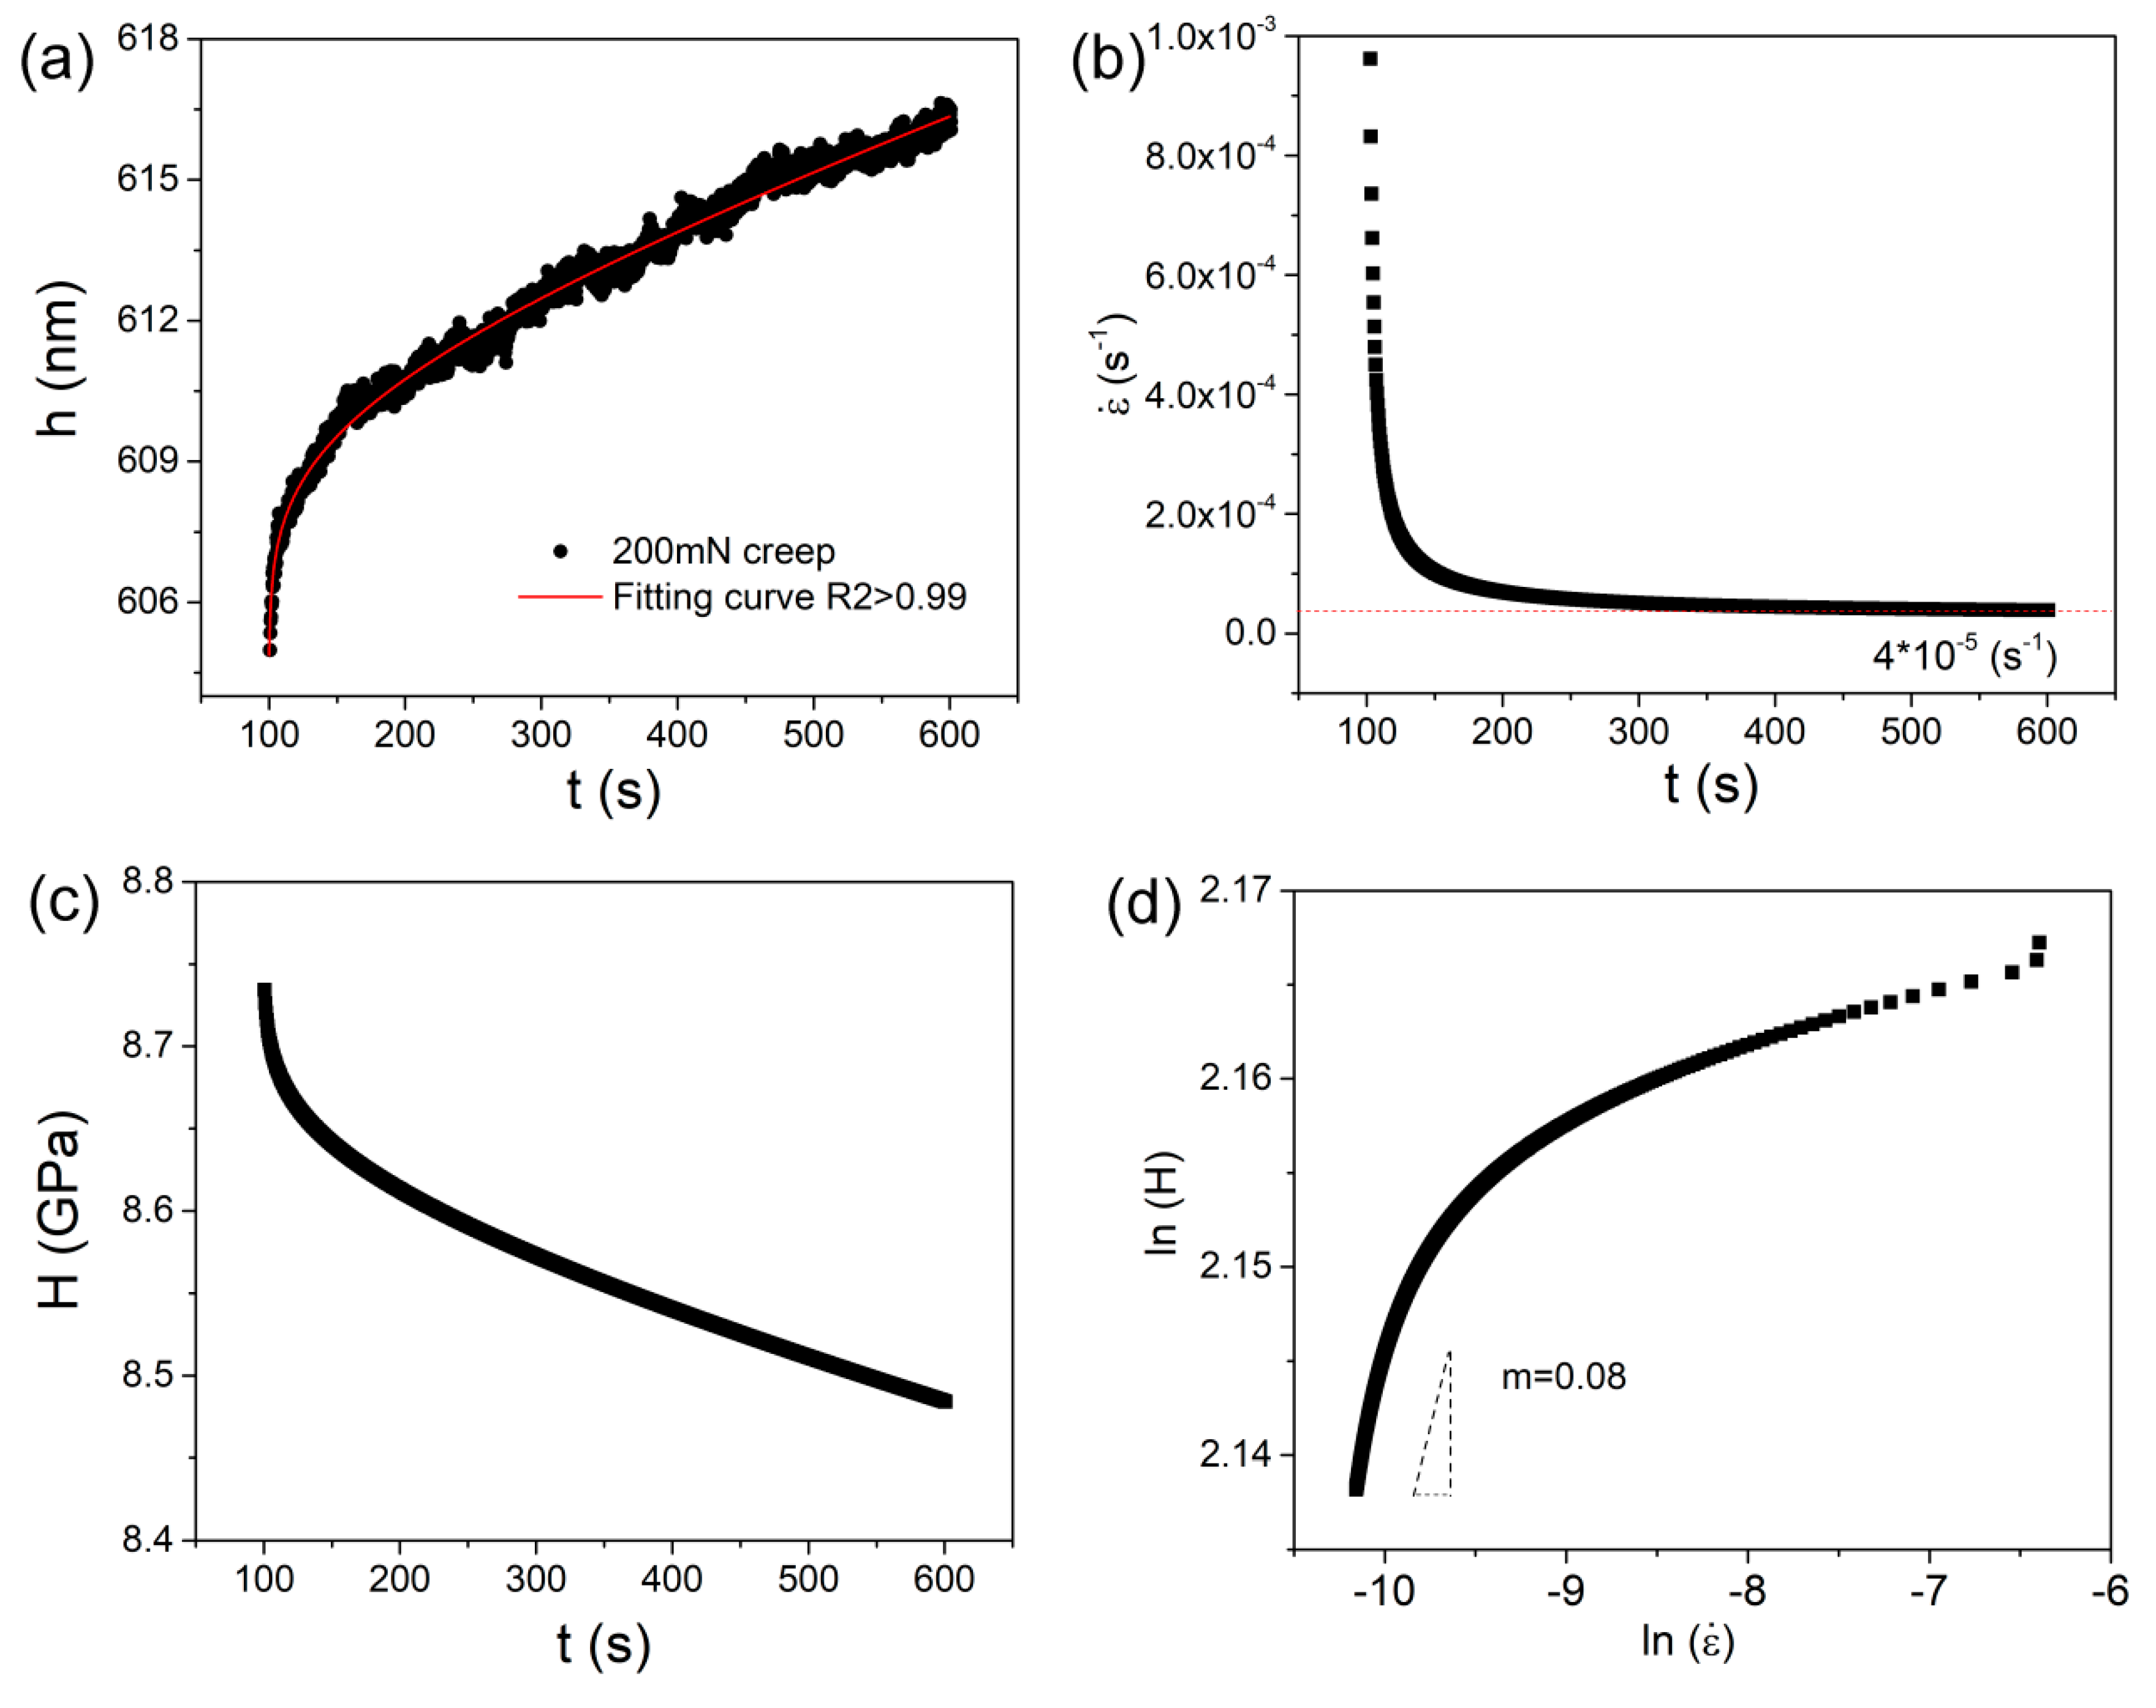
The present creep feature under nanoindentation was similar to conventional testing. Hence, it has merits to estimate strain rate sensitivity (SRS) in order to reveal the creep mechanism and its correlation with nanoindentation length scale. Here, we selected 200 mN-holding testing by spherical indenter as an illustration to calculate SRS. As exhibited in
Figure 5a, creep curve could be perfectly fitted (R
2 > 0.99) by an empirical law:
where
h0,
t0 are the displacement and time at the beginning of holding stage,
a,
b,
k are the fitting constants. The value of SRS exponent
m can be evaluated via
The creep flow stress
can be obtained from the mean pressure
beneath indenter via Tabor’s mode,
= 3
σ [
30] in the elastic region,
. At plastic region, the mean pressure is also defined as hardness, which is
for spherical tip and
for standard Berkovich indenter.
C is the tip area coefficient for Berkovich indenter and was rectified upon testing on standard fused silica, equal to 24.3 here.
is the creep strain rate.
Figure 5b,c show the changes of strain rate and hardness during holding stage, which were deduced from the fitting line of creep curve.
Figure 5d shows the Logar–Logar correlation between hardness and strain rate during the holding stage. Then SRS can be obtained by linearly fitting on the part of steady-state creep.
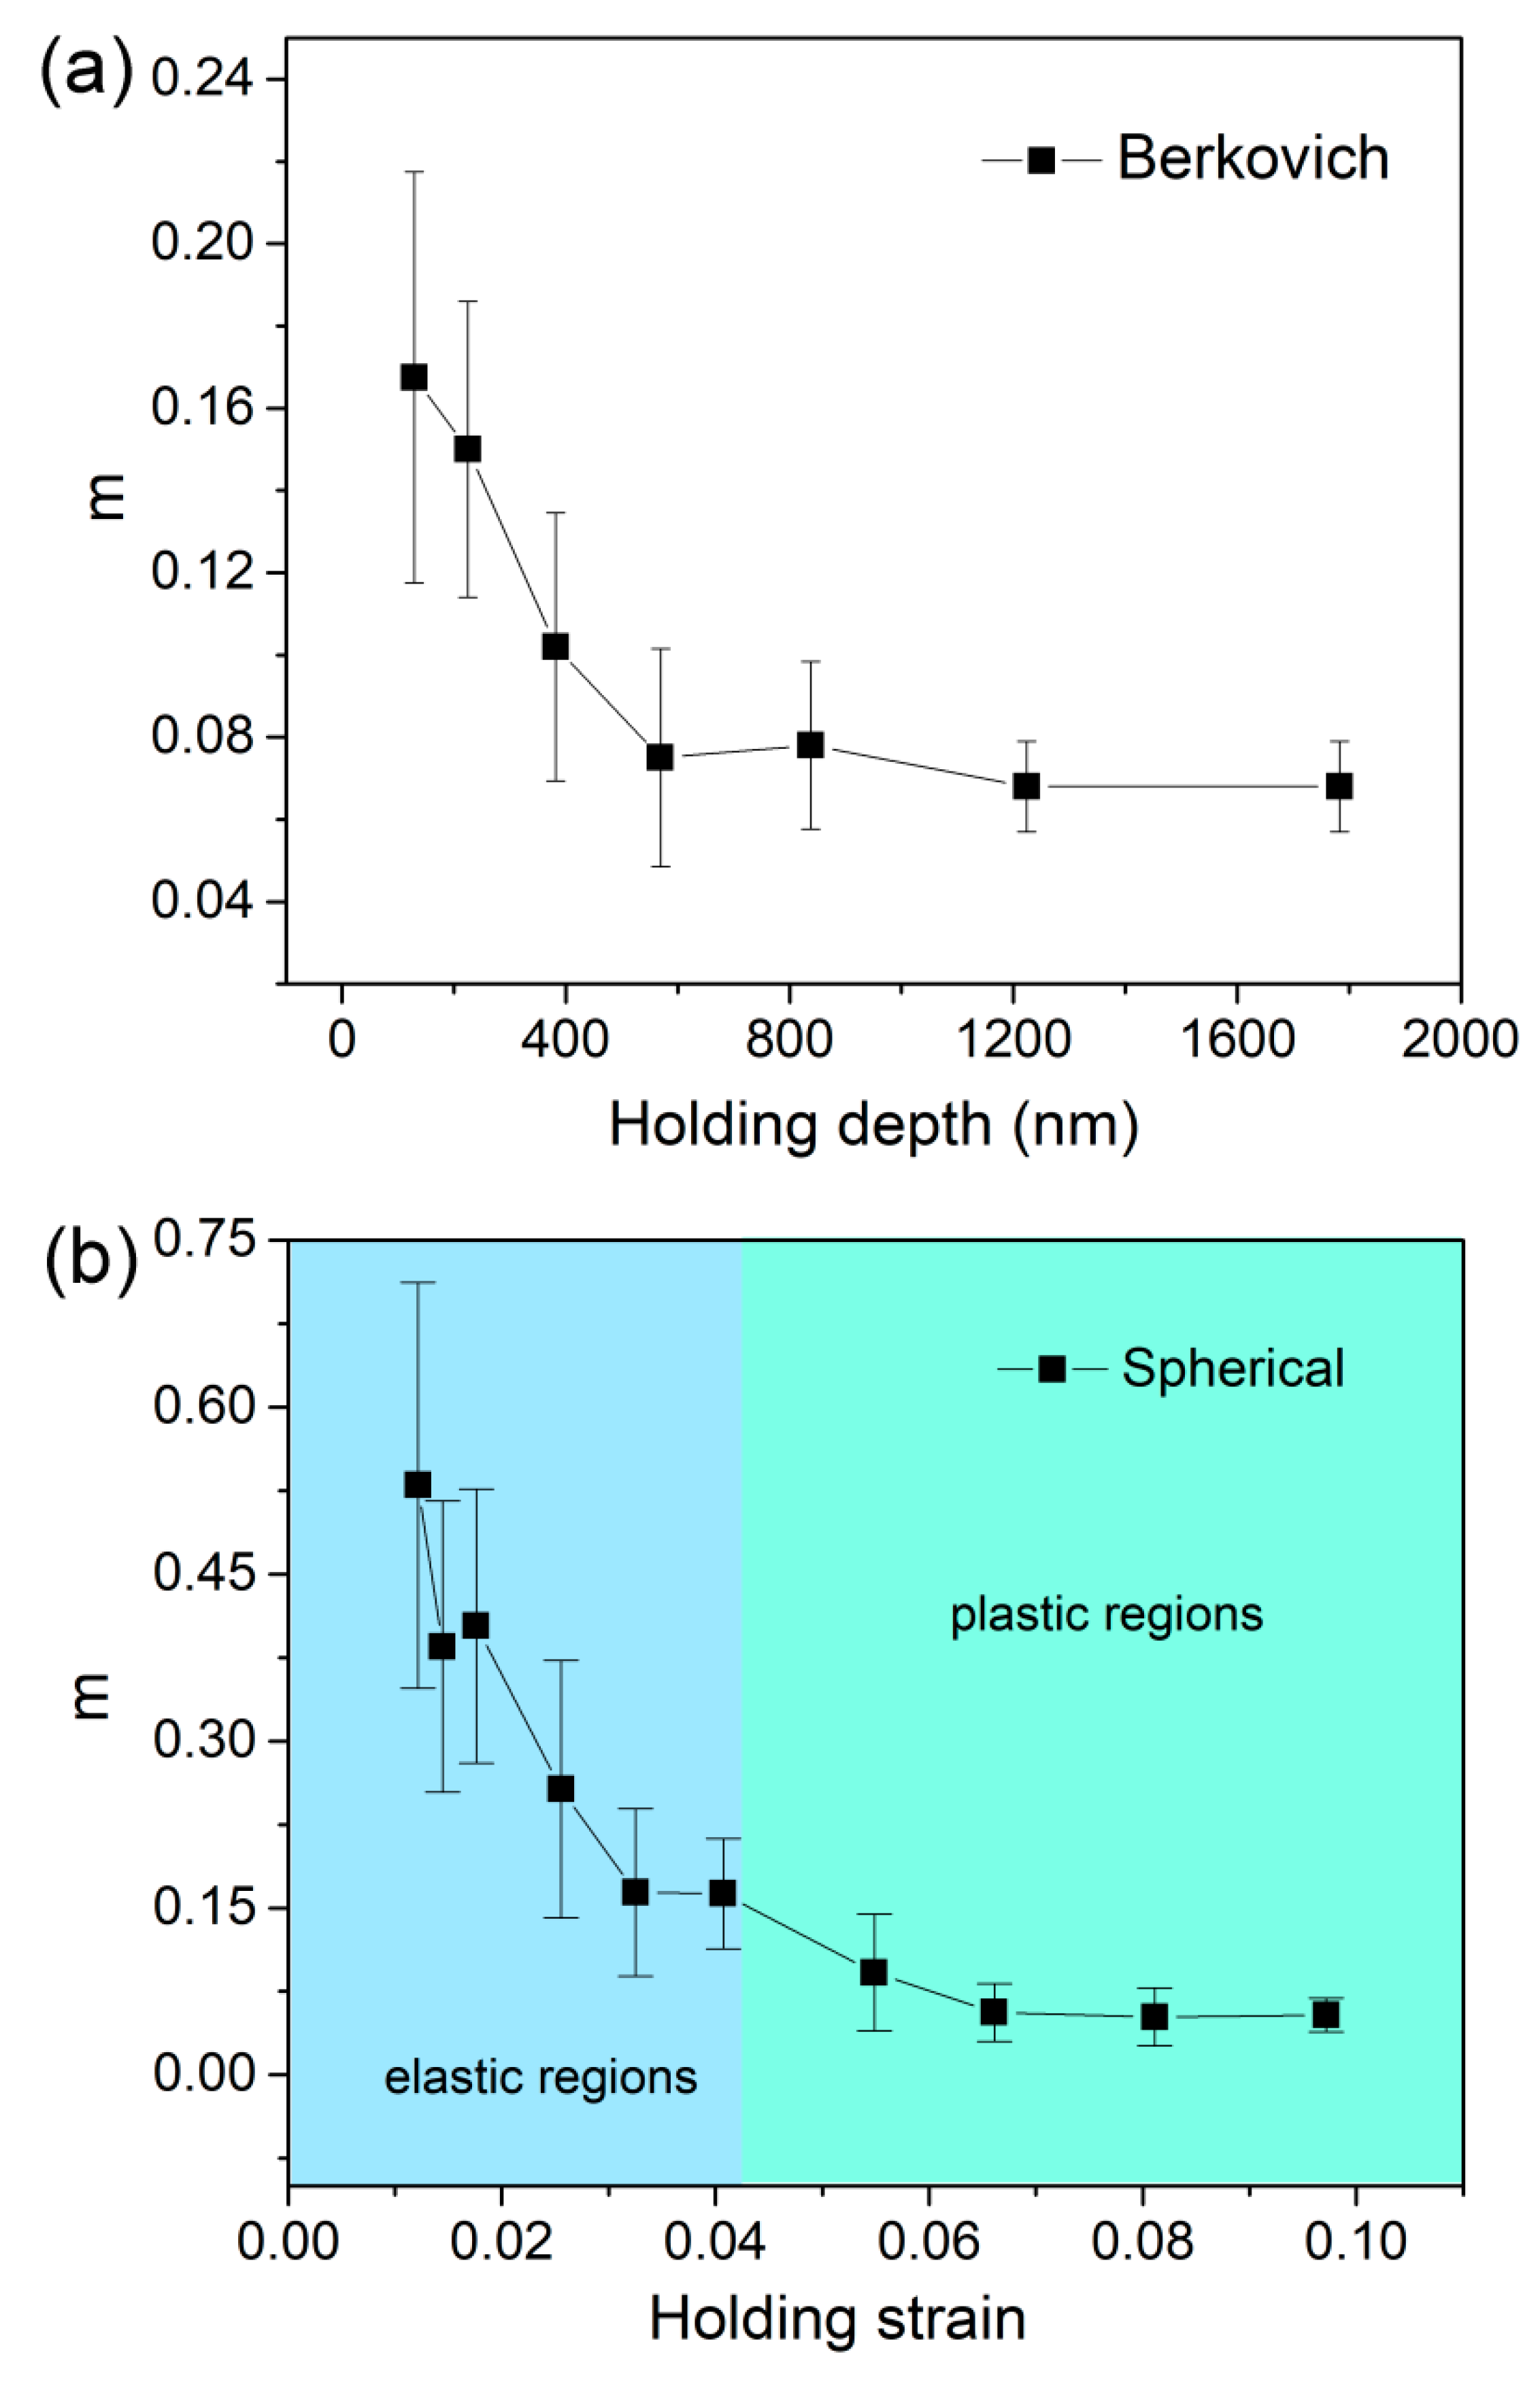
Figure 6a shows the correlation between
m and holding depth for Berkovich indenter. SRS was decreased from 0.17 to 0.075 as holding depth increased from 130 to 570 nm, and then tended to stabilize around 0.07. In the present work, the tip bluntness effect on creep behavior at shallow depth could be excluded since the minimum pressed depth was beyond 100 nm.
Figure 6b shows the correlation between
m and holding strain for spherical indenter. At elastic regions,
m greatly decreased from 0.53 to 0.16, as holding strain increased from 1.2% to 4%. At plastic regions,
m slightly decreased, from 0.09 to 0.055, as holding strain increased from 5.5% to 10%. Apparently, SRS decreased with increasing holding depth and settled as the pressed depth was larger than about 500 nm for both indenters.
The value of strain rate sensitivity
m or stress exponent
n (
n = 1/
m) is widely used as an indication to creep mechanism in crystalline alloy or metals [
31]. For example, dislocation move is dominating in creep flow as
m falls in the range between 0.1 and 0.3. In metallic glasses, free volume generation and annihilation, shear transformation zone (STZ) evolution and atomic diffusion (under elastic contact) are thought to be the possible creep mechanisms [
23], while the relationship between
m and creep mechanism in metallic glass is inconclusive. For creep flow under a Berkovich indenter, the STZ creep flow could be mainly actuated by STZ evolution. The gentle change of
m was probably due to that STZ size and density were also changed with nanoindentation depth. For spherical nanoindentation creep, it is worth mentioning that
m was in between 0.25 and 0.055 within holding strain range from 2.6% to 10%. It is reasonable that
m at plastic region under spherical indenter was much comparable to Berkovich nanoindentation, due to the same creep mechanism, while for 30–120 mN elastic holdings (2.6–4% holding strains), the maximum stress beneath indenter had already exceeded yield stress as it was aforementioned. Though it could not meet the requirement of shear banding generation, the stress level and atomic surrounding were satisfied for STZ activation [
23]. Creep deformation beneath indenter was prone to occur at the region that suffered high stress. Thus, STZ evolution might also be the creep mechanism under the nominal elastic holding at 30–120 mN. The 2–10 mN holdings, of which holding strains were below 2%, could be regarded as purely elastic under nanoindentation. In this scenario, STZs were unable to be activated. Atomic diffusion and free volume migration could be suggested as creep mechanism. Accordingly, the high values of SRS (0.4~0.5) at shallow depths under spherical indenter could be explained by the transition of creep mechanism. In the current work, we investigated creep behavior and its correlation with nanoindentation length scale and holding strain. Relying on the suggested modes for plastic deformation in metallic glass, we bridged the connection between creep mechanisms and SRS values at elastic holding and plastic holding.


