Article

Development of High-Fidelity Imaging Procedures to Establish the Local Material Behavior in Friction Stir Welded Stainless Steel Joints

by
S. Ramachandran
1,*,
A. K. Lakshminarayanan
2,
P. A. S. Reed
1 and
J. M. Dulieu-Barton
1
1
Engineering Materials Research Group, Faculty of Engineering and Physical Sciences, University of Southampton, Southampton SO17 1BJ, UK
2
Department of Mechanical Engineering, SSN College of Engineering (Autonomous), Kalavakkam, Chennai, Tamilnadu 603110, India
*
Author to whom correspondence should be addressed.
Metals 2019, 9(5), 592; https://doi.org/10.3390/met9050592
Submission received: 4 May 2019 / Revised: 19 May 2019 / Accepted: 21 May 2019 / Published: 23 May 2019

Abstract

:
Friction stir welded (FSW) 304 austenitic stainless steel (SS) joints are studied using a range of microstructural characterization techniques to identify various sub-regions across the weld. A high-resolution (HR) 2D-digital image correlation (DIC) methodology is developed to assess the local strain response across the weld surface and cross-section in the elastic regime. The HR-DIC methodology includes the stitching of multiple images, as it is only possible to partially cover the FSW region using a single camera with the high-resolution optical set-up. An image processing procedure is described to stitch the strain maps as well as strain data sets that allow full-field strain to be visualized and interrogated over the entire FSW region. It is demonstrated that the strains derived from the DIC can be associated with the local weld geometry and the material microstructure in the region of the FSW. The procedure is validated in the material elastic range and provides an important first step in enabling detailed mechanical assessments of the local effects in the FSW process.

1. Introduction

Friction Stir Welding (FSW) is a solid-state welding process that does not involve any bulk melting of the base materials as the joining is achieved by frictional heat and plastic work produced by a rotating and traversing non-consumable tool. These large plastic deformations and frictional heating of the FSW process generate recrystallized ultrafine grains in the weld nugget, making the weld nugget stronger compared to the parent material [1]. Because of the varying mechanical and thermal effects of the FSW process, microstructural gradients occur across the cross-section of the weld resulting in sub-regions known as the heat affected zone (HAZ), thermo-mechanical affected zone (TMAZ) and stir zone (SZ). The behavior of a FSW structure is, therefore, dependent on the local properties of each sub-region [2,3]. Several traditional techniques have been used in an attempt to obtain local properties of FSW, such as testing miniature tensile specimens machined from various weld zones [4] and instrumented ball indentation methods [5]. However, these methods are extremely time-consuming, and the spatial resolution was often not sufficient to isolate the different FSW sub-regions.
Digital image correlation (DIC) is a well-established technique that has been used for measuring full-field displacement and strain fields in welds [2,3,6,7,8,9,10]. DIC has been used on FSW joints with the focus on attempting to assess the local material behavior of weld zones [2,3,7,8,11]. However, the optics used in these studies produced low spatial resolution images and also focused the local region of interest (ROI) either across the surface or through the weld cross-section. Due to the complex thermo-mechanical cycle that occurs in the FSW process, the microstructures produced on the surface and in cross-section of the FSW are distinct [12] and for a complete analysis micrographs of both are required. Furthermore, the weld nugget contains fine recrystallized grains alongside a slight thickness reduction produced by the plastic deformation experienced in the FSW process [13]. During tests in uniaxial tension, the local geometry variations at the weld produce an out-of-plane displacement, which can be accounted for using stereo DIC [14]. Nevertheless, most DIC studies on FSWs used specimens that were machined to the reduced thickness of the weld nugget to avoid any out-of-plane displacements [2,13]. Although this approach enables a more accurate single-camera (2D) DIC, it neglects the effects that the post-weld machining procedure may have on the material microstructure and its effect on the local strain distributions. Notably, only [13] considered the local thickness variations of the FSW weld on the post-processed DIC results, but, in general, the FSW geometry and its effect on local strain distribution have not been considered [2,3,7,8,11].
In the present paper, a high-resolution (HR) DIC approach is developed and validated and represents the first step in providing a holistic understanding of the mechanical behavior across the FSW. HR-DIC requires imaging at a very high magnification using a macro lens, which provides a narrow depth of field due to its short focal length [15] and a limited field of view. Therefore, in the process of developing the HR-DIC approach, the following significant experimental and post-processing challenges are addressed:
  • The effect of the geometry of the test specimen in the region of the weld causes out-of-plane deformations and consequent parasitic in-plane strains. Executing stereo DIC at the short focal length necessary for the macro lens is practically impossible, so a means of identifying the out-of-plane displacement is developed which allows the parasitic strains to be removed from the in-plane strains obtained by the HR-DIC.
  • The limited field of view of the macro lens means that the entire weld region cannot be captured by a single image. Hence, it is necessary to develop an experimental methodology that enables sequential loading and the capture of multiple images across the weld region to fully exploit the full-field nature of DIC.
  • The capture of the separate images requires that an image stitching procedure is developed to provide the strain field across the entire welded region.
To systematically address these challenges, the present paper introduces a novel experimental procedure based on HR-DIC and optical measurements of specimen geometry, which allows the local material properties of the FSW to be determined. First, the effect of the welding process on the material structure is established, using optical and Electron Backscatter Diffraction (EBSD) micrographs, as well as microhardness indents across the weld. The welded specimen is not machined to avoid any risk of modifying the weld material structure. Instead, the specimen geometry over the region of the FSW was determined from an Alicona infinite focus variation microscope and used to determine the applied stress across the welded region accounting for the section change. HR-DIC is applied to capture the strain fields both on the surface and in the through-thickness cross-section of a realistic FSW at high spatial resolution, which enables a procedure for removing the parasitic strains resulting from any out-of-displacement from the analysis. An image processing procedure is developed so that the strain maps obtained from small regions across the weld using the HR-DIC are sequentially stitched together to generate a full field strain map over the region of the FSW. It is demonstrated that the HR-DIC procedure can be used to accurately capture the strain across the weld by validating the procedure in the elastic region. Although residual stress will be present in the FSW specimens [16,17,18], this study cannot directly consider the effect of the residual stress. This is because, DIC relies on a strain change and therefore, cannot account for residual stress. Furthermore, the effects of residual stress will become apparent when the material is loaded beyond its elastic limit, which is not covered in the present paper.

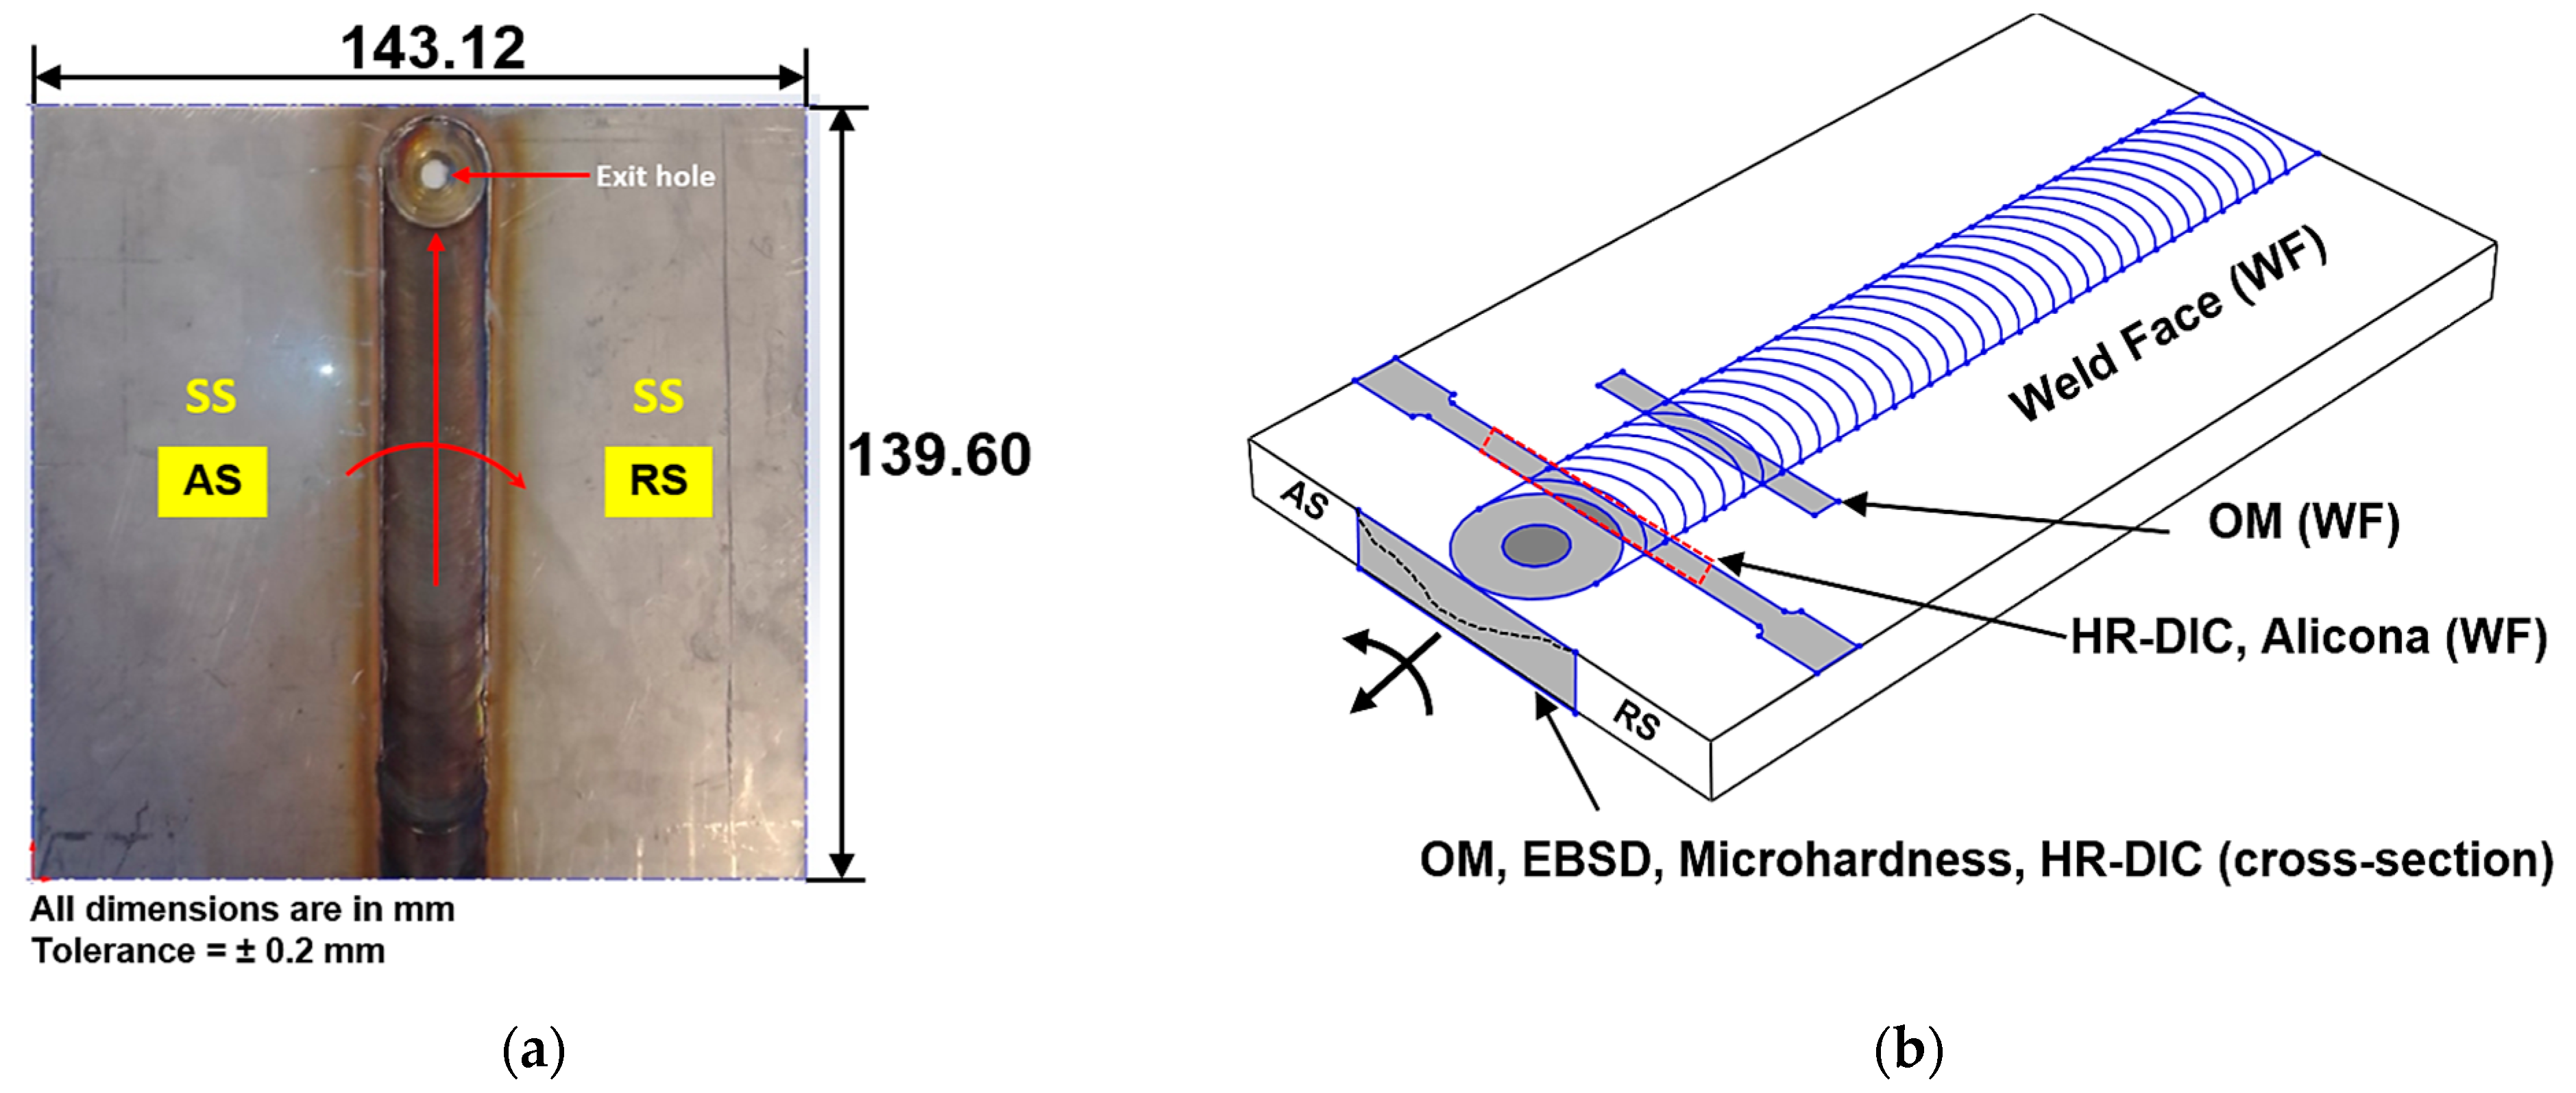
2. Materials and Test Specimen Preparation

The material used in this study was AISI 304 austenitic stainless steel (SS) sheet with dimensions of 139.60 mm wide × 71.56 mm long × 2 mm thick; the manufacture’s quoted chemical composition of the AISI 304 SS material is provided in Table 1. Two sheets of the material were FSW (using the parameters given in Table 2) across their width, parallel to the rolling direction of the sheets, to create a butt weld. The FSW process parameters were chosen following an optimization study, which is described in [19]. The FSW tool material was tungsten-1% lanthanum alloy with a convex shoulder and tapered cylindrical pin; the FSW (SS-SS) sheet joint is shown in Figure 1a. The advancing (AS) and retreating sides (RS) of the tool with respect to the finished plate are indicated in Figure 1a. Figure 1b shows a schematic representation on the finished FSW plate, with the approximate positions of the specimens cut for the DIC, microstructural, and microhardness analysis.
ASTM E3-11 [20] was followed for the preparation of metallographic specimens. For the EBSD analysis, the specimen was finally polished with 0.04 μm colloidal silica solution for 45 min. To reveal the weld microstructures through optical microscopy, the final polished specimen was etched with a chemical solution containing a mixture of 20 mL FeCl3 and 20 mL HCl. All the microstructures in the vicinity of the weld were observed using an optical microscope (Make: Olympus, Tokyo, Japan; Model: BX51). For EBSD characterization, the sample was tilted at 60° inside the field-emission gun scanning electron microscope (FEG-SEM) (Make: JEOL, Tokyo, Japan; Model: 6500F) chamber with an accelerating voltage of 20 kV and probe current of 17 nA at a working distance of 20 mm. To resolve the fine recrystallized grains of the weld nugget, a step-size of 0.5 μm was used to achieve the best spatial resolution during the EBSD analysis.
ASTM E384-16 [21] was followed when preparing the weld specimens for microhardness measurements. The microhardness variations were measured across the weld cross-section in the fine polished specimen using a digital microhardness tester (Make: Future tech, Kawasaki, Japan; Model: FM-300). All the indents were placed at a load of 50 g with a dwell time of 15 s. The distance maintained between each indent in both directions was 0.1 mm. This value was determined as per the ASTM standard by calculating the average diagonal length of a group of indents (d) and therefore, the distance between the indents was maintained at greater than 2.5d by choosing this consistent spacing.
To measure the FSW (SS-SS) weld geometry profile, an optical 3D non-contact measurement system, Alicona infinite focus (IFM) microscopy (Infinite Focus G4, Alicona, Graz, Austria) was used at 50× magnification with a vertical resolution of 1 μm. The FSW transverse tensile specimens (length perpendicular to the welding direction as shown in Figure 1b) were produced according to ASTM: E8/E8M-16a [22] by water jet cutting to the dimensions shown in Figure 2a. The specimen at the end of the weld was chosen in this study to verify the methodology developed in the material elastic region, as any variation in microstructure will have little effect on the elastic properties of the material; the specimens from the center of the plate were reserved for a study where the elastic limit is exceeded, which will be presented elsewhere. The fine black speckled pattern required for the HR 2D-DIC analysis was created using an airbrush kit (Make: Clarke, Dunstable, UK; Model: CAB 3P) operated at 40 psi pressure with a 0.2 mm diameter nozzle on a white painted background specimen using Createx paint as shown in Figure 2b.
The ROI for HR 2D-DIC strain measurements and the HR 2D-DIC experiment set-up are shown in Figure 3a,b, respectively. All the tests were performed within the material elastic range in an Instron-8800 servo-hydraulic testing machine (Instron, Wycombe, UK) equipped with 5 kN load cell. The specimen was tested in the position control mode at a displacement rate of 0.1 mm/min. The HR-DIC system consists of 16 MP CCD camera (Make: LaVision, Gottingen, Germany; Model: Imager Lx) having a resolution of 4904 × 3280 pixels fitted with a Canon MP-E 65 mm focal length macro lens. Through these high-resolution optics, the images were captured at the spatial and strain resolution of 300 pixel/mm and 1.4971 × 10⁻⁵ ± 6.4390 × 10⁻⁵, respectively. Adequate illumination was provided throughout the test with a pair of 40 W LED lights, and all the images were recorded at a frame rate of 1 Hz during the DIC experiments. Load values for each image being captured were recorded using a separate Analog to Digital converter (ADC) channel data acquisition system. The specimen surface was maintained perpendicular to the camera sensor axis. All the recorded images were processed using commercial data correlation software LaVision (DaVis 8.3.1, LaVision, Gottingen, Germany). This software uses the least square difference method (LSM) to compute the position of displacement vector fields and also employs a 6th order spline interpolation to achieve sub-pixel displacement accuracy. All the HR-DIC data were processed using a subset size of 59 × 59 pixels and step size of 10 to increase the correlation accuracy and also to minimize noise in the strain maps. The DaVis system employs a central difference scheme to compute the strain values using a fixed strain window size of three data points.
To maintain the same spatial resolution at different ROIs during the HR-DIC experiments, the cross-head of the servo-hydraulic test machine was moved at sequential stages instead of adjusting the position of the tripod where the HR-DIC optics were mounted. This procedure was adopted because of the narrow depth of field of HR-DIC optics to eliminate any need to adjust the optical stage on which the camera was mounted and hence, maintain a constant spatial resolution for each image. Thus, the position of HR-DIC optics was fixed throughout the mechanical tests. It is important to note that the sequential loading approach can only be used for tests conducted in the material elastic region but is acceptable for the purposes of validating the HR-DIC procedure, which is the object of the paper.

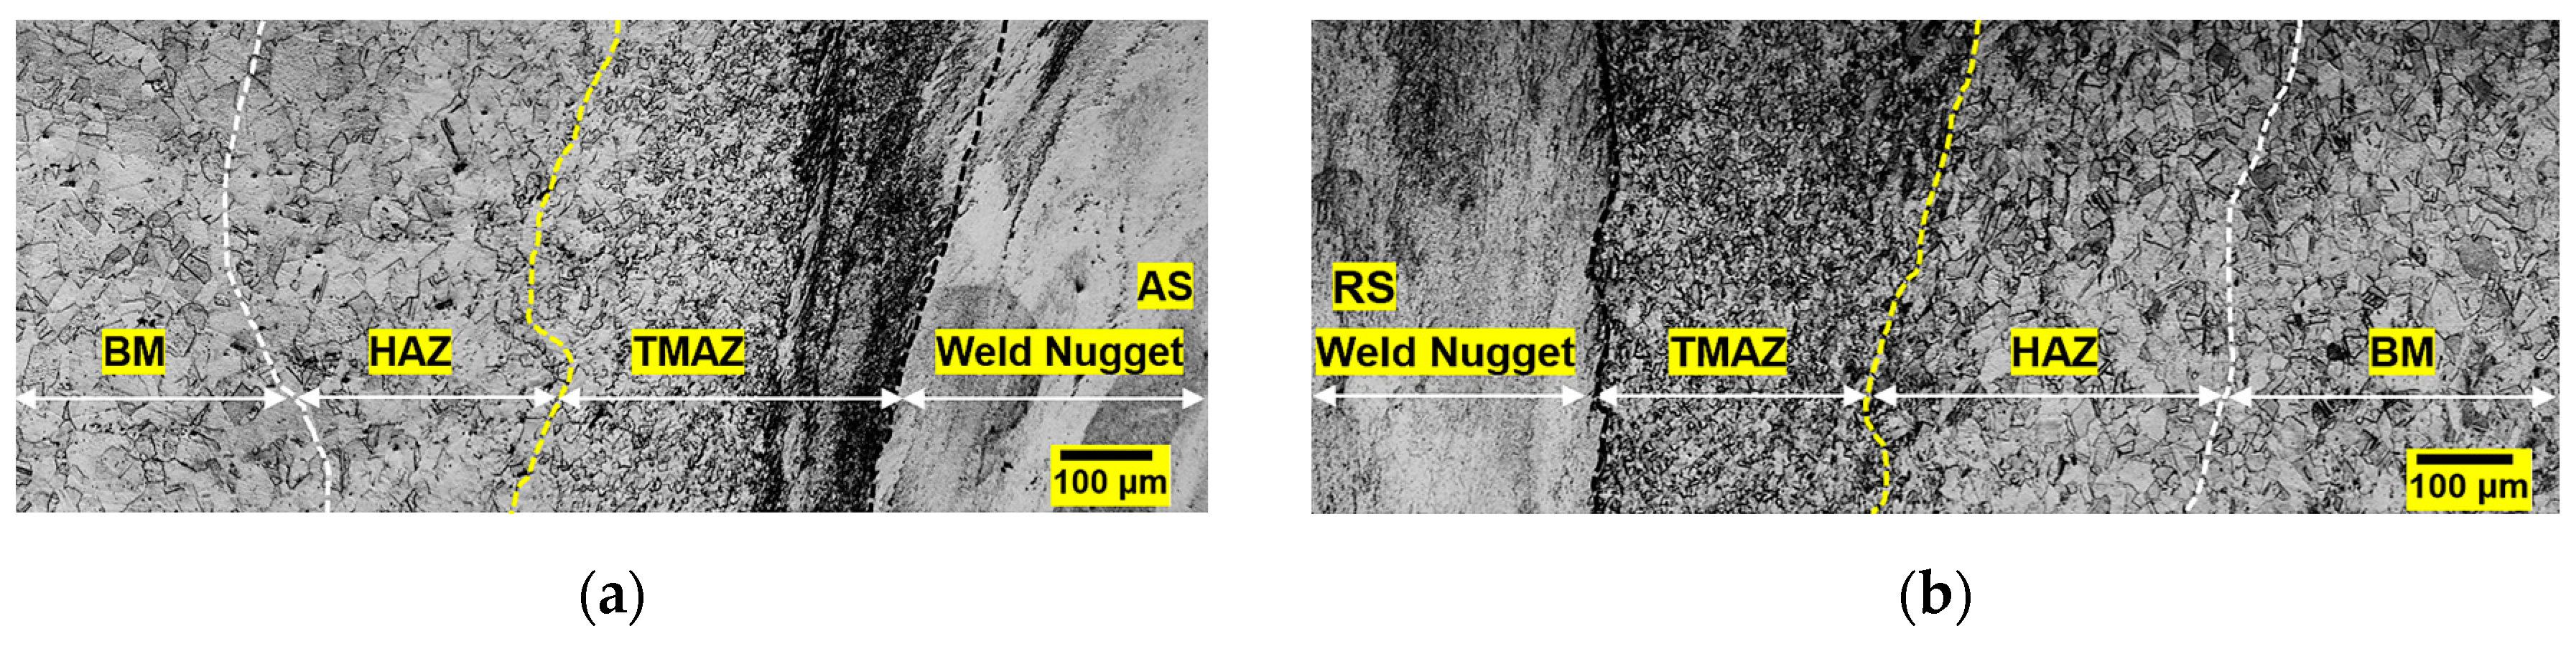
3. Microstructural Characterizations

To locate the various zones in the vicinity of the weld, the optical micrographs were stitched using the Image-J (Fiji) open-source image analysis software. The theory behind this stitching method has been explained elsewhere [23]; an overview of the procedure is given in Figure 4. To summarize, the Image-J software uses a Fourier shift theorem based stitching algorithm that correlates the pixel grey level intensity values in the image so that the pixel coordinates in the overlap region can be obtained with sub-pixel accuracy [23]. Based on the computed pixel coordinates, the sequence of images is fused using a linear blending method, where the grey level intensity of the overlapped region is adjusted. Figure 5 shows the sequentially stitched optical micrographs along the surface and transverse cross-section of the FSW (SS-SS) weld. From these micrographs, it can be seen that the weld has no major defects with no obvious sharp weld interface evident in the joint. The micrograph shown in Figure 5 covers the weld regions of the Base metal (BM), HAZ, TMAZ, and weld nugget. However, the regions are not clearly distinguished by the grain morphology, so the regions shown in Figure 5 provide only an approximate indication of location. The surface micrographs in Figure 5a,b show typical austenite grains expected from the 304 SS BM and the corresponding HAZs exhibit slightly coarser grains compared to the BM (Figure 5a,b). Figure 5a shows a sharp contrast between the grains in the TMAZ and weld nugget along the weld surface. The weld nugget has achieved extremely fine equiaxed grains due to the dynamic recrystallization (DRX) effects produced by the combined frictional heat and severe plastic deformation of the FSW process. This same finding has been confirmed elsewhere [24,25]. In addition to that, the cross-sectional micrograph of the weld nugget (Figure 5c) displays the classical ‘onion rings’ [26,27,28] associated with the thermoplastic metal flow induced by the tool action during the FSW process. These elliptical onion rings are the compilation of multiple vortex layers, and the size of these layers are usually related to the tool geometry as well as FSW process parameters [28]. As shown in Figure 5c, there is another layer of fine recrystallized grains on the tool shoulder affected region, and these grains are slightly coarser than the grains observed in the weld nugget.
Figure 6a shows the SEM image captured at FSW (SS-SS) weld interface using backscattered electron (BSE) method. By using the SEM-BSE technique, the compositional variations of an element can be differentiated through varying contrast with respect to its atomic number. Sharp contrast variations between the FSW nugget and the region close to the weld nugget are clearly observed in Figure 6a confirming that the atomic number of the elements present in the weld nugget and the surrounding material are distinct. To investigate further, SEM-EDS elemental mapping was performed on the same location (Figure 6b) which showed that the weld nugget contained tungsten. The same is clearly evidenced in the EDS horizontal line profile performed across the weld interface, as shown in Figure 6c, where there is a sharp dip in the tungsten at the weld interface. As the FSW tool material is made from tungsten, it is clear that deposits of tungsten are being incorporated in the weld nugget during the stirring process. FSW tool wear has been widely reported [29] in the joining of high melting point materials, such as stainless steel, because of their high melting point. The addition of the tungsten in the weld nugget revealed by the SEM-EDS may have an effect on the mechanical response of the weld nugget region, which is discussed in later sections of the paper.
The boundary along the weld cross-section between the TMAZ/weld nugget is not resolved in the optical micrographs (Figure 5c) or in subsequent SEM-SEI studies, due to the limitations in magnification and spatial resolution of these techniques. To identify the boundary between the different weld regions especially between the weld nugget/TMAZ and TMAZ/HAZ regions, an SEM-EBSD analysis was performed exclusively along the weld cross-section to observe the varying grain size between these weld sub-regions.
Figure 7a,b shows the inverse pole figure (IPF) based grain orientation maps of the SS BM and HAZ/TMAZ/weld nugget interfaces, respectively. IPF orientation components of the EBSD map represent the direction of the grain orientations, such as <100>, <110>, <111>, with respect to the plane normal. For cubic crystalline systems, grain orientations, such as <100>, <110>, <111>, are represented by the red, green, and blue color coding scheme, respectively, as shown in Figure 7a. All the intermediate orientations of grains are then coded by the mixture of RGB coloring scheme. The coarse austenite grains with randomly distributed annealing twins are observed in the SS-BM (Figure 7a). A sharp spatial transition from the weld nugget to TMAZ as well as from the TMAZ to HAZ is evident in Figure 7b. The weld nugget has undergone significant stirring by the tool, so the grains distributed in the weld nugget have more random orientations compared to other weld sub-regions. By post-processing the EBSD micrographs, the average grain size of the BM, TMAZ, and Weld nugget (WN) sub-regions were given as 14.89 ± 4.02 μm, 6.68 ± 1.63 μm, and 1.21 ± 0.81 μm, respectively. In summary, it can be seen in both the optical/SEM micrographs and the SEM-EBSD analysis that there are significant differences in the microstructure across the FSW because of the distinct frictional and thermoplastic effects experienced by these regions. The microstructural findings confirm the distinct microstructural features between the FSW weld-surface and its cross-section.

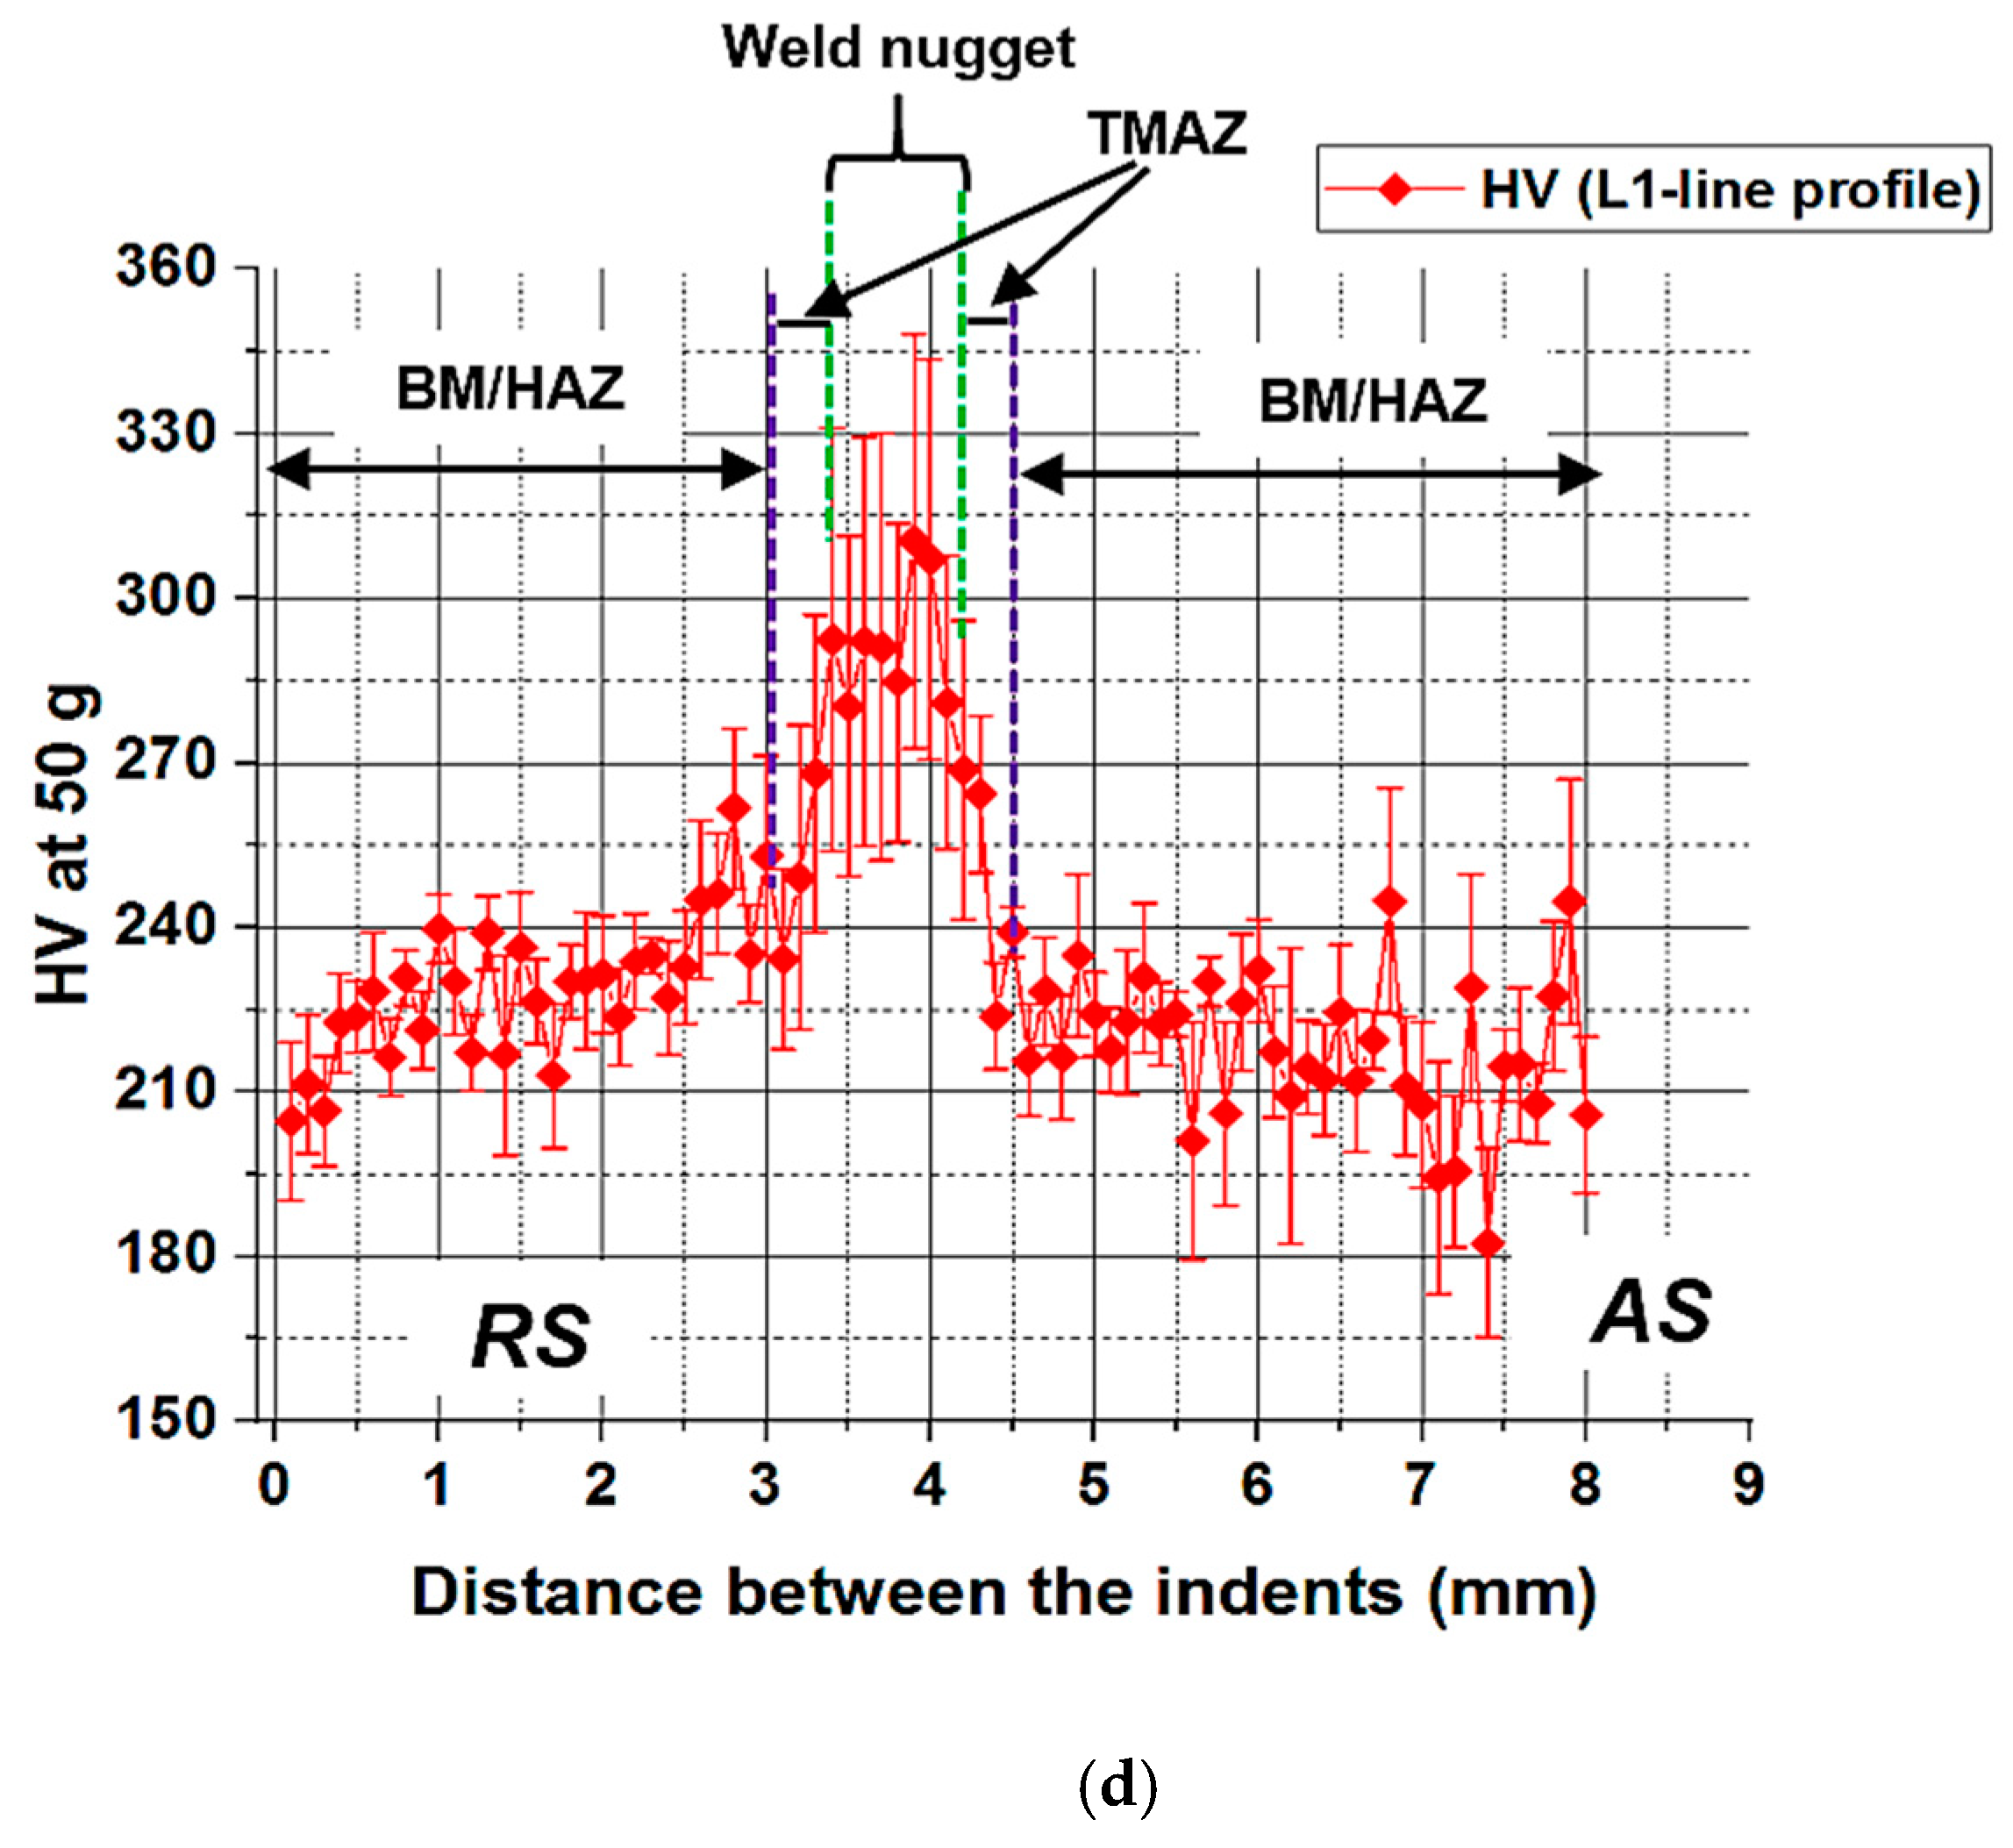
4. Microhardness Measurements

Figure 8a shows the ROI screened for microhardness measurements, and the hardness indents positioned on the ROI is shown in Figure 8b. The microhardness contour map of the FSW (SS-SS) weld is given in Figure 8c; it is clear that the hardness of the weld nugget up to 0.25 mm from the weld surface is much greater than that of both the AS and RS weld zones. This is because the pin on the tool is shorter than the sheet thickness, and cannot fully penetrate through-thickness of the sheet [24].
To spatially locate the hardness gradients between various subregions of the FSW (SS-SS) weld, the hardness data points measured across the horizontal line L1 shown in Figure 8c are plotted as a line profile in Figure 8d. From Figure 8d, the indication is that both SS BM and its HAZ have similar hardness with an average of 226 ± 0.7 HV, confirming the low heat input characteristics of the FSW process and contrasts markedly with what would be seen in a typical fusion weld. Additionally, a sharp upward change in hardness is noted at the TMAZ into the weld nugget corresponding with the partially recrystallized and deformed grains of the TMAZ. The weld nugget has maximum hardness compared to other weld sub-regions with the average hardness value of 281 ± 2.8 HV. It should be noted that other research, e.g., [24], has shown that the TMAZ had maximum hardness, indicating a possible dependence on the welding parameters. However, it should be considered that the obvious increment in hardness values at the weld nugget is associated with its high degree of grain refinement, based on the Hall-Petch relationship [30]. Figure 8d shows that the various FSW weld sub-regions can be identified in the line profile taken across the weld. However, the interface between the BM and its HAZ cannot be detected in the hardness profile as the hardness values of these zones are close to each other.

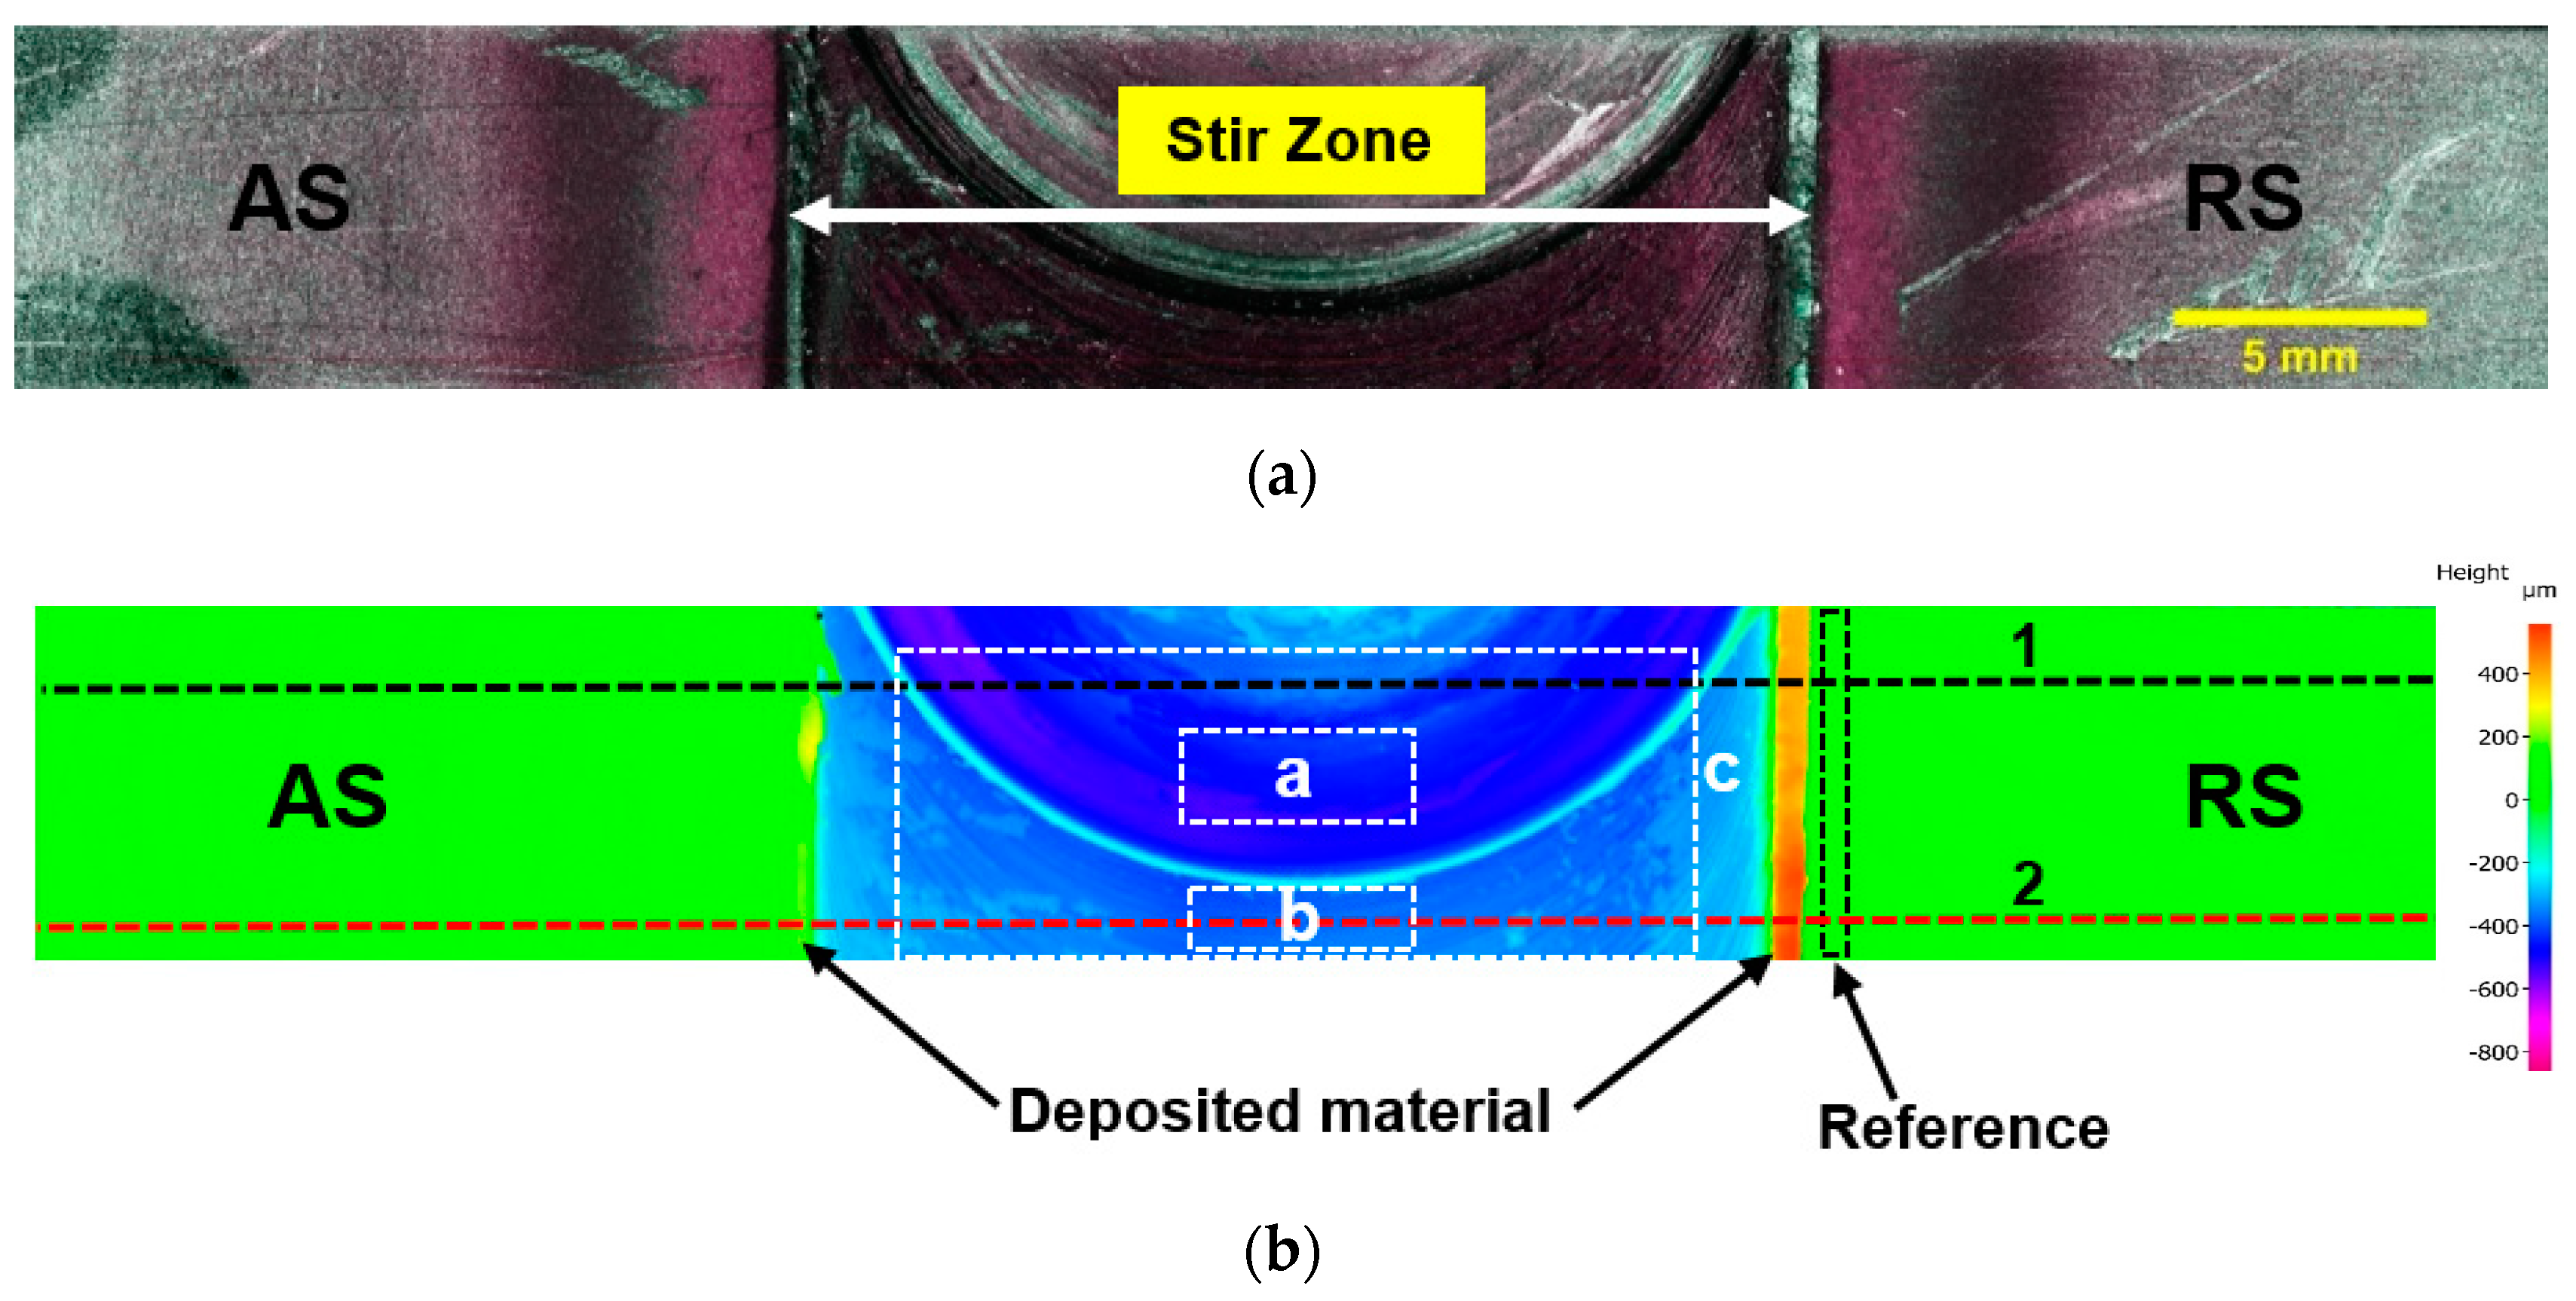
5. FSW (SS-SS) Weld Surface Geometry

It is clearly visible in Figure 9a that the cross-section of the weld nugget is thinner than the base material. The impact is that when the specimen is loaded in tension to perform the DIC, an offset loading will be experienced across the welded section causing a non-uniform strain through the thickness of the welded region. Therefore, it is necessary to establish the geometry change in the FSW (SS-SS) specimens. This was carried out using an Alicona optical 3D measurement system. The Alicona 3D surface topography maps derived from the trial Alicona scans (vertical resolution: 4 μm) on the ROI-1 and ROI-2 of Figure 9a with respect to their reference position (height = 0 μm) are shown in Figure 9b,c, respectively. From these maps, a sharply reduced thickness in the weld nugget is clearly evident. It is noteworthy that the thickness reduction is more predominant in the RS than the AS of the weld. The Alicona full-field measurements provide the specimen thickness measurements that are used to calculate the stress in the cross section in the DIC stress-strain behavior analysis. A suitable ROI (shown in Figure 10a) in the weld surface of a tensile specimen was chosen for the Alicona full-field surface measurements. Figure 10b shows the Alicona derived (vertical resolution: 1 μm) whole weld geometry embedded with local thickness variation measurements. Here the large thickness reduction in the weld nugget and especially the shoulder affected region (“a” in Figure 10b) is evident. An additional thickness reduction in the region “a” was due to an extra dwell time spent by the tool shoulder while retracting the tool at the end of the FSW process. By post-processing the Alicona 3D data points, the average thickness reduced in the region “a”, “b”, and “c” are determined as 0.48 ± 0.042 mm, 0.34 ± 0.027 mm, and 0.40 ± 0.075 mm, respectively. The thickness variations across the horizontal lines (1, 2) as illustrated in Figure 10b are plotted as line profiles shown in Figure 10c. From Figure 10c, it is important to note that the outer boundaries of the weld nugget had a marginal increase in thickness (0.2 to 0.5 mm) with respect to the reference position because of extruded material depositions during the FSW process. Moreover, the line profiles also reveal the presence of minor deformation in the joint (<0.05 mm), which is removed when the specimen is subjected to tensile stress during the mechanical tests.

6. HR Strain Measurements

6.1. Image Stitching Procedure

As the HR-DIC measurements have a limited field of view, it is necessary to employ an image stitching algorithm to combine an array of DIC strain maps to obtain the full-field strain distributions over the entire welded region. Figure 11a shows the welded region divided into six ROIs for the HR-DIC strain measurements with their corresponding speckle patterns imaged using the HR-DIC optics. The grey scale DIC images from each ROI captured at the same load step were sequentially stitched (Figure 11b) through the Image-J (Fiji) software, as explained in the optical micrographs section of the paper. The fidelity of the Image-J grid plugin for stitching the DIC strain maps has been tested [31] and clearly evidenced that this method has minimum interpolation error compared to other stitching methods.
Initially, DIC was performed on the stitched images, but this resulted in a series of artifacts in the stitched region, as shown in Figure 12. This is due to an interpolation error caused by the different sub-pixel accuracy of the DIC correlation software and Image-J software. Additionally, an intensity smoothing made by the image stitching software at the overlapped region further amplifies the error during correlation through the DIC software, as mentioned in [31]. To further compound the difficulties the procedure used to capture the images results in lighting fluctuations due to the close proximity of the lens to the test specimen. Hence to avoid the artefacts, the post-processed individual DIC strain maps were stitched to visualize the strain distribution over the entire field. As the Image-J stitching procedure works only on grey scale images, it is not straightforward to stitch the RGB color format DIC strain maps. However, the pixel coordinates derived from the overlapped grey scale images can be used as reference points to stitch the corresponding DIC strain maps. Due to the step size of ten pixels in overlapping the subsets of DIC correlation, the resolution of the DIC strain map is 246 × 206, i.e., one-tenth of the pixel resolution of speckle map (2460 × 2060) as shown in Figure 13. To spatially stitch the strain data using the already computed overlap coordinates of the speckle maps, the overlap coordinates determined from the high spatial resolution speckle maps must be scaled to the resolution of the strain map. To achieve this, it is necessary to export TIF images of the strain map, which are compressed and hence, further image processing is required. Adobe Photoshop was used to adjust the spatial resolution of the strain maps to one-tenth of the greyscale images (246 × 206) captured by the camera by using a bicubic interpolation to generate strain maps as represented in Figure 14.
Figure 14 shows the procedures for stitching the RGB strain map images using the strain map coordinates determined from the grey scale images based on the overlap pixel coordinates. During the stitching process, the series of strain maps (RGB) are converted into their equivalent grey scale format, and the necessary spatial translations performed to align the images with the strain map coordinates of the overlapped region. All the spatially translated strain maps are fused at the overlapped region using a linear blending method. The finally stitched grey scale strain map is converted into its equivalent RGB color format, as shown in Figure 14. The reliability of the stitching approach using the derived strain map coordinates of the overlap region is verified by extracting correlation coefficients using Image-J. The average correlation coefficient achieved by the final stitched strain maps was 0.93 ± 0.019, which shows a high degree of confidence in the accuracy of the image stitching. The procedure provides only a visualization in the form image of the full field strain distribution. Therefore, it is necessary to devise a means of stitching the displacement/strain data so that further manipulation and interrogation of the data can take place. This would enable strain values at discrete points to be extracted and combined to allow, e.g., principal strain and stress maps to be produced.

6.2. HR-DIC Strain Data Stitching Procedure

To interrogate the stitched strain maps, it is necessary to devise a means of stitching the HR-DIC strain data [31,32] implemented using the image processing functions of Image-J and MATLAB. Figure 15a shows the sequential steps involved, where each array of strain data obtained from the different ROIs was imported from DIC correlation software (DaVis) into image J using a MATLAB script. By using the strain map overlap coordinates derived in the previous section, the appropriate spatial translations were made to align the strain data with sub-pixel accuracy. As in the previous section, the spatially translated data sets (grey scale) were fused in the overlap region using a linear blending method. Then MATLAB was used to convert the Image-J stitched strain data (grey scale) into a color contour plot shown in Figure 15b, i.e., a full-field strain map where data interrogation is possible. To confirm the reliability of the stitching approach, the strain values along the vertical line shown in the color contour plot in Figure 15b were correlated with the manually aligned strain data sets shown in Figure 15b. In the manual method, the data in the overlap was aligned visually, and the average strain value taken from the two overlapping points. From Table 3, it is noteworthy that the coefficient of variation of strain (%) along the vertical line (shown in Figure 15b) of the BM-AS and weld nugget regions derived from the manual and MATLAB based stitching methods are close to each other; the difference noticed on the BM-RS may be due to lighting variations. This agreement between the manual method and the MATLAB stitching confirms the accuracy of the stitching approach.

6.3. HR-DIC Strain Measurements and Procedure for Removing Parasitic Strains

Figure 16a shows the full-field stitched strain maps derived from the weld face (WF), weld root (WR) and weld cross-section (CS) at 2.5 kN tensile load. It is clear that both the base material regions (AS and RS) have more uniform strain distributions than the weld nugget (WF). Furthermore, the strain gradient is clearly evident across the weld nugget CS due to the specimen bending caused by the reduced thickness of the weld nugget. In Figure 16a, on the WR side of the specimen, there are two localized regions of high strain. One region is at the joint and is simply where the weld has not penetrated through the material, and the other is a small crack occurring close to the interface of the weld nugget. There is no indication of the crack in the weld CS image because the spatial resolution is not sufficient to identify a crack. The cracks are visible in the high-resolution images of the specimen shown in Figure 16b. Figure 17b shows the strain measurements (WF and WR) plotted along the line as shown in Figure 17a. There are large strains at the interface between the stir zone and the base material on the WF, which could be attributed to the inevitable stress concentration due to the rapid change in geometry. However, it should be considered that the build-up of material on the RS highlighted in the Alicona images, would defocus the cameras, and may also produce some decorrelation. There is a clear increase in strain in the stir zone on the WF and a reduction on the WR; the average of the two values gives the same strain as that of the theoretical value of weld nugget. This clearly shows that the specimen is bending as a result of the thinner cross-section in the stir zone; it is noticeable in the line plots in Figure 17c that the strain away from the stir zone on both the WF and WR sides of the specimen have the same value as expected in theory. Figure 17c also shows the shear (εxy) and transverse (εxx) strain plots derived from the average of WF and WR, and these plots are also close to theory. Thus, the bending has led to out-of-plane displacements and therefore, the parasitic strains caused by rigid body motion towards and away from the DIC optics, which are included in the DIC measured in-plane strains on the weld nugget. The theoretical strain value (εyy = 0.001) of the weld nugget at 2.5 kN is calculated based on its cross-section area measured through Alicona (13.04 mm2) and known elastic modulus of the 304 SS (E = 190 GPa).
To validate the procedure, a stress-strain curve was developed for the data taken from the base metal and weld nugget regions from both the WF and WR faces of the specimen, as shown in Figure 18a. The stress was adjusted to take account of the reduction in cross-sectional area in the nugget region. The local stress-strain curves derived from the BM and weld nugget of WF and WR are shown in Figure 18b. The elastic modulus is determined from linear fitting the stress-strain curves in each region of interest indicated in Figure 18b. It is noted that both the BM regions (AS and RS) of WF and WR have an elastic modulus very close to the theoretical value. The elastic modulus derived for the weld nugget on the WF side was 100 ± 1 GPa and for the weld nugget on the WR shows infinite stiffness, thus, providing an excellent illustration of the deleterious effect of the out-of-plane deformation on DIC measurements. Hence, as stereo DIC cannot be applied, there is a necessity to apply an appropriate correction procedure to remove the parasitic strains from measured in-plane strains across the FSW weld nugget.
The out-of-plane displacement was evaluated from the DIC measurements carried out on the CS, as shown in Figure 19a. From this procedure, the average out-of-plane displacement (ΔZ) was measured on the weld nugget (CS) at different load values. An average parasitic strain (ΔZ/Z) at a particular load value can be calculated by using the known stand-off distance (Z) and its corresponding (ΔZ). Hence, the corrected strain at a particular load value was derived by eliminating the parasitic strains from the DIC measured strains. The modified stress-strain curves of the weld nugget (WF and WR) determined by applying the above correction procedure are shown in Figure 19b. After applying the correction procedure, Young’s modulus of the weld nugget on the WF and WR faces were determined as 193 ± 2 GPa and 201 ± 3 GPa, respectively. These elastic moduli values are very close to the expected theoretical value which validates the reliability of this procedure. A simple check can be carried out by taking the average values from the uncorrected stress-strain curve of the weld nugget (WF, WR). A plot is shown in Figure 19b, which shows excellent agreement between the average values and the theoretically obtained stress-strain curve. The procedure developed to determine the out-of-plane deformation confirms that the error is due to bending across the reduced cross-section of the weld nugget. Moreover, all the aforementioned key findings prove that the HR-DIC erroneous strain measured on the weld nugget (WF, WR) is exclusively an outcome of combined tensile and bending effects evolved due to local variations in the FSW weld geometry. The principal outcome is that to conduct accurate HR-DIC measurements on such a specimen it is necessary to monitor the strains from both the front and back of the specimens to account for the out-of-plane deformation in the elastic region where the material behaves homogeneously. However, as the material in the weld has different thermomechanical histories post-yield the deformation is likely to be heterogeneous and it will be necessary to measure the out-of-plane deformation in the edge of the specimen to properly account for the parasitic strains.
The work has shown that the tungsten composition variations in the weld nugget revealed by the SEM-BSE and EDS analyses have no effect on the measured elastic modulus of the weld nugget region. However, the microhardness measurements have shown that the region of the weld nugget is much harder than the other regions of the weld and the base material and it is not clear if this is as a result of the fine grains caused by the FSW process or the variation in tungsten levels. In the next stage of the work, which will use the procedures developed here, the yield strength of the individual materials in the vicinity of the weld will be established; this work is underway and will be presented elsewhere.

7. Conclusions

An experimental methodology has been developed and validated that enables high-resolution DIC to be conducted on the regions in a FSW joint using sequential loading possible only in the elastic region. Both image stitching and strain data stitching procedures have been developed that allow a detailed full field visualization and data interrogation of the strain fields, respectively, across the FSW. The following conclusions can be drawn from the work:
  • Meaningful data can be obtained from the as-manufactured FSW joint without the need to conduct post-weld machining to produce a specimen of uniform cross-section.
  • The parasitic effect of the out-of-plane displacements was eliminated using a correction procedure which was validated by showing that the elastic modulus could be obtained accurately in the weld nugget region.
  • An alternative to the stereo-DIC method has been devised, which is particularly applicable where high magnification and small stand-off distances are used.
  • To apply the procedure, establishing the correct weld geometry is essential to obtain accurate stress values; this was done using an Alicona infinite focus 3D optical microscope.
To confirm the weld microstructure and help to interpret the results, optical micrographs of the FSW were captured along the WF and CS regions to approximately identify the local weld zones (HAZ, TMAZ, and weld nugget) based on their grain morphology. The findings were as follows:
  • Only the SEM-EBSD micrograph of the weld was able to show the clear, distinct boundary between the weld nugget and TMAZ as well as TMAZ and HAZ.
  • The microhardness measurements revealed that the FSW weld nugget has the greatest hardness compared to the other local weld zones.
  • The SEM-BSE/EDS results showed that there were significantly higher tungsten levels in the weld nugget resulting from tool wear during the FSW process, which could be linked to the increased hardness levels as well as the fine grain structure.
  • The tungsten did not modify the elastic modulus of the material in the weld nugget.
The study has demonstrated the significant challenges in obtaining accurate strain measurements using DIC on small specimens at sufficiently high resolutions to distinguish behavior over the locally different regions of the weld. The present paper has dealt only with a response under elastic loading and served to validate the measurement approach. The next phase will be to apply the technique to this material system under elastic-plastic deformation to identify the different yield behaviors across the FSW joint. The sequential loading procedure will require modification as loading and unloading is not possible.

Author Contributions

Experimental investigation and results analysis, S.R.; Novel methodology, S.R., P.A.S.R. and J.M.D.-B.; Test specimen production, A.K.L.; Supervision, P.A.S.R. and J.M.D.-B.; Manuscript preparation and revision, S.R., P.A.S.R., and J.M.D.-B.

Funding

This research received no external funding.

Acknowledgments

The experimental work described in the paper was conducted in the Testing and Structures Research Laboratory (TSRL) at the University of Southampton https://www.southampton.ac.uk/engineering/research/facilities/360/tsrl_360.page. The authors are grateful for the support received from Andrew Robinson, the TSRL Principal Experimental Officer. The authors acknowledge Daniel Bull, a Research Fellow at the University of Southampton for his help in developing the image stitching procedures. The authors also thank the Department of Mechanical Engineering, SSN College of Engineering (Autonomous)-Affiliated to Anna University Chennai, India for supplying the FSW test specimens.

Conflicts of Interest

The authors declare no conflicts of interest.

References

  1. Mishra, R.S.; Ma, Z.Y. Friction stir welding and processing. Mater. Sci. Eng. R Rep. 2005, 50, 1–78. [Google Scholar] [CrossRef]
  2. Reynolds, A.P.; Duvall, F. Digital image correlation for determination of weld and base metal constitutive behaviour. Weld. Res. Suppl. 1999, 78, 355–360. [Google Scholar]
  3. Lockwood, W.D.; Reynolds, A.P. Simulation of the global response of a friction stir weld using local constitutive behavior. Mater. Sci. Eng. A 2003, 339, 35–42. [Google Scholar] [CrossRef]
  4. Velu, M.; Bhat, S. Metallurgical and mechanical examinations of steel–copper joints arc welded using bronze and nickel-base superalloy filler materials. Mater. Des. 2013, 47, 793–809. [Google Scholar] [CrossRef]
  5. Ambriz, R.R.; Chicot, D.; Benseddiq, N.; Mesmacque, G.; de la Torre, S.D. Local mechanical properties of the 6061-T6 aluminium weld using micro-traction and instrumented indentation. Eur. J. Mech. A. Solids 2011, 30, 307–315. [Google Scholar] [CrossRef]
  6. Sutton, M.A.; Yang, B.; Reynolds, A.P.; Yan, J. Banded microstructure in 2024-T351 and 2524-T351 aluminum friction stir welds: Part II. Mechanical characterization. Mater. Sci. Eng. A 2004, 364, 66–74. [Google Scholar] [CrossRef]
  7. Mironov, S.; Onuma, T.; Sato, Y.S.; Yoneyama, S.; Kokawa, H. Tensile behavior of friction-stir welded AZ31 magnesium alloy. Mater. Sci. Eng. A 2017, 679, 272–281. [Google Scholar] [CrossRef]
  8. Mironov, S.; Sato, Y.S.; Yoneyama, S.; Kokawa, H.; Fujii, H.T.; Hirano, S. Microstructure and tensile behavior of friction-stir welded TRIP steel. Mater. Sci. Eng. A 2018, 717, 26–33. [Google Scholar] [CrossRef]
  9. Texier, D.; Zedan, Y.; Amoros, T.; Feulvarch, E.; Stinville, J.C.; Bocher, P. Near-surface mechanical heterogeneities in a dissimilar aluminum alloys friction stir welded joint. Mater. Des. 2016, 108, 217–229. [Google Scholar] [CrossRef]
  10. Saranath, K.M.; Sharma, A.; Ramji, M. Zone wise local characterization of welds using digital image correlation technique. Opt. Lasers Eng. 2014, 63, 30–42. [Google Scholar] [CrossRef]
  11. Wang, Y.-F.; An, J.; Yin, K.; Wang, M.-S.; Li, Y.-S.; Huang, C.-X. Ultrafine-Grained Microstructure and Improved Mechanical Behaviors of Friction Stir Welded Cu and Cu–30Zn Joints. Acta Metall. Sinica (English Letters) 2018, 31, 878–886. [Google Scholar] [CrossRef]
  12. Yang, B.; Yan, J.; Sutton, M.A.; Reynolds, A.P. Banded microstructure in AA2024-T351 and AA2524-T351 aluminum friction stir welds: Part I. Metallurgical studies. Mater. Sci. Eng. A 2004, 364, 55–65. [Google Scholar] [CrossRef]
  13. Leitão, C.; Galvão, I.; Leal, R.M.; Rodrigues, D.M. Determination of local constitutive properties of aluminium friction stir welds using digital image correlation. Mater. Des. 2012, 33, 69–74. [Google Scholar] [CrossRef]
  14. Sutton, M.A.; Yan, J.H.; Tiwari, V.; Schreier, H.W.; Orteu, J.J. The effect of out-of-plane motion on 2D and 3D digital image correlation measurements. Opt. Lasers Eng. 2008, 46, 746–757. [Google Scholar] [CrossRef] [Green Version]
  15. Crammond, G.; Boyd, S.W.; Dulieu-Barton, J.M. Evaluating the localised through-thickness load transfer and damage initiation in a composite joint using digital image correlation. Composites Part A 2014, 61, 224–234. [Google Scholar] [CrossRef]
  16. Citarella, R.; Carlone, P.; Lepore, M.; Sepe, R. Hybrid technique to assess the fatigue performance of multiple cracked FSW joints. Eng. Fract. Mech. 2016, 162, 38–50. [Google Scholar] [CrossRef]
  17. Sepe, R.; Armentani, E.; di Lascio, P.; Citarella, R. Crack Growth Behavior of Welded Stiffened Panel. Procedia Eng. 2015, 109, 473–483. [Google Scholar] [CrossRef] [Green Version]
  18. Citarella, R.; Carlone, P.; Sepe, R.; Lepore, M. DBEM crack propagation in friction stir welded aluminum joints. Adv. Eng. Software 2016, 101, 50–59. [Google Scholar] [CrossRef]
  19. Lakshminarayanan, A.K. Enhancing the properties of friction stir welded stainless steel joints via multi-criteria optimization. Arch. Civ. Mech. Eng. 2016, 16, 605–617. [Google Scholar] [CrossRef]
  20. ASTM E3-11. Standard Guide for Preparation of Metallographic Specimens; ASTM International: West Conshohocken, PA, USA, 2017. [Google Scholar] [CrossRef]
  21. ASTM E384-17. Standard Test Method for Microindentation Hardness of Materials; ASTM International: West Conshohocken, PA, USA, 2017. [Google Scholar] [CrossRef]
  22. ASTM E8/E8M-16a. Standard Test Methods for Tension Testing of Metallic Materials; ASTM International: West Conshohocken, PA, USA, 2016. [Google Scholar] [CrossRef]
  23. Preibisch, S.; Saalfeld, S.; Tomancak, P. Globally optimal stitching of tiled 3D microscopic image acquisitions. Bioinformatics 2009, 25, 1463–1465. [Google Scholar] [CrossRef]
  24. Park, S.H.C.; Sato, Y.S.; Kokawa, H.; Okamoto, K.; Hirano, S.; Inagaki, M. Microstructural characterisation of stir zone containing residual ferrite in friction stir welded 304 austenitic stainless steel. Sci. Technol. Weld. Joining 2005, 10, 550–556. [Google Scholar] [CrossRef]
  25. Kumar, S.S.; Murugan, N.; Ramachandran, K.K. Microstructure and mechanical properties of friction stir welded AISI 316L austenitic stainless steel joints. J. Mater. Process. Technol. 2018, 254, 79–90. [Google Scholar] [CrossRef]
  26. Peng, G.; Yan, Q.; Hu, J.; Chen, P.; Chen, Z.; Zhang, T. Effect of Forced Air Cooling on the Microstructures, Tensile Strength, and Hardness Distribution of Dissimilar Friction Stir Welded AA5A06-AA6061 Joints. Metals 2019, 9, 304. [Google Scholar] [CrossRef]
  27. Li, Y.; Qin, F.; Liu, C.; Wu, Z. A Review: Effect of Friction Stir Welding on Microstructure and Mechanical Properties of Magnesium Alloys. Metals 2017, 7, 524. [Google Scholar] [Green Version]
  28. Nandan, R.; Debroy, T.; Bhadeshia, H. Recent advances in friction-stir welding—Process, weldment structure and properties. Prog. Mater Sci. 2008, 53, 980–1023. [Google Scholar] [CrossRef]
  29. Zhang, H.; Wang, D.; Xue, P.; Wu, L.H.; Ni, D.R.; Xiao, B.L.; Ma, Z.Y. Achieving ultra-high strength friction stir welded joints of high nitrogen stainless steel by forced water cooling. J. Mater. Sci. Technol. 2018, 34, 2183–2188. [Google Scholar] [CrossRef]
  30. Li, H.; Yang, S.; Zhang, S.; Zhang, B.; Jiang, Z.; Feng, H.; Han, P.; Li, J. Microstructure evolution and mechanical properties of friction stir welding super-austenitic stainless steel S32654. Mater. Des. 2017, 118, 207–217. [Google Scholar] [CrossRef]
  31. Carroll, J.; Abuzaid, W.; Lambros, J.; Sehitoglu, H. An experimental methodology to relate local strain to microstructural texture. Rev. Sci. Instrum. 2010, 81, 083703. [Google Scholar] [CrossRef] [PubMed] [Green Version]
  32. Chen, Z.; Lenthe, W.; Stinville, J.C.; Echlin, M.; Pollock, T.M.; Daly, S. High-Resolution Deformation Mapping Across Large Fields of View Using Scanning Electron Microscopy and Digital Image Correlation. Exp. Mech. 2018, 58, 1407–1421. [Google Scholar] [CrossRef]
Figure 1. (a) Friction stir welded (FSW) (stainless steel-stainless steel (SS-SS)) joint; (b) schematic for extracting the specimens for various material characterizations (AS—Advancing side; RS—Retreating side).
Metals 09 00592 g001
Figure 2. (a) Water jet machined transverse tensile specimen of the FSW (SS-SS) joint; (b) fine speckle pattern produced through an airbrush.
Metals 09 00592 g002
Figure 3. (a) Region of interest (ROI) for the high-resolution (HR) 2D-digital image correlation (DIC) strain measurements; (b) the HR 2D-DIC experimental setup.
Metals 09 00592 g003
Figure 4. Image stitching procedures involved in Image-J to stitch grey scale images.
Metals 09 00592 g004
Figure 5. Sequentially stitched optical micrographs of the FSW (SS-SS) weld: (a) weld surface (AS); (b) weld surface (RS); (c) weld cross-section.
Metals 09 00592 g005aMetals 09 00592 g005b
Figure 6. (a) SEM-BSE of Weld nugget; (b) W-SEM-EDS map; (c) W-EDS line scan.
Metals 09 00592 g006
Figure 7. SEM-EBSD Micrographs along the FSW (SS-SS) weld cross-section: (a) BM; (b) HAZ/TMAZ/Weld nugget interfaces.
Metals 09 00592 g007
Figure 8. (a) ROI for hardness mapping; (b) optical micrograph showing the microhardness indents; (c) microhardness contour map along the cross-section of the weld; (d) microhardness line profile (L1) along the line as shown in (b).
Metals 09 00592 g008aMetals 09 00592 g008b
Figure 9. (a) ROIs (1, 2) for the Alicona profile measurements along the FSW (SS-SS) weld cross-section; (b) Alicona 3D surface topography of the ROI-1 located in (a); (c) Alicona 3D surface topography of the ROI-2 located in (a).
Metals 09 00592 g009
Figure 10. (a) Alicona ROI on the FSW (SS-SS) weld surface; (b) Alicona surface profile of the FSW (SS-SS) weld surface. (c) line profiles showing the thickness variations along the horizontal lines (1, 2) as shown in (b).
Metals 09 00592 g010aMetals 09 00592 g010b
Figure 11. (a) DIC ROIs on the FSW (SS-SS) weld; (b) sequentially stitched speckle map using Image-J.
Metals 09 00592 g011
Figure 12. εyy strain map derived from the DIC correlation on the stitched speckle maps of the FSW (SS-SS) weld at 2.5 kN. O—Overlap between the images.
Metals 09 00592 g012
Figure 13. Speckle map and its corresponding DIC strain map at 2.5 kN.
Metals 09 00592 g013
Figure 14. Image stitching procedures in Image-J to stitch strain maps (RGB) using reduced pixel coordinates determined from the stitched grey scale DIC speckle images.
Metals 09 00592 g014
Figure 15. (a) MATLAB and Image-J based strain data stitching procedures; (b) Correlation between the stitched strain data and manually stitched data (right) along a vertical line as shown in the strain map (left) at 2.5 kN.
Metals 09 00592 g015
Figure 16. (a) εyy strain map of the FSW (SS-SS) weld along the weld face (WF), weld root (WR), and weld cross-section (CS) at 2.5 kN; (b) defect locations on the WR.
Metals 09 00592 g016
Figure 17. Strain distribution through the weld region: (a) DIC ROI; (b) strain distribution on the WF and WR along the vertical line shown in (a) at 2.5 kN load; (c) average strain (εxx, εyy, and εxy) distributions.
Metals 09 00592 g017
Figure 18. (a) ROIs on WF and WR for local stress-strain curves; (b) local stress-strain curves of WF and WR.
Metals 09 00592 g018
Figure 19. (a) Out-of-plane displacement measurements along the vertical line of weld cross-section at 2.5 kN; (b) correction factor applied stress-strain curves of the weld nugget.
Metals 09 00592 g019
Table 1. Chemical composition of the base metal.
304 SSChemical Composition (in wt %)
CMnSiPSCrNiMoFe
0.070.9450.3020.0360.00318.0728.130.372.142
Table 2. Friction stir welded (FSW) process parameters.
Process ParametersFSW (SS-SS)
Tool rotation speed (RPM)441
Tool traverse speed (mm/min)118
Shoulder diameter (mm)17.5
Pin diameter (mm)8
Pin length (mm)1.8
Table 3. Coefficient of variation of strain (%) between Manual and MATLAB stitching methods.
TechniqueCoefficient of Variation of Strain (%)
BM (RS)BM (AS)Weld Nugget
Manual25.9330.8326.86
MATLAB/ImageJ34.0130.9826.88

