Article

A Prediction Model for Internal Cracks during Slab Continuous Casting

College of Materials Science and Engineering, Chongqing University, Chongqing 400044, China
*
Authors to whom correspondence should be addressed.
Metals 2019, 9(5), 587; https://doi.org/10.3390/met9050587
Submission received: 22 April 2019 / Revised: 14 May 2019 / Accepted: 17 May 2019 / Published: 21 May 2019

Abstract

:
Slab continuous casting internal cracking is a common quality defect in the production process. The ability to predict the quality of each continuous casting product and assess whether it is suitable for hot delivery or needs to be cleaned down will greatly increase the rolled product rate and reduce the scrap rate and production management cost. According to the quality defects of internal cracks during slab continuous casting and based on the solidification and heat transfer simulations, stress and strain calculations and theoretical analysis of metallurgical processes related to continuous casting combined with an abnormal casting event expert system, the internal crack generation index of the slice unit is used to predict the crack occurrence rating of each sized slab. Moreover, the internal crack prediction model for the slab is successfully developed and applied in a domestic steel mill. The accuracy of the model prediction reached 86.85%. This method achieved the organic combination of theoretical analysis and an expert system and provides an important theoretical tool for the prediction of crack quality defects in slab continuous casting; the method can be applied in slab continuous casting production.

1. Introduction

As the core issue of concern for continuous casting producers, the quality of continuous casting products has long been a concern of steel production companies, engineering design institutes, and research institutes [1,2,3,4,5,6,7,8,9]. The ability to predict the quality of each continuous casting product and assess whether it is suitable for hot delivery or needs to be cleaned down will greatly increase the rolled product rate and reduce the scrap rate and production management cost [10,11]. Thus, the quality of continuous casting products has very important practical importance.
Many domestic and foreign researchers have carried out extensive work and have developed their own slab quality prediction models [5,8,9,12,13], including Siemens-VAI’s VAI-Q [14], Demag’s XQE [15], British Steel’s MTM [16,17], and online inspection of surface quality defects in slabs using various sensors [3,4,10,11,18]. Most of these models use methods based solely on neural networks, expert systems, database queries, or sensor detection. These models do not proceed from the mechanism of slab defects. However, detailed analyses and calculations indicate that steel composition, mold cooling, secondary cooling, roll design, and abnormal casting events affect the slab defects. No real-time dynamic method for calculating the solidification heat transfer as well as stress and strain state in the production process of a slab is available, although such a method could be used to describe various factors that may cause slab defects. Thus, the overall application effect is not good.
Slab continuous casting internal cracking is a common quality defect in the production process. It includes triangle cracks, intermediate cracks, and centerline cracks, which strongly influence the quality of the slab. Such cracking usually leads to an abnormal microstructure and poor compactness of the casting slab and reduces the impact toughness and strength. The root cause is the integrated action of thermal stress and mechanical stress in the cooling and solidification process of molten steel, resulting in the total strain at the solidification front exceeding the critical strain value of the steel (depending on the mechanical strength of the steel at high temperature). Unreasonable primary and secondary cooling, poor accuracy of arcing between segments, abnormal roll-gap shrinkage, excessive slab bulging, poor quality of molten steel, and improper control of steel composition can promote internal crack formation [19,20,21,22,23,24,25,26,27]. For these influencing factors, some can be determined by theoretical calculation, whereas others can only be processed through artificial experience. In the former case, the method of quality loss factors is adopted in this paper. In the latter case, the method of casting abnormal events is used. Through the organic combination of these approaches, an effective and accurate model for predicting internal cracking of a slab is developed.

2. Quality Loss Factor

Numerous process factors are involved in the slab casting process, and various process factors are closely related to multiple metallurgical process conditions and parameters. The influence on the quality of the slab is intricate. Knowledge of the internal laws through heat transfer calculations and mechanical analyses is needed to provide a solid theoretical basis for the accurate prediction of the quality diagnostic model. In combination with casting production practices, the main process factors affecting the internal cracks of the slab and its related metallurgical processing conditions and parameters are summarized. The details are listed in Table 1.
According to the metallurgical process factors and parameters closely related to the internal crack quality defects in the slab [28,29], eight quality loss factors are determined in this study, as shown in Table 2, where STA is an abbreviation of smaller than aim; LTA is an abbreviation of larger than aim; ETA is an abbreviation of equal than aim.

2.1. Type of Quality Loss Factor

The introduction of the quality loss factor is based on the important metallurgical process parameters obtained by the heat transfer calculation and mechanical analysis of the slab during the casting process. Each type of quality loss factor comprises the corresponding characteristic calculation parameters and is calculated according to the features it contains. According to the trend of parameter values, the quality loss factors can be divided into the following three categories.
(1) ETA-type loss factor
When the characteristic calculation parameter is taken as a target value, the loss factor reaches a minimum value, namely
( ω ) = k ( ω ω o ) 2 ,
where ω is the calculation characteristic value, ω0 is the target value, and k is a coefficient that makes the loss factor dimensionless and equal to 1 when ω is the critical value. When the characteristic value is close to the target value, the calculated loss factor reduces to 0.
(2) STA-type loss factor
When the characteristic calculation parameter is taken as a smaller value, the loss factor reaches a minimum value, namely
( ω ) = k ( ω ) 2 ,
(3) LTA-type loss factor
When the characteristic calculation parameter is taken as a larger value, the loss factor reaches a minimum value, namely
( ω ) = k ( 1 ω ) 2 ,
At the same time, given that the various quality loss factors have different unit properties, a normalized processing method is adopted in the model to theoretically define the quality loss factor to facilitate the calculation. The value of the loss coefficient k in the above equations should be such that the corresponding calculated value of the loss factor is one when the feature calculation parameter reaches the target value or the limit allowable value (maximum/minimum).

2.2. Theoretical Calculation Method of Quality Loss Factor

2.2.1. Loss Factor of Shell Stress at Mold Exit

The slab should have a solidified shell of sufficient thickness to withstand the static pressure of the molten steel and to ensure that the total stress received in the slab is less than the critical value of crack formation. If the stress caused by the bulge and thermal strain exceeds the critical value, the stress will cause tearing at the solidification front, resulting in the formation of internal crack defects.
The limitation of this loss factor is as follows:
σ T M 0.95 σ c ,
where σ T M is the total stress of the slab at the mold exit, MPa; σ c is the critical stress, MPa, which is closely related to the composition of the steel [23]; and the value 0.95 is the safety factor. The calculation method after the loss factor is normalized is as follows:
I n t M o l d σ T = ( 1.108 σ c ) 2 · ( σ T M ) 2 ,
where I n t M o l d σ T is the loss factor of shell stress at the mold exit. The σ T M term is calculated as follows [29]:
σ T M = k T M · ( 7.781 + 0.00372 L x + 0.00186 L m + 0.00175 L R + 0.0109 R o 0.044 D e + 0.671 ε t h 0.00285 T e 0.00381 L I T ) ,
where k T M is the adjustment coefficient; ε t h is the strain caused by the temperature change of the slab in the brittle temperature range, and its calculation formula is
ε t h = ρ ( L I T ) ρ ( Z D T ) 3 1 ,
where ρ is the slab density, kg/m3, which is closely related to the temperature; Lx is the slab width, m; Lm is the length of the mold, m; LR is the roll spacing, m; Ro is the radius of the caster, m; De is the thickness of the shell of the mold exit, m; Te is the surface temperature of the slab at the mold exit, °C; the liquid impenetrable temperature (LIT, fs = 0.85) and zero ductility temperature (ZDT, fs = 0.99) are the liquid impenetrable temperature and the zero ductility temperature [23,27,30], respectively, °C.

2.2.2. Loss Factor of Shell Stress in the Secondary Cooling Zone

The slab is subjected to strong spray cooling throughout the secondary cooling zone. Thermal stress is generated by this process, along with mechanical stress during the bending and straightening process. If the total stress exceeds the critical value, the internal crack will form or deteriorate. Thus, measures should be taken to ensure that the total stress experienced in the slab is less than the critical value.
The limitation of this loss factor is as follows:
σ T S 0.95 σ c ,
where σ T S is the total stress of the secondary cooling zone, MPa, and the value 0.95 is the safety factor. The calculation method after the loss factor is normalized is as follows:
I n t S C Z σ T = ( 1.108 σ c ) 2 · ( σ T S ) 2 ,
where I n t S C Z σ T is the loss factor of shell stress of the secondary cooling zone. The σ T S calculation method is as follows [29]:
σ T S = k T S · ( 8.45 + 0.0077 L x + 0.000392 L S P + 0.00317 L R + 0.0267 R o 0.0418 D S P + 0.556 ε t h 0.00389 T s u r f 0.00392 L I T ) ,
where k T S is the adjustment coefficient; L S P is the total length of the secondary cooling zone, m; D S P is the thickness of the shell at the exit of the secondary cooling zone, m; and T s u r f is the surface temperature of the slab at the exit of the secondary cooling zone, °C.

2.2.3. Loss Factor of Reheating at Slab Surface in the Secondary Cooling Zone

To avoid stresses due to bulging, reheating in the secondary cooling zone should be minimized. Related studies have suggested a maximum value of 100 °C/m. Reheating beyond 100 °C/m leads to a high likelihood of forming intermediate cracks. This likelihood is even greater for those grades with low values of critical stress for crack formation. However, to obtain a low reheat (<40 °C/m), the use of more secondary cooling zones may be necessary. Such additional cooling zones are unnecessary because a reheat below 60 °C/m rarely causes any problems.
The limitation of this loss factor is as follows:
T r e h e a t i k I n t S C Z T r e h e a t · 80   ° C / m ,
where T r e h e a t i is the maximum reheating of the ith cooling zone, °C/m; k I n t S C Z T r e h e a t is the adjustment coefficient according to the steel grade, the value ranges from 0.75 to 1.5. The calculation method after the loss factor is normalized is as follows:
I n t S C Z T r e h e a t = 0.000156 · ( T r e h e a t i k I n t S C Z T r e h e a t ) 2 ,
where I n t S C Z T r e h e a t is the loss factor of reheating at the slab surface in the secondary cooling zone. The T r e h e a t i calculation method is
T r e h e a t i = T M a x i T M i n i L M a x M i n i ,
where T M a x i is the max surface temperature of the slab in the ith secondary cooling zone, °C; T M i n i is the min surface temperature of the slab in the ith secondary cooling zone, °C; L M a x M i n i is the distance between the max surface temperature and the min surface temperature in the ith secondary cooling zone, m.

2.2.4. Loss Factor of Temperature Dropping at Slab Surface in the Secondary Cooling Zone

The slab is subjected to strong spray cooling in the secondary cooling zone, and its surface temperature is generally decreasing. However, the rate of cooling should not be too high; otherwise, the larger thermal stress generated by a higher cooling rate will easily cause the formation or deterioration of internal cracks.
The limitation of this loss factor is as follows:
T d r o p i k I n t S C Z T d r o p · 150   ° C / m ,
where T d r o p i is the temperature decrease in the ith cooling zone, °C/m; k I n t S C Z T d r o p is the adjustment coefficient according to the steel grade, the value ranges from 0.67 to 1.34. The calculation method after the loss factor is normalized is as follows:
I n t S C Z T d r o p = 0.00044 · ( T d r o p i k I n t S C Z T d r o p ) 2 ,
where I n t S C Z T d r o p is the loss factor of the temperature decreasing at the slab surface in the secondary cooling zone. The T d r o p i calculation method is as follows:
T d r o p i = T e x i t i T e n t e r i L z o n e i ,
where T e x i t i is the surface temperature of the slab at the exit of the ith secondary cooling zone, °C; T e n t e r i is the surface temperature of the slab at the entrance of the ith secondary cooling zone, °C; and L z o n e i is the length of the ith secondary cooling zone, m.

2.2.5. Straightening Temperature Loss Factor of the Slab in the Secondary Cooling Zone

The slab is subjected to the combined action of thermal stress and straightening stress in the straightening zone. If the total strain of the solidification front exceeds the critical strain value of the steel, tearing behavior will occur, which leads to the formation of internal cracks. Minimizing the possibility of crack formation requires that the surface temperature of the slab in the straightening zone be outside the low-ductility region of the steel during the casting process; that is, the surface temperature should be higher than the upper limit of the low-ductility region or lower than the lower limit of the low-ductility zone. Taking into account the possible negative effect of the strong cold system on the surface quality of the slab, in this article, the upper limit of the low-ductility region is taken.
The limitation of this loss factor is expressed as follows:
T u n b e n d T B r i Z o n e ,
where T u n b e n d is the surface temperature of the slab at the entrance of the straightening zone, °C; T B r i Z o n e is the low-ductility zone temperature upper limit of steel, °C, the range is from 900 °C to 1100 °C, and the specific value depends on the steel composition. The calculation method after the loss factor is normalized is as follows:
Int SCZ T unbend = ( T BriZone T unbend ) 2 ,
where I n t S C Z T u n b e n d is the straightening temperature loss factor of the slab in the secondary cooling zone.

2.2.6. Loss Factor of Steel Crack Sensitivity

For the formation of internal cracks in the slab, in addition to the solidification cooling state and the deformation state of the slab (which can be regarded as external factors), the sensitivity of the steel itself to the crack is also an important influence (which can be regarded as an intrinsic factor). As far as the crack sensitivity index is concerned, the carbon content and the manganese: sulfur ratio of the steel are the two most variable factors. As the carbon content increases and the manganese: sulfur ratio decreases, the brittle temperature range increases accordingly. The ductility of steel in the brittle temperature range is poor; thus, the critical strain value causing the internal crack is correspondingly reduced, which increases the possibility of crack generation.
The limitation of this loss factor is
I c k I n t G r a d e I c ,
where I c is the steel crack sensitivity index; k I n t G r a d e I c is the adjustment coefficient according to the steel grade, the value ranges from 2 to 4. The calculation method after the loss factor is normalized is as follows:
I n t G r a d e I c = ( I c k I n t G r a d e I c ) 2 ,
where I n t G r a d e I c is the steel crack sensitivity loss factor. The I c calculation method is [31]
I c = 30.848 · exp ( 2.195 [ % C ] ) · ( [ % M n ] [ % S ] ) 0.857 ,

2.2.7. Loss Factor of the Total Deformation Rate of the Slab in the Secondary Cooling Zone

During the casting process, the slab will form a corresponding strain distribution under the combined action of thermal stress and mechanical stress; this distribution is the main source of crack defects. If the total strain of the solidification front exceeds the critical strain value of the steel, the solidification front will tear along the dendrites, forming internal cracks. Among the total strains experienced by the solidification front of the slab, mainly including bulge strain, bending/straightening strain, and misalignment strain. In the theoretical analysis of the strain condition of the slab, from the viewpoint of simplifying the problem, the strain condition can be considered only from these three aspects; the various strains are analytically calculated based on the simple beam-slab bending theory, and the creep effect is considered in the bugle strain.
The limitation of this loss factor is as follows:
ε t o t a l ε c ,
where ε t o t a l is the total strain of the slab and ε c is the critical strain, which is closely related to the composition of the steel. The calculation method after the loss factor is normalized is as follows:
I n t S C Z ε t o t a l = ( ε t o t a l ε c ) 2 ,
where I n t S C Z ε t o t a l is a loss factor of the total deformation rate of the slab in the secondary cooling zone. The ε t o t a l calculation method is as follows:
ε t o t a l = ε b + ε u + ε m ,
where ε b , ε u , ε m are the strains caused by bulging, straightening, and roll misalignment, respectively.
Due to the hydrostatic pressure of the steel, slab bulge deformation behavior between the adjacent two nip rolls will occur. The influencing factors include the slab temperature, amount of cooling water, steel grade, slab thickness, slab width, and the nip distance. The corresponding calculation formulas are as follows [32,33,34]:
ε b = 1600 · s · δ b l 2 ,
δ b = P · l 4 32 · E t · s 3 l V c ,
P = ρ L · g · h 1000
E t = [ T s ( T s u r f + T s ) 2 ] T s 100 × 10 6 ,
where δ b is the amount of bulge, cm; P is the static pressure of the steel, N/cm2; l is the spacing between the rolls, cm; E t is the modified equivalent modulus of elasticity, N/cm2; s is the solidified shell thickness of the slab, cm; V c is the speed of the slab, cm/s; ρ L is the liquid steel density, kg/cm3; g is the gravitational acceleration, with a value of 9.8 N/kg, T s is solidus temperature, °C; T s u r f is the surface temperature, °C.
When the slab goes through the bending and the straightening zone, it will be deformed by the tensile force, the extent of which depends mainly on the number of bending/straightening points (for continuous bending and continuous straightening rolls, it can be simplified, according to the number of rolls, to multipoint bending and multipoint straightening) and the radius of curvature as well as slab thickness and shell thickness. Its calculation method is as follows [32,35]:
ε u = 100 · ( d 2 s ) · | ( 1 R i 1 R i + 1 ) | ,
where d is the thickness of the slab, m; s is the thickness of the shell at the ith bending or straightening roller, m; Ri is the outer arc radius of the caster corresponding to the ith bending or straightening roller, m; and Ri+1 is the outer arc radius of the caster corresponding to the i + 1th bending or straightening roller, m. If Ri is the last bending roller, then the value of Ri+1 is the radius of the caster. If Ri is the last straightening roller, then the value of Ri+1 is gigantic.
Misalignment strain is the result of improper placement of the rolls. This is caused by either poor machine condition or poor maintenance. The analytical equation generally used for calculating the misalignment strain is as follows [32,33]:
ε m = 300 · δ m · s l 2 ,
where δ m is the amount of misalignment, cm.

2.2.8. Target Temperature Loss Factor of a Slab in the Secondary Cooling Zone

The cooling condition of the slab in the secondary cooling zone is especially important for its quality control. A reasonable secondary cooling system should ensure that a reasonable temperature distribution for the casting steel grade is obtained and that the requirements of the metallurgical standard are met from the aspects of the straightening-point temperature, the temperature gradient of the secondary cooling zone, and the exit temperature of the caster. The setting of the target temperature curve is closely related to the high-temperature thermophysical properties and mechanical properties of the steel and related to the structural parameters of the caster. Substantial deviation of the actual temperature distribution of the slab from the target temperature curve reflects a poor current control state of the secondary cold water, which may promote the formation or aggravation of internal cracks in the slab.
The limitation of this loss factor is
| T s u r f , i T a i m , i | T s e t , i ,
where T s u r f , i is the surface temperature of the slab corresponding to the target control point of the ith secondary cooling zone, °C; T a i m , i is the target surface temperature of the slab corresponding to the target control point of the ith secondary cooling zone, °C; and T s e t , i is the allowable temperature deviation corresponding to the target control point of the ith secondary cooling zone, °C. The calculation method after the loss factor is normalized is as follows:
I n t S C Z T a i m = i = 1 n ( | T s u r f , i T a i m , i | T s e t , i ) 2 ,
where I n t S C Z T a i m is the target temperature loss factor of the slab in the secondary cooling zone; n is the number of target control points of the secondary cooling zone.

3. Casting Abnormal Events

During the slab continuous casting production process, the stability of the casting process will be affected by the fluctuations of the casting speed caused by planned or unplanned accidents, such as the replacement of the tundish online or a breakout alarm. These accidents will adversely affect the quality of the slab. In this study, in order to facilitate the development of the model program, the two types of planned and unplanned accidents are uniformly defined as casting abnormal events [36,37,38]. The casting abnormal events are divided into four types according to the region of the caster, namely: (1) abnormal events of the tundish; (2) abnormal events of the mold; (3) abnormal events of the secondary cooling zone; and (4) abnormal events of the casting district. Each major class of abnormal events includes a number of specific events. Details are listed in Table 3.
The model considers abnormal events by defining the generation index’s adjustment factor of the internal cracks, the value of the adjustment factor mainly depends on human experience and the degree of the incident. There are two modes of manual and automatic to capture abnormal events in the model during on-site operation. The manual mode introduces the influence of the abnormal event by manually setting the occurrence level of the abnormal event on the corresponding interface of the model when an abnormal event occurring. The automatic mode judges whether abnormal events occurred and the severity by collecting various parameters of real-time production onsite. Using automatic mode is the better way for all abnormal events.
In addition to the aforementioned abnormal events, other types of abnormal events can be introduced according to the actual situation at the site; however, the adjustment factor values and the occurrence levels of the corresponding quality defects under various occurrence levels must be reasonably set.

4. Internal Crack Generation Index of Slice Unit

The causes of quality defects can be divided into four categories: (1) Abnormal events (including operational errors); (2) poor condition of the caster (mainly poor maintenance of mechanical and electrical equipment); (3) unreasonable process parameters (mainly referring to the basic roll gap, crystallizer vibration, secondary cold water, etc.); or (4) steel composition (such as peritectic steel, steel containing niobium). According to the relevant statistical analysis of actual production data, the proportions of quality defects related to these four causes are approximately 16%, 29%, 38%, and 17%, respectively. For the casting process parameters and the characteristics of the cast steel itself, through the real-time tracking simulation analysis of the continuous casting process, the force analysis and the theoretical calculation of the solidification characteristics of the steel, the effects of these two main factors can be accurately predicted. The two influencing factors of abnormal events and caster conditions are uniformly defined as casting abnormal, which can be considered using empirical methods of the expert knowledge base. In view of the internal crack quality defects of the slab, the internal crack generation index is used for theoretically predictions in this study. Two algorithms are considered to determine the internal crack generation index of the slice unit: the weighted-average algorithm and the back propagation (BP) neural-network algorithm.
The space-time dispersion diagram of the internal crack generation index of the slicing unit in the slab casting process is shown in Figure 1. The prediction model performs a complete tracking of the casting process and obtains real-time metallurgical information (including the temperature distribution, stress/strain distribution, and solidified state) for each slice unit in the slab by solidification heat transfer simulation and stress/strain solution. According to the results of these tracking calculations, various quality loss factors of each slice unit are obtained; the effect of each abnormal event is introduced into each slice unit simultaneously. The internal crack generation index of each slicing unit is finally obtained.
The internal crack generation index of the slice unit is calculated once in each tracking period. During the casting process, as the casting process conditions change, the crack generation index of the slice unit may also change. The maximum crack generation index value experienced by the slice unit is the most influential to its quality defect formation, so the maximum value obtained by the slice unit is taken as the final result.

4.1. The Weighted-Average Algorithm

The internal crack generation index of the slice unit is calculated by multiplying the quality loss factor and its corresponding weight coefficient and adding 29 abnormal event adjustment factors. This method only needs the weight of each quality loss factor to be manually determined and can obtain the slab quality prediction value without excessive sample data, making it suitable for the early stage of model investment. The specific calculation method is as follows:
φ I n t C r a c k E l e m = i = 1 m C I n t i · ε I n t i + j = 1 n ω I n t j ,
where φ I n t C r a c k E l e m is the internal crack generation index of the slab slice unit; C I n t i is the quality loss factor related to the internal crack generation index; ε I n t i is the weight of the quality loss factor in the internal crack generation index (its value reflects the extent to which the corresponding quality loss factor affects the internal crack generation index); ω I n t j is the adjustment factor for the internal crack generation index of the abnormal event; m is the number of quality loss factors related to the internal crack generation index; and n is the number of abnormal events that affect the internal crack generation index.
The weight coefficient of each quality loss factor indicates the degree of influence of each quality loss factor on the internal crack generation index, and its value determines the accuracy of the model prediction. In the early stage of model industrial application, the value of the weight coefficient of each quality loss factor is determined on the basis of the knowledge of an expert. The values are shown in Table 4.
For all quality loss factors, the sum of the weight coefficients must be equal to 1. If a new quality loss factor is to be introduced in the future, the weight coefficients of all quality loss factors must be adjusted accordingly so that the sum of the values is equal to 1.

4.2. The BP Neural Network Algorithm

Given the fuzzy uncertainty of the influence of various quality loss factors on the internal crack generation index of a slice unit, this study makes full use of the nonlinear approximation ability and adaptive and self-learning of neural networks [2,38]. The results can truly reflect the relationship between the crack generation index and each quality loss factor. The relationship between each quality loss factor and its corresponding weight coefficient is obtained by the BP neural network algorithm; 29 abnormal event adjustment factors are added, and the internal crack generation index of each slice unit is then obtained. This method requires the existence of a large number of effective samples, which adapts to the middle period of the model application.
The main idea of the BP algorithm is that inputting the learning samples and using the backpropagation algorithm repeatedly adjusts the weights and deviations of the network so that the output vector and the expected vector are as close as possible. When the error of the network output layer is less than the predetermined error, the training is completed and the weight and deviation of the network are saved.
To speed up the convergence rate of network training and avoid the global optimality due to the local minimum, in this study, the BP algorithm is improved by using the increasing momentum term and the maximum error learning method. The method of increasing the momentum term involves accumulating the previous adjustment experience in the process of weight adjustment, which can reduce the oscillation of the network learning process to a certain extent and increase the training speed. The maximum error learning method is to calculate the error signals of each layer and adjust the weights without using the total error of all sample outputs but using the largest error sample after learning all the samples. This approach ensures that the overall error of the training sample is kept in a downward direction, effectively overcoming the disadvantage of being easily trapped in a local minimum.
In this study, a three-layer network is established for the internal crack generation index, and eight internal crack loss factors are used to map one internal crack index for training; specifically, the number of input layer nodes is eight and the number of output layer nodes is one. The BP neural network algorithm flow based on the improved momentum term and with the maximum error learning method is shown in Figure 2.
If the network error is less than the predetermined error or if the number of learning is greater than the predetermined value, the training is considered to have met the requirement and is terminated. The connection weights and thresholds that directly reflect the mapping relations between the input layer and the output layer are recorded. Table 5 and Table 6 are examples of weights and thresholds for internal crack network training, where P is the input layer node, H is the hidden layer node and D is the output layer node.

5. Internal Crack Prediction Algorithm for the Sized Slab

The sized slab contains several slice units (the specific number is determined by its length and slice pitch). Each slice unit is divided along the entire model tracking area (from the mold meniscus to the cutting position) at an equal pitch. Each slice unit is numbered and tracked from the beginning; however, the number of the slice unit is not assigned to the sized slab at this time. After the prediction model has read the start cutting signal, the sized slab is considered to have formed; the sized slab can then determine which slice units it contains according to the length of the sized slab and the position information of the slice unit. The relationship between the slice unit number and the sized slab can be accurately established. The internal crack generation index of the sized slab is the maximum value of all the slice units it contains. The calculation method is as follows:
φ I n t C r a c k S l a b = m a x { φ I n t C r a c k E l e m ( 1 ) , φ I n t C r a c k E l e m ( 2 ) , , φ I n t C r a c k E l e m ( n ) } ,
where φ I n t C r a c k S l a b is the internal crack generation index of the sized slab and n is the number of slice units the sized slab contains.
The internal crack generation index reflects the possibility and severity of crack defects in the sized slab, and it is divided into five levels: nonoccurrence, possible, slight, general, and serious. The levels are described as follows:
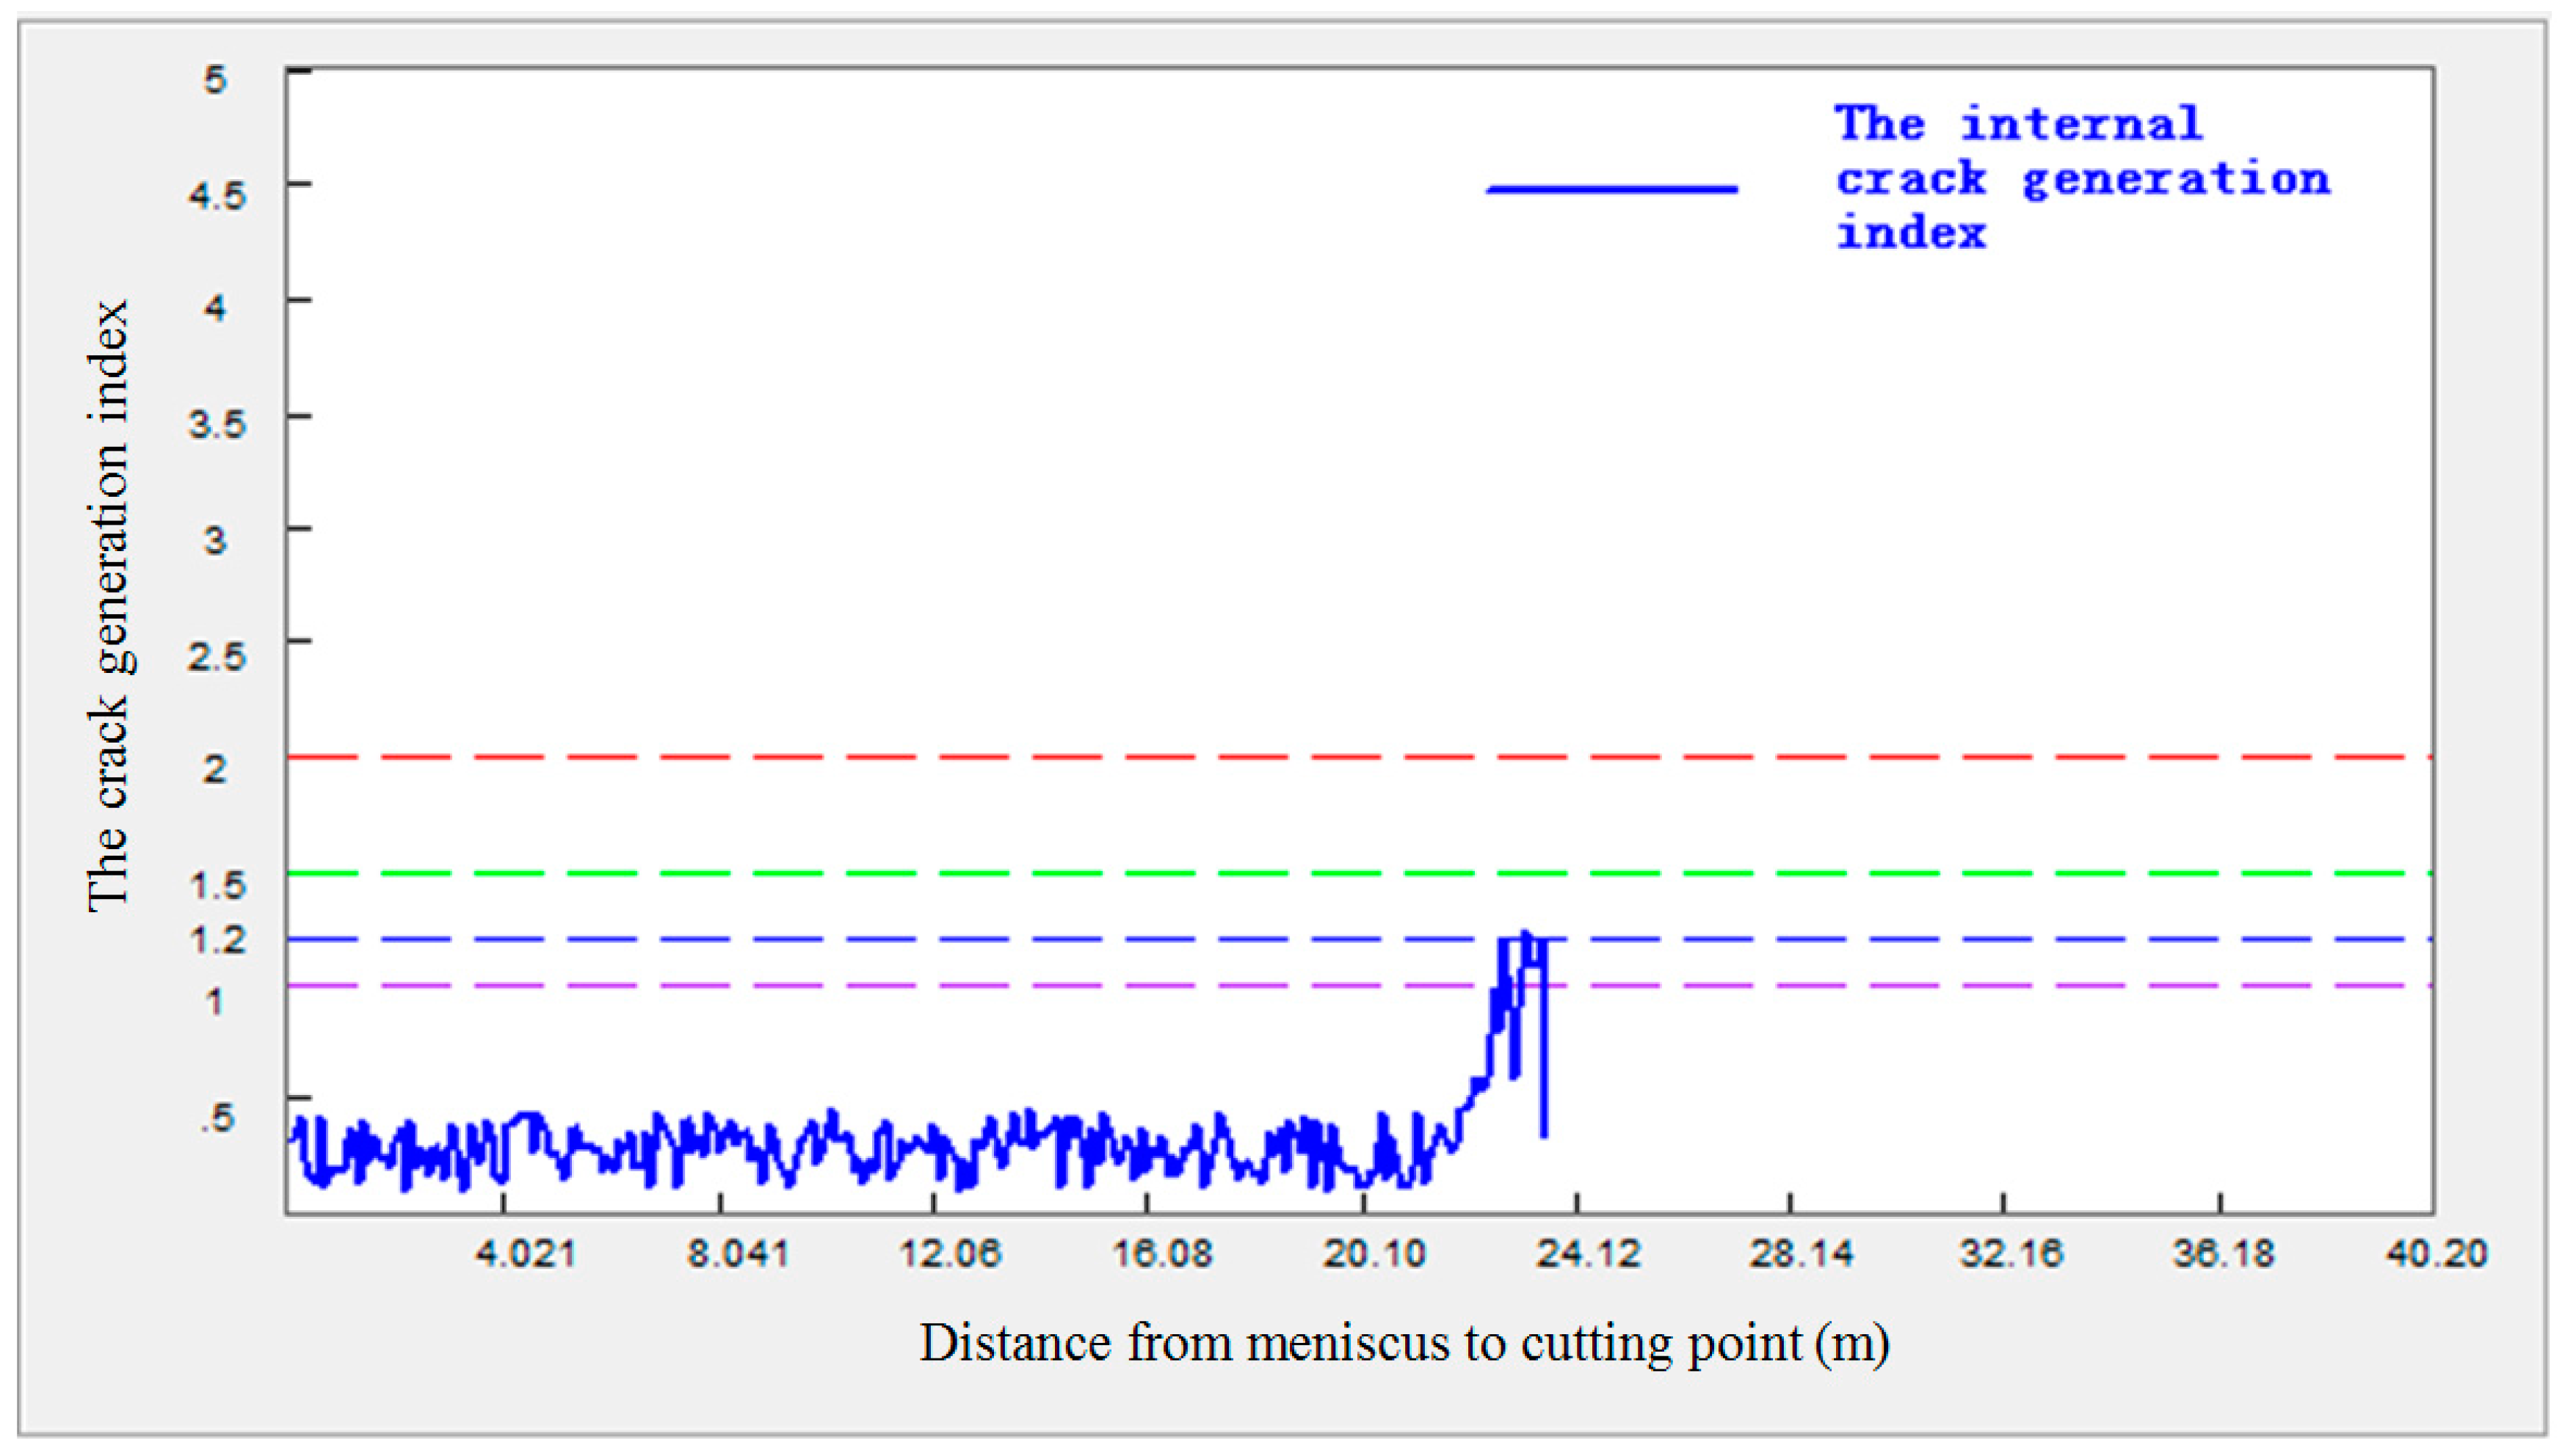
(1) The crack generation index is less than 1.0Nonoccurrence
(2) The crack generation index is between 1.0 and 1.2Possible
(3) The crack generation index is between 1.2 and 1.5Slight
(4) The crack generation index is between 1.5 and 2.0General
(5) The crack generation index is greater than 2.0Serious
For the cut sized slab, the recommended treatment measures will be given according to the theoretically predicted crack generation index by the model. If the crack defect level is serious, the model recommends that the slab be cleaned offline; if the crack defect level is general, the model recommends that the slab should be further checked; for other grades, there is no need for special treatment (no suggestion), or directly hot delivering, or directly stacking.

6. Industrial Application

6.1. The Prediction Model Software Introduction

The prediction model software is mainly composed of the following three parts: the real-time reading of caster production parameters, the real-time simulation calculation of the casting process, and internal crack prediction. The data real-time reading module is mainly responsible for the collection of data transmitted by the previous process, the real-time process parameters in the casting process, the real-time control feedback parameters of the continuous caster, and the casting abnormal events. Most of these parameters are collected by object linking and embedding (OLE) for process control (OPC) communication with a level 1 system; others are collected by Oracle database collection to a level 2 system. The real-time simulation calculation module is mainly responsible for the dynamic calculation of the solidification heat transfer process in the production process of a slab. The internal crack prediction module is mainly responsible for calculation of the internal crack generation index and for the collection and inquiry of production quality data. The model software function diagram is shown in Figure 3. In addition, the model also has the functions of off-line simulation of the casting process, casting abnormal event management, BP neural-network sample management, and training and testing.

6.2. Industrial Applications

The online internal crack prediction model of the slab continuous casting was put into industrial application in the No. 1 slab continuous caster of a steel mill in China. The basic structural parameters of the slab continuous caster are shown in Table 7.
The internal crack generation index of the slab during the start of casting in the continuous caster is shown in Figure 4. Due to the instability of the casting speed, mold oscillation parameters, temperature, and stress distribution during the start of the casting stage, the calculated crack generation indexes at the 3 m head are both greater than 1.0. This result indicates that the possibility of a quality defect is high. After the process parameters stabilized, the crack index sharply reduced to a normal state. The prediction results are consistent with the actual state. The casting abnormal events also strongly influence the crack generation index. For example, in the process of replacement of the tundish online, replacement of the submerged nozzle and breakout alarm, the crack generation index rises rapidly, generally reaching 1.2 or more. In addition, the large fluctuation of the speed during the casting process greatly influences the calculation results of the model, which increases the crack generation index.
The slab will be cut after running to the cutting position for a distance. The prediction model tracks the process and relays the quality information to the cutting slab; each cut has corresponding quality information. The corresponding slab quality information is saved in the SlabQuality file folder after each cutting and can be viewed later. The stored information includes the slab number, length, internal crack generation index, and the abnormal events experienced.
The quality information for 4297 sized slabs was collected onsite over a period of six months for comparison with the corresponding model prediction results. As shown in Table 8, the model prediction accuracy was 86.85%. In Table 8, Nact is the slab number for each grade of the actual quality and Npre is the slab number for each grade when the model predictions agree with the actual values. Because the model is in the early stage of industrial application, the calculation method and the weight coefficient of each quality loss factor and the value of the casting abnormal event adjustment factor require improvement. The BP neural network method will be introduced to optimize the aforementioned parameters. In the next step, based on the three-dimensional temperature field of the slab, the location of slab crack occurrence will be refined, which will be a huge improvement in slab crack prediction. In the future, such an approach can be widely used as an important theoretical tool for predicting and controlling slab cracks in continuous casting.

7. Conclusions

According to the quality defects of internal cracks in continuous casting slabs, the stress and strain calculations and theoretical analysis of metallurgical processes related to continuous casting, and an abnormal casting events expert system, the internal crack generation index was used to predict the crack occurrence rating of each sized slab. The internal crack prediction model of slab continuous casting was developed, an organically combined theoretical analysis and an expert system were realized, and the neural network algorithm was introduced to optimize the relevant parameters, which provided an important theoretical tool for predicting slab quality. The results are summarized as follows:
(1)
The accurate and comprehensive collection of data transmitted from a previous process, the real-time process parameters in continuous casting, the real-time control feedback parameters of the continuous caster, and the casting abnormal events are important foundations for the model to ensure the accuracy of the predictions.
(2)
In the early stage of model industrial applications, according to the feedback condition of onsite slab quality, correcting the weight coefficient of each quality loss factor and the adjustment factor of each casting abnormal event is important for improving the prediction accuracy of the model.
(3)
In the middle stage of model industrial applications, improving the stability of the prediction model by using the BP neural network algorithm to correct and adjust the weight coefficient of each quality loss factor through the obtained effective samples is important.
(4)
The organic combination of the mechanism of internal crack generation in slabs as well as the BP neural network and expert system resulted in an effective method for predicting the internal cracking of slabs.

Author Contributions

Funding acquisition, D.C. and M.L.; methodology, Y.K., D.C., Q.L. and M.L.; software, Y.K. and Q.L.; writing—original draft, Y.K.; writing—review and editing, D.C. and M.L.

Funding

This research was funded by the Natural Science Foundation of China (project NO. 51874060).

Conflicts of Interest

The authors declare no conflict interest.

References

  1. Brimacombe, J.K. Empowerment with knowledge—toward the intelligent mold for the continuous casting of steel billets. Metall. Trans. B 1993, 24B, 917–935. [Google Scholar] [CrossRef]
  2. Schnelle, K.D.; Mah, R.H. Product quality management using a real-time expert system. ISIJ Int. 1994, 34, 815–821. [Google Scholar] [CrossRef]
  3. Thomas, B.G. On-line detection of quality problems in continuous casting of steel. In Proceedings of the 2003 Materials Science and Technology Symposium, Chicago, IL, USA, 10–12 November 2003. [Google Scholar]
  4. Normanton, A.S.; Barber, B.; Bell, A.; Spaccarotella, A.; Holappa, L.; Laine, J.; Peters, H.; Link, N.; Ors, F.; Lopez, A.; et al. Developments in online surface and internal quality forecasting of continuously cast semis. Ironmak. Steelmak. 2004, 31, 376–382. [Google Scholar] [CrossRef]
  5. Chimani, C.M.; Resch, H.; Mörwald, K.; Kolednik, O. Precipitation and phase transformation modelling to predict surface cracks and slab quality. Ironmak. Steelmak. 2005, 32, 75–79. [Google Scholar] [CrossRef]
  6. Watzinger, J.; Pesek, A.; Huebner, N.; Pillwax, M.; Lang, O. MoldExpert–operational experience and future development. Ironmak. Steelmak. 2005, 32, 208–212. [Google Scholar] [CrossRef]
  7. Wang, X.D.; Yao, M.; Du, B.; Fang, D.C.; Zhang, L.; Chen, Y.X. Online measurement and application of mould friction in continuous slab casting. Ironmak. Steelmak. 2007, 34, 138–144. [Google Scholar] [CrossRef]
  8. Ershun, P.; Liang, Y.; Shi, J.J.; Chang, T. On-line bleeds detection in continuous casting processes using engineering-driven rule-based algorithm. J. Manuf. Sci. Eng. 2009, 131, 1–9. [Google Scholar]
  9. Du, F.M.; Wang, X.D.; Liu, Y.; Wei, J.J.; Yao, M. Prediction of longitudinal cracks based on a full-scale finite-element model coupled inverse algorithm for a continuously cast slab. Steel Res. Int. 2017, 88, 1–7. [Google Scholar] [CrossRef]
  10. Thomas, G.B.; Jenkins, M.S.; Mahapatra, R.B. Investigation of strand surface defects using mould instrumentation and modelling. Ironmak. Steelmak. 2004, 31, 485–494. [Google Scholar] [CrossRef]
  11. Landstrom, A.; Thurley, M.J. Morphology-based crack detection for steel slabs. IEEE J. STSP 2012, 6, 866–875. [Google Scholar] [CrossRef]
  12. Lee, J.E.; Yeo, T.J.; Oh, K.H.; Yoon, J.K.; Yoon, U. Prediction of cracks in continuously cast steel beam blank through fully coupled analysis of fluid flow, heat transfer, and deformation behavior of a solidifying shell. Metall. Mater. Trans. A 2000, 31, 225–237. [Google Scholar] [CrossRef]
  13. Santos, C.A.; Spim, J.A.; Garcia, A. Mathematical modeling and optimization strategies (genetic algorithm and knowledge base) applied to the continuous casting of steel. Eng. Appl. Artif. Intell. 2003, 16, 511–527. [Google Scholar] [CrossRef]
  14. Preissl, H.; Fastner, T. Automatic quality control of cast slabs at the VOEST-ALPINE Steel works. In Proceedings of the Steelmaking Conference Proceedings, Pittsburgh, PA, USA, 2–5 March 1995. [Google Scholar]
  15. Schwedmann, J.; Wochnik, J. Instrumentation system, automation control and quality control for products of the continuous casting process. In Proceedings of the Second International Conference on Continuous Casting of Steel, Wuhan, China, 19–21 May 1995. [Google Scholar]
  16. Hewitt, P.N.; Robson, A.; Normanton, A.S.; Hunter, N.S.; Scholes, A.; Stewart, D. Continuous casting developments at british steel. Presented at the 1997 ATS International Steelmaking Conference, Paris, France, 9–10 December 1997. [Google Scholar]
  17. Normanton, A.S.; Hewitt, P.N.; Hunter, N.S.; Scoones, D.; Harris, B. Mould thermal monitoring: A window on the mould. Ironmak. Steelmak. 2004, 31, 357–363. [Google Scholar] [CrossRef]
  18. Landstrom, A.; Thurley, M.J.; Jonsson, H. Sub-millimeter crack detection in casted steel using color photometric stereo. In Proceedings of the Digital Image Computing: Techniques and Applications (DICTA), Hobart, Australia, 26–28 November 2013. [Google Scholar]
  19. Brimacombe, J.K.; Sorimachi, K. Crack formation in the continuous casting of steel. Metall. Trans. B 1977, 8, 489–505. [Google Scholar] [CrossRef]
  20. Brimacombe, J.K.; Weinberg, F.; Hawbolt, E.B. Formation of longitudinal, midface cracks in continuously-cast slabs. Metall. Trans. B 1979, 10, 279–292. [Google Scholar] [CrossRef]
  21. Nakagawa, T.; Umeda, T.; Murata, J.; Kamimura, Y.; Niwa, N. Deformation behavior during solidification of steels. ISIJ Int. 1995, 35, 723–729. [Google Scholar] [CrossRef]
  22. Nakagawa, T.; Umeda, T.; Murate, T. Strength and ductility of solidifying shell during casting. Trans. Iron Steel Inst. Jpn. 1995, 35, 723–728. [Google Scholar] [CrossRef]
  23. Won, Y.M.; Yeo, T.; Seol, D.J.; Oh, K.H. A new criterion for internal crack formation in continuously cast steels. Metall. Mater. Trans. B 2000, 31, 779–794. [Google Scholar] [CrossRef]
  24. Zhu, G.S.; Wang, X.H.; Yu, H.X.; Zhang, J.M.; Wang, W.J. Formation mechanism of internal cracks in continuously cast slab. Int. J. Miner. Metall. Mater. 2004, 11, 398–402. [Google Scholar]
  25. Chang, G.W.; Jin, G.C.; Chen, S.Y.; Yue, X.D. Research on the formation mechanism of internal crack in the continuous casting slab. Acta Metall. Sin. 2007, 20, 35–39. [Google Scholar] [CrossRef]
  26. El-Bealy, M.O. On the formation of interdendritic internal cracks during dendritic solidification of continuously cast steel slabs. Metall. Mater. Trans. B 2012, 43, 1488–1516. [Google Scholar] [CrossRef]
  27. Dou, K.; Qing, J.S.; Wang, L.; Zhang, X.F.; Wang, B.; Liu, Q.; Dong, H.B. Research on internal crack susceptibility of continuous-casting bloom based on micro-segregation model. Acta Metall. Sin. 2014, 50, 1505–1512. [Google Scholar]
  28. Ames, A.E.; Mattucci, N.; MacDonald, S.; Szonyi, G.; Hawkins, D.M. Quality loss functions for optimization across multiple response surfaces. J. Qual. Technol. 1997, 29, 339–346. [Google Scholar] [CrossRef]
  29. Kulkarni, M.S.; Babu, A.S. Managing quality in continuous casting process using product quality model and simulated annealing. J. Mater. Process. Technol. 2005, 166, 294–306. [Google Scholar] [CrossRef]
  30. Kim, K.H.; Yeo, T.J.; Oh, K.H.; Lee, D.N. Effect of carbon and sulfur in continuously cast strand on longitudinal surface cracks. ISIJ Int. 1996, 36, 284–289. [Google Scholar] [CrossRef]
  31. Mokler, D.A.; (SMS Engineering (China) Ltd. Beijing, China). Personal communication, 2011.
  32. Han, Z.Q.; Cai, K.K.; Liu, B.C. Prediction and analysis on formation of internal cracks in continuously cast slabs by mathematical models. ISIJ Int. 2001, 41, 1473–1480. [Google Scholar] [CrossRef]
  33. Verma, R.K.; Girase, N.U. Comparison of different caster designs based on bulging, bending and misalignment strains in solidifying strand. Ironmak. Steelmak. 2006, 33, 471–476. [Google Scholar] [CrossRef]
  34. Wu, C.H.; Ji, C.; Zhu, M.Y. Numerical simulation of bulging deformation forwide-thick slab under uneven cooling conditions. Metall. Mater. Trans. B 2018, 49B, 1–14. [Google Scholar]
  35. Barber, B.; Perkins, A. Strand deformation in continuous casting. Ironmak. Steelmak. 1989, 16, 406–411. [Google Scholar]
  36. Toledo, G.A.; Ciriza, J.; Laraudogoitia, J.J. Abnormal transient phenomena in the continuous casting process: Part 1. Ironmak. Steelmak. 2003, 30, 353–359. [Google Scholar] [CrossRef]
  37. Toledo, G.A.; Ciriza, J.; Laraudogoitia, J.J.; Arteaga, A. Abnormal transient phenomena in the continuous casting process: Part 2. Ironmak. Steelmak. 2003, 30, 360–368. [Google Scholar] [CrossRef]
  38. Wang, X.D.; Yao, M.; Chen, X.F. Development of prediction method for abnormalities in slab continuous casting using artificial neural network models. ISIJ Int. 2006, 46, 1047–1053. [Google Scholar]
Figure 1. Schematic of space-time dispersion of the internal crack generation index of the slice unit in the slab casting process.
Metals 09 00587 g001
Figure 2. The improved BP algorithm flow.
Metals 09 00587 g002
Figure 3. Model software function.
Metals 09 00587 g003
Figure 4. The internal crack generation index distribution at the beginning stage of casting.
Metals 09 00587 g004
Table 1. Main process factors and related metallurgical process conditions and parameters.
Process FactorRelated Metallurgical Process ConditionsRelated Metallurgical Process Parameters
Steel compositionCrack generation tendencyCritical strain, critical stress, thermal strain, shell deformation
Mold parametersHeat loss, mold deformationThickness of mold, mold thermal conductivity, cooling water flow rate, cooling water temperature, cooling water flow
Casting supportBulgeRoller pitch
Spray zone parametersSlab surface temperature, solidified shell thicknessSecondary cooling water flow rate, temperature of secondary cooling water, length of secondary cooling zone
Straightening parametersSlab surface strain, solidification front strainSlab surface temperature, solidified shell thickness
Casting speedThickness of the shell at the exit of the mold, thickness of the shell at the exit of the secondary cooling zone, metallurgical lengthShell stress, strain plus, surface temperature at the exit of the mold, surface temperature at the exit of the secondary cooling zone, position of complete solidification
Table 2. Quality loss factor of internal cracks.
Quality Loss Factor NameType
C1: Loss factor of shell stress at mold exitSTA
C2: Loss factor of shell stress in the secondary cooling zoneSTA
C3: Loss factor of reheating at slab surface in the secondary cooling zoneSTA
C4: Loss factor of the temperature dropping at the slab surface in the secondary cooling zoneSTA
C5: Straightening temperature loss factor of the slab in the secondary cooling zoneLTA
C6: Loss factor of steel crack sensitivitySTA
C7: Loss factor of total deformation rate of the slab in the secondary cooling zoneSTA
C8: Target temperature loss factor of the slab in the secondary cooling zoneSTA
Table 3. Detailed list of the classification of casting abnormal events.
Type of Abnormal EventNumberNames of Abnormal Events
Abnormal events of tundish1Steel level of the tundish abnormally decreasing
2Steel level of the tundish fluctuating
3Tundish sliding nozzle blocked
4Tundish flow control device damaged
5Online replacement of the tundish
Abnormal events of mold1Steel level of the mold fluctuating
2Submerged entry nozzle blocked
3Cylinder synchronous error in mold oscillation
4Mold narrow face taper drift
5Uneven coverage of mold slag
6Breakout alarm of mold
7Mold copper plate wear
8Online replacement of the submerged entry nozzle
Abnormal events of secondary cooling zone1Nozzles of segment zero blocked
2Nozzles of curved area blocked
3Nozzles of straightening area blocked
4Nozzles of horizontal area blocked
5Valve of segment zero is unstable
6Valve of curved area is unstable
7Valve of straightening area is unstable
8Valve of horizontal area is unstable
Abnormal events of casting district1Roll gap of segment zero control failure
2Roll gap of curved area control failure
3Roll gap of straightening area control failure
4Roll gap of horizontal area control failure
5Roll gap of segment zero control accuracy is poor
6Roll gap of curved area control accuracy is poor
7Roll gap of straightening area control accuracy is poor
8Roll gap of horizontal area control accuracy is poor
Table 4. The value of the weight coefficient of each quality loss factor in the internal crack generation index.
Quality Loss FactorWeight CoefficientRemark
C10.1/0.1
C20.15/0.15
C30.15/0.15
C40.15/0.15
C50.15/0.1
C60.15/0.1
C70.15/0.15
C80/0.1Considered as an option in the model
Table 5. Input layer to hidden layer weights and thresholds.
WeightH1H2H3H4H5H6H7H8H9H10
P10.021800.00807−0.151130.036740.009370.02791−0.046220.09190.039830.03049
P2−0.043630.291400.402590.279910.046480.046380.042070.188350.059410.00049
P30.004380.372270.332590.313940.06738−0.020760.015990.28521−0.01314−0.00971
P40.034870.485070.585410.411030.11683−0.027470.024630.37454−0.010890.01719
P5−0.037470.435040.406260.285160.08213−0.03996−0.035010.33558−0.00708−0.03167
P6−0.018630.244890.201550.285600.11023−0.00950−0.017660.19401−0.019530.02868
P7−0.007370.155100.188310.135840.05684−0.02889−0.027230.15669−0.029420.00860
P80.042510.371450.454510.320710.050860.041890.018010.316270.00745−0.02643
Thresholds0.00290−0.24204−0.78453−0.039130.01203−0.04486−0.026490.03094−0.04393−0.00276
Table 6. Hidden layer to output layer weights and thresholds.
WeightD1
H1−0.06657
H21.32652
H31.85098
H41.01310
H50.35802
H60.01900
H7−0.02027
H80.88893
H9−0.04537
H10−0.15340
Thresholds−1.811758
Table 7. Basic Structural parameters of the slab continuous caster.
NameUnitValue
Type of continuous caster Vertical bending type
Radiusm9.5
Thickness of slabmm190, 230
Width of slabmm900–1650
Length of casterm32.954
Number of segments 14
Number of secondary cooling zones 10
Speed of workm/min0.6–1.2
Table 8. Comparison of the actual collected results with the model prediction results.
Grades of Slab QualityNactNpre
Nonoccurrence, lower than 1.034602978
Possible, between 1.0 and 1.2413360
Slight, between 1.2 and 1.5229216
General, between 1.5 and 2.0139127
Serious, greater than 2.05651
Total slab number42973732
Prediction accuracy86.85%

