Interface Characterization of Ultrasonic Spot-Welded Mg Alloy Interlayered with Cu Coating

Abstract
:
1. Introduction
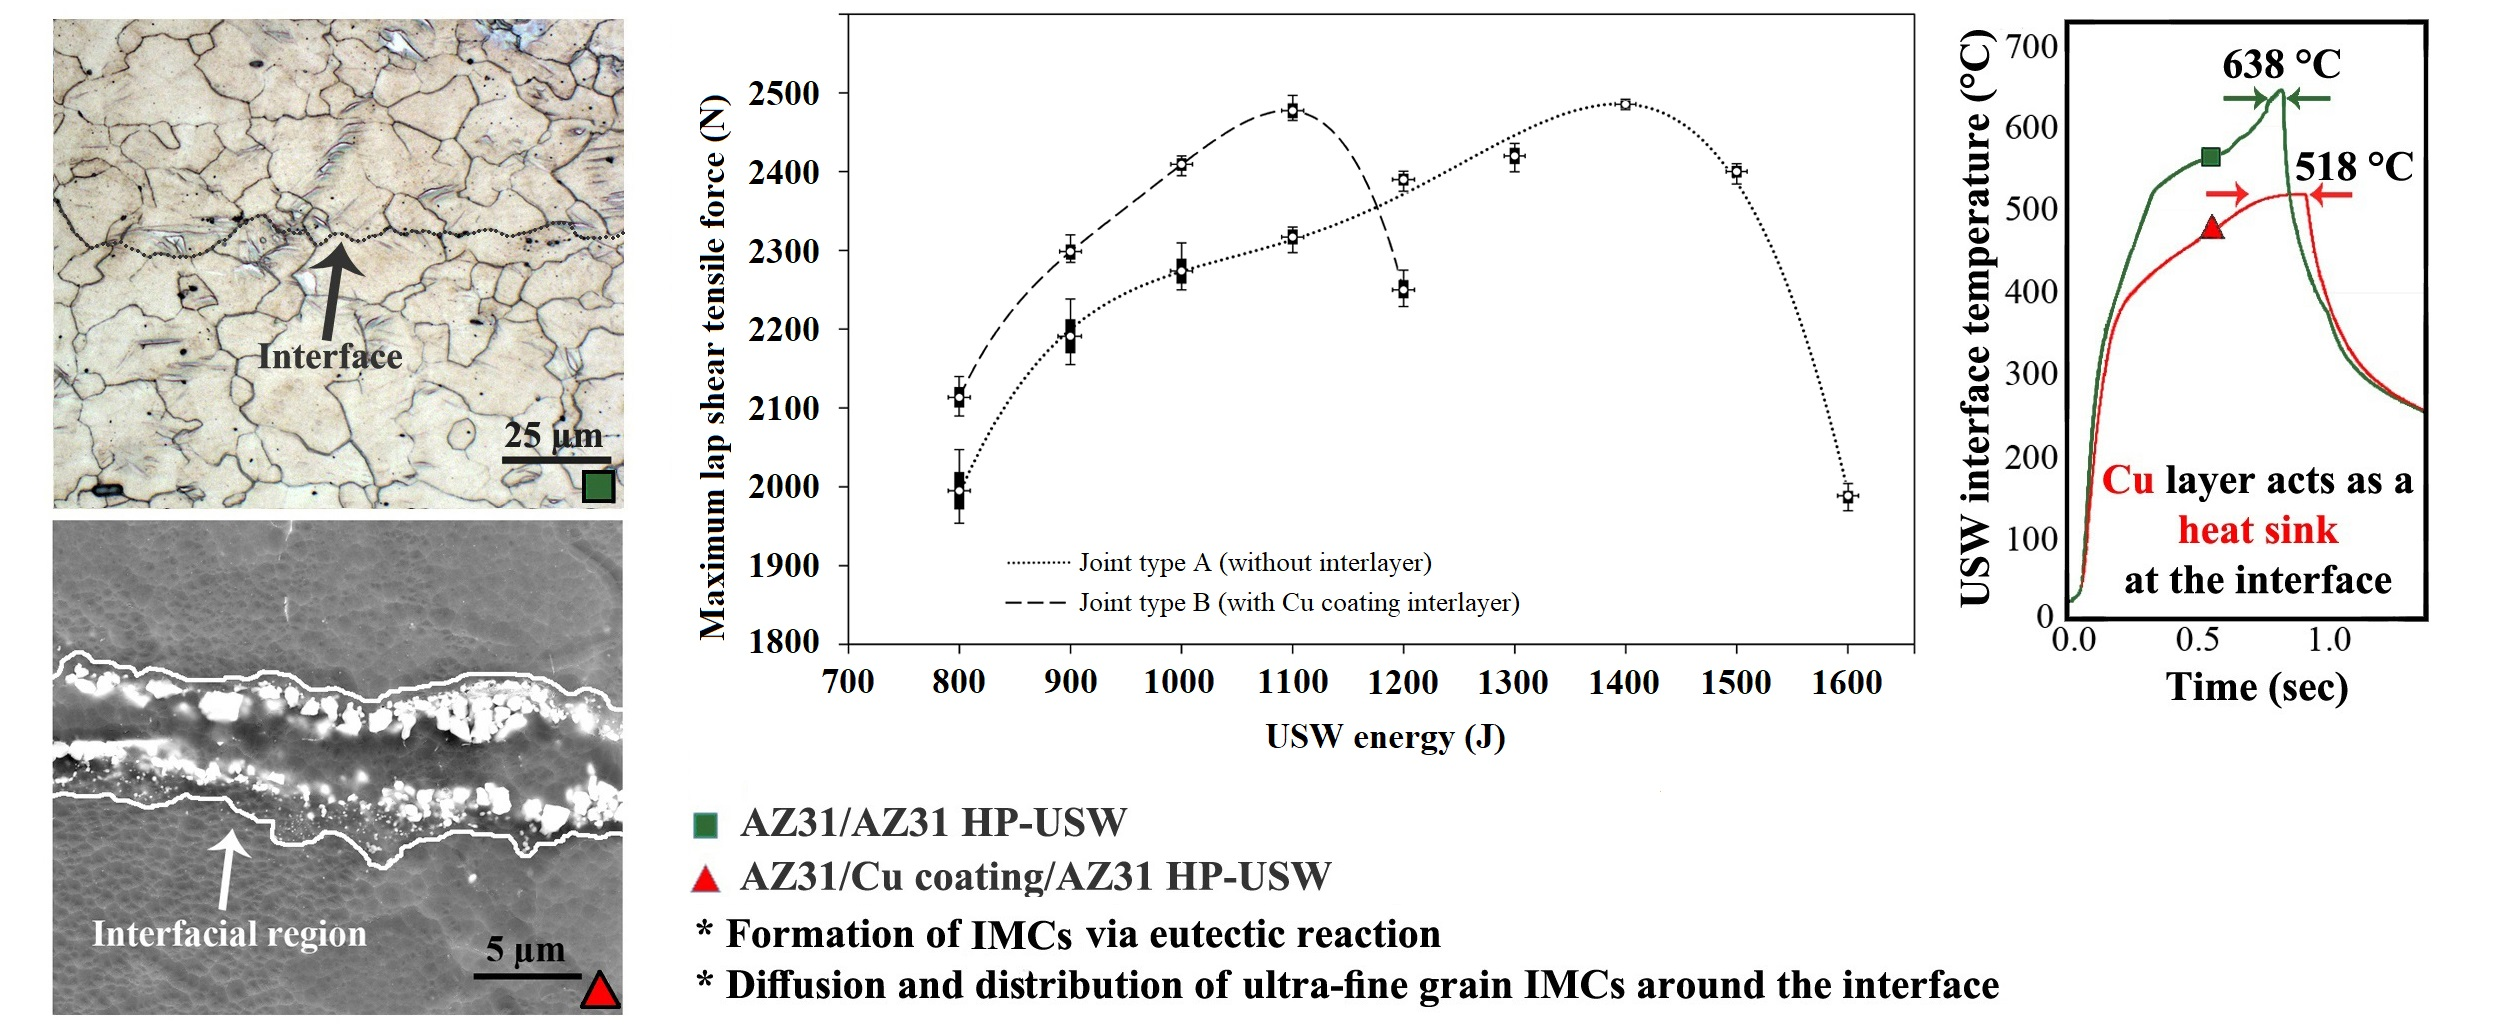
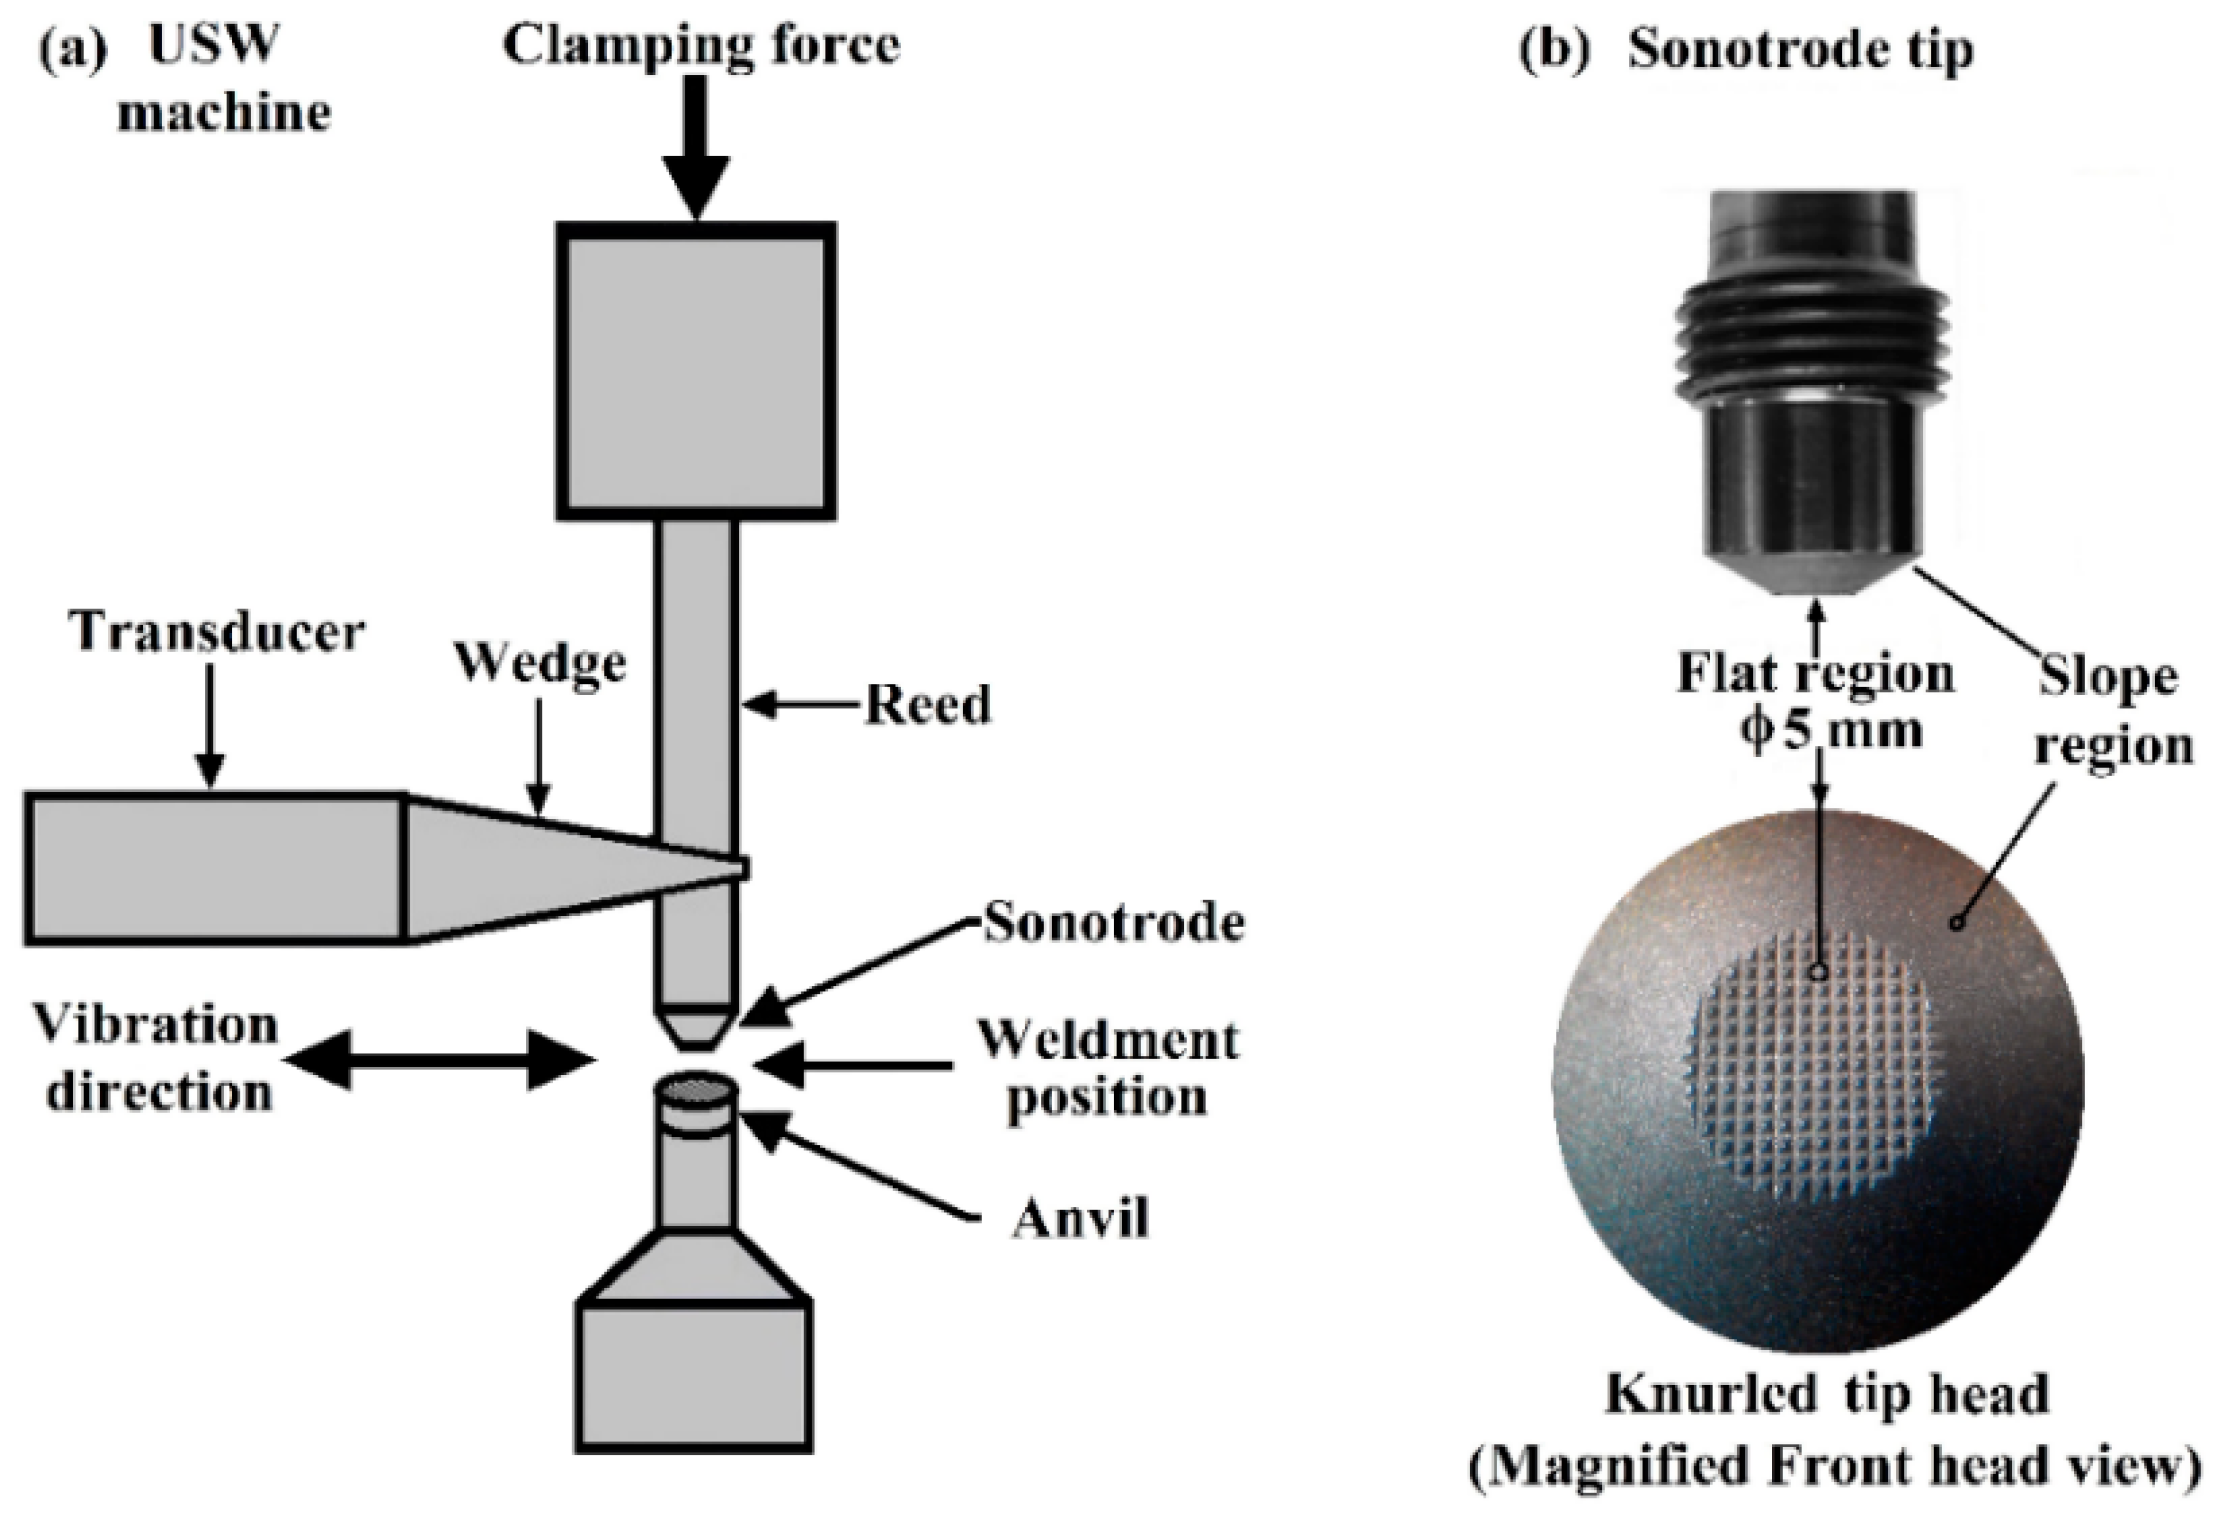
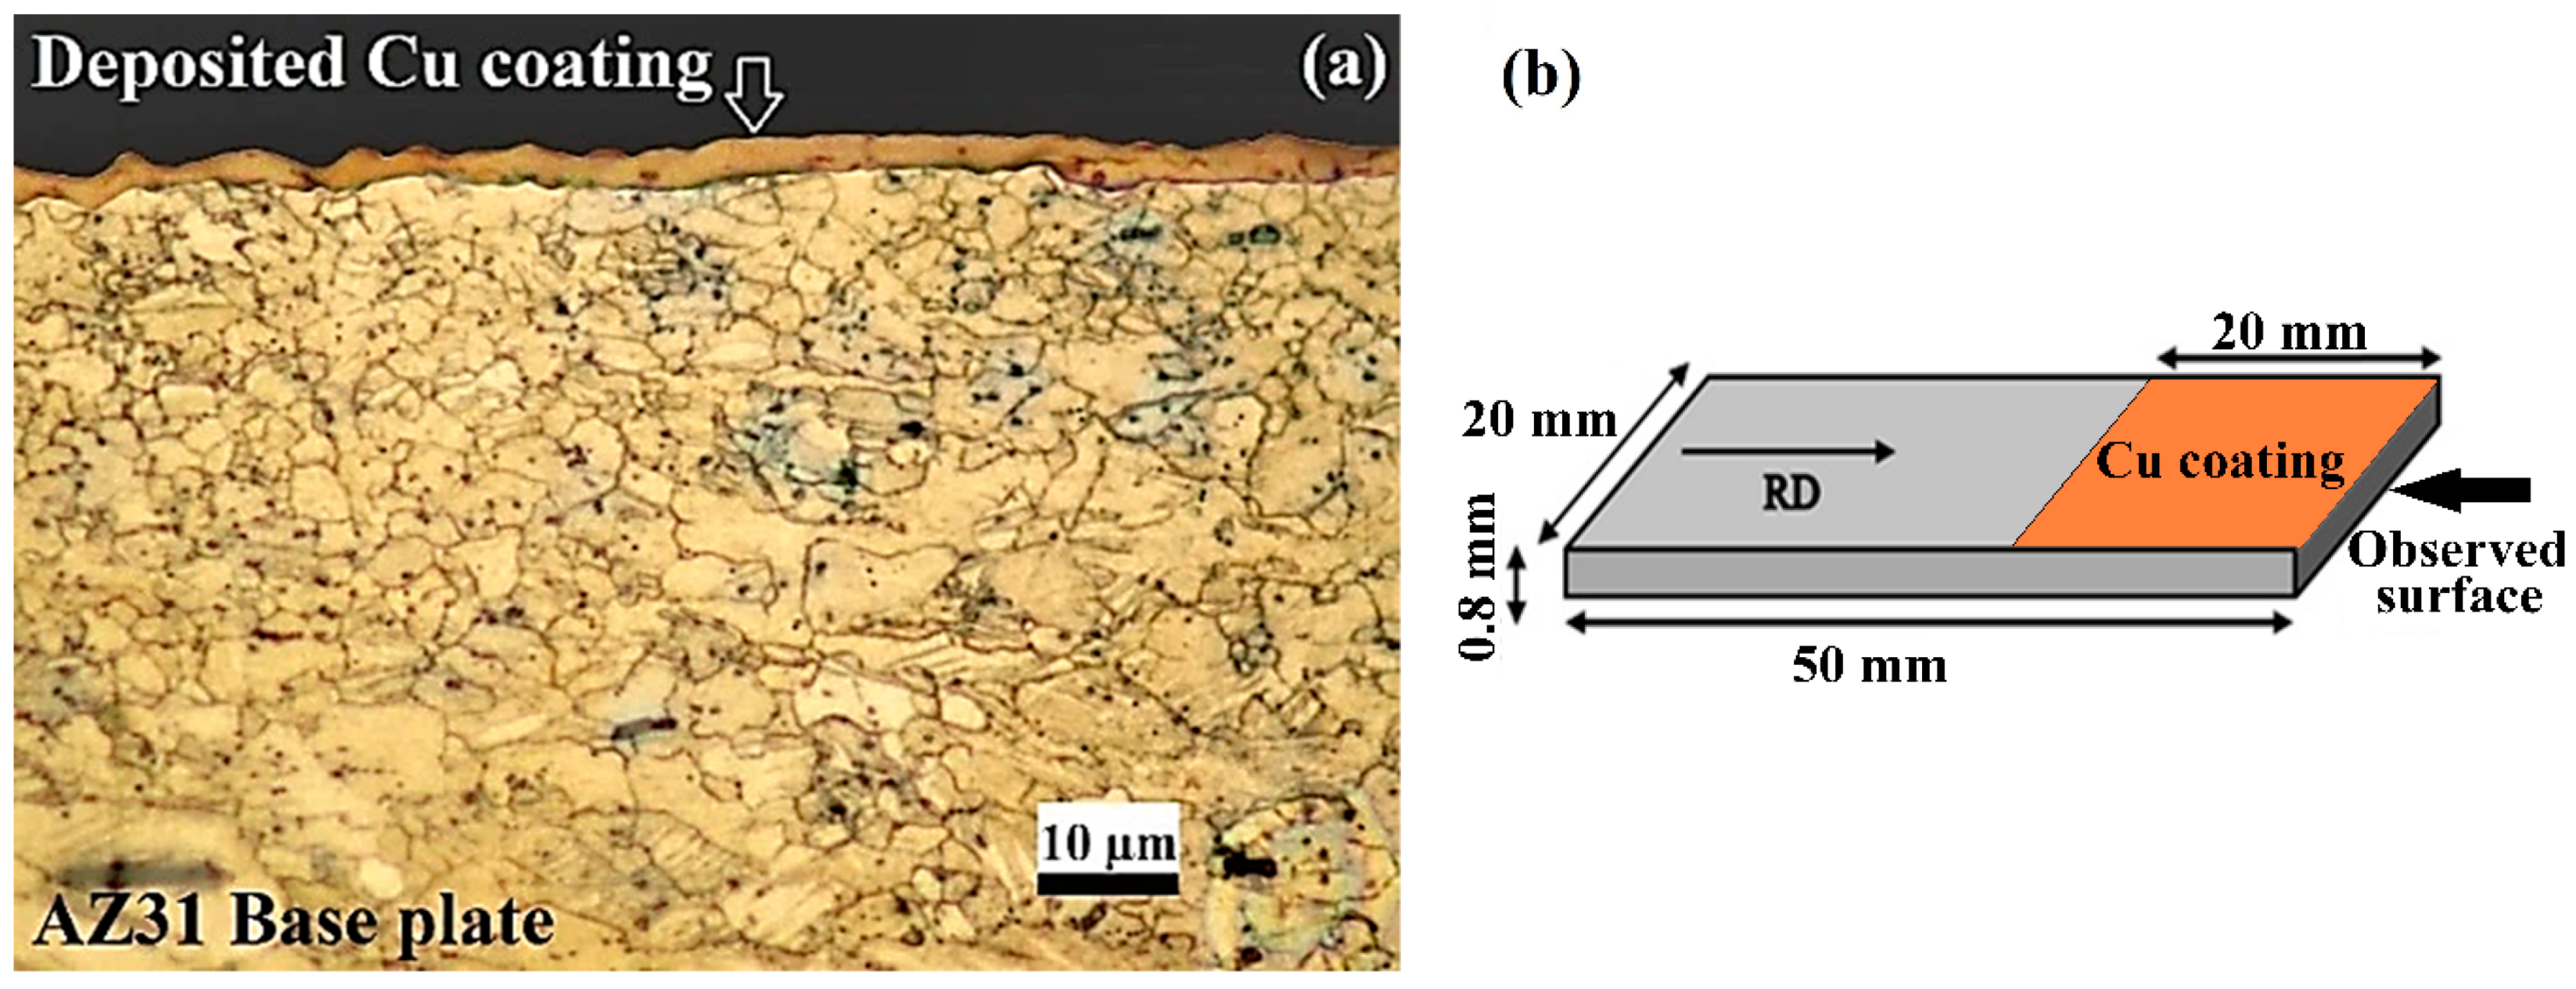
2. Materials and Methods
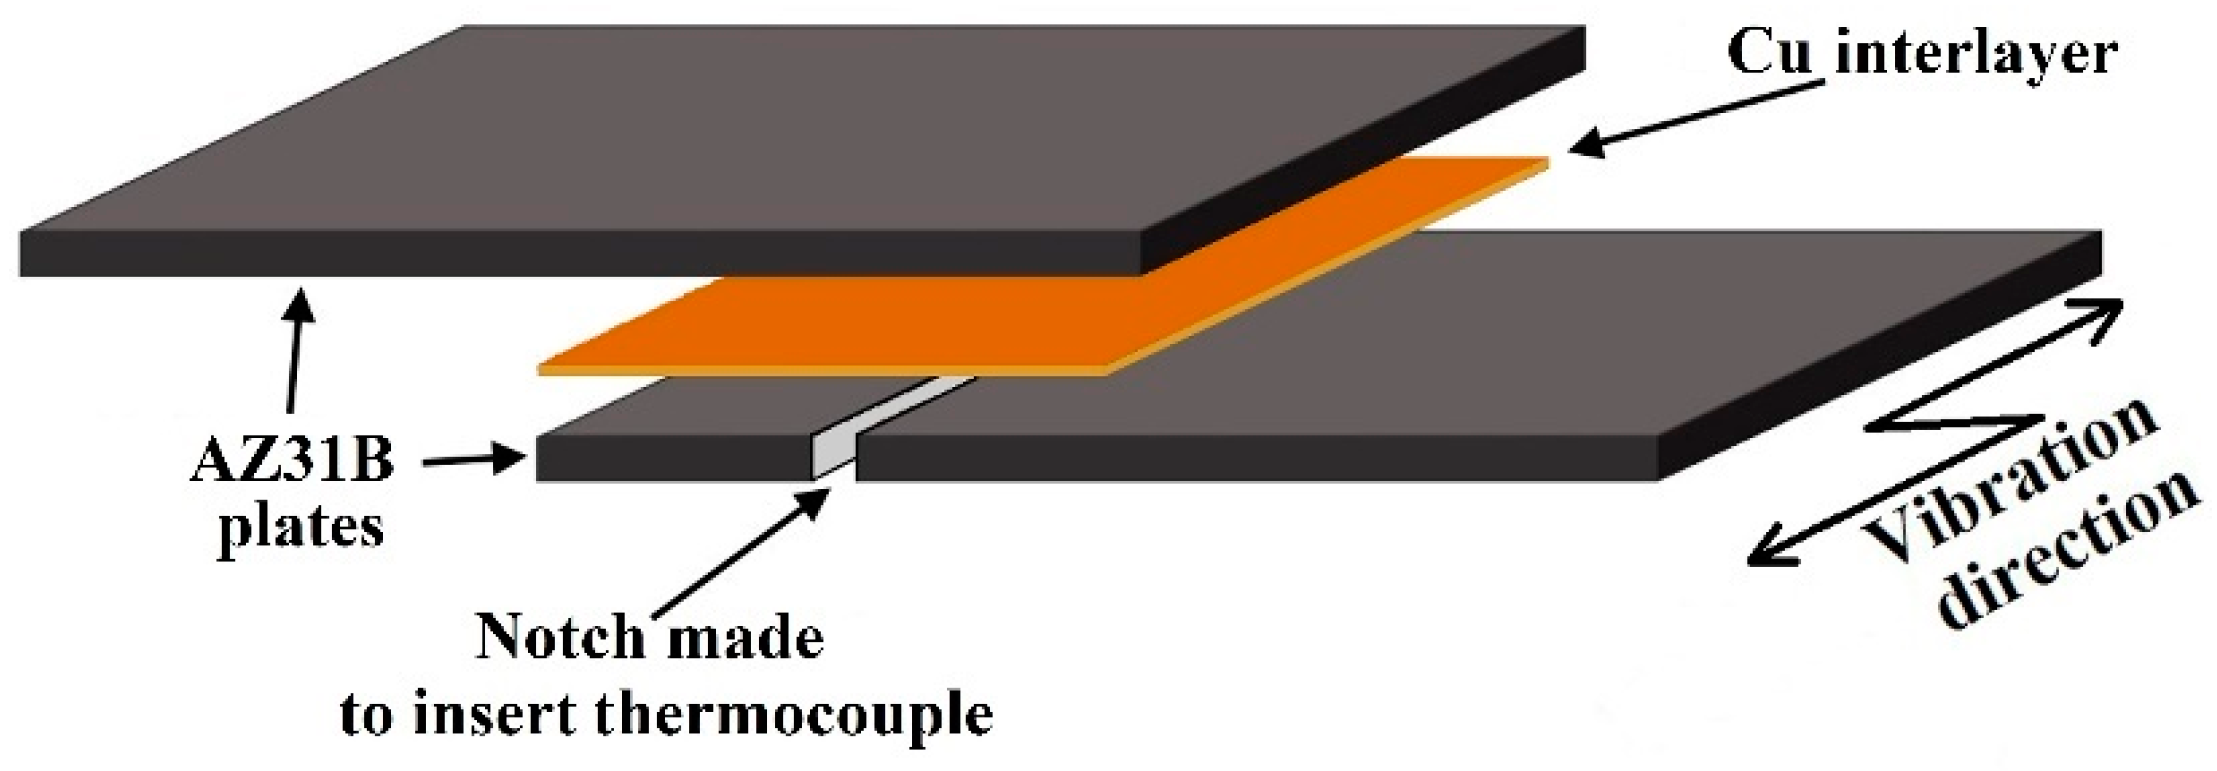
- Joint type A: Direct welding of AZ31B plates without using interlayer; and,
- Joint type B: Cu coated AZ31B top plate welded to uncoated AZ31B bottom plate.
3. Results and Discussion
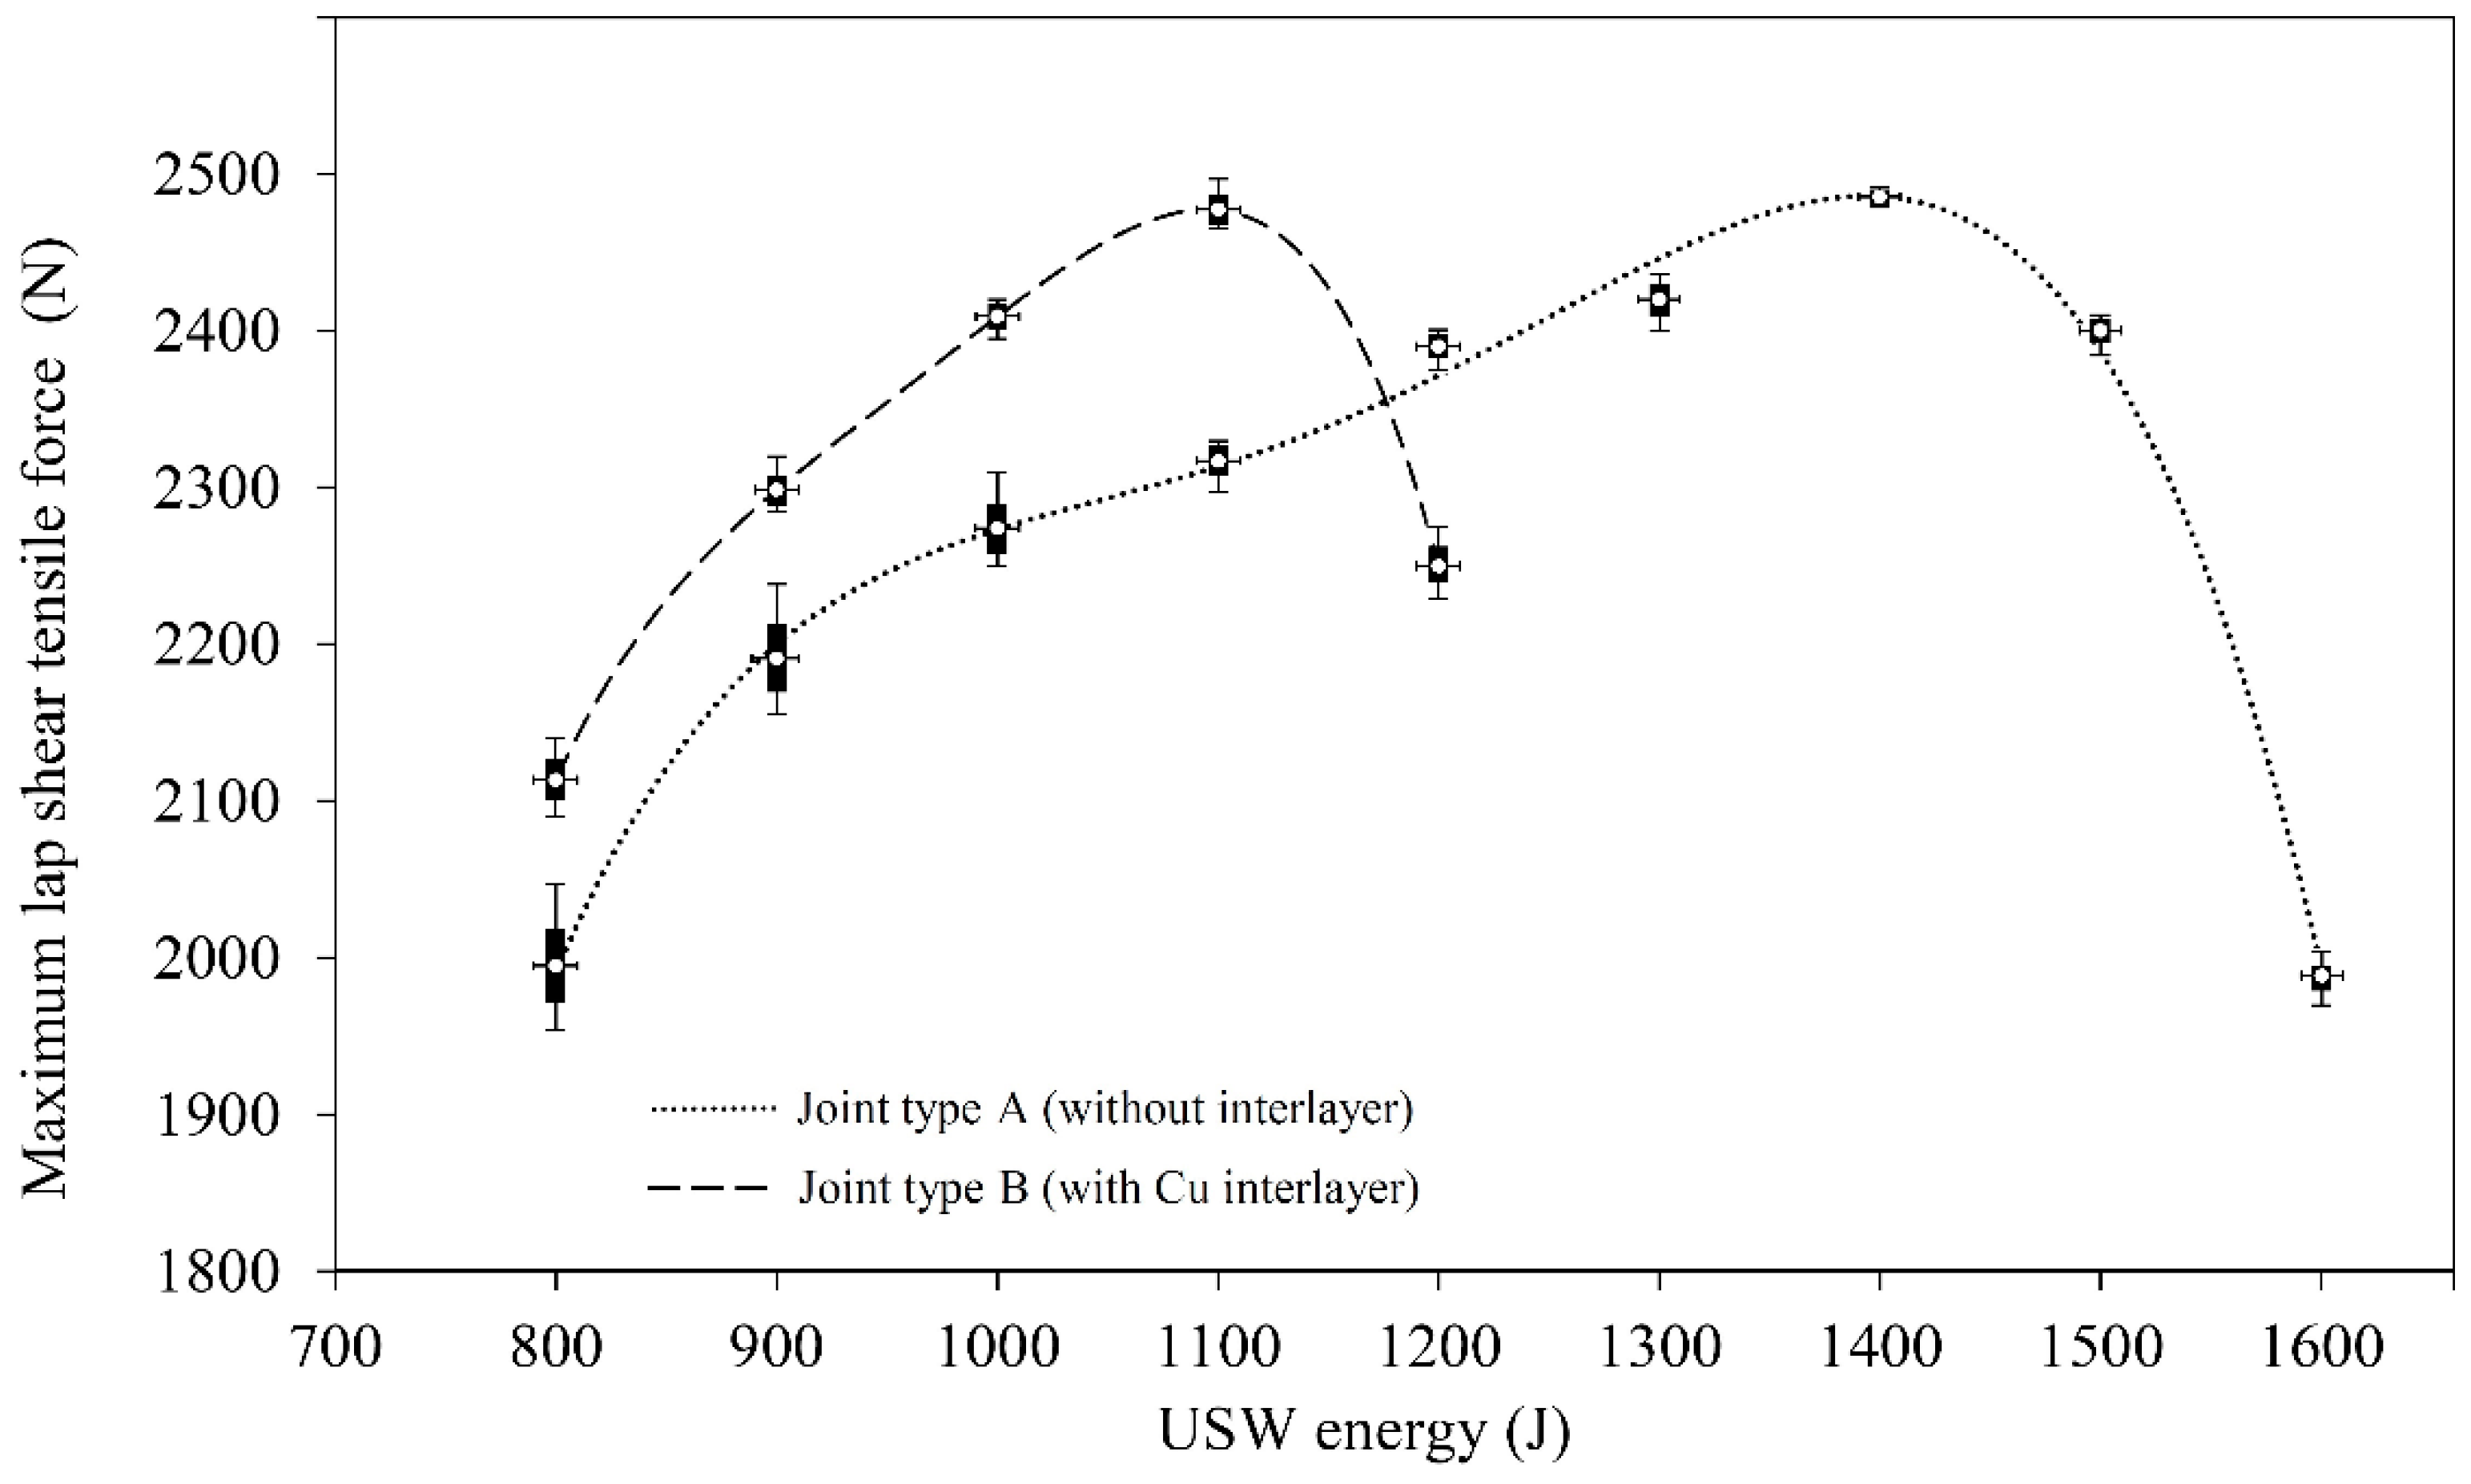
3.1. Lap Shear Tensile Test Results
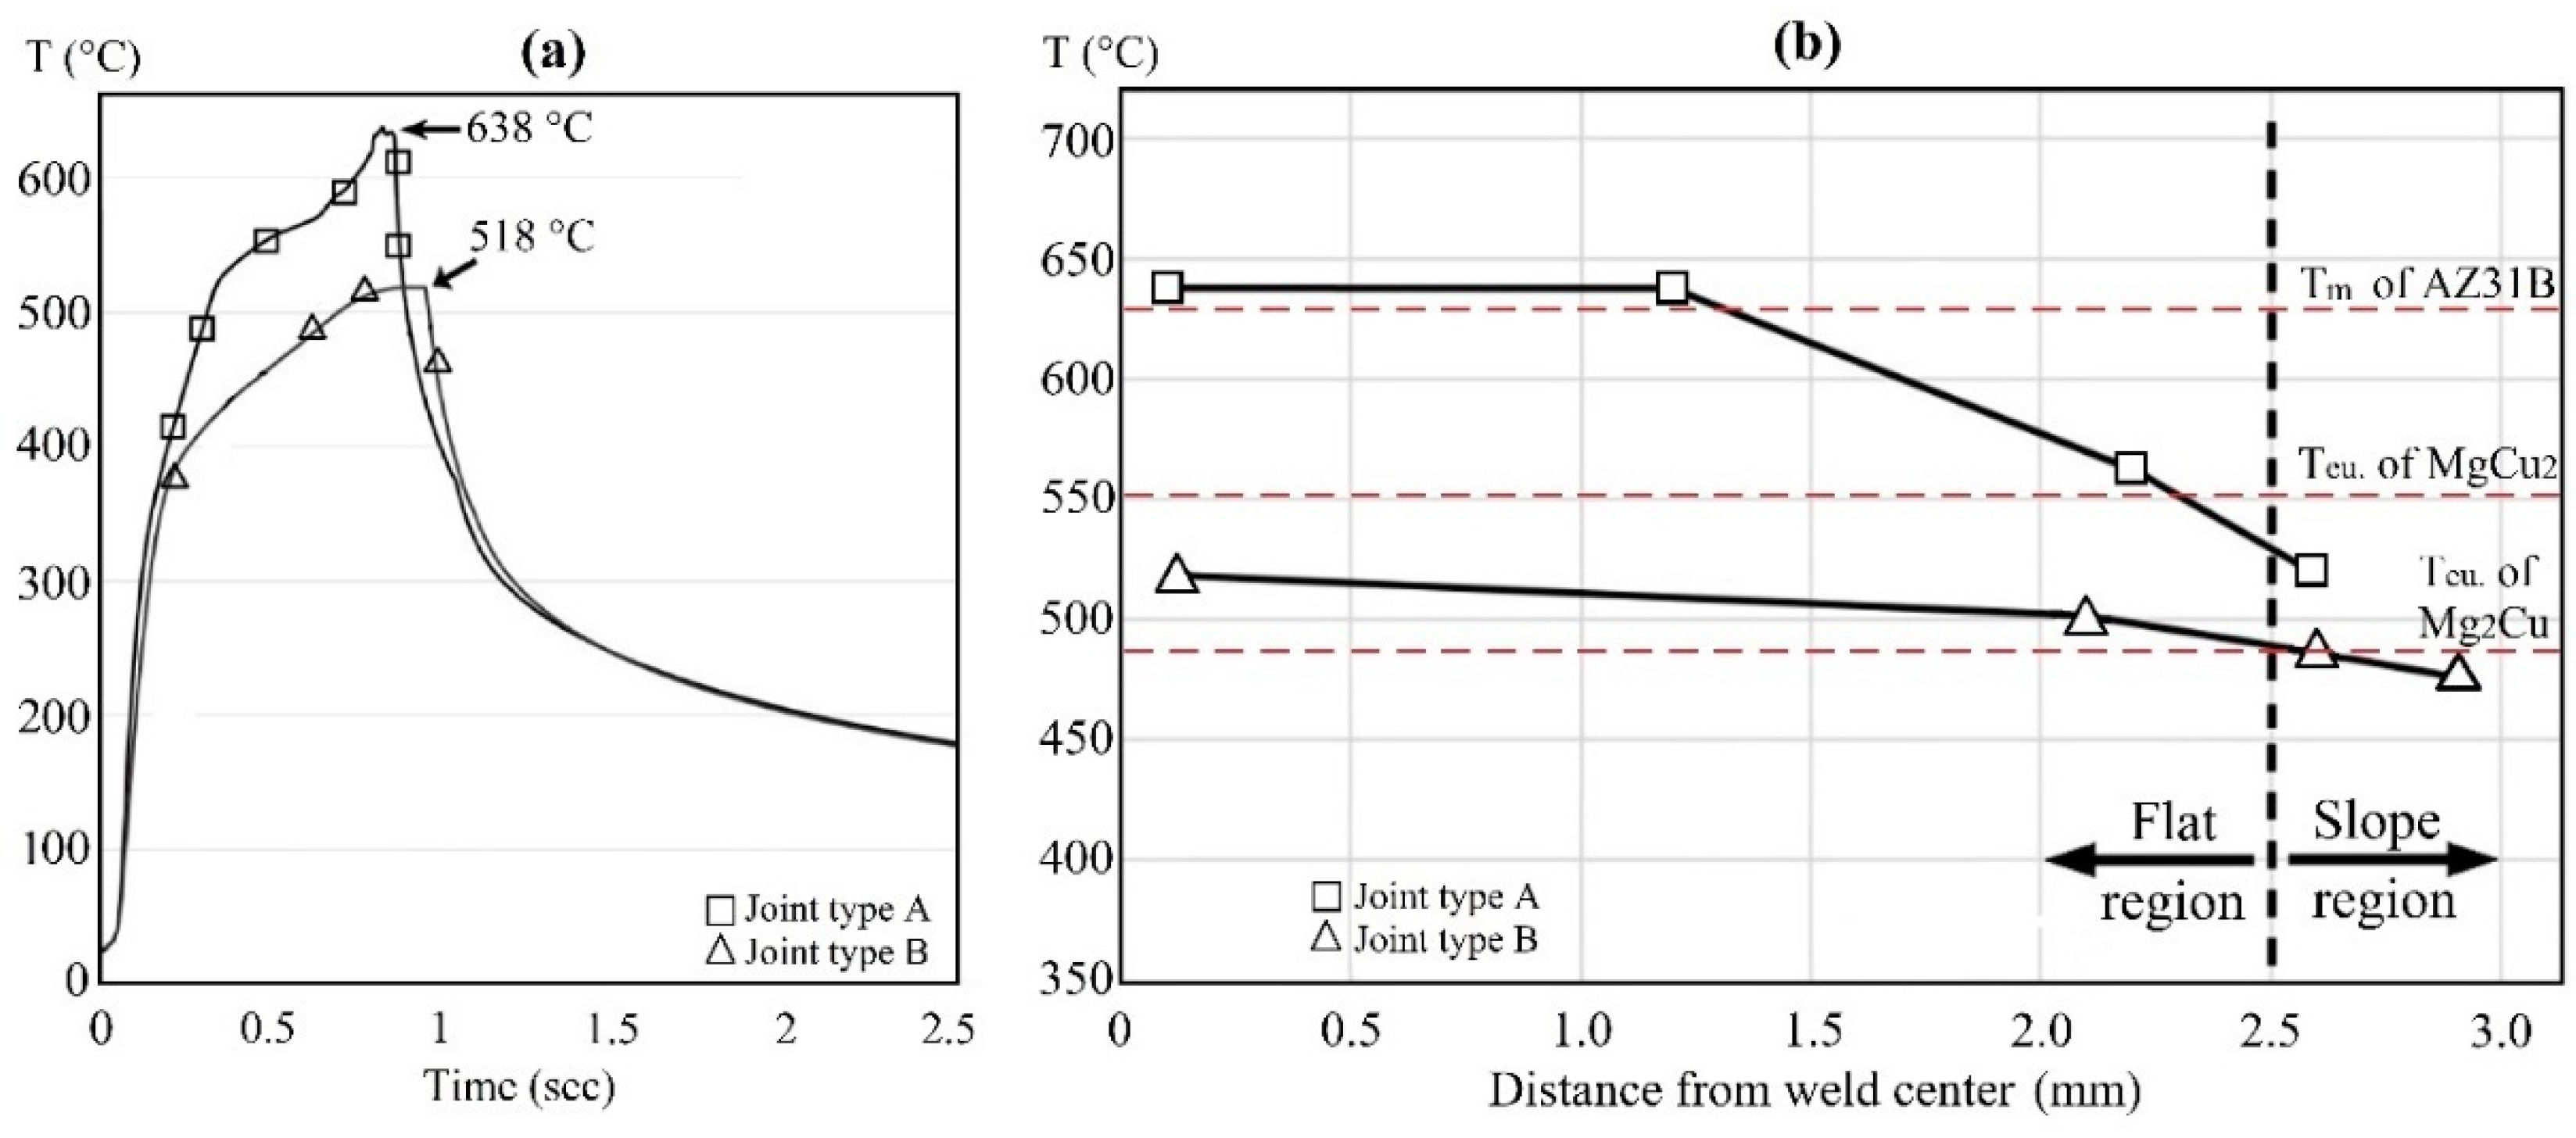
3.2. Interface Temperature Measurements
3.3. Interface Characterization
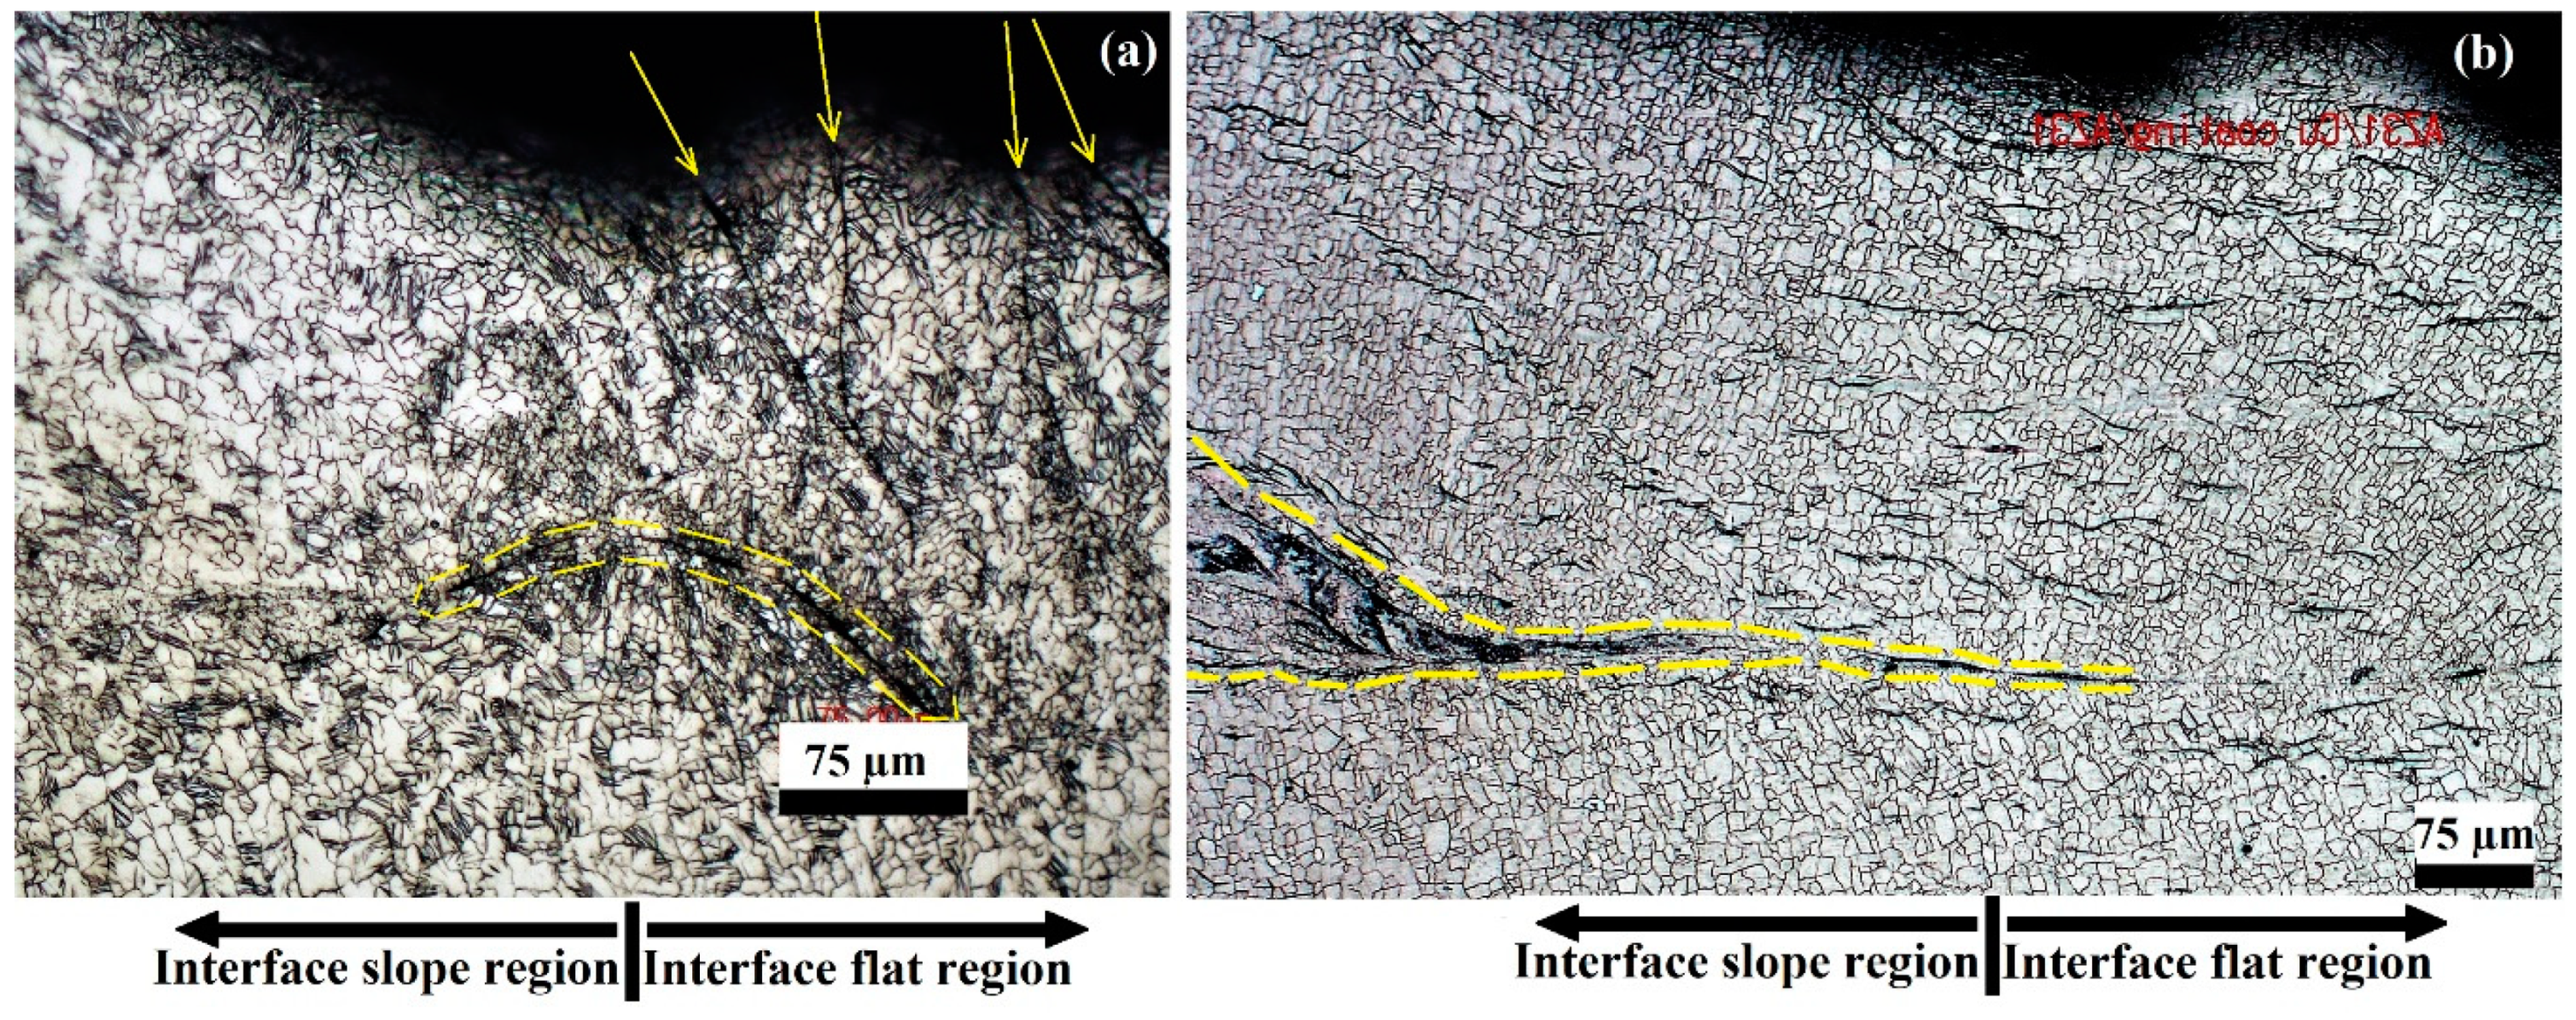
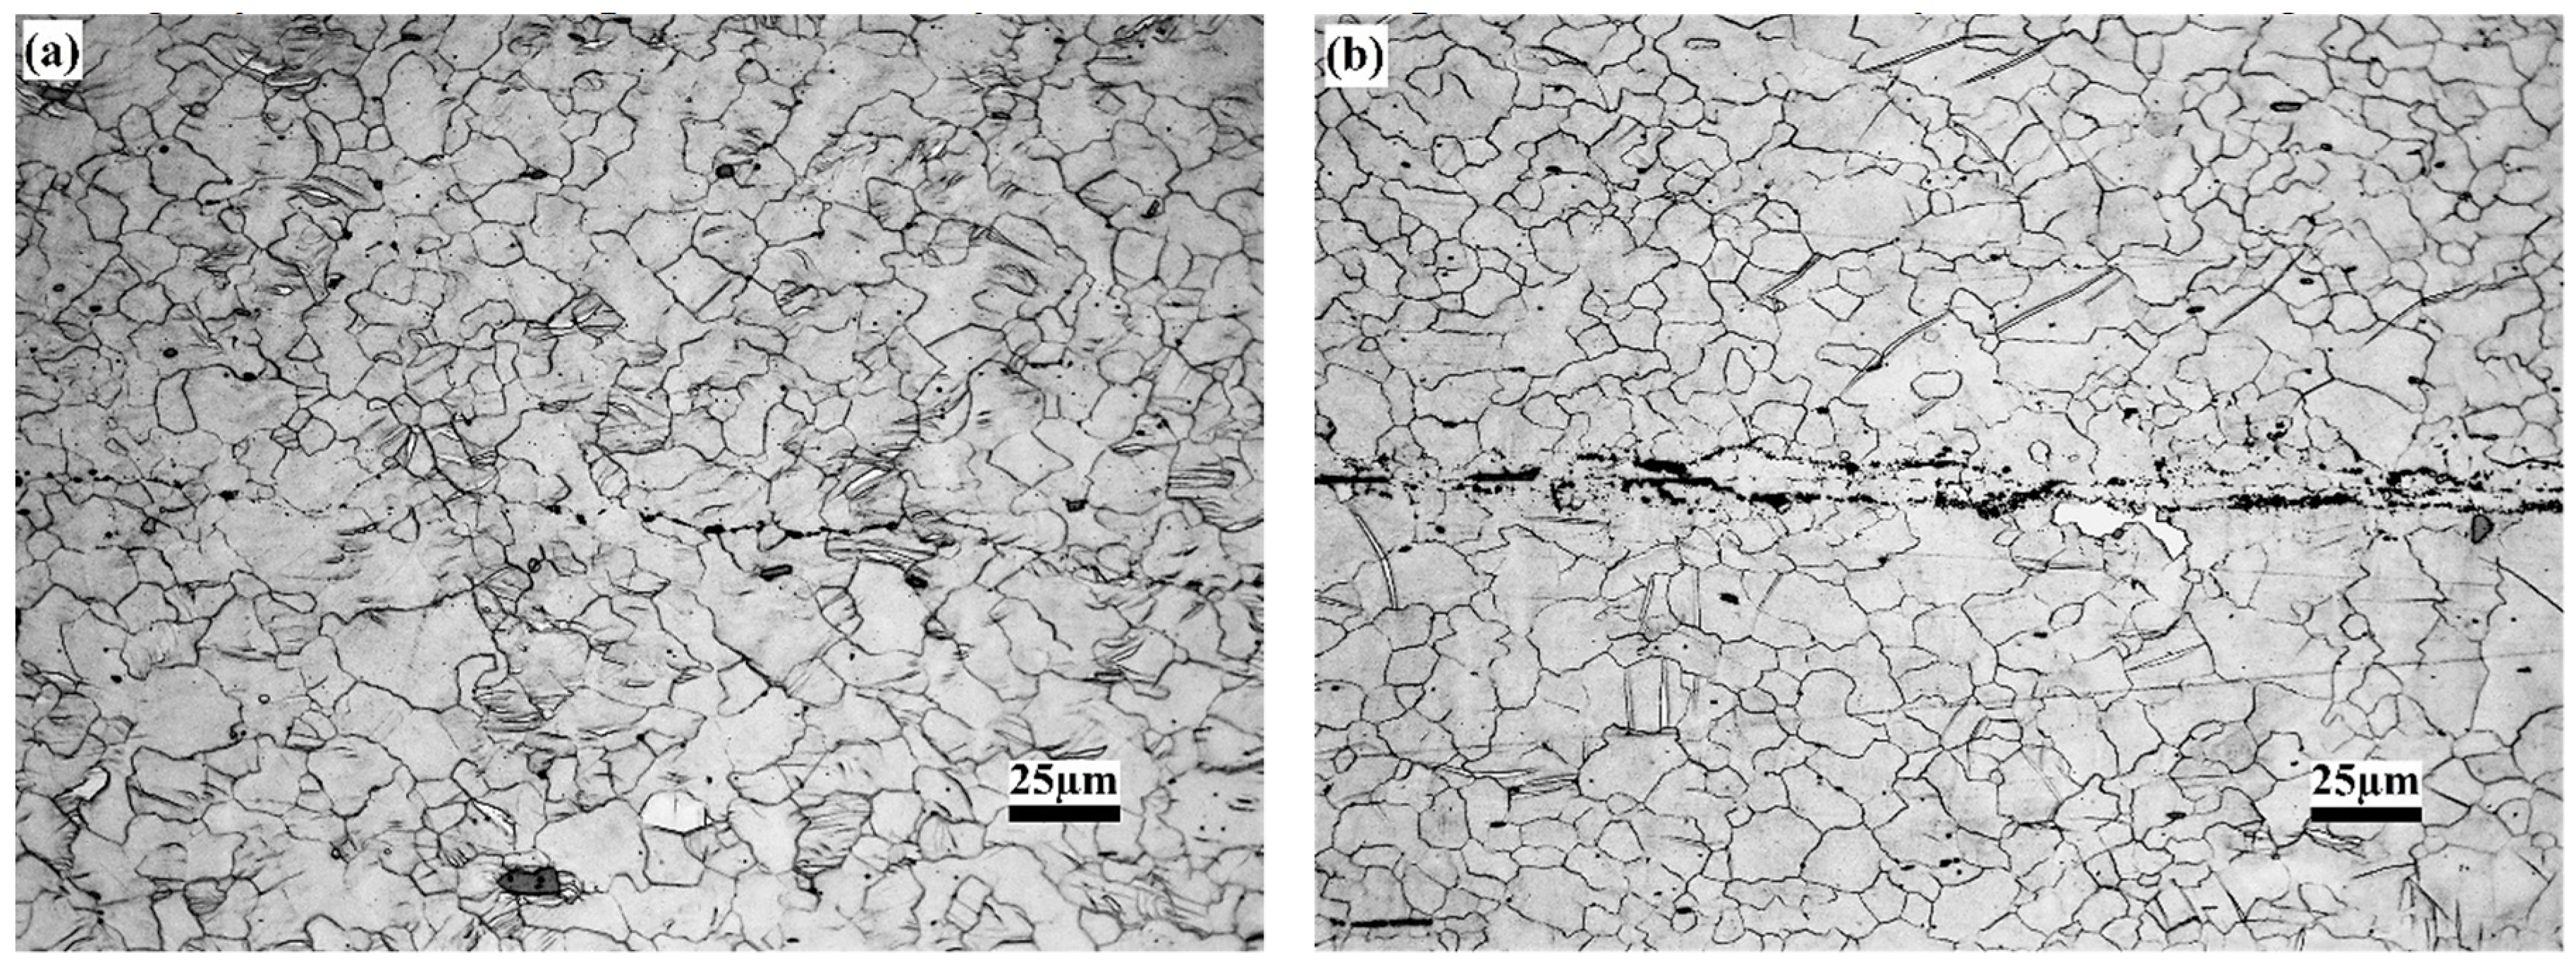
3.3.1. Light Microscopy Observation
3.3.2. Microhardness Evaluation
3.3.3. Electron Microscopy Analysis
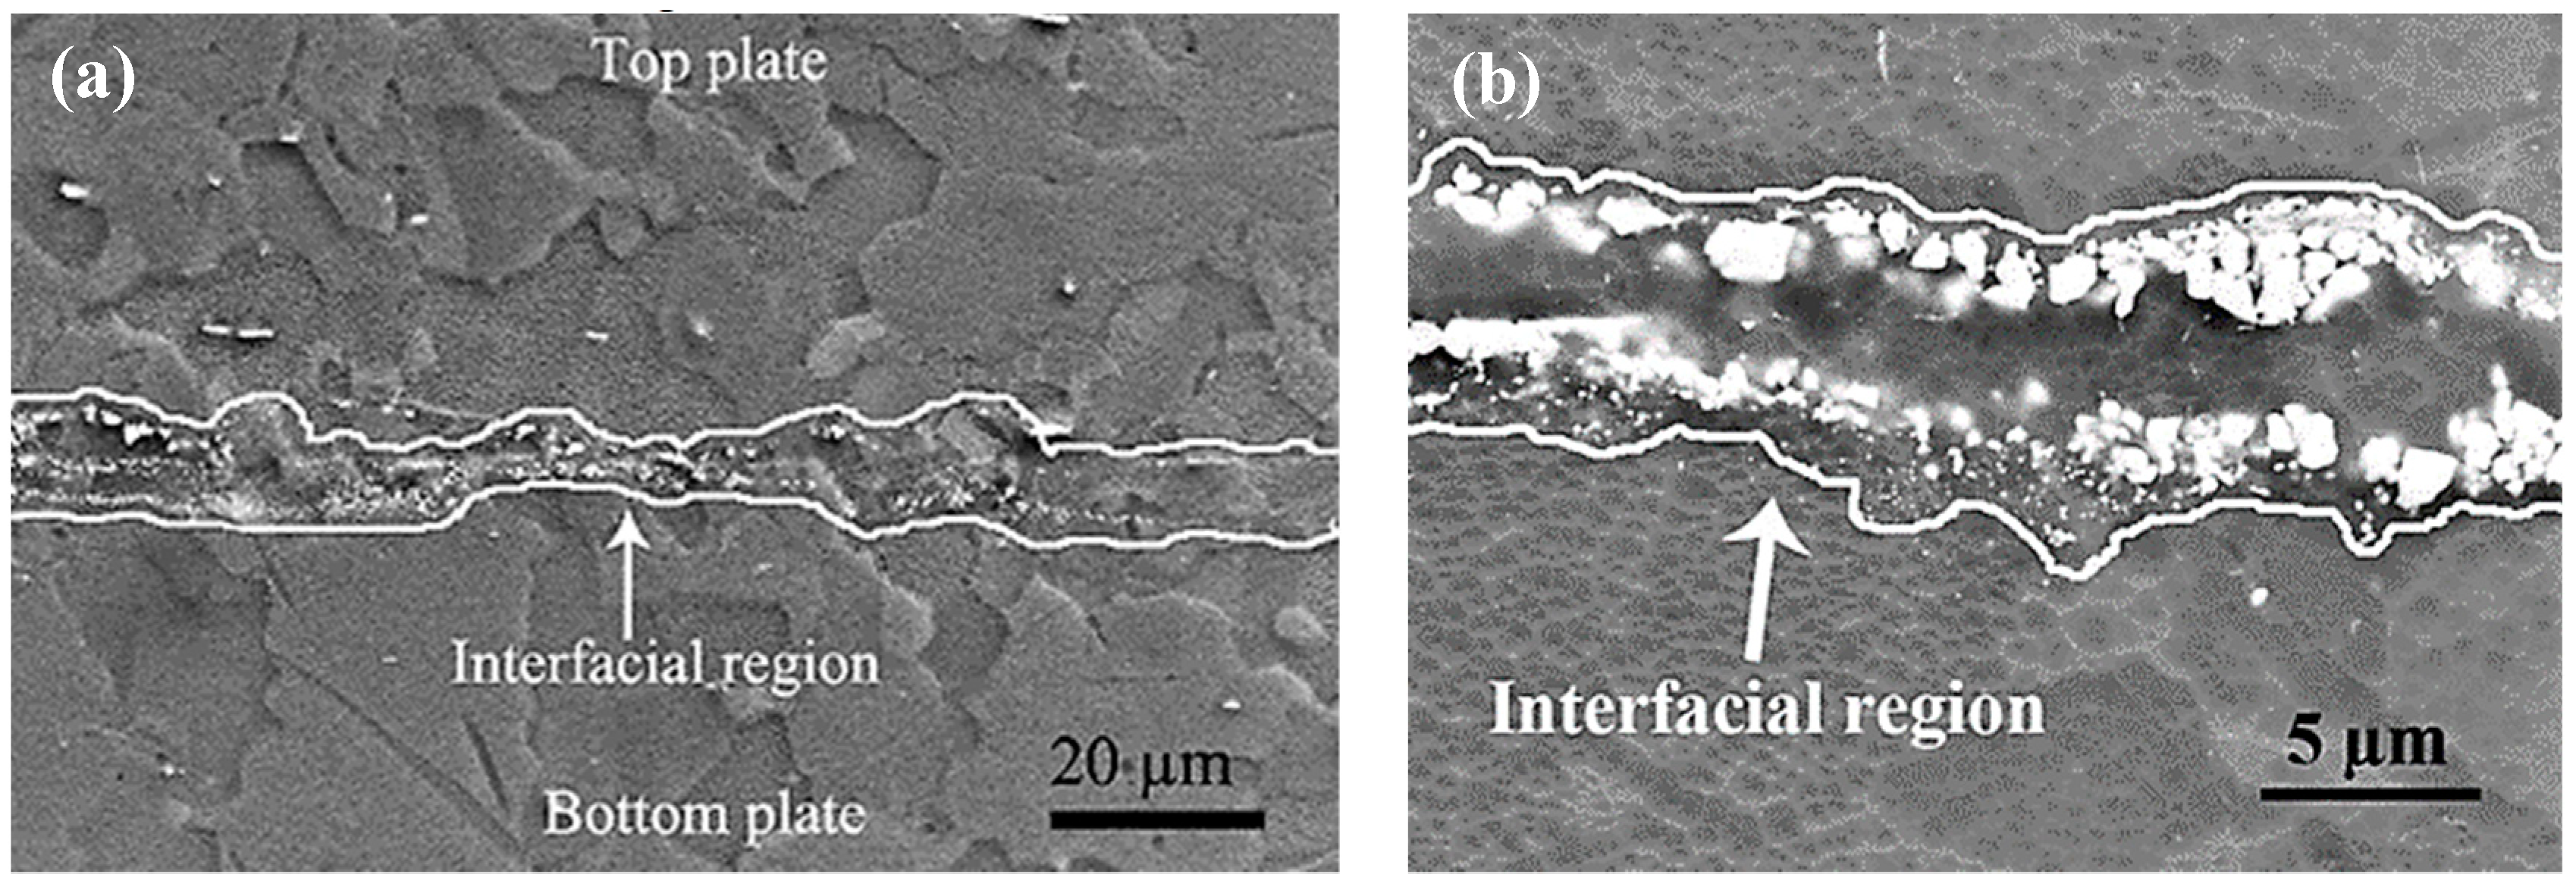
SEM Interface Observation
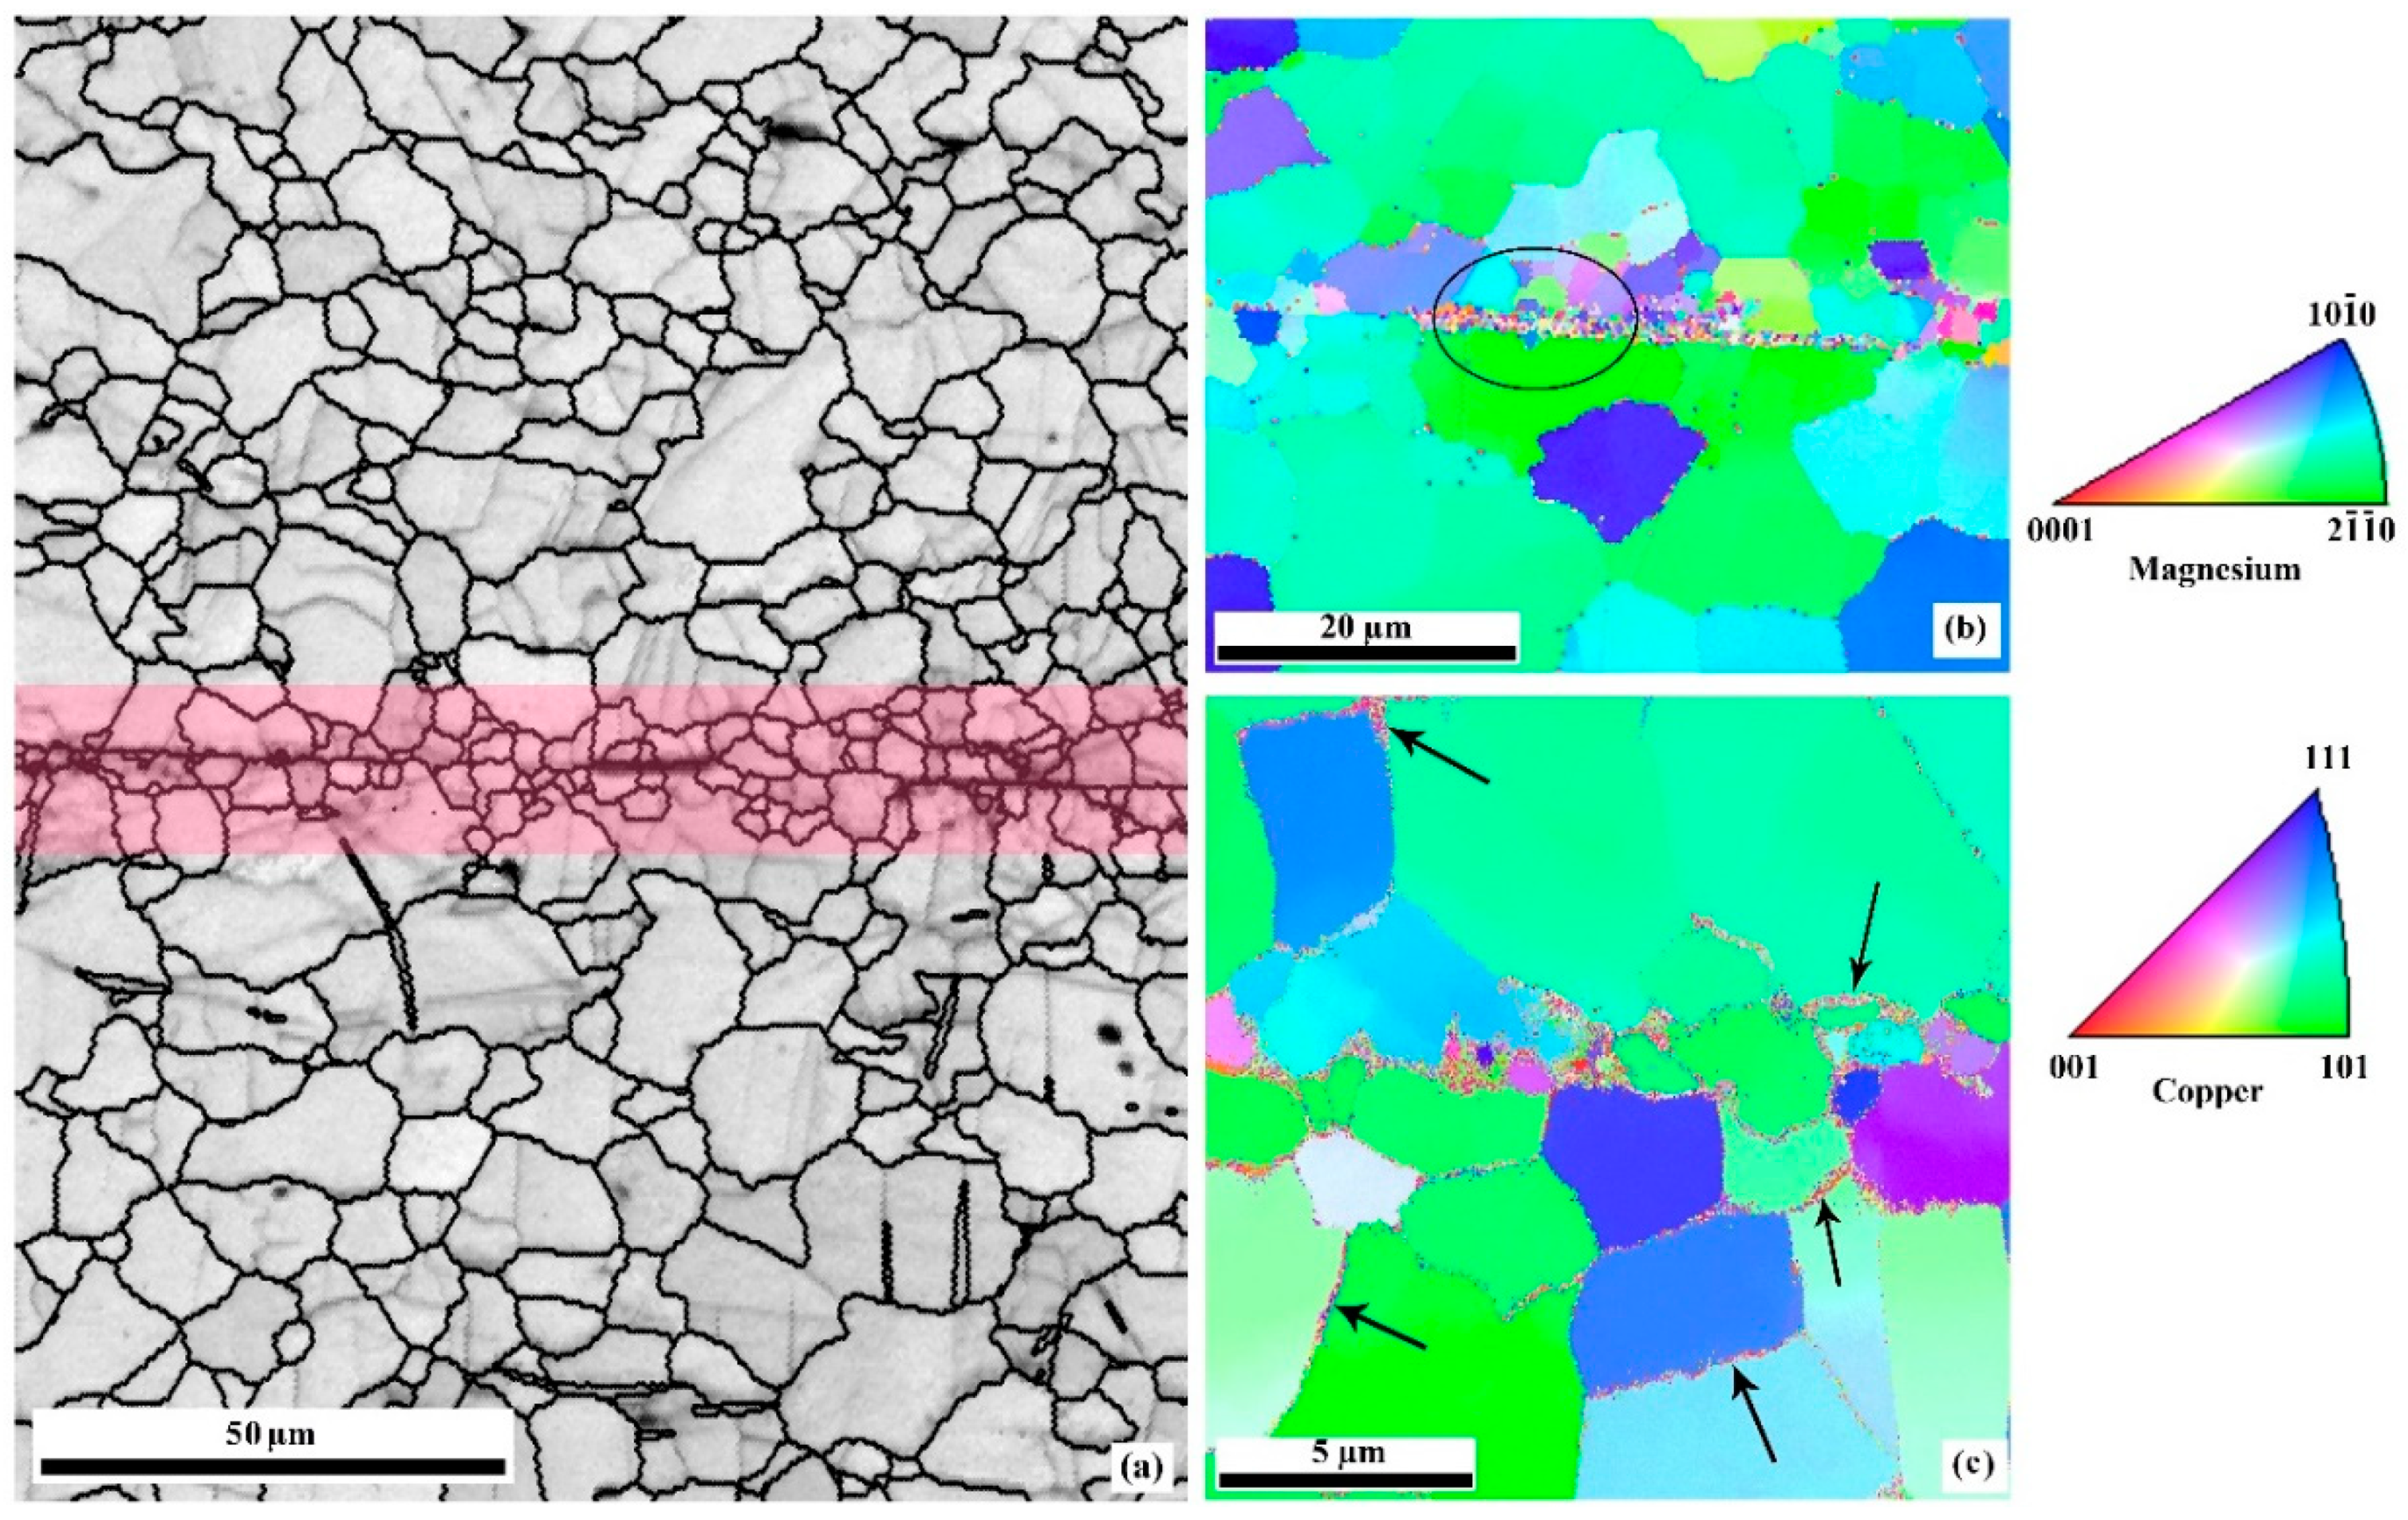
EBSD Analysis
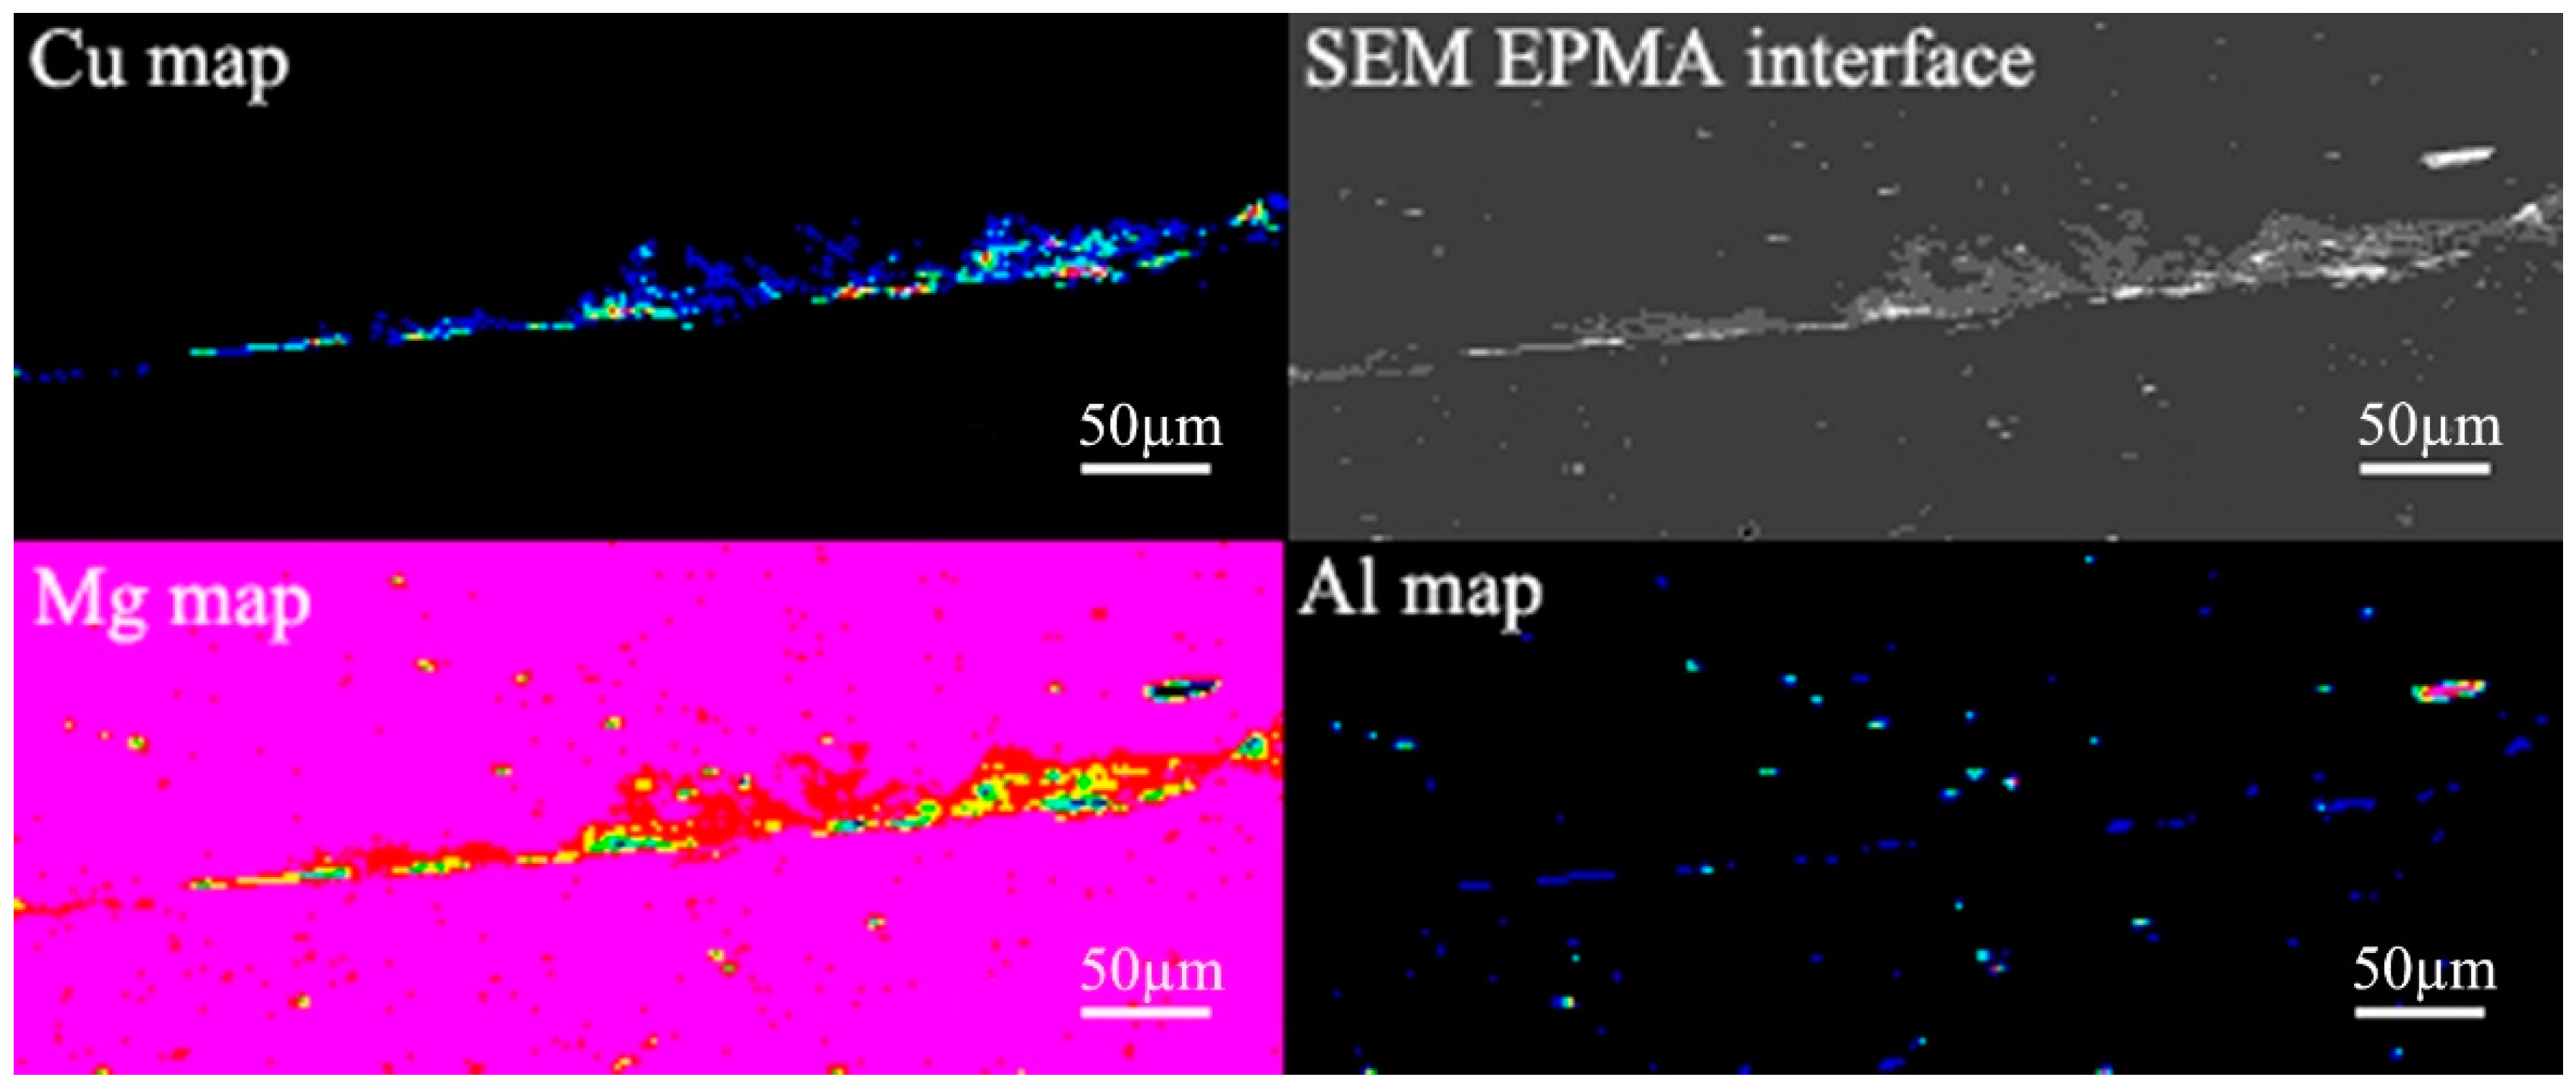
EPMA Analysis
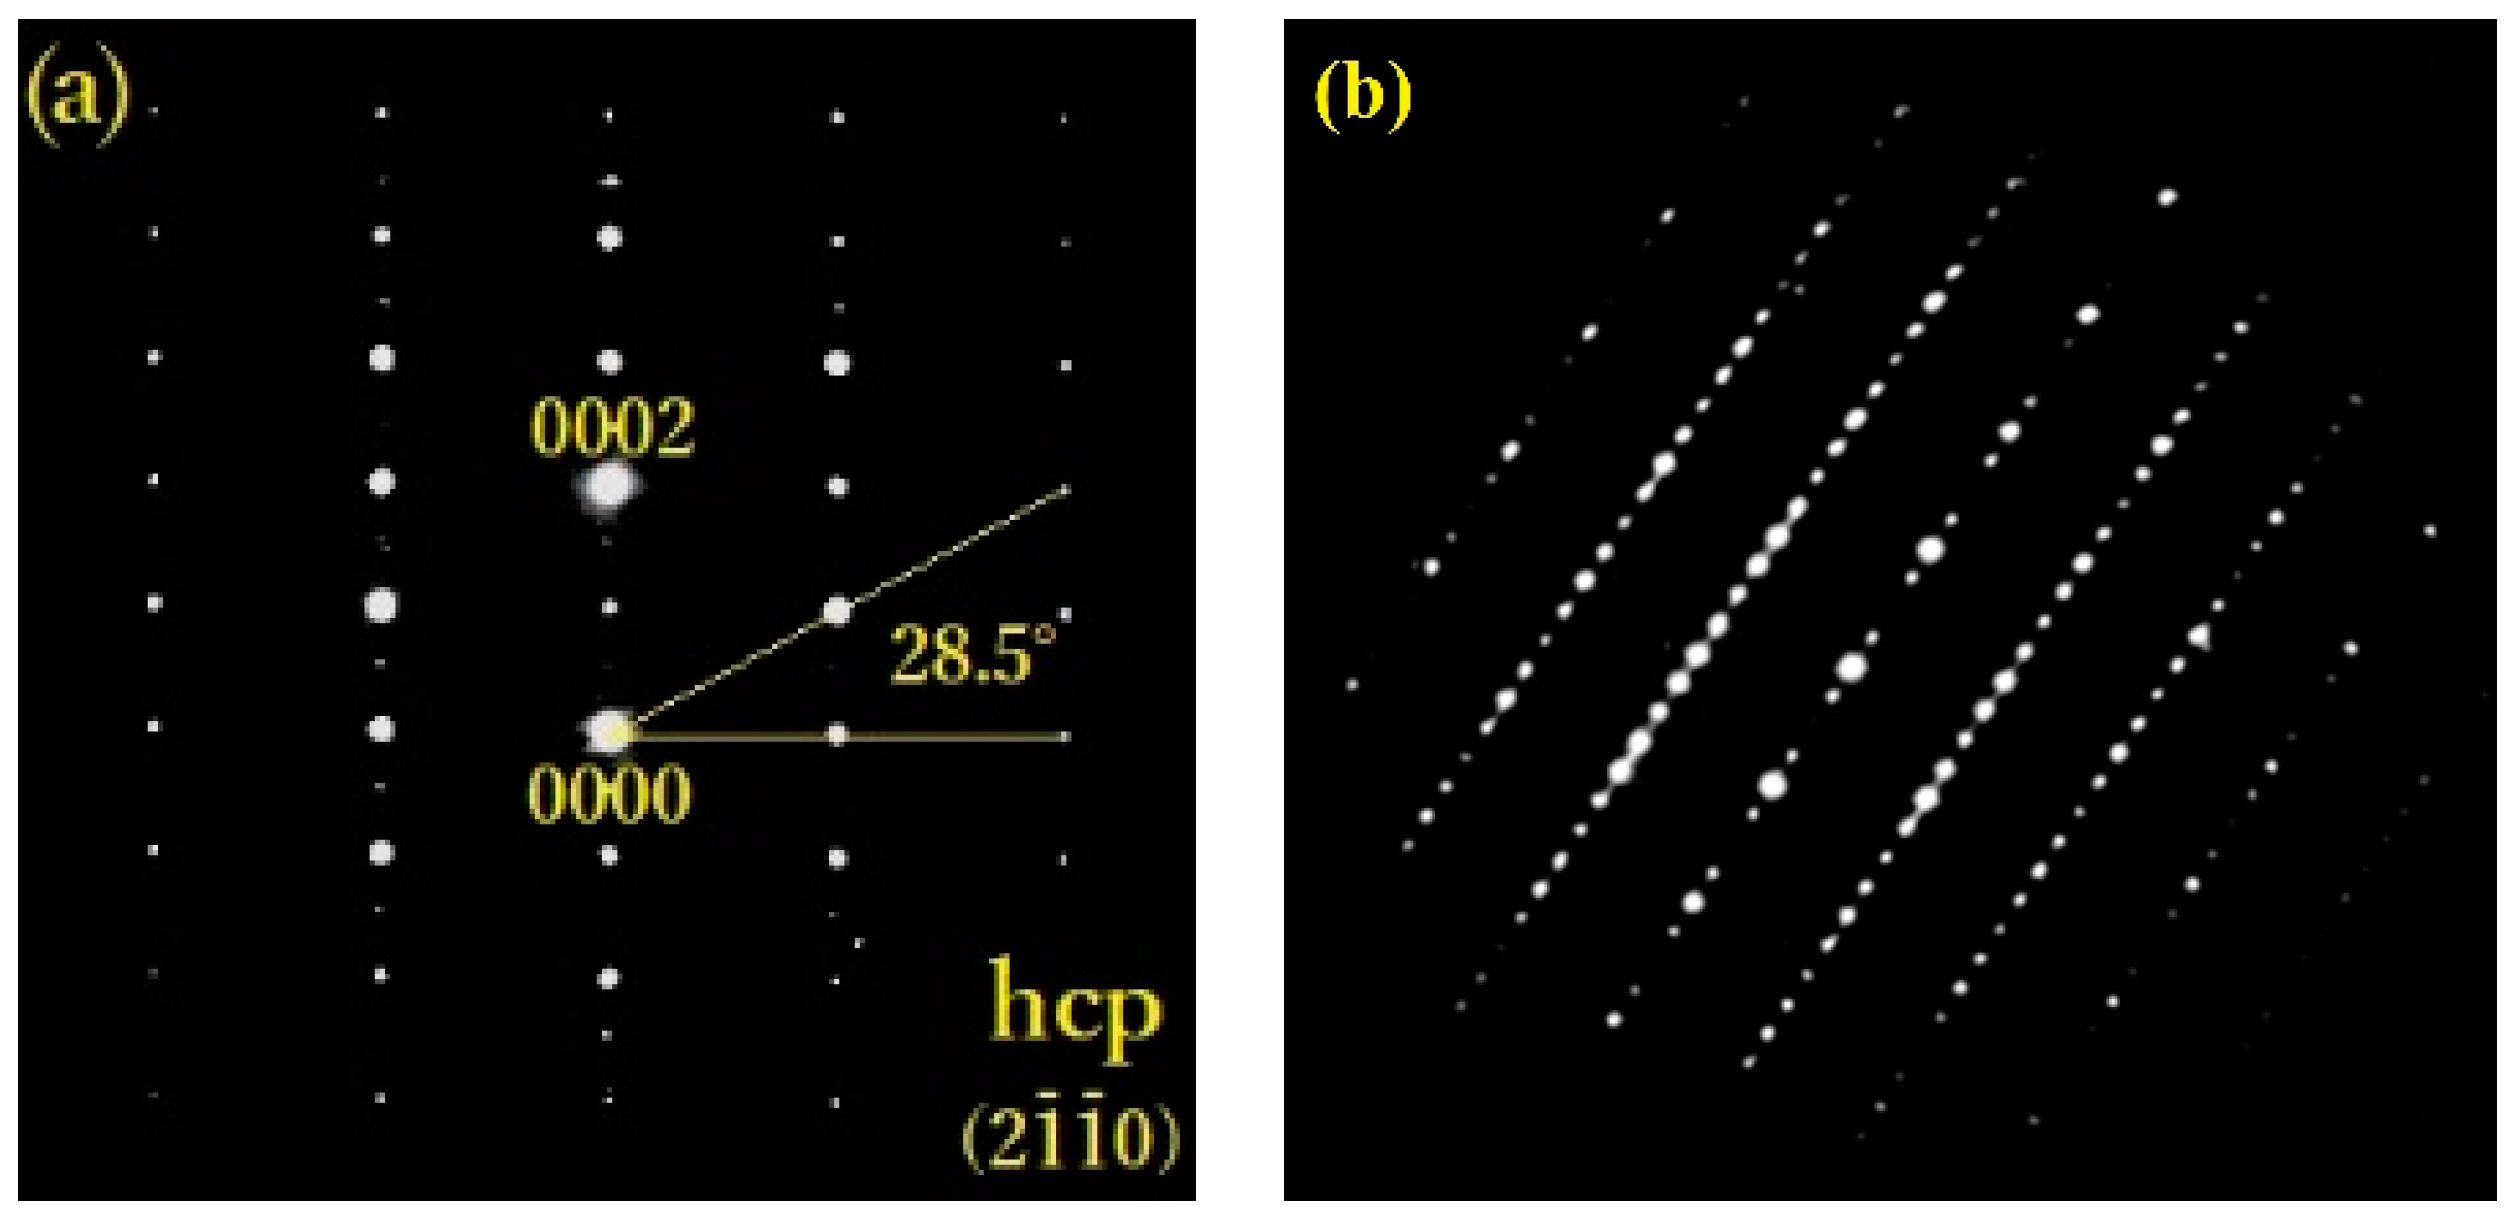
TEM Interface Analysis
4. Conclusions
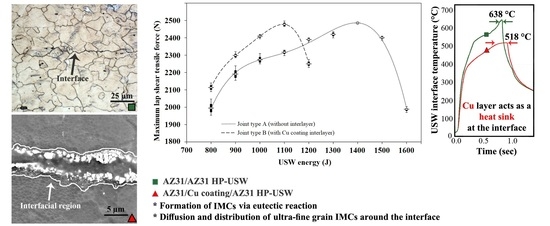
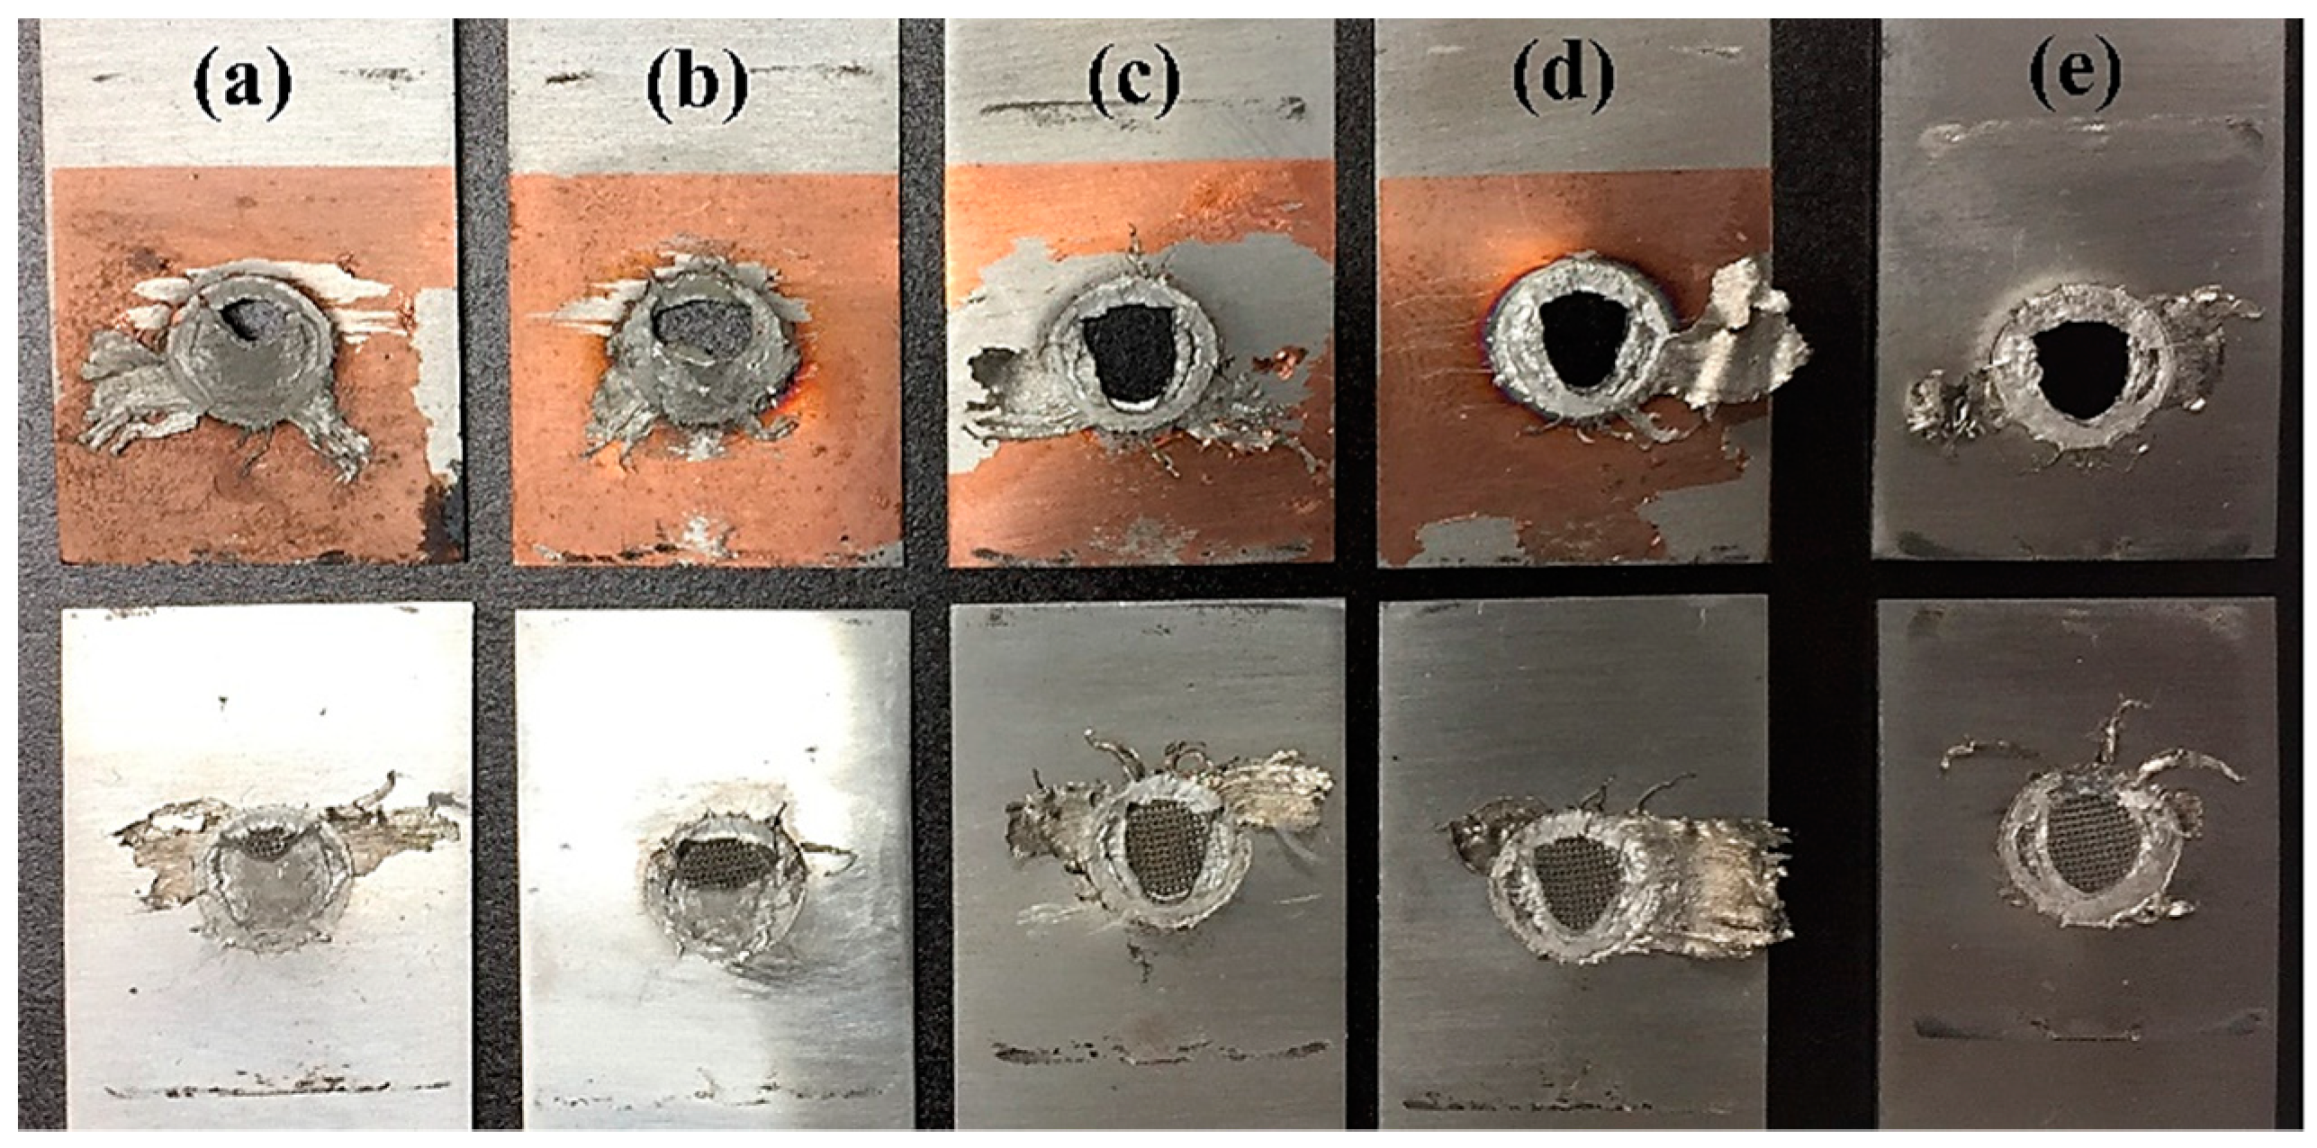
- Microstructure observations on interface, together with high mechanical strength and nugget pull-out fracture, revealed good weldability of the Cu interlayered joint.
- Highest strength for interlayered joints was achieved in 20% lower USW energy, as compared to joints without the interlayer.
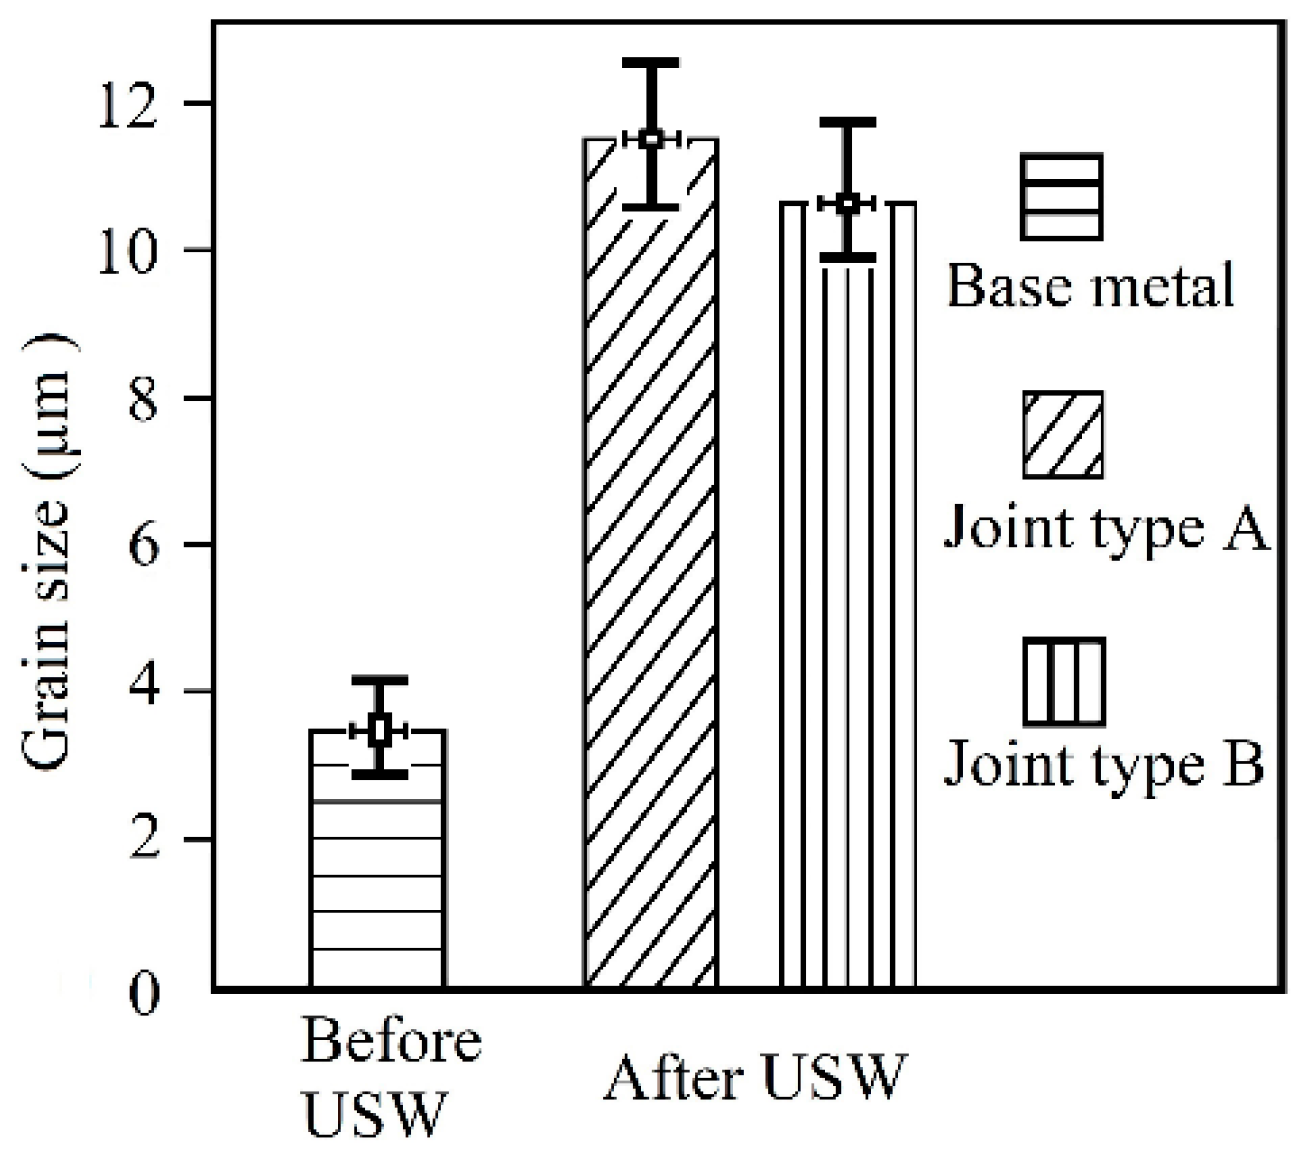
- The microstructure of base metal after USW, converted to enlarged equiaxed grains with grain growth in the scale of three times larger than initial value, which is attributed to enhanced temperature, alongside high strain rates of HP-USW under the effect of DRX and DRV phenomena.
- Temperature data, alongside EPMA analysis, suggested the formation of Mg2Cu as the main IMC product around the interface. Additionally, EBSD analysis showed the diffusion and spreading of IMC’s to farther the distances from the interface centerline, especially trough grain boundaries.
- Proper strength of the interlayered joint is cited to the presence of fine grains of base metal adjacent to the interface and the dispersion of ultrafine hard IMC reaction products inside the soft matrix of Mg.
- TEM analysis declared that the Al-containing reaction product that is found in the interface centerline is a composition of type MgCuxAly, which is a Friauf–Laves phase.
Author Contributions
Funding
Conflicts of Interest
References
- Avedesian, M.M.; Baker, H. ASM Specialty Handbook: Magnesium and Magnesium Alloys; ASM International: Novelty, OH, USA, 1999; ISBN 978-0-87170-657-7. [Google Scholar]
- Ropp, R.C. Encyclopedia of the Alkaline Earth Compounds; Elsevier: Oxford, UK, 2013; ISBN 978-0-444-59550-8. [Google Scholar]
- Harooni, M.; Kovacevic, R. Laser Welding of Magnesium Alloys: Issues and Remedies. In Magnesium Alloys; Aliofkhazraei, M., Ed.; IntechOpen: London, UK, 2017; Available online: https://www.intechopen.com/books/magnesium-alloys (accessed on 1 April 2019).[Green Version]
- Czerwinski, F. Welding and Joining of Magnesium Alloys. In Magnesium Alloys—Design, Processing and Properties; InTech: Rijeka, Croatia, 2011; pp. 469–490. ISBN 978-953-307-520-4. [Google Scholar]
- Haddadi, F. Ultrasonic Spot Welding. In Advanced Manufacturing Technologies Modern Machining, Advanced Joining, Sustainable Manufacturing; Gupta, K., Ed.; Springer International Publishing AG: Cham, Switzerland, 2017; pp. 185–209. ISBN 978-3-319-56098-4. [Google Scholar]
- Wang, T.; Shukla, S.; Gwalani, B.; Komarasamya, M.; Reza-Nieto, L.; Mishraa, R.S. Effect of reactive alloy elements on friction stir welded butt joints of metallurgically immiscible magnesium alloys and steel. J. Manuf. Process. 2019, 39, 138–145. [Google Scholar] [CrossRef]
- Edison, K.G. Ultrasonic metal welding. In New Developments in Advanced Welding; Ahmed, N., Ed.; Woodhead Publishing Ltd.: Cambridge, UK, 2005; pp. 241–269. ISBN 978-1-85573-970-3. [Google Scholar]
- Devine, J. Ultrasonic Welding. In ASM Metals Handbook; Lienert, T.J., Babu, S.S., Siewert, T.A., Acoff, V.L., Eds.; ASM International: Materials Park, OH, USA, 2011; Volume 6A, pp. 725–730. ISBN 978-1-61503-133-7. [Google Scholar]
- Bakavos, D.; Prangnell, P.B. Mechanisms of joint and microstructure formation in high power ultrasonic spot welding 6111 aluminum automotive sheet. Mater. Sci. Eng. A 2010, 527, 6320–6334. [Google Scholar] [CrossRef]
- Fujii, H.T.; Goto, Y.; Sato, Y.S.; Kokawa, H. Microstructural evolution in dissimilar joint of Al alloy and Cu during ultrasonic welding. Mater. Sci. Forum 2014, 783–786, 2747–2752. [Google Scholar] [CrossRef]
- Sanga, B.; Wattal, R.; Nagesh, D.S. Mechanism of joint formation and characteristics of interface in ultrasonic welding: Literature review. Period. Eng. Nat. Sci. (PEN) 2018, 6, 107–119. [Google Scholar] [CrossRef]
- Jahn, R.; Cooper, R.; Wilkosz, D. The effect of anvil geometry and welding energy on microstructures in ultrasonic spot welds of AA6111-T4. Metall. Mater. Trans. A 2007, 38, 570–583. [Google Scholar] [CrossRef]
- Nonaka, K.; Sakazawa, T.; Nakajima, H. Reaction diffusion in Mg-Cu system. Mater. Trans. JIM 1995, 36, 1463–1466. [Google Scholar] [CrossRef]
- Dai, J.; Jiang, B.; Zhang, J.; Yang, Q.; Jiang, Z.; Dong, H.; Pan, F. Jiang binary system. J. Phase Equilib. Diffus. 2015, 36, 613–619. [Google Scholar] [CrossRef]
- Macwan, A.; Chen, D.L. Microstructure and mechanical properties of ultrasonic spot-welded copper to magnesium alloy joints. Mater. Des. 2015, 84, 261–269. [Google Scholar] [CrossRef]
- Elthalabawy, W.M.; Khan, T.I. Eutectic bonding of austenitic stainless steel 316L to magnesium alloy AZ31 using copper interlayer. Int. J. Adv. Manuf. Technol. 2011, 55, 235–241. [Google Scholar] [CrossRef]
- Elthalabawy, W.; Khan, T.I. Liquid phase bonding of 316L stainless steel to AZ31 magnesium alloy. J. Mater. Sci. Technol. 2011, 27, 22–28. [Google Scholar] [CrossRef]
- Panteli, A.; Robson, J.D.; Chen, Y.C.; Prangnell, P.B. The effectiveness of surface coatings on preventing interfacial reaction during ultrasonic welding of aluminum to magnesium. Metall. Mater. Trans. A 2013, 44, 5773–5781. [Google Scholar] [CrossRef]
- Panteli, A.; Robson, J.D.; Brough, I.; Prangnell, P.B. The effect of high strain rate deformation on intermetallic reaction during ultrasonic welding aluminium to magnesium. Mater. Sci. Eng. A 2012, 556, 31–42. [Google Scholar] [CrossRef]
- Panteli, A.; Chen, Y.C.; Strong, D.; Zhang, X.; Prangnell, P.B. Optimization of aluminium to magnesium ultrasonic spot welding. JOM 2012, 64, 414–420. [Google Scholar] [CrossRef]
- Patel, V.K.; Bhole, S.D.; Chen, D.L. Improving weld strength of magnesium to aluminium dissimilar joints via tin interlayer during ultrasonic spot welding. Sci. Technol. Weld. Join. 2012, 17, 342–347. [Google Scholar] [CrossRef]
- Patel, V.K.; Bhole, S.D.; Chen, D.L. Ultrasonic spot welding of lightweight alloys. In Proceedings of the 13th International Conference on Fracture, Beijing, China, 16–21 June 2013. [Google Scholar]
- Liu, J.; Cao, B.; Yang, J. Effects of vibration amplitude on microstructure evolution and mechanical strength of ultrasonic spot welded Cu/Al joints. Metals 2017, 7, 471. [Google Scholar] [CrossRef]
- Mezbahul-Islam, M.; Mostafa, A.M.; Medraj, M. Essential magnesium alloys binary phase diagrams and their thermochemical data. J. Mater. 2014, 2014, 704283. [Google Scholar] [CrossRef]
- Peng, H.; Chen, D.L.; Bai, X.F.; She, X.W.; Li, D.Y.; Jiang, X.Q. Ultrasonic spot welding of magnesium to aluminum alloys with a copper, interlayer: Microstructural evolution and tensile properties. J. Manuf. Process. 2019, 37, 91–100. [Google Scholar] [CrossRef]
- Macwan, A. Ultrasonic Spot Welding of Similar and Dissimilar Alloys for Automotive Applications. Ph.D. Thesis, Ryerson University, Toronto, ON, Canada, 2016. [Google Scholar]
- Peng, H.; Chen, D. Microstructure and mechanical properties of an ultrasonic spot welded aluminum alloy: The effect of welding energy. Materials 2017, 10, 449. [Google Scholar] [CrossRef] [PubMed]
- Brandes, E.A.; Brook, G.B. Smithells Light Metals Handbook; Butterworth-Heinemann: Oxford, UK, 1998; ISBN 978-0-7506-3625-4. [Google Scholar]
- Haddadi, F.; Tsivoulas, D. Grain structure, texture and mechanical property evolution of automotive aluminum sheet during high power ultrasonic welding. Mater. Charact. 2016, 118, 340–351. [Google Scholar] [CrossRef]
- Haddadi, F.; Fadi, A. The effect of interface reaction on vibration evolution and performance of aluminum to steel high power ultrasonic spot joints. Mater. Des. 2016, 89, 50–57. [Google Scholar] [CrossRef]
- Derks, P.L.L.M. Parameters that influence the ultrasonic bond quality. Electron. Compon. Sci. Technol. 1983, 10, 269–275. [Google Scholar] [CrossRef]
- Al-Samman, T.; Gottstein, G. Dynamic recrystallization during high temperature deformation of magnesium. Mater. Sci. Eng. A 2008, 490, 411–420. [Google Scholar] [CrossRef]
- Itakura, M.; Kaburaki, H.; Yamaguchi, M.; Tsuru, T. Novel cross-slip mechanism of pyramidal screw dislocations in magnesium. Phys. Rev. Lett. 2016, 116, 225501. [Google Scholar] [CrossRef]
- Patel, V.K.; Bhole, S.D.; Chen, D.L. Influence of ultrasonic spot welding on microstructure in a magnesium alloy. Scr. Mater. 2011, 65, 911–914. [Google Scholar] [CrossRef]
- Xiea, J.; Zhua, Y.; Bianc, F.; Liud, C. Dynamic recovery and recrystallization mechanisms during ultrasonic spot welding of Al-Cu-Mg alloy. Mater. Charact. 2017, 132, 145–155. [Google Scholar] [CrossRef]
- Shimizu, S.; Fujii, H.T.; Sato, Y.S.; Kokawa, H.; Sriraman, M.R.; Babu, S.S. Mechanism of weld formation during very-high-power ultrasonic additive manufacturing of Al alloy 6061. Acta Mater. 2014, 74, 234–243. [Google Scholar] [CrossRef]
- Fujii, H.T.; Sriraman, M.R.; Babu, S.S. Quantitative evaluation of bulk and Interface microstructures in Al-3003 alloy builds made by very high power ultrasonic additive manufacturing. Metall. Mater. Trans. A 2011, 42, 4045–4055. [Google Scholar] [CrossRef]
- Gunduz, I.E.; Ando, T.; Shattuck, E.; Wong, P.Y.; Doumanidis, C.C. Enhanced diffusion and phase transformations during ultrasonic welding of zinc and aluminum. Scr. Mater. 2005, 52, 939–943. [Google Scholar] [CrossRef]
- Buhler, T.; Fries, S.G.; Spencer, P.J.; Lukas, H.L. A Thermodynamic assessment of the Al-Cu-Mg ternary system. J. Phase Equilib. 1998, 19, 317–333. [Google Scholar] [CrossRef]
- Mel’nik, E.V.; Kinzhibalo, V.V. Investigation of the Mg-Al-Cu and Mg-Ga-Cu systems from 33.3 to 100 at. % Mg. Russ. Metall. 1981, 3, 154–158. [Google Scholar]


© 2019 by the authors. Licensee MDPI, Basel, Switzerland. This article is an open access article distributed under the terms and conditions of the Creative Commons Attribution (CC BY) license (http://creativecommons.org/licenses/by/4.0/).
Share and Cite
Badamian, A.; Iwamoto, C.; Sato, S.; Tashiro, S. Interface Characterization of Ultrasonic Spot-Welded Mg Alloy Interlayered with Cu Coating. Metals 2019, 9, 532. https://doi.org/10.3390/met9050532
Badamian A, Iwamoto C, Sato S, Tashiro S. Interface Characterization of Ultrasonic Spot-Welded Mg Alloy Interlayered with Cu Coating. Metals. 2019; 9(5):532. https://doi.org/10.3390/met9050532
Chicago/Turabian StyleBadamian, Amir, Chihiro Iwamoto, Shigeo Sato, and Suguru Tashiro. 2019. "Interface Characterization of Ultrasonic Spot-Welded Mg Alloy Interlayered with Cu Coating" Metals 9, no. 5: 532. https://doi.org/10.3390/met9050532