Article

Characterization of Texture Evolution during Recrystallization by Laser-Induced Transient Thermal Grating Method

1
Laboratory of Modern Acoustics, Ministry of Education, and Institute of Acoustics, Nanjing University, Nanjing 210093, China
2
Faculty of Mechanical Engineering & Mechanics, Ningbo University, Ningbo 315211, China
3
Laboratory Acoustics, Soft Matter and Biophysics, Department of Physics and Astronomy, KU Leuven, Celestijnenlaan 200D, B3001 Heverlee, Belgium
4
National Laboratory of Solid State Microstructures, Nanjing University, Nanjing 210093, China
*
Authors to whom correspondence should be addressed.
Metals 2019, 9(3), 288; https://doi.org/10.3390/met9030288
Submission received: 11 January 2019 / Revised: 24 February 2019 / Accepted: 27 February 2019 / Published: 4 March 2019
(This article belongs to the Special Issue FaSTeP: Faultless Steel Production and Manufacturing)

Abstract

:
The analyses of texture evolution of cold rolled interstitial free (IF) steel sheets during annealing and recrystallization are presented, in which the dispersion curves of surface acoustic waves (SAW) excited by laser-induced transient thermal grating method are measured. The results show that the angular anisotropy of the SAW velocity changes due to the texture changes at different stages of recrystallization. The theoretically simulated angular dispersion of SAW velocity within individual crystal revealed that the change of SAW velocity is closely related to recrystallization texture evolution. A model for the angular dependence of the SAW velocity in textured polycrystalline IF steel with different oriented crystals is presented and the simulations are yielded, which show that the results agree with those of experiments.

1. Introduction

The annealing and recrystallization of materials produce new microstructures under heating conditions, and have important influences on the properties of materials [1,2,3,4], such as deformation behavior [1,2] and magnetic susceptibility [5]. The study of the texture evolution during recrystallization processes has attracted great attention [6,7,8,9]. Therefore, control of texture in metal materials is of major industrial importance [6]. Conventionally, the textures were measured by X-Ray diffractometer (XRD) or electron backscattered diffraction (EBSD) [10]. These methods have stringent requirements on sample preparation and testing environments, even causing destruction, though they provide accurate measurements of textures [10].
Evidently, a microstructural characterization technique that allows for continuous and nondestructive measurements during the materials’ processing would be advantageous [6,11]. One promising method is laser-ultrasonics (LUS) [6,12]. Since LUS can be employed and controlled at high temperature environments from far away, it is possible to practice the measurements in real time during the recrystallizing processes [6,12].
On the other hand, laser-ultrasonic techniques have been used to detect of textures of different metals or rolling alloys. Lesne [13] used Q-swiched laser excitation source and heterodyne interferometer receiver detect the texture of rolled steel plates; it was found that the velocity of the surface acoustic waves (SAW) wave varies with the direction of the rolling direction. Maznev [14] and Li [15] studied the angular dependence of the SAW velocity in single crystals of silicon and nickel, respectively. Lévesque [16] and Yin [17] determined the crystallographic texture in steel plates using laser-generated surface waves.
Generally, {100}, {110} and {111} textures have a very direct influence on the mechanical properties of deep-drawing materials [1,10]. Similarly, the deep-drawing property and plastic strain ratio are closely related to the fourth-order texture coefficients. The presence of {111} texture will make the negative value of C 4 11 larger and beneficial to the deep-drawing property. For example, large and negative C 4 12 cause transverse earring, while large and positive C 4 13 cause rolling and transverse earring effect [1,10]. However, few researchers have analyzed the influence of each texture component on the SAW dispersion during recrystallization; in addition, there is also a lack of online texture detection theoretical model based on laser ultrasound.
In this work, one of the pulsed laser ultrasonic techniques, i.e., the transient thermal grating technique [17,18,19], has been known as Impulsive Stimulated Scattering (ISS), which is used to study texture evolution during recrystallization processing of cold rolled interstitial free (IF) steel sheets. The anisotropies of angular dispersions of SAW velocities were obtained and the effect of the {100}, {110} and {111} textures of polycrystalline materials were analyzed. Meanwhile, based on the numerical simulation of angular dispersion of SAW velocity in different orientated single crystals, the angular dispersions of SAW velocity in textured polycrystalline metals and the influence of different texture components on the angular dependence of the SAW velocity were analyzed. The results show that both the experiments and simulations are in agreement.

2. Experiment

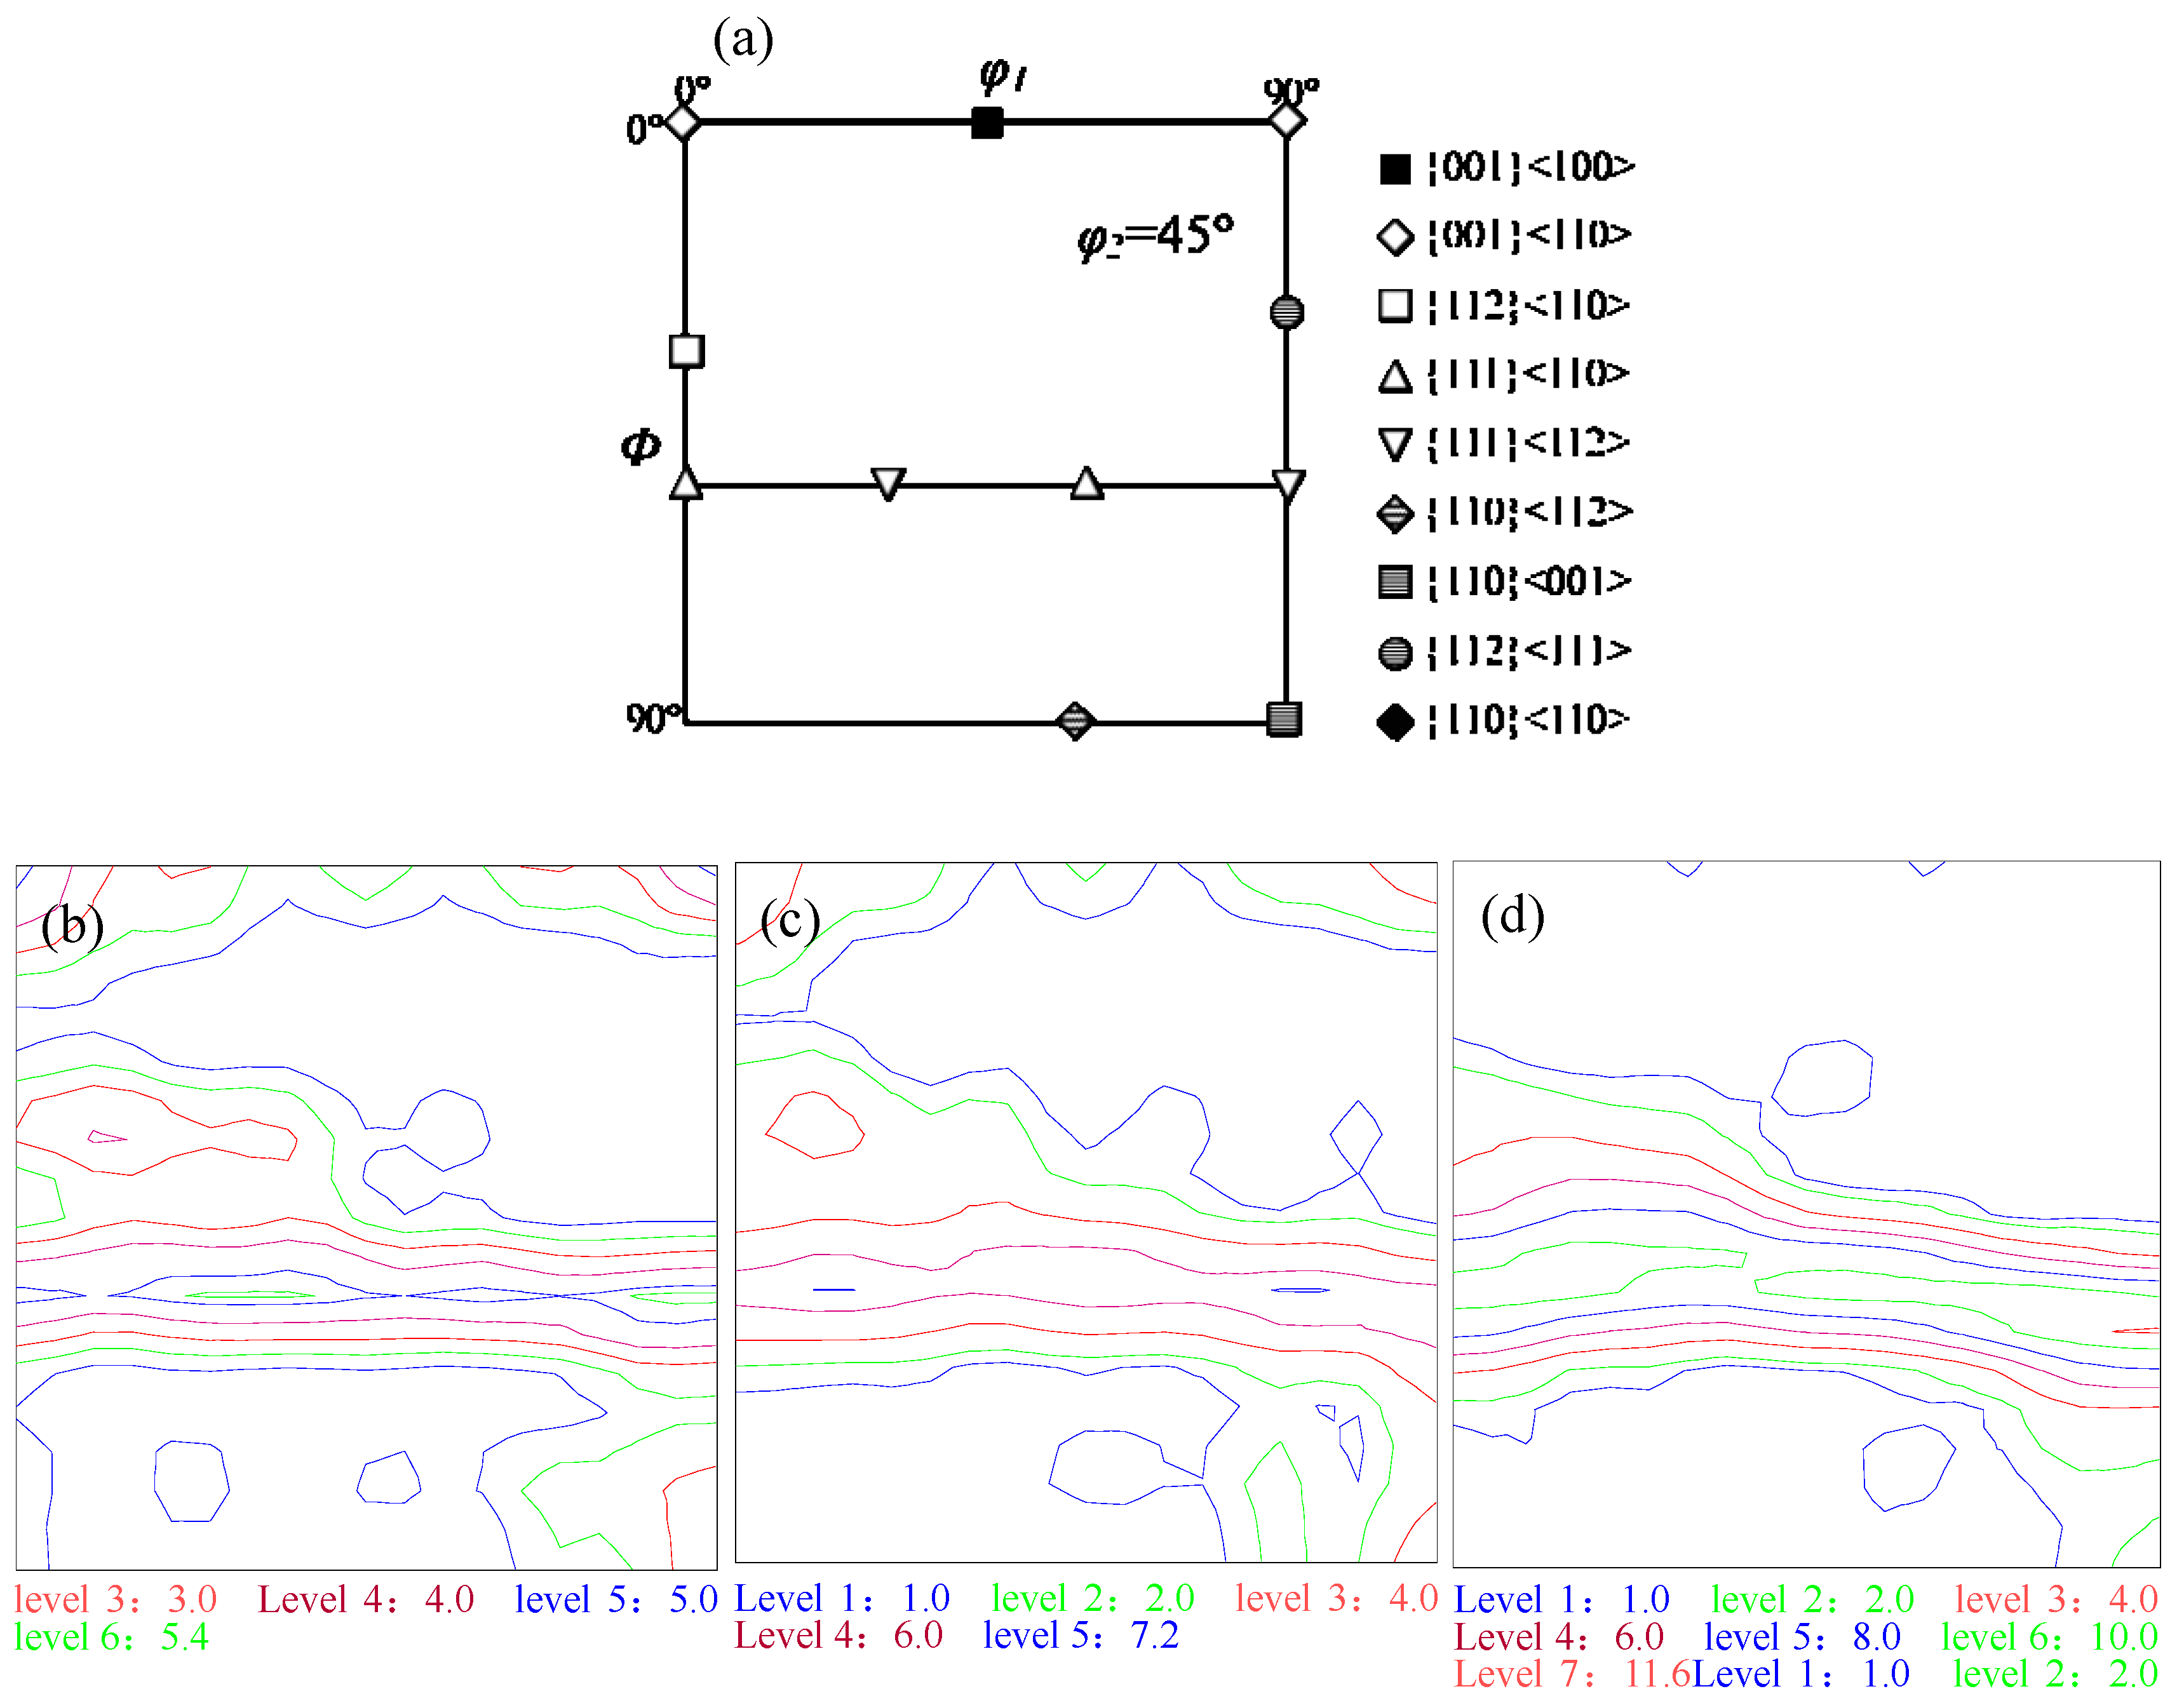
2.1. Experimental Material and Texture Analysis

The material selected for this study is cold-rolled 0.65 mm Ti-IF steel that contains >99.7% iron. Its chemical composition is shown in Table 1. This type of steel was chosen because it was representative for many deep drawing steels that are of practical interest, and also because its microstructure was fully ferrite after cooling to room temperature.
The total reduction rate of cold rolling is 78.3%. The cold rolled plates are annealed in a furnace, according to the following sequence: room temperature charging, heating to a holding temperature of 710 °C with a rate of 60 °C/h, then taking out one sample after different holding times and quenching it in water as shown in Figure 1a. Next, the sample plates were cut to 20 mm × 25 mm size for texture analysis. All the samples were measured using a Bruker D8 series X-Ray diffractometer (XRD); the volume fractions of {100}, {110} and {111} textures were calculated [10] and are shown in Figure 1b.
Figure 1b shows the evolution of the {100}, {110} and {111} texture volume fraction during annealing processing of the IF steel plates. The volume fraction of the {100} and {111} texture components did not change very much during the recovery process, as the holding time was less than 10.5 hours. However, during the recrystallization process (between 10.5–11.5 h), the {100} component started to decrease rapidly (from 7.51% to 2.58%) and the {111} component started to increase rapidly (from 12.41% to 19.56%). After that, the volume fractions of the {100} and {111} texture components varied slightly in the grain growth stage. However, the volume fraction of {110} remained nearly unchanged in the whole process of the annealing. To simplify the description, three samples (sample 6, 7, 8), which can represent three typical stages of the recrystallization process, were selected and analyzed.

2.2. Laser Ultrasonic Detection Method

An ISS setup [17,18,19] was used, shown in Figure 2. SAWs are excited by an impulsively stimulated thermal grating, which are generated by optical absorption of two crossing pulsed laser beams (pulse width: 10 ps, wavelength: 1064 nm, repetition rate: 1 kHz, energy: 30 µJ/ pulse) on the surface of sample. The spacing of the thermal grating, which imposed the SAW wavelength λ, could be modified by the parameters of optical grating and the telescope system in the optical path. Following the same optical path as the pumping laser, a probing laser beam (cw, 532 nm wavelength, 100 mW power) was also diffracted by the optical grating and then focused by the telescope system onto the sample. The probing beam was diffracted again by the thermally and acoustically induced surface ripples, so that SAW induced amplitude and phase changes of the weak diffracted probe beams were amplified by heterodyning with the strong transmitted beams. Both the probing laser beam incident on the sample and the reflective diffraction beam travelled through a quarter wave plate, so that the polarization of the reflected beams was perpendicular to the one of the incident beams, and the reflected beams were directed off the path of the incident beam by a polarizing beam splitter. Mirrors were used to guide the two pairs of mixed diffracted/transmitted probe beams to a pair of photodiodes, whose differential signal was coupled to a wide band preamplifier and then displayed on an oscilloscope. The detected intensity difference between the reflected probing beams was proportional to the normal displacement at the sample surface. Based on the differential signal recorded by an oscilloscope, the main signal frequency component f0 can be determined from its Fourier transform (right upper of Figure 2). Together with the wavelength λ and the value of f0, the propagation velocity c = λf0 of the related surface acoustic wave could be determined.

2.3. Experimental Results

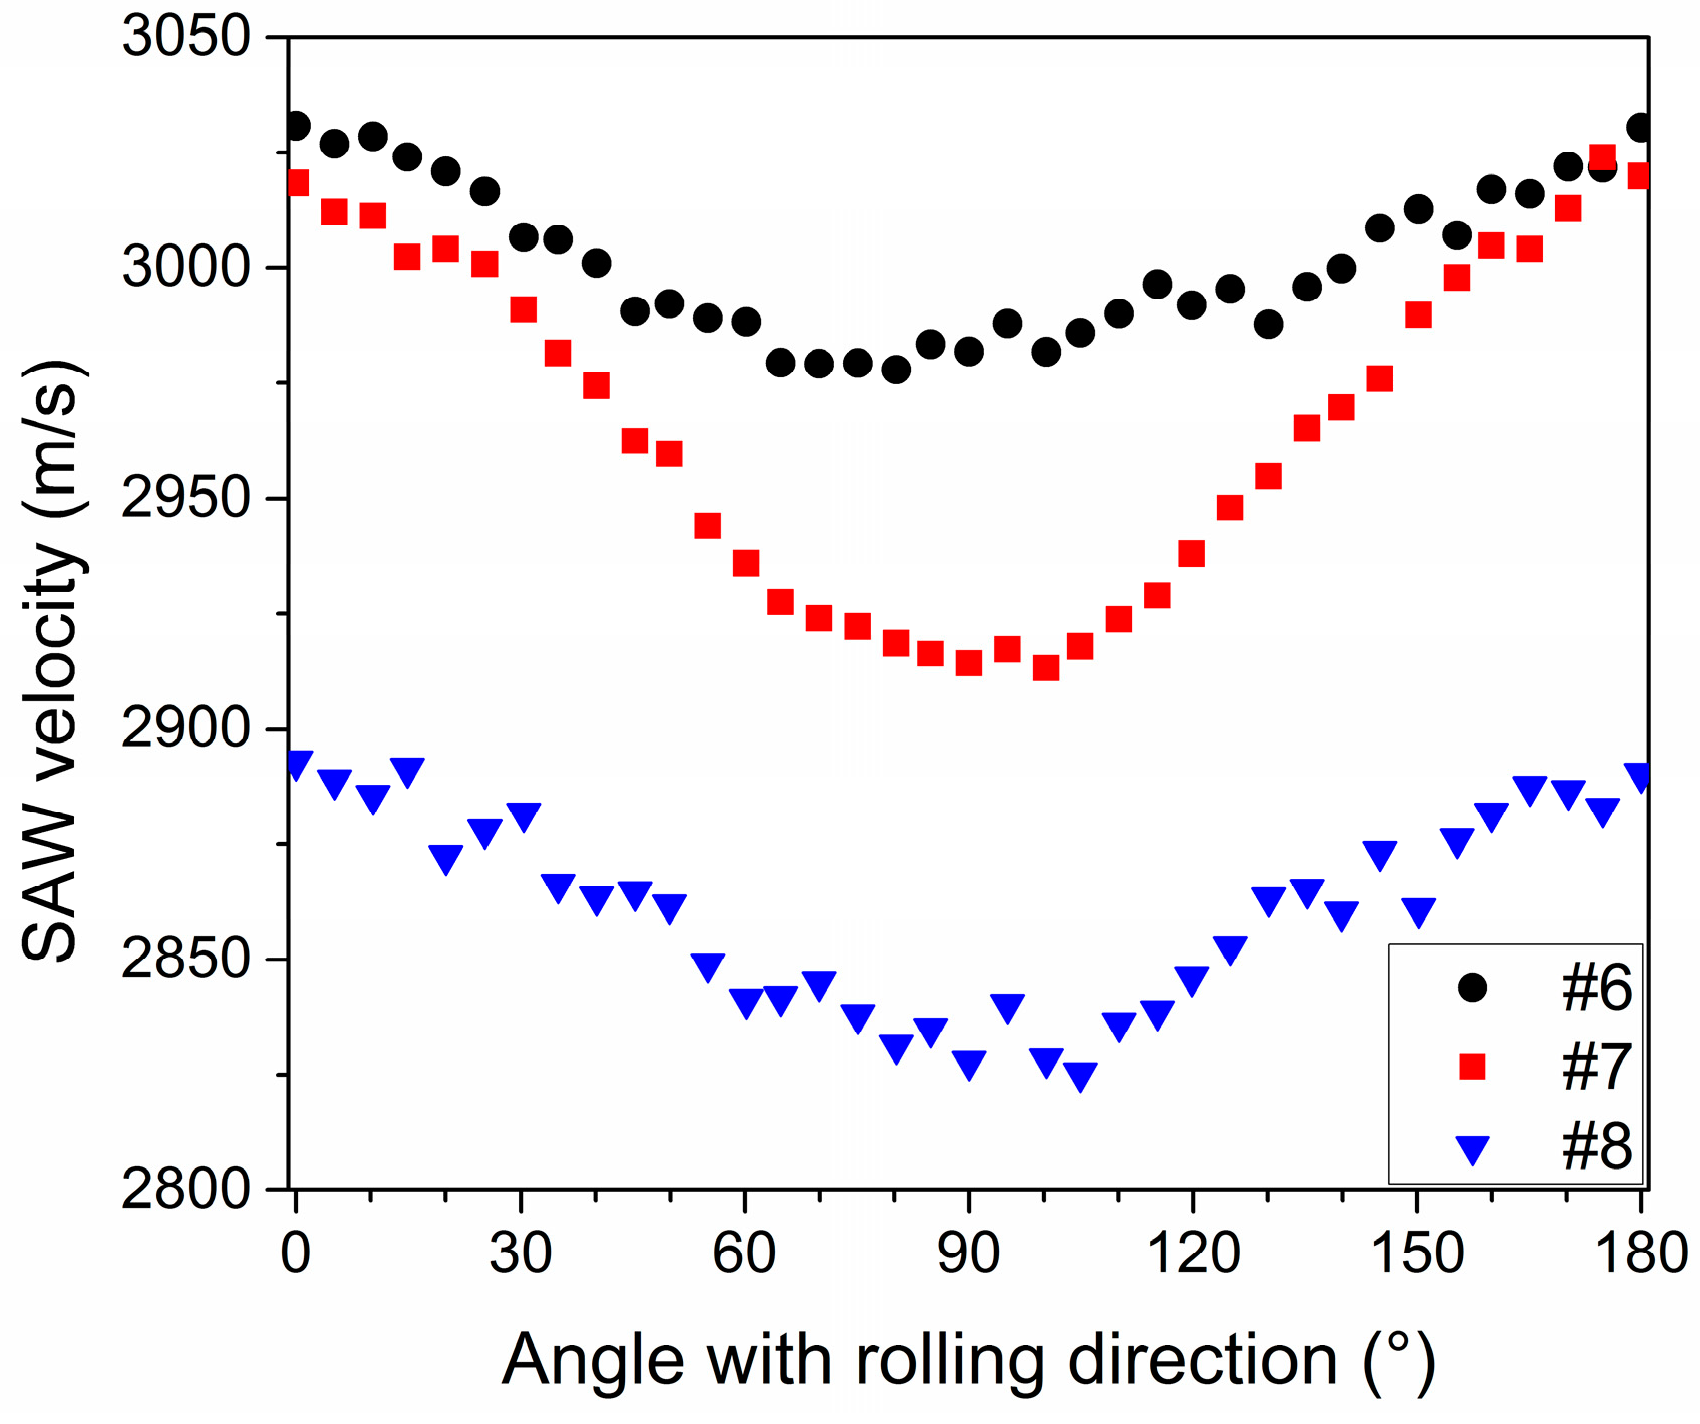
2.3.1. Angular Dependence of the SAW Velocity

Figure 3 depicts the measured angular dependence of the SAW velocity for SAW propagation angles between 0° to 180° (step of 5°) with respect to the rolling direction, for IF steel in three different stages of recrystallization samples 6, 7 and 8, respectively.
For sample 6, which was in the nucleation stage (start of recrystallization), the SAW velocity varies between 2978 m/s and 3031 m/s (difference of 53 m/s), the highest SAW velocity was in the rolling direction and the lowest SAW velocity was in the 85–90°. The SAW velocity of sample 7 ranges from 2913 m/s to 3024 m/s (difference of 111m/s). Compared to sample 6, the SAW velocity of sample 7 was lower, mainly in 90° with respect to the rolling direction. Compared to samples 6 and 7, the SAW velocity in sample 8 was much lower in all directions, which was between 2825 m/s and 2893 m/s. The difference between the minimum and maximum, 68 m/s, is slightly larger than the one of sample 6 and substantially smaller than that of sample 7.
Typically, the SAW velocities curves shown in Figure 3 are expected to be symmetric around 90° [13,16,17]. However, in experiments, there are several factors that may cause errors, such as: (1) the measured samples were cut to small pieces from rolled coils. The cut orientation may not be precise. (2) The samples were fixed on the rotating stage with some errors. (3) The microstructure and the residual stress may cause non-perfect SAW angular dependence curves.

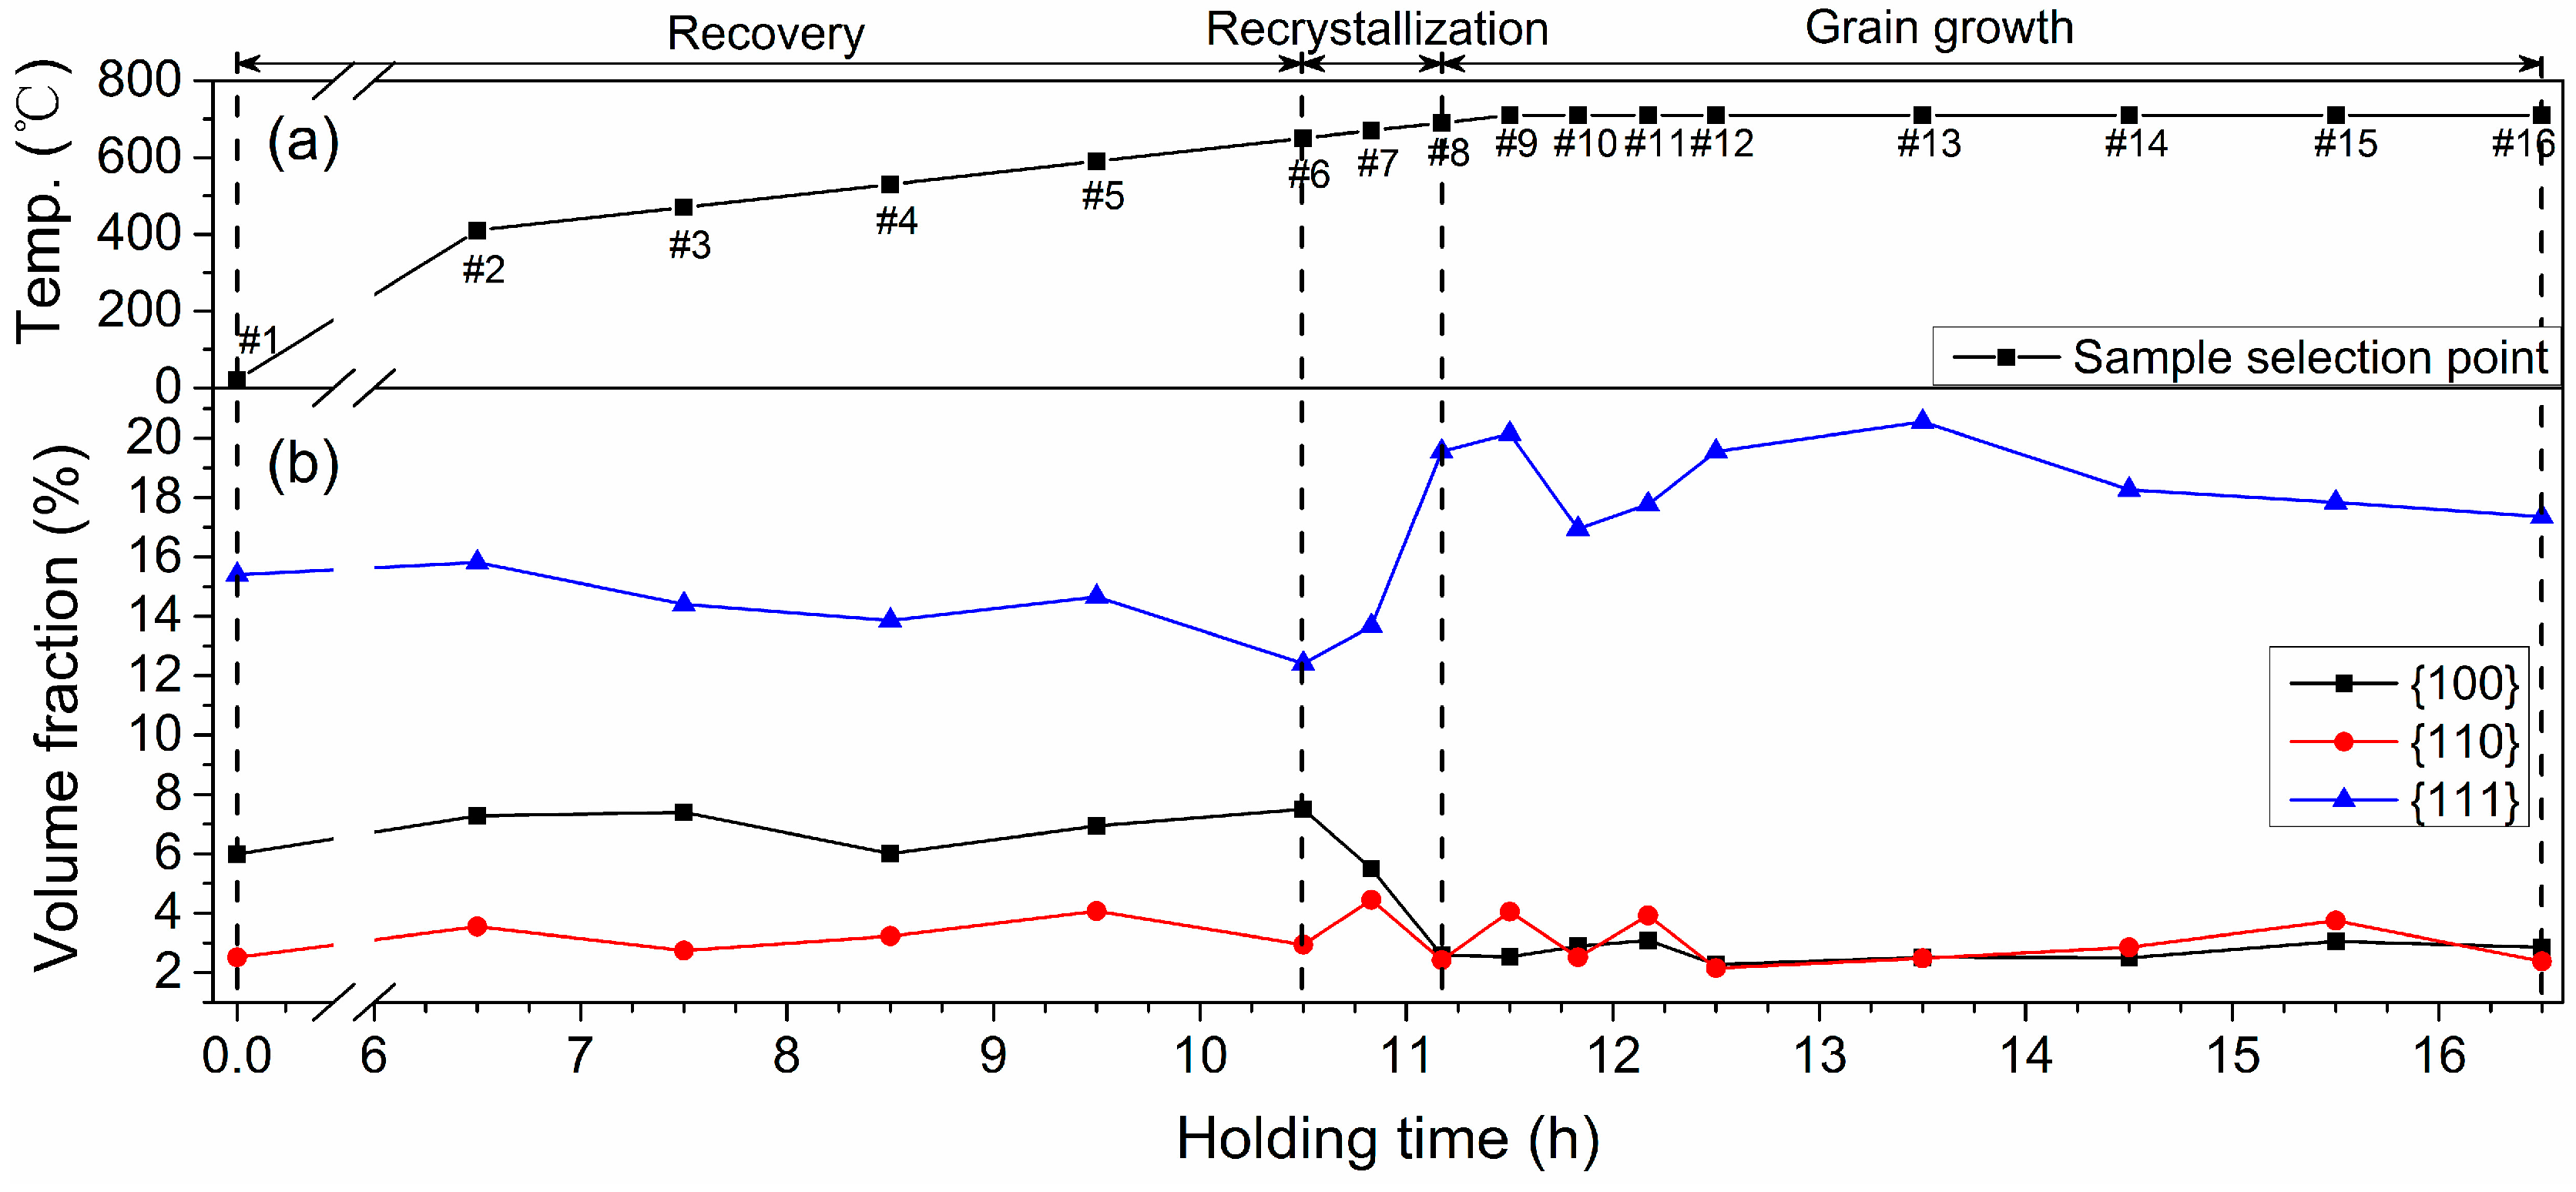
2.3.2. Texture Evolution during Recrystallization

As is well-known, low carbon steels have a weak or near random texture in the hot band state, strong {100} texture and weaker {111} texture in the cold rolled state, but strong {111} texture in the recrystallized state [2]. With the change of texture type and orientation density, the fourth order texture coefficients also changes [20].
Figure 4 shows the density f(g) of Orientation Distribution Function (ODF). Figure 4a is the most important orientations in bcc materials in the φ2 = 45° section [10]. The measured ODF by XRD in the beginning, during and at the end of recrystallization are displayed as contour lines and shown in Figure 4b–d, respectively.
As can be seen from Figure 4, there is a strong {100} texture (in the top of Figure 4a) at the start of recrystallization. With the development of recrystallization processing, the density of the {100} and {111} textures decreased and increased, respectively. The volume fraction of the {100}, {110} and {111} textures and the fourth order texture coefficients at three different stages of recrystallization (samples 6, 7 and 8) are also calculated and shown in Table 2.
The volume fraction of the {111} and {100} textures increased and decreased with increasing holding temperature, respectively. Before the start of recrystallization (in recovery stage), the volume fractions of {111} texture and {100} texture were 12.41% and 7.51%, respectively. In the recrystallization nucleation and growth stage, the volume fraction of {111} texture increased to 13.67% and the volume fraction of {100} texture decreased to 5.50%. After recrystallization, the volume fraction of {111} texture increased to 19.56%, and the volume fraction of {100} texture decreased to 2.58%.

2.4. Analysis of Angular Dependence of the SAW Velocity during Recrystallization

It is well known that the texture of metallic polycrystalline materials affects the anisotropy of ultrasonic surface wave velocity [9]. As can be seen from Figure 3 in Section 2.3.1 and Table 2 in Section 2.3.2, for sample 6, which is in the nucleation stage (start of recrystallization) with the highest SAW velocity among the three samples, its main textures are {100} (7.51%) and {111} (12.41%). In sample 7, which is in the growth stage of recrystallization, the SAW velocity was lower than that of sample 6, mainly in the 90° rolling direction; the volume fraction of the {100} texture decreased to 5.50%, while the volume fraction of the {111} texture increases to 13.67%. There was also a slight increase of the volume fraction for {110} texture (from 2.94% to 4.45%). After completion of recrystallization, for sample 8, the recrystallization texture was dominated by {111} texture (volume fraction up to 19.56%); the volume fraction of {100} texture declined to 2.58%. The volume fraction of {110} texture did not change much (2.42%). Compared to samples 6 and 7, the SAW velocity in sample 8 was lower in all directions.
The maximum SAW velocity, minimum SAW velocity, mean SAW velocity and the standard deviation of SAW velocity, as well as the volume fraction of main texture and fourth order texture coefficients are shown in Figure 5.
As can be seen from Figure 5, in the recrystallization process, the negative value of C 4 11 showed a significant increase trend (see Figure 5b), which was mainly caused by the increase of {111} texture volume fraction (see Figure 5a), because the change of {111} texture only affected the value of C 4 11 [20]. At the same time, the maximum, minimum and average velocities of SAW showed a downward trend (see Figure 5c), which was the same as the volume fraction change trend of {100} texture and opposite to that of {111} texture (see Figure 5a). This may indicate that the decrease of the SAW velocity in IF steel during recrystallization was due to the increasing volume fraction of {111} texture and the decreasing fraction of {100} texture. The standard deviation of SAW velocity (see Figure 5d) increased first and then decreased, which is the same trend as the volume fraction of {110} texture; this may indicate that the standard deviation of SAW velocity is directly related to the volume fraction of {110} texture.
Thus, the experimental results show that the texture of metallic polycrystalline materials can be probed by determining the anisotropy of the ultrasonic surface wave velocity.

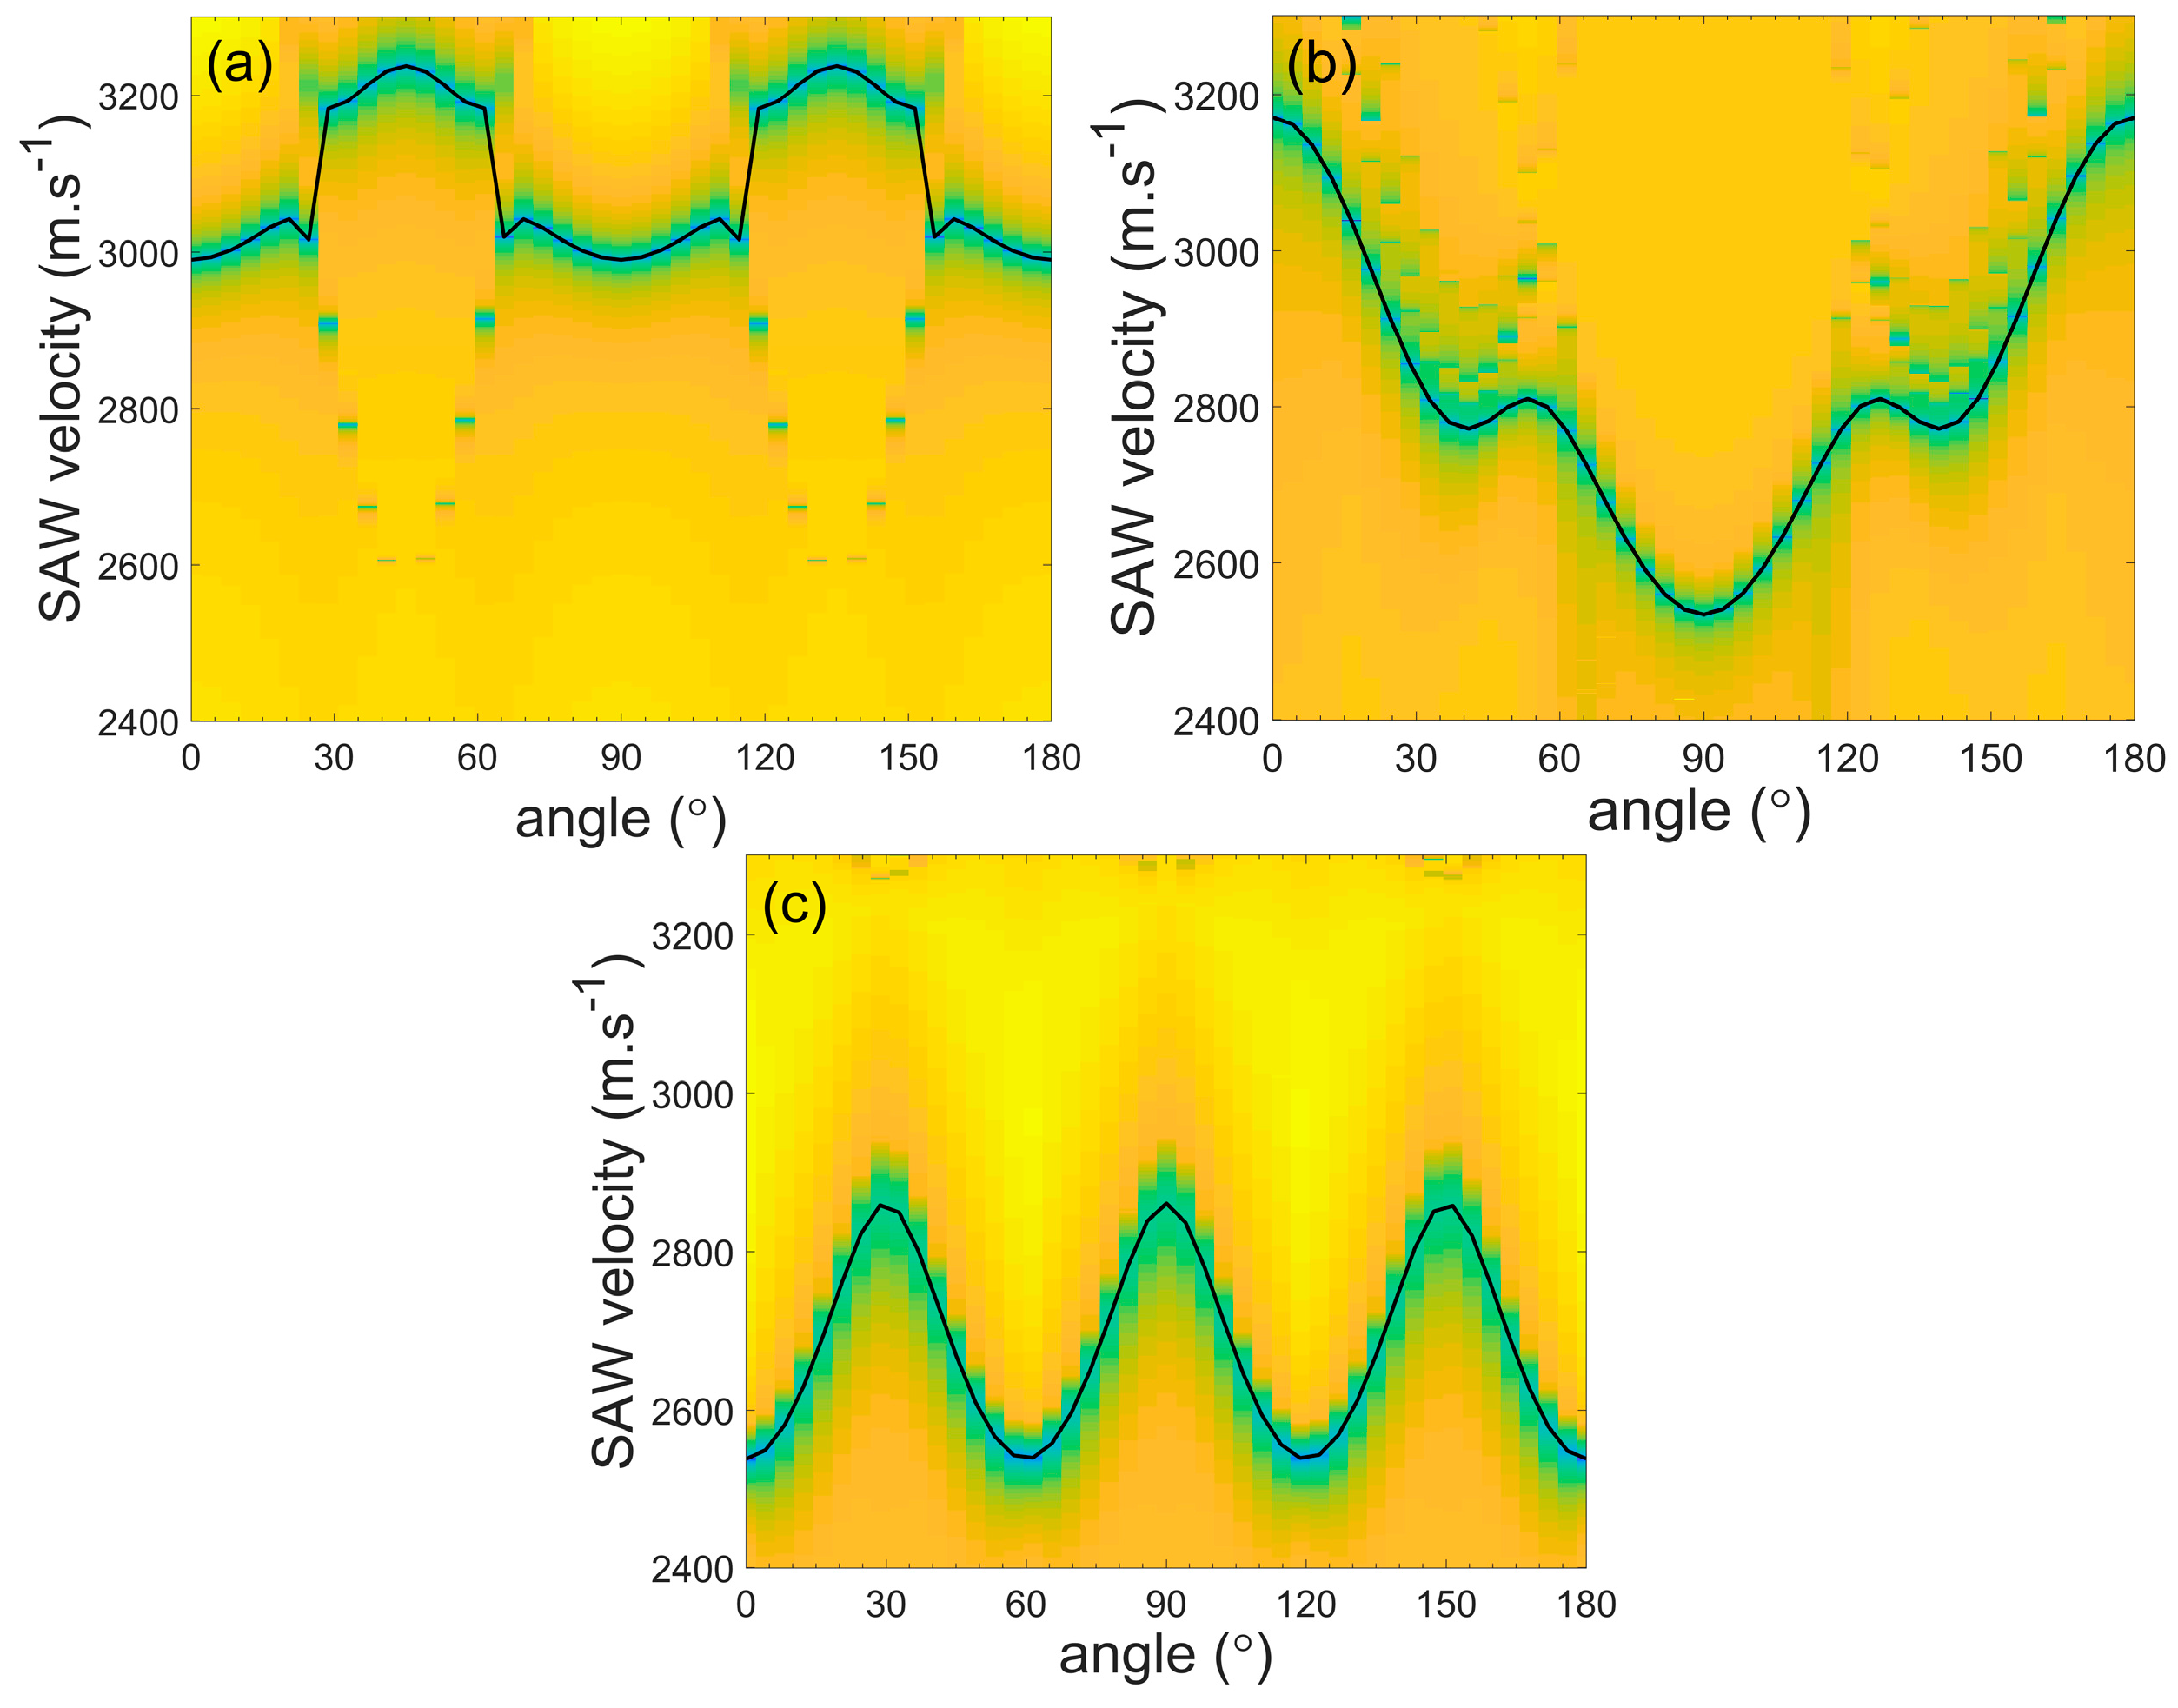
3. Numerical Simulation

3.1. Angular Dispersion of SAW Velocity in Single Crystal

The anisotropy of polycrystalline materials is a manifestation of the anisotropy of single crystal in the state of texture. In order to get more insight in the effect of recrystallization on the angular dependence of the macroscopic SAW velocity, we have also studied the SAW velocity angular dispersion within individual crystal with different orientations. The theoretically simulated [21,22] angular dependences of the SAW velocity (111), (110) and (100) orientated single crystals are shown in Figure 6. In theory, all information is available to calculate the determinant of the boundary condition matrix R. This value is retained for all velocities and angles. The colors blue and yellow represent increasing values of |ΔR|. Since in numerical calculations demand that ΔR = 0 can never be fulfilled exactly, the SAW velocities (Black solid lines) are sought that minimize |ΔR|.
The crystal orientation has a pronounced effect on the SAW velocity and its angular dispersion. The SAW velocity in (100) was the highest (from 2806 m/s to 3146 m/s) and it had the smallest angular contrast (340 m/s). Furthermore, (111) had the lowest SAW velocity (from 2307 m/s to 2710 m/s) and a slightly higher angular contrast (403 m/s). The SAW velocity of (110) lied between both values above (from 2308 m/s to 3057 m/s); however, the difference between the maximum velocity and the minimum velocity is the largest (750 m/s).
In the texture state, the anisotropy of polycrystalline materials is induced by the preferred orientation of single crystal. The theoretically simulated angular dependences of the SAW velocity for (111), (110) and (100) orientated single crystals were consistent with the experimental results in Figure 5. These differences also confirmed that the decrease of the SAW velocity in IF steel during recrystallization was due to the increasing volume fraction of {111} texture and the decreasing fraction of {100} texture. A large volume fraction of {110} texture led to a large standard deviation of SAW velocity of sample 7.

3.2. Angular Dispersion of Velocity in Textured Polycrystalline Metals

The elastic anisotropy of polycrystalline metals can be interpreted as a texture which is dependent statistical average over the values of the anisotropic constituting single crystal grains. The theoretical relationship between the fourth order texture coefficient C 4 1 ν and Young’s modulus E was described by Bunge [23]. It was stated that Young’s modulus E measured in a certain direction with respect to the rolling direction (described by the angle θ) can be written as:
E ( θ ) = E r + E 1 C 4 11 + E 2 C 4 12 cos 2 θ + E 3 C 4 13 cos 4 θ
whereby Er is the average mean value of Young’s modulus, and E1, E2 and E3 are constants corresponding to three single crystal elastic constants. From Equation (1), we started to derive a model for the angular dependence of the SAW velocity, which can then serve as parameters to fit the laser ultrasonic experimental data.
In polycrystalline materials, Young’s modulus E, the shear modulus G and Poisson’s ratio σ can be expressed in terms of the density ρ and of the velocities VL and VT of the longitudinal and shear waves, respectively, as follows [20]:
E = ρ V T 2 3 V L 2 4 V T 2 V L 2 V T 2
G = ρ V T 2
σ = ( V L V T ) 2 2 2 [ ( V L V T ) 2 1 ]
Since the velocities of the longitudinal and transverse waves were measured, the elastic moduli can be determined. In the case of surface acoustic wave measurements, one has access only to the SAW velocity, for which Viktorov [20] proposed an approximate relation with the moduli:
V R = G ρ ( 0.87 + 1.12 σ ) 1 + σ
Combining Equation (5) with Equation (3), the ratio between the SAW and shear velocities can be expressed in terms of Poisson’s ratio:
V R V T = 0.87 + 1.12 σ 1 + σ
The Poisson’s ratio of the experimental materials used in this paper was between 0.24 and 0.28 [24], then the ratio of the SAW and shear velocities is between 0.9184 and 0.9247. Thus, the ratio between the SAW and shear velocities can be expressed as a proportional constant CRT. This was set to 0.92 in this calculation [21]. In more compact form, Equation (6) can be converted to
V R = C R T V T
Additionally, by substituting Equation (4) into Equation (6), the ratio between the SAW velocity and the shear velocity can be expressed in terms of the ratio between the shear and longitudinal velocity [21]:
V R V T = 0.718 ( V T V L ) 2 0.75 ( V T V L ) 2
Assuming that CRT is known, the longitudinal velocity can be expressed in terms of the SAW velocity:
V L = V R C R T 1 C R T 0.718 0.75 C R T
By substituting Equations (7) and (9) into Equation (2), a linear relation between E and the squared SAW velocity is obtained [21]:
E = αρVR2
where α = 0.128 0.282 C R T 2 0.25 C R T 3 .
Combining Equation (10) with Equation (1), the angular dependence of the SAW velocity can be expressed as:
V R ( θ ) 2 = E ( θ ) α ρ = E r + E 1 C 4 11 + E 2 C 4 12 cos 2 θ + E 3 C 4 13 cos 4 θ α ρ
By using Equation (11), the angular dependence of the SAW velocity affected by the texture can be calculated and shown in Figure 7.
The angular dependence of the SAW velocity affected by texture can be calculated by using Equation (11). The maximum error between the calculated value (2861 m/s) and the experimental value (2825 m/s) for sample 8 is 1.3% which was 105° with a rolling direction. The calculated results were in good agreement with the experimental measured values.

4. Conclusion

The laser-induced transient thermal grating experiments show that the texture of polycrystalline materials (cold rolled IF steel) affects the angular dependence of the SAW velocity during recrystallization. The sample in the nucleation stage (start of recrystallization) showed the highest SAW velocity and the strongest {100} texture. As recrystallization progresses, the SAW velocity decreased as the volume fractions of the {111} increased and {100} textures decreased. Additionally, the maximum, minimum and average velocities of SAW showed a downward trend, which is similar to the volume fraction change trend of {100} texture and opposite to that of {111} texture. The standard deviation of SAW velocity increased first and then decreased, which is a similar trend as the volume fraction of {110} texture.
The theoretically angular dependences of the SAW velocity (111), (110) and (100) orientated single crystals were simulated. The results reveal that the decrease of the SAW velocity in IF steel was due to the increasing of {111} texture during recrystallization. We presented a model for the angular dependence of the SAW velocity for polycrystalline materials. The calculated results by the model match the experimental results. The results can be used to practice the measurements in real time during the recrystallization processing and to optimize the heating treatment parameters.

Author Contributions

Conceptualization, A.Y., X.X. and S.Z.; methodology, A.Y. and X.X.; formal analysis, A.Y.; investigation, A.Y., X.X. and S.Z.; writing—original draft preparation, A.Y.; writing—review and editing, S.Z., C.G., X.S., Y.W. and X.Y.; visualization, A.Y., X.X., S.Z. and C.G.; supervision, S.Z. and C.G.; project administration, X.X. and S.Z.

Funding

This research is supported by the Key research and development project of the Ministry of science and technology (No. 2016YFB0700301), the National Natural Science Foundation of China (No. 51475247, 51805279), the Natural Science Foundation of Zhejiang (No. Q17E050012), the Natural Science Foundation of Ningbo (No. 2016A610057), and Sponsored by the K.C. Wong Magna Fund in Ningbo University.

Conflicts of Interest

The authors declare no conflict of interest.

Abbreviations

The following abbreviations are used in this manuscript:
IFinterstitial free steel
SAWsurface acoustic waves
XRDX-Ray diffractometer
EBSDelectron backscattered diffraction
LUSlaser-ultrasonics
ISSImpulsive Stimulated Scattering
ODFOrientation Distribution Function

References

  1. Kocks, U.F.; Tomé, C.N.; Wenk, H.R. Texture and Anisotropy: Preferred Orientations in Polycrystals and their Effects on Materials Properties; Cambridge University Press: London, UK, 2000. [Google Scholar]
  2. Peeters, B.; Bacroix, B.; Teodosiu, C.; Van Houtte, P.; Aernoudt, E. Work-hardening softening behaviour of b.c.c. polycrystals during changing strain paths: I. An integrated model based on substructure and texture evolution, and its prediction of the stress-strain behavior of an IF steel during two-stage strain paths. Acta Mater. 2001, 49, 1607–1619. [Google Scholar] [CrossRef]
  3. Ma, B.; Li, C.S.; Song, Y.L.; Wang, J.K.; Sui, F.L. Deformation and recrystallization microtextures of an austenitic steel during asymmetrical hot rolling process. J. Mater. Sci. 2017, 52, 1–15. [Google Scholar] [CrossRef]
  4. Zecevic, M.; Lebensohn, R.A.; McCabe, R.J.; Knezevic, M. Modelling recrystallization textures driven by intragranular fluctuations implemented in the viscoplastic self-consistent formulation. Acta Mater. 2019, 164, 530–546. [Google Scholar] [CrossRef]
  5. Perevertov, O.; Schäfer, R. Influence of applied compressive stress on the hysteresis curves and magnetic domain structure of grain-oriented transverse Fe–3%Si steel. J. Phys. D Appl. Phys. 2012, 47, 185001. [Google Scholar] [CrossRef]
  6. Bate, P.; Lundin, P.; Lindh-Ulmgren, E.; Hutchinson, B. Application of laser-ultrasonics to texture measurements in metal processing. Acta Mater. 2017, 123, 329–336. [Google Scholar] [CrossRef]
  7. Dierk, R. A texture-component Avrami model for predicting recrystallization textures, kinetics and grain size. Modell. Simul. Mater. Sci. Eng. 2007, 15, 39–63. [Google Scholar]
  8. Cheng, L.; Zhang, N.; Yang, P.; Mao, W.M. Retaining {100} texture from initial columnar grains in electrical steels. Scr. Mater. 2012, 67, 899–902. [Google Scholar] [CrossRef]
  9. Lee, H.H.; Jung, J.; Yoon, J.I.; Kim, J.K.; Kim, H.S. Modelling the evolution of recrystallization texture for a non-grain oriented electrical steel. Comput. Mater. Sci. 2018, 149, 57–64. [Google Scholar] [CrossRef]
  10. Engler, O.; Randle, V. Introduction to Texture Analysis: Macrotexture, Microtexture, and Orientation Mapping, 2nd ed.; CRC Press: Boca Raton, FL, USA, 2009. [Google Scholar]
  11. Sayers, M.C. Ultrasonic velocities in anisotropic polycrystalline aggregates. J. Phys. D Appl. Phys. 1982, 15, 2157–2167. [Google Scholar] [CrossRef]
  12. Moreau, A.; Lévesque, D.; Lord, M.; Dubois, M.; Monchalin, J.-P.; Padioleau, C.; Bussière, J.F. On-line measurement of texture, thickness, and plastic strain ratio using laser ultrasound resonance spectroscopy. Ultrasonics 2002, 40, 1047–1056. [Google Scholar] [CrossRef]
  13. Lense, J.L.; Le Brun, A.; Royer, D.; Dieulesaint, E. High bandwidtch laser heterodyne interferometer to measure transient mechanical displacements. SPIE 1987, 863, 13–22. [Google Scholar]
  14. Maznev, A.A.; Akthakul, A.; Nelson, K.A. Surface acoustic modes in thin films on anisotropic substrates. J. Appl. Phys. 1999, 86, 2818. [Google Scholar] [CrossRef]
  15. Li, W.Q.; Sharples, S.D.; Smith, R.J.; Clark, M.; Somekh, M.G. Determination of crystallographic orientation of large grain metals with surface acoustic waves. J. Acoust. Soc. Am. 2012, 132, 738–745. [Google Scholar] [CrossRef] [PubMed]
  16. Lévesque, D.; Lim, C.S.; Padioleau, C.; Blouin, A. Measurement of texture in steel by laser-ultrasonic surface waves. J. Phys. Conf. Ser. 2011, 278, 012007. [Google Scholar] [CrossRef]
  17. Yin, A.M.; Wang, X.C.l.; Glorieux, C.; Yang, Q.; Dong, F.; He, F.; Wang, Y.L.; Sermeus, J.; Donck, T.V.D.; Shu, X.D. Texture in steel plates revealed by laser ultrasonic surface acoustic waves velocity dispersion analysis. Ultrasonics 2017, 78, 30–39. [Google Scholar] [CrossRef] [PubMed]
  18. Sermeus, J.; Sinha, R.; Vanstreels, K.; Vereecken, P.M.; Glorieux, C. Determination of elastic properties of a MnO2 coating by surface acoustic wave velocity dispersion analysis. J. Appl. Phys. 2014, 116, 023503. [Google Scholar] [CrossRef]
  19. Verstraeten, B.; Sermeus, J.; Salenbien, R.; Fivez, J.; Shkerdin, G.; Glorieux, C. Determination of thermoelastic material properties by differential heterodyne detection of impulsive stimulated thermal scattering. Photoacoustics 2015, 3, 64–77. [Google Scholar] [CrossRef] [PubMed] [Green Version]
  20. Sakata, K.; Daniel, D.; Jonas, J.J. Estimation of 4th and 6th order ODF coefficients from elastic properties in cold rolled steel sheets. Texture Stress Microstruct. 1989, 11, 41–56. [Google Scholar] [CrossRef]
  21. Auld, B.A. Acoustic Fields and Waves in Solids; John Wiley & Sons: New York, NY, USA, 1973. [Google Scholar]
  22. Sermeus, J.; Verstraeten, B.; Salenbien, R.; Pobedinskas, P.; Haenen, K.; Glorieux, C. Determination of elastic and thermal properties of a thin nanocrystalline diamond coating using all-optical methods. Thin Solid Films 2015, 590, 284–292. [Google Scholar] [CrossRef]
  23. Bunge, H.J. Texture Analysis in Materials Science: Mathematical Methods; Butterworth-Heinemann: London, UK, 1982. [Google Scholar]
  24. Boresi, A.P.; Schmidt, R.J. Advanced Mechanics of Materials; Wiley: New York, NY, USA, 2003. [Google Scholar]
Figure 1. Samples in annealing processing: (a) samples with different annealing process shown in circle symbols; (b) texture volume fraction of the {100}, {110} and {111} texture components.
Metals 09 00288 g001
Figure 2. Experimental setup.
Metals 09 00288 g002
Figure 3. Angular dependence of surface acoustic waves (SAW) velocity in beginning (sample 6), during (sample 7) and after completion (sample 8) of recrystallization.
Metals 09 00288 g003
Figure 4. Orientation Distribution Function (ODF) measured by X-Ray diffractometer (XRD): (a) most important orientations in bcc materials in the φ2 = 45° section; (b) start of recrystallization, sample 6; (c) nucleation and growth, sample 7; (d) end of recrystallization, sample 8.
Metals 09 00288 g004
Figure 5. Characteristics of samples in the beginning (sample 6), during (sample 7) and after completion (sample 8) of recrystallization. (a) The volume fraction of the {100}, {110} and {111} textures; (b) the fourth order texture coefficients; (c) The maximum, minimum, mean values of SAW velocity; (d) the standard deviation of SAW velocity.
Metals 09 00288 g005
Figure 6. Simulated angular dispersion of SAW velocity in a single crystal of interstitial free (IF) steel: (a) (100) plane; (b) (110) plane; (c) (111) plane.
Metals 09 00288 g006
Figure 7. Evolution of the angular dependence of the SAW velocity: experimental data (the black dot for sample 6, the red diamond for sample 7 and the blue triangle for sample 8) and calculated results according to Equation (11) (the black solid line is sample 6, the red solid line is sample 7 and the blue solid line is sample 8).
Metals 09 00288 g007
Table 1. Chemical compositions of the experimental samples.
SiAlMnPCSONTi
0.0140.0540.120.00800.00340.00800.00270.00280.064
Table 2. Evolution of texture volume fraction and fourth order texture coefficients during recrystallization.
SampleStage{100}/%{110}/%{111}/% C 4 11 C 4 12 C 4 13
#6start of recrystallization7.512.9412.41−0.022−0.805−0.543
#7nucleation and growth5.504.4513.67−1.433−1.1500.218
#8end of recrystallization2.582.4219.56−2.378−0.3850.494

