Article

Stress Relaxation Aging Behavior and Constitutive Modelling of AA7150-T7751 under Different Temperatures, Initial Stress Levels and Pre-Strains

1
Light Alloy Research Institute of Central South University, Changsha 410083, China
2
State Key Laboratory of High-Performance Complex Manufacturing, Central South University, Changsha 410083, China
3
School of Mechanical and Electrical Engineering, Central South University, Changsha 410083, China
4
Shanghai Aerospace Equipment Manufacturing Co., Ltd., Shanghai 200245, China
*
Authors to whom correspondence should be addressed.
Metals 2019, 9(11), 1215; https://doi.org/10.3390/met9111215
Submission received: 21 September 2019 / Revised: 5 November 2019 / Accepted: 7 November 2019 / Published: 12 November 2019
(This article belongs to the Special Issue Metal Plasticity and Fatigue at High Temperature)

Abstract

:
Age forming is an advanced manufacture technology for forming large aluminum panels. Temperature, initial stress level and pre-strains have a great effect on the formability and performance. The stress relaxation aging behavior of AA7150-T7751 under different temperatures, initial stress levels and pre-strains was studied through stress relaxation tests, tensile tests and TEM observations. The results show that the formability can be improved with the increase of temperature, initial stress levels and pre-strains. Deformation mechanisms during stress relaxation of the material were analyzed on the basis of creep stress exponent and apparent activation energy. The aging precipitates of the studied alloy were not sensitive to the age forming conditions, but drastically coarsened at over aging temperature, which decreased the mechanical properties. In addition, the relationship between stress relaxation behavior and aging strengthening is discussed. Based on the dislocation theory and the modified Arrhenius equation, a stress relaxation constitutive equation considering the initial mobile dislocation density and temperature dependent activation energy was established. This model can predict very well the stress relaxation behavior under various temperature, stress level and pre-strain conditions, with an average error of 2%.

1. Introduction

Age forming (AF) technology was conceived in the 1970s by Textron Aerostructures to produce components with high strength and complex curvatures in the aeronautical industry [1]. The fundamental operational mechanism is based on stress relaxation and/or the creep phenomenon occurring during the course of artificial aging. Currently, the technology has been successfully applied to the upper wing of Airbus A340/A380 air planes and the upper wing skins of Gulfstreams [2,3]. Zhan et al. [4] and Zheng [5] outlined several important process parameters that affect the quality and precision of age forming, including aging time, aging temperature and initial stress level. Moreover, a simulation regarding the deformation behavior and mechanical property evolution of materials in age forming relies on the establishment of a unified constitutive equation on the basic of deformation and strengthening mechanism. Therefore, in order to realize the precise manufacturing of components, it is necessary to understand the comprehensive influence of process parameters and initial states on age forming so as to come up with an accurate prediction model.
Previous studies on the evolution of shape and properties in the age forming process have been carried out by simulating the creep phenomenon. Mostly, recent studies have outlined that when the work-piece is enforced to conform to the shape of the tool by atmospheric pressure acting on its upper surface, stress relaxation is the main phenomenon in the age forming process of the wing plate [6]. Stress relaxation of aluminum alloys at a certain temperature and initial stress is generally attributed to increased creep deformation. The power-low equations describe a function of steady-state creep rate on stress, temperature and grain diameter in pure metals [6]. However, for aluminum alloys, the grain structure and average size are not significantly altered, since the aging temperature is much lower than the recrystallization temperature [7,8]. Therefore, the subsequent studies on stress relaxation of aluminum alloys focused on stress, temperature. Considering the dislocation hardening, Kowalewski et al. [9] set creep damage constitutive equations to describe creep damage. Ho K C et al. [10] developed this and considered the solute hardening and aging hardening in the creep process. Their equations model the primary and secondary creep stage well. On this basis, Zhan et al. [11] further described the static and dynamic recovery effects in creep process by introducing relative dislocation density. Subsequently, this macro-micro modeling method based on the hardening and softening mechanism was generalized. Zhang et al. [12] and Ma et al. [13] extended the equation to a wider stress and temperature range and characterized the microscopic factors (precipitate size, volume fraction and aspect ratio) in more detail. Zheng et al. [14] established a deformation constitution model of the stress relaxation. Although the forms of the characteristic equation in their models of precipitates were different, the precipitated strengthening effect is introduced into the model by contributing to the yield strength of the material. However, Xu [7] et al. showed that a minor role was played by the precipitate size in the steady-state creep mechanism. Therefore, the physical relationship between the characteristics of precipitates and the strain rate in the process of stress relaxation still needs further study. Additionally, according to the Orowan equation, strain is a function of mobile dislocation density and its velocity; therefore, considering the evolution of mobile dislocation density, rather than total dislocation density, would be more suitable for physical mechanisms in the establishment of a stress relaxation model [15,16].
7150 Al alloy is a common application material of AF technology, the precipitate sequence of which can be summarized as: Solid solution → Guinier–Preston zones (GP zones) → Metastable η′ → Stable η (MgZn2) [17]. Since its development, its retrogression and re-aging treatment (RRA, commonly called T77 or T7751 temper) has been favored by the aerospace manufacturing industry due to its excellent resultant mechanical properties, which have been shown to not only guarantee the strength of a T6 temper, but also to offer the corrosion resistance of a T76 temper [18,19]. In this paper, AA7150-T7751, whose average grain size is generally more than 100 μm [20], was used as the experimental material to simulate the stress relaxation process on the relaxation testing machine. The control-variable method was used to explore the influence of the stress relaxation and age hardening at the initial stress level, aging temperature, pre-strain levels and the microstructure through TEM observation. The physical mechanism of stress relaxation behavior was investigated, and eventually, based on Orowan mechanism, a stress relaxation aging constitutive model AA7150-t7751 was initiated. It was evident that it accurately predicted different initial pre-strain levels, as well as complex thermal-mechanical conditions, and provided an essential theoretical basis for accurate prediction of spring-back in age forming and precision forming manufacturing.

2. Experiment

2.1. Material and Sample Preparation

In this study, the experiments were conducted on a commercial high-strength AA7150 whose chemical composition is listed in Table 1. Samples were machined into a dog-bone-shaped pattern with a parallel length of 50 mm along the rolling direction, whose specific geometry and dimensions are shown in Figure 1. The samples underwent a solution treatment at 470 °C for 1 h, water quenching for 1–2 min, natural aging for 2 days after pre-strain of 2% and 24 h of heat treatment at 120 °C. Afterward, retrogression and re-aging (RRA) heat treatment was conducted, where the samples were subjected to retrogression at 190 °C for 30 min and the re-aging treatment at 120 °C for 24 h. The samples were lastly air-cooled.

2.2. Experimental Procedure

To study the influence of different temperatures, initial stress levels, aging time, and pre-strains on the stress relaxation behavior of state AA7150-t7751, SRA experiments formulated as displayed in Table 2 were performed on RMT-D5, electronic stress relaxation testing machine. The sample was heated up to a certain temperature with a heating rate of 5 °C/min and then loaded to the predetermined stress level under a quasi-static condition with a loading rate of 15 N/s. After a period of aging, the sample was unloaded and cooled to room temperature inside the furnace. The aged samples were subjected to uniaxial tensile tests on a CMT-5105 test machine and the yield strengths were obtained as 0.2% offset yield stress. The tests were performed at room temperature with a strain rate of 7 × 10⁻⁴ s−1. The microstructural evolution was characterized in detail by transmission electron microscopy (TEM). Slices for TEM observation were cut from the specimens and ground to about 70~120 µm in thickness and then punched out from the above slices to get foil discs of 3 mm in diameter. Finally, these foil discs were twin-jet electro-polished with a Struers TenuPol-5 machine using a mixture of 275 mL nitric acid and 825 mL methanol at −25 °C to further thinning down up to 40–60 nm. TEM images were acquired on a Titan G2 60–300 transmission electron microscope operated at 300 kV.

3. Results

3.1. Stress Relaxation Behavior of AA7150 under Different Temperatures

Figure 2 shows the stress relaxation behavior of AA7150 under different temperatures (120 °C, 140 °C, 145 °C, 150 °C and 170 °C). The stress relaxation curves under different temperatures are similar to the logarithmic-function curve, as shown in Figure 2a. A sharp stress drop period is observed at the start of the experiment, lasting about 1~1.5 h. After that, the stress declines at a slow rate, but no relaxation limit appears. Stress relaxation rate curves are used to characterize the stress relaxation resistance in the SRA process, as shown in Figure 2b. The stress relaxation rate curves of different temperatures also experience a steep drop at first and then transited to a stage in which relaxation rate gradually approaches zero. Interestingly, the stress relaxation curve at 170 °C shows an unusual phenomenon, which intersects the curves at 140 °C, 145 °C and 150 °C, as shown in Figure 2b. The aging time corresponding to the three intersections is about 0.52 h, 0.62 h and 0.98 h, respectively. Figure 2c represents the stress relaxation rate at different temperatures, ε 120 ˙ < ε 170 ˙ < ε 140 ˙ < ε 145 ˙ < ε 150 ˙ within 1 h. After that, the higher the temperature is, the more the stress relaxation rate is. This unique phenomenon can be explained by the different mechanisms of SRA under 170 °C, which will be discussed in detail in Section 4.1. Relaxation efficiency is a measure of relaxation capacity and can be expressed by residual stress ratio:
φ = σ t σ i
where σ i and σ t are the initial stress and the residual stress at a specific time. Higher temperature results in higher residual stress ratios at 16 h. These are 13.23%, 22.22%, 24.93%, 27.48%, and 38.70% respectively. This proves that temperature has a positive effect on stress relaxation.

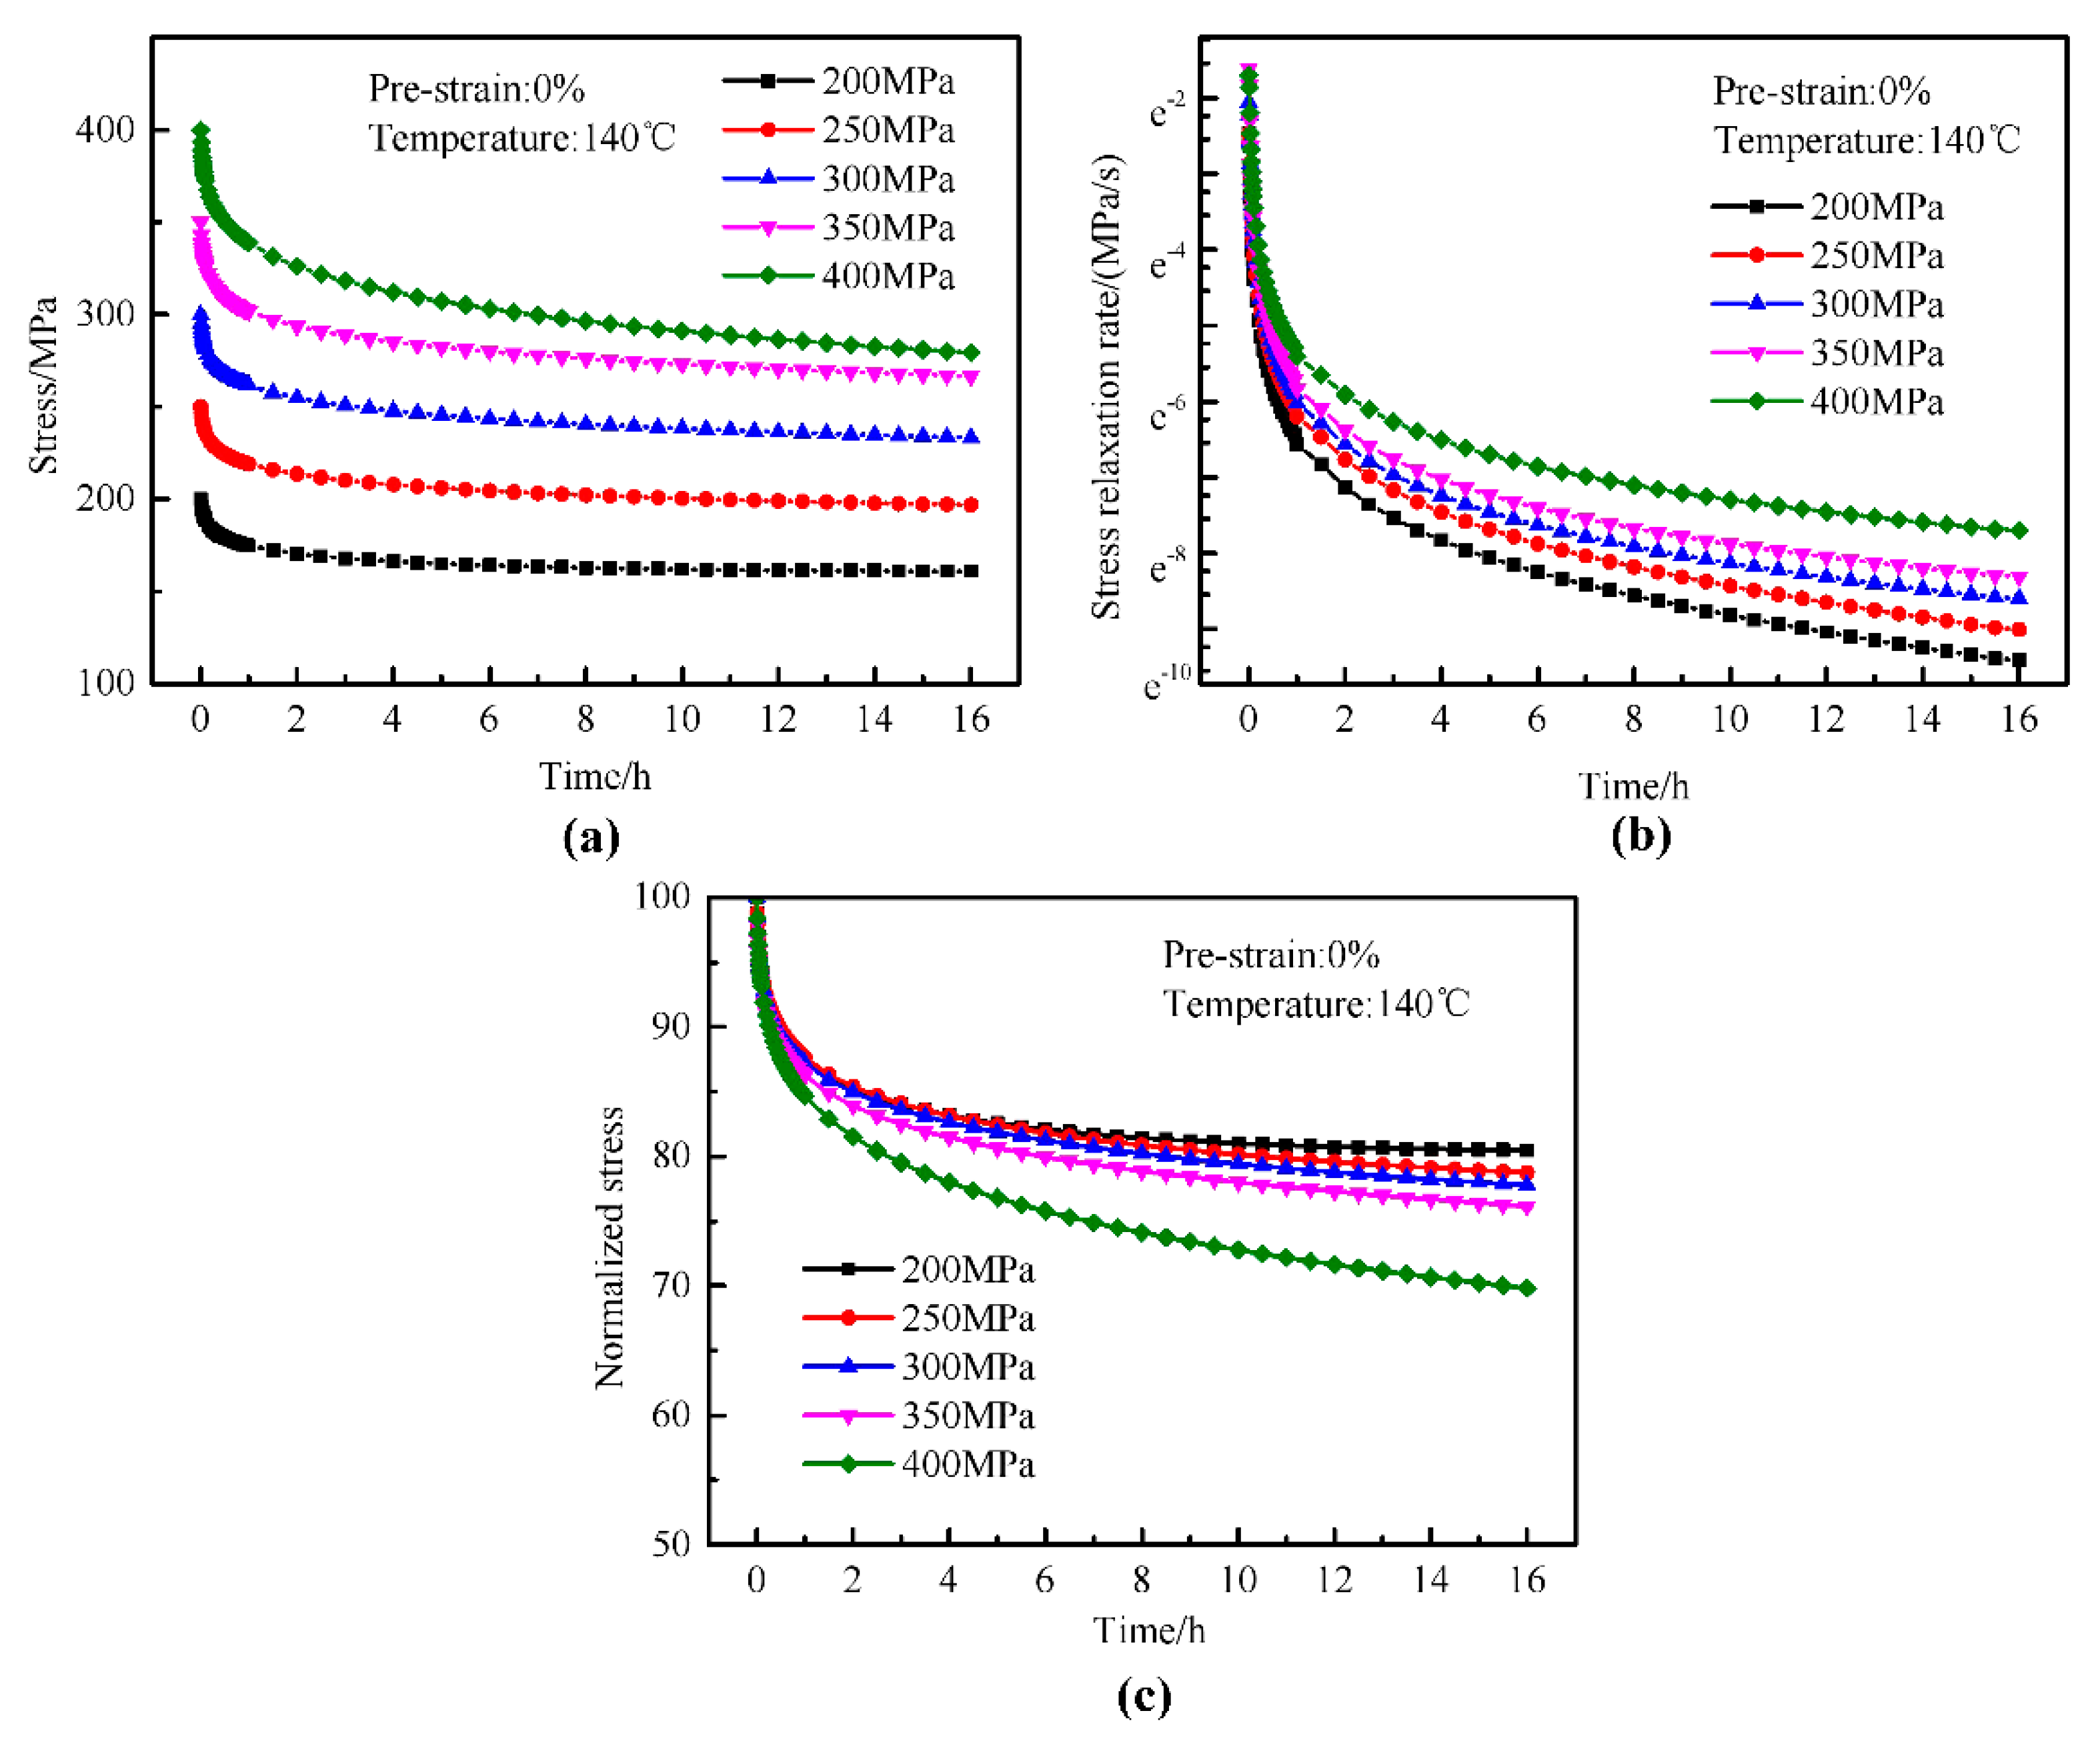
3.2. Stress Relaxation Behavior of AA7150 under Different Initial Stress Levels

According to the experimental case 2 in Table 2, the effects of different initial stress levels (200, 250, 300, 350 and 400 MPa) on the stress relaxation behavior of AA7150 with non-pre-strain were studied, as exhibited in Figure 3a. Apparently, there is no difference in the trend of the stress relaxation curve under different initial stresses; both the fast and slow decline stages can be observed, which is similar to the curves under different temperatures in Section 3.1. This may be caused by same stress relaxation mechanism of different initial stress levels. By using Equation (1) to normalize the stress relaxation curves under different stresses, the evolution of the residual stress ratio over time can be obtained. Figure 3b indicates that the residual stress ratio at 16 h are 19.54%, 21.25%, 22.22%, 23.85% and 30.18%, respectively. The relaxation efficiency increases slightly with the increase of the initial stress levels from 200–350 MPa, but shows a significant rise at initial stress at 400 MPa. This is because 400 MPa is close to the elastic limit of AA7150-T7751 under 140 °C (the elastic limit of equivalent strain rate is about 430 MPa obtained by the hot tensile test under 140 °C). Although Figure 3c shows that the stress relaxation rate curves with different initial stresses are similar, the stress relaxation driving force increases with the increase of applied stress.

3.3. Stress Relaxation Behavior of AA7150 under Different Initial Pre-Strains

Experiments at different pre-strains (0, 3% and 6%) were performed according to case 3 of Table 2. Figure 4a indicates that introducing pre-strain does not change the trend of stress relaxation curve but improves the relaxation efficiency, which is consistent with the results of previous researches [5,21]. The relaxation efficiency of three pre-strain levels are 22.22%, 29.96% and 39.94%, respectively. This increases with the enhancement of the pre-strain and the residual stress decreases by about 30 MPa for every 3% pre-strain. Similarly, there is still no relaxation limit, just like the stress relaxation behavior in the previous two sections. What we can observe from the different stress relaxation rate diagrams in Figure 4b is that the pre-strain augments the stress relaxation rate throughout the SRA phase. In the whole SRA process, it is evidently true that ε 0 ˙ < ε 3 % ˙ < ε 6 % ˙ , and this means larger pre-strains lead to larger stress relaxation rates. Therefore, introducing pre-strains can improve the relaxation and forming efficiency.

3.4. Aging Behavior of AA7150 under Different Temperatures, Initial Stress Levels and Pre-Strains

Before studying the evolution of aging behavior of AA7150-T7751 during the SRA under different temperatures, initial stress levels and pre-strains, we need first to study the yield strength’s change with time. Figure 5a shows the yield strength of stress-relaxation-aged samples at 0 MPa and 300 MPa under 140 °C for 0 h, 1 h, 8 h and 16 h. It is observed that the maximum yield strength of both stress-free aging and stress relaxation aging appears at 0 h, which are 589 MPa. The yield strength of stress-free aged samples fluctuates within 582 MPa to 589 MPa. When the initial stress is 300 MPa, the yield strength of stress-relaxation-aged samples has a small decrease trend with time. In addition, the yield strength after 16 h stress-aging is about 572 MPa, which is about 2.0% lower than that of initial state. With the increase of temperature, the yield strength gradually decreases, as shown in Figure 5b. The maximum drop is about 110 MPa, which occurs at 170 °C. When comparing the yield strength of the stress-relaxation-aged and stress-free–aged samples, the former is always lower than the later and the difference between them grows with temperature. Therefore, the reduction of property caused by stress relaxation is far less than caused by aging. After regression re-aging, SRA can be considered as an over-aging process. Higher initial stress level and higher temperature can deepen the degree of over-aging, which results in the decreasing of yield strength.
Figure 5d shows that the yield strength of 3% and 6% pre-strained sample are initially 30 MPa and 55 MPa higher than the non-pre-strained sample, respectively. This phenomenon is the strain hardening effect due to dislocations and entanglements [22]. The effects of initial pre-strain levels on the aging behavior have been studied by comparing its influence on the yield strength variation among non-pre-strained, 3% and 6% pre-strained samples stress-aged at 0 MPa and 300 MPa for 16 h, as shown in Figure 5d. Yield strength of both stress-free-aged and stress-relaxation-aged samples decreases with pre-strains. Moreover, the yield strength of stress-free-aged specimens is lower than that of stress-relaxation-aged specimens and its difference grows with pre-stains. The reason for this may be that the work hardening caused by pre-strains may not be completely recovered, which makes up for the performance weakening caused by the coarsening of precipitates.
To study the precipitation behavior under different temperatures, initial stress levels and pre-strains. The TEM bright field images of selected samples are shown in Figure 6. It is reported that the precipitations of the Al-Zn-Mg-Cu alloy in the T7751 state is dominated by the GP zones and the η′-precipitate. The former is a small cluster, and the latter is a small rod-shaped or platelet-like precipitate. TEM observation is mainly carried out along the <110>Al direction [23].
A large number of platelet-like and short rod-shaped precipitates can be observed in both initial materials, as shown in Figure 6a. According to the High Resolution Transmission Electron Microscopy (HRTEM) image of initial material, Figure 6f, they are GP zones and η′-precipitate. The size of the η′-precipitate is about 12 nm, and a small amount of GP zones have a size of about 2–5 nm. Based on precipitation hardening theories, the length of the η′-precipitate in the initial state is the same as the average critical length of the aluminum alloy, which can provide the maximum shear stress and bring the maximum hindrance to the dislocation motion, and the yield strength in this state may be the maximum.
Figure 6a,b shows that the types of precipitates after stress relaxation for 16 h at 300 MPa and 140 °C are unchanged, and the number of precipitates changes little. The average diameter of η′-precipitate is about 10 nm; thus, the mechanical properties before and after the stress relaxation aging are similar. When comparing Figure 6b,c, coarsening of the η′-precipitate is evident when the stress-relaxation aging temperature is 170 °C, where the average diameter of η′-precipitate is about 20 nm. In addition, a small amount of η′-precipitates appears, with an average size of about 50 nm. This explains why the yield strength drops sharply at 170 °C. In comparison with Figure 6b,d, when the initial stress is 400 MPa, the average diameter of the η′-precipitate is about 12 nm and a small amount of η′-precipitates is coarsened to 20 nm. The small GP zones disappear completely. Therefore, the yield strength in this state is slightly lower than initial state. Ma et al. and Zheng et al. [13,14] also demonstrated that the coarsening of the precipitates can be accelerated under higher stress. The comparison of Figure 6b,e shows that the average diameter of the η′-precipitate after stress relaxation aging of 6% pre-strain is about 20 nm. Pre-strains mainly affects the precipitation process by accumulating more dislocations of SRA, thus resulting in a noticeable coarsening response after SRA.

4. Discussion

4.1. Deformation Mechanism during Stress Relaxation Aging Process under Three Parameters

A rational explanation of the stress relaxation phenomenon is that the total strain remains unaffected and a certain amount of creep strain is generated under the high temperature stress aging. This leads to a decrease in the force maintaining the elastic strain. The relation among the three strains can be described by Equation (2). The relationship between the stress relaxation rate ( σ ˙   ˙ ) and the creep strain rate ( ε c   ˙ ) can be directly determined by Equation (3).
ε T = ε e + ε c  
σ ˙ = E × ε c   ˙
where ε T ,   ε e and ε c   are the total strain, elastic strain and creep strain, respectively. The deformation mechanism during the creep aging process at different initial stress levels can be determined by calculating the stress exponent at constant stress levels by Equation (4) [24]. There are two questions exist in stress relaxation aging process. One is that the steady creep strain rate of SRA is difficult to determine. Another is that the stress in SRA decreases gradually. However, we can calculate the “steady-state relaxation rate” through the linear fitting of the relaxation curve in the 13~16 h period. Then, Equation (5) is used to calculate the “stress exponent” between it and the initial stress level and the final residual stress, respectively as n1 and n2. The actual stress exponent in the stress relaxation process is between n1 and n2.
n = ln ( ε s ˙ ) ln σ
  n = ln ( σ s ˙ / E ) ln σ n  
where ε s ˙ is the steady creep strain rate and σ s ˙ is the “steady-state relaxation rate” obtained by fitting.   σ n represent substituting initial stress levels or finial residual stress. E is Young’s modulus. The plots of ln ( σ s ˙ / E ) ln σ n are shown in Figure 7. Therefore, the value of n is found to range from 2.76 to 3.29. It is also known that n = 3 indicates a viscous dislocation glide creep mechanism; n = 5 represents the dislocation climb creep mechanism [25]. Consequently, we can infer that deformation mechanism of stress relaxation at 140 °C for different initial stress levels is principally controlled by dislocation glide.
From Section 3.1, it is evident that temperature has a great impact on stress relaxation behavior. We all known that the essence of deformation is the dislocation motion under thermal activation. Therefore, the deformation mechanism may change at different temperatures, which can be determined by calculating the value of the apparent activation energies. The Arrhenius equation (Equation (6)) has been shown to be applicable in describing the process of thermal activation [26,27]. The formula for calculating the apparent activation energy can be obtained by taking the logarithm on both the left and right sides of Equation (6).
ε s ˙ = A ×   exp ( Q c R T )
  ln ( σ s ˙ E ( T ) ) = ln A Q c R T
E ( T ) = 107452 119 × T
where A is the material constant, R is the gas constant ( 8.314   J · mol 1 · K 1 ) and T is the Kelvin temperature. E(T) represents that Young′s modulus is function of temperatures. The experimental data and fitting curves for Equation (8) are shown in Figure 8a Q c is the apparent activation energy. Generally, when the temperature range is narrow, it is considered to be simply unaffected. However, some researchers had analyzed the relationship between the apparent activation energy ( Q c ) and temperature of some pure metals such as aluminum and silver. They found that the apparent activation energy is the least and close to that for grain boundary diffusion energy (84 kJ/mol [28]) of pure aluminum when the temperature is about 0.4 Tm (Tm indicates that the melting point of aluminum, which is 993 K). At this time, the main deformation mechanism of creep is the grain boundary diffusion mechanism. When the temperature is > 0.7 Tm, Q c is close to the self-diffusion activation energy of pure aluminum. The diffusion mechanism is dominant at this time. When the homologous temperature is between 0.4 and 0.7 (0.4 < T/Tm < 0.7), the activation energy increases with the temperature evidently. This change in the value of Q c is usually explained by the contribution to strain by different deformation mechanisms. Dislocation motion is the main deformation mechanism during SRA. However, there are two main types of dislocation motion and they are dislocation glide and dislocation climb, and the energy barrier of dislocation climb is greater than that of dislocation slip, which causes the former is hard to occur at lower temperature [6,26]. Obviously, there are some differences in apparent activation energies between pure metals and alloys. Other researchers calculated the apparent activation energies of creep or stress relaxation in Al-Zn alloy and found out they lied within 91~134 kJ/mol, but little difference was found in the trend of creep or stress relaxation curves at different temperatures in their papers [29,30]. However, a significant difference appeared in stress relaxation process under different temperature. A special overlap phenomenon was observed in stress relaxation curves in this essay, as shown in Figure 2a. The apparent activation energies in two temperature ranges (120 °C, 140 °C, 145 °C and 145 °C, 150 °C, 170 °C) calculated by using Equation (7) are 109.0 kJ/mol and 135.2 kJ/mol, as shown in Figure 8b. It increases with the temperature. When the aging temperature rises from 120 °C to 170 °C, the dominant deformation mechanism in the stress relaxation process of AA7150-T7751 changes from dislocation slip to dislocation climbing. During dislocation climbing, the edge dislocation may generate positive and negative climbing. The former contribute to the multiplication of dislocation and the latter leads to dislocation annihilation. Therefore, the stress relaxation rate of stress-aged at 300 MPa with non-pre-strain sample under 170 °C is less than that under 140 °C to 150 °C in the initial stage of SRA, this may due to the fact that the rate of total dislocation multiplication under 170 °C decreases as a result of the presence of dislocation annihilation, which is lower than that under 140 °C to 150 °C.
Tamás Csanádi [22] reported that the introducing of pre-strain increases the initial dislocation density in the material. However, the introduction of pre-strains does not change the deformation mechanism in the stress relaxation process, which can be supported by the similar trend of stress relaxation and stress relaxation rate curves in Section 3.3. Another piece of evidence determining the mechanism of stress relaxation is that a large number of dislocations are observed in Figure 9, which shows the TEM images of 3% pre-strain samples after SRA treatment with an initial stress of 300 MPa. These dislocations become entangled with the precipitates and unwind at high temperatures to become mobile dislocations.
Based on the above discussion, we can infer that the main deformation mechanism of stress relaxation is dislocation motion. At lower temperatures, the deformation mechanism of stress relaxation aging under different stress levels is primarily dislocation slip. At higher temperatures, the dominant mechanism of SRA changes from dislocation slip to dislocation climb. Moreover, the introduction of initial pre-strain cannot change the predominant mechanism of deformation mechanism in the SRA process. Therefore, we can infer the stress relaxation behavior and deformation mechanism of AA7150-T7751 by taking into account the three parameters as displayed in Figure 10.

4.2. Constitutive Modeling and the Determination of Material Parameters

The mechanism controlling stress relaxation of AA7150-T7751 is a thermal activation dislocation motion, as was identified in Section 4.1. Equation (9), a formula combining the Orowan equation and the Arrhenius equation, is normally used to describe the dependencies of strain rate, ε ˙ , mobile dislocation density, ρ m , the average velocity of mobile dislocation, ε ˙ and temperature, T.
ε ˙ = b ρ m v   ( Q c R T )
where b is the absolute value of the Burgers vector.   Q c is the apparent activation energy of SRA and it changes with the aging temperature. Thus, a modified model needs to be introduced to define their relations, Equation (10), which was proposed by J.M. Montes et al. [31], is as follows:
Q c = Q S D ( 1 a 1 + exp ( b ( T T m + c ) ) )
where a, b and c are material constants, Q S D is the self-diffusion activation energy, whose value for pure aluminum is142 kJ/mol [31,32].
ρ m is the initial mobile dislocation density. The relationship between initial mobile dislocation density, initial dislocation density and stress ( σ ) is derived in Estrin and Mecking, as shown in Equation (11) [33,34]. The initial dislocation density and thus the dislocation hardening effect should increase with increasing pre-strain level. Equation (12) describes its increasing with pre-strains [35].
ρ m = ρ i ( σ s σ ) m  
ρ i = ( 1 + ( C 1 C 2 C 2 2 ) ε p ) exp ( C 2 ε p ) ×   ρ 0
where ρ 0 , ρ i and ρ m are initial mobile dislocation density, dislocation density after introducing pre-stains and initial dislocation density, respectively. C1 reflects material mobile dislocation proliferation, C2 is on behalf of the mobile dislocation and mobile dislocation to capture and annihilate each other, ε p is pre-strain. σ s is the saturated stress and m is the material constant. With these two equations, the starting point of the stress relaxation process under the different pre-strains is determined.
v is the velocity of mobile dislocation and it is the time dependent and a strong function of stress in stress relaxation aging, and usually has three empirical equation forms as shown in Equation (13).
v ¯ = { K σ n ,   l o w   s t r e s s C e x p ( α σ ) ,   h i g h   s t r e s s A s i n h ( B σ ) ,   a l l   s t r e s s   l e v e l
where K ,   C ,   A ,   n ,   α and B are material constants; σ is aging stress. The Norton equation, K σ n , is suitable for lower stress levels; the Dorn equation, C e x p ( α σ ) , is suitable for high stress aging; while the hyperbolic sine equation, A s i n h ( B σ ) , is considered to be suitable for various initial stress levels.
In this paper, based on the A s i n h ( B σ ) model and the hardening and recovery theories, we proposed a stress relaxation model with considering the pre-strains, initial stress and temperature. Equations (14)–(19), as follows:
| σ ˙ | = E ( T ) × ε c ˙
ε c ˙ = f 1 × ρ m ¯ × sin h { f 2 σ ( 1 ρ ¯ ) } exp ( Q H R T )
ρ m ¯ = ( 1 + ( f 8 f 9 f 9 2 ) ε p ) ( f 7 σ ) f 5 × exp ( f 9 ε p )
ρ ¯ ˙ = f 3 σ f 4 × exp ( Q H R T ) ( 1 ρ ¯ f 6 × ( f 7 σ ) f 5 × exp ( f 9 ε p ) ) ε c ˙
Q c = Q S D ( 1 f 10 1 + exp ( f 11 ( T T m + f 12 ) ) )
Q H = f 13 ( 1 1 + exp ( f 14 ( T T m + f 15 ) ) )
where f 1 ~ f 15 are material constants. R is the gas constant ( 8.314   J · mol 1 · K 1 ) and T is the Kelvin temperature. T and Tm are aging temperature and the melting temperature of pure aluminum respectively.   ε p is the initial pre-strain value.   σ is the initial stress.
Equation (14) indicates that the decrease of stress relaxation rate is due to the slowdown of strain rate. E(T) represents the change of Young’s modulus with temperatures within experimental temperature.
ρ m ¯ in Equation (16) is the normalized mobile dislocation density and means the mobile dislocation density ratio before stress relaxation between non-pre-strain and pre-strained samples, which is a combine of Equations (11) and (12).
The total density is composed in part of mobile dislocations and in part of network dislocations. The term σ ( 1 ρ ¯ ) in Equation (15) is used to describe the contribution of network mobile dislocations on strain rate under effective stress based on the assumption that only dislocations which are trapped contribute to the hardening of the material in stress relaxation process [36]. ρ ¯ is the relative newly generated network dislocation density fraction, which is defined as the density of the new network dislocation formed by the trapped mobile dislocation and its ratio of the instantaneous value to the possible peak value in the stress relaxation process. This peak value occurs when hardening and softening reach a dynamic equilibrium. Thus, ρ ¯ varies from 0 to 1. Equation (17) indicates that the transformation from mobile dislocations to network dislocations may be just related to dislocation multiplication caused by deformation in stress relaxation and dislocation annihilation caused by dynamic recovery. The rate of relative newly generated network dislocation density fraction is effected by stress, temperature, pre-strain and strain rate. The first term in Equation (17) represents the development of dislocation density due to deformation. The second term gives the effect of the dynamic recovery. With the increase of stress, temperature and pre-strain, ρ ¯ ˙ is smaller and thus is hard to reach steady state. Q c is the apparent activation energy, whose relations between Q c and aging temperature is given as Equation (18), which is the same form as Equation (10). Q H is the recovery energy, which represents the energy required to convert mobile dislocations into network dislocations at specific temperatures and that decrease with increasing temperature, as shown in Equation (19), which is deduced on the basis of Equation (10).
The particle swarm algorithm was used for fitting the SRA curves. To prevent the program from producing no physical meaning constants and obtain more accurate material constants of Equation (14–19), the stress relaxation curves under the four experimental conditions (i.e., 0% + 300 MPa + 140 °C, 0% + 350 MPa + 140 °C, 0% + 300 MPa + 170 °C, 6% + 300 MPa + 140 °C) were fitted by manually modifying the range of material constants, as shown in Figure 11a. Standard deviation of the experimental data and the fitted data is used as a criterion for fitting accuracy. Table 3 shows the material parameters of stress relaxation aging constitutive equation of AA7150-T7751. Figure 11b gives the fitting results of the stress relaxation curves under different process parameters and the fitting curves of creep activation energy and recovery energy. The fitting error of the four stress relaxation curves is less than 1%. The evolution of Q c and Q H with the temperature is illustrated in Figure 11b. The apparent activation energy obtained by fitting at 170 °C and 120 °C is 134 kJ/mol and 117 kJ/mol, respectively, which are close to the apparent activation energy calculating results in Figure 8b. Figure 11c shows that the relative newly generated network dislocation density fraction obtained by using these models, which increase with the time and is closed to 1 when the hardening and recovery reach the dynamic balance. The higher temperature, initial stress levels and pre-stains are, the smaller ρ ¯ is.
Through modification of the variables such as initial pre-strain level, temperature and initial stress level, the stress relaxation curves under the other above mentioned process conditions were predicted as shown in Figure 12a. To further verify the accuracy of the model, predicted and experimental stress relaxation curves under two new experimental conditions (i.e., 2% + 275 MPa + 155 °C, 5% + 325 MPa + 160 °C) for 16 h was used to compare, as shown in Figure 12b. The standard deviation of each experimental curve and the predicted curve is less than 2%. Therefore, the stress relaxation constitutive model of AA7150-T7751 established in this paper has correct and accurate prediction ability for stress relaxation curves under different process conditions.

5. Conclusions

By studying the stress relaxation behavior of AA7150-T7751 under different age forming conditions of temperature, initial stress levels and pre-strains, the following were concluded:
(1)
Temperature, stress level and pre-strain have a great effect on stress relaxation behavior of AA7150-T7751. When the temperature rises by 30 °C, the initial stress level increases by 100 MPa and pre-strain value increases by 3%, relaxing efficiency increased by 16.48%, 7.96% and 17.72%, respectively, compared with SRA at 300 MPa under 140 °C for 16 h.
(2)
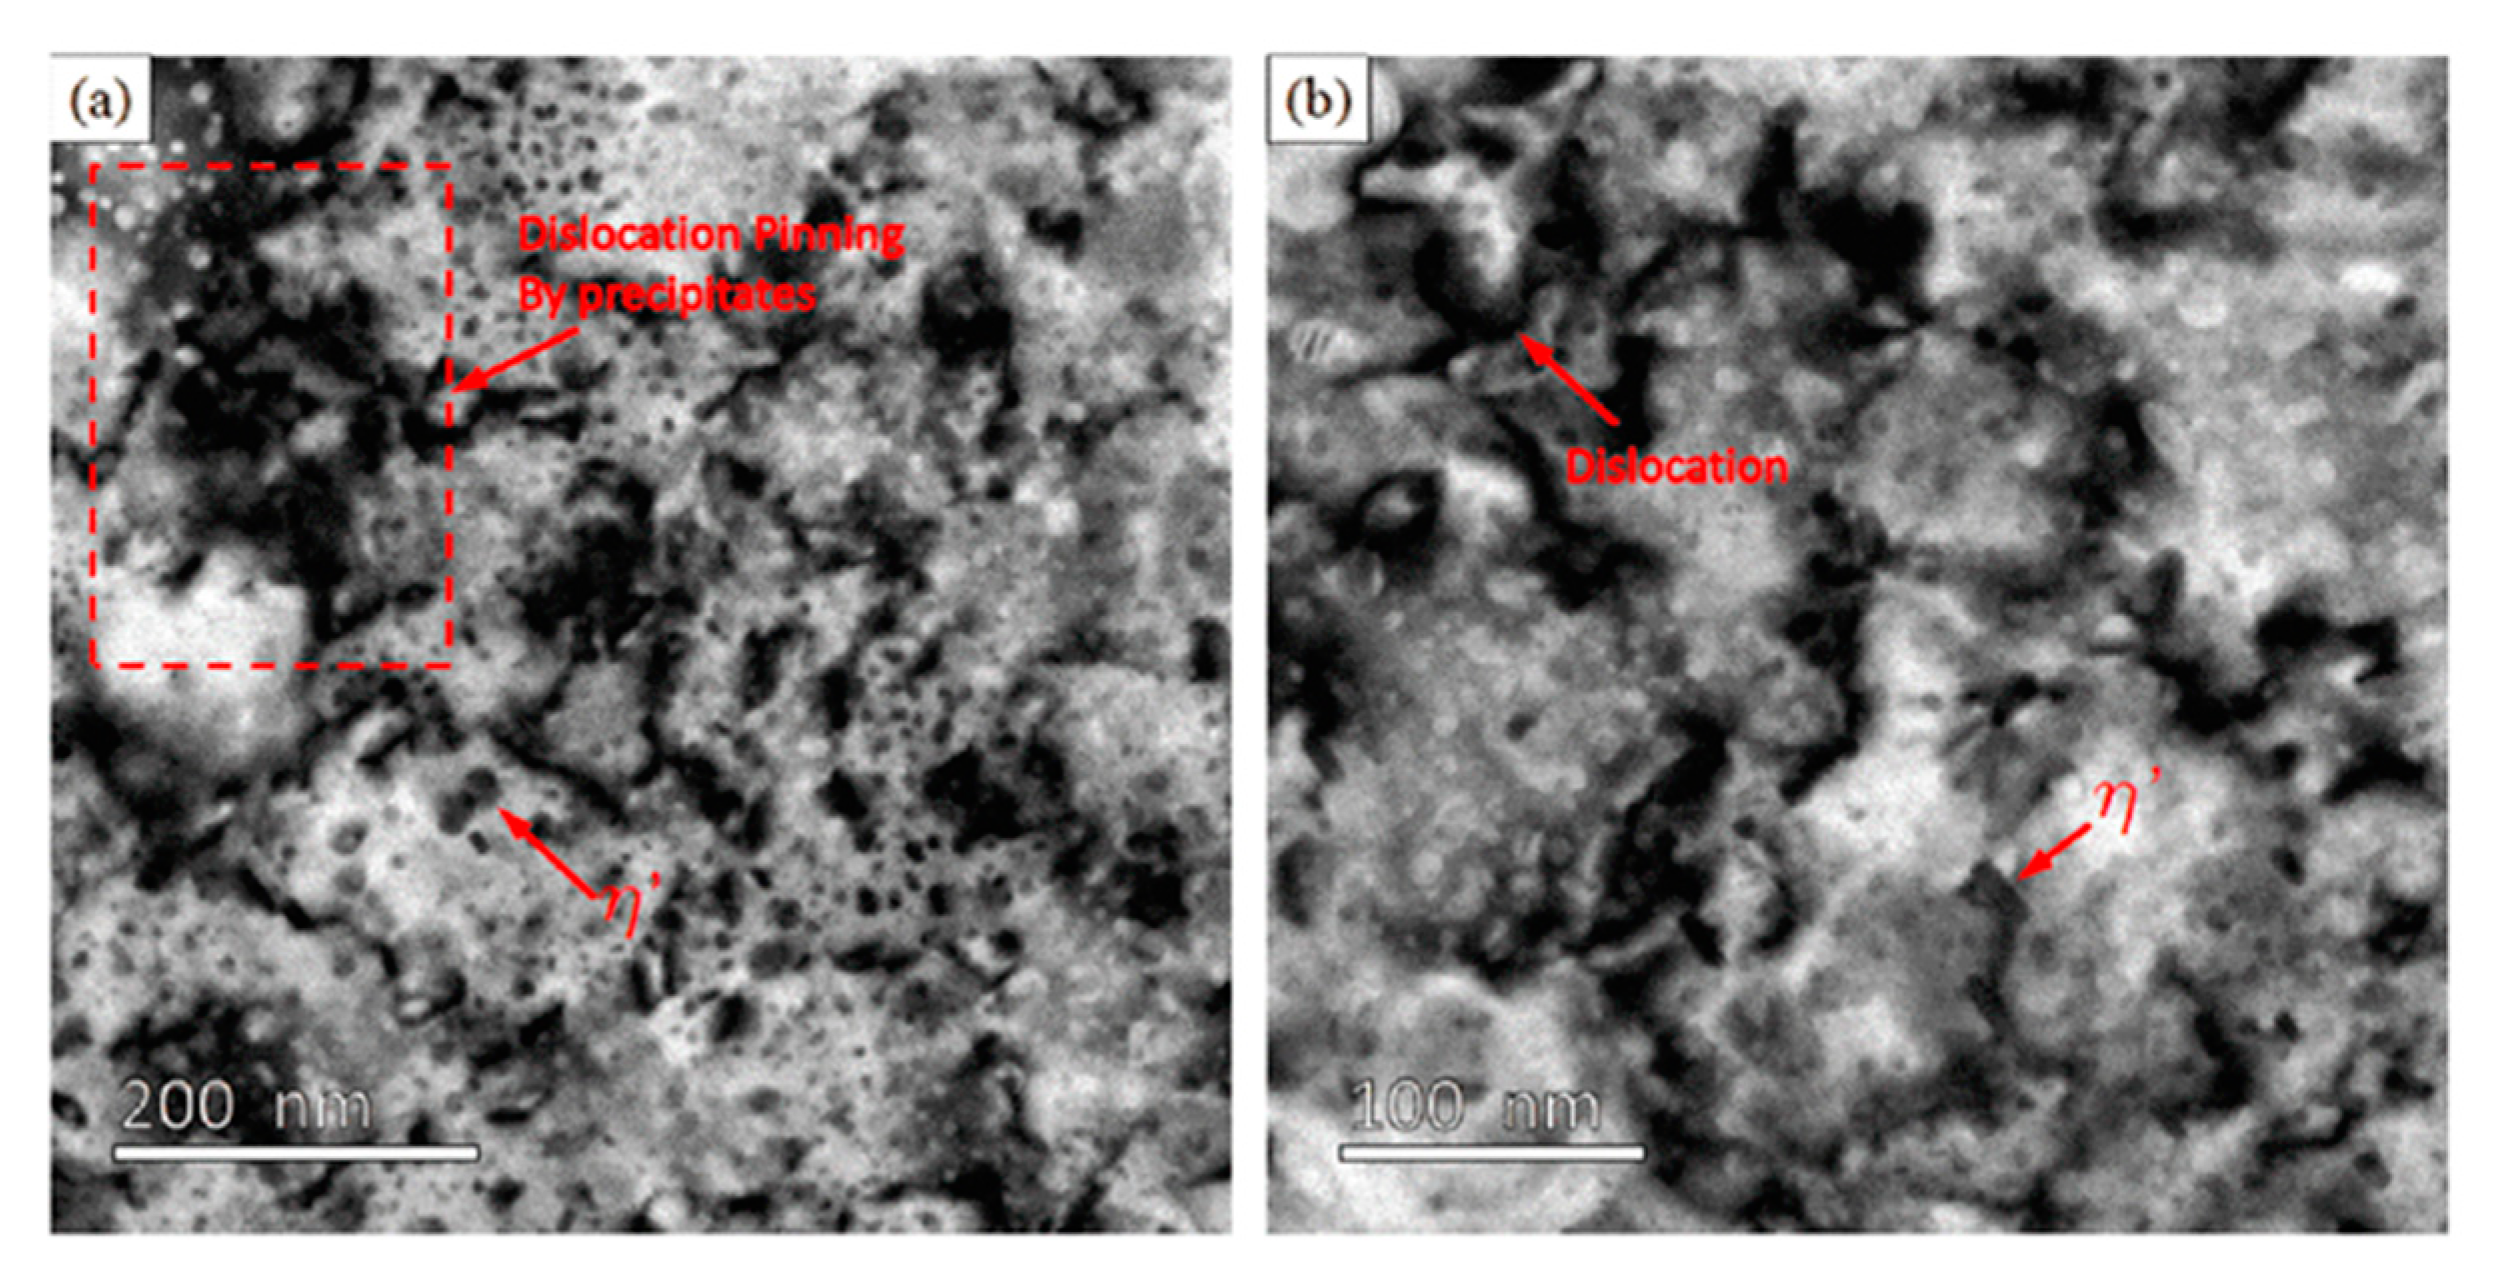
Temperature, stress level and pre-strain considerably influence aging-strengthening during the stress relaxation aging behavior of AA7150-T7751. The improvement of these parameters can promote the coarsening of the η′-precipitate, but the decrease of yield strength is very small, especially compared with the stress-free aging samples. This means that the evolution of precipitates has no significant effect on the stress relaxation behavior in the complex process.
(3)
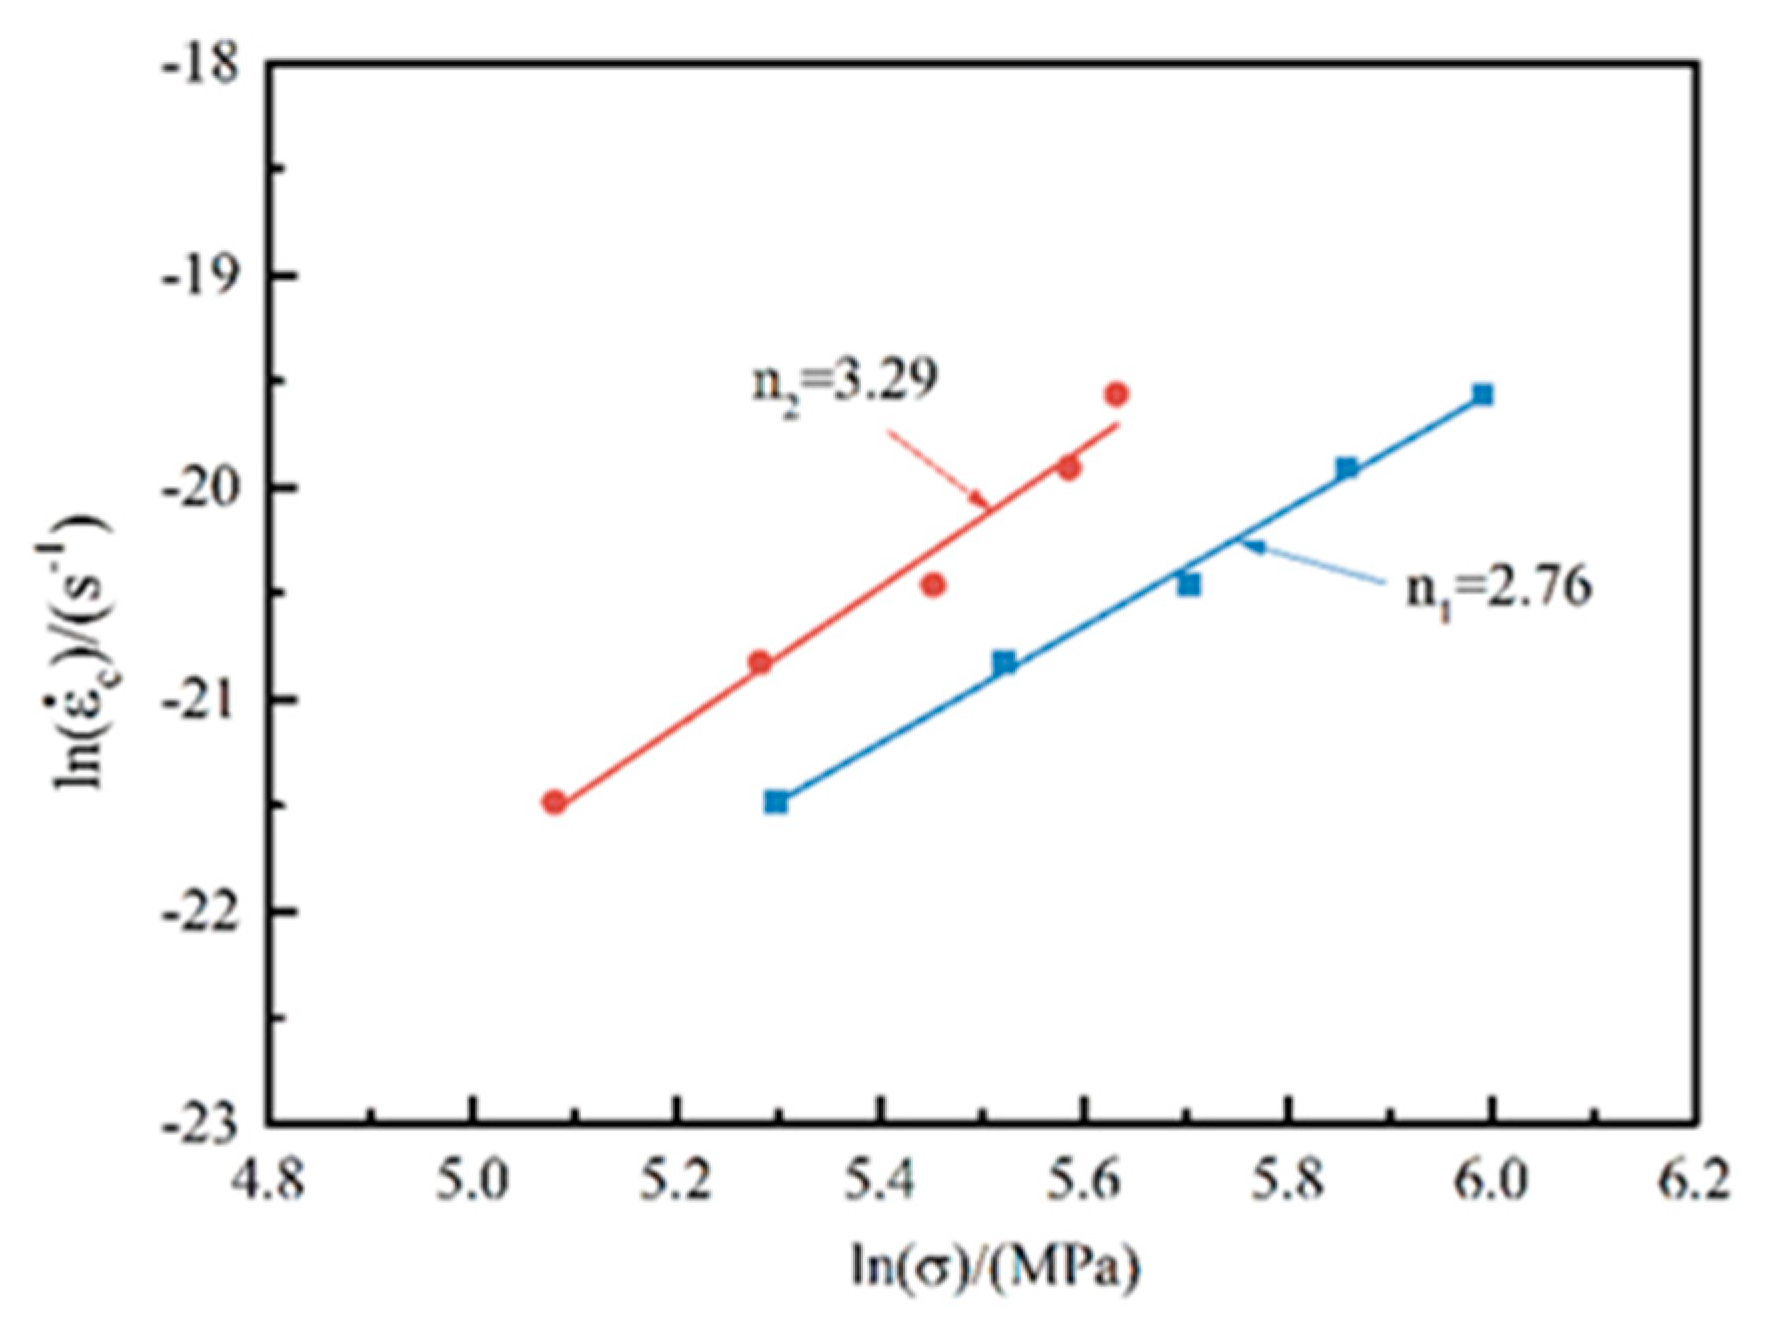
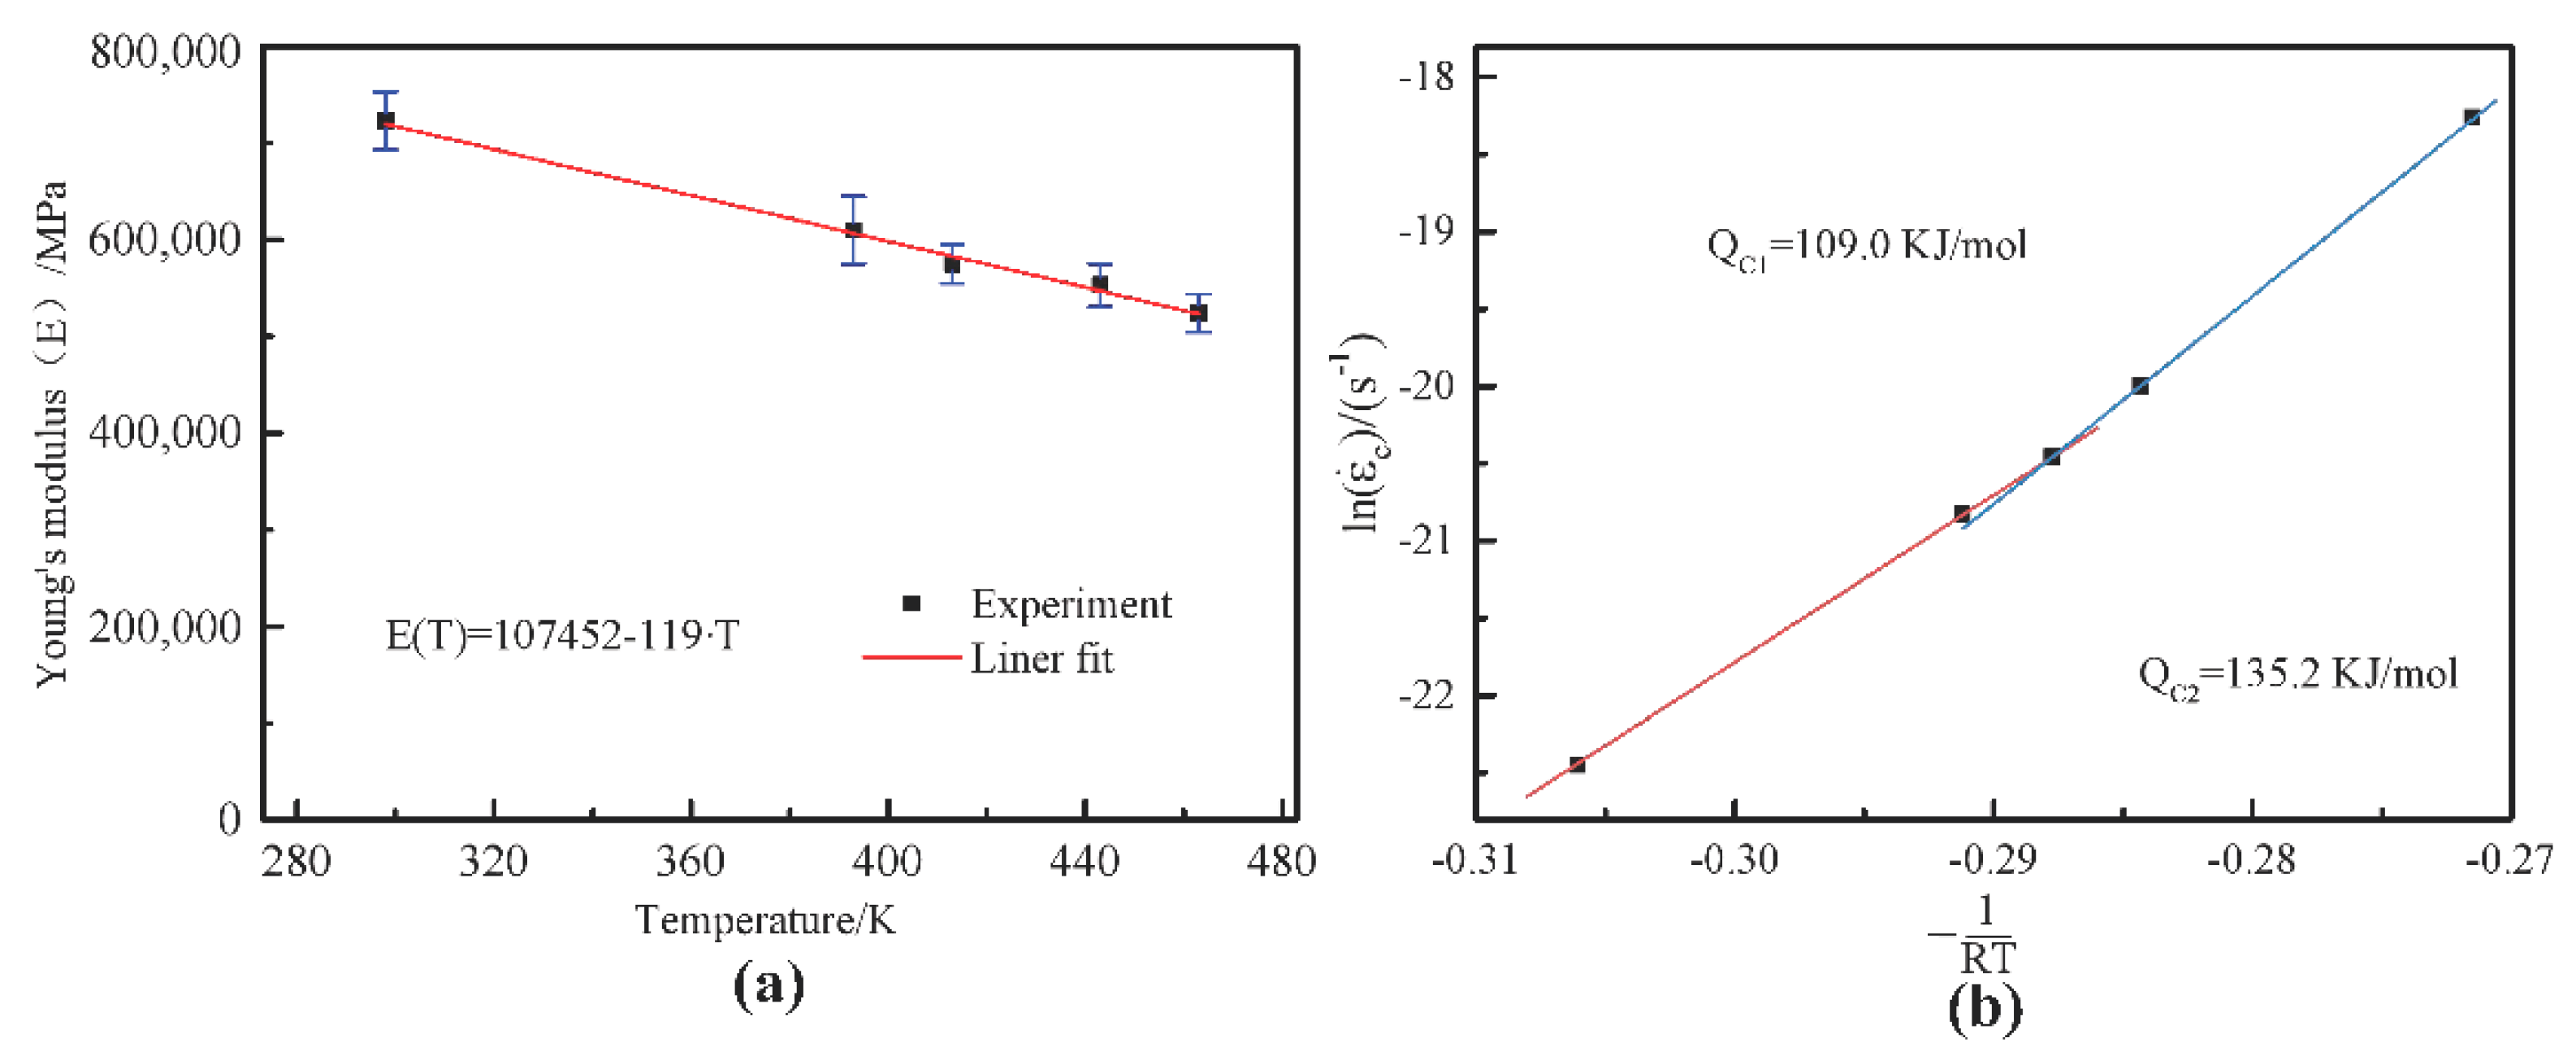
The results of stress index and apparent activation energy show that the stress relaxation deformation mechanism of AA7150-T7751 is mostly dislocation slip at lower temperatures and dislocation climb at higher temperatures. This leads to the intersection phenomenon of stress relaxation curves at different temperatures.
(4)
By introducing the correction formula of apparent activation energy and the formula of dislocation density changing with pre-strain, based on the Orowan model, a stress relaxation constitutive model considering the initial movable dislocation density and temperature-dependent activation energy is established. The average fitting error of a single curve is less than 2%. Not only does this promote the development of stress relaxation constitutive modeling, but it also provides a theoretical basis for the accurate prediction for spring-back of stress relaxation formed AA7150-T7751.

Author Contributions

Y.C. performed the stress relaxation curves and TEM experiments, the theoretical explanation of experimental curves, the establishment of the constitutive model and wrote the data; L.Z. performed the design of the work; Y.X. analyzed the data; C.L., J.W., X.Z., L.X., C.T., G.J., Q.W. and M.H., L.H. contributed reagents/materials/analysis tools; L.H. made effort to investigate.

Funding

This work is supported by National key R&D Program of China (2017YFB0306300); National Natural Science Foundation of China (No. 51601060); National Science and Technology Major Project of China (No. 2017ZX04005001); National Defense Program of China (JCKY2014203A001); the Fundamental Research Funds for the Central Universities of Central South University (2018zzts478).

Conflicts of Interest

The authors declare no conflict of interest.

References

  1. Holman, M.C. Autoclave age forming large aluminum aircraft panels. J. Mech. Work. Technol. 1989, 20, 477–488. [Google Scholar] [CrossRef]
  2. Ho, K.C.; Lin, J.; Dean, T.A. Modelling of spring-back in creep forming thick aluminum sheets. Int. J. Plast. 2004, 20, 733–751. [Google Scholar] [CrossRef]
  3. Jeunechamps, P.P.; Ho, K.; Lin, J.; Ponthot, J.P.; Dean, T. A closed form technique to predict spring-back in creep age-forming. Int. J. Mech. Sci. 2006, 48, 621–629. [Google Scholar] [CrossRef]
  4. Zhan, L.; Lin, J.; Dean, T.A.; Huang, M. Experimental studies and constitutive modelling of the hardening of aluminium alloy 7055 under creep age forming conditions. Int. J. Mech. Sci. 2011, 53, 595–605. [Google Scholar] [CrossRef]
  5. Zheng, J.-H.; Pan, R.; Li, C.; Zhang, W.; Lin, J.; Davies, C.M. Experimental investigation of multi-step stress-relaxation-ageing of 7050 aluminium alloy for different pre-strained conditions. Mater. Sci. Eng. 2018, 710, 111–120. [Google Scholar] [CrossRef]
  6. Ashby, M.F. A first report on deformation-mechanism maps. Acta Metall. 1972, 20, 887–897. [Google Scholar] [CrossRef]
  7. Xu, Y.; Yang, L.; Zhan, L.; Yu, H.; Huang, M. Creep Mechanisms of an Al–Cu–Mg Alloy at the Macro- and Micro-Scale: Effect of the S’/S Precipitate. Materials 2019, 12, 2907. [Google Scholar] [CrossRef] [PubMed]
  8. Lei, C.; Li, H.; Fu, J.; Bian, T.J.; Zheng, G.W. Non-isothermal creep aging behaviors of an Al-Zn-Mg-Cu alloy. Mater. Charact. 2018, 144, 431–439. [Google Scholar] [CrossRef]
  9. Kowalewski, Z.L.; Hayhurst, D.R.; Dyson, B.F. Mechanism-based creep constitutive equations for an aluminium alloy. J. Strain. Anal. 1994, 29, 309–316. [Google Scholar] [CrossRef]
  10. Ho, K.C.; Lin, J.; Dean, T.A. Constitutive modelling of primary creep for age forming an aluminium alloy. J Mater. Process Technol. 2004, 153–154, 122–127. [Google Scholar] [CrossRef]
  11. Zhan, L.; Lin, J.; Dean, T. A review of the development of creep age forming: Experimentation, modelling and applications. Int. J. Mach. Tools Manuf. 2011, 51, 1–17. [Google Scholar] [CrossRef]
  12. Zhang, J.; Deng, Y.; Zhang, X. Constitutive modeling for creep age forming of heat-treatable strengthening aluminum alloys containing plate or rod shaped precipitates. Mater. Sci. Eng. A 2013, 563, 8–15. [Google Scholar] [CrossRef]
  13. Ma, Z.; Zhan, L.; Liu, C.; Xu, L.; Xu, Y.; Ma, P.; Li, J. Stress-level-dependency and bimodal precipitation behaviors during creep ageing of Al-Cu alloy: Experiments and modeling. Int. J. Plast. 2018. [Google Scholar] [CrossRef]
  14. Zheng, J.H.; Lin, J.; Lee, J.; Pan, R.; Li, C.; Davies, C.M. A novel constitutive model for multi-step stress relaxation ageing of a pre-strained 7xxx series alloy. Int. J. Plast. 2018, 106, 31–47. [Google Scholar] [CrossRef]
  15. Orowan, E. Problems of plastic gliding. Proc. Phys. Soc. 1940, 52, 8. [Google Scholar] [CrossRef]
  16. Roters, F. A new concept for the calculation of the mobile dislocation density in constitutive models of strain hardening. Phys. Status Sol. 2003, 240, 68–74. [Google Scholar] [CrossRef]
  17. Park, J.K. Influence of retrogression and reaging treatments on the strength and stress corrosion resistance of aluminum alloy 7075-T6. Mater. Sci. Eng. A 1988, 103, 223–231. [Google Scholar] [CrossRef]
  18. Kanno, M.; Araki, I.; Cui, Q. Precipitation behaviour of 7000 alloys during retrogression and reaging treatment. Mater. Sci. Technol. 1994, 10, 599–603. [Google Scholar] [CrossRef]
  19. Sha, G.; Cerezo, A. Early-stage precipitation in Al–Zn–Mg–Cu alloy (7050). Acta Mater. 2004, 52, 4503–4516. [Google Scholar] [CrossRef]
  20. Fan, X.G.; Jiang, D.M.; Meng, Q.C.; Xian, H.Z.; Li, N.K. Influence of Ageing Treatment on Microstructure and Properties of 7150 Alloy. Mater. Sci. Forum 2007, 546–549, 849–854. [Google Scholar] [CrossRef]
  21. Yang, Y.L. Effect of pre-deformation on creep age forming of AA2219 plate: Springback, microstructures and mechanical properties. J. Mater. Process Technol. 2016, 229, 697–702. [Google Scholar] [CrossRef]
  22. Csanádi, T.; Chinh, N.Q.; Gubicza, J. Plastic behavior of fcc metals over a wide range of strain: Macroscopic and microscopic descriptions and their relationship. Acta Mater. 2011, 59, 2385–2391. [Google Scholar] [CrossRef]
  23. Marlaud, T.; Deschamps, A.; Bley, F.; Lefebvre, W.; Baroux, B. Influence of alloy composition and heat treatment on precipitate composition in Al–Zn–Mg–Cu alloys. Acta Mater. 2010, 58, 248–260. [Google Scholar] [CrossRef]
  24. Kassner, M.E. Fundamentals of Creep in Metals and Alloys; Butterworth Heinemann: Oxford, UK, 2015. [Google Scholar]
  25. Poirier, J. Creep of Crystals: High-Temperature Deformation Processes in Metals, Ceramics and Minerals; Cambridge Earth Science Series; Cambridge University Press: New York, NY, USA, 1985. [Google Scholar]
  26. Jeong, C.Y.; Nam, S.W.; Ginsztler, J. Activation processes of stress relaxation during hold time in 1Cr–Mo–V steel. Mater. Sci. Eng. A 1999, 264, 188–193. [Google Scholar] [CrossRef]
  27. Sket, F.; Dzieciol, K.; Isaac, A.; Borbely, A.; Pyzalla, A.R. Tomographic method for evaluation of apparent activation energy of steady-state creep. Mater. Sci. Eng. A 2010, 527, 2112–2120. [Google Scholar] [CrossRef]
  28. Davies, C.K. Introduction to creep. Int. Mater. Rev. 1994, 3, 123. [Google Scholar] [CrossRef]
  29. Chen, J.F.; Jiang, J.T.; Zhen, L.; Shao, W.Z. Stress relaxation behavior of an Al–Zn–Mg–Cu alloy in simulated age-forming process. J. Mater. Process Technol. 2014, 214, 775–783. [Google Scholar] [CrossRef]
  30. Mostafa, M.M.; Al-Ganainy, G.S.; El-Khalek, A.M.A.; Nada, R.H. Steady-state creep and creep recovery during transformation in Al–Zn alloys. Physica B 2003, 336, 402–409. [Google Scholar] [CrossRef]
  31. Montes, J.M.; Cuevas, F.G.; Cintas, J.; Ternero, F.; Caballero, E.S. Phenomenological equation for the thermal dependence of the activation energy of creep. Mater. Lett. 2017, 196, 273–275. [Google Scholar] [CrossRef]
  32. Frost, H.J.; Ashby, M.F. Deformation-Mechanism Maps: The Plasticity and Creep of Metals and Ceramics; Pergamon Press: Oxford, UK, 1982. [Google Scholar]
  33. Estrin, Y.; Mecking, H. A unified phenomenological description of work hardening and creep based on one-parameter models. Acta Metall. 1984, 32, 57–70. [Google Scholar] [CrossRef]
  34. Mecking, H.; Styczynski, A.; Estrin, Y. Steady State and Transient Plastic Flow of Aluminium and Aluminium Alloys. Strength Metals Alloys 1989, 2, 989–994. [Google Scholar]
  35. Chinh, N.Q.; Illy, J.; Horita, Z.; Langdon, T.G. Using the stress-strain relationships to propose regions of low and high temperature plastic deformation in aluminum. Mater. Sci. Eng. A 2005, 410–411, 234–238. [Google Scholar] [CrossRef]
  36. Basirat, M.; Shrestha, T.; Potirniche, G.P.; Charit, I.; Rink, K. A study of the creep behavior of modified 9Cr–1Mo steel using continuum-damage modeling. Int. J. Plast. 2012, 37, 95–107. [Google Scholar] [CrossRef]
Figure 1. Specimen geometry (dimensions are in mm).
Metals 09 01215 g001
Figure 2. (a) Stress relaxation curves; (b) a partial enlargement of (a); (c) stress relaxation rate curves for 16 h under 120 °C, 140 °C, 145 °C, 150 °C and 170 °C, respectively.
Metals 09 01215 g002
Figure 3. Stress relaxation curves (a), stress relaxation rate curves (b) and normalized stress curves (c) under 200 MPa, 250 MPa, 300 MPa, 350 MPa and 400 MPa, respectively.
Metals 09 01215 g003
Figure 4. Stress relaxation curves (a) and stress relaxation rate curves (b) of 0%, 3% and 6% pre-strained samples, respectively.
Metals 09 01215 g004
Figure 5. Yield strength for samples: (a) stress-free-aged at 0 MPa and stress-relaxation-aged at 300 MPa for different times; (b) stress-free-aged at 0 MPa and stress-relaxation-aged at 300 MPa under different temperatures; (c) stress-relaxation-aged at different initial stress levels; (d) before aging, stress-free-aged at 0 MPa and stress-aged at 300 MPa under different pre-strains.
Metals 09 01215 g005
Figure 6. Bright field TEM images in <011> zone axis of Al matrix of samples after 16 h stress relaxation aging treatment: (a) T7751(initial); (b) 300 MPa + 140 °C; (c) 300 MPa + 170 °C;(d) 400 MPa + 140 °C; (e) 6% + 140 °C + 300 MPa; (f) HRTEM image of the GP-zones and η′-precipitate. Please note that, e.g., 6% + 140 °C + 300 MPa indicates the sample was pre-strained to 6% and the initial temperature and initial stress for SRA are 140 °C and 300 MPa.
Metals 09 01215 g006
Figure 7. Variations of “steady-state creep strain rate” with initial stress levels and residual stresses, to determine the stress exponent range of stress relaxation aging with non-pre-strain samples at 140 °C.
Metals 09 01215 g007
Figure 8. (a) Comparison of the predicted (line) and experimental (symbols) of the Young’s modulus curves of AA7150 alloy under different temperatures; (b) apparent activation energy of SRA with temperatures.
Metals 09 01215 g008
Figure 9. (a) and (b) are bright field TEM images of 3% pre-strained samples after 16 h stress relaxation aging treatment with an initial stress of 300 MPa under different magnifications, respectively.
Metals 09 01215 g009
Figure 10. Diagram of stress relaxation behavior and microstructure evolution of AA7150-T7751, considering changes of temperature, initial stress level and pre-strain.
Metals 09 01215 g010
Figure 11. (a) Comparison of the predicted (lines) and experimental (symbols) of the SRA curves of AA7150-T7751 under different conditions; (b) The fitting curves of apparent activation energy and recovery activation energy. (c) The relative newly generated network dislocation density fraction with time. Please note that, e.g., 6% + 140 °C + 300 MPa + 16 h indicates the sample was pre-strained to 6% and the initial temperature and initial stress for 16 h SRA are 140 °C and 300 MPa.
Metals 09 01215 g011
Figure 12. Comparison between the predicted (line) and experimental (symbols) stress relaxation curves of AA7050 during the stress relaxation aging process. (a) Other process conditions in this paper; (b) new conditions. Please note that e.g., 6% + 140 °C + 300 MPa + 16 h indicates the sample was pre-strained to 6% and the initial temperature and initial stress for 16 h SRA are 140 °C and 300 MPa.
Metals 09 01215 g012
Table 1. Main compositional elements of AA7150-T7751, wt.%.
ZnMgCuMnFeSiNiCrTiAl
6.232.881.580.310.150.048<0.010.160.025Bal
Table 2. Stress relaxation aging experiments of the AA7150-T7751.
Case IDPre-Stain (%)Aging Stress (MPa)Aging Temperature (°C)Aging Time (h)
10300120/140/145/150/17016
20200/250/300/350/40014016
30/3/630014016
403001400/1/8/16
Table 3. Material parameters of stress relaxation constitutive model of AA7150-T7751.
f1(-)f2(-)f3(-)f4(-)F5(-)f6(-)
1.76 E+120.02510.320.682.500.40
f7(MPa)f8(-)f9(-)f10(-)f11(-)f12(-)
446.74518.250.16182050.4427
f13(kJ/mol)f14(-)f15(-)---
13.9895.20.4521---

