Article

Mechanical, Thermal, and Acoustic Properties of Aluminum Foams Impregnated with Epoxy/Graphene Oxide Nanocomposites

1
Department of Mechanical Engineering, TEMA, University of Aveiro, 3810-193 Aveiro, Portugal
2
Faculty of Mechanical Engineering, University of Maribor, 2000 Maribor, Slovenia
3
Department of Civil Engineering, University of Aveiro, 3810-193 Aveiro, Portugal
4
Department of Civil Engineering, ISISE, University of Coimbra, 3030-788 Coimbra, Portugal
5
Faculty of Electrical Eng., Mech. Eng. and Naval Architecture, University of Split, 21000 Split, Croatia
*
Author to whom correspondence should be addressed.
Metals 2019, 9(11), 1214; https://doi.org/10.3390/met9111214
Submission received: 9 October 2019 / Revised: 7 November 2019 / Accepted: 9 November 2019 / Published: 12 November 2019
(This article belongs to the Special Issue Cellular Metals: Fabrication, Properties and Applications)

Abstract

:
Hybrid structures with epoxy embedded in open-cell aluminum foam were developed by combining open-cell aluminum foam specimens with unreinforced and reinforced epoxy resin using graphene oxide. These new hybrid structures were fabricated by infiltrating an open-cell aluminum foam specimen with pure epoxy or mixtures of epoxy and graphene oxide, completely filling the pores. The effects of graphene oxide on the mechanical, thermal, and acoustic performance of epoxy/graphene oxide-based nanocomposites are reported. Mechanical compression analysis was conducted through quasi-static uniaxial compression tests at two loading rates (0.1 mm/s and 1 mm/s). Results show that the thermal stability and the sound absorption coefficient of the hybrid structures were improved by the incorporation of the graphene oxide within the epoxy matrix. However, the incorporation of the graphene oxide into the epoxy matrix can create voids inside the epoxy resin, leading to a decrease of the compressive strength of the hybrid structures, thus no significant increase in the energy absorption capability was observed.

1. Introduction

Metal foams have gained special attention in the last years due to their outstanding properties [1]. The first reference to metallic foams is a French patent published in 1925 by Meller; however, its commercialization only started three decades later in the United States of America (USA). After the stagnation period, and with the development of new technologies that allowed the decrease of cost and difficulties in the manufacturing process, there was a boost in their development that is still ongoing [2]. With these recent developments, metal foams have become commercially available in a wide variety of structures [3]. There are many interesting combinations of different properties, such as high stiffness associated with low specific weight or high compression strength combined with good energy absorption efficiency, making them suitable for automotive industry, ship building, aerospace industry, civil engineering, and medicine [1,2,3,4,5]. Thus, it is important to predict their mechanical behavior prior their application. While the behavior of closed-cell foams is difficult to predict, since often, non-regular structures are obtained by the existent manufacturing methods [6], open-cell foams, used mainly for functional applications, frequently present regular structures—therefore, their behavior is easier to estimate [7]. Cellular metals with regular structures have been developed, e.g., open-cell metal foams [8], advanced pore morphology (APM) foam elements [9,10,11], and metal hybrid hollow structures [12], to be used as fillers of thin-walled structures [13]. The low compressive strength of open-cell structures limits their application. In this context, the uprising research of the hybrid structure concept, resulting from filling open-cell structures with stronger materials that provide suitable resistance, has brought new insights in this field [8,14,15] Epoxy-based materials possess competitive advantages, such as high compressive resistance, low cost, and simple processing. However, epoxy materials are characterized by low fracture toughness, poor crack resistance, and brittle fracture under loading [16]. Besides this, epoxy—as many organic materials—presents a risk of high flammability [17]. It is reported that the addition of fillers (or a combination of different fillers) to the epoxy matrix can improve or confer important features to the final product [17]. Among the most commonly used, the following can be pointed out: Phosphorous, nitrogen-based fillers, nanoclays, carbon nanotubes, and graphene-based materials [18]. The inclusion of graphene oxide, a two-dimensional (2D) structure formed by a flat monolayer of carbon atoms arranged in a hexagonal lattice and decorated by a variety of functional groups (such as epoxides, carbonyls, hydroxyls), as well as its reduced form (with no or less oxygen functionalities and recovering the sp2 hybridization configuration), has been the subject of considerable interest and analysis [19]. It is documented that graphene and its derivatives greatly improve the fatigue characteristics and toughness of epoxy resins, as well as induce fire-resistance [20]. Several methods (e.g., ball milling, solvent-assisted, ultrasonication, or surface modification) [20] have been explored for preparation of these type of nanocomposite materials in order to ensure the good dispersion of nanofillers into the polymer matrix. The work herein follows the previous pioneering studies performed by Duarte et al. [8,21], where they evaluated the quasi-static and dynamic crush compressive performance of simple multifunctional hybrid structures based on an open-cell aluminum foam impregnated with polymers (e.g., epoxy resin) and their performance as fillers of square thin-walled tubes. Results demonstrate that the polymer–aluminum hybrid structure stabilizes the tube and prevents the unstable global bending or mixed buckling mode. Studies show that the aluminum foam–epoxy hybrid structure-filled structures are more efficient in terms of crashworthiness [21]. Herein, the graphene oxide at a low content load of 0.25 wt.% was studied as reinforcement of the epoxy matrix, used as a void filler of the open-cell foam. Additionally, its effects on the mechanical, thermal, and acoustic properties were evaluated.

2. Materials and Methods

2.1. Materials

An AlSi7Mg0.3 open-cell foam (OCF) block made of AlSi7Mg0.3 with pore sizes of 10 ppi (pores per inch) fabricated by the replication casting method was supplied by Mayser GmbH & Co. KG (Lindenberg, Germany) (formely M-pore). The OCF was fully filled by the epoxy resin (EP).
A commercial EP resin solvent-free mid-viscosity glue was supplied by company KGK Ltd. (Barilović, Croatia), and when cured at 20 °C for 25 min had a density of 1100 kg/m3, compression strength of 90.4 MPa, bending strength of 38.9 MPa, and tensile strength of 14.8 MP. It was composed of two reagents, component A (polymer) and component B (hardener), and the mixing ratio was A:B = 2:1 (mass ratio) or 9:5 (volume ratio). The component A had a density of 1.12 kg/dm3, while the component B had a density of 1 kg/dm3. Graphene oxide (GO) was acquired from Graphenea Inc. (San Sebastián, Spain) in an aqueous dispersion with 4 mg/mL. The GO sheets had a particle size <10 µm and >95% of GO content was a monolayer (nanometric in thickness). The GO had a carbon content of 49–56% and oxygen content of 41–50%, which was determined by X-ray photoelectron spectroscopy (XPS). Before incorporation in the EP, diluted GO suspension was freeze-dried to be used in powder form.

2.2. Fabrication of the Specimens

The dense pure EP and EP reinforced with the graphene oxide (EP/GO) specimens were prepared by pouring the pure EP or EP/GO mixtures into an empty thin-walled tube. The aluminum foam–epoxy hybrid structure (OCF–EP) and aluminum foam–EP/GO nanocomposite hybrid structure specimens (OCF–EP/GO) were fabricated by pouring the pure EP or EP/GO mixtures into an empty thin-walled tube containing an open-cell aluminum foam specimen (22 × 22 × 25 mm3). The inner surfaces of the thin-walled tubes were previously cleaned, polished, and greased to facilitate the specimen removal. The components A and B were mixed together well at the mass ratio of 2:1. In the case of the EP/GO specimens, the EP component A was first mixed together well with the GO with a mechanical stirrer at 1000 rpm for 1 h. After that, the mixture was submitted for 30 min to an ultrasonic bath and another 1 h to mechanical stirring. Then, component B was added and mixed with a mechanical stirrer at 250 rpm for 10 min to avoid bubble formation, followed by 20 min of degassing under vacuum. The specimens were extracted from the thin-walled tubes after the filler polymer was completely cured (at room temperature for 7 days).
Preliminary uniaxial quasi-static tests at 0.1 mm/s and Vickers hardness were carried out to assess the dispersion of the GO into the EP. For this purpose, three compositions of GO were tested: 0.1, 0.25, and 0.5 wt.%. These concentrations of GO were in the final epoxy (A + B) mixture. Figure 1 shows the fabricated specimens: OCF (Figure 1a), pure EP (Figure 1b), EP/GO (Figure 1c), OCF-EP (Figure 1d), and EP/GO-OCF (Figure 1e).
The densities of the materials were: 105.1 kg/m3 (standard deviation: 2.1 kg/m3), 1105 kg/m3 (standard deviation: 29.7 kg/m3), 1130.3 kg/m3 (standard deviation: 6.1 kg/m3), 1162.4 kg/m3 (standard deviation: 14.3 kg/m3), and 1169.3 kg/m3 (standard deviation: 7.7 kg/m3) for the OCF, EP, EP/GO, OCF–EP, and OCF–EP/GO, respectively.

2.3. Scanning Electron Microscopy and X-ray Micro Computed Tomography Characterisation

To investigate the dispersion of the GO into the EP matrix, scanning electron microscopy (SEM) analysis was applied. The TM 400 Plus (Hitachi, Tokyo, Japan) was used at an accelerating voltage of 15 kV and in backscattering electron mode.
The specimens (22 × 22 × 25 mm3) were analyzed in a micro-computed tomography (µCT) equipment from SkyScan 1275 (Bruker, Belgium) with penetrative X-rays of 80 kV and 125 µA, 1 mm Al filter, in a high resolution mode with a pixel size of 18 µm and 45 ms of exposure time. NRecon (Bruker, Belgium), CTVox (Bruker, Belgium), and CTAn (Bruker, Belgium) softwares were used for slicing, three-dimensional (3D) reconstruction, and morphometric analysis.

2.4. Mechanical Characterisation

Uniaxial compression tests were used to study the quasi-static compressive response of the hybrid structures and the individual components (OCF, EP, and EP/GO). The servo-hydraulic dynamic INSTRON 8801 testing machine (maximum load 50 kN, Instron, Norwood, Massachusetts, USA) and the electro-mechanical RAAGEN testing machine (with maximum load 250 kN, RAAGEN, Ankara, Turkey) were used for quasi-static tests at 0.1 mm/s and 1 mm/s loading rates, respectively. The quasi-static tests were recorded by using a high-resolution video camera. A high cooled middle-wave infrared (IR) thermal camera FLIR SC 5000 [22] was also used to study the deformation and failure modes of the specimens subjected to the loading rate of 1 mm/s. The IR camera detected IR energy emitted from objects, converted it to temperature, and displayed an image of temperature distribution from the specimen surface. Temperature was measured in real time from a fixed distance without contacting the specimen. The load–displacement data were converted to the engineering stress–strain data. The energy absorption density (EAD) and specific energy absorption (SEA) were determined according to the ISO 13314: 2011 [23]. Vickers hardness measurements were carried out on samples using a diamond Vickers indenter Tester HMV-2000 (Shimadzu, Kyoto, Japan) where a 0.025 kgf load was applied for 10 s.

2.5. Thermal and Flammibility/Fire Retarcdancy Characterization

The thermal stability of the EP and EP/GO was assessed by a thermogravimetric (TG) analyzer (TGA-50, Netzsch, Selb, Germany) at a scanning rate of 10 °C/min, in the temperature range of 30–800 °C, under 50 mL/min of synthetic air (80% of N2 and 20% O2). The dynamic scanning calorimetry (DSC) method was used in order to measure cure heat (ΔH). The DSC analysis was carried out using the Perkin Elmer 4000 device (Perkin Elmer, Buckinghamshire, UK). Immediately after adding the hardener, the EP and EP/GO resins were submitted to a heating cycle from 30 to 220 °C with a heat rate of 10 °C/min under nitrogen atmosphere. The thermal conductivity properties were evaluated with the Hot Disk TPS 2500 S instrument (Hot Disk, Gothenburg, Sweden) in the transient mode, at room temperature (20 °C), in accordance with the standards ISO 22007-2.2 [24] and ASTM D7984 [25]. The sensor, a thin nickel foil in a double spiral pattern, which was embedded in between two thin layers of Kapton polyimide protective films, was sandwiched between two identical samples (22 × 22 × 25 mm3). Three measurements were performed for each specimen type. During the measurement, electrical heat current passed through the nickel spiral and created an increase in temperature. The heat generated dissipated through the sample on either side at a rate which depended on the thermal transport characteristics of the material. By recording the temperature versus time with the sensor, these characteristics could accurately be calculated by a computational algorithm based on Hot Disk Thermal analyzer software.
The fire retardancy tests were based on the direct observation of the response of the specimens when subjected to a flame. Each test consisted of applying an ethanol flame to the specimen’s bottom using the set-up in the vertical sample position. A test lasted for 3 s, plus a subsequent application of 3 s if the specimen self-extinguished.

2.6. Acoustic Characterization

The value of the sound absorption coefficient was estimated from measurements made with an impedance tube according to the standard ASTM E 1050 [26]. The cylindrical specimens had a diameter of 37 mm and a height of 22 mm. The tests consisted of placing the specimens at the end of an impedance tube with a diameter of 37 mm [27] and a length of 700 mm. The sound source, an RG noise generator (Wandel & Goltermann, Eningen, Germany) that emits a random noise signal, connected to a loudspeaker, was positioned at the opposite end of the impedance tube. Two microphones were placed inside the tube, separated by 30 mm between the sound source and the specimen, allowing to analyze a frequency range between 115 and 4500 Hz. The measurement allowed calculation of the sound absorption coefficient (α), which refers to the ratio between the amount of sound energy that is dissipated or absorbed by a given material and the sound wave that is passed to the material. The higher the sound absorption coefficient value, the greater the effectiveness of the insulation. Another parameter is the noise reduction coefficient (NRC) indicator, which is the arithmetic mean value of the sound absorption coefficients at frequencies of 250, 500, 1000, and 2000 Hz, and is used to compare and evaluate the performance of commercial materials.

3. Results and Discussion

3.1. Weight Ratio of the Graphene Oxide

In order to assure an uniform dispersion of the GO within the EP, a preliminary study was performed by using quasi-static uniaxial compression and Vickers hardness (HV) tests. For that, three compositions of GO were tested: 0.1 wt.%., 0.25 wt.%., and 0.5 wt.%. Visually, it was observed that until 0.25 wt.%, the dispersion of the GO was satisfactory, with no aggregates observed. Above 0.25 wt.% of GO, the formation of several aggregates was observed and persisted even after vigorous mechanical stirring. Figure 2 shows the average compressive stress–strain curves (Figure 2a) and the HV values (Figure 2b) measured for dense unreinforced EP and reinforced EP with different amounts of GO. Results clearly indicate that the diagram shape of the stress–strain curves of the unreinforced and reinforced EP are similar. The reinforced EP shows an inferior stress–strain behavior when compared to the EP without GO. However, stress–strain curves of the reinforced EP with 0.25 wt.% and 0.5 wt.% are more stable when compared to the unreinforced (pure) EP, in which the first peak stress values are similar (~80 MPa). Furthermore, after the second peak stress, the reinforced EP compositions show a lower decrease in stress in comparison to the unreinforced EP specimens. This could be attributed to the development of pores in the region near to the GO region. The specimen with 0.25 wt.% of GO showed a HV value of 17.7, which is 10% higher than the value 16.1 obtained for the pure EP. The values are in agreement with the one reported by Ho and co-workers [28]. It appears that the GO additions significantly increase the variability in the hardness, since also high standard deviation was observed. The high variability of the hardness may be attributed to the GO dispersion in the polymer matrix, which can affect the final properties. Based on these preliminary results, the 0.25 wt.% of GO was selected as the composition for the specimens in subsequent studies, and is denoted from now on by EP/GO and OCF–EP/GO.

3.2. Microstructure

The representative scanning electron microscopy (SEM) images in Figure 3 show fractured cross-section of the EP and EP/GO specimens, which were obtained by breaking of the frozen specimens under liquid nitrogen. The results show that the GO sheets are well dispersed and randomly oriented within the polymer. No aggregates are visible in the SEM images. As shown in Figure 3a, the fracture surface of the unreinforced EP exhibits low river patterns and a smooth surface. Additionally, the cracks spread randomly, revealing a weak resistance to the crack initiation and propagation within EP. The failure process of unreinforced EP is a typical brittle fracture pattern, as reported by other authors [29]. Contrary, the EP/GO composites exhibit a rougher fracture surface (Figure 3b) and several river patterns, in which numerous and deep cracks can be observed. It seems that a continuous network of the GO was not formed due to the low content of GO. Furthermore, at higher magnification (Figure 3c), the presence of GO agglomerates within the EP matrix is not observed.
The µCT results reveal that the values of the total porosity of OCF–EP/GO and OCF–EP are 0.008% and 0.048%, respectively. Despite that both types of specimens present very low values, the OCF–EP/GO has a higher percentage of total porosity that can be attributed to the formation of the voids in the EP matrix due to the GO. Figure 4 presents a 2D slice and 3D volume rendered image of the OCF–EP/GO hybrid structures, using the NRecon and CTvox, respectively.

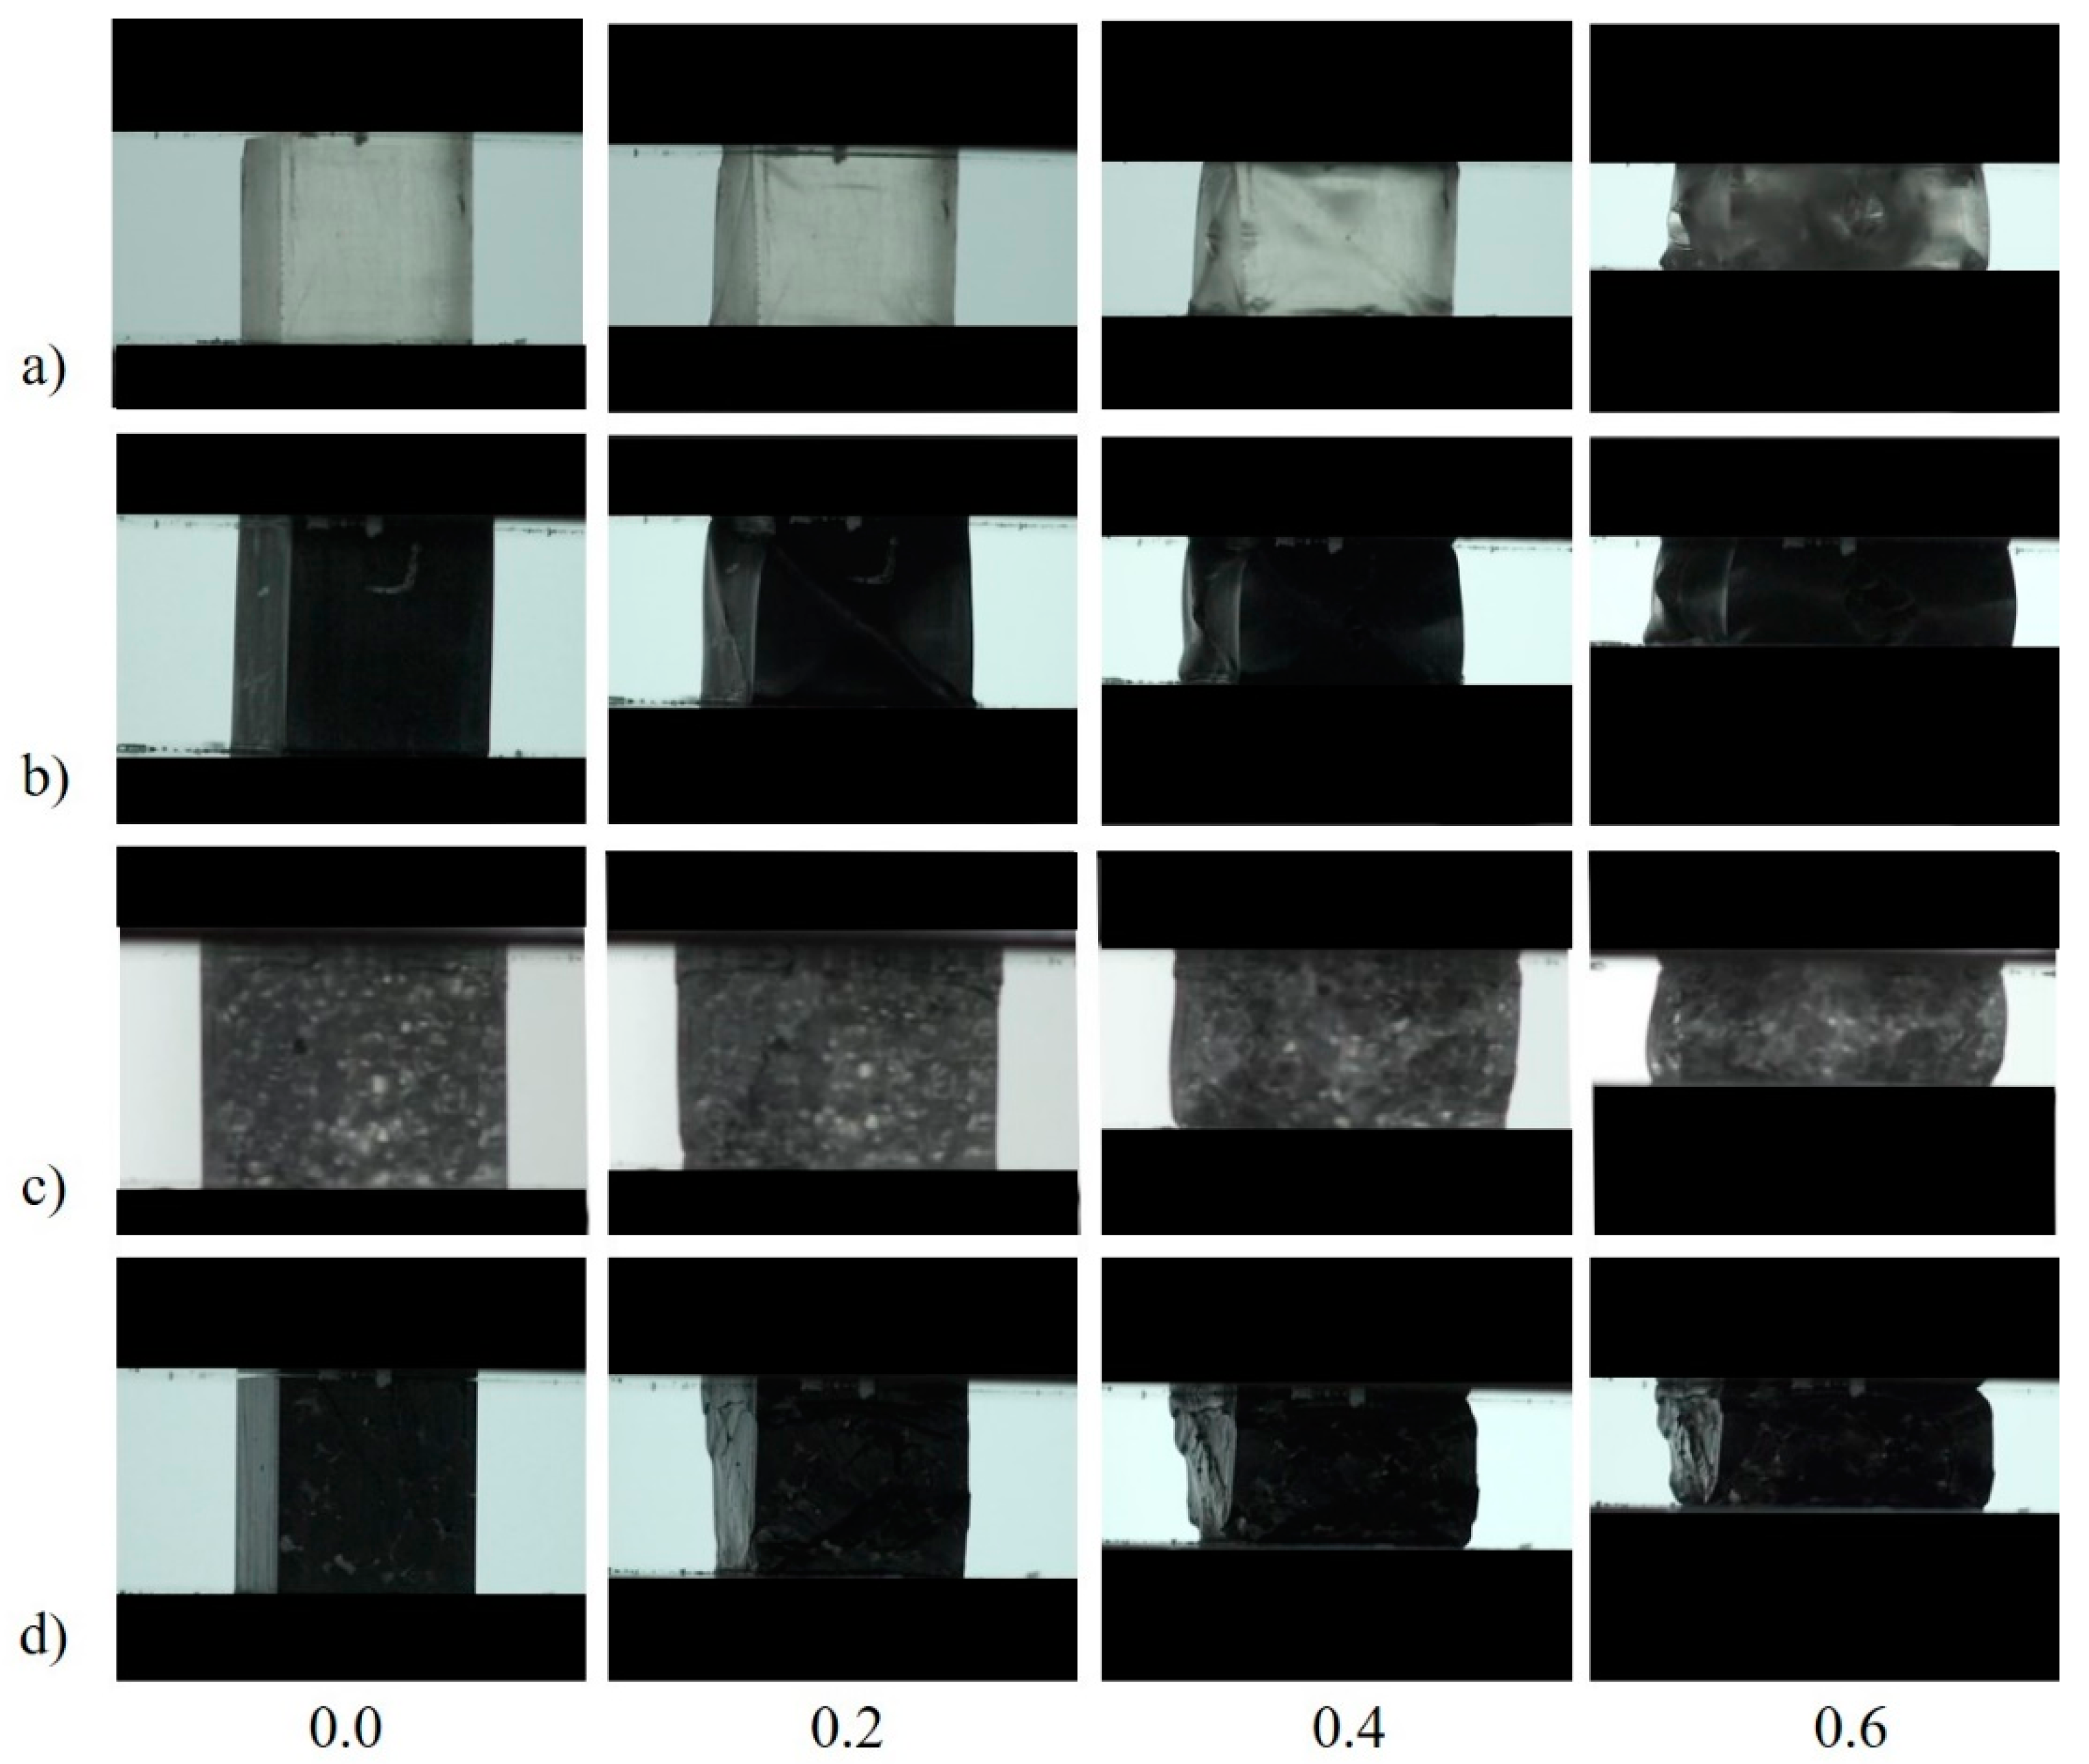
3.3. Mechanical Properties

This study is the continuation of the study conducted by Duarte et al. [8], in which the OCF voids were filled with EP. Herein, however, GO was added to the EP matrix to increase the toughness and provide thermal stability. The EP and EP/GO specimens, as well as their respective hybrid structures (OCF–EP and OCF–EP/GO), were subjected to uniaxial compression loading at two different deformation rates. Figure 5 and Figure 6 show the deformation stages during the quasi-static loading at 0.1 mm/s and 1 mm/s, respectively.
The EP, EP/GO, OCF–EP, and OCF–EP/GO exhibited symmetric deformation, i.e., barreling in the center of the specimen during the slower loading rate (0.1 mm/s). Contrary, at loading rate of 1 mm/s, asymmetric deformation was observed. However, the incorporation of 0.25 wt.% of GO had no significant influence on the deformation mode for both tested velocities. Furthermore, the IR thermography (Figure 7) also allowed to study the deformation and failure modes of the hybrid structures (OCF–EP and OCF–EP/GO) at low crosshead rates (1 mm/s), as it was also confirmed in [30]. The regions subjected to higher strain were located near the metal foam skeleton and the specimens started to fail by development of cracks in the EP matrix. These cracks progressed, and aggravated their amplitude and group until the final failure.
Figure 8 shows the quasi-static compressive stress–strain curves of the tested specimens (EP, EP/GO, OCF–EP, and OCF–EP/GO) subjected to 0.1 mm/s (Figure 8a) and 1 mm/s (Figure 8b).
Quasi-static compressive stress–strain curves (Figure 8a,b) show very similar diagram shapes between EP, EP/GO, OCF–EP, and OCF–EP/GO for both loading rates. The EP and EP/GO specimens, as well as the corresponding hybrid structures (OCF–EP and OCF–EP/GO), do not exhibit a typical metal foam stress–strain behavior. The compressive stress–strain curves of the EP, EP/GO, OCF–EP, and OCF–EP/GO specimens are very similar to the compressive response obtained from the empty aluminum tubes, in-situ closed-cell foam-filled tubes and polymer-open-cell aluminum foam-filled tubes [21,31,32]. The initial quasi-linear elastic region up to the peak stress is followed by a rapid stress drop region to a given minimum value of stress, and then by the stress fluctuation region until the abrupt final densification. These results are also in agreement with the previous results [8], in which the OCF–EP specimens reach high values of the initial peak stress (~75 MPa). The experiments conducted at 0.1 mm/s revealed that the first peak stress values of 82.5 MPa and 78.6 MPa were obtained for strain values of 0.060 and 0.067 for the EP and EP/GO, respectively. It is noteworthy to state that the stress values for the EP are in agreement with those in the literature [8]. The EP is a polymer composed of long carbon chains with strong chemical bonds between the carbon atoms and oxygen (epoxy groups). Thus, the EP is a tough and brittle polymer, resulting in high stress values during loading [33]. The decrease in the peak stress at the incorporation of GO, even at low loading velocity, can be attributed to some voids created in the EP and to the fact that GO can decrease the high crosslinking of the EP chains during curing process. Simultaneously, the strain at the peak stress is higher for the EP/GO, suggesting a higher mobility of molecule chains. The stress–strain behavior of the OCF structure (22 × 22 × 25 mm3) shows a significant lower stiffness (~0.31 MPa), which was already described in [8].
The compressive behavior of the hybrid structures is mainly governed by the filling polymer, EP and EP/GO, since similar profile curves were obtained with and without the OCF. The peak stress values of OCF–EP were 66.21 MPa (0.1 mm/s) and 73.95 MPa (1 mm/s), while the peak stress values of OCF–EP/GO were 77.39 MPa (0.1 mm/s) and 84.25 MPa (1 mm/s). Interestingly, slightly inferior peak stress values were obtained since the OCF structure acts like a defect (confirmed by IR tomography), since the EP has a much higher stiffness than the OCF. In comparison with the OCF, the hybrid structures present a significant increase in strength and a different stress–strain response. Comparing the OCF with the filled ones, an increase of the peak stress of more than 40 times was registered. In the case of the hybrid structures, high peak stresses occurred for low strain rates, followed by a minor decrease in stress until 0.25 of strain, after which the stress started to increase again up to the densification. The decrease after the first peak is related to the initial formation and propagation of cracks, which is a typical behavior of the brittle cured EP. All specimens are strain rate sensitive. Globally, the specimens subjected to 1 mm/s show a higher stiffness in comparison to the ones subjected to 0.1 mm/s.
The energy absorption density (EAD) to strain relationship for the tested specimens is shown in Figure 9. The EAD curves of the hybrid structures were compared to the EAD curves of the pure EP specimens. The EAD curves were calculated by integrating the compressive stress–strain curve from undeformed state up to the strain corresponding to the second stress peak of each test. Specific energy absorption (SEA) was obtained by dividing energy absorption with the mass of each corresponding specimen.
From Figure 9, it can be observed that the EP and EP/GO significantly contribute to the increase of the energy absorption in comparison to the OCF (Figure 9a) and that the increase is linear for all samples at both crosshead rates. The linear energy absorption curves indicate that these hybrid structures are ideal materials to be used as energy absorbers. The hybrid structure specimens present very high energy absorption capacity (Figure 9b) when compared to the OCF, and even if compared to the closed-cell aluminum foam [30]. It can be observed that the polymer filler, either EP or EP/GO, greatly contributes to the increase of the energy absorption capacity of the OCF specimens. However, there is a negligible difference between EP and EP/GO with or without OC skeleton (OCF–EP and OCF–EP/GO). Comparing the materials with and without the OCF, the values of EAD and SEA are similar, which indicates that the mechanical properties are governed by the polymer. However, the higher energy absorption capacity (Figure 9c,d) compensates for the increase in higher mass of the specimens. The incorporation of GO does not reveal a significant increase in the mechanical properties. From the diagrams, it was also observed that the energy absorption capacity is also strongly strain rate sensitive.

3.4. Thermogravimetric Properties

Figure 10 contains the thermogravimetric (TG) and derivative thermogravimetric (DTG) curves of the EP and EP/GO specimens under synthetic air atmosphere. The EP and EP/GO specimens show the typical degradation curve of the EP in air atmosphere, with expected three mass loss steps [34]. Both specimens exhibit similar thermal response, since the plotted curves are practically overlapping and suggesting that the presence of GO did not significantly change the degradation mechanism of the EP matrix and that GO is well mixed within the EP matrix.
The first mass loss was observed between 100–250 °C and represents approximately 20% of its total mass initiated by degradation of the weakest and unstable linkages, oxygen functional groups (hydroxyl, carboxyl, and carbonyl groups), and the unreacted epoxy or any other impurity traces that began to decompose. The unstable oxygen functional groups transformed into CO, CO2, and water vapor. As temperature further increased, the main major mass loss (300–380 °C) occurred in which the DTG peaks are 358 and 354 °C for EP and EP/GO, respectively. This can be attributed to the degradation of the main epoxy chain. The final weight lost, 450–600 °C, can be assigned to the degradation of the skeleton of the carbon atoms. The inclusion of GO 0.25 wt.% increased T50 by 1 °C and decreased T10 by 14 °C (Figure 10). This reduction can be attributed to the defects generated in the EP network caused by possible agglomerated GO sheets (although not observed in the SEM analysis) or weak interaction between GO and the EP (weaker than the crosslinking of the EP monomer). A similar response was detected by Chhetri et al. [35]. However, in the temperature range between 420–520 °C, the thermal stability of the EP/GO was slightly improved in comparison to the EP. This might be attributed to a good dispersion of the GO into the EP matrix, which helped to develop efficient interfacial interaction within the nanocomposites. Furthermore, the high aspect ratio of the GO structure may also serve as barrier to prevent the diffusion of small gaseous molecules produced by the thermal degradation. The residue after 750 °C was less than 1% (0.25% for the EP and 0.30% for the EP/GO), since both specimens decomposed into gas such as CO2 and water vapor.

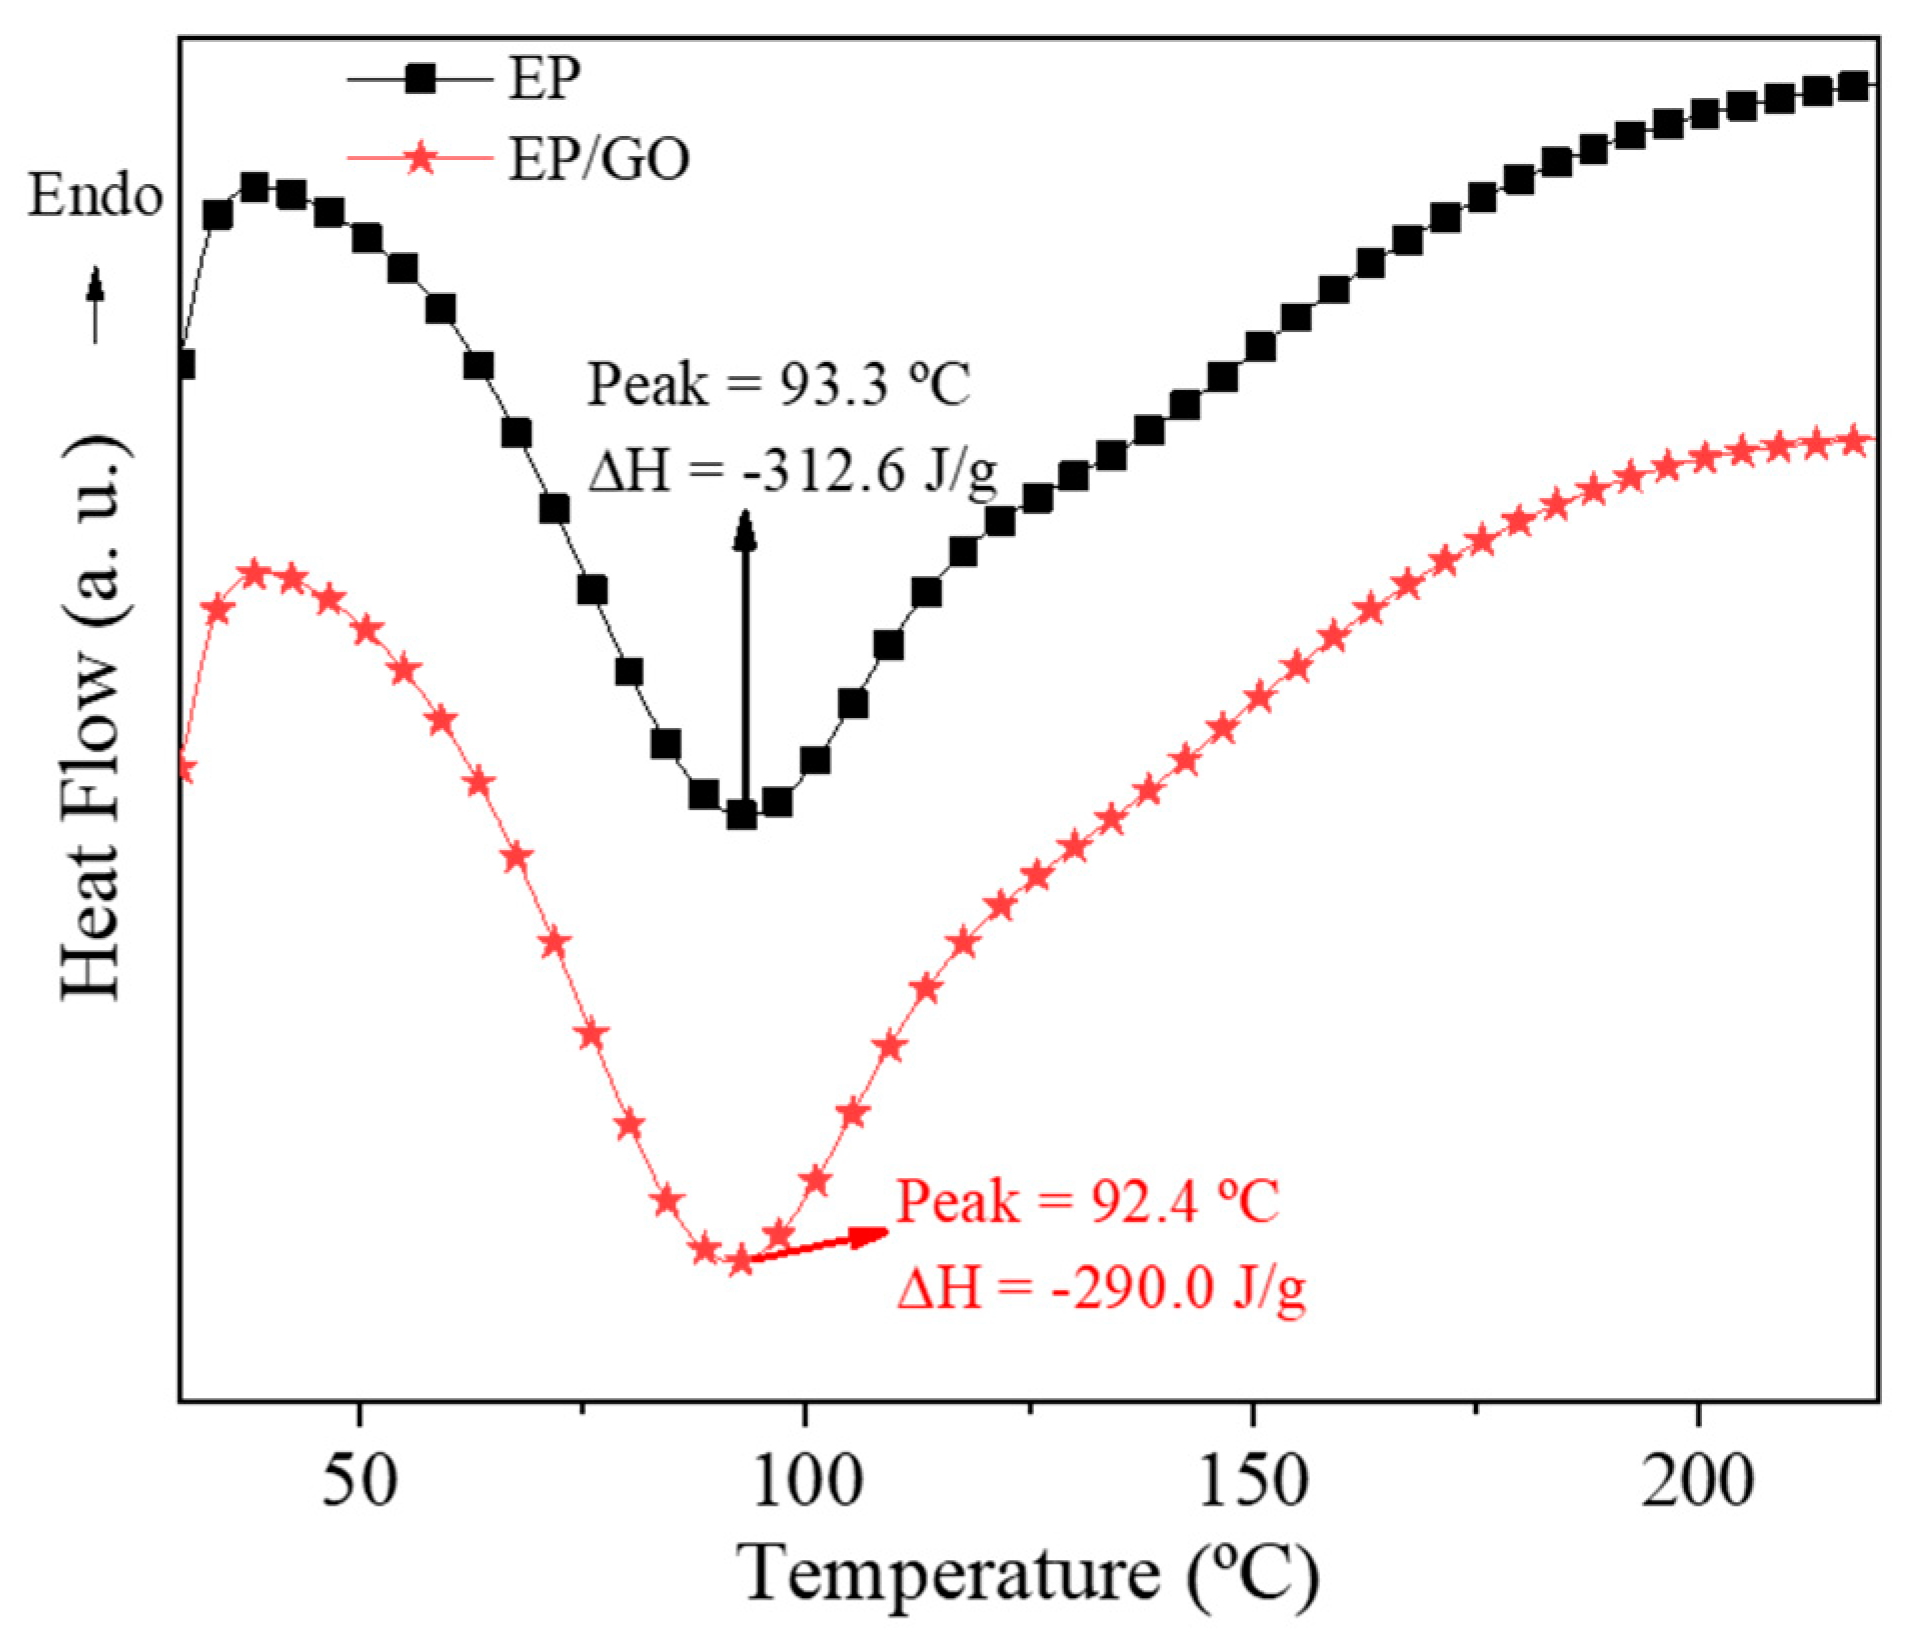
3.5. Calorimetric Properties

Figure 11 shows the DSC heat flow curves obtained for the EP and EP/GO mixtures, immediately after adding the hardener. The heat of reaction (ΔH) was measured from the areas enclosed by the thermograms. During the curing reaction, the epoxy started to polymerize, cross-link, and then harden. The onset curing temperatures for both mixtures were located around 55 °C and the specimens were fully cured at 200 °C. The peak at which the cure reaction happened slightly decreased with the incorporation of GO, from 93.3 °C for EP to 92.4 °C to EP/Go. Although this temperature decrease is less than 1%, it is suggested that GO acts as a catalyst, accelerating the epoxy curing reaction. A similar behavior was observed by Park and Kim [36], where a decrease of 2 °C was found with the incorporation of 0.5 wt.% of graphene nanoplatelets. These authors suggested that the interactions between the amino groups present in EP resin and the remaining hydroxyl groups in graphene nanomaterial are the main reason for the lowering in peak temperature. Regarding the ΔH associated with the cure reactions, the ΔH value decreased from 312.6 for EP to 290.0 J/g for EP/GO, suggesting that GO interferes with the cure reaction of EP. The steric hindrance effect of GO resulting from the high surface area of GO nanosheets could have contributed to the lower cross-linking degree in the EP mixture [37,38]. Galpaya et al. [39] reported declines of 14%, from 137.1 to 117.3 J/g, in ΔH of curing in epoxy matrices with the incorporation of only 0.3 wt.% of GO.

3.6. Thermal Properties

Figure 12 shows the thermal conductivity values of the tested specimens. The thermal conductivity values obtained for the EP specimens (0.20 W/m·K) are in accordance with the values reported in literature (0.15–0.20 W/m·K) [40]. With the incorporation of 0.25 wt.% of GO, a slight increase of approximately 10% relative to the pure EP specimens was observed. The study by Aradhana et al. [41] reported an increase of more than 200% in thermal conductivity with 0.5 wt.% of GO within the EP. An increase of 20% and 90% in thermal conductivity was obtained by Kim et al. [42] for 1 wt.% and 3 wt.%, respectively. Both studies stated the importance and the key role of GO dispersion for the increase of thermal conductivity. SEM analysis can be helpful to understand the reason for a smaller increase of the thermal conductivity in this study. The content of GO used in this work is lower than in the described studies and might be too low to allow the formation of a conductive network that would provide an effective pathway for the phonon movement in the insulator matrix, leading to higher thermal conductivity values. On the other hand, even a low level of GO in the EP could result in the formation of aggregates, due to the high content of oxygen functionalities and ability to form intra/intermolecular bonds that restrict heat transport. Aggregates reduce the aspect ratio, decrease the contact area, and trap or scatter phonons [35]. The thermal conductivity value of the hybrid structures raised up to 0.32 and 0.40 W/m·K without and with GO, respectively. The presence of the interconnected OCF structure facilitated the heat transfer and promoted a substantial increase of approximately 60% in thermal conductivity. The presence of the GO seems to reduce the interfacial resistance and enhance heat flow [43,44]. In this case, the enhancement was approximately 100% compared to the EP/GO.

3.7. Acoustic Properties

The sound absorption coefficient values are represented in Figure 13, displaying the measured values for samples EP, OCF–EP, EP/GO, and OCF–EP/GO. In general, it should be said that the values of sound absorption coefficient registered for all samples are quite low (lower than 0.3) throughout the frequency range, which is attributed to the non-porous and high stiff structure of the EP matrix.
Indeed, when the sound absorption curve determined for the EP sample was analyzed, very low values were registered, generally below 0.05, and with only two small peaks (at 500 Hz and 3500 Hz) exhibiting a value around 0.1. The isolated addition of both the OCF skeleton and of the GO reinforcement seemed to be beneficial in what concerns sound absorption, although with a concentrated effect around the first peak occurring at a lower frequency. Further improvement was obtained when both the OCF skeleton and the GO reinforcement were used (OCF–EP/GO), for which case, a maximum peak around 0.25 at 750Hz was registered, and with higher absorption at a somewhat broader frequency range (values above 0.1 were registered between approximately 500 Hz and 1500 Hz). Interestingly, high frequency sound absorption was very low (below 0.1 in all cases), a behavior that can, once again, be strongly related to the low porosity and high stiffness of all samples. This behavior contrasts with the typical sound absorption of porous and fibrous materials (broadly used in acoustic applications), which may exhibit peak sound absorption values around 1.0, and allow significant high frequency sound absorption (see, for example, the reference book by Cox and d’Antonio [45]).
To better understand the above-described behavior, it is important to bear in mind that sound waves propagate fast in solid materials, but not as much in air and liquids. When the sound wave hits a solid surface, the material vibrates, the molecules that compose the material collide between each other, and the kinetic energy resulting from those collisions is passed from molecule to molecule. The transfer/transmission of energy is higher when molecules are closer to each other and have stronger bonding [5,6]. Chemically, the EP is composed of long carbon chains with very strong chemical bonds between the carbon atoms [33], and therefore lacks in chain mobility and high transmission of energy. The incorporation of GO introduces voids into the EP matrix, increasing the chain mobility, and when the sound propagates through the voids, oscillations of air molecules occur, leading to a frictional loss. Furthermore, the inclusion of GO can contribute to a rougher surface, which also results in a higher sound absorption coefficient. The hybrid structures present a higher sound absorption coefficient, since the OCF structure allows for a higher chain mobility, while in the filling process, some voids are additionally introduced at the metal–polymer interface. The noise reduction potential of cellular metals was studied by Hinze et al. [46] using the impedance method. They demonstrated that the acoustic absorption mainly depends on pore morphology, porosity, and the thickness of the specimen. They reported that the acoustic absorption is only achieved if sound waves can cross through the absorber. The reflection of sound waves from the absorber surface is reduced if the porosity of absorbers is high (80 to 95%). Also, similar sound absorption levels with material containing bigger pores are achieved if the thickness of the absorber is high.

3.8. Fire-Retardant Properties

The EP presents high flammability, as reported in literature [47]. Several authors have focused on the enhancement of polymers’ fire-retardant properties. The incorporation of graphene and its derivatives can improve fire-retardant properties by forming a char layer on the surface of the polymer that avoids or delays the escape of volatiles from the decomposition process by creating a complex path. As such, it reduces the volatiles in gaseous phase available for fire propagation and returns heat back to the surface of the polymer [48,49]. Figure 14 shows the burning behavior of the EP and EP/GO. For the EP specimen, the flame self-extinguishes after 5 s; in the case of EP/GO, the flame self-extinguishes after only 3 s, suggesting a better (flame-retardant) behavior of GO. Due to the fact that GO presents no toxicity or environmental issues, it presents great potential to be one of the most promising fire-retarding fillers for epoxy nanocomposites [36].

4. Conclusions

This work analyzes the influence of graphene oxide (GO) that was carefully dispersed in the epoxy resin (EP) matrix on the mechanical, thermal, and sound absorbing properties. For that purpose, the EP and GO dispersed within the EP (EP–GO) and the hybrid structures, the OCF–EP and OCF–EP/GO (EP and EP–GO infiltrated in the open-cell aluminum foam (OCF)), were fabricated and tested. The motivation of this work was to study the influence of the incorporation of GO within the EP to obtain superior mechanical, thermal, and acoustic properties for advanced multifunctional structures. The main results of the study allow to point out the following conclusions:
  • The EP, EP–GO, and the epoxy–aluminum hybrid structures (OCF–EP and OCF–EP/GO) are sensitive to strain rate.
  • The presence of the EP and EP/GO decreases the oscillations in stress plateau that are usually observed in the OCF, since the shape of the stress–strain diagram is governed by the characteristics of the polymer filler.
  • The presence of the EP increases the compressive strength and energy absorption of the OCF.
  • The use of GO as a reinforcement of the EP matrix decreases the compressive strength at quasi-static uniaxial mechanical tests, thus no significant increase in the energy absorption capability was observed.
  • GO induces thermal stability to the EP, as observed by TGA and fire-retardant tests.
  • The thermal conductivity increases with the addition of GO, and the hybrid structures present even higher thermal conductivity due to the presence of the OCF skeleton.
  • Although the sound absorption of the specimens was low, it was noted that the nanofillers, as well as the aluminum structure, increase the sound absorption coefficient, especially at low frequencies.

Author Contributions

Conceptualization, S.C.P., I.D., P.A.A.P.M., and R.V.; methodology, S.C.P., I.D., P.A.A.P.M., M.V., L.K.-O., and L.G.; formal analysis, S.C.P., I.D., and P.A.A.P.M.; investigation, S.C.P., I.D., P.A.A.P.M., M.V., L.K.-O., L.G., and R.V.; writing—original draft preparation, S.C.P. and I.D.; writing—review and editing, S.C.P., I.D., M.V., R.V., and P.A.A.P.M.; supervision, I.D., P.A.A.P., and R.V.

Funding

This research was funded by the Portuguese Foundation for Science and Technology (FCT) under the grant number SFRH/BD/111515/2015 and the UID/EMS/00481/2019-FCT and CENTRO-01-0145-FEDER-022083—Centro Portugal Regional Operational Programme (Centro2020), under the PORTUGAL 2020 Partnership Agreement, through the European Regional Development Fund. Authors also acknowledge the financial support from the Slovenian Research Agency (research core funding No. P2-0063 and bilateral project (Slovenia – Croatia) No. BI-HR/018-19-012).

Conflicts of Interest

The authors declare no conflict of interest.

References

  1. Banhart, J. Manufacture, characterisation and application of cellular metals and metal foams. Prog. Mater. Sci. 2001, 46, 559–632. [Google Scholar] [CrossRef]
  2. Lefebvre, L.-P.; Banhart, J.; Dunand, D.C. Porous metals and metallic foams: Current status and recent developments. Adv. Eng. Mater. 2008, 10, 775–787. [Google Scholar] [CrossRef]
  3. Duarte, I.; Vesenjak, M.; Vide, M.J. Automated continuous production line of parts made of metallic foams. Metals 2019, 9, 531. [Google Scholar] [CrossRef]
  4. Banhart, J.; Baumeister, J. Production methods for metallic foams. MRS Symp. Proc. 2011, 521, 121–132. [Google Scholar] [CrossRef]
  5. Banhart, J. Metal Foams: Production and stability. Adv. Eng. Mater. 2006, 8, 781–794. [Google Scholar] [CrossRef]
  6. Ulbin, M.; Vesenjak, M.; Borovinšek, M.; Duarte, I.; Higa, Y.; Shimojima, K.; Ren, Z. Detailed analysis of closed-cell aluminum alloy foam internal structure changes during compressive deformation. Adv. Eng. Mater. 2018, 20, 1800164. [Google Scholar] [CrossRef]
  7. Duarte, I.; Peixinho, N.; Andrade-campos, A.; Valente, R. Special issue on cellular materials. Sci. Technol. Mater. 2018, 30, 1–3. [Google Scholar] [CrossRef]
  8. Duarte, I.; Vesenjak, M.; Krstulović-Opara, L.; Ren, Z. Crush performance of multifunctional hybrid structures based on an aluminium alloy open-cell foam skeleton. Polym. Test. 2018, 67, 246–256. [Google Scholar] [CrossRef]
  9. Stöbener, K.; Lehmhus, D.; Avalle, M.; Peroni, L.; Busse, M. Aluminum foam-polymer hybrid structures (APM aluminum foam) in compression testing. Int. J. Solids Struct. 2008, 45, 5627–5641. [Google Scholar] [CrossRef]
  10. Duarte, I.; Vesenjak, M.; Krstulović-Opara, L.; Ren, Z. Compressive performance evaluation of APM (Advanced Pore Morphology) foam filled tubes. Compos. Struct. 2015, 134, 409–420. [Google Scholar] [CrossRef]
  11. Duarte, I.; Ferreira, J.M.F. 2D Quantitative analysis of metal foaming kinetics by hot-stage microscopy. Adv. Eng. Mater. 2014, 16, 33–39. [Google Scholar] [CrossRef]
  12. Friedl, O.; Motz, C.; Peterlik, H.; Puchegger, S.; Reger, N.; Pippan, R. Experimental investigation of mechanical properties of metallic hollow sphere structures. Metall. Mater. Trans. B 2008, 39, 135–146. [Google Scholar] [CrossRef]
  13. Duarte, I.; Krstulović-Opara, L.; Vesenjak, M. Axial crush behaviour of the aluminium alloy in-situ foam filled tubes with very low wall thickness. Compos. Struct. 2018, 192, 184–192. [Google Scholar] [CrossRef]
  14. Ashby, M.F.; Bréchet, Y.J.M. Designing hybrid materials. Acta Mater. 2003, 51, 5801–5821. [Google Scholar] [CrossRef]
  15. Ashby, M.F. Materials Selection in Mechanical Design, 4th ed.; Butterworth-Heinemann: Oxford, UK, 2010. [Google Scholar]
  16. Mia, X.; Zhong, L.; Wei, F.; Zeng, L.; Zhang, J.; Zhang, D.; Xu, T. Fabrication of halloysite nanotubes/reduced graphene oxide hybrids for epoxy composites with improved thermal and mechanical properties. Polym. Test. 2019, 76, 473–480. [Google Scholar] [CrossRef]
  17. Kausar, A.; Rafique, I.; Anwar, Z.; Muhammad, B. Recent developments in different types of flame retardants and effect on fire retardancy of epoxy composite. Polym. Plast. Technol. Eng. 2016, 55, 1512–1535. [Google Scholar] [CrossRef]
  18. Weil, E.D.; Levchik, S. A review of current flame retardant systems for epoxy resins. J. Fire Sci. 2004, 22, 25–40. [Google Scholar] [CrossRef]
  19. Bortz, D.R.; Heras, E.G.; Martin-Gullon, I. Impressive Fatigue life and fracture toughness improvements in graphene oxide/epoxy composites. Macromolecules 2012, 45, 238–245. [Google Scholar] [CrossRef]
  20. Domun, N.; Hadavinia, H.; Zhang, T.; Sainsbury, T.; Liaghat, G.H.; Vahid, S. Improving the fracture toughness and the strength of epoxy using nanomaterials—A review of the current status. Nanoscale 2015, 7, 10294–11329. [Google Scholar] [CrossRef] [PubMed]
  21. Duarte, I.; Krstulović-Opara, L.; Dias-de-Oliveira, J.; Vesenjak, M. Axial crush performance of polymer-aluminium alloy hybrid structure filled tubes. Thin-Walled Struct. 2019, 138, 124–136. [Google Scholar] [CrossRef]
  22. Krstulović-Opara, L.; Vesenjak, M.; Duarte, I.; Ren, Z.; Domazet, Z. A Infrared thermography as a method for energy absorption evaluation of metal foams. Mater. Today Proc. 2016, 3, 1025–1030. [Google Scholar] [CrossRef]
  23. ISO 13314: 2011: Mechanical Testing of Metals—Ductility Testing—Compression Test for Porous and Cellular Metals; International Organization for Standardization: Geneva, Switzerland, 2011.
  24. ISO 22007-2.2. Plastics—Determination of Thermal Conductivity and Thermal Diffusivity—Part 2: Transient Plane Heat Source (Hot Disc) Method; International Organization for Standardization: Geneva, Switzerland, 2008.
  25. ASTM D7984 Standard Test Method for Measurement of Thermal Effusivity of Fabrics Using a Modified Transient Plane Source (MTPS) Instrument Thermal; ASTM International: West Conshohocken, PA, USA, 2016.
  26. ASTM E 1050 Standard Test Method for Impedance and Absorption of Acoustical Materials Using a Tube, Two Microphones and a Digital Frequency Analysis System; ASTM International: West Conshohocken, PA, USA, 2012.
  27. da Silva, J. Experimental Methods for Determining the Sound Absorption Coefficient of Building Materials. Master’s Thesis, University of Coimbra, Coimbra, Portugal, 2008. [Google Scholar]
  28. Ho, M.-W.; Lam, C.-K.; Lau, K.; Ng, D.H.L.; Hui, D. Mechanical properties of epoxy-based composites using nanoclays. Compos. Struct. 2006, 75, 415–421. [Google Scholar] [CrossRef]
  29. Tang, J.; Zhou, H.; Liang, Y.; Shi, X.; Yang, X.; Zhang, J. Properties of graphene oxide/epoxy resin composites. J. Nanomater. 2014, 2014, 696859. [Google Scholar] [CrossRef]
  30. Krstulović-Opara, L.; Surjak, M.; Vesenjak, M.; Tonković, Z.; Kodvanj, J.; Domazet, Z. Comparison of infrared and 3D digital image correlation techniques applied for mechanical testing of materials. Infrared Phys. Technol. 2015, 73, 166–174. [Google Scholar] [CrossRef]
  31. Duarte, I.; Krstulović-Opara, L.; Vesenjak, M. Characterisation of aluminium alloy tubes filled with aluminium alloy integral-skin foam under axial compressive loads. Compos. Struct. 2015, 121, 154–162. [Google Scholar] [CrossRef]
  32. Duarte, I.; Vesenjak, M.; Krstulović-Opara, L.; Ren, Z. Static and dynamic axial crush performance of in-situ foam-filled tubes. Compos. Struct. 2015, 124, 128–139. [Google Scholar] [CrossRef]
  33. Park, Y.T.; Qian, Y.; Chan, C.; Suh, T.; Nejhad, M.G.; Macosko, C.W.; Stein, A. Epoxy toughening with low graphene loading. Adv. Funct. Mater. 2015, 25, 575–585. [Google Scholar] [CrossRef]
  34. Ma, S.; Liu, W.; Hu, C.; Wang, Z.; Tang, C. Toughening of epoxy resin system using a novel dendritic polysiloxane. Macromol. Res. 2010, 18, 392–398. [Google Scholar] [CrossRef]
  35. Chhetri, S.; Adak, N.C.; Samanta, P.; Murmu, N.C.; Kuila, T. Functionalized reduced graphene oxide/epoxy composites with enhanced mechanical properties and thermal stability. Polym. Test. 2017, 63, 1–11. [Google Scholar] [CrossRef]
  36. Park, J.K.; Kim, D.S. Effects of an Aminosilane and a Tetra-Functional Epoxy on the Physical Properties of Di-Functional Epoxy/Graphene Nanoplatelets Nanocomposites. Polym. Eng. Sci. 2014, 54, 969–976. [Google Scholar] [CrossRef]
  37. Teng, C.; Ma, C.M.; Lu, C.; Yang, S.; Lee, S.; Hsiao, M.; Yen, M.; Chiou, K.; Lee, T. Thermal Conductivity and Structure of Non-Covalent Functionalized Graphene/Epoxy Composites. Carbon 2011, 49, 5107–5116. [Google Scholar] [CrossRef]
  38. Prolongo, M.G.; Salom, C.; Sanchez-Cabezudo, C.A.M.; Masegosa, R.M.; Prolongo, S.G. Influence of Graphene Nanoplatelets on Curing and Mechanical Properties of Graphene/Epoxy Nanocomposites. J. Therm. Anal. Calorim. 2016, 125, 629–636. [Google Scholar] [CrossRef] [Green Version]
  39. Galpaya, D.; Wang, M.; George, G.; Motta, N.; Waclawik, E.; Yan, C. Preparation of Graphene Oxide/Epoxy Nanocomposites with Significantly Improved Mechanical Properties. J. Appl. Phys. 2014, 116, 53518. [Google Scholar] [CrossRef] [Green Version]
  40. Dixon, C.; Strong, M.R.; Zhang, S.M. Transient plane source technique for measuring thermal properties of silicone materials used in electronic assemblies. Int. Microelectron. Packag. Soc. 2000, 23, 494–500. [Google Scholar]
  41. Aradhana, R.; Mohanty, S.; Nayak, S.K. Comparison of mechanical, electrical and thermal properties in graphene oxide and reduced graphene oxide filled epoxy nanocomposite adhesives. Polymer (Guildf) 2018, 141, 109–123. [Google Scholar] [CrossRef]
  42. Kim, J.; Yim, B.; Kim, J.; Kim, J. The Effects of Functionalized Graphene Nanosheets on the Thermal and Mechanical Properties of Epoxy Composites for Anisotropic Conductive Adhesives (ACAs). Microelectron. Reliab. 2012, 52, 595–602. [Google Scholar] [CrossRef]
  43. He, X.; Huang, Y.; Liu, Y.; Zheng, X.; Kormakov, S.; Sun, J.; Zhuang, J.; Gao, X.; Wu, D. Improved thermal conductivity of polydimethylsiloxane/short carbon fiber composites prepared by spatial confining forced network assembly. J. Mater. Sci. 2018, 53, 14299–14310. [Google Scholar] [CrossRef]
  44. Zhang, Y.-F.; Ren, Y.-J.; Guo, H.-C.; Bai, S. Enhanced thermal properties of PDMS composites containing vertically aligned graphene tubes. Appl. Therm. Eng. 2019, 150, 840–848. [Google Scholar] [CrossRef]
  45. Cox, T.; d’Antonio, P. Acoustic Absorbers and Diffusers: Theory, Design and Application; CRC Press: Boca Raton, FL, USA, 2016. [Google Scholar]
  46. Hinze, B.; Rösler, J.; Lippitz, N. Noise reduction potential of cellular metals. Metals 2012, 2, 195–201. [Google Scholar] [CrossRef] [Green Version]
  47. Yu, B.; Shi, Y.; Yuan, B.; Qiu, S.; Xing, W.; Hu, W.; Song, L.; Lo, S.; Hu, Y. Enhanced thermal and flame retardant properties of flame-retardant-wrapped graphene/epoxy resin nanocomposites. J. Mater. Chem. A 2015, 3, 8034–8044. [Google Scholar] [CrossRef]
  48. Hamdani, S.; Longuet, C.; Perrin, D.; Lopez-Cuesta, J.-M.; Ganachaud, F. Flame retardancy of silicone-based materials. Polym. Degrad. Stab. 2009, 94, 465–495. [Google Scholar] [CrossRef]
  49. Sang, B.; Li, Z.; Li, X.; Yu, L.; Zhang, Z. Graphene-based flame retardants: A review. J. Mater. Sci. 2016, 51, 8271–8395. [Google Scholar] [CrossRef]
Figure 1. Fabricated specimens (22 × 22 × 25 mm3): (a) Open-cell foam (OCF), (b) epoxy resin (EP), (c) EP/graphene oxide (GO), (d) OCF–EP and (e) OCF–EP/GO.
Metals 09 01214 g001
Figure 2. Quasi-static compressive stress–strain curves (a) and Vickers hardness (VH) (b) of the unreinforced EP and reinforced EP with different compositions of GO.
Metals 09 01214 g002
Figure 3. SEM images of the EP (magnification factor: 1000) (a) and EP/GO matrices (magnification factor: 1000 (b) and 2000 (c)).
Metals 09 01214 g003
Figure 4. Micro-computed tomography images: (a) Two-dimensional (2D) slice and (b) three-dimensional (3D) volume rendering of OCF–EP/GO.
Metals 09 01214 g004
Figure 5. The quasi-static deformation (0.1 mm/s) sequences showing the progressive deformation of the: (a) EP, (b) EP/GO, (c) OCF–EP, and (d) OCF–EP/GO.
Metals 09 01214 g005
Figure 6. The quasi-static deformation (1 mm/s) deformation sequences showing the progressive deformation of the: (a) EP, (b) EP/GO, (c) OCF–EP, and (d) OCF–EP/GO.
Metals 09 01214 g006
Figure 7. The IR image sequences at different strain increments showing the dynamic progressive deformation of the: (a) OCF–EP and (b) OCF–EP/GO subjected to a crosshead rate of 1 mm/s.
Metals 09 01214 g007
Figure 8. Stress-strain relationship (each curve represents an average of three specimens tested) at different crosshead rates: (a) 0.1 mm/s and (b) 1 mm/s.
Metals 09 01214 g008
Figure 9. Average energy absorption and specific absorption energy capacity at crosshead rate of 0.1 mm/s (a,c) and 1 mm/s (b,d).
Metals 09 01214 g009
Figure 10. Thermograms of the EP and EP/GO matrices.
Metals 09 01214 g010
Figure 11. Dynamic scanning calorimetry (DSC) curves of the EP and EP/GO matrices.
Metals 09 01214 g011
Figure 12. Thermal conductivity of the EP, EP/GO, OCF–EP, and OCF–EP/GO.
Metals 09 01214 g012
Figure 13. Sound absorption coefficient of the OC, EP, EP/GO, OCF–EP, and OCF–EP/GO.
Metals 09 01214 g013
Figure 14. Fire-retardant behavior of the: (a) EP and (b) EP/GO.
Metals 09 01214 g014

