Article

Influence of Solution-Annealing Parameters on the Continuous Cooling Precipitation of Aluminum Alloy 6082

1
Chair of Materials Science, Faculty of Mechanical Engineering and Marine Technology, University of Rostock, Albert Einstein-Str. 2, 18059 Rostock, Germany
2
Competence Centre °CALOR, Department Life, Light & Matter, Faculty of Interdisciplinary Research, University of Rostock, Albert-Einstein-Str. 25, 18059 Rostock, Germany
3
Medical Biology and Electron Microscopy Centre, University Medical Center Rostock, Strempelstraße 14, 18057 Rostock, Germany
4
Chair of Structural Mechanics, Faculty of Mechanical Engineering and Marine Technology, University of Rostock, Albert Einstein-Str. 2, 18059 Rostock, Germany
*
Author to whom correspondence should be addressed.
Metals 2018, 8(4), 265; https://doi.org/10.3390/met8040265
Submission received: 26 February 2018 / Revised: 26 March 2018 / Accepted: 3 April 2018 / Published: 13 April 2018
(This article belongs to the Special Issue Heat Treatment of Aluminum Alloys)

Abstract

:
We use a systematic approach to investigate the influence of the specific solution condition on quench-induced precipitation of coarse secondary phase particles during subsequent cooling for a wide range of cooling rates. Commercially produced plate material of aluminum alloy EN AW-6082 was investigated and the applied solution treatment conditions were chosen based on heating differential scanning calorimetry experiments of the initial T651 condition. The kinetics of the quench-induced precipitation were investigated by in situ cooling differential scanning calorimetry for a wide range of cooling rates. The nature of those quench-induced precipitates was analyzed by electron microscopy. The experimental data was evaluated with respect to the detrimental effect of incomplete dissolution on the age-hardening potential. We show that if the chosen solution temperature and soaking duration are too low or short, the solution treatment results in an incomplete dissolution of secondary phase particles. This involves precipitation during subsequent cooling to start concurrently with the onset of cooling, which increases the quench sensitivity. However, if the solution conditions allow the formation of a complete solid solution, precipitation will start after a certain degree of undercooling, thus keeping the upper critical cooling rate at the usual alloy-specific level.

1. Introduction

The most important heat treatment which allows to increase the strength of several aluminum alloys is the age-hardening heat treatment [1]. Within this heat treatment, solution annealing, which is the generation of a solid solution, establishes the basis for the potential decomposition of solid solutions by quench-induced precipitation and/or supersaturation of the solid solution during subsequent cooling. A fully supersaturated solid solution is the precondition to obtain maximum strength after the final process “aging” step [1,2,3]. If a full solution is obtained during the solution treatment, a complete supersaturation can be achieved by overcritical cooling. If cooling is done “to slow”, “quench-induced” precipitation will occur. Quench-induced precipitation reduces the age-hardening potential by lowering the amount of solutes after cooling (prior to aging). This phenomenon is commonly called quench sensitivity. The upper critical cooling rates (uCCR) required to completely suppress quench-induced precipitation, depend on several aspects, for instance, alloy composition. Thereby, higher concentrations of alloying elements cause higher uCCRs [4,5]. In practical applications, the cooling rates can be adapted by choosing a suitable cooling media [6].
For the solution treatment, lower temperatures and shorter soaking durations are preferable for economic reasons, such as the continuous annealing in sheet and plate production or quenching from extrusion heat. Another example of a very short “solution treatment” occurs in the heat-affected zone of welding processes [7] or in the production of tailored heat-treated pre-products [8,9,10,11]. These short-solution treatments, particularly if they are performed at relatively low temperatures, might end with an incomplete solution. However, incomplete dissolution of the secondary phase particles might lead to reduced time spent for nucleation of the quench-induced precipitation. Thereby incomplete dissolution has the potential to influence quench sensitivity. The solution treatment was kept constant in most quench sensitivity studies. Thus, to the best knowledge of the authors, no recent study exists that systematically varies the solution temperature and soaking duration for investigations of Al-alloy quench sensitivity.
The quench sensitivity, and thus the precipitation behavior during cooling from solution treatment and its kinetics, have been investigated to a great extent in recent years (e.g., in AlMgSi alloys [4,5,12,13,14]). Differential scanning calorimetry (DSC) has proven to be a very helpful method in these investigations, particularly if combined with micro- and nanostructure analyses [4,5,15].
The main objective of this work is to investigate the detrimental effect of incomplete dissolution during the solution treatment within the age-hardening heat treatment of Al alloys with respect to the kinetics of quench-induced precipitation. Therefore, the solution-annealing temperature, as well as the soaking duration, was systematically varied. The solution conditions were chosen based on DSC heating experiments of the initial T651 condition. The precipitation behavior during the cooling of the EN AW-6082 alloy was analyzed by DSC for a wide range of cooling rates. The DSC findings are discussed in comparison with hardness after artificial aging, previous studies, and the observed microstructures, which are analyzed by scanning electron microscopy (SEM) and transmission electron microscopy (TEM).

2. Materials and Methods

2.1. Investigated Aluminum Alloys

The samples were prepared from a 10-mm-thick plate of commercially supplied aluminum alloy, EN AW–6082, in the initial T651 delivery condition. Aluminum wrought alloy EN AW-6082 has been chosen as it is a very widely used age-hardening aluminum alloy. This condition comprises solution treatment, quenching, stress reduction by stretching a controlled amount (1.5–3 % of the plate), and final artificial aging. The chemical composition was analyzed by optical emission spectroscopy (OES). The mass fractions of alloying elements are shown in Table 1.

2.2. Differential Scanning Calorimetry (DSC)

Here, heating and cooling rates in the 0.01–5 K/s range were investigated using two different types of DSC devices. The slower scanning rates (up to 0.1 K/s) were performed in a CALVET-type heat-flux DSC (Setaram DSC 121, Caluire-et-Cuire, France), whereas the faster rates (0.1–5 K/s) were examined in power-compensated DSCs (PerkinElmer Pyris Diamond DSC, PerkinElmer DSC 8500, Waltham, MA, USA). The two DSC device types required different sample geometries. Cylindrical samples with a diameter of 6 mm, a length of 21.65 mm, and a mass of about 1600 mg were used for the measurements in the heat-flux DSC. The samples for the power-compensated DSCs also have a cylindrical shape, but with a diameter of 6.4 mm, a height of 1 mm, and a mass of about 80 mg. The samples were packed in pure aluminum crucibles and then placed in the micro-ovens of the calorimeter. The heating rate to reach the solution-annealing temperature is 0.1 K/s in the heat-flux DSC and 2 K/s in the power-compensated DSCs.

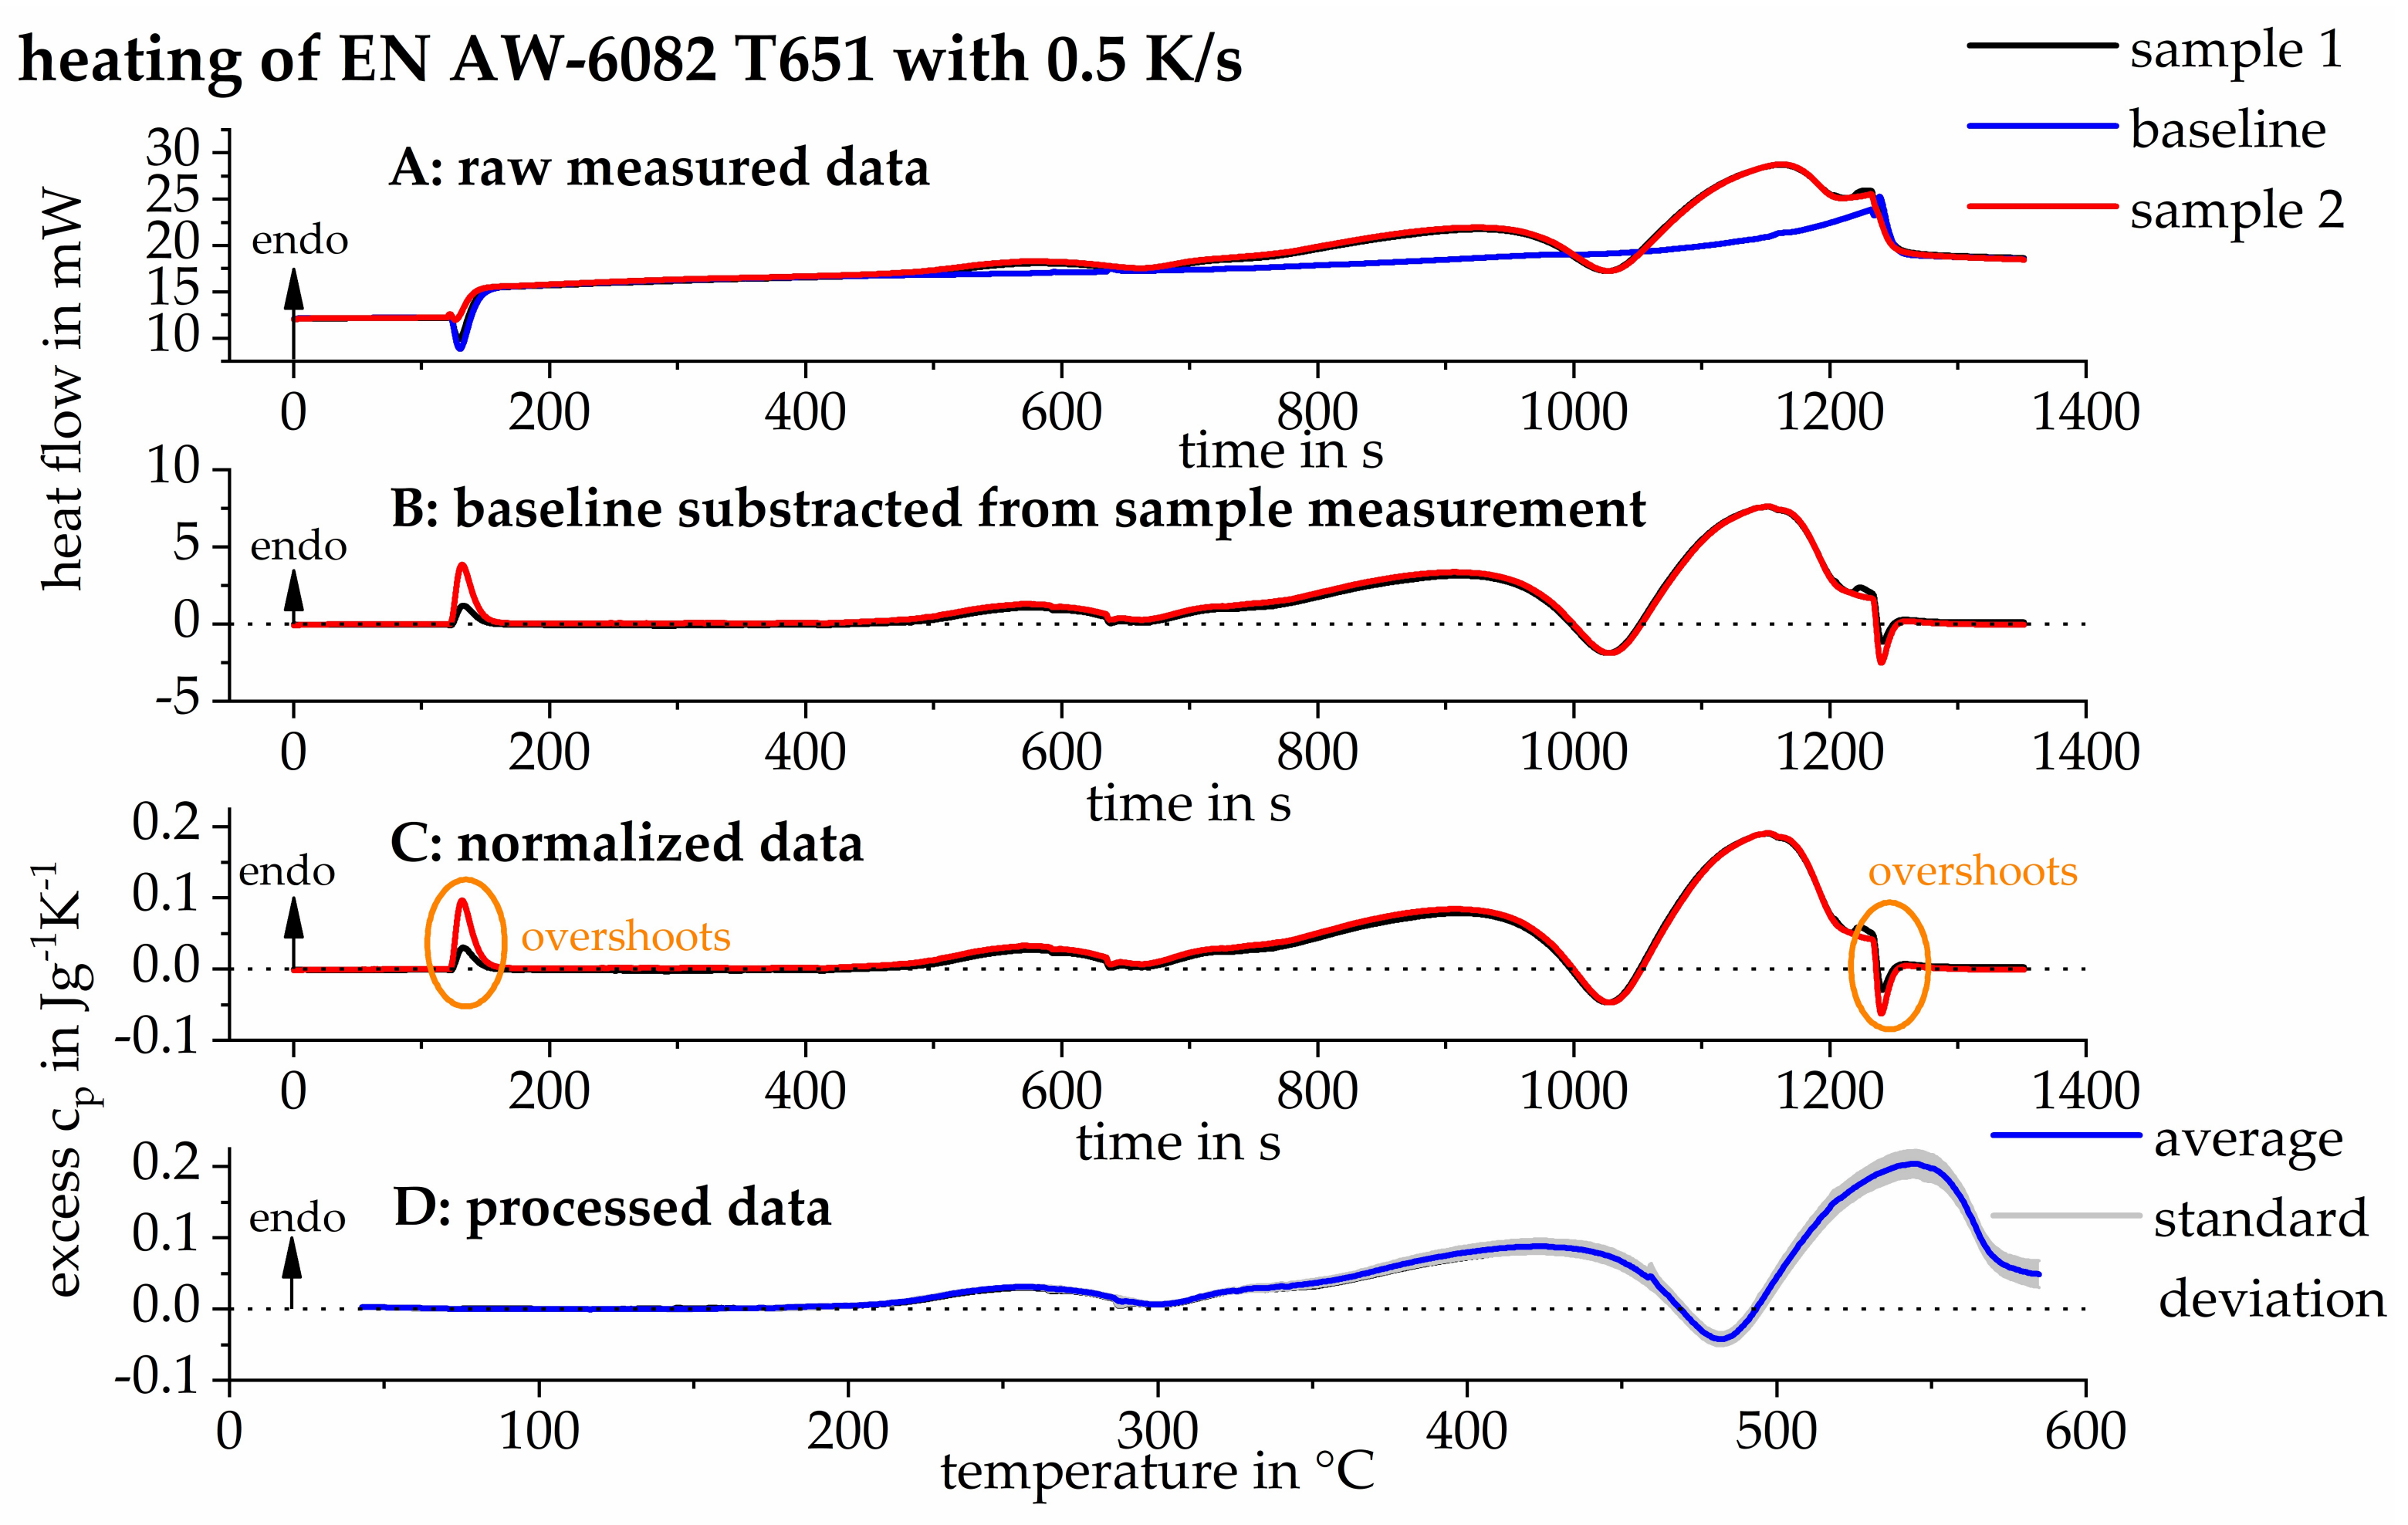
2.3. Data Processing of Raw Measured Heat Flow Curves

It is necessary to eliminate the device-specific curvature to obtain high-quality DSC raw data. This curvature can be determined by recording a baseline measurement. Pure aluminum references are placed in both micro-ovens (the two DSC sensors) for the baseline measurement, and the identical temperature program to the one performed during a sample measurement is performed. Pure aluminum (99.9995% purity) was used as the reference material for DSC. The device-specific curvature of the measured curves can change slightly, especially for the power-compensated calorimeters, within a few hours. The following scheme of first acquiring a sample measurement, followed by a baseline measurement, and then another sample measurement, was performed. The aim is to have a fresh baseline for each sample measurement. However, to keep experimental effort small, we use one baseline run for two sample measurements—one before and one directly after the baseline run. By subtracting the baseline from the sample measurement, the device-specific curvature can be removed from the raw data.
The heating experiments consisted of four sample measurements and two baselines in the heat-flux DSC, and eight single-sample measurements were recorded with four related baseline measurements in the power-compensated DSCs for each heating rate. The cooling experiments for each cooling rate in the heat-flux DSC consisted of two-four sample measurements with one or two associated baseline measurements in the heat-flux DSC, and six sample measurements with three related baseline measurements in the power-compensated DSCs.
Comparison of the measurements with different heating or cooling rates ( β ) and different sample masses ( m S ) requires the normalization of the measured heat flow to the value of excess specific heat capacity ( C p e x c e s s ) according to Equation (1) [16], where Q ˙ S and Q ˙ B l are the sample and baseline heat flows, respectively, and β is the scan (heating or cooling) rate.
C p e x c e s s = Q ˙ S Q ˙ B l m S · β   ( in   J   g 1   K 1 ) ,
Figure 1 shows the evaluation of the DSC curves for a heating curve produced from a heating rate of 0.5 K/s that was recorded with a power-compensated DSC. Figure 1A shows the recorded raw data. The device-specific curvature is eliminated by subtracting the baseline measurement from the sample measurement, as shown in Figure 1B. Figure 1C shows the data normalized by scanning rate and sample mass, which still contains overshoot artefacts [15] that have to be excluded from further evaluations. Figure 1D shows two resulting heating curves of the EN AW-6082 alloy from the initial state T651, with a heating rate of 0.5 K/s depending on temperature. As shown in Figure 1D, the dissolution of precipitates is not complete even at high temperatures up to 580 °C. This can be seen by the fact, that the DSC signal is not dropping back to zero at high temperatures. Thus, a zero-level correction by subtraction of a polynomial, as suggested in Osten et al. [11] and Milkereit et al. [15,17], was not applicable. Experiment specific curve fluctuations (e.g., caused by slight position differences of the sensor-lid or sample [17]) are definitely minimized by averaging the curves measured for a single set of parameters. This data treatment was recently introduced by our group, and discussed in detail in Kemsies et al. [18]. As the reproducibility of the DSC measurements was found to be high, with small fluctuations, as shown in Figure 1D, we do not plot the curve fluctuation ranges here to maximize the readability of the plots, which also allows for the easy comparison of multiple DSC curves.
A dotted straight line is additionally plotted on all the DSC heating and cooling curves, thus indicating the related zero level. A deviation of the measurement curve from this zero level signifies either an endothermic dissolution reaction or an exothermic precipitation reaction. Both the heating and cooling curves are shown here. In terms of the specific heat capacity, the endothermic area is shown upwards in the heating experiments [15,19], whereas the exothermic area is shown upwards in the cooling experiments [5]. Any figures presented in the results and discussion section below that consist of DSC curves from different scanning rates are arranged and shifted in order of the scanning rate used, starting with the lowest rate on top.

2.4. Microscopy

The samples for the microstructure investigations were heat-treated in a DSC, as well as in a quenching dilatometer (Bähr 805 A/D), based on the DSC results presented below. After thermal preparation, the samples for SEM analysis were cold-embedded in epoxy resin and then mechanically ground and polished with water-free lubricants. The final polishing was done with 0.05 µm oxide polishing suspension. The polished samples were rinsed after polishing and were analyzed in the polished condition.
The SEM samples were analyzed by a field emission SEM (MERLIN® VP Compact, Co. Zeiss, Oberkochen, Germany), equipped with an energy-dispersive X-ray (EDX) detector (XFlash 6/30) and analysis software (Quantax400, Co. Bruker, Berlin, Germany). Representative areas of the samples were analyzed and mapped to determine the elemental distribution on basis of the EDX-spectra data by the QUANTAX ESPRIT Microanalysis software (version 2.0).
The embedded and polished samples were mounted on the SEM carrier with adhesive conductive carbon and aluminum tape (Co. PLANO, Wetzlar, Germany). SEM-secondary electron (SEM-SE) images were obtained using high efficiency Everhart-Thornley-type HE-SE detector at 5 kV acceleration voltage. The acceleration voltage for the EDX analysis was varied between 5 and 15 kV.
Samples for transmission electron microscopy (TEM) were prepared by mechanical grinding, polishing up to a thickness of 100–150 µm, and further treatment by twin jet electro-polishing in methanol and nitric acid (2:1 ratio). The electrolytic thinning occurs at a temperature of about −20 °C, with a voltage of 12 V. TEM analysis was done by a Zeiss LIBRA 120 (Oberkochen, Germany), equipped with a LaB6 cathode and an in-column omega spectrometer. Representative areas of the samples were analyzed with 120 kV accelerating voltage and digital images were acquired using a bottom-mount 2 × 2 k slow scan digital camera system (Proscan, Co. TRS, Moorenweis, Germany). Image processing was done with the iTEM software (Olympus Soft Imaging Solutions GmbH, Münster, Germany).

2.5. Hardness Tests

The hardness was examined for different solution-annealing conditions and cooling rates to correlate the results of the thermal analysis with a characteristic mechanical value, after a subsequent artificial aging at 180 °C for 4 h. Hardness tests were chosen as the hardness can be tested directly on the DSC samples. The heat treatments, with cooling up to 5 K/s, were carried out in the DSC. However, faster cooling rates of 10 to 300 K/s were also realized in the quenching dilatometer Bähr 805 A/D. The hardness (HV1) was determined with a micro-hardness tester, HMV-2, from Shimadzu, Japan. Six hardness indentations were recorded per parameter set. The results plot the average, hardness values. Additionally, the minimum and maximum values are given as error bars.

3. Results and Discussion

3.1. Continuous Heating of the T651 Initial Condition

The solution-annealing temperature was chosen as 540 °C in several previous investigations of the quench sensitivity of AlMgSi alloys [4,5,12]. However, the DSC heating experiments on the particular alloy batch and the initial T651 condition used here (shown in Figure 2), even for slow heating at 0.01 K/s, indicate that dissolution of the secondary precipitates of interest is just completed at about 560 °C. Furthermore, Figure 2 shows that the temperature at which the dissolution of the secondary phases is completed strongly depends on the heating rate. An increase in the heating rate shifts this dissolution completion to higher temperatures. As derived from findings in Schumacher et al. [20], it can be expected that the specific solvus temperature will be reduced by up to a few tens of Kelvin at even lower heating rates or under isothermal solution-annealing conditions. One solution-annealing temperature was thus chosen as 560 °C, which, according to the heating experiments, should be above the equilibrium solvus temperature in any case. As mentioned above, 540 °C is a typical solution-annealing temperature that has been used in previous works, and 550 °C was chosen as the temperature in between these values. Two different solution-annealing soaking durations of 1 and 20 min were also examined. Since the slower CALVET-type DSC required at least 5 min to achieve thermal equilibration [13], a soaking duration of 1 min is only investigated in the faster DSCs (0.3–5 K/s). Therefore, a systematic investigation of the quench sensitivity or quench-induced precipitation behavior after different solution-annealing conditions was conducted, and the DSC experiments were performed with three significant parameters varied, as follows:
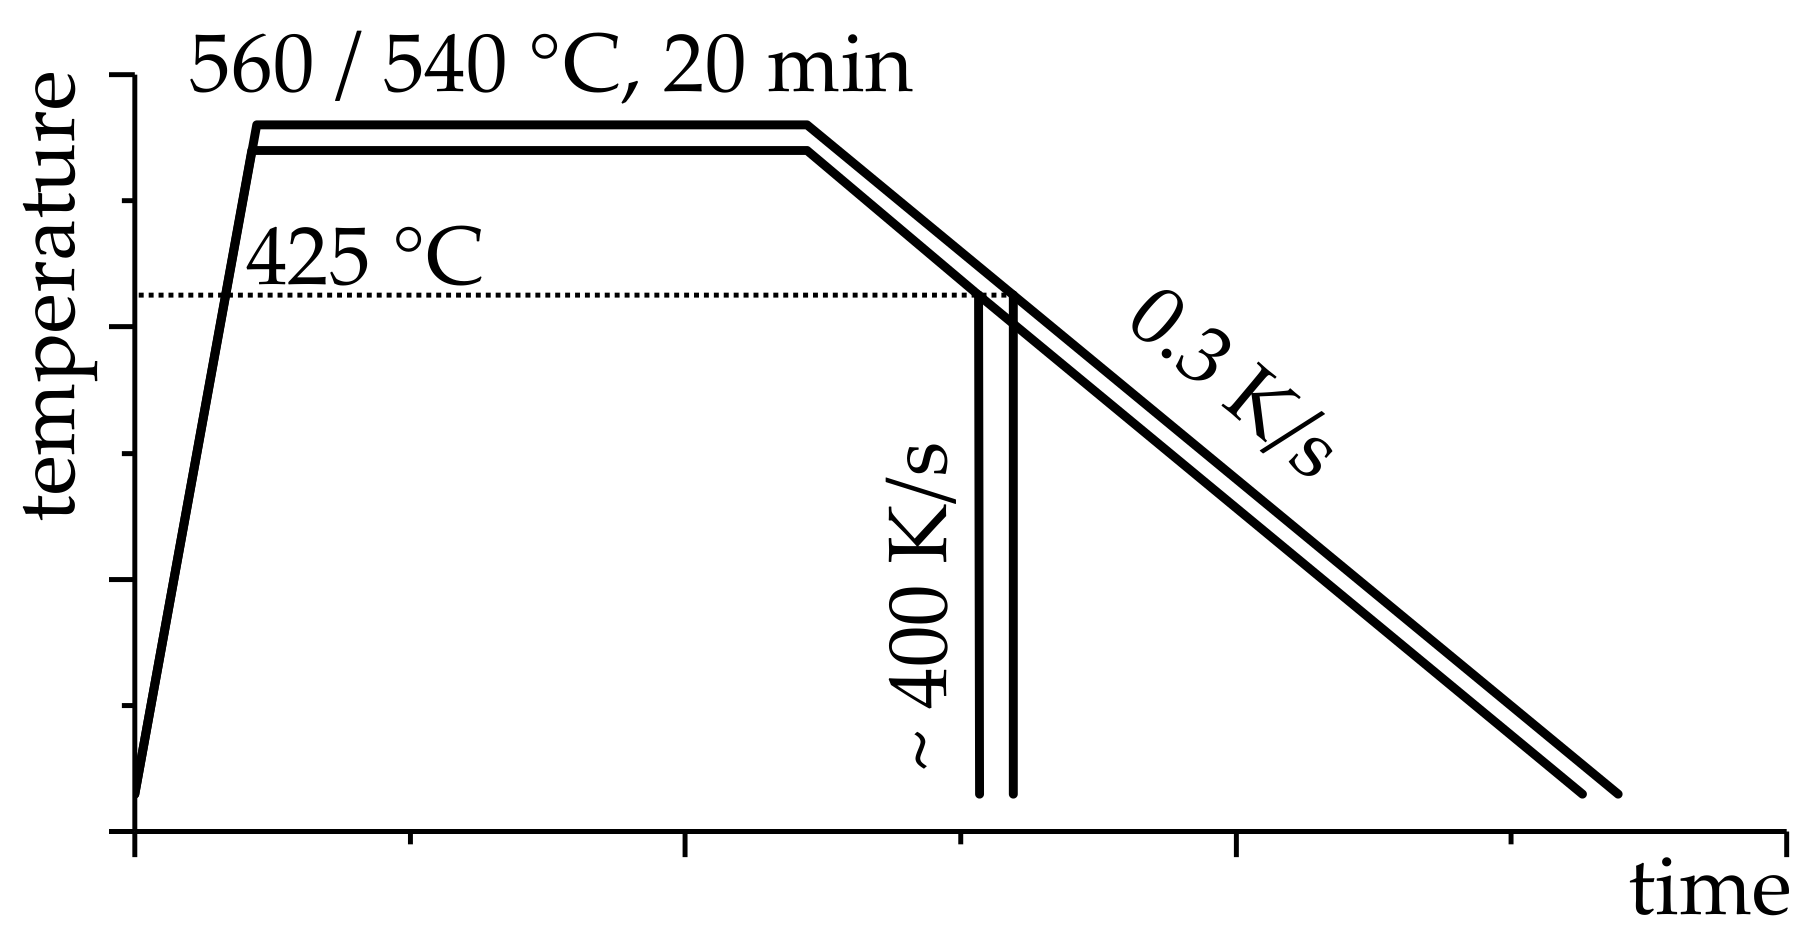
  • Solution-annealing temperatures: 540, 550, and 560 °C;
  • Solution-annealing soaking durations: 1 and 20 min;
  • cooling rates: 0.01–5 K/s.
This corresponds to 33 sets of parameters and more than 200 single DSC experiments.

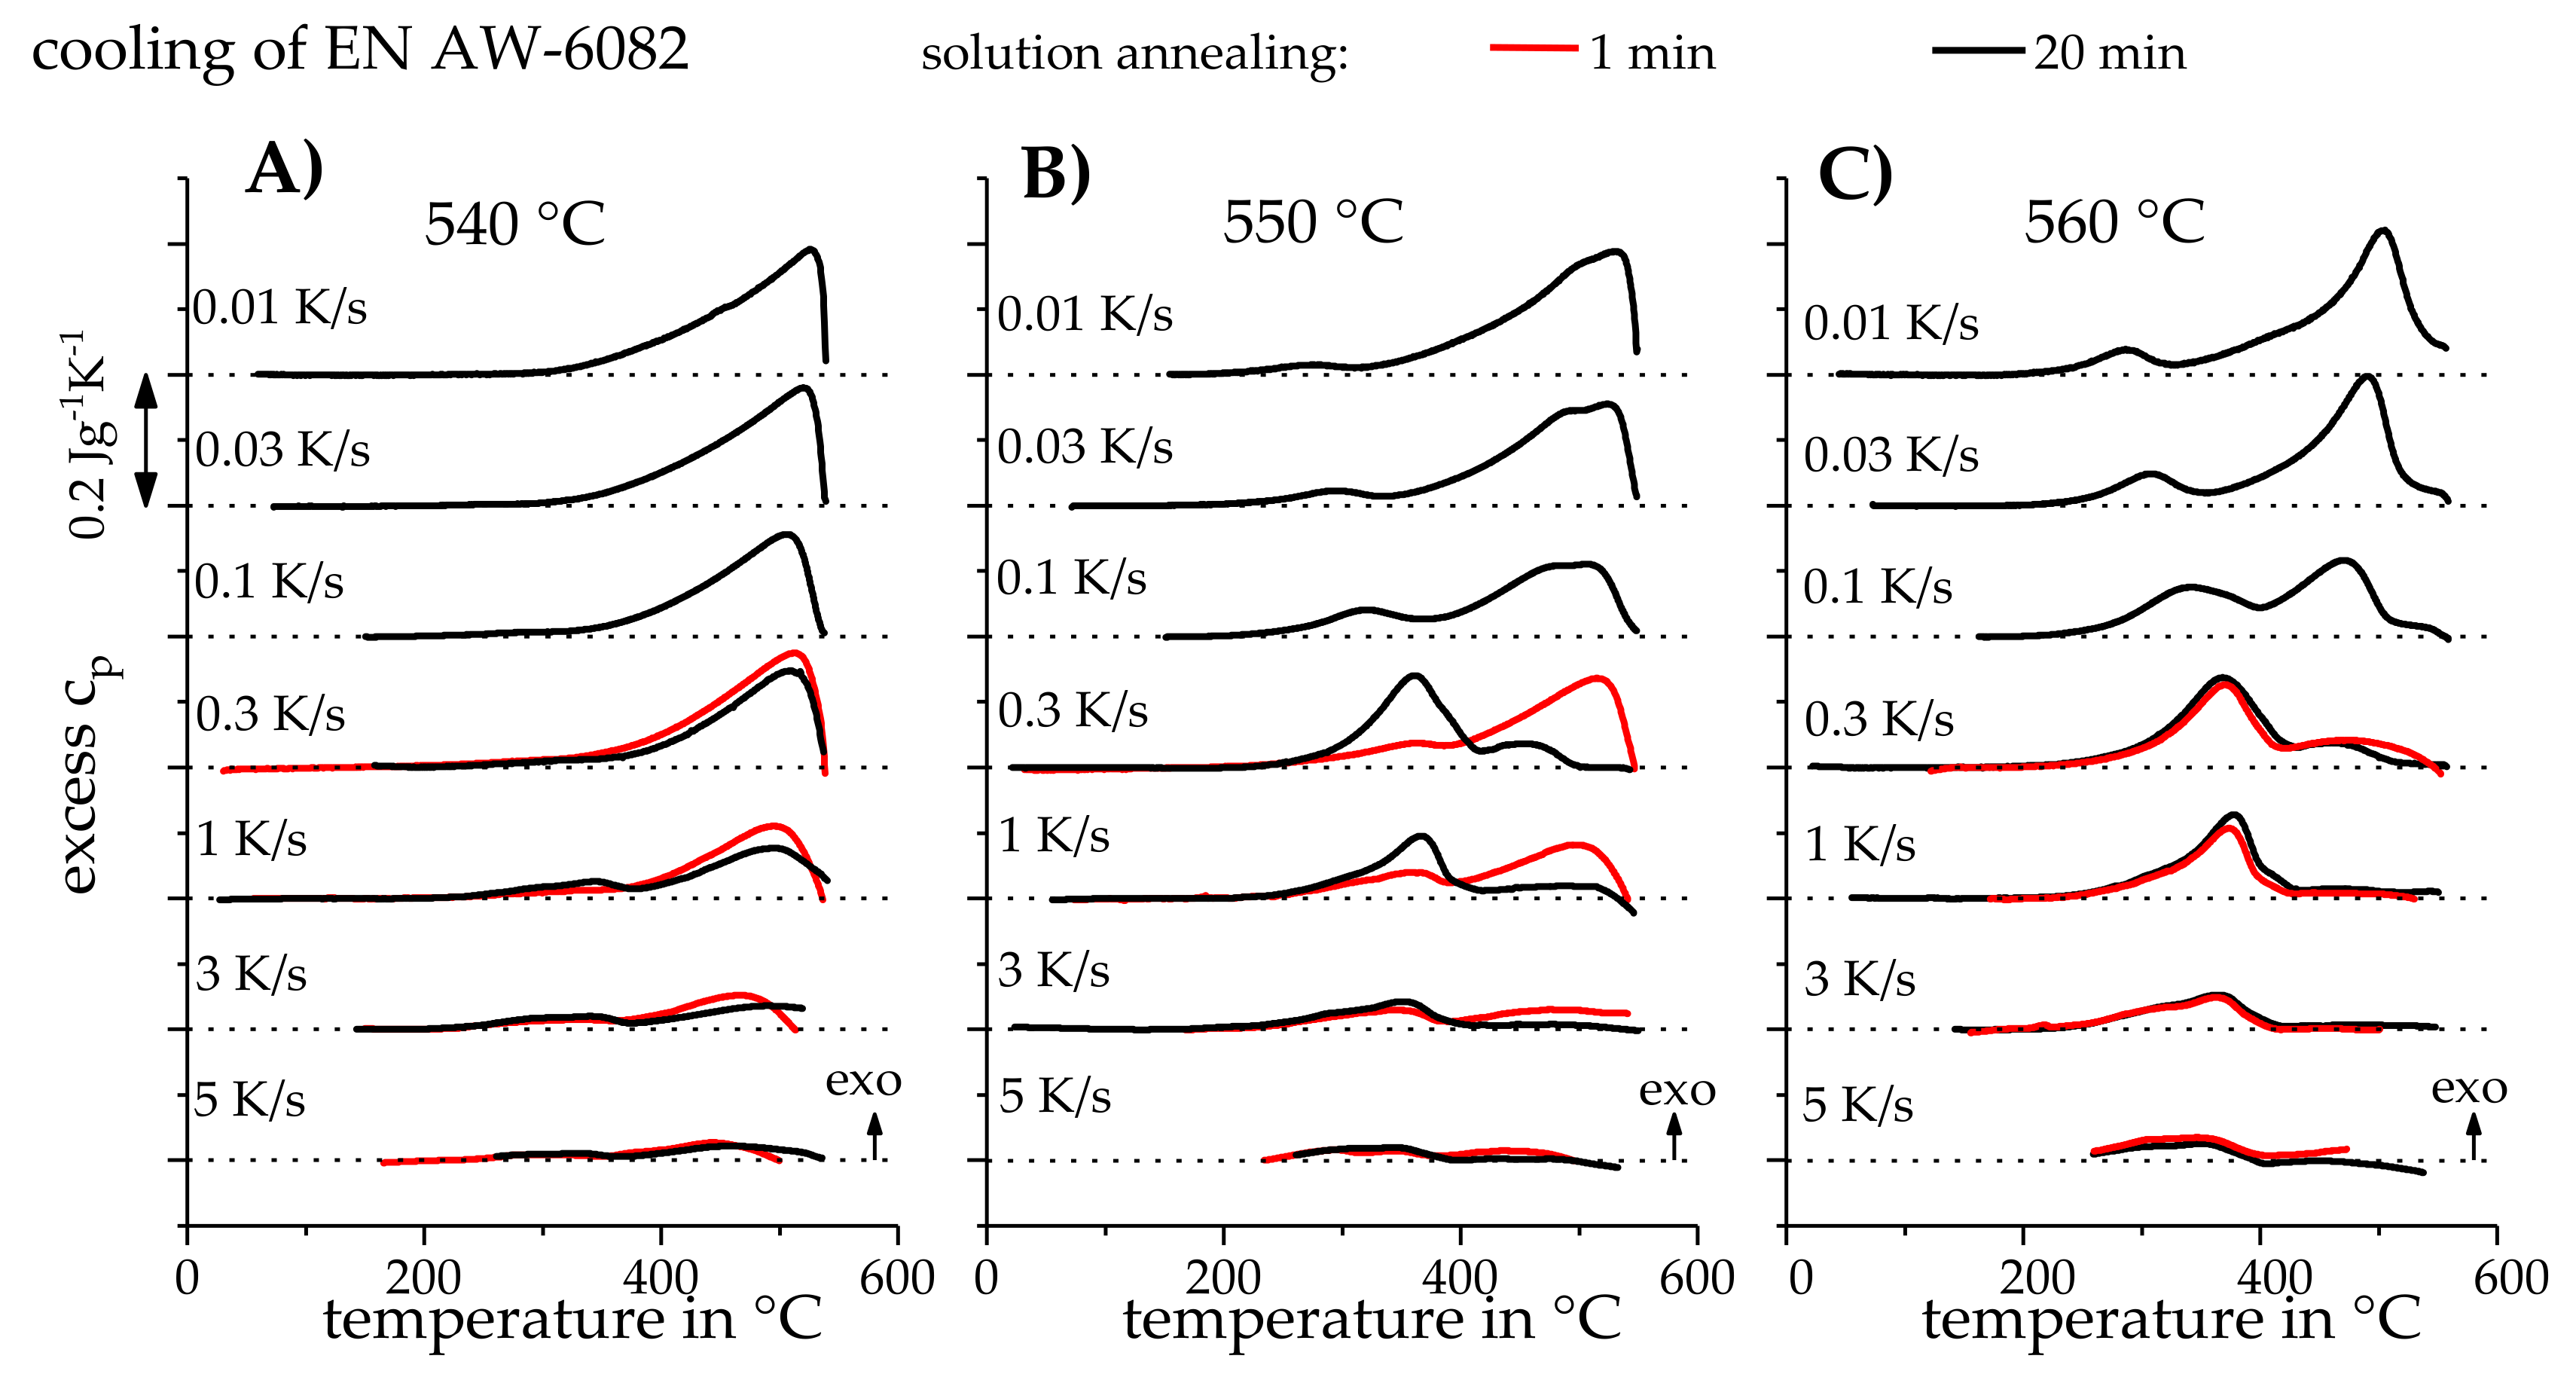
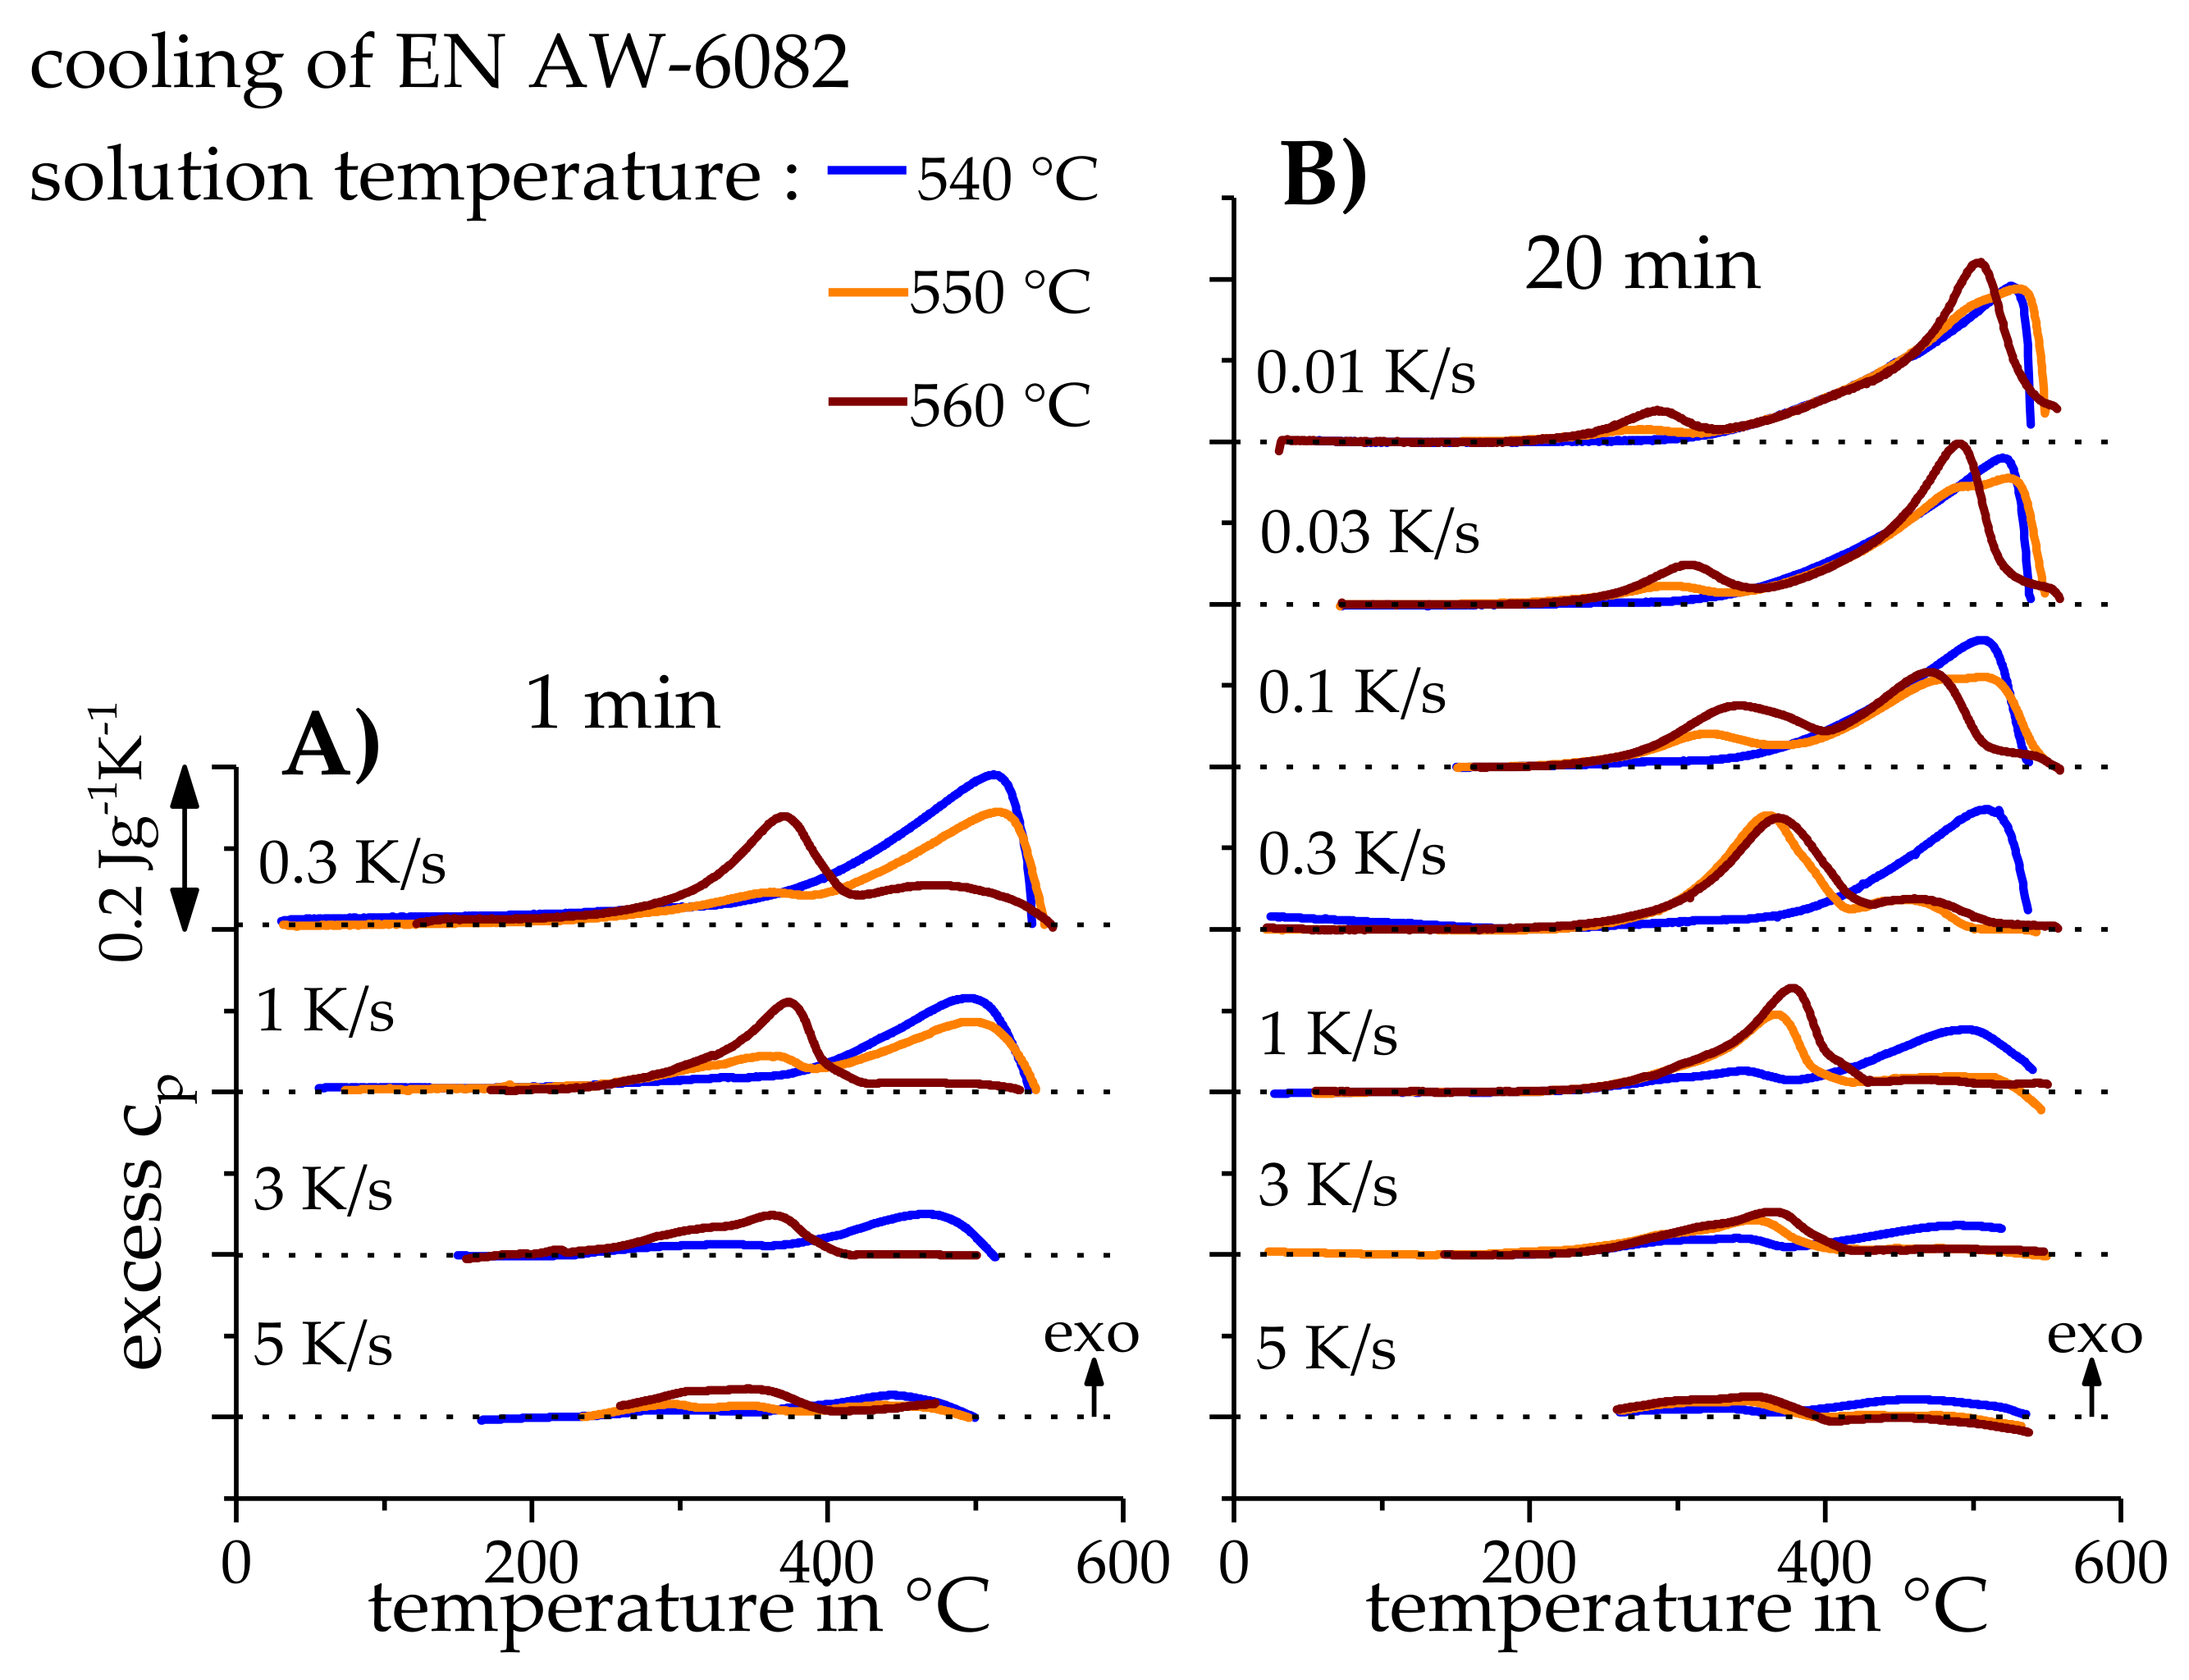
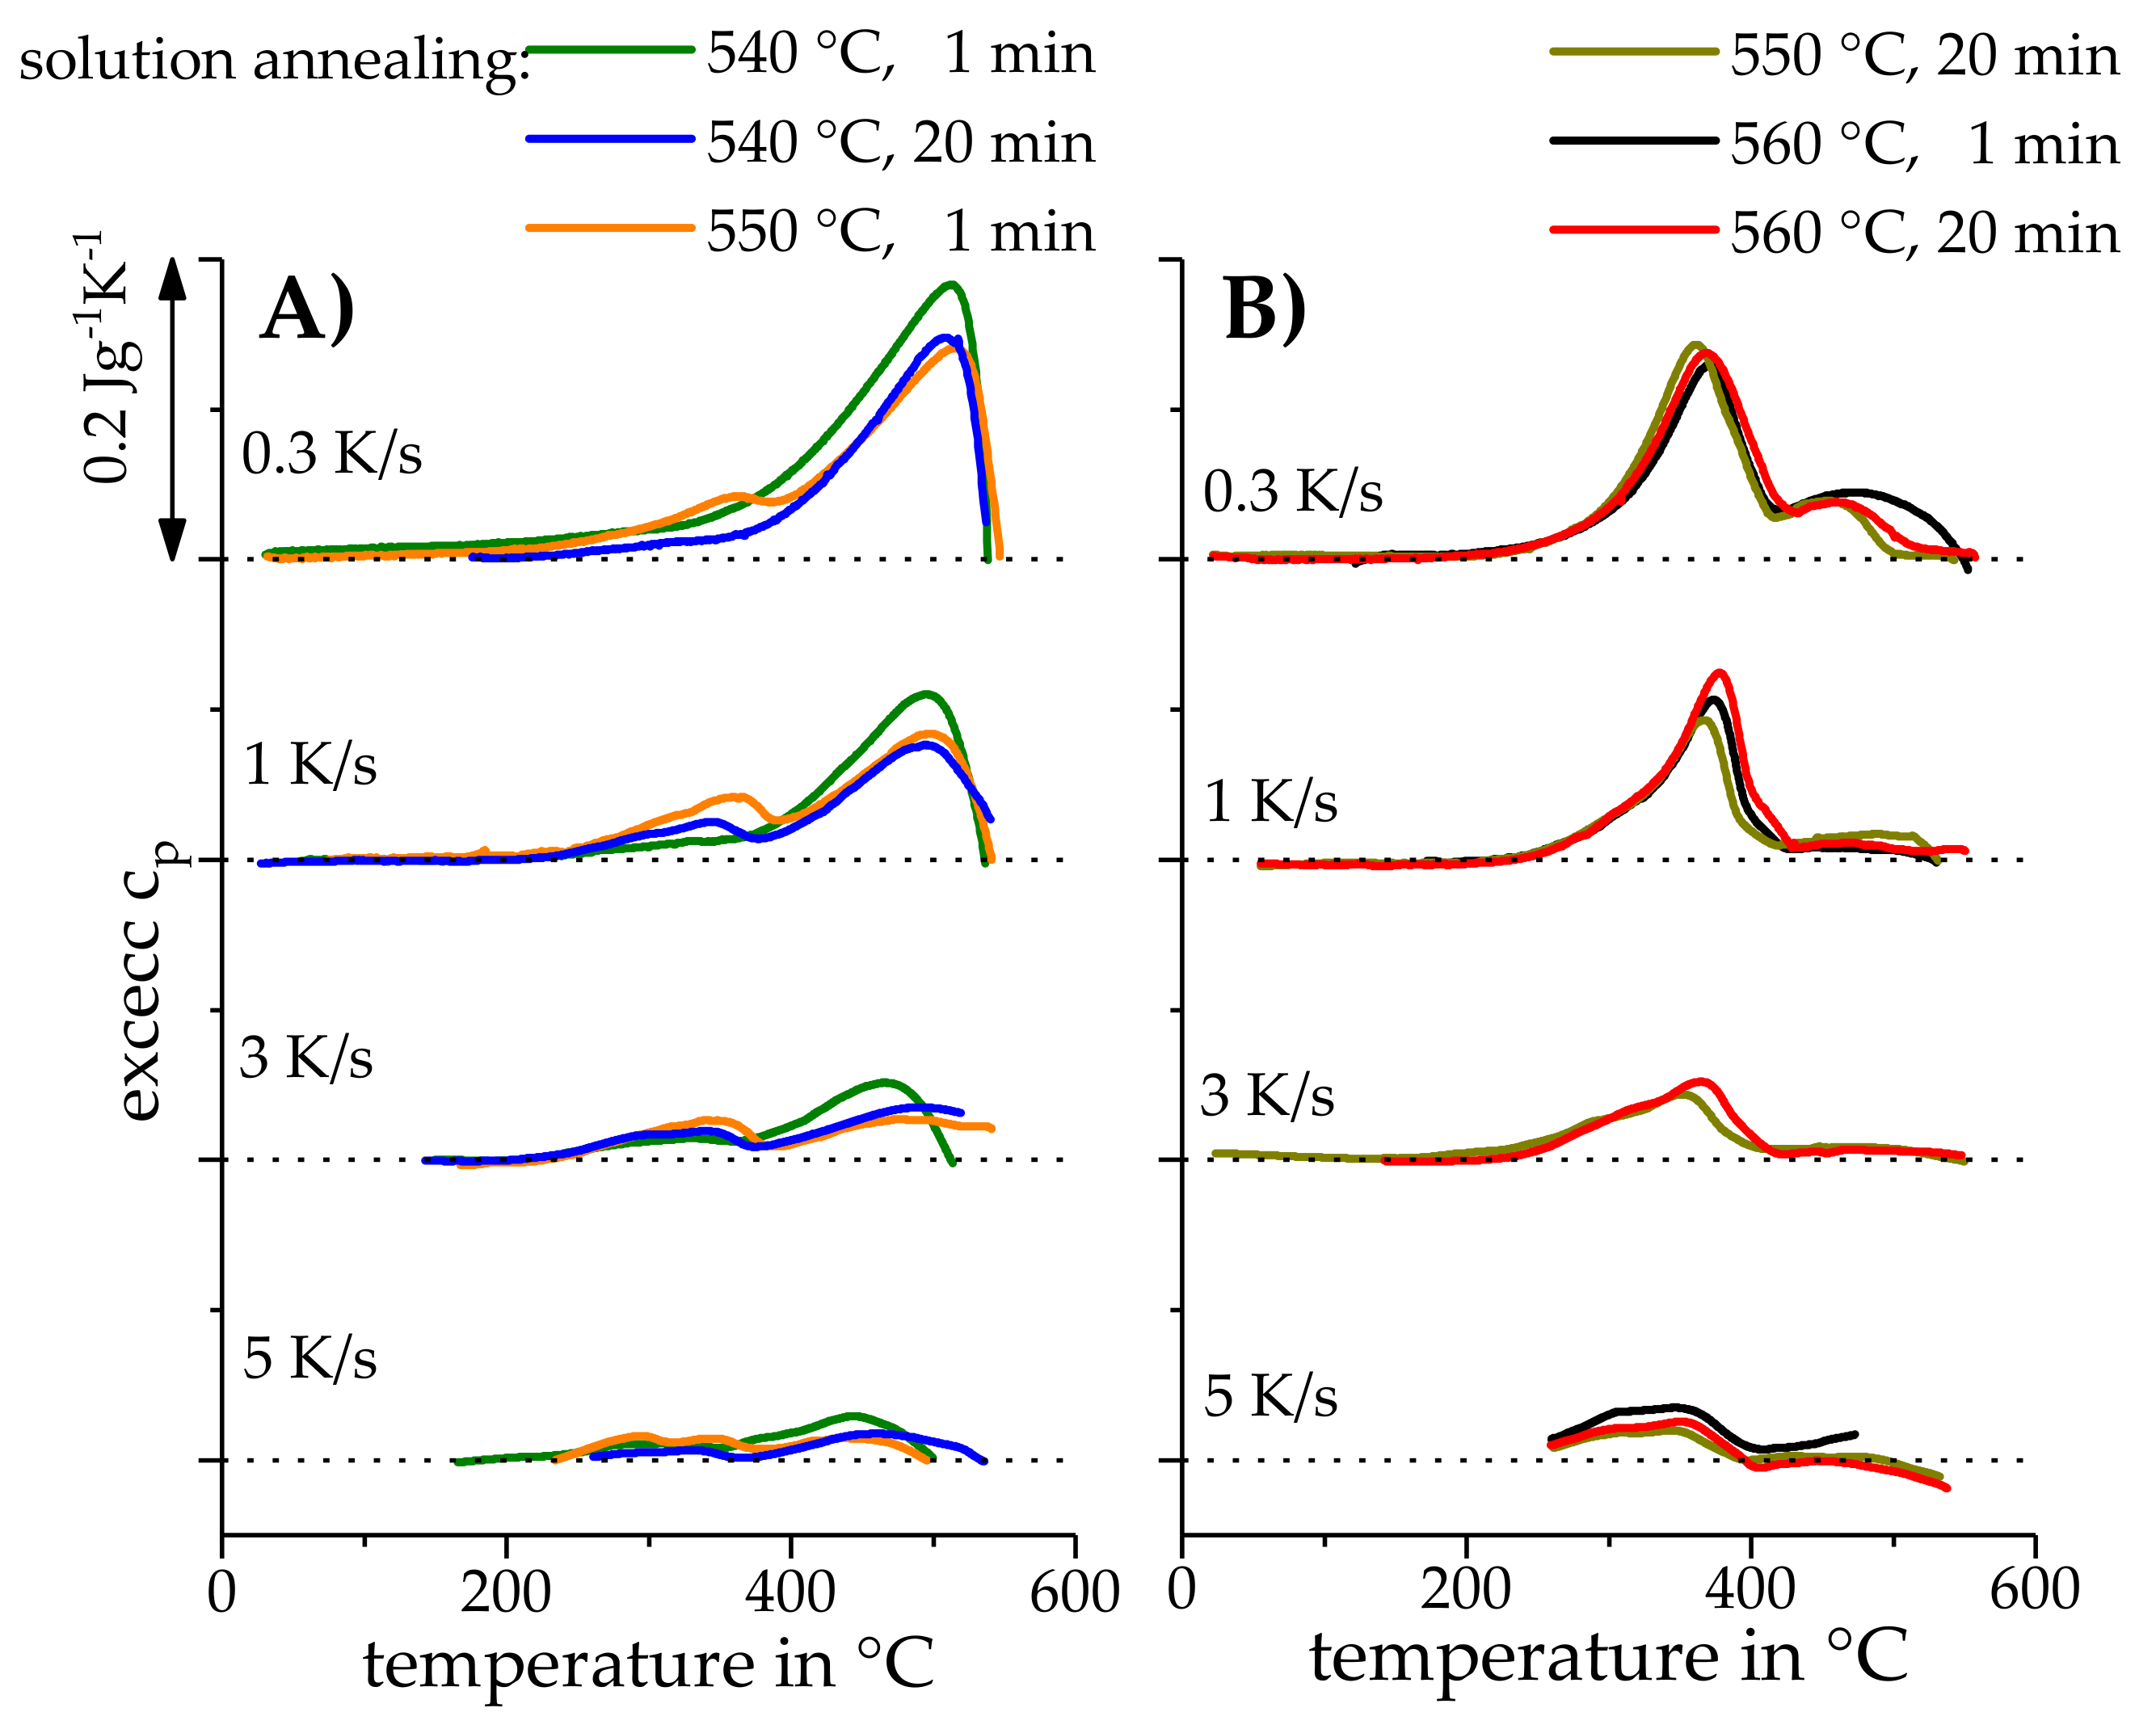
3.2. Continuous Cooling Experiments, Starting from Different Solution Treatment Conditions

Figure 3 highlights one parameter set of the cooling experiments, plotted according to the 540, 550, and 560 °C solution-annealing temperatures. The DSC cooling curves of the two different soaking durations are plotted in two colors. The area between a DSC curve peak and its corresponding zero level is proportional to the precipitation enthalpy, and thus the volume fraction, of the precipitates grown during a certain reaction/peak [4].
Figure 3A shows that the DSC curves/reactions are insensitive to the soaking time at 540 °C. Furthermore, a broad high-temperature reactions (HTRs) peak dominates, even at high cooling rates. A similar pattern is observed if cooling started from 560 °C regarding the insensitivity to soaking time (Figure 3C). However, the shape of the cooling curves varies significantly when comparing soaking at these two temperatures. Two main exothermic precipitation reaction peaks are observed for the soaking at 560 °C. The low temperature reactions (LTRs) peak begins to dominate the precipitation behavior during faster cooling from 560 °C. The medium solution-annealing temperature at 550 °C highlights that the soaking duration significantly impacts the curvature of the observed DSC curves, as shown in Figure 3B. Here, the shorter soaking times (1 min) yield DSC curves that are similar to those at 540 °C, whereas the longer soaking times (20 min) yield DSC curves that are similar to those at 560 °C.
The same DSC data are rearranged in Figure 4 to highlight the role of the solution-annealing temperature. Two major arguments can be derived from these data: (1) only minor differences in the DSC curve curvatures are observed at the slower cooling rates (up to 0.1 K/s, resulting in cooling durations of 1.4 to 14 h) and 20 min of soaking. However, (2) for faster cooling rates of 0.3 to 5 K/s those differences are more significant while those cooling rates additionally are considered to be much more technologically relevant, covering cooling durations ranging from 30 s to a few minutes. Considerably different DSC curves are produced at these fast cooling rates, the two different soaking times, and the range of solution-annealing temperatures, which exhibit the largest differences for the medium cooling rates of 0.3 and 1 K/s.
The findings from Figure 3 and Figure 4 thus suggest that there are two major types of DSC curvatures for a given cooling rate. The resultant DSC curvature obviously depends on the specific solution condition applied prior to cooling. Therefore, the DSC data are arranged into these two types of DSC curves, as shown in Figure 5. The DSC curves in Figure 5A are dominated by HTRs, while the DSC curves in Figure 5B are dominated by LTRs. This leads one to ask what the cause of these different DSC curves and their quench-induced precipitation behavior is. We thus postulate that the two different types of precipitation behavior depend on whether the cooling started from an incomplete solution (as seen in Figure 5A) or if a (largely, if not fully) complete solution precedes the cooling (as seen in Figure 5B).
This postulation is derived from three arguments:
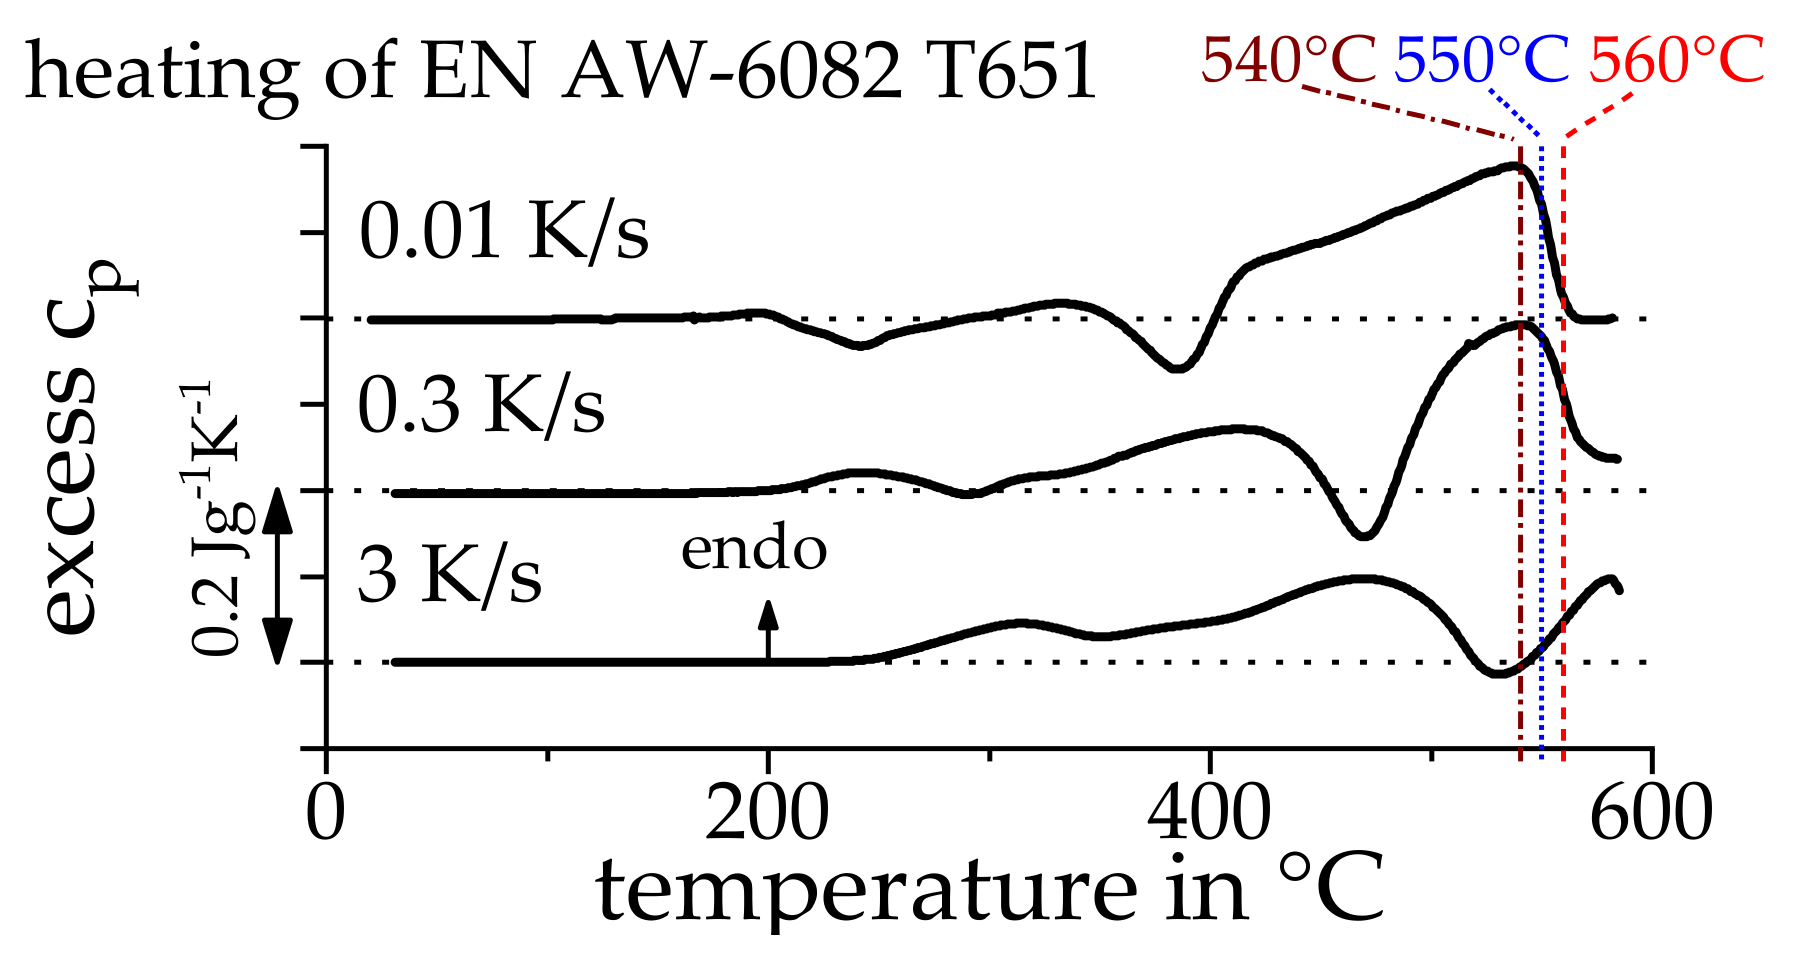
  • According to Figure 2 (and the related discussion), the solvus temperature of the initial T651 condition of this particular batch of EN AW-6082 for slow heating is below 560 °C.
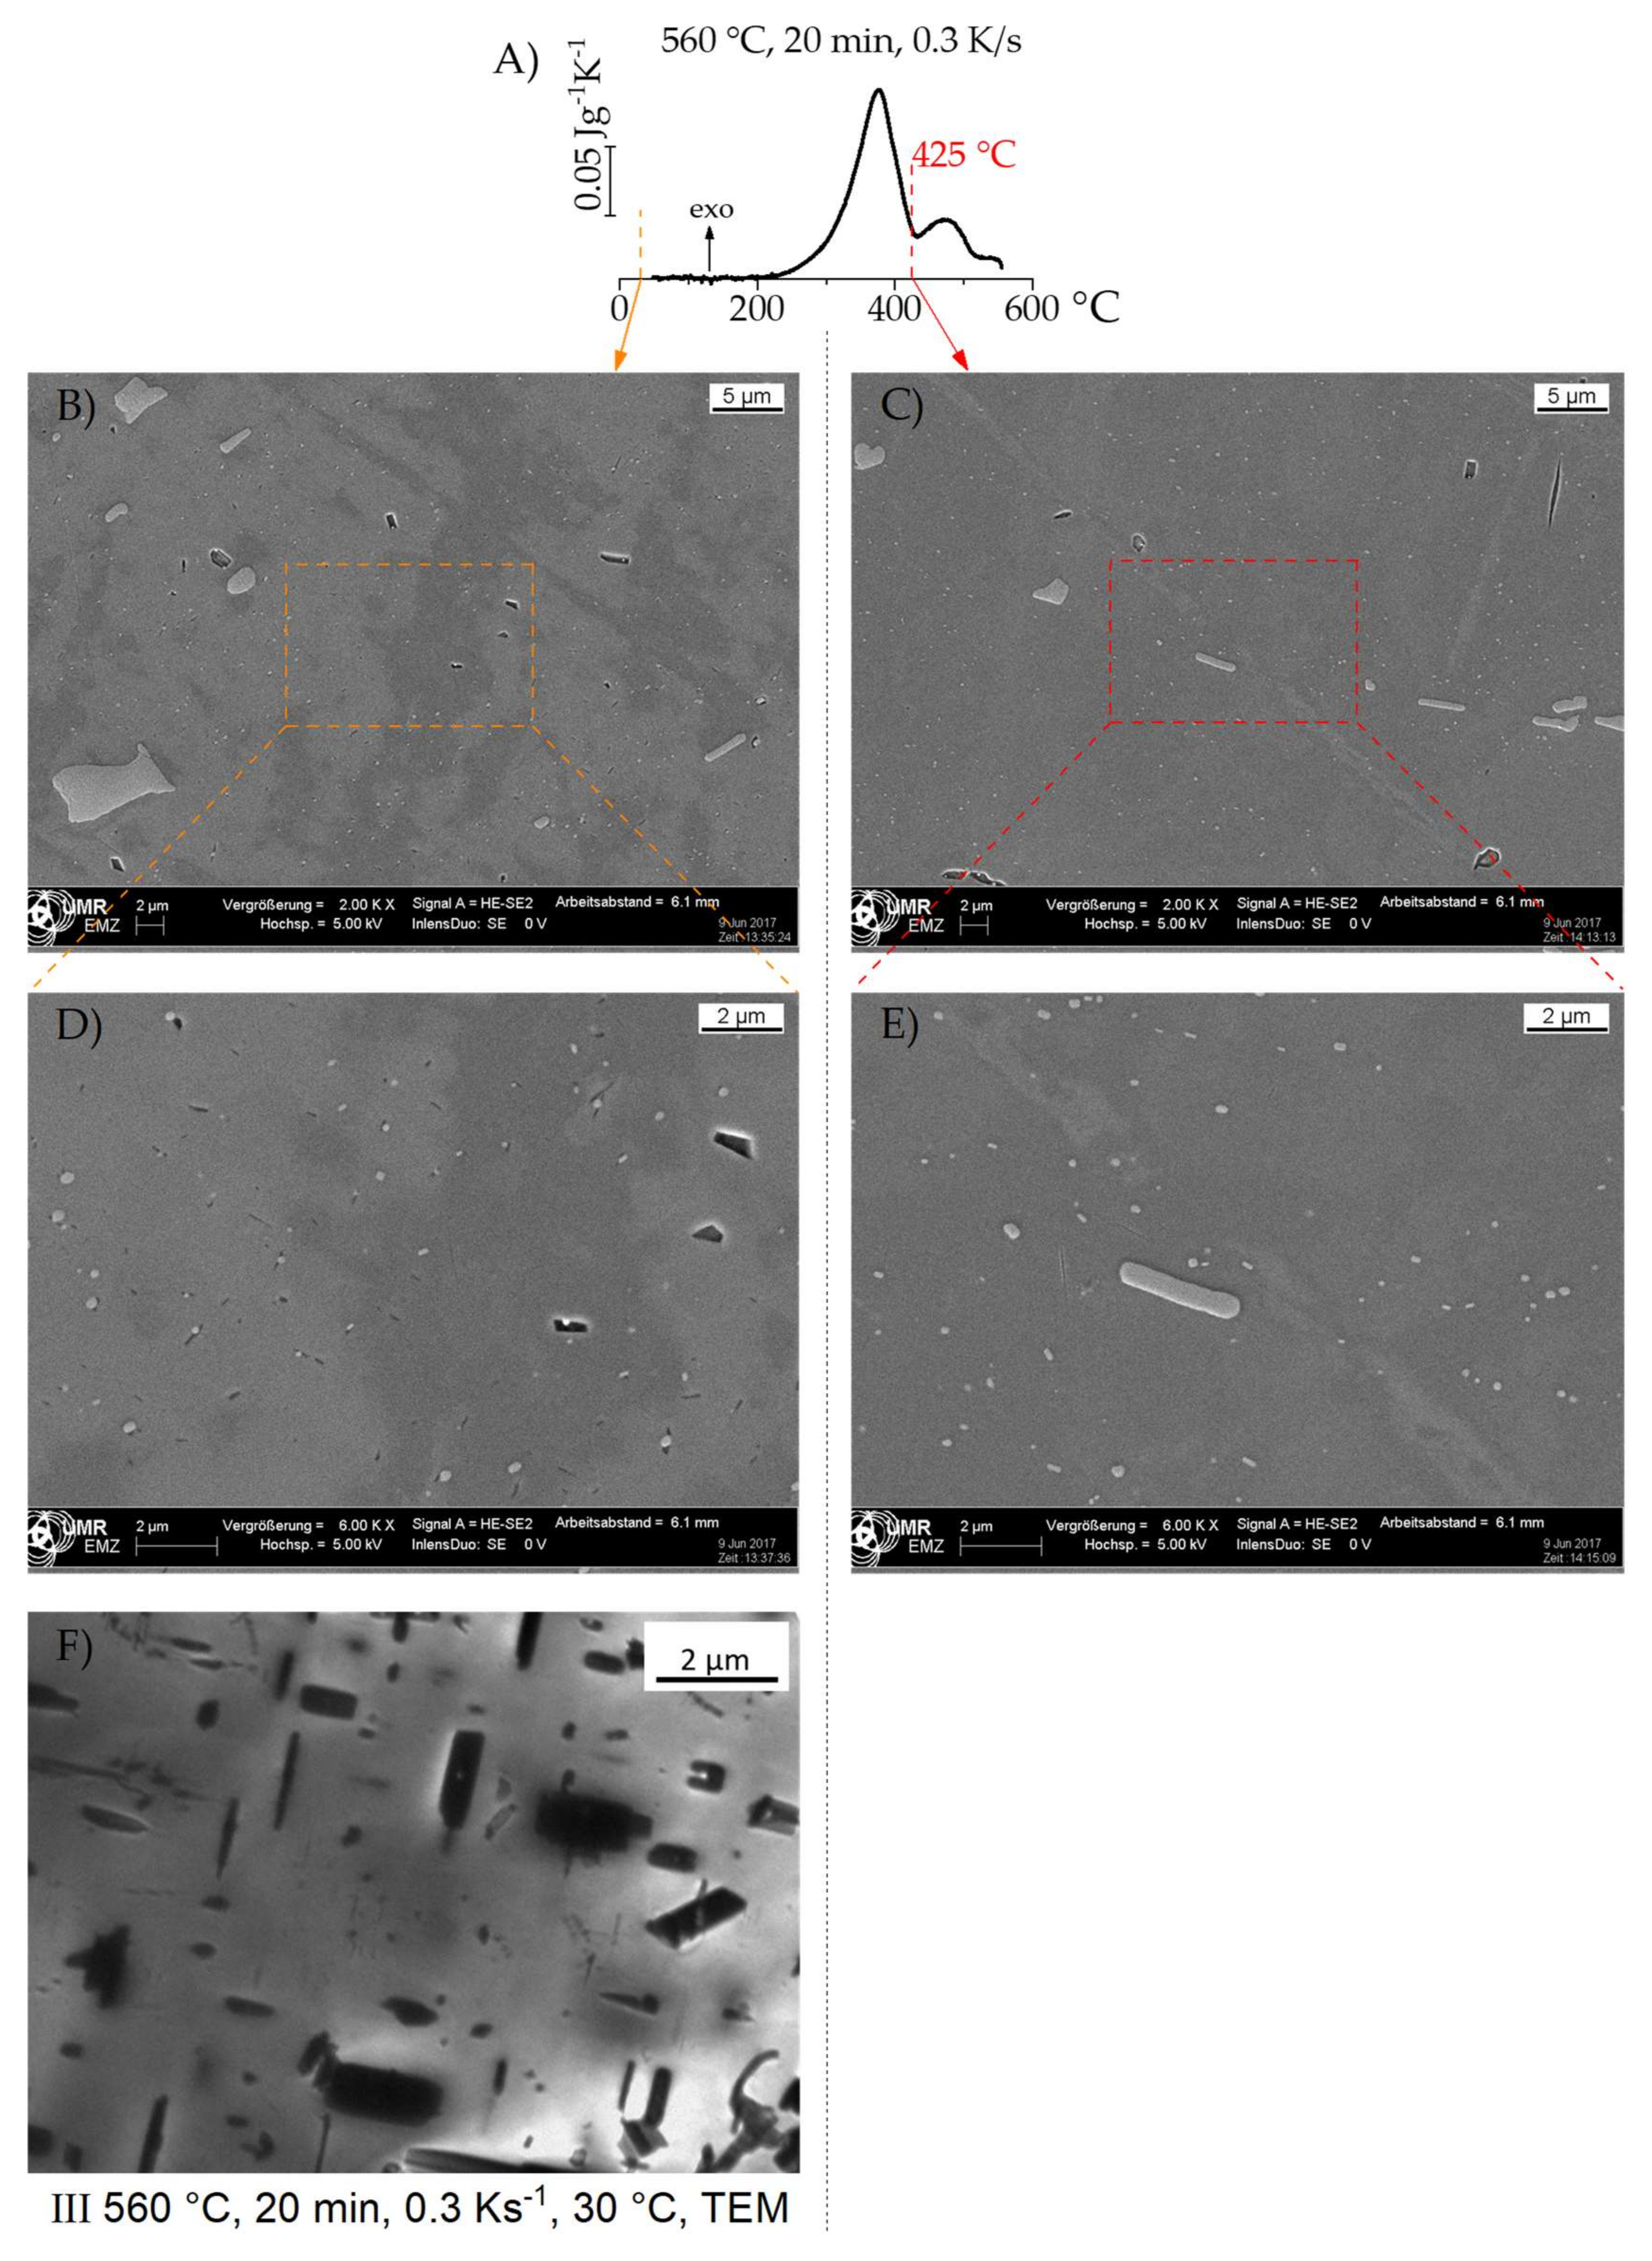
  • If cooling is starting from a more-or-less complete solution (e.g., 560 °C solution-annealing temperature and 20 min soaking time), the main precipitation begins after a certain degree of undercooling.
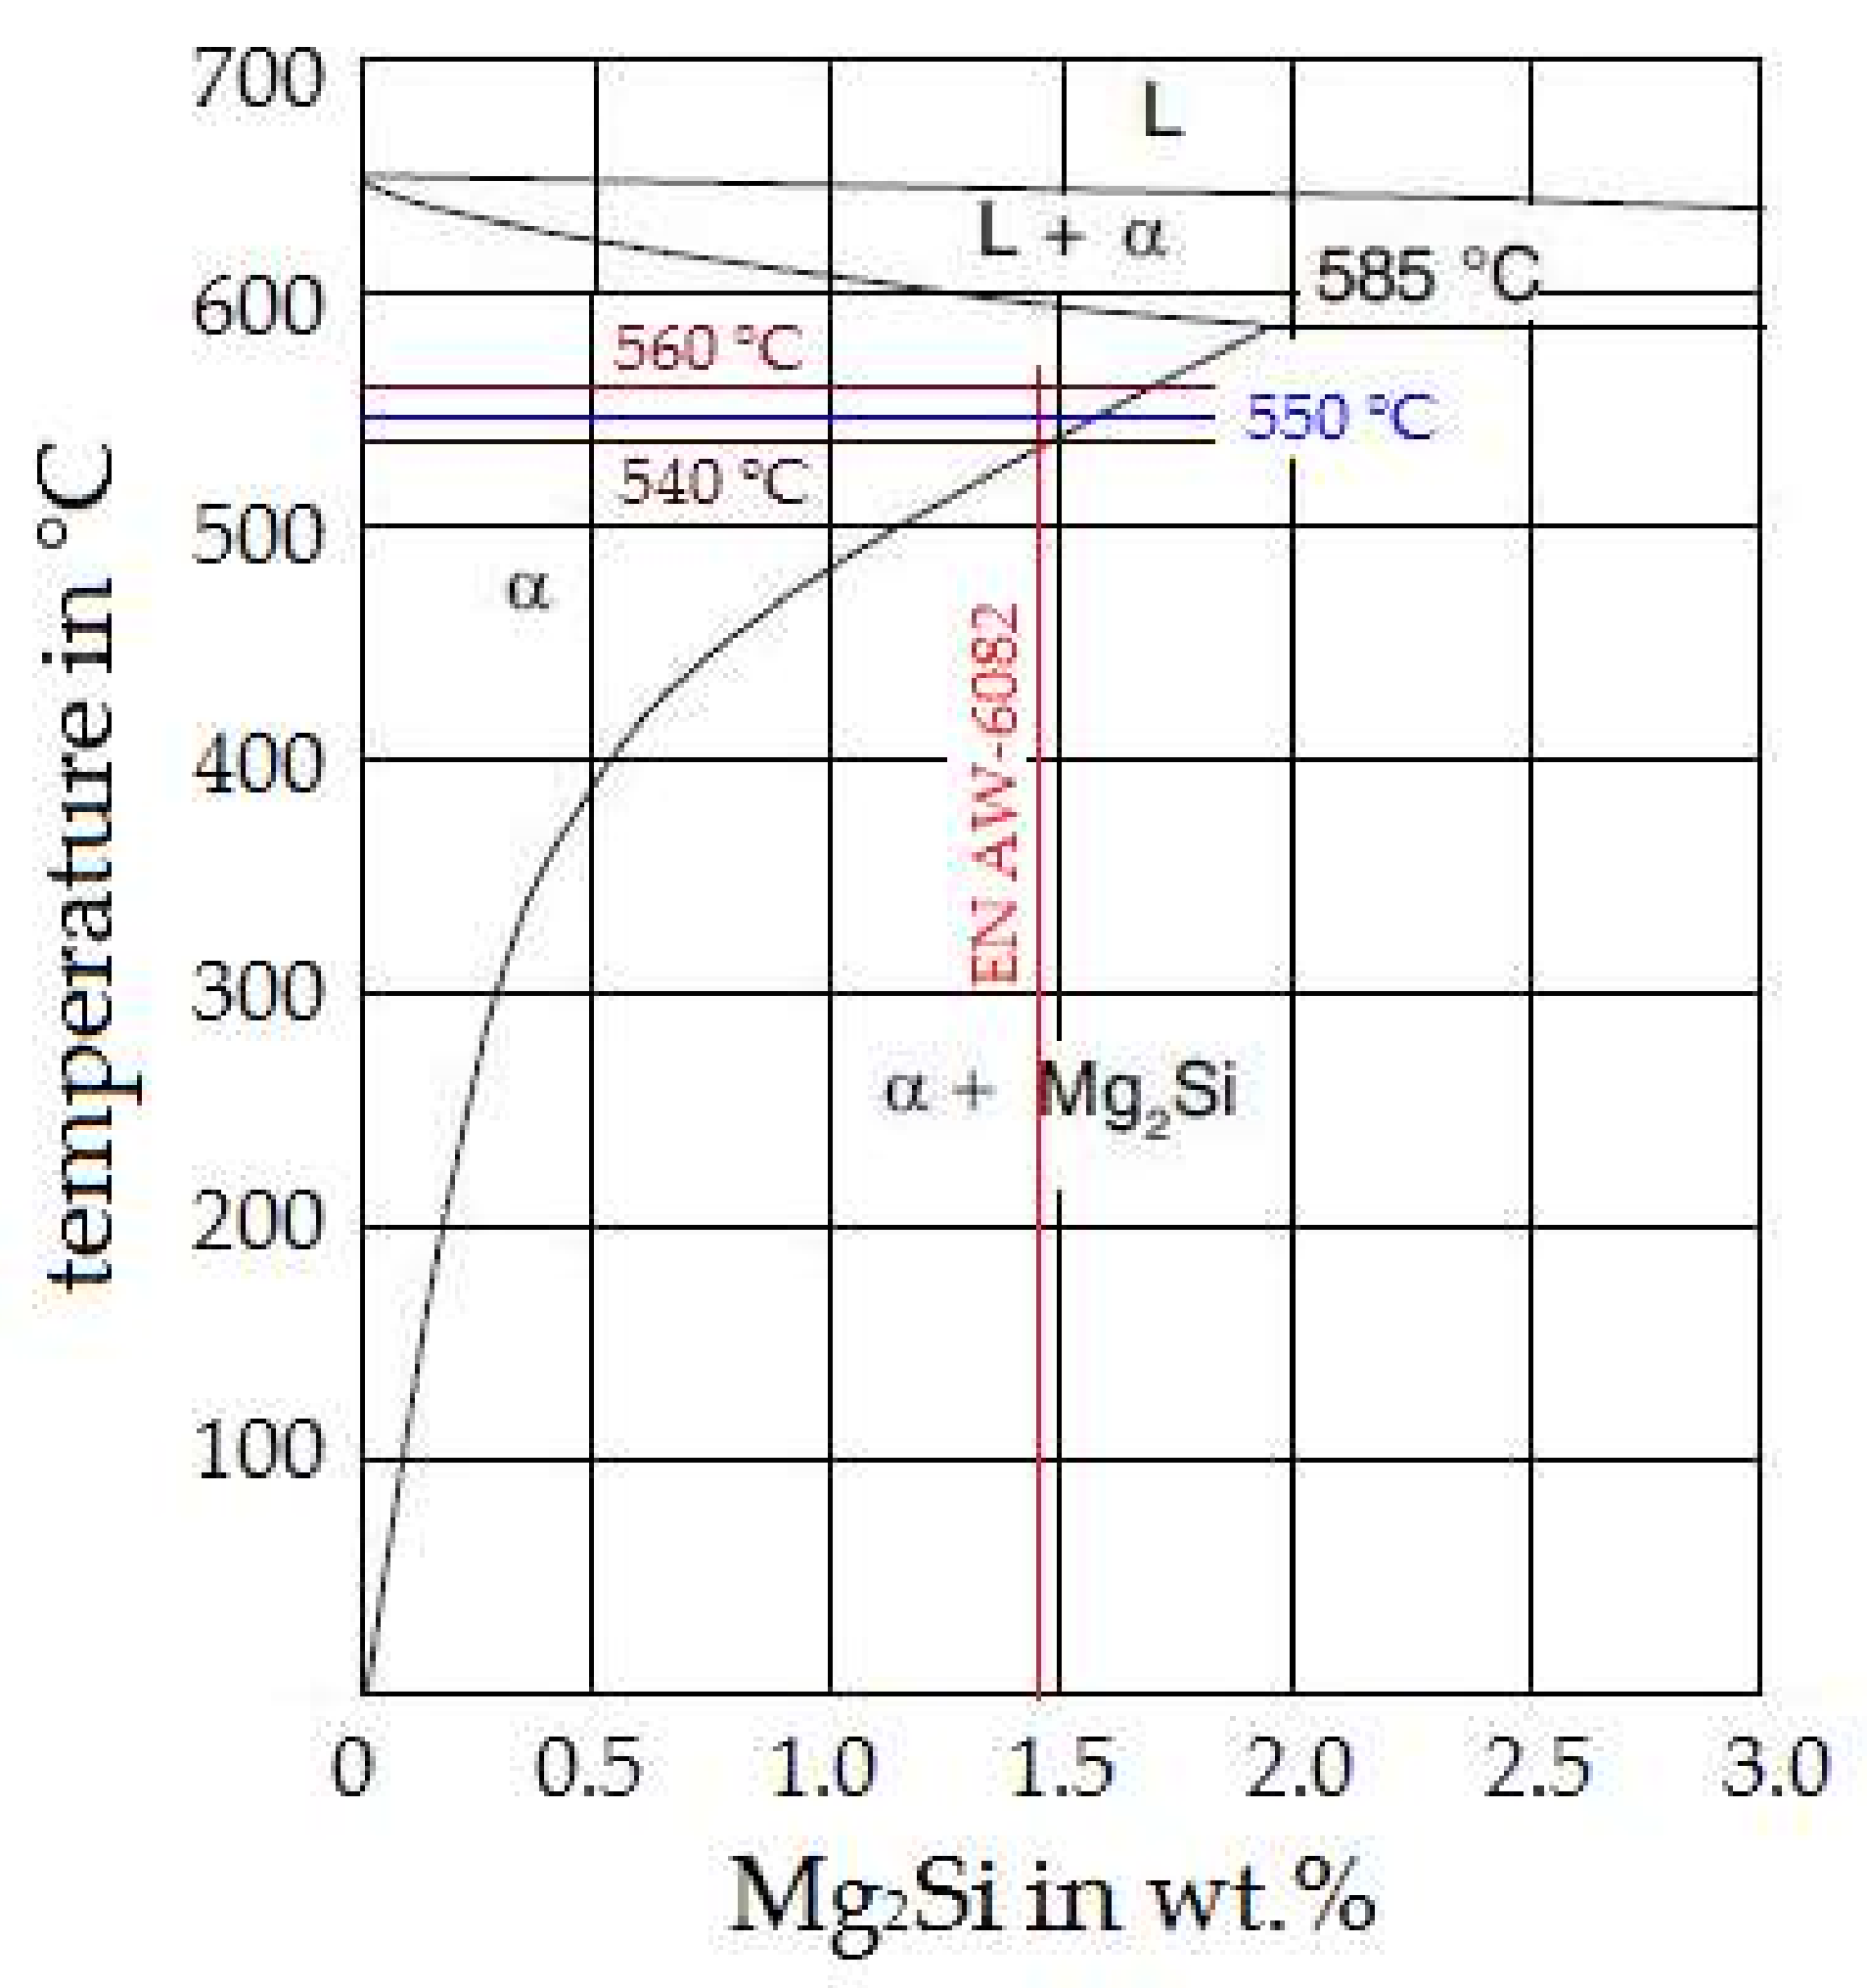
  • The quasi-binary phase diagram Al-Mg2Si (Figure 6) indicates that the Mg2Si equilibrium solvus temperature for this alloy is near or slightly above 540 °C.
Our reasoning for these three arguments is as follows:
i.: The heating rate-specific solvus temperature can drop below 560 °C during very slow heating, as demonstrated in Figure 2. The cooling experiments in Figure 5 were conducted after relatively fast heating (2 K/s). Therefore, according to Figure 2, the dissolution remained incomplete at the end of the heating process. A complete solution can still be obtained with the switch to isothermal soaking, as seen in Figure 5B. Here 20 min of soaking at 550 and 560 °C results in precipitation beginning after a certain degree of undercooling, while a short soaking of 1 min at 560 °C still causes the direct onset of precipitation.
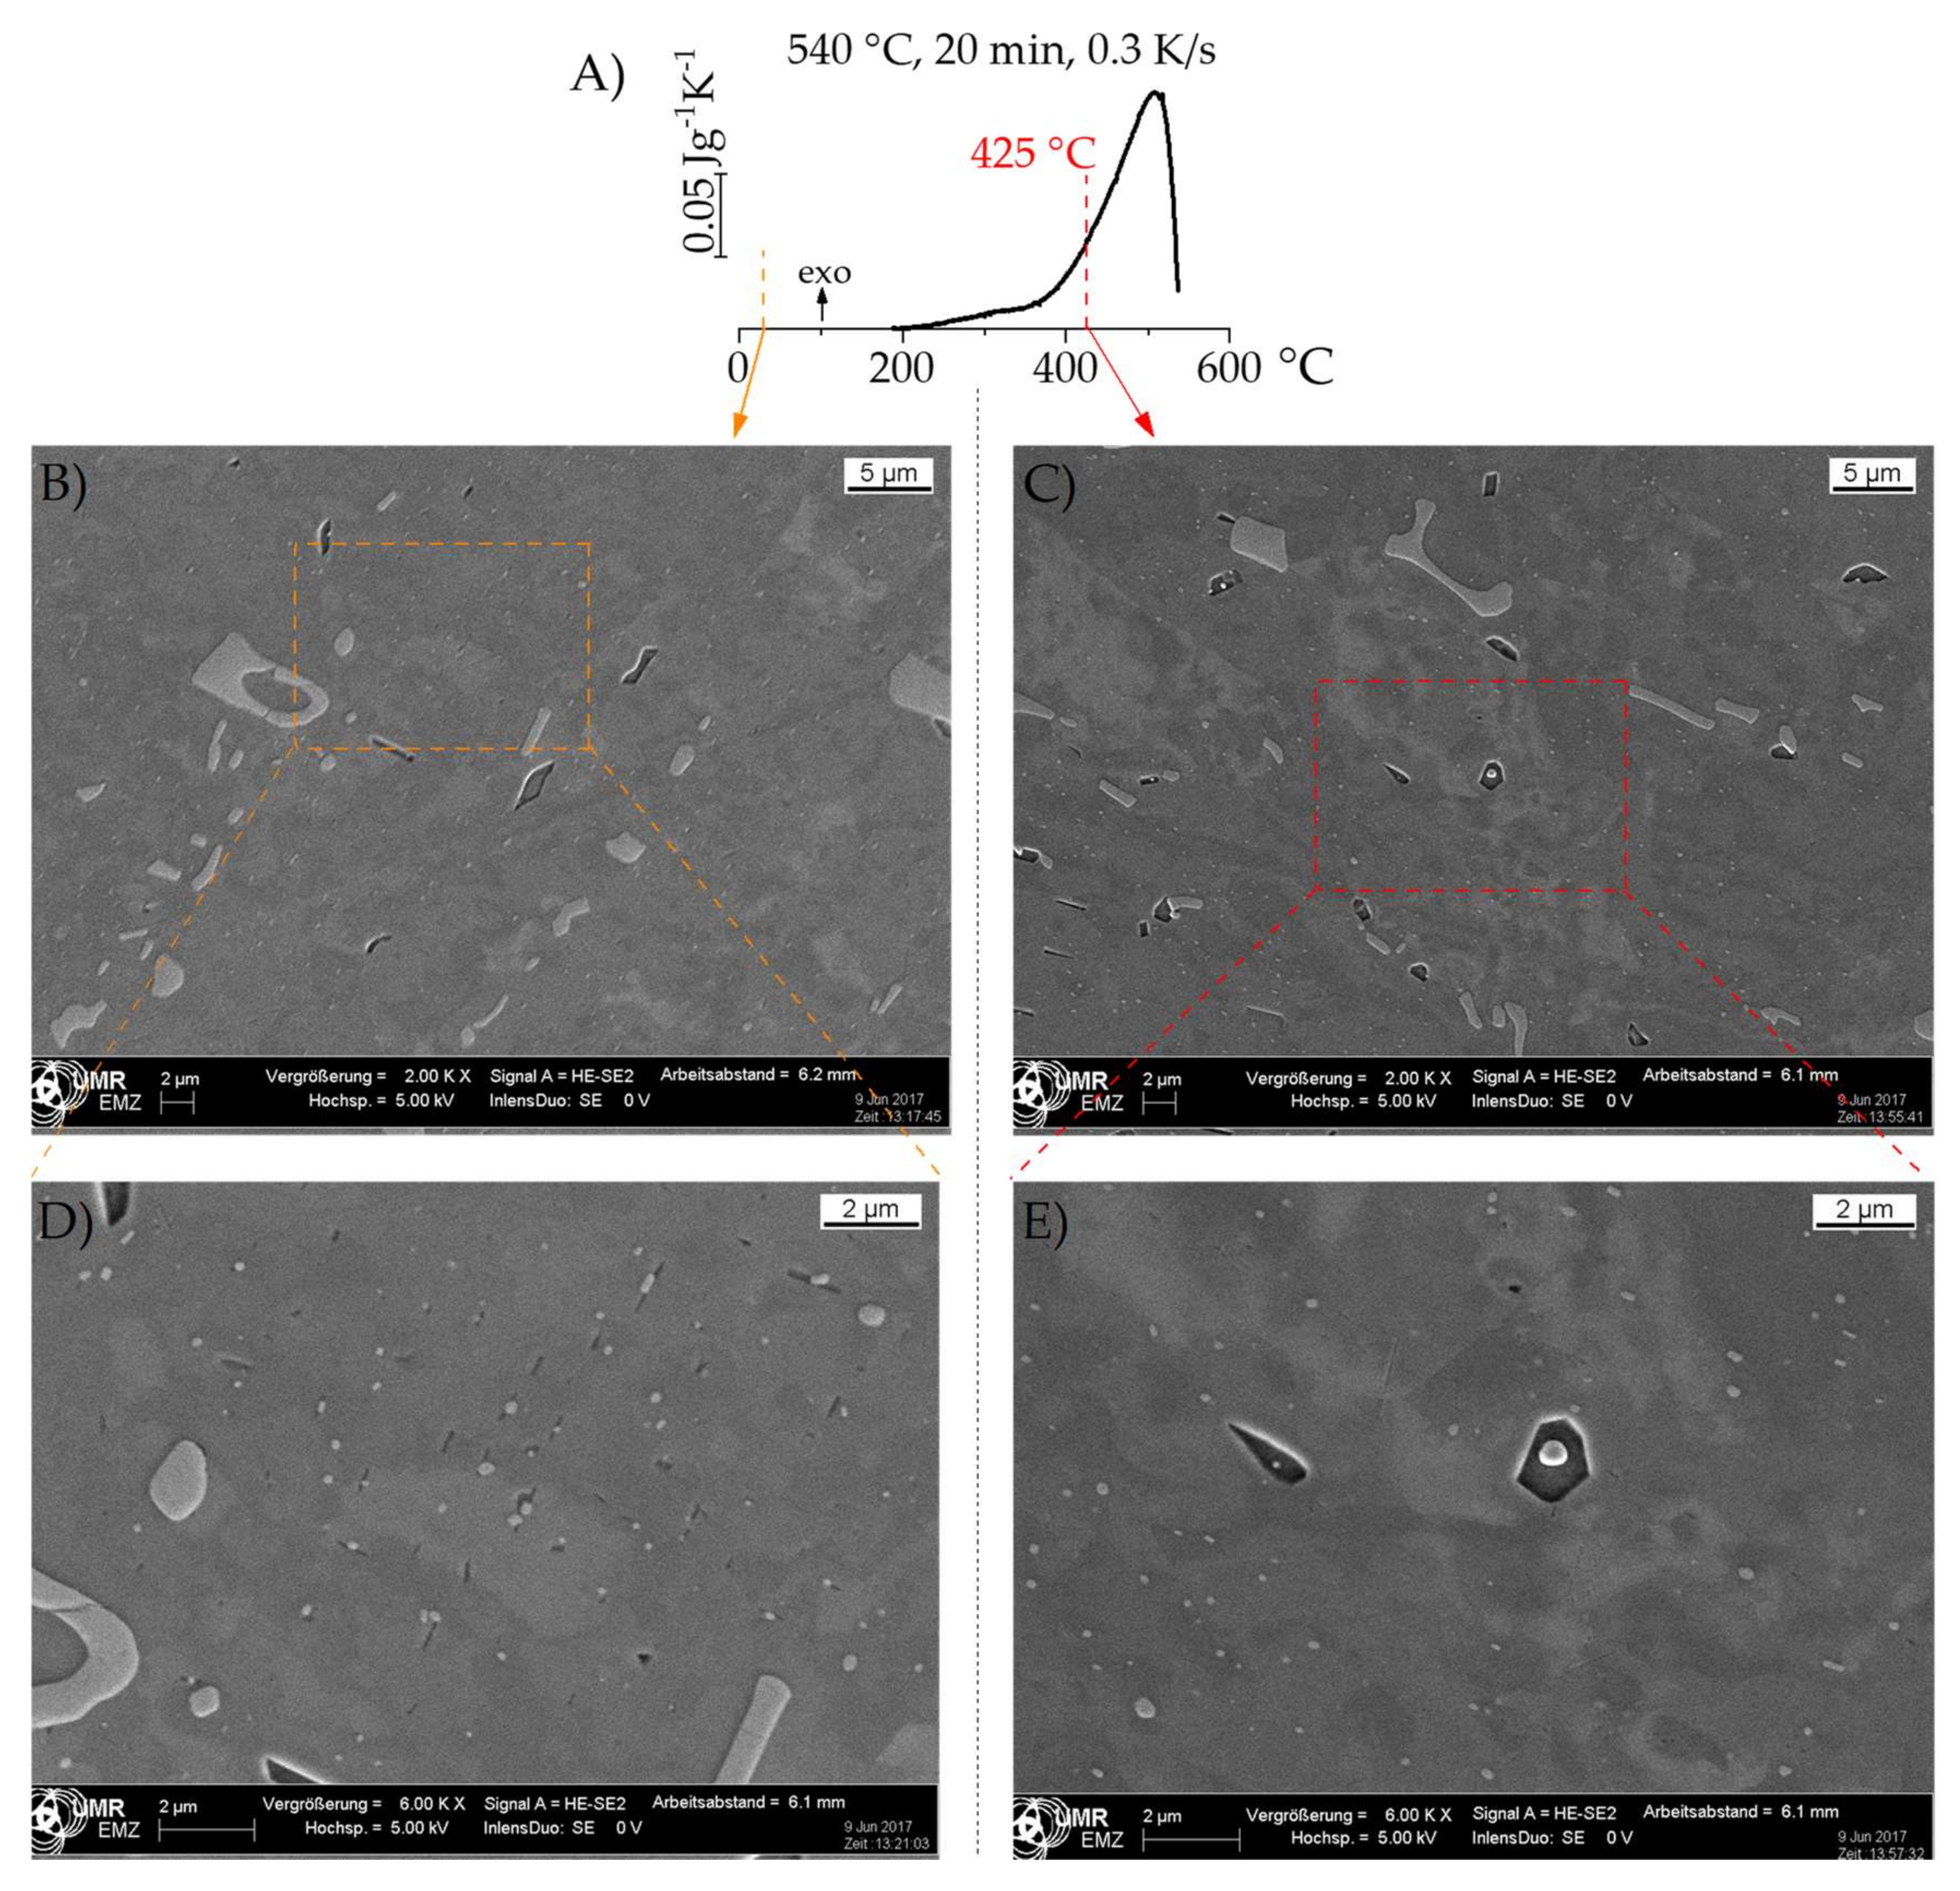
ii.: Taking the cooling rate of 0.3 K/s as an example, cooling from 560 °C and 20 min of soaking causes the precipitation to start at about 500 °C, after a certain degree of undercooling. However, starting from a condition that we claim to be an incomplete solution (e.g., 540 °C solution-annealing temperature), the same cooling rate of 0.3 K/s causes the immediate onset of precipitation when the temperature drops below 540 °C, with precipitation thus starting 40 K higher than that in the complete solution. Two different types of precipitation onset (1: immediate precipitation onset with the onset of cooling; and 2: onset of precipitation after a certain degree of undercooling) were attributed to the observations from the quasi-binary Al-Mg2Si phase diagram, which depended on whether the cooling starts from the α-Al solid-solution single-phase region or from the α-Al + β-Mg2Si two-phase region [21].
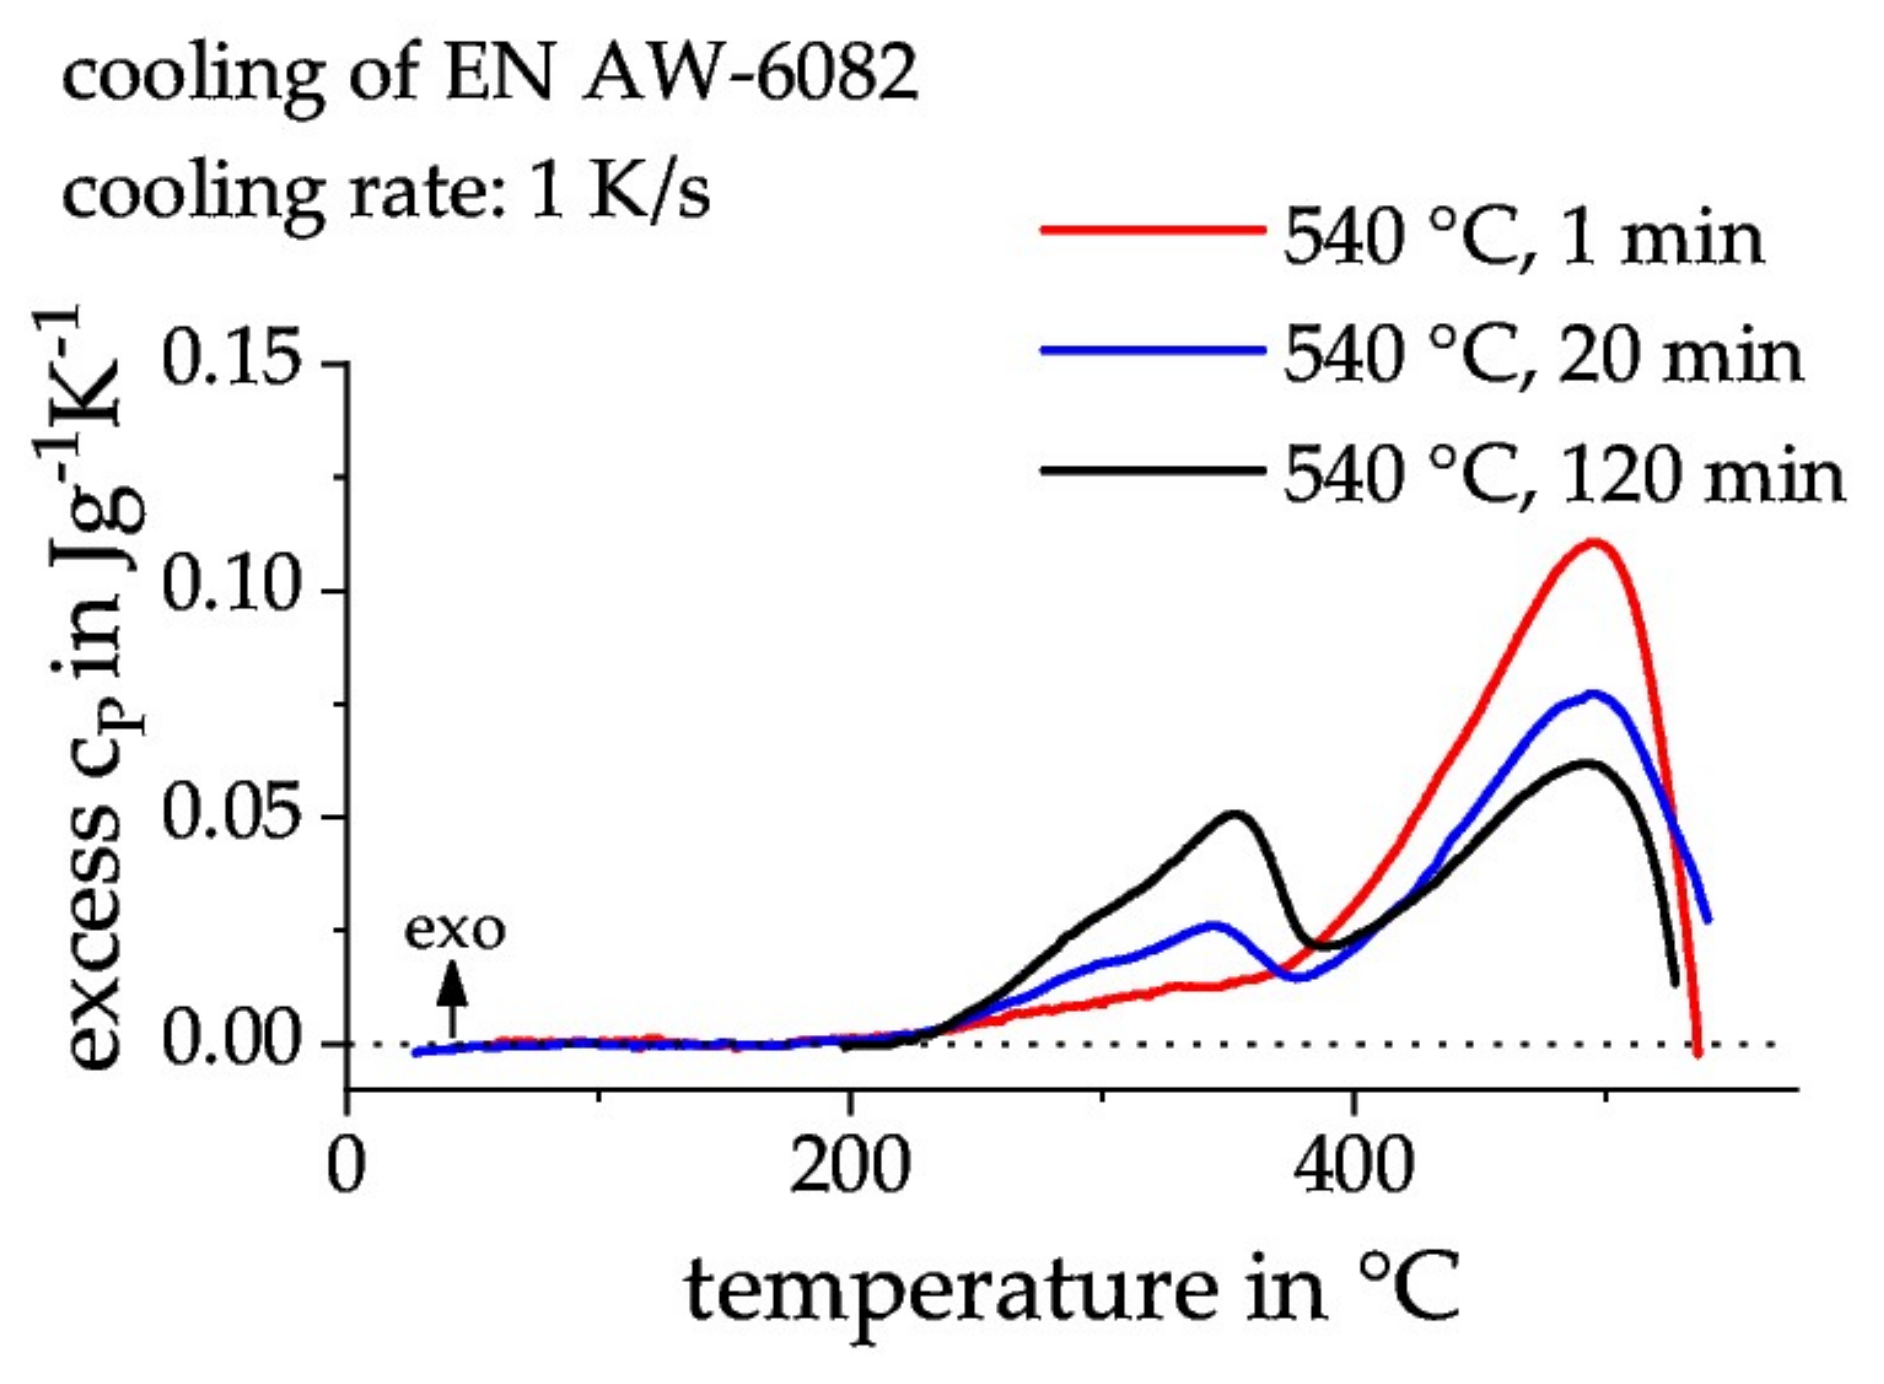
iii.: The three applied solution temperatures are indicated in the quasi-binary phase diagram Al-Mg2Si and shown in Figure 6, as well as the estimated maximum amount of Mg2Si for the particular batch of EN AW-6082 that was used in the experiments. While the comparison of EN AW-6082 with this phase diagram is a simplification, the precipitation of the β-Mg2Si phase from the α-Al solid solution is dominating the HTRs during cooling from the solution treatment of AlMgSi alloys [5], including two batches of EN AW-6082. It is thus inferred that the most likely phase to be considered in terms of complete solution is β-Mg2Si. The equilibrium solvus of the estimated β-Mg2Si mass fraction is close to 540 °C, which is additionally supported by the DSC experiments shown in Figure 7. The latter used soaking durations ranging from 1 to 120 min at 540 °C that preceded a cooling rate of 1 K/s. A complete solution was still not attained after two hours of soaking at 540 °C, with the Mg2Si precipitation starting concurrently with the onset of cooling. Therefore, it is reasonable to assume that the alloy batch-specific equilibrium β-Mg2Si solvus temperature is close to 540 °C (very likely a few Kelvin above 540 °C).
It can thus be concluded that a relatively short soaking at a high enough temperature (some 10 K above the alloy specific solvus) can result in the intended complete solution. The formation of a complete solution requires both an appropriate solution temperature and soaking duration to be chosen. As seen from the above results, a complete solution as the initial condition for subsequent cooling results in the initiation of precipitation temperatures that are some 10 Kelvin lower that the initial condition of an incomplete solution. This aspect can be quite important in an industrial/production context. For instance, the transportation of the solution-treated part from the furnace to the quenching media is unavoidably going to experience some cooling before quenching. Ensuring a complete solution during the technological application of the solution treatment can thus help to avoid quench-induced precipitation. This aspect might be of even more relevance, because the general quench sensitivity is also increased if the dissolution remains incomplete during the solution treatment (see the discussion on hardness below).

3.3. Analysis of the Quench-Induced Microstructure

The schematic temperature-time profile applied for the heat treatment of samples used for the microstructure analysis is shown in Figure 8. The parameters were chosen based on the cooling DSC results. For clarity, the corresponding DSC curves are plotted next to the microstructure images in Figure 9A and Figure 10A. Figure 9 and Figure 10 show the DSC curves and representative SEM-SE images from 540 °C and 560 °C, respectively, with 20 min of soaking and a cooling rate of 0.3 K/s. The cooling was continued at this low rate down room temperature in Figure 9B,D and Figure 10B,D. Alternatively, the low cooling rate of 0.3 K/s was applied until 425 °C, and subsequently overcritically gas-quenched (~400 K/s) to room temperature (see Figure 8) in Figure 9C,E and Figure 10C,E.
Some similar microstructural components are observed in the SEM-SE images under both conditions. This is exemplified through the coarse primary, intermetallic, mostly irregularly shaped particles in a variety of dimensions in the µm range. These primary particles appear bright in the SEM-SE images. EDX revealed them to be enriched in Fe, Mn, and Si. Those primary particles most likely precipitated from the melt.
Coarse dark particles are also seen in Figure 9. EDX showed an enrichment of Mg and Si for these particles. Based on both our experience and the published literature, these are β-Mg2Si-phase particles [4,5]. Nucleation of Mg2Si is reported to occur on primary Fe, Mn, and Si rich intermetallic particles. Such primary particles are also often found within the Mg2Si particles (e.g., see Figure 9E). Figure 10 contains fewer and smaller Mg2Si particles, corresponding to the weaker HTR. As seen from Figure 9C,E, as well as Figure 10C,E, Mg2Si is already present when the HTRs are nearly finished, as detected by DSC. This is in perfect agreement with previous studies that report the HTRs in AlMgSi alloys were predominantly caused by the precipitation of β-Mg2Si-phase particles [5].
These Mg2Si particles are found almost unchanged if there is continuous cooling down to room temperature. Another population of smaller, dark, regularly shaped, elongated particles is also precipitated during the LTRs, as seen from the SEM-SE images (Figure 9D and Figure 10D). Plate- or rod-shaped, elongated particles can even better be detected via TEM (see Figure 10F). Their sizes range from a few hundreds of nm to a few µm in length, and some tens to a few hundreds of nm in diameter. Previous studies suggest that these particles likely belong to the B′-Mg5Si4Al2 phase [5]. Nucleation of the quench-induced B′-particles is reported to occur on dispersoids [5], and thus forms a much smaller and finer distribution of nucleation sites compared to the nucleation sites of the HTRs precipitation of β-Mg2Si.
The following inferences can be made with regard to the onset condition of cooling, which largely depend on whether the solution is a complete or incomplete solution. The HTRs dominate the quench-induced precipitation behavior, and thus the DSC curve, if the cooling starts from an incomplete solution. As discussed above, the HTRs are predominantly related to the precipitation of the β-Mg2Si phase. Although it is difficult to statistically conclude this possibility from the two SEM images plotted here, a comparison of the microstructures after cooling from 540 °C (Figure 9C) and 560 °C (Figure 10C) shows that there is a higher number of even larger Mg2Si particles if the cooling started with an incomplete solution (Figure 9C). This is also supported by a number of additionally recorded SEM images that are not shown here. Furthermore, the DSC peak areas, which are proportional to the volume fraction precipitated [2], suggest that the precipitated volume fraction of Mg2Si is much higher if the same cooling rate is applied to an initially incomplete solution. However, if the cooling is starting from a complete solution (with respect to Mg2Si), the quench-induced precipitation is dominated by the LTRs, which are related to the precipitation of B′-Mg5Si4Al2. The latter considerations particularly hold if one specific (medium to fast) cooling rate is considered to start from the different initial conditions of an incomplete or complete solution. We interpret this to be related to the following: if the dissolution of the remaining Mg2Si is incomplete, there is no need for new nucleation of that phase, and the existing Mg2Si particles are immediately able to grow again with the onset of cooling. The Mg2Si-precipitation out of a complete solution, though, requires a certain amount of time to initiate the precipitation by nucleation. Thus, dynamic suppression of the precipitation of this equilibrium phase is much easier, which substantially reduces the precipitated volume fraction at the specific cooling rate. In general, it can be stated, that quench-induced precipitates reduce the atomic fraction of alloying elements in solid solution which are available for final aging. This reduced amount of solutes is reducing the age hardening potential as the amount of strength increasing precipitates will be lowered.

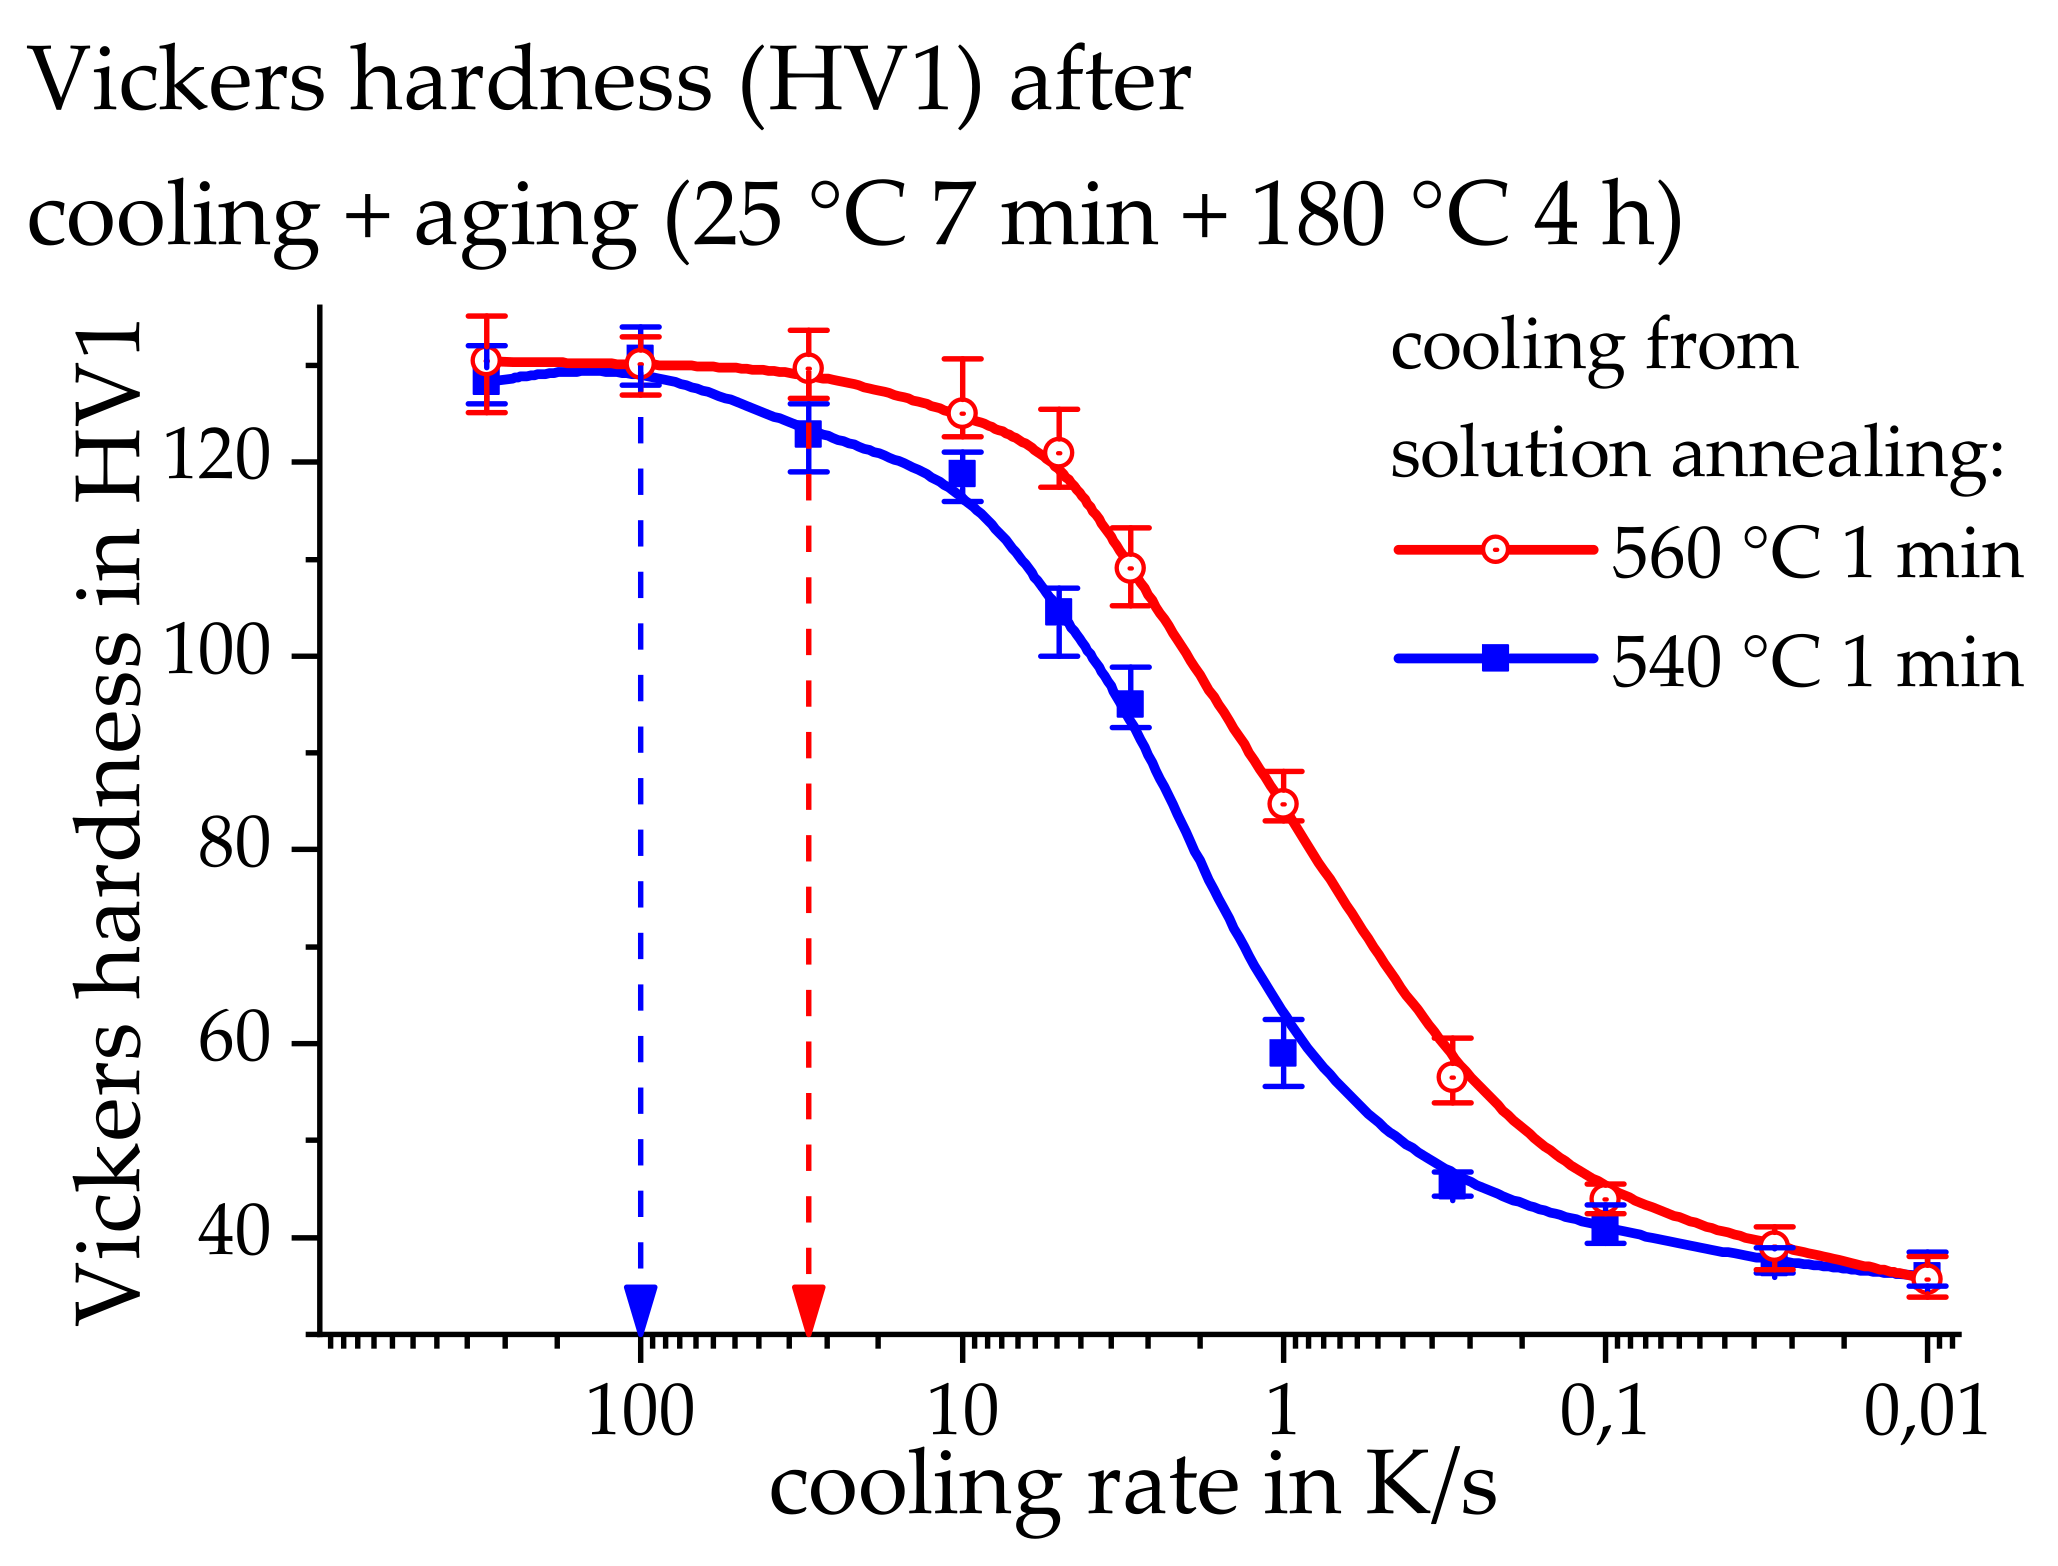
3.4. Hardness Development after Cooling at Various Rates and Additional Artificial Aging

Incomplete dissolution accelerates the kinetics of quench-induced precipitation due to a reduced effort for nucleation, particularly for coarse high-temperature precipitates. The influence of an incomplete versus complete solution, with respect to the quench sensitivity of EN AW–6082, is also obvious from the hardness values after cooling and subsequent aging. Figure 11 compares the hardness after cooling from the 540 and 560 °C solution-annealing temperatures for 1 min and subsequent artificial aging as functions of cooling rate.
These two cases show a sigmoidal increase in hardness values from slow to fast cooling. The upper critical cooling rate (uCCR) is defined as the slowest cooling rate at which precipitation is completely inhibited. The hardness after aging thus reaches a saturation level at this and faster cooling rates. The uCCR for the complete dissolution of EN AW-6082, with solution-annealing at 560 °C and 1 min of soaking, is found to be about 30 K/s, whereas the uCCR for incomplete dissolution is about 100 K/s, with solution-annealing at 540 °C and 1 min of soaking. The uCCR for EN AW-6082 may thus increase by a factor of three if the solution treatment is terminated leaving an incomplete dissolution.
A hardness of about 85 HV1 is obtained after a cooling rate of 1 K/s is applied from the solution-annealing temperature of 560 °C and 1 min of soaking (initially complete dissolution, with quench-induced precipitation dominated by B′), and aging. The same cooling rate, starting from 540 °C and 1 min of soaking (initially incomplete dissolution, with quench-induced precipitation dominated by β-Mg2Si) leads to only about 60 HV1 after aging. This suggests that at medium cooling rates, incomplete dissolution may reduce the hardness by up to 30 % compared to complete dissolution as the onset condition. It is thus seen that, particularly for technologically relevant cooling, the danger of a substantial hardness reduction is present in the case of incomplete dissolution during solution treatment.
It still remains unclear as to why similar hardness values are achieved for both solution conditions at the highest cooling rates. The expectation is that the undissolved Mg2Si should lead to a reduced saturation level for hardness after aging. It might be that the hardness testing is not sufficient to detect this difference, thus requiring tensile testing to potentially detect these differences in the future.
These results are also especially important for welding with rapid heating and almost no soaking in the heat-affected zones (HAZ), particularly since the HAZ microstructures of aluminum alloys cannot be predicted with conventional continuous cooling precipitation (CCP) diagrams. For steels special welding-time-temperature-transformation diagrams are available [22]. However, such special welding CCP diagrams do not exist for aluminum alloys and thus need to be developed in future.

4. Conclusions

This work, for the first time, quantifies the difference between complete and incomplete dissolution with respect to quench sensitivity in terms of critical cooling rate and potential loss in aging/hardening potential. The above considerations on the AlMgSi wrought alloy EN AW-6082 have led to the following conclusions:
  • The precipitation behavior during cooling after solution-annealing is significantly dependent upon whether complete or incomplete dissolution occurred during the solution treatment, particularly for medium to faster cooling rates (which are technologically relevant).
  • The undissolved Mg2Si particles can instantly begin to grow within the solution at the onset of cooling when there is incomplete dissolution. Thus, undissolved particles allow for the immediate start of quench-induced precipitation.
  • Quench-induced precipitation requires nucleation when there is complete dissolution. The required nucleation, in combination with dynamic suppression due to cooling, causes a certain degree of undercooling before the onset of precipitation.
  • Incomplete dissolution increases the quench sensitivity. The upper critical cooling rate may increase by a factor of three. At medium cooling rates, the hardness is reduced by up to 30 %.
  • Complete dissolution is highly recommended to ensure optimal alloy performance that exploits its full age-hardening potential. This can be achieved by using an appropriately high-solution temperature while maintaining a short soaking duration (a few minutes).

Acknowledgments

The authors acknowledge funding of this work from the German Research Foundation (DFG), within the scope of the research project “Materials Based Simulation of Limit Load Behaviour for Welded Aluminium Structures” (DFG RE3808/2-1 and DFG SA 960/7-1).

Author Contributions

The DSC measurements, hardness tests and evaluations were performed by Philipp Wiechmann and Hannes Fröck. The SEM and TEM analyses were performed by Armin Springer. All authors contributed to the discussion of the results. The manuscript was written by Hannes Fröck and Benjamin Milkereit. All authors have revised the text and given their approval for the final version of the manuscript.

Conflicts of Interest

The authors declare no conflict of interest.

References

  1. Polmear, I.J. Light Alloys. From Traditional Alloys to Nanocrystals, 4th ed.; Elsevier Butterworth-Heinemann: Amsterdam, The Netherlands, 2006. [Google Scholar]
  2. Milkereit, B.; Kessler, O.; Schick, C. Recording of continuous cooling precipitation diagrams of aluminium alloys. Thermochim. Acta 2009, 492, 73–78. [Google Scholar] [CrossRef]
  3. Kammer, C. Aluminium Taschenbuch Band 1; Aluminium-Verlag, Aluminium-Zentrale Düsseldorf: Düsseldorf, Germany, 1998. [Google Scholar]
  4. Milkereit, B.; Wanderka, N.; Schick, C.; Kessler, O. Continuous cooling precipitation diagrams of Al-Mg-Si alloys. Mater. Sci. Eng. A 2012, 550, 87–96. [Google Scholar] [CrossRef]
  5. Milkereit, B.; Starink, M.J. Quench sensitivity of Al-Mg-Si alloys: A model for linear cooling and strengthening. Mater. Des. 2015, 76, 117–129. [Google Scholar] [CrossRef]
  6. Ostermann, F. Anwendungstechnologie Aluminium, 3rd ed.; Springer Berlin Heidelberg: Berlin/Heidelberg, Germany, 2014. [Google Scholar]
  7. Sarmast, A.; Serajzadeh, S.; Kokabi, A.H. A study on thermal responses, microstructural issues, and natural aging in gas tungsten arc welding of AA2024-T4. Proc. Inst. Mech. Eng. B J. Eng. Manuf. 2013, 228, 413–421. [Google Scholar] [CrossRef]
  8. Merklein, M.; Maren, J.; Lechner, M.; Kuppert, A. A review on tailored blanks—Production, applications and evaluation. J. Mater. Process. Technol. 2014, 214, 151–164. [Google Scholar] [CrossRef]
  9. Fröck, H.; Graser, M.; Milkereit, B.; Reich, M.; Lechner, M.; Merklein, M.; Kessler, O. Precipitation Behaviour and Mechanical Properties during Short-Term Heat Treatment for Tailor Heat Treated Profiles (THTP) of Aluminium Alloy 6060 T4. MSF 2016, 877, 400–406. [Google Scholar] [CrossRef]
  10. Geiger, M.; Merklein, M.; Vogt, U. Aluminum tailored heat treated blanks. Prod. Eng. Res. Dev. 2009, 3, 401–410. [Google Scholar] [CrossRef]
  11. Kerausch, M.; Merklein, M.; Geiger, M. Improved material flow for deep drawing of aluminium blanks by local laser heat treatment. In Proceedings of the 10th International Conference on Sheet Metal, SheMet 2003; Kals, H.J.J., Shirvani, B., Sing, U.P., Geiger, M., Eds.; University of Ulster: Jordanstown, UK, 2003; pp. 73–80. [Google Scholar]
  12. Strobel, K.; Lay, M.D.H.; Easton, M.A.; Sweet, L.; Zhu, S.; Parson, N.C.; Hill, A.J. Effects of quench rate and natural ageing on the age hardening behaviour of aluminium alloy AA6060. Mater. Charact. 2016, 111, 43–52. [Google Scholar] [CrossRef]
  13. Saito, T.; Marioara, C.D.; Røyset, J.; Marthinsen, K.; Holmestad, R. The effects of quench rate and pre-deformation on precipitation hardening in Al–Mg–Si alloys with different Cu amounts. Mater. Sci. Eng. A 2014, 609, 72–79. [Google Scholar] [CrossRef]
  14. Kim, J.; Hayashi, M.; Kobayashi, E.; Sato, T. Influence of Si addition on quenching sensitivity and formation of nano-precipitate in Al-Mg-Si alloys. J. Nanosci. Nanotechnol. 2016, 16, 1814–1817. [Google Scholar] [CrossRef] [PubMed]
  15. Osten, J.; Milkereit, B.; Schick, C.; Kessler, O. Dissolution and precipitation behaviour during continuous heating of Al-Mg-Si alloys in a wide range of heating rates. Materials 2015, 8, 2830–2848. [Google Scholar] [CrossRef]
  16. Sarge, S.M.; Höhne, G.W.H.; Hemminger, W.F. Calorimetry. Fundamentals Instrumentation and Applications; Wiley-VCH Verlag GmbH & Co. KGaA: Weinheim, Germany, 2014. [Google Scholar]
  17. Milkereit, B.; Kessler, O.; Schick, C. Precipitation and Dissolution Kinetics in Metallic Alloys with Focus on Aluminium Alloys by Calorimetry in a Wide Scanning Rate Range. In Fast Scanning Calorimetry; Schick, C., Mathot, V., Eds.; Springer International Publishing: Cham, Switzerland, 2016; pp. 723–773. [Google Scholar]
  18. Kemsies, R.H.; Milkereit, B.; Wenner, S.; Holmestad, R.; Kessler, O. In situ DSC investigation into the kinetics and microstructure of dispersoid formation in Al-Mn-Fe-Si(-Mg) alloys. Mater. Des. 2018, 146C, 96–107. [Google Scholar] [CrossRef]
  19. Fröck, H.; Graser, M.; Reich, M.; Lechner, M.; Merklein, M.; Kessler, O. Influence of short-term heat treatment on the microstructure and mechanical properties of EN AW-6060 T4 extrusion profiles: Part A. Prod. Eng. Res. Dev. 2016, 10, 383–389. [Google Scholar] [CrossRef]
  20. Schumacher, P.; Pogatscher, S.; Starink, M.J.; Schick, C.; Mohles, V.; Milkereit, B. Quench-induced precipitates in Al–Si alloys: Calorimetric determination of solute content and characterisation of microstructure. Thermochim. Acta 2015, 602, 63–73. [Google Scholar] [CrossRef]
  21. Milkereit, B. Kontinuierliche Zeit-Temperatur-Ausscheidungs-Diagramme von Al-Mg-Si-Legierungen. Ph.D. Thesis, University of Rostock, Rostock, Germany, 2011. [Google Scholar]
  22. Zhang, Z.; Farrar, R.A. An Atlas of Continuous Cooling Transformation (CCT) Diagrams Applicable to Low Carbon Low Alloy Weld Metals; Bourne Press Ltd.: Southampton, UK, 1995. [Google Scholar]
Figure 1. Evaluation procedure of the heating experiments. (A) Raw data measurements; (B) subtraction of baseline measurements from the sample measurements; (C) normalization of the data; (D) processed data.
Metals 08 00265 g001
Figure 2. Differential scanning calorimetry (DSC) heating curves of EN AW–6082 initially T651 as a function of temperature. The solution temperatures chosen for later experiments are indicated.
Metals 08 00265 g002
Figure 3. DSC cooling curves of EN AW-6082 (initially T651) with cooling rates from 0.01 up to 5 K/s after solution-annealing at (A) 540 °C, (B) 550 °C and (C) 560 °C for 1 min (red) and 20 min (black).
Metals 08 00265 g003
Figure 4. DSC cooling curves of EN AW-6082 (initially T651), with cooling rates ranging from 0.01 to 5 K/s and after solution-annealing at various conditions. (A) Soaking duration of 1 min and (B) 20 min. The three different applied temperatures are color-coded to highlight the degree of variability with soaking time and cooling rate.
Metals 08 00265 g004
Figure 5. DSC cooling curves of EN AW-6082, with cooling rates from 0.3 to 5 K/s after solution-annealing, resulting in: (A) an incomplete solution and (B) a complete solution.
Metals 08 00265 g005
Figure 6. Section from the quasi-binary phase diagram Al-Mg2Si (adopted from Polmear [1]). The theoretical maximum amount of β-Mg2Si in this batch of EN AW-6082 (vertical red line), as well as the applied solution temperatures (horizontal lines), is highlighted.
Metals 08 00265 g006
Figure 7. DSC cooling experiments on EN AW-6082 after solution treatment at 540 °C, soaking times of 1, 20, and 120 min, and a cooling rate of 1 K/s.
Metals 08 00265 g007
Figure 8. Schematic time–temperature profile of the heat treatments for the microstructure analysis.
Metals 08 00265 g008
Figure 9. (A) DSC cooling curve after solution-annealing at 540 °C, a 20 min soaking time, and a cooling rate of 0.3 K/s, and (BE) associated scanning electron microscopy (SEM) images at different magnifications.
Metals 08 00265 g009
Figure 10. (A) DSC cooling curve after solution-annealing at 560 °C, a 20 min soaking time, and a cooling rate of 0.3 K/s, and associated (BE) SEM and (F) transmission electron microscopy (TEM) images at different magnifications.
Metals 08 00265 g010
Figure 11. Hardness values (HV1) after cooling and artificial aging, as function of cooling rate, for the following solution-annealing conditions: 540 °C and 560 °C, both with a 1 min soaking time. The upper critical cooling rates (uCCRs) for the two temperatures are indicated by arrows.
Metals 08 00265 g011
Table 1. Mass fractions of the alloying elements in the investigated EN AW–6082 alloy, in %.
EN AW-6082Mass Fraction, in %
SiFeCuMnMgCrZnTi
OES0.830.380.060.480.920.030.010.02
DIN EN 573-30.7–1.3≤0.5≤0.10.4–1.00.6–1.2≤0.25≤0.2≤0.1

