Article

Gas-Solid Reaction Route toward the Production of Intermetallics from Their Corresponding Oxide Mixtures

by
Hesham Ahmed
1,2,*,
R. Morales-Estrella
3,
Nurin Viswanathan
4 and
Seshadri Seetharaman
5
1
Division of Minerals and Metallurgical Engineering, Department of Civil, Environmental and Natural Engineering, Luleå University of Technology, 97187 Luleå, Sweden
2
Department of Minerals Technology, Central Metallurgical Research and Development Institute, Box 87-Helwan, Cairo, Egypt
3
Instituto de Investigación en Metalurgia y Materiales, Universidad Michoacana de San Nicolás de Hidalgo, Ciudad Universitaria, C.P. 58030, Morelia, México
4
Centre of Excellence in Steel Technology (CoEST), Indian Institute of Technology Bombay, 400076 Mumbai, India
5
Royal Institute of Technology (KTH), S-100 44 Stockholm, Sweden
*
Author to whom correspondence should be addressed.
Metals 2016, 6(8), 190; https://doi.org/10.3390/met6080190
Submission received: 29 June 2016 / Revised: 3 August 2016 / Accepted: 10 August 2016 / Published: 17 August 2016
(This article belongs to the Special Issue Intermetallics 2016)

Abstract

:
Near-net shape forming of metallic components from metallic powders produced in situ from reduction of corresponding pure metal oxides has not been explored to a large extent. Such a process can be probably termed in short as the “Reduction-Sintering” process. This methodology can be especially effective in producing components containing refractory metals. Additionally, in situ production of metallic powder from complex oxides containing more than one metallic element may result in in situ alloying during reduction, possibly at lower temperatures. With this motivation, in situ reduction of complex oxides mixtures containing more than one metallic element has been investigated intensively over a period of years in the department of materials science, KTH, Sweden. This review highlights the most important features of that investigation. The investigation includes not only synthesis of intermetallics and refractory metals using the gas solid reaction route but also study the reaction kinetics and mechanism. Environmentally friendly gases like H2, CH4 and N2 were used for simultaneous reduction, carburization and nitridation, respectively. Different techniques have been utilized. A thermogravimetric analyzer was used to accurately control the process conditions and obtain reaction kinetics. The fluidized bed technique has been utilized to study the possibility of bulk production of intermetallics compared to milligrams in TGA. Carburization and nitridation of nascent formed intermetallics were successfully carried out. A novel method based on material thermal property was explored to track the reaction progress and estimate the reaction kinetics. This method implies the dynamic measure of thermal diffusivity using laser flash method. These efforts end up with a successful preparation of nanograined intermetallics like Fe-Mo and Ni-W. In addition, it ends up with simultaneous reduction and synthesis of Ni-WN and Ni-WC from their oxide mixtures in single step.

Graphical Abstract

1. Introduction

Intermetallics are well-suited for applications in high technology, where there is a strong need for materials that can withstand high temperatures. Intermetallics are suitable materials for the manufacture of microstructured tools because of their excellent mechanical properties in regard to wear and mechanical durability. Ni-W alloys for example exhibit enhanced properties such as corrosion resistance and wear resistance. This kind of alloys also can be used for magnetic heads, bearings, magnetic relays, etc. The problem in the utilization of intermetallics is their brittleness which calls for grain refinement. The grain size needed to produce ductility is very small and is difficult to achieve. In this aspect, the gas-solid reaction route is of great advantage in controlling the nano-sized structures. On the other hand, near-net shape forming of metallic powders produced in situ from reduction of corresponding pure metal oxides has not been explored to large extent. Such a process can be probably termed in short as “Reduction-Sintering” process. This methodology can be especially effective in producing components containing refractory metals. Additionally, in situ production of metallic powder from complex oxides containing more than one metallic element may result in in situ alloying during reduction, possibly at lower temperatures. With this motivation, in situ reduction of complex oxides mixtures containing more than one metallic element has been investigated intensively over a period of years in the Department of Materials Science and Engineering, Royal Institute of Technology, Stockholm, Sweden. The strategy adopted by the present authors was to initially study the hydrogen reduction of thin beds of oxide powders leading to intermetallics and refractory metals. In order to produce the intermetallic phases in bulk, fluidized bed technique was adopted in view of the excellent contact between the reactant solid and the gas with achievable high reaction efficiencies; the inter-particle contact would be minimum and the temperature of the reaction would be low. Therefore, both sintering and grain growth in the produced intermetallic phase will be minimum. Moreover, carburization and nitridation of nascent intermetallics could be successfully carried out. A novel method based on material thermal property was explored to track the reaction progress and estimate the reaction kinetics. This method implies the dynamic measure of thermal diffusivity using laser flash method. Gases like H2, CH4 and N2, with low negative impact on the environment were used for simultaneous reduction, carburization, and nitridation, respectively. Thus, the present results are likely to lead to the synthesis of an entirely new series of materials with interesting properties; for example, production of Fe-Mo and Ni-Wi intermetallics with nano-grained structures along with Ni-WN and Ni-WC composites produced by simultaneous reduction from their oxide mixtures in a single step. This novel method was further developed to produce intermetallic coatings on cupper surfaces. Moreover, other intermetallics with superior structure produced from their corresponding oxides have been reported elsewhere [1].

2. Materials and Methods

This section describes relevant details of the experimental techniques and procedures involved in this work. The entire experimental work was carried out within The Department of Materials Science and Technology, Royal institute of technology (KTH), Sweden. The experimental procedures described below do not represent the order in which this work was conducted.

2.1. Materials and Sample Preparation for Kinetic Studies

Table 1 shows the starting materials used for the present work (reduction, reduction-carburization and reduction-nitridation). These studies can be divided in to 3 categories; (1) thermogravimetric studies, (2) fluidized bed studies and (3) thermal diffusivity measurements. In the case of thermogravimetric and fluidized bed studies systems studied were viz., Fe-Mo-O and Ni-W-O. In the case of thermal diffusivity measurements NiO-WO3 powder was studied.
In order to produce stoichiometric Fe2MoO4, powders of Fe, Fe2O3, and MoO3, with mole ratio 4:1:3, were mixed thoroughly using an eccentric oscillator at 200 round per minute. Then the mixture was placed into an iron crucible with 45 mm inner diameter. An iron lid was then welded to the top of the crucible to make it gas tight. Thereafter, the crucible was heated under argon atmosphere at 1173 K for 24 h followed by a similar period of time at 1373 K. The crucible was removed from the hot zone at the end and quenched in water. The Fe2MoO4 thus synthesized was submitted to X-Ray diffraction (XRD) analysis to verify it against its reference pattern corresponding to Powder Diffraction File 00-025-1403.
On the other hand, the excess of oxygen in the nickel oxide was removed by heating the powder to 1273 K in argon and then left to cool down in the furnace. Stoichiometric NiO and WO3 were then mixed in predetermined different ratios to produce Ni-W-O mixtures with different Ni and W content. The oxides were then mixed thoroughly and pressed into briquettes (10 mm in diameter and 5 mm in height), heated up to 873 K, and kept at this temperature overnight (24 h). Then the temperature was raised to 1273 K, and the samples were left to sinter at this temperature for 72 h.

2.2. Methods (Techniques and Procedures)

Both isothermal and non-isothermal experiments were carried out by means of thermogravimetric unit (SETARAM TGA 92, SETARAM instrumentation, Caluire, France) having a detection limit of 1 μg. Complete details of the experimental set up are given elsewhere [2]. Nevertheless, the experimental conditions were adjusted as to obtain the rate of the chemical reaction as the rate controlling mechanism. That is to say, the following parameters were carefully optimized; a hydrogen flow above the starvation rate, a very thin layer of powder (10–40 mg), and an average particle size of about 1–5 µm. Additionally, preliminary experiments were conducted to ensure that there is no external mass transfer effect through the sample bed.
Fluidized bed experiments were conducted in an electrical resistance furnace. A quartz tube with dimensions 1000 mm long and an inner diameter of 15 mm was vertically positioned in the furnace. A porous quartz disc (2 mm thick) was fused in the middle of the reactor, as sample supporter as well as gas distributer. The water content of the off-gases was monitored using a Shimadzu Gas Chromatograph (GC), model GC-2014 with Thermal conductivity Detector (TCD) (Shimadzu Corp., Kyoto, Japan). The fluidized bed reactor was connected to the gas chromatograph by a stainless steel tube of 5 mm inner diameter. Minimum fluidization velocity ( U * m f ) at room temperature was firstly determined experimentally and corresponding U m f values at higher temperatures were calculated according to Equation (1). More details of the experimental setup can be found elsewhere [3]. The fluidized-bed reduction experiments were conducted isothermally. The sample was allowed to rest on the porous disc in the reactor. The powder bed was kept under a continuous flow of argon gas during heating segment. When the desired temperature was reached and stabilized, the inert gas was replaced by hydrogen.
U m f = U * m f ρ r µ r ρ T µ T
where ρ r , µ r , ρ T and µ T stand for the properties of the gas phase, viz. densities and viscosities at room temperature and high temperature, respectively.
A laser flash unit model TC-7000H/MELT provided by Sinku-Rico, Inc., Yokohama, Japan was used for thermal diffusivity measurements. The laser beams irradiate the top side of the sample and provides an instantaneous energy pulse. The laser energy is then absorbed by the top surface of the sample and diffuses through the sample down to the other side. Immediately after the laser flash, the temperature of the other side (the rear face) is recorded using a photovoltaic infrared detector. The increase in temperature of the rare surface of the sample was plotted against time. Further details of instrument and procedure are reported in an earlier publication [4].

3. Results and Discussion

In the present section the data obtained for Fe-Mo-O and Ni-W-O systems will be shown and discussed separately.

3.1. Fe-Mo-O System

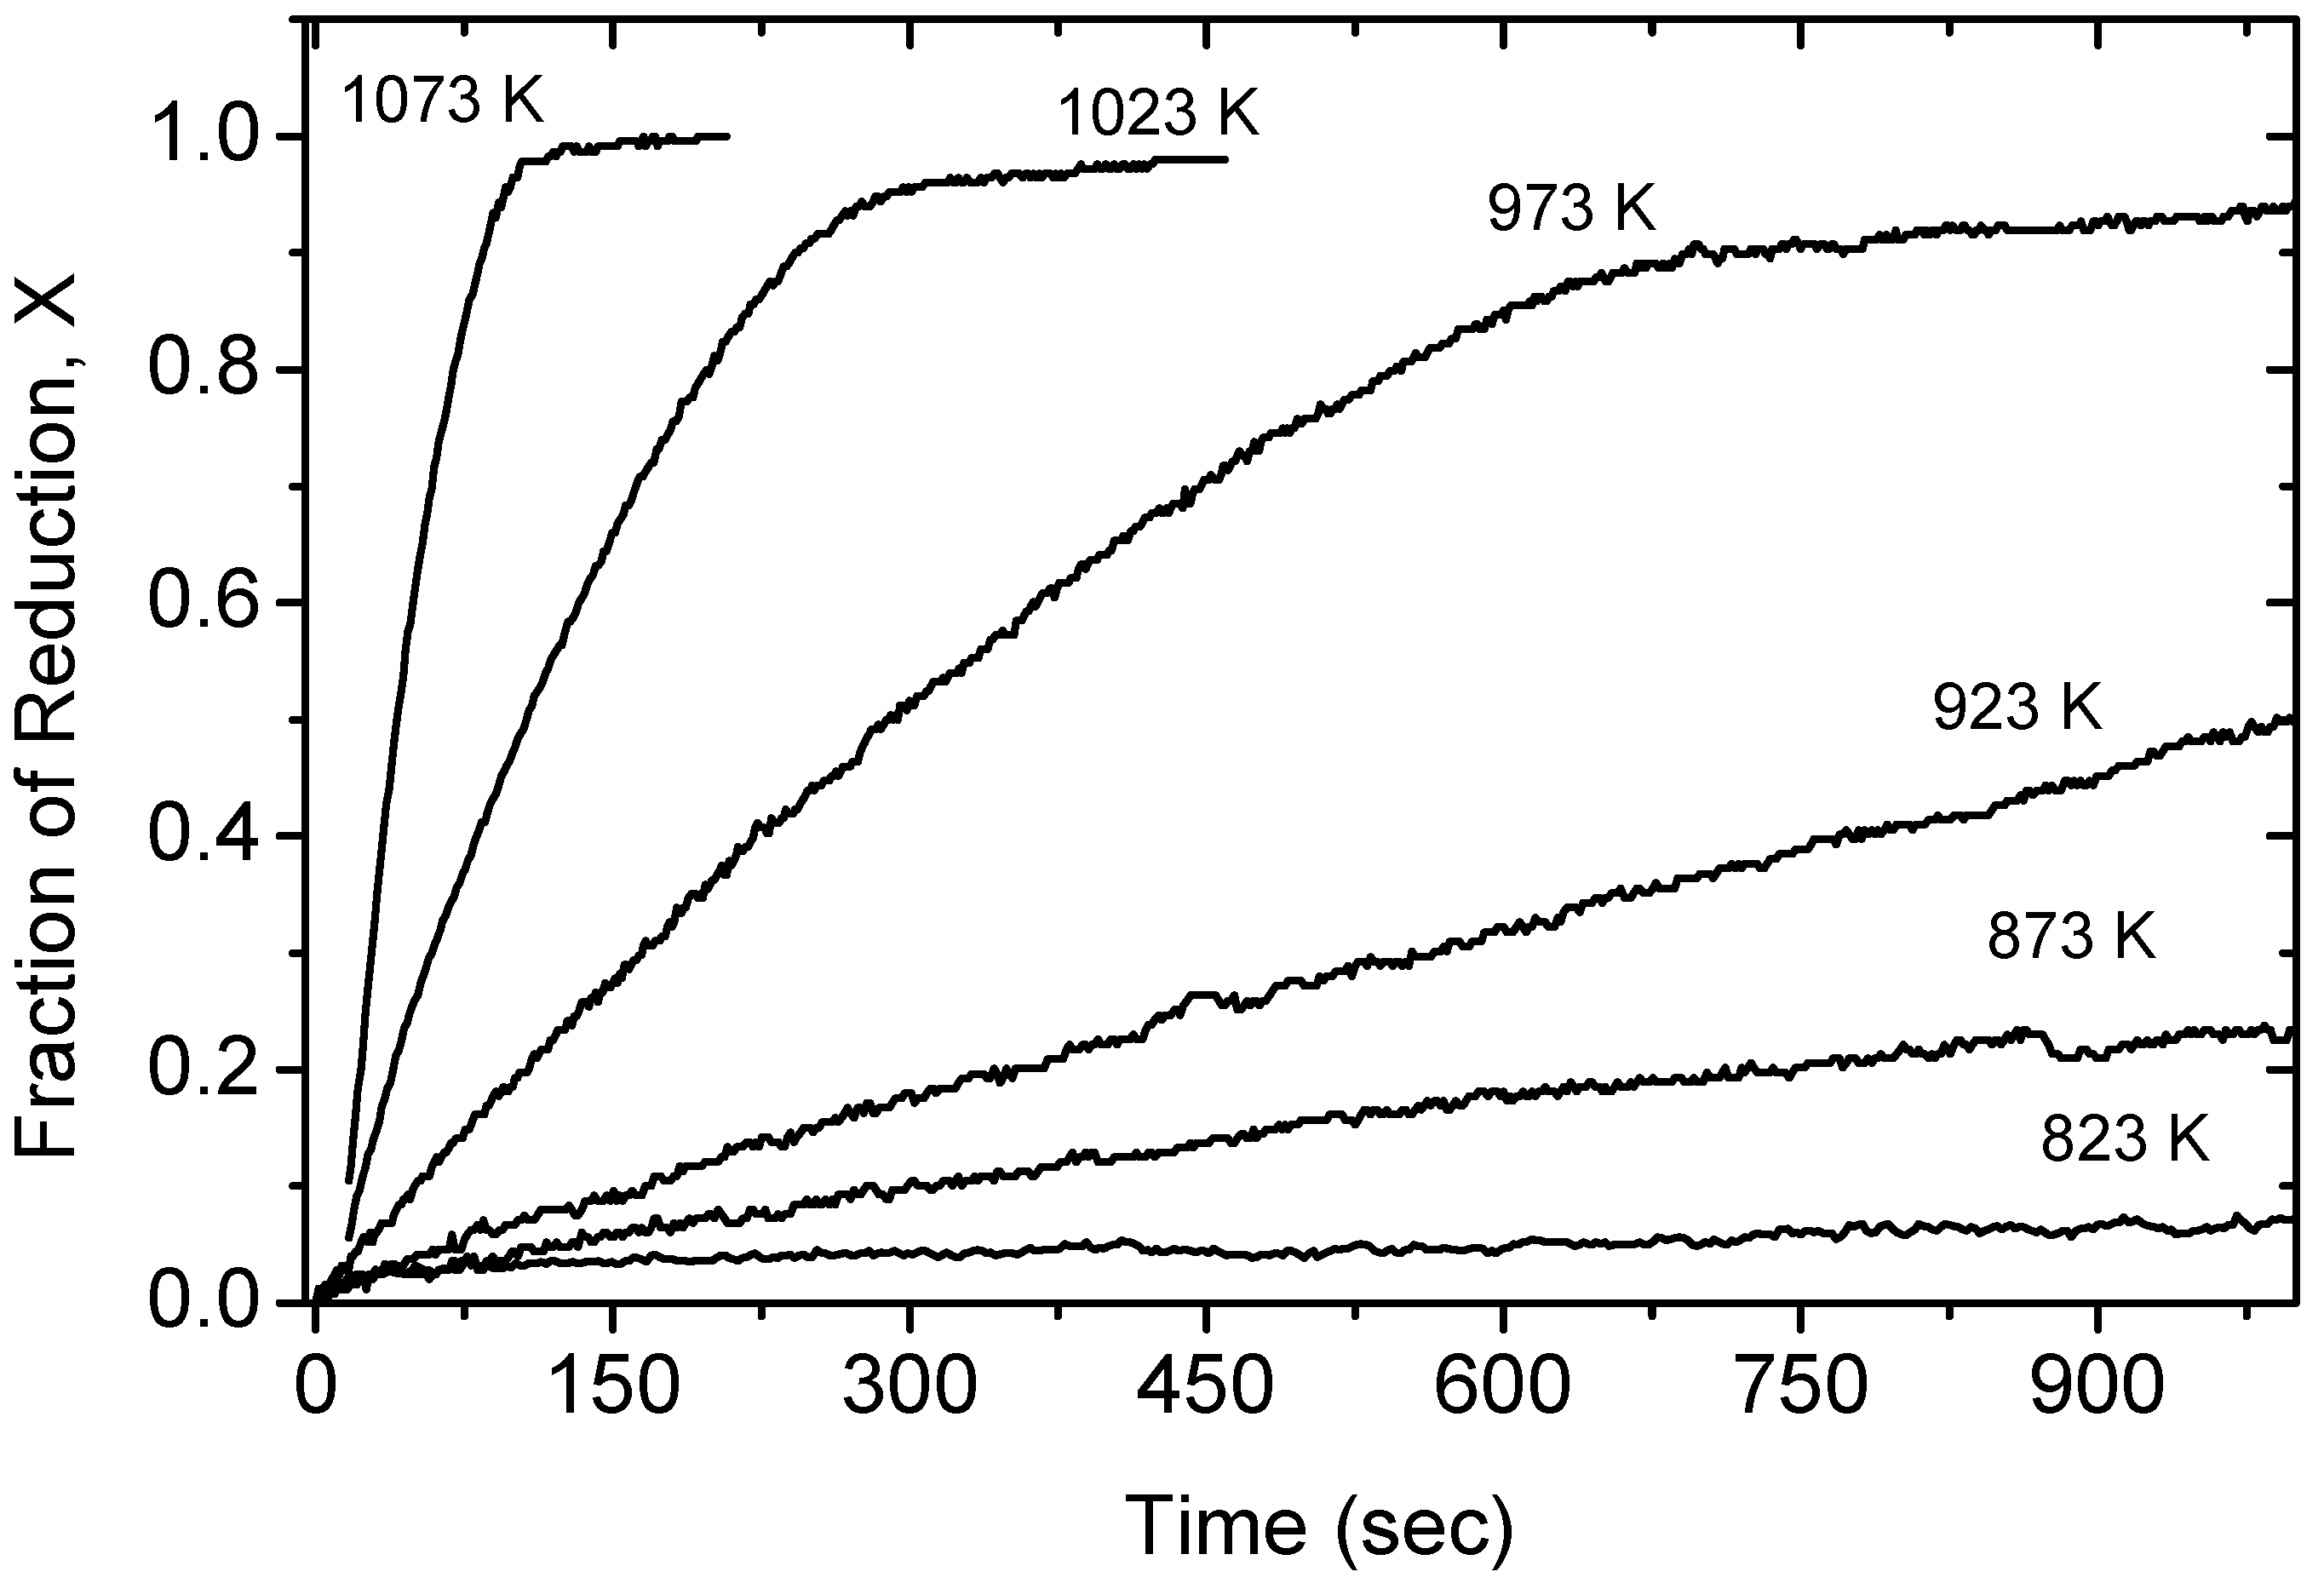
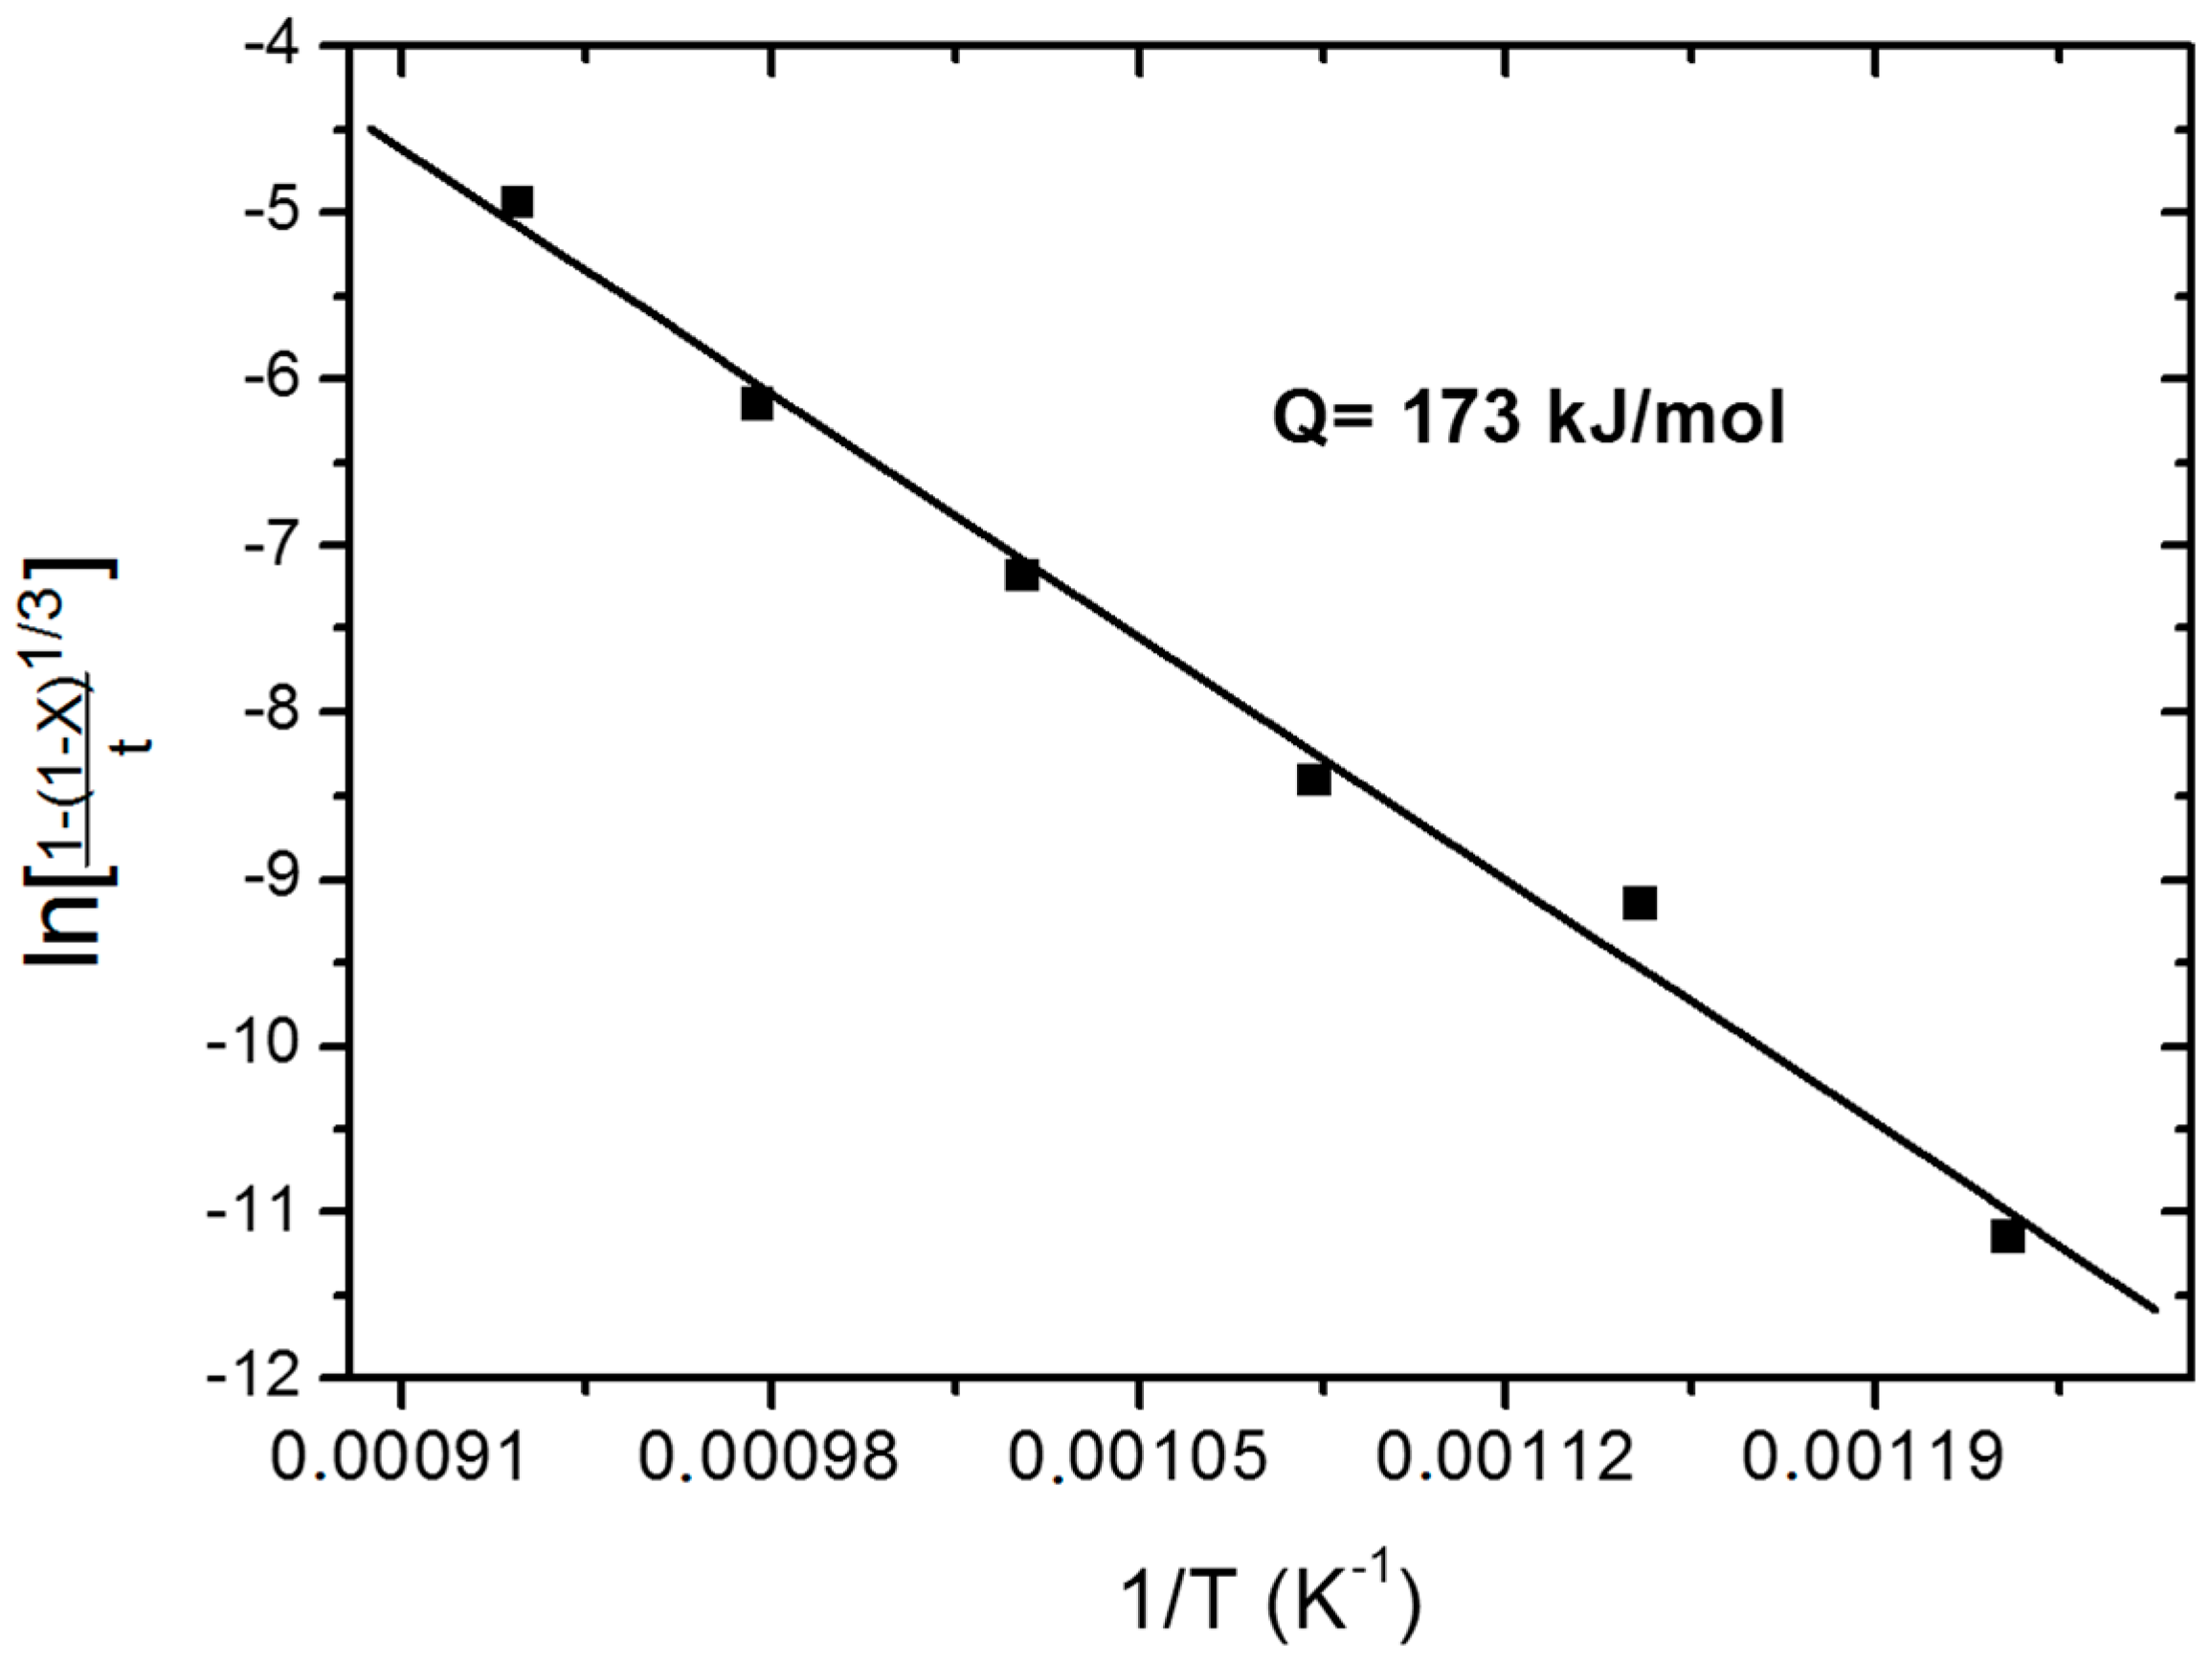
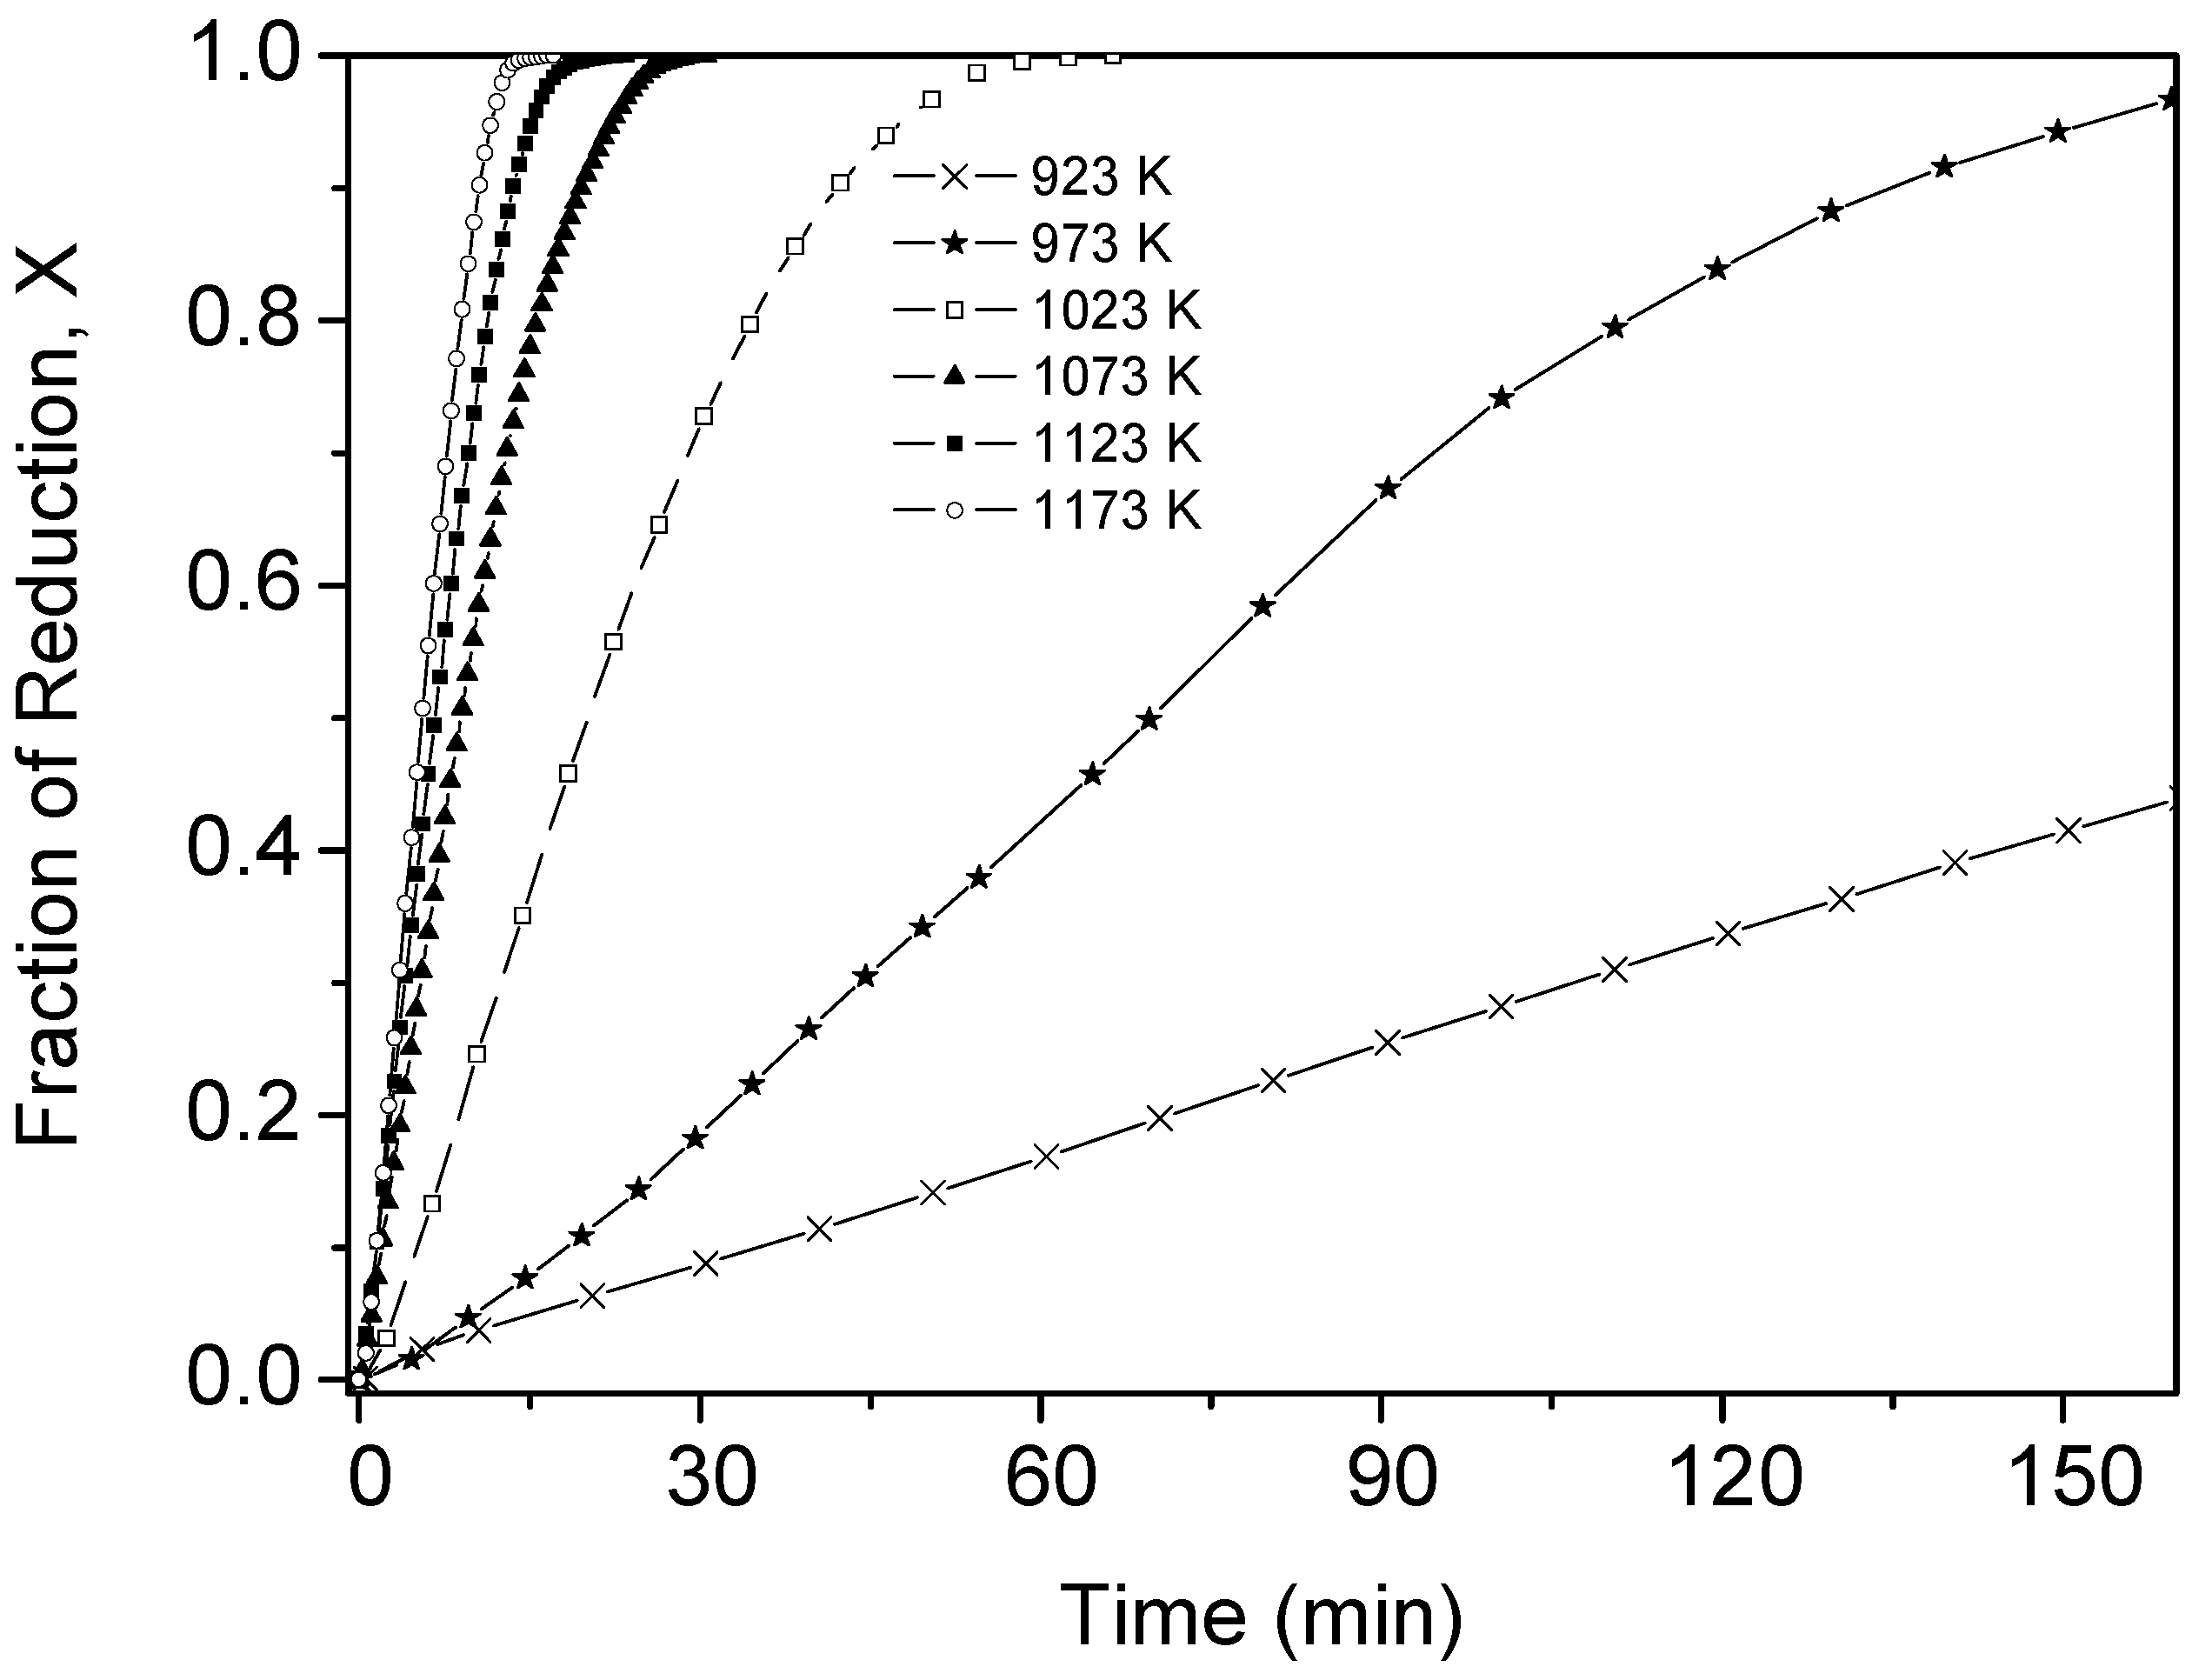
3.1.1. Isothermal Reduction of Fe2MoO4

Figure 1 shows the reduction fraction (X) as a function of time for the reduction of iron molybdate by hydrogen in the temperature range of 823–1073 K. The fractional reduction, X, is defined as the ratio of the instant mass loss, ∆mt, over the theoretical final mass loss, ∆m∞, (calculated based on the loss of four oxygen atoms per Fe2MoO4 unit). It is clearly seen that, under the prevailing experimental conditions, the reduction process is sensitive to temperatures, which confirms that the rate of the chemical reaction is the rate controlling step. Moreover, the reduction curves suggested a single step reaction. XRD analyses on partially reduced samples revealed only Fe2MoO4 and Fe2Mo phases. The completely reduced product was established to be a homogeneous Fe2Mo intermetallic phase; the existence of which had been a controversy over the years [5,6,7].
Hence, the chemical reaction for the reduction of Fe2MoO4 by hydrogen gas can be expressed as follows
1/4Fe2MoO4(s) + H2(g) = 1/4Fe2Mo(s) + H2O(g)
The kinetic analysis of the gas-solid reaction was worked out using the shrinking core model. Such model was combined with the Arrehnius rate law leading to the following expression [2]:
[ 1 ( 1 X ) 1 / 3 ] t = M Fe 2 MoO 4 P H 2 k 0 ρ Fe 2 MoO 4 r 0 exp ( Q R T )
where, t is instant time, r0 is the particle initial radius, ρ Fe 2 MoO 4 and M Fe 2 MoO 4 are the density and molecular weight of Fe2MoO4, respectively, k0 is the frequency factor from the Arrhenius plot, P H 2 is the partial pressure of hydrogen, Q is the activation energy of the reaction, T is the temperature in K, and R is the gas constant. The plot of left hand side of Equation (2) as a function of 1/T is given in Figure 2. From the slopes of the plot, the corresponding activation energy is found to be 173 kJ/mol.

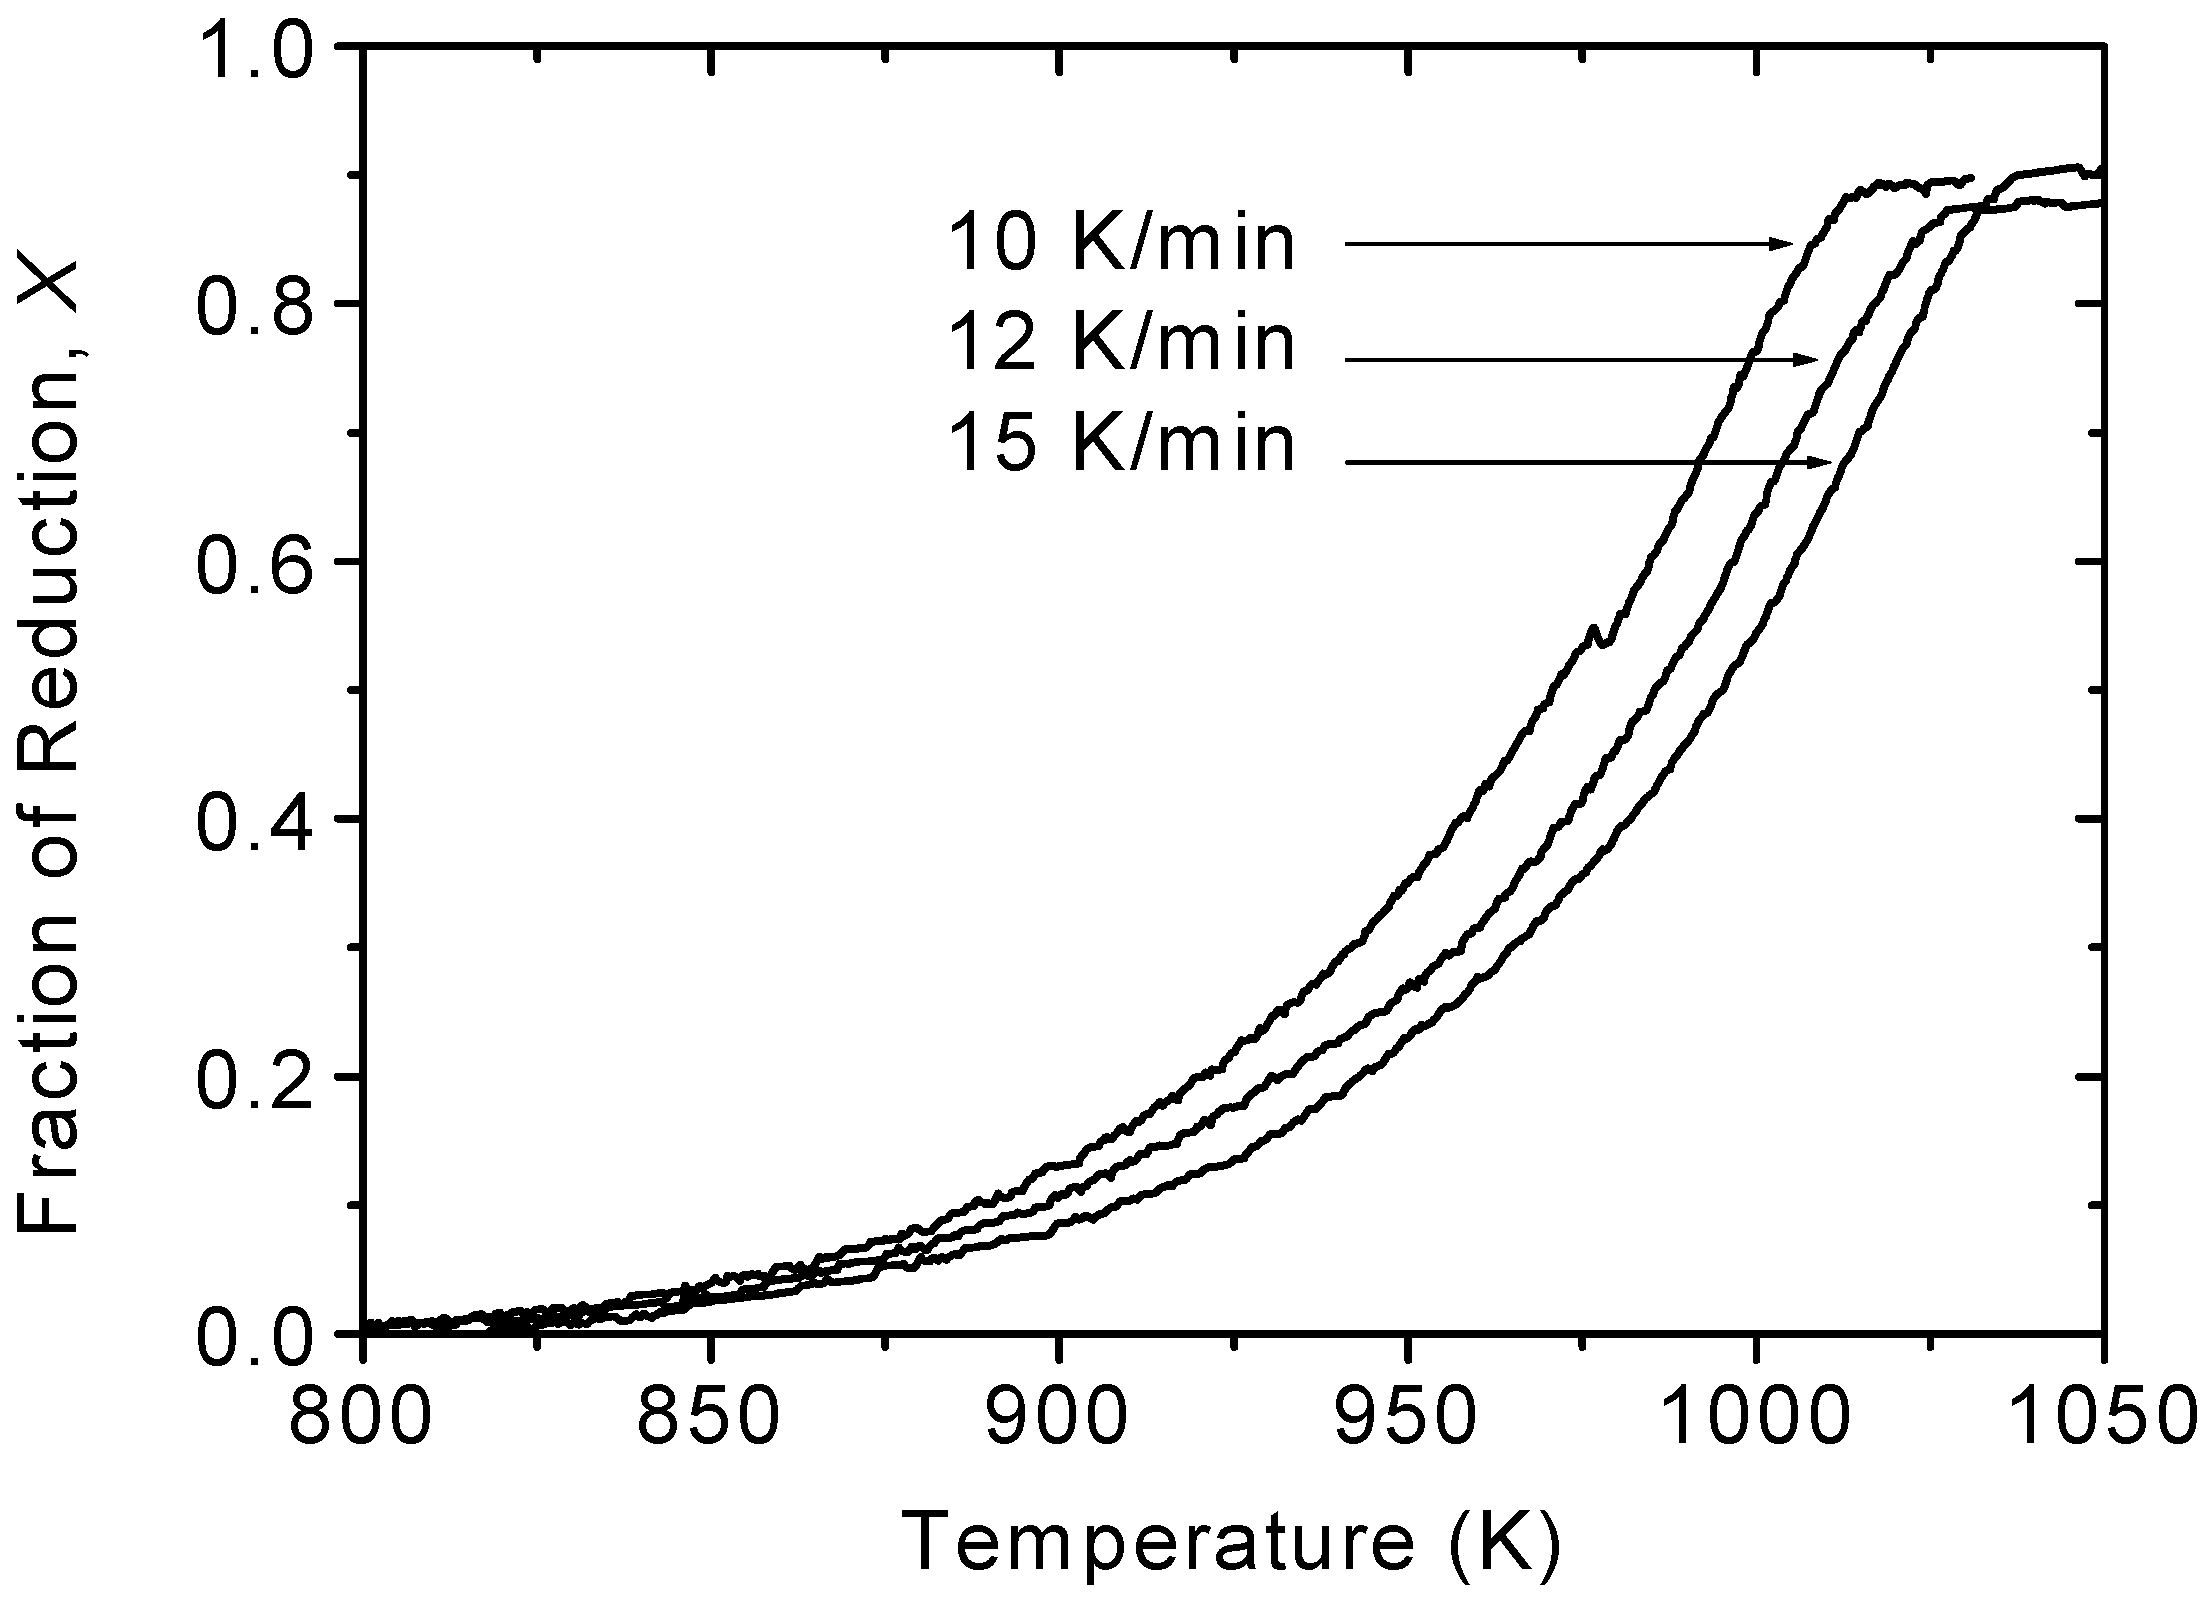
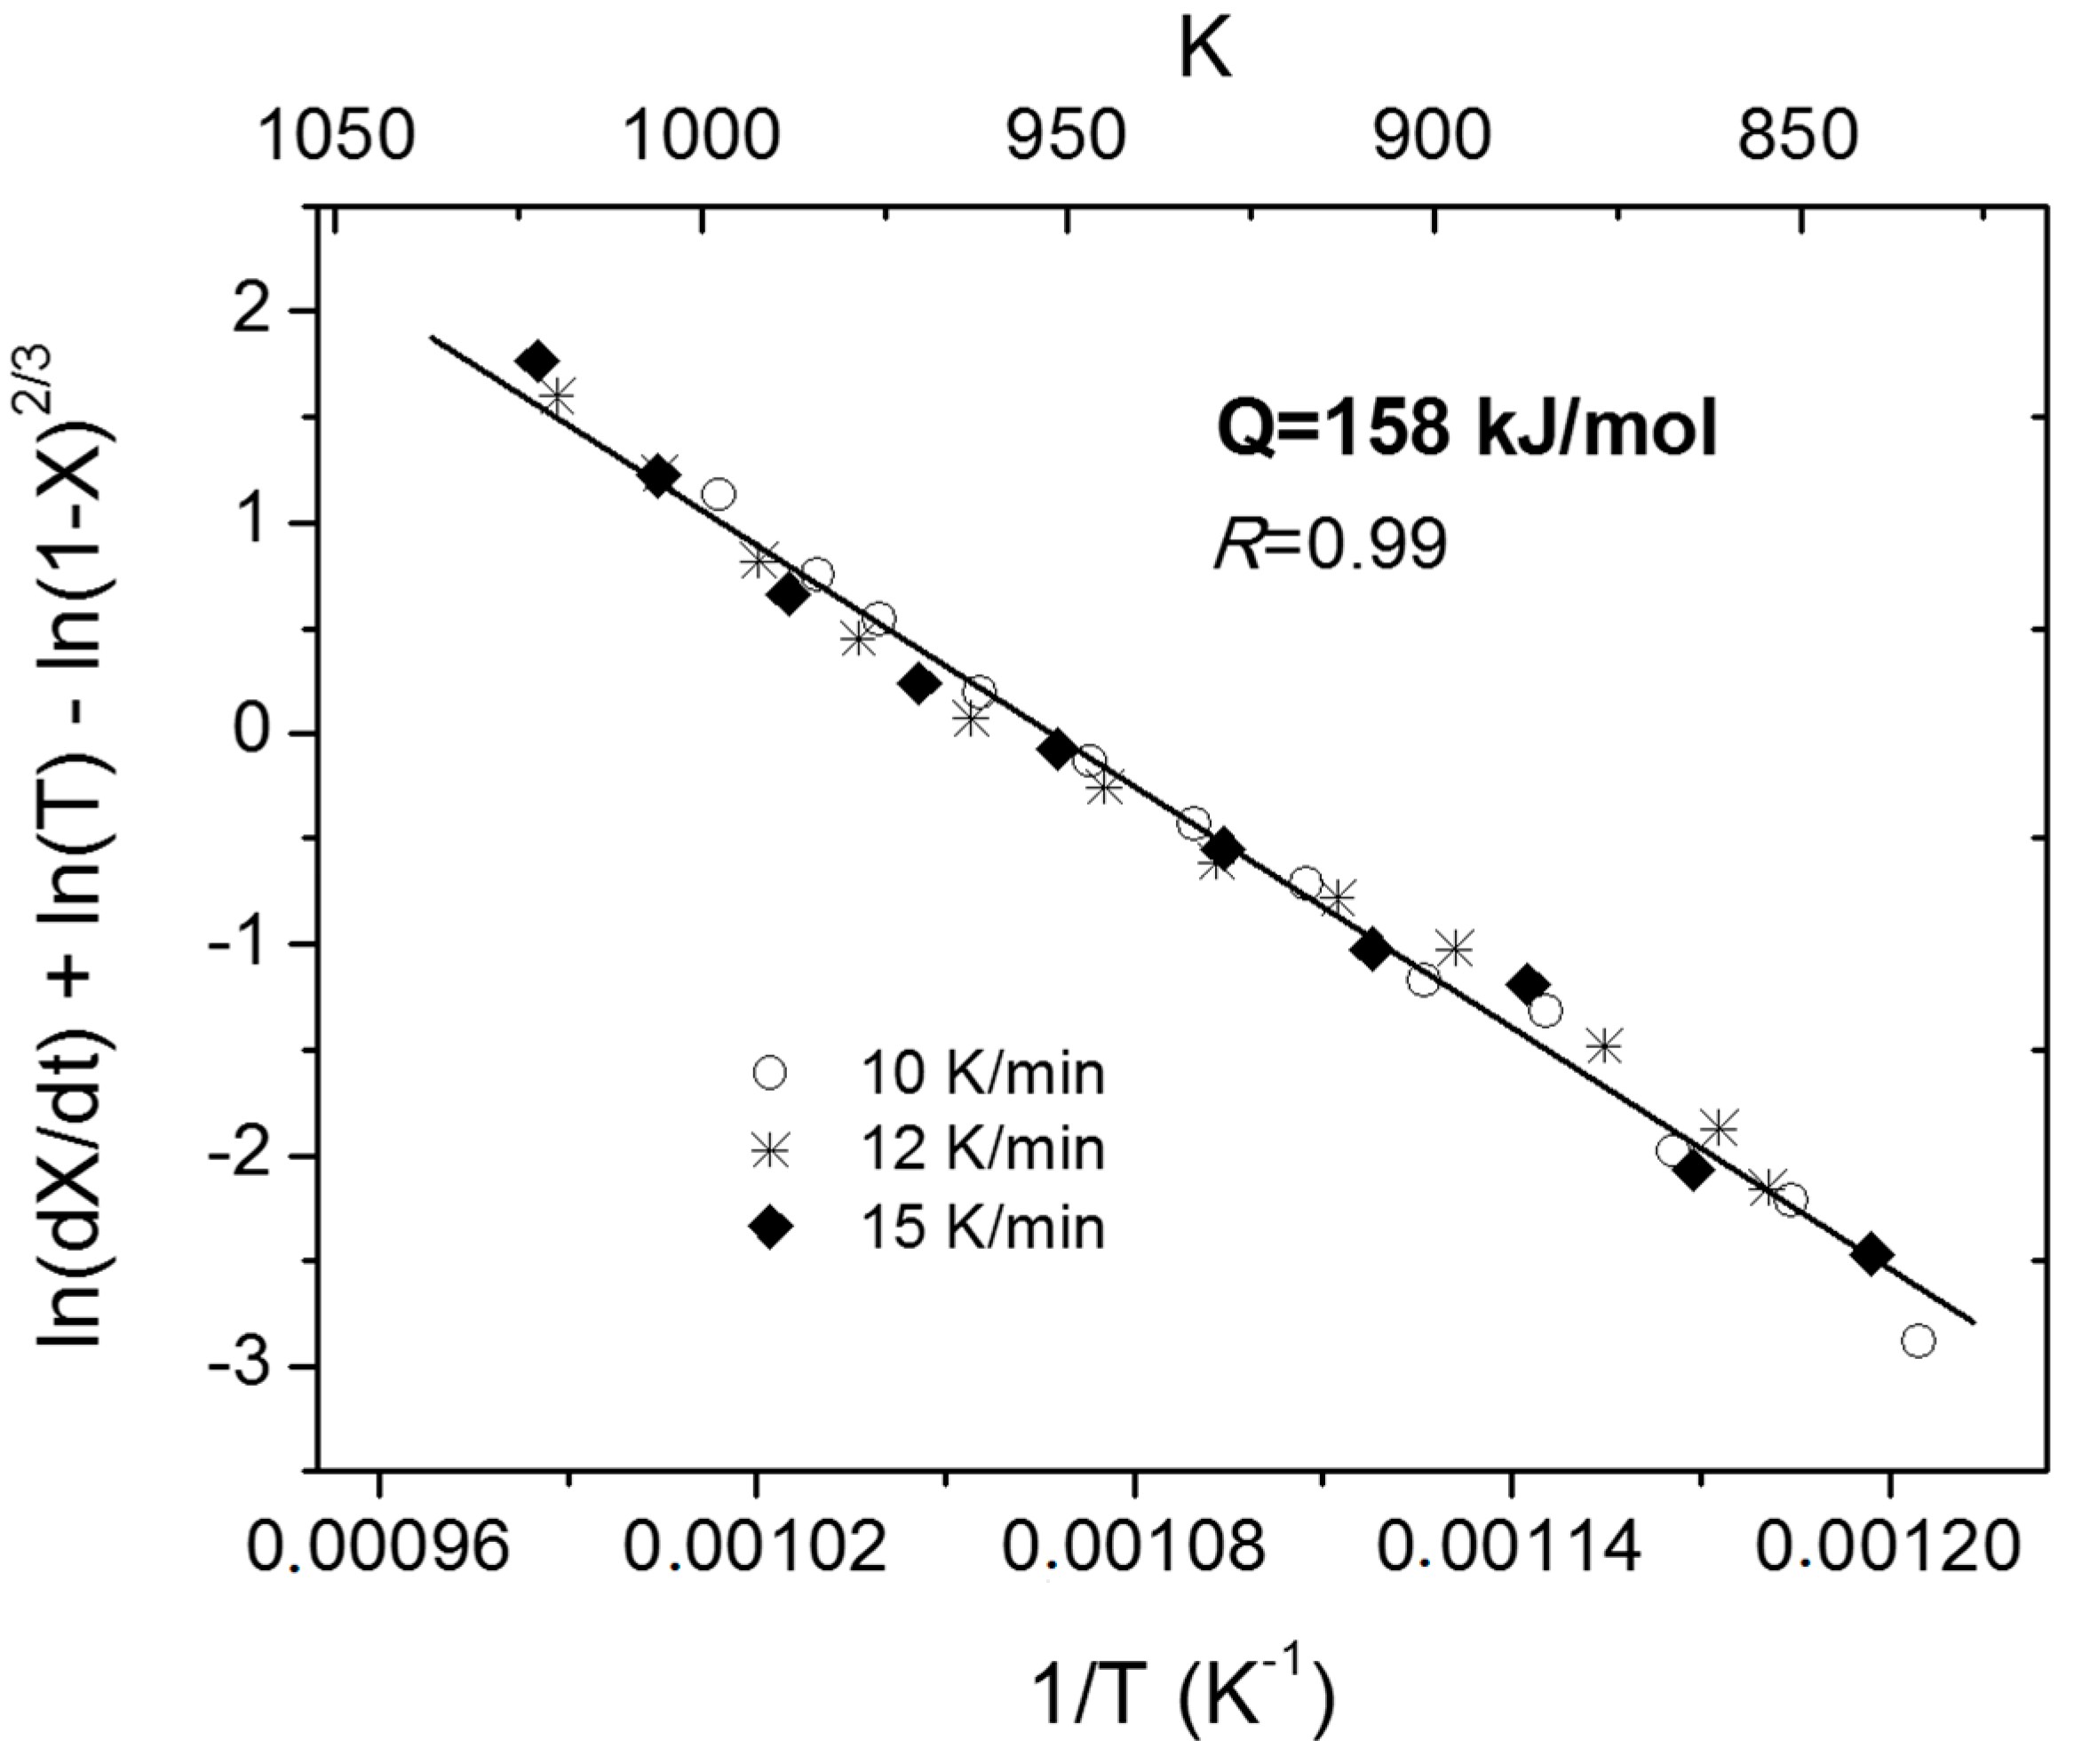
3.1.2. Nonisothermal Reduction of Fe2MoO4

Figure 3 shows the non-isothermal reduction curves of Fe2MoO4 at three different heating rates, viz., 10, 12 and 15 K/min. It clearly shows that the reaction rates are sensitive to the heating rate. At a given temperature, the higher the heating rate the lower the reduction fraction is reached. To calculate the activation energy from the nonisothermal experimental data, a mathematical model derived earlier [8] was used. This model assumes that the rate of the chemical reaction is the rate-controlling mechanism and the reduced particles follow a shrinking core mode.
ln ( d X d t ) + ln ( T ) ln ( 1 X ) 2 / 3 = ln ( A 0 k 0 R ) Q R T
In Equation (4), the terms on the left hand side can be evaluated based on the reaction rate, conversion degree and temperature obtained from the non-isothermal curves in Figure 3. An Arrhenius plot, using Equation (4) for different heating rates, is presented in Figure 4.
The activation energy for Reaction (2) obtained from the regression line, in Figure 4, is 158.3 kJ/mol. Note that high correlation factor obtained suggests that the activation energy is independent of the heating rate, which in turn indicates that activation energy is a real function of the reacted fraction at a given temperature. The observed dependence implies that the Equation (4) provides accurate values of activation energies. In fact, the value of 158 kJ/mol is in good agreement with the value obtained from the isothermal experiments, 173 kJ/mol.

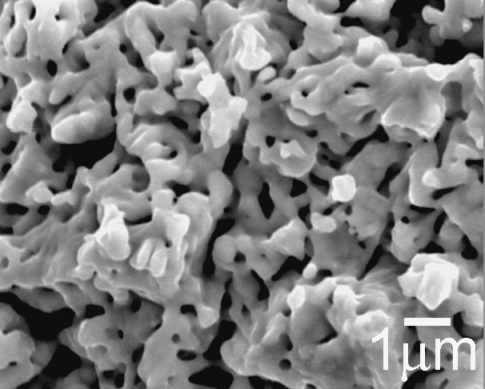
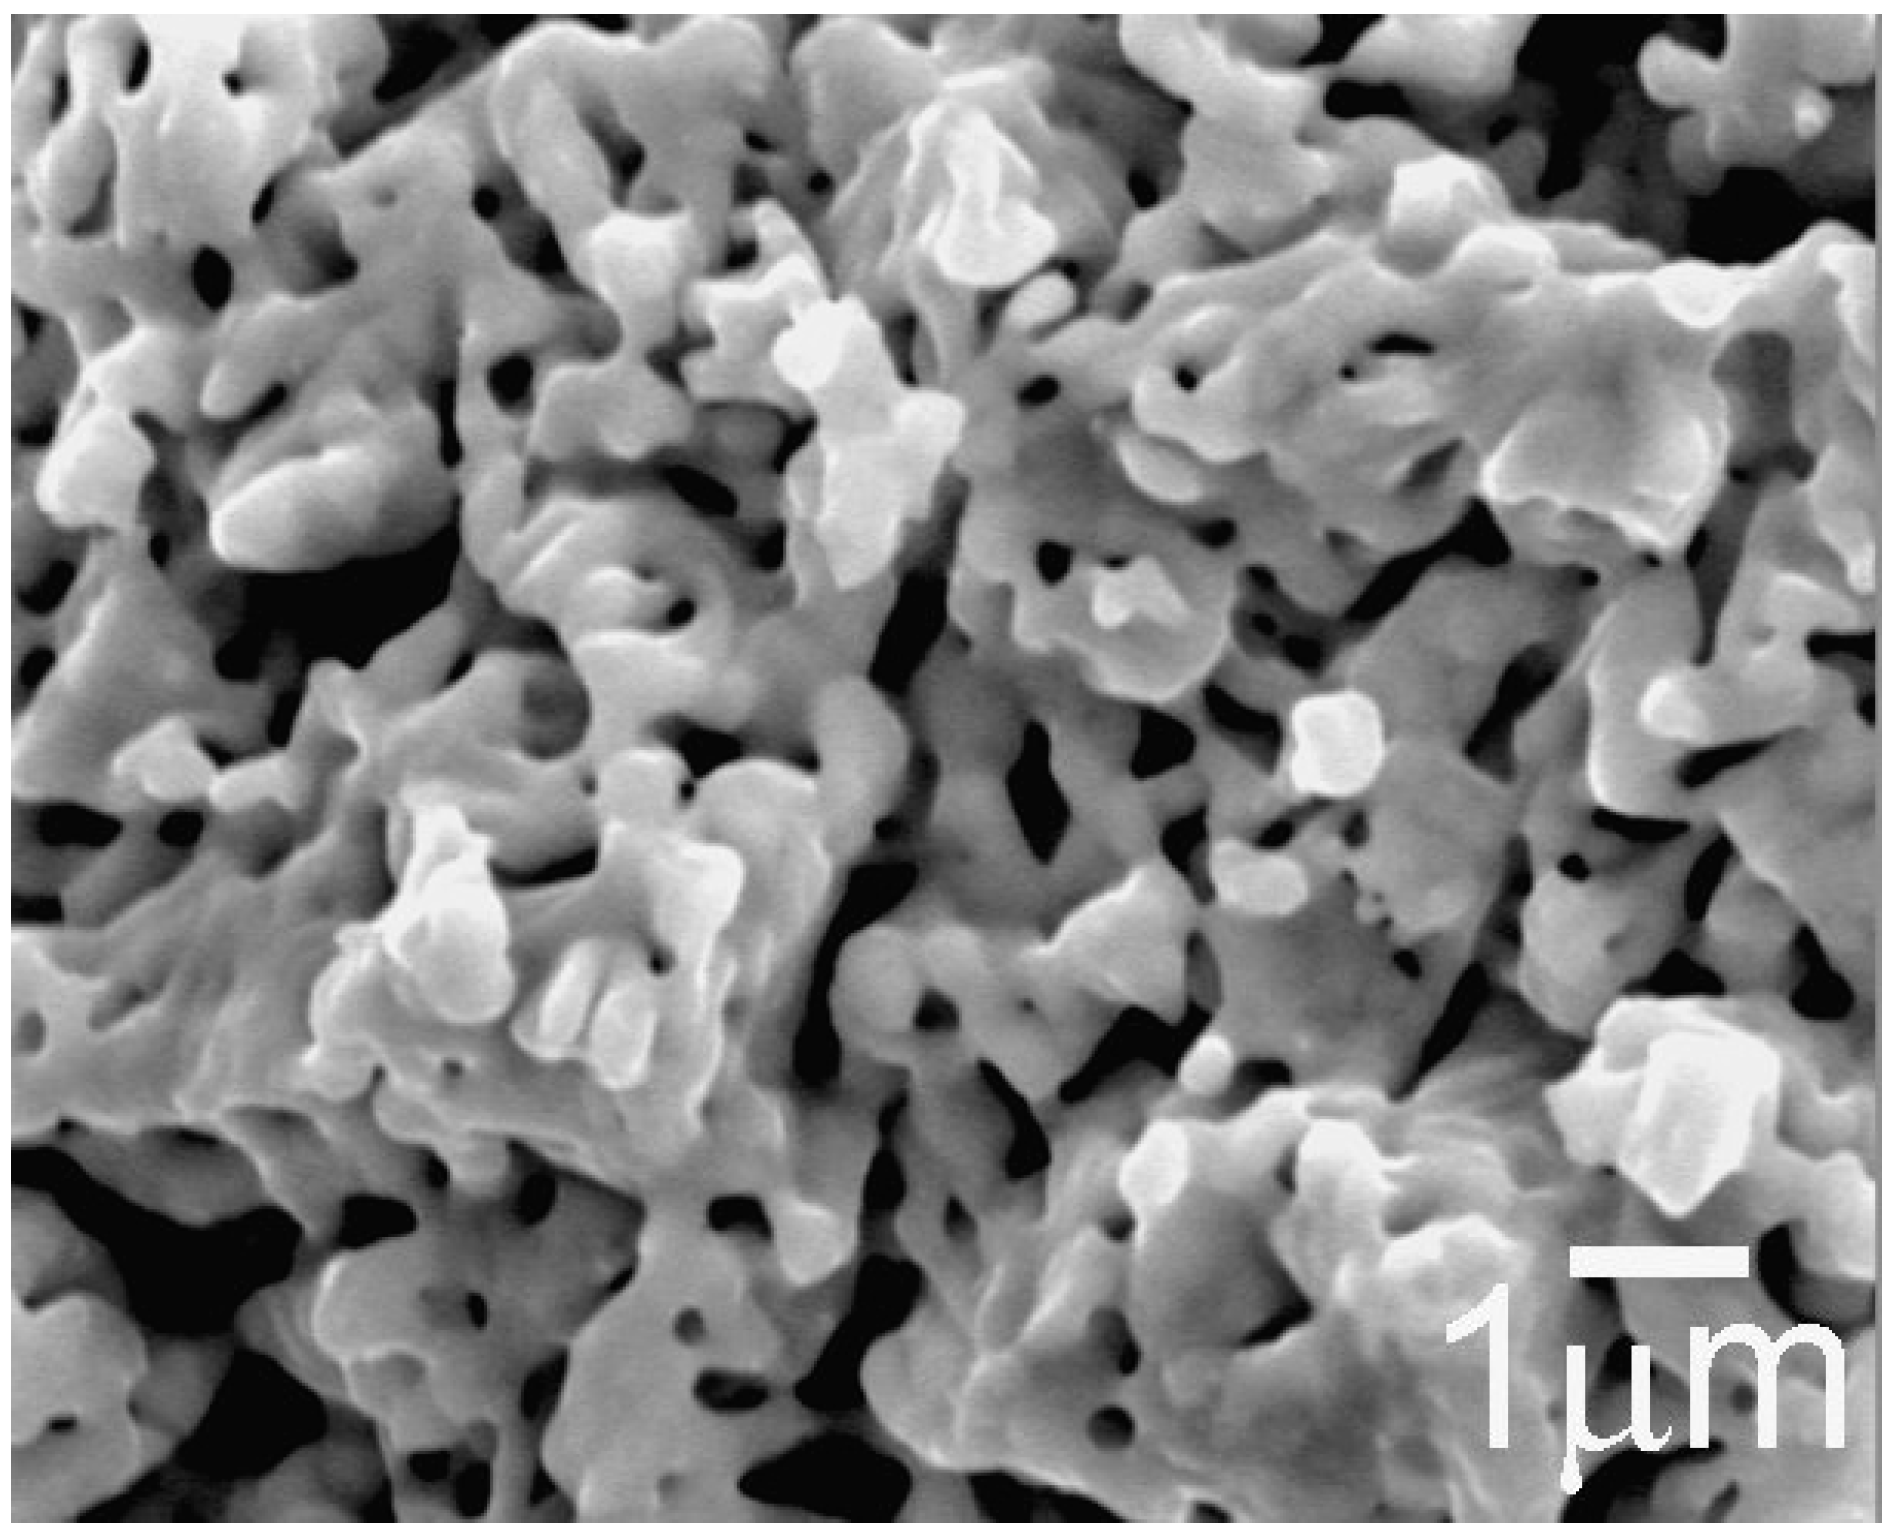
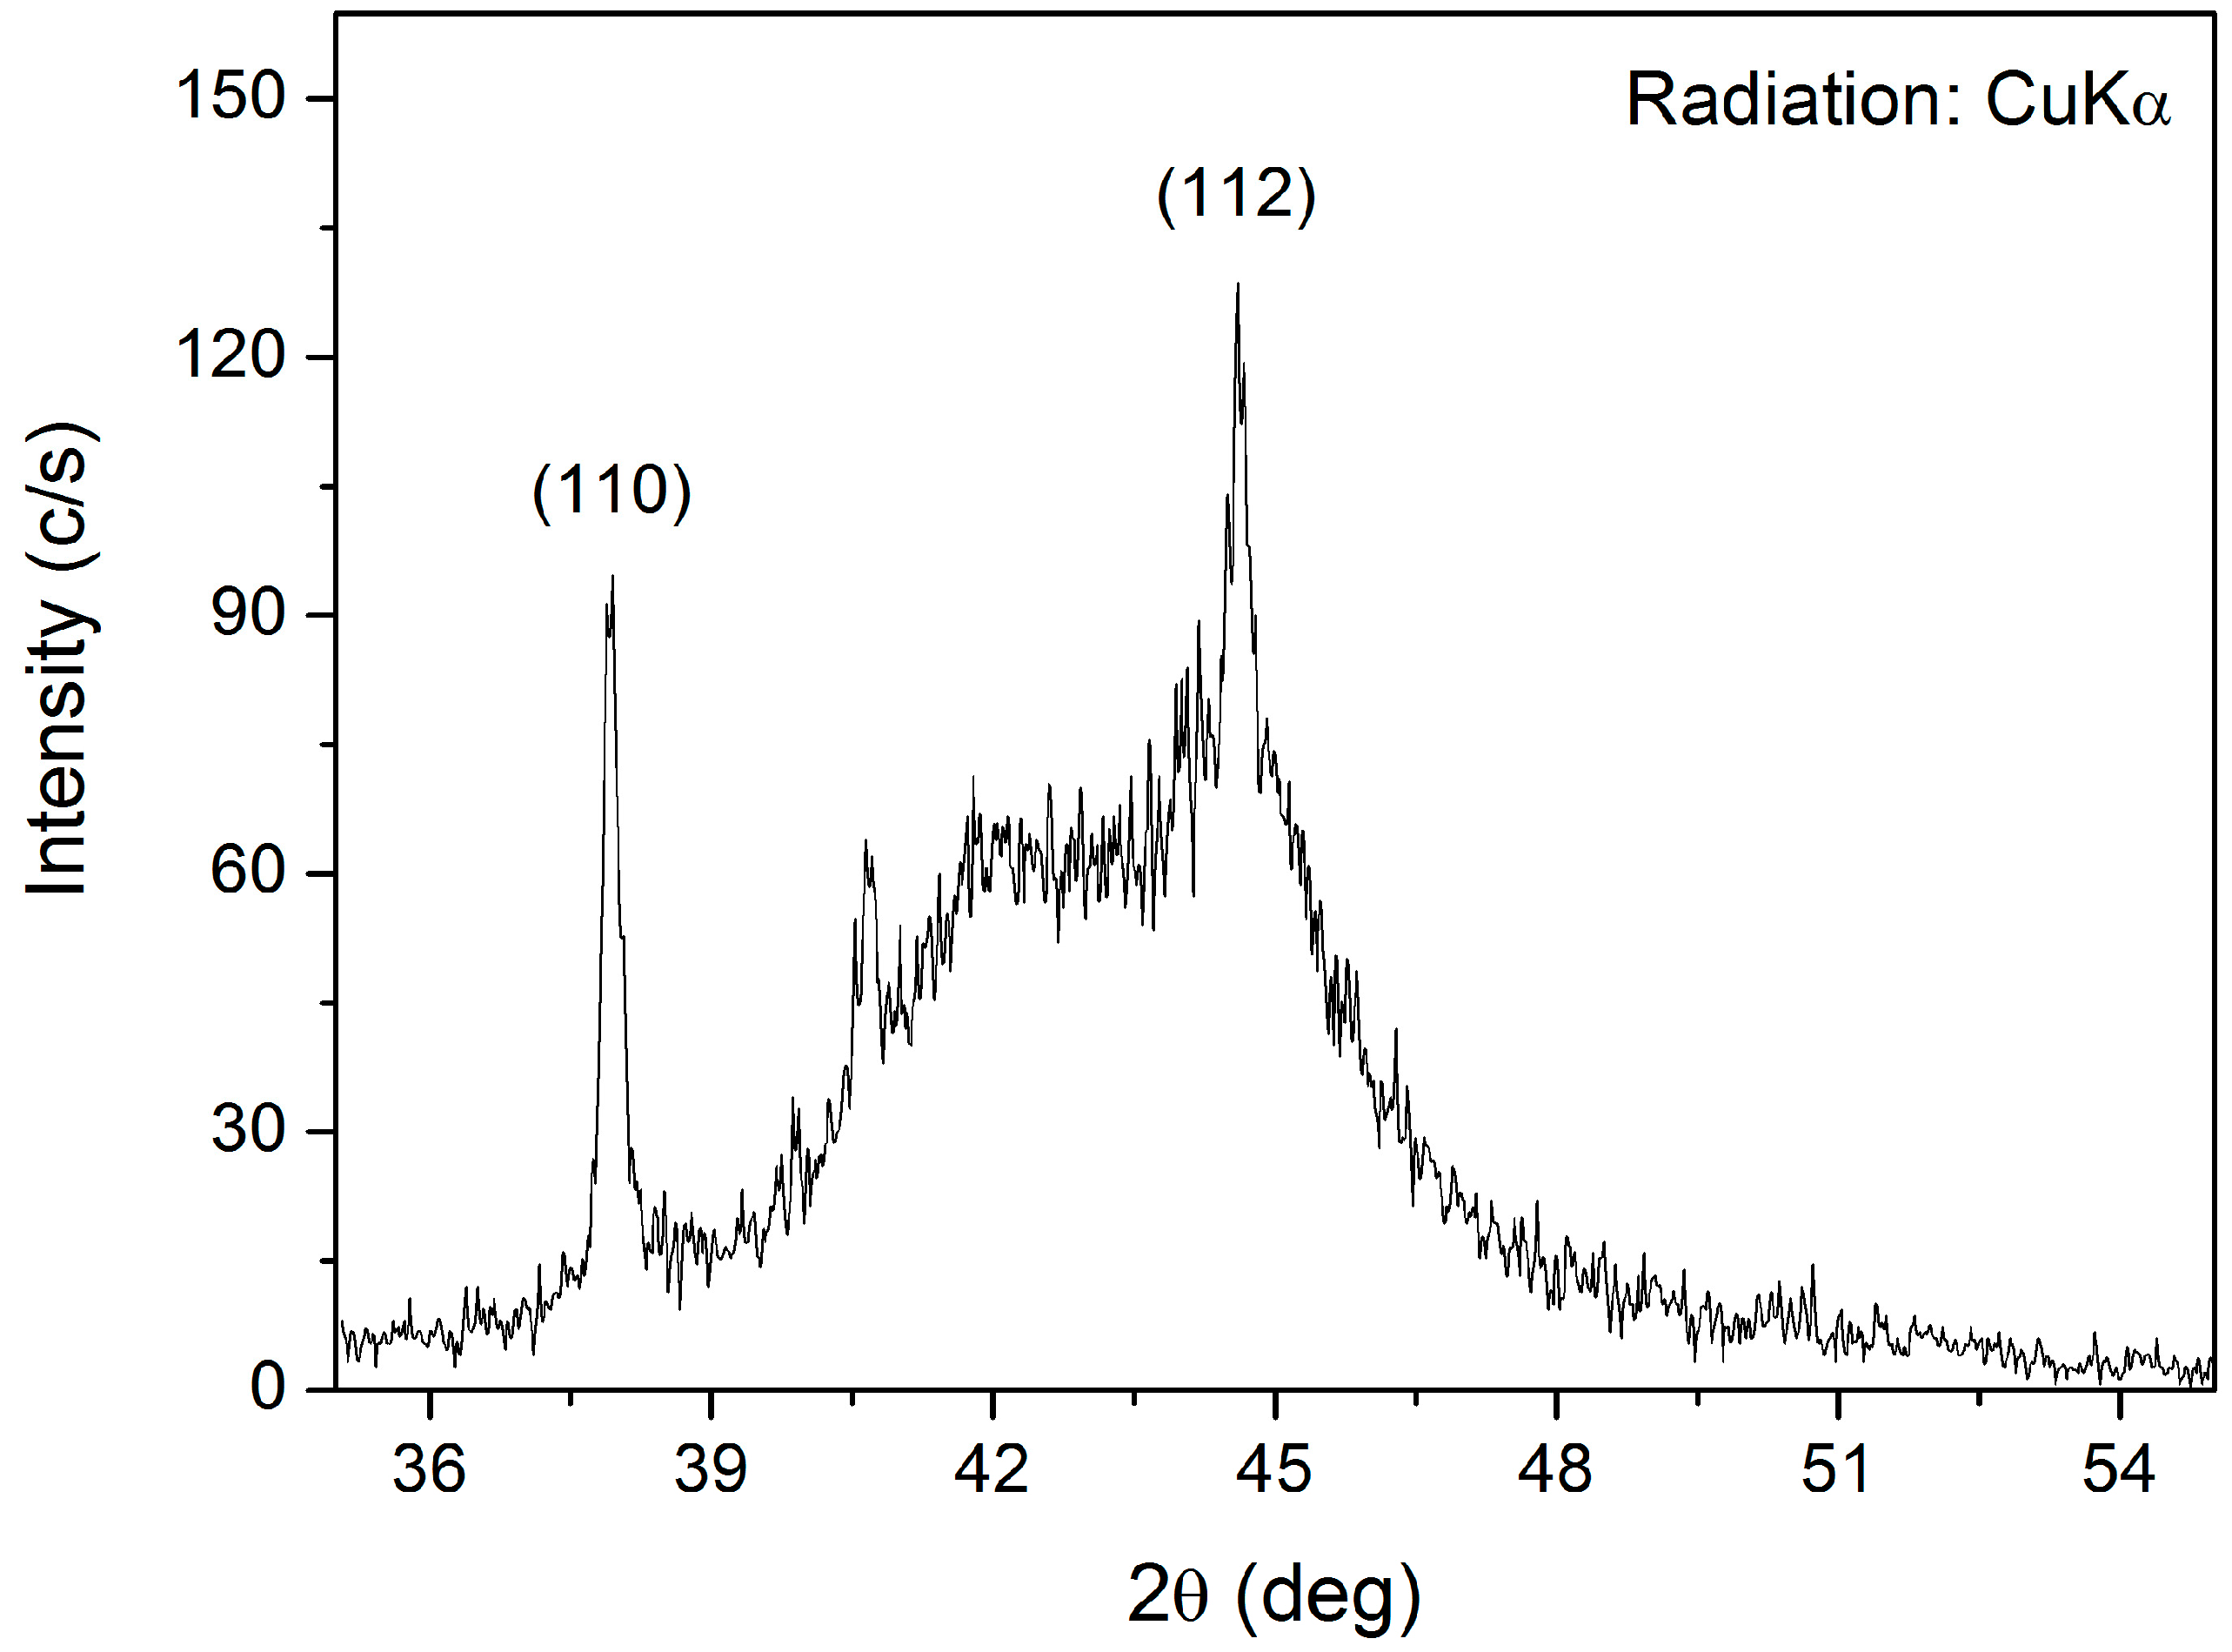
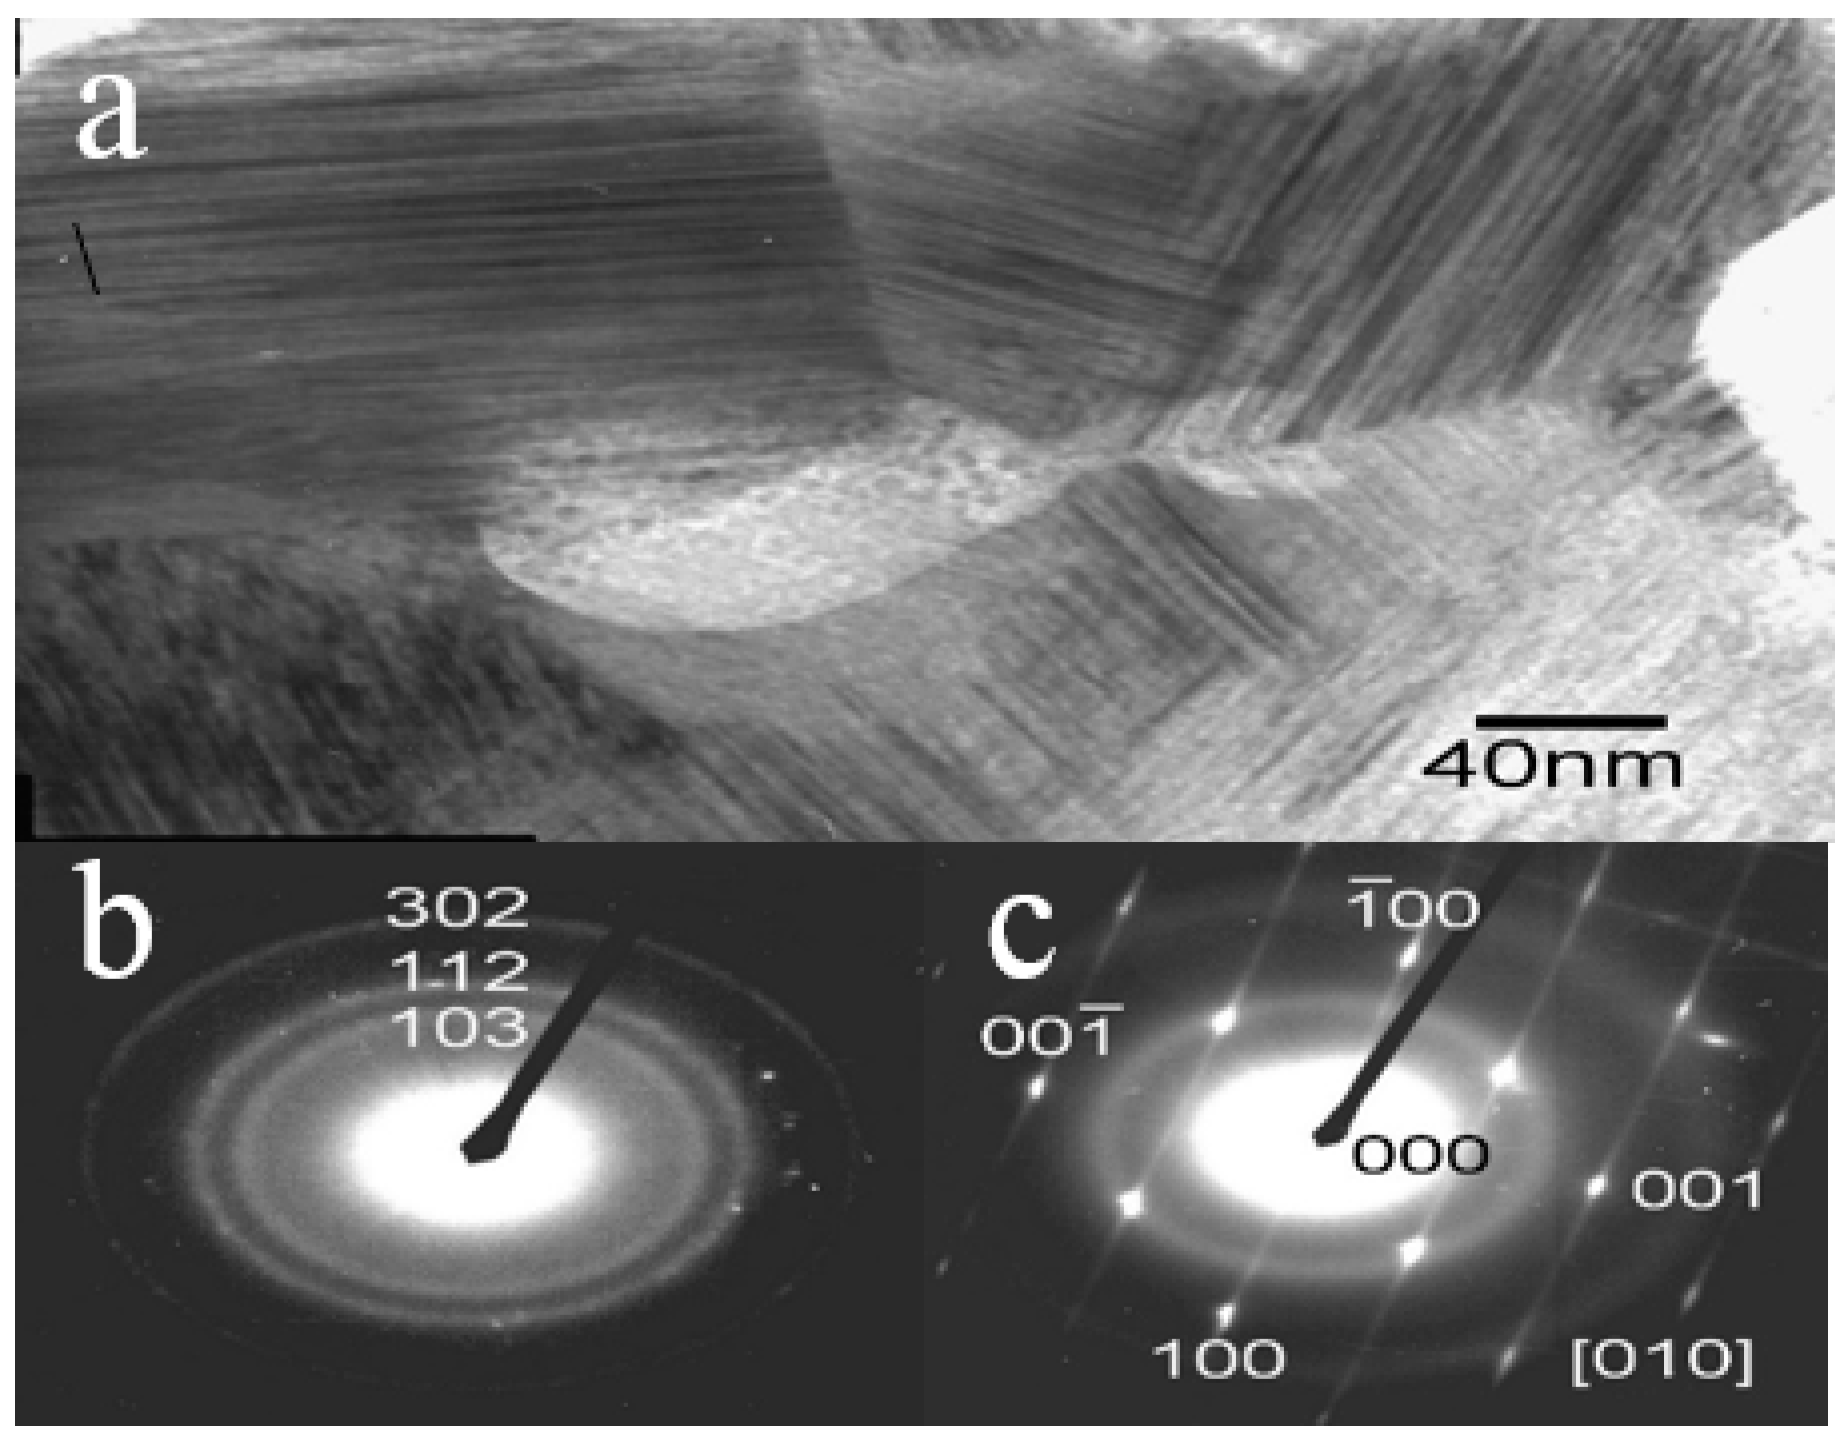
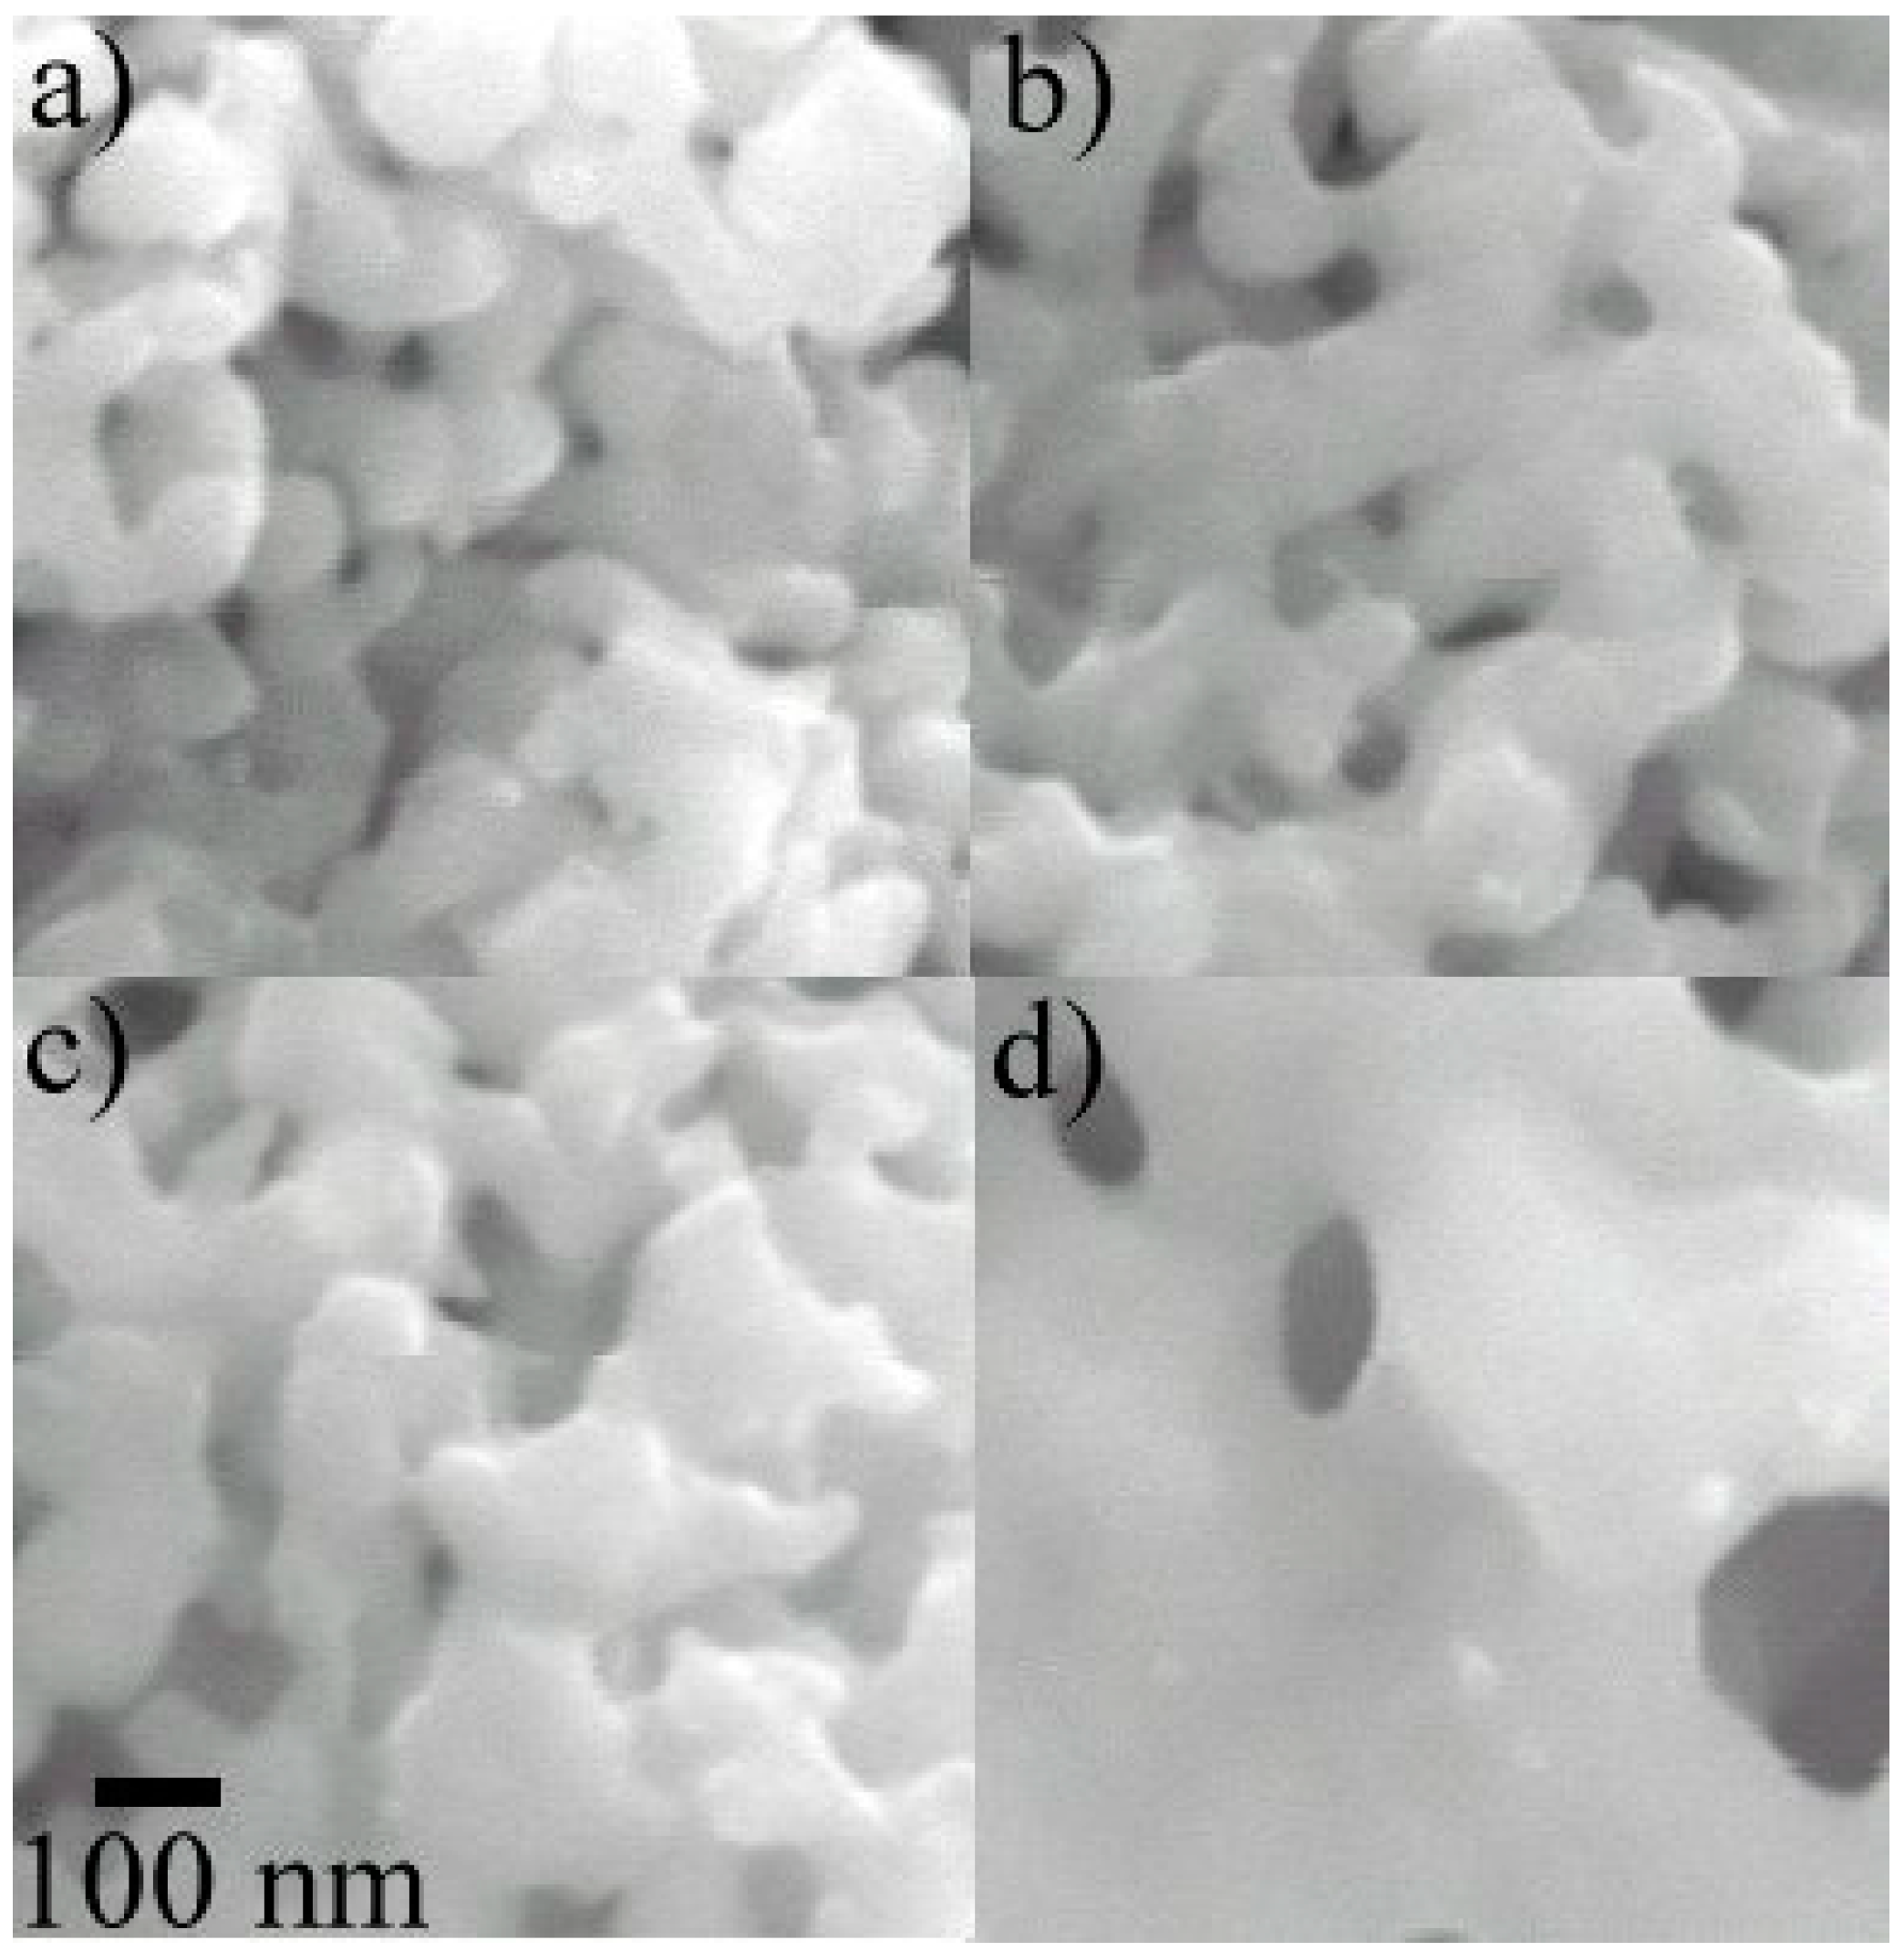
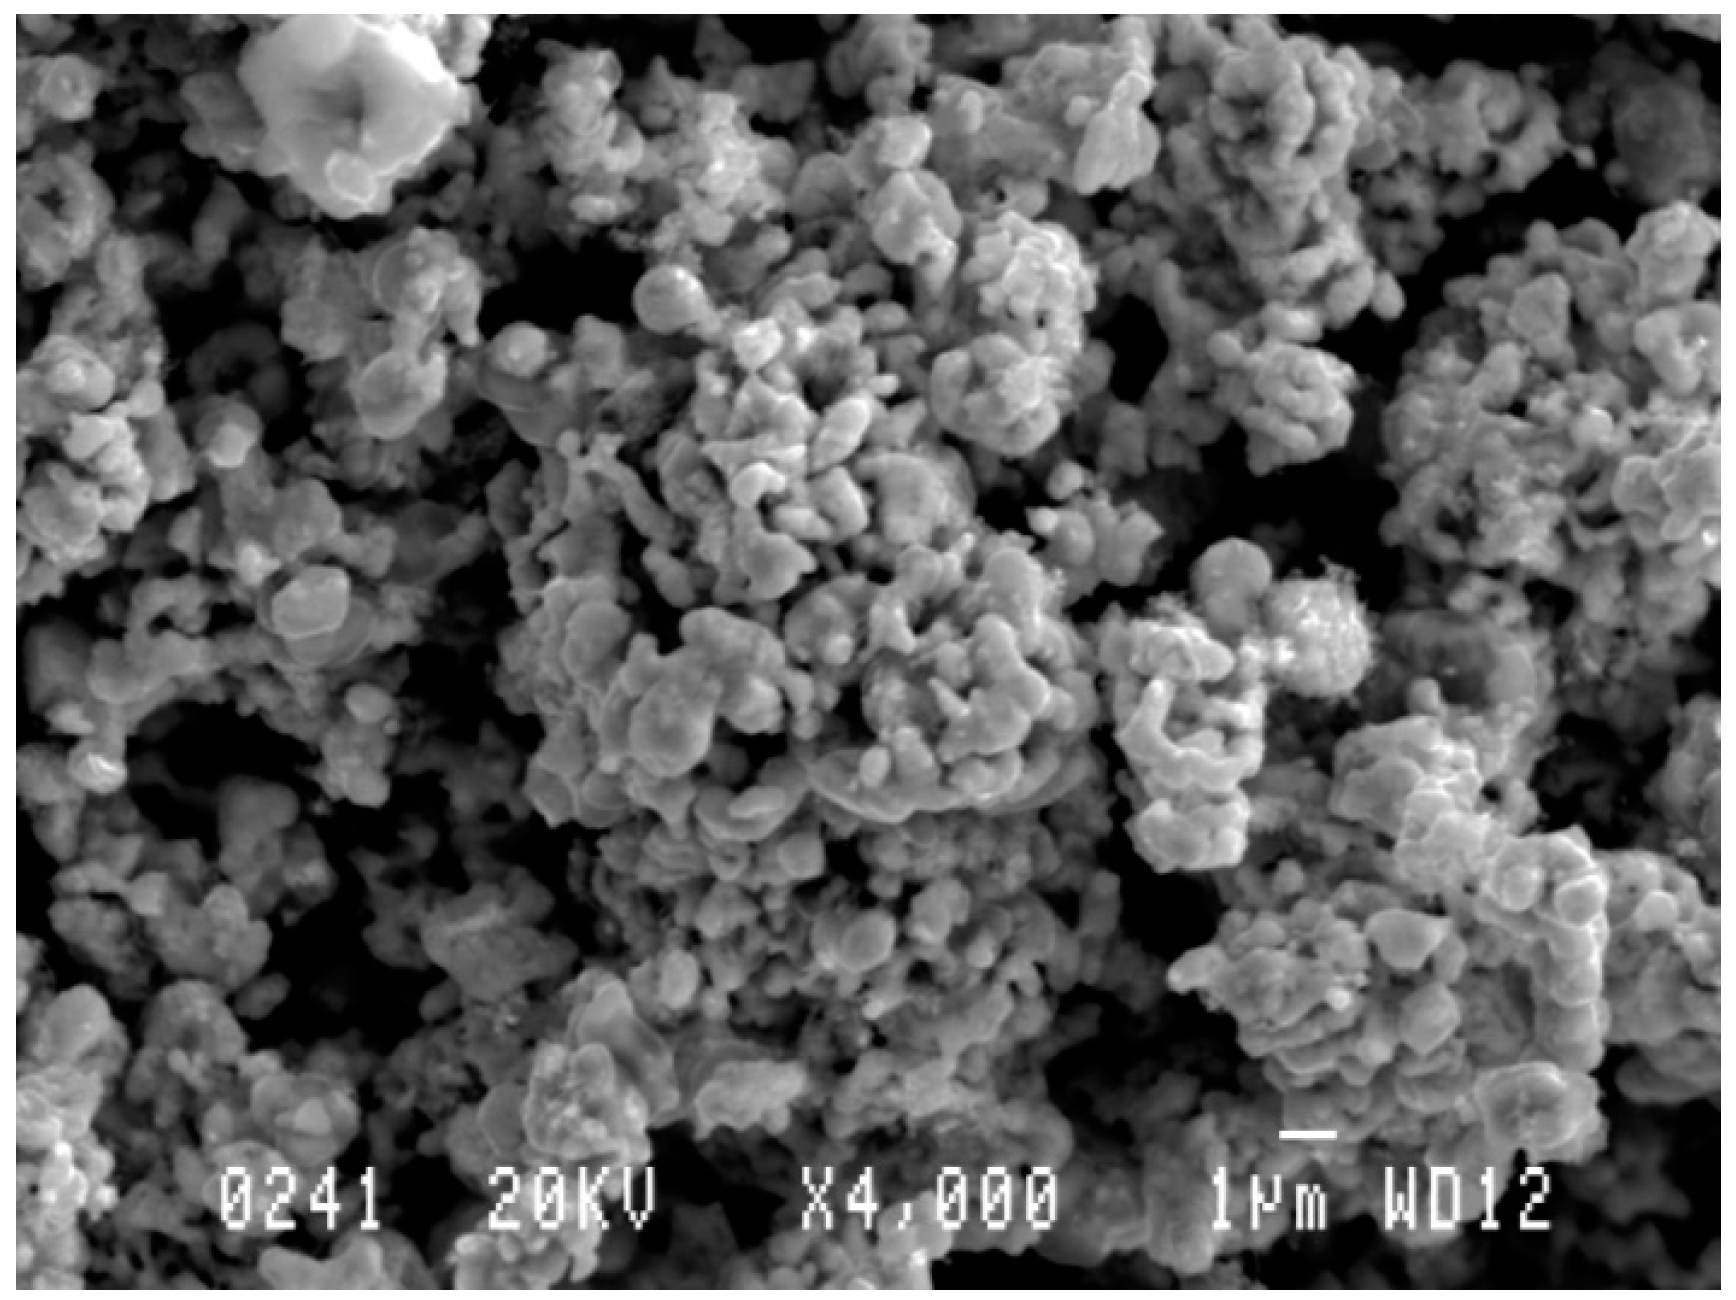
3.1.3. Characterization of Fe2Mo Intermetallic

Figure 5 shows a Scanning electron microscope (SEM) image of reduced Fe2MoO4 isothermally at 1173 K [2]. The sponge-like structure is the result of the removal of oxygen which increases the specific surface area. The X-ray diffraction spectrum of the same sample is given in Figure 6 [2]. Two sharp peaks could be identified which correspond to the Fe2Mo phase. Another broad Bragg peak was also detected which is an indication of an amorphous phase in the sample. However, Transmission Electron Microscopy (TEM) studies performed on a sample, pressed at 1 GPa, confirmed that the sample did not contain amorphous structure but indicated the existence of grains in both nano and micro scale. The TEM microstructural details are presented in Figure 7a–c. The small size of the domains along with the remarkable angle of disorientation among them (see Figure 7a) do diffract the incident beam of X-rays in larger deviated directions causing peak broadening. Selected Area diffraction Patterns (SAD) in Figure 7b,c indicate the existence of a hexagonal structure of Laves phase type Fe2Mo on indexing.
The streaks shown in Figure 7c reveal that the lattice deformation present in the Fe2Mo compact is due to the application of high compaction pressure at localized regions. To the best knowledge of the authors, these results represent the first documented evidence in successfully synthesizing the Fe2Mo intermetallic powder which can be attributed to the advantages of the gas-solid reaction technique.

3.1.4. Fluidized Bed Reduction of Fe2MoO4

In view of the results obtained using shallow powder beds, it was decided to produce the intermetallic phase in bulk using a laboratory-scale fluidized bed reactor due to the excellent contact between the reactant solid and the gas. The reduction experiments were carried out isothermally and the rate of the reaction was followed by monitoring the rate of evolution of the product gas, viz. water vapor, using a gas chromatograph. The reduction rate curves at several temperatures are shown in Figure 8. Here, the times to complete the reaction are larger than in the thermogravimetric experiments due to the larger average particle size of Fe2MoO4 (100 µm versus < 1 µm). Despite the larger average particle size, it can be seen that the reduction curves are sensitive to temperature increase which is an indication that the process is controlled by the rate of the chemical reaction.
The same mathematical model (Equation (3)) was used to calculate the activation energy, of Reaction (2), from the slope of the Arrhenius plot. In this case, the range in particle size distribution was considered instead of taken a fix value of r0. Thus, the value of the activation energy for the Reaction (2) was 158 ± 17 kJ/mol. This value is close to the activation energies calculated in isothermal and non-isothermal studies of fine shallow powder beds.
Figure 9a–d present the SEM images of the reduced samples at 923, 1023, 1073 and 1173 K, respectively. The images clearly show the effect of temperature on the morphology of the samples after being reduced. As shown in Figure 9a, the crystals are well below 100 nm. On the other hand, the crystal size is much bigger for samples exposed to higher temperatures (1173 K). The production of Fe2Mo particles by gas-solid route in a fluidized bed reactor is clearly shown from the present results. Thus, the gas-solid reaction route with fluidization appears to be a very promising route towards the production of the Fe2Mo phase with nano-crystalline structure.

3.2. Ni-W-O System

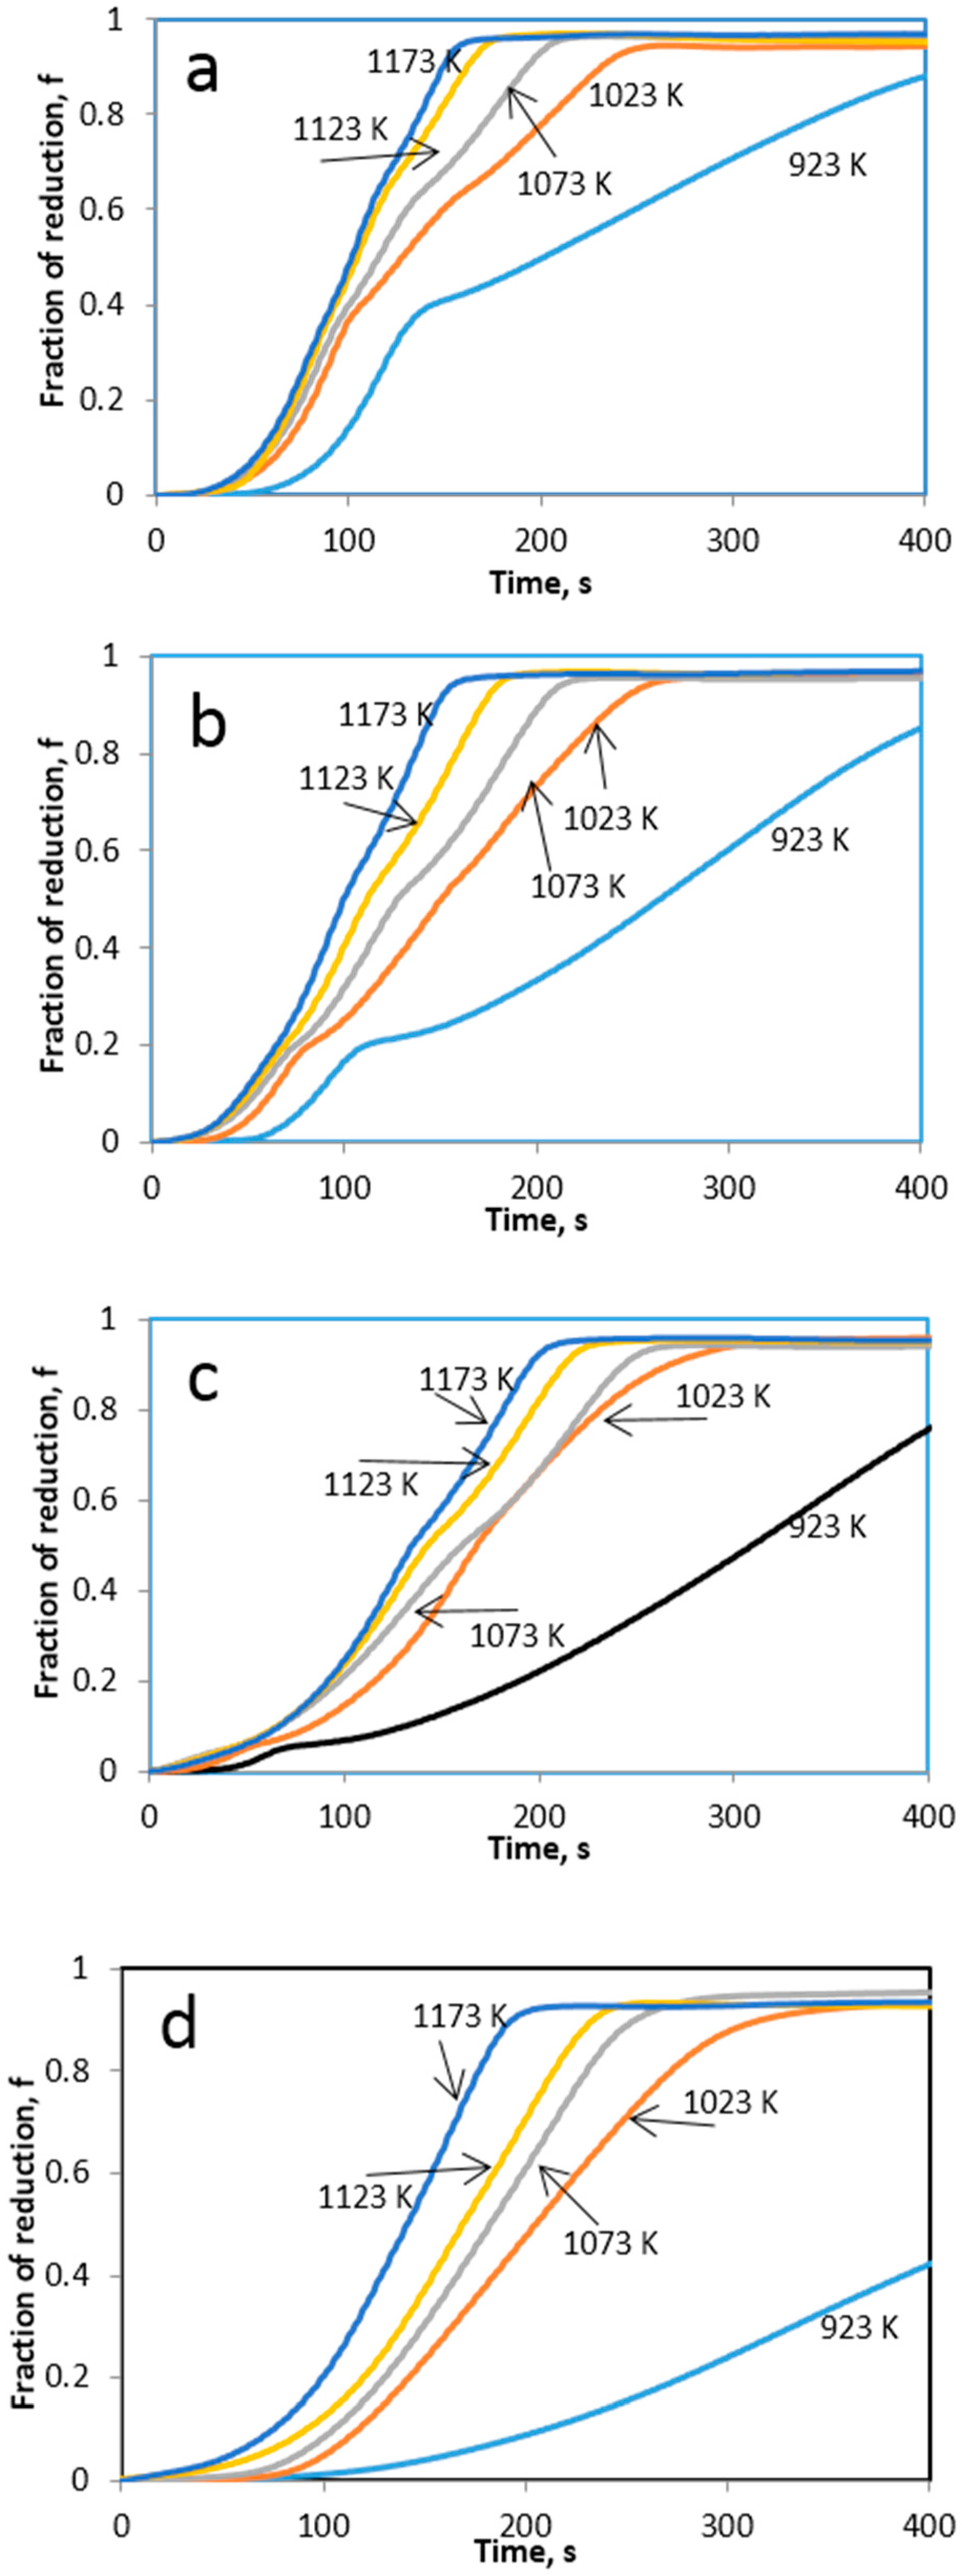
3.2.1. Reduction of Ni-W-O System

Reduction of mixtures of NiO and WO3 were conducted by means of thermogravimetric analyzer (TGA) to understand the intrinsic reduction kinetics. Subsequently, to explore the possibility of designing a process for the reduction, experiments were conducted using a fluidized bed reactor (FB).
Reduction experiments of four different compositions with different Ni/(Ni + W) molar ratios were first conducted by theromgravimetric means in the temperature range from 923 to 1173 K with a continuous hydrogen flow at rate of 0.5 L/min. Figure 10 shows the corresponding reduction fraction as function of temperature and time for the studied mixtures.
Generally, as the temperature increases the rate of reduction was found to increase. TG reduction curves manifest break points, which indicate change in the reaction mechanism (Figure 10a–d). The break points in the reduction curves and the XRD analysis of partially reduced sampled reveal that the reduction of NiO-WO3 mixtures proceeds through successive steps, which could be represented as follows;
NiO-WO3(s) + H2(g) = Ni-WO3(s) + H2O(g)
Ni-WO3(s) + H2(g) = Ni-WO2(s) + H2O(g)
Ni-WO2(s) + 2H2(g) = Ni-W(s) + 2H2O(g)
NiO-WO3 mixtures were further reduced by hydrogen in a fluidized bed reactor in the temperature range from 973 to 1273 K. Figure 11a–c shows the curves resulted from these experiments.
The symbol Χ in Equation (8) can be explained as the ratio of area under the curve, at any time t, Ap(t) to the area at the time when the reaction approaches completion. Therefore, fractional reduction can be expressed as follows;
X = 0 t A p ( t ) d t 0 A p ( t ) d t
It can be seen clearly that the reduction curves show break points at different parts of the reduction curves, which is in agreement with thermogravimetric results. Irrespective of the applied technique Ni content seems to have a significant effect on the reduction rate. The higher the Ni/(Ni + W) molar ratio, the higher was the reduction rate. On comparing the reduction rates obtained by TGA and FB, the former was found to be faster. In order to correlate the obtained results and to understand the mechanism behind the fluidized bed reduction process, a modeling approach was developed.
The developed model was based on the following assumptions;
  • The system is considered to be isothermal.
  • The gas flow is plug flow.
  • The mass transfer resistance for the reaction is small compared to the intrinsic reaction rate.
  • The particle sizes are small enough that diffusive transport of gas through the product particles can be neglected.
Based on these assumptions a mathematical description of this model is presented. The fluidized bed system is represented schematically in Figure 12.
An equation based on this representation can be written as follows;
d ( n ˙   x H 2 O ( z ) ) d z = A   R ˙ ( z )
where A is the area of cross section of the reactor in m2, z is axial co-ordinate, n ˙ is the molar flux of gas through the reactor in mol/s, x H 2 O is mole fraction of water vapor in the gas and R ˙ is the generation of water vapor due to chemical reaction in mol/m3.s.
The term R ˙ can be calculated as
R ˙ = N 0 O A L k f ( x H 2   x H 2 O K e )
where N 0 O is the total number of moles of reducible oxygen in the Ni-W-O powder, L is height of the fluidized bed, k f is the intrinsic reaction rate constant and K e is the equilibrium constant for the reaction. The term N 0 O A L refers to the moles of reducible oxygen present per unit volume of the fluidized bed and R ˙ refers to reduction rate per unit volume of the fluidized bed. The intrinsic reaction rate k f can be determined from d X T G A which refers to the extent of reduction in TGA. Further details about model derivation and assumption can be found elsewhere [3]
d X T G A d t = k f x H 2
With a set of calculated values of rate constants, the model was used to predict the progress of reduction under the experimental conditions. The computed as well as the experimental results for reaction rate constant of NiWO4 reduction by hydrogen are shown in Table 2.
As seen from Table 2, the computed reduction rates of NiWO4 by hydrogen based on TGA results are in good agreement with the experimental values of fluidized bed technique. The reduction kinetics was then estimated using Arrhenius plots. The calculated activation energies were found to follow the trend that indicates greater nickel content in the precursor would lead to greater activation energy (Table 3).
Investigation of reduced samples was further conducted by means of X-ray diffractometer (Siemens D5000 X-Ray diffractometer, Siemens Co., Munich, Germany). Corresponding peaks to metallic nickel phase were found slightly shifted from those that correspond to the pure metal (Figure 13). It was observed that as the WO3 content increased in the mixture the shift increased. Unlike nickel peaks, peaks corresponding to metallic tungsten in the reduced samples overlapped with those peaks for pure W. This trend can be explained by the slight solubility of tungsten in nickel and the negligible solubility of nickel in tungsten. These results are in good agreement with the Ni-W binary phase diagram
Figure 14 represents the SEM images of reduced samples (0.4 Ni/(Ni + W) molar ratio) at 1173 K. The sample is extremely porous. This porosity is similar to that observed earlier in case of Fe-Mo-O system after getting reduced by hydrogen [9]. Moreover, microstructural investigation of product samples was done by Scanning Electron Microscope (A JOEL JSM-840 SEM, Japan Electron Optics Ltd., Tokyo, Japan). Agglomerates of small particles (more common when W content is higher) could be clearly seen from SEM images. The small particles are spherical in shape and the large particles are more elongated.

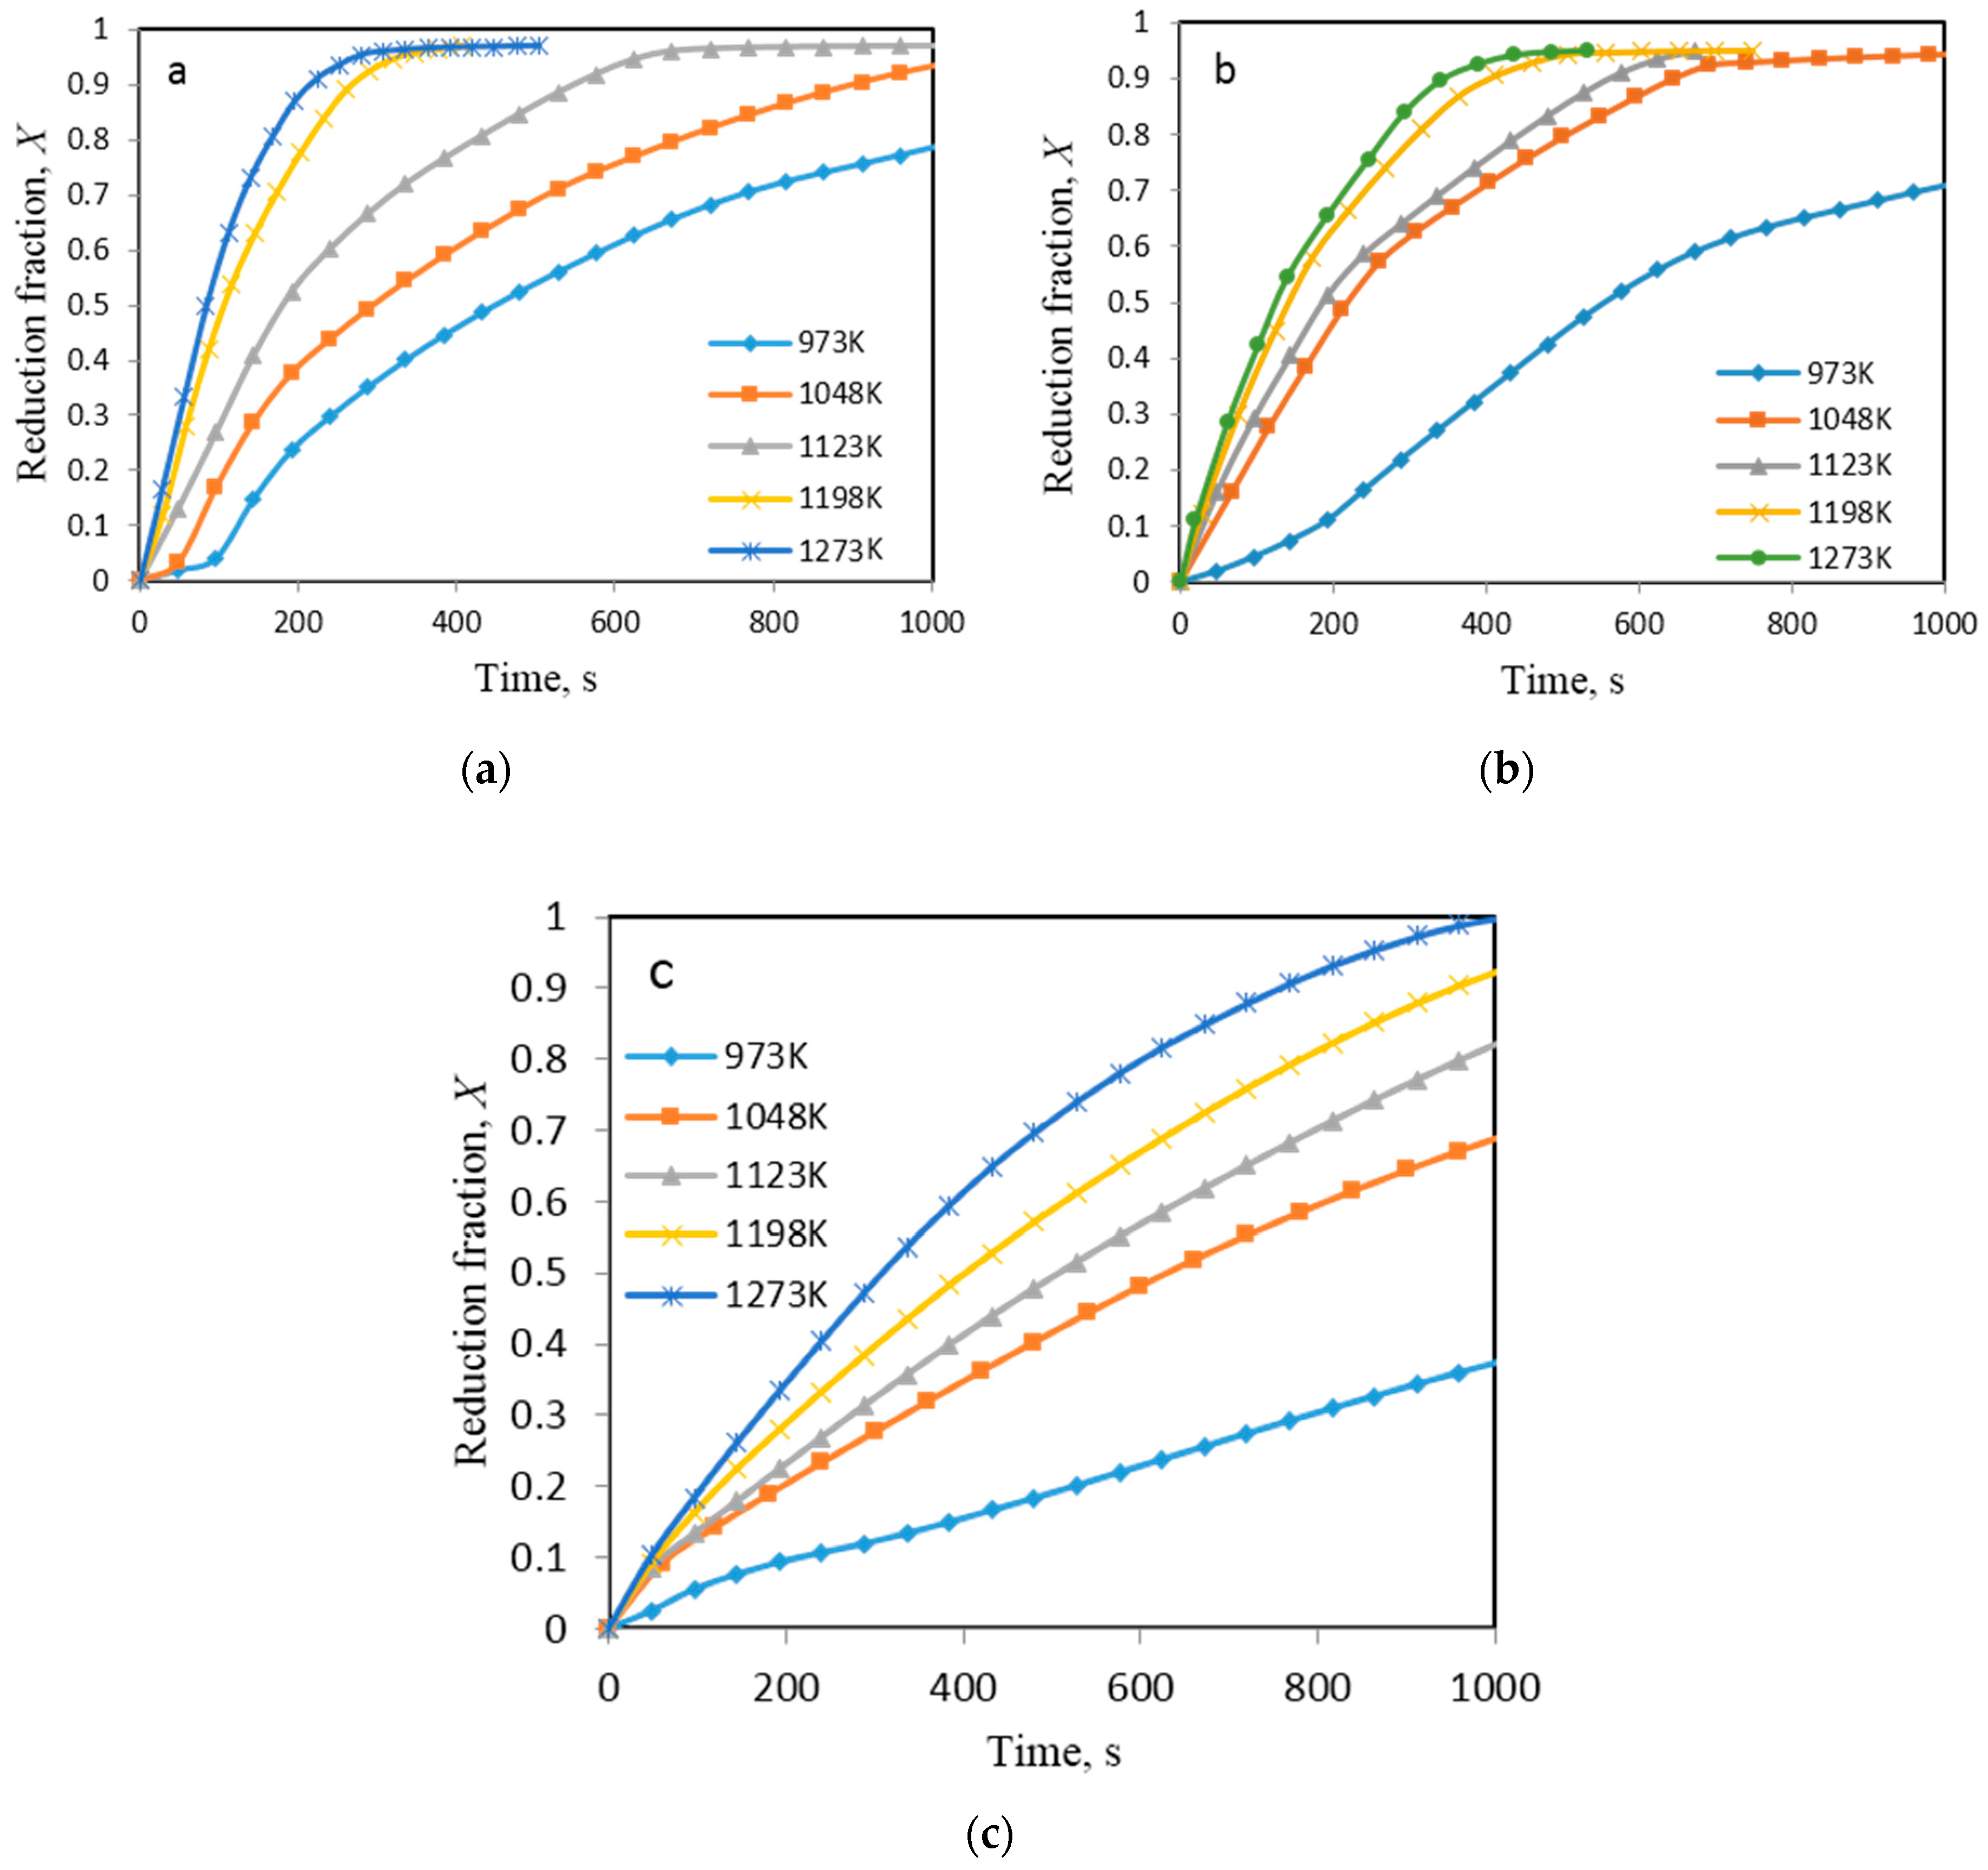
3.2.2. Reduction-Carburization of Ni-W-O Mixed Oxides

In the present study, reduction-carburization of Ni-W mixed oxides using methane-hydrogen gas mixture was studied isothermally using thermogravimetric analyzer. The main advantage of carburizing metal oxides with methane is the high carbon activity of deposited solid carbon, which provides thermodynamic conditions to produce corresponding cemented carbides at relatively low temperature. The experiments were conducted in the presence of 5 vol.% methane-95 vol.% hydrogen gas mixture at temperatures from 973 K to 1237 K with 50 K interval. The targeted composition for this cemented carbide was WC-10 wt. pct Ni. The reaction progress as function of time and temperature is given in Figure 15. It can be seen clearly from the curves that the reaction proceeds through initially mass loss then followed by mass gain in most cases. The mass loss continues down to 20% which is corresponding to reduction of input sample. The afterwards mass gain resulted from carburization reaction and formation of corresponding cemented carbides.
As can be seen from Figure 15, as long as the temperature is below1048 K there was no observed mass gain. At temperature higher than 1048 K the TGA curves showed significant increase in weight, which is corresponding to carburization of nascent formed NiW intermetallic. As the temperature increases, the rate and the carburization extent increase. The carburization was observed to go through two consecutive steps. The first one goes up to f = −18.7% which corresponds to formation of the intermediate W2C. The second step proceeds up to −15.5% mass change, which corresponds to complete formation of WC. The activation energy was calculated based on the initial rates and found to be 96 kJ/mol.
Mineralogical investigation revealed that carburization at 973 K was far from being complete. W metal phase was the predominant detected phase with only traces of the intermediate W2C phase. This observation is in contradiction with an earlier investigation where it was stated that no carbide phase could form at such low temperatures [12]. As the temperature increased, phases like W, W2C and WC were detected. The XRD pattern of W2C is similar to that of standard W2C peaks but broader .It was reported that nano-crystalline W2C has been restricted from further development but instead it proceeds to the more stable WC phase [13]. The above observations agree very well with the thermogravimetric results. There are no signs of the presence of intermediate W2C phase in the completely carburized samples.
Further evaluation of the above findings points to the fact that carburization can slowly start before complete reduction especially at lower temperatures. Similar observations have been reported earlier for the CoWO4 system [14]. Microstructural investigation of product sample (reduced and carburized) shows the existence of agglomerates of hemispherical small particles (Figure 16).

3.2.3. Reduction-Nitridation of Ni-W-O Mixed Oxides

The reduction–nitridation reactions of Ni-W-O powders was carried out isothermally at 973–1273 K in a flow of 50% H2 and 50% N2 gas mixture using a fluidized bed reactor. In these experiments, H2 gas was the reducing agent, while N2 in the gas mixture was applied for the nitridation reactions. Similar to previously reported observations, it is expected that these precursors will first get reduced in H2 gas to produce Ni–W intermetallics followed by the nitridation reaction of the reduced product. Because there is no reaction product during nitridation in the gas phase, analysis of the off-gases could not indicate the reaction progress. However, XRD results of reacted NiO-WO3 precursors revealed the presence of WO2 phase in NiO-WO3 precursor as a main phase formed at 1048 K together with W, Ni, WN2 and WN. This phase resulted from the stepwise reduction of WO3. With further rise in temperature, the WO2 phase is subsequently reduced to W metal, which is then reacted with N2 gas to produce tungsten nitrides (WN and WN2). The reduction-nitridation reactions of the stoichiometric NiWO4 precursor proceed faster than that of NiO-WO3, and tungsten nitrides are formed even at relatively lower. The extent of formation of WN, as the main reaction product at 1198 K, increases with rise in temperature. The higher the reaction temperature, the higher is the rate of formation of WN in the reaction products. Further, a higher degree of crystallinity was developed as indicated from the sharpening of WN peak at high temperatures. It is worth mentioning that, with an increase in the reaction time, the amount of WN formed increases and it becomes the predominant phase in NiWO4 precursor [15].

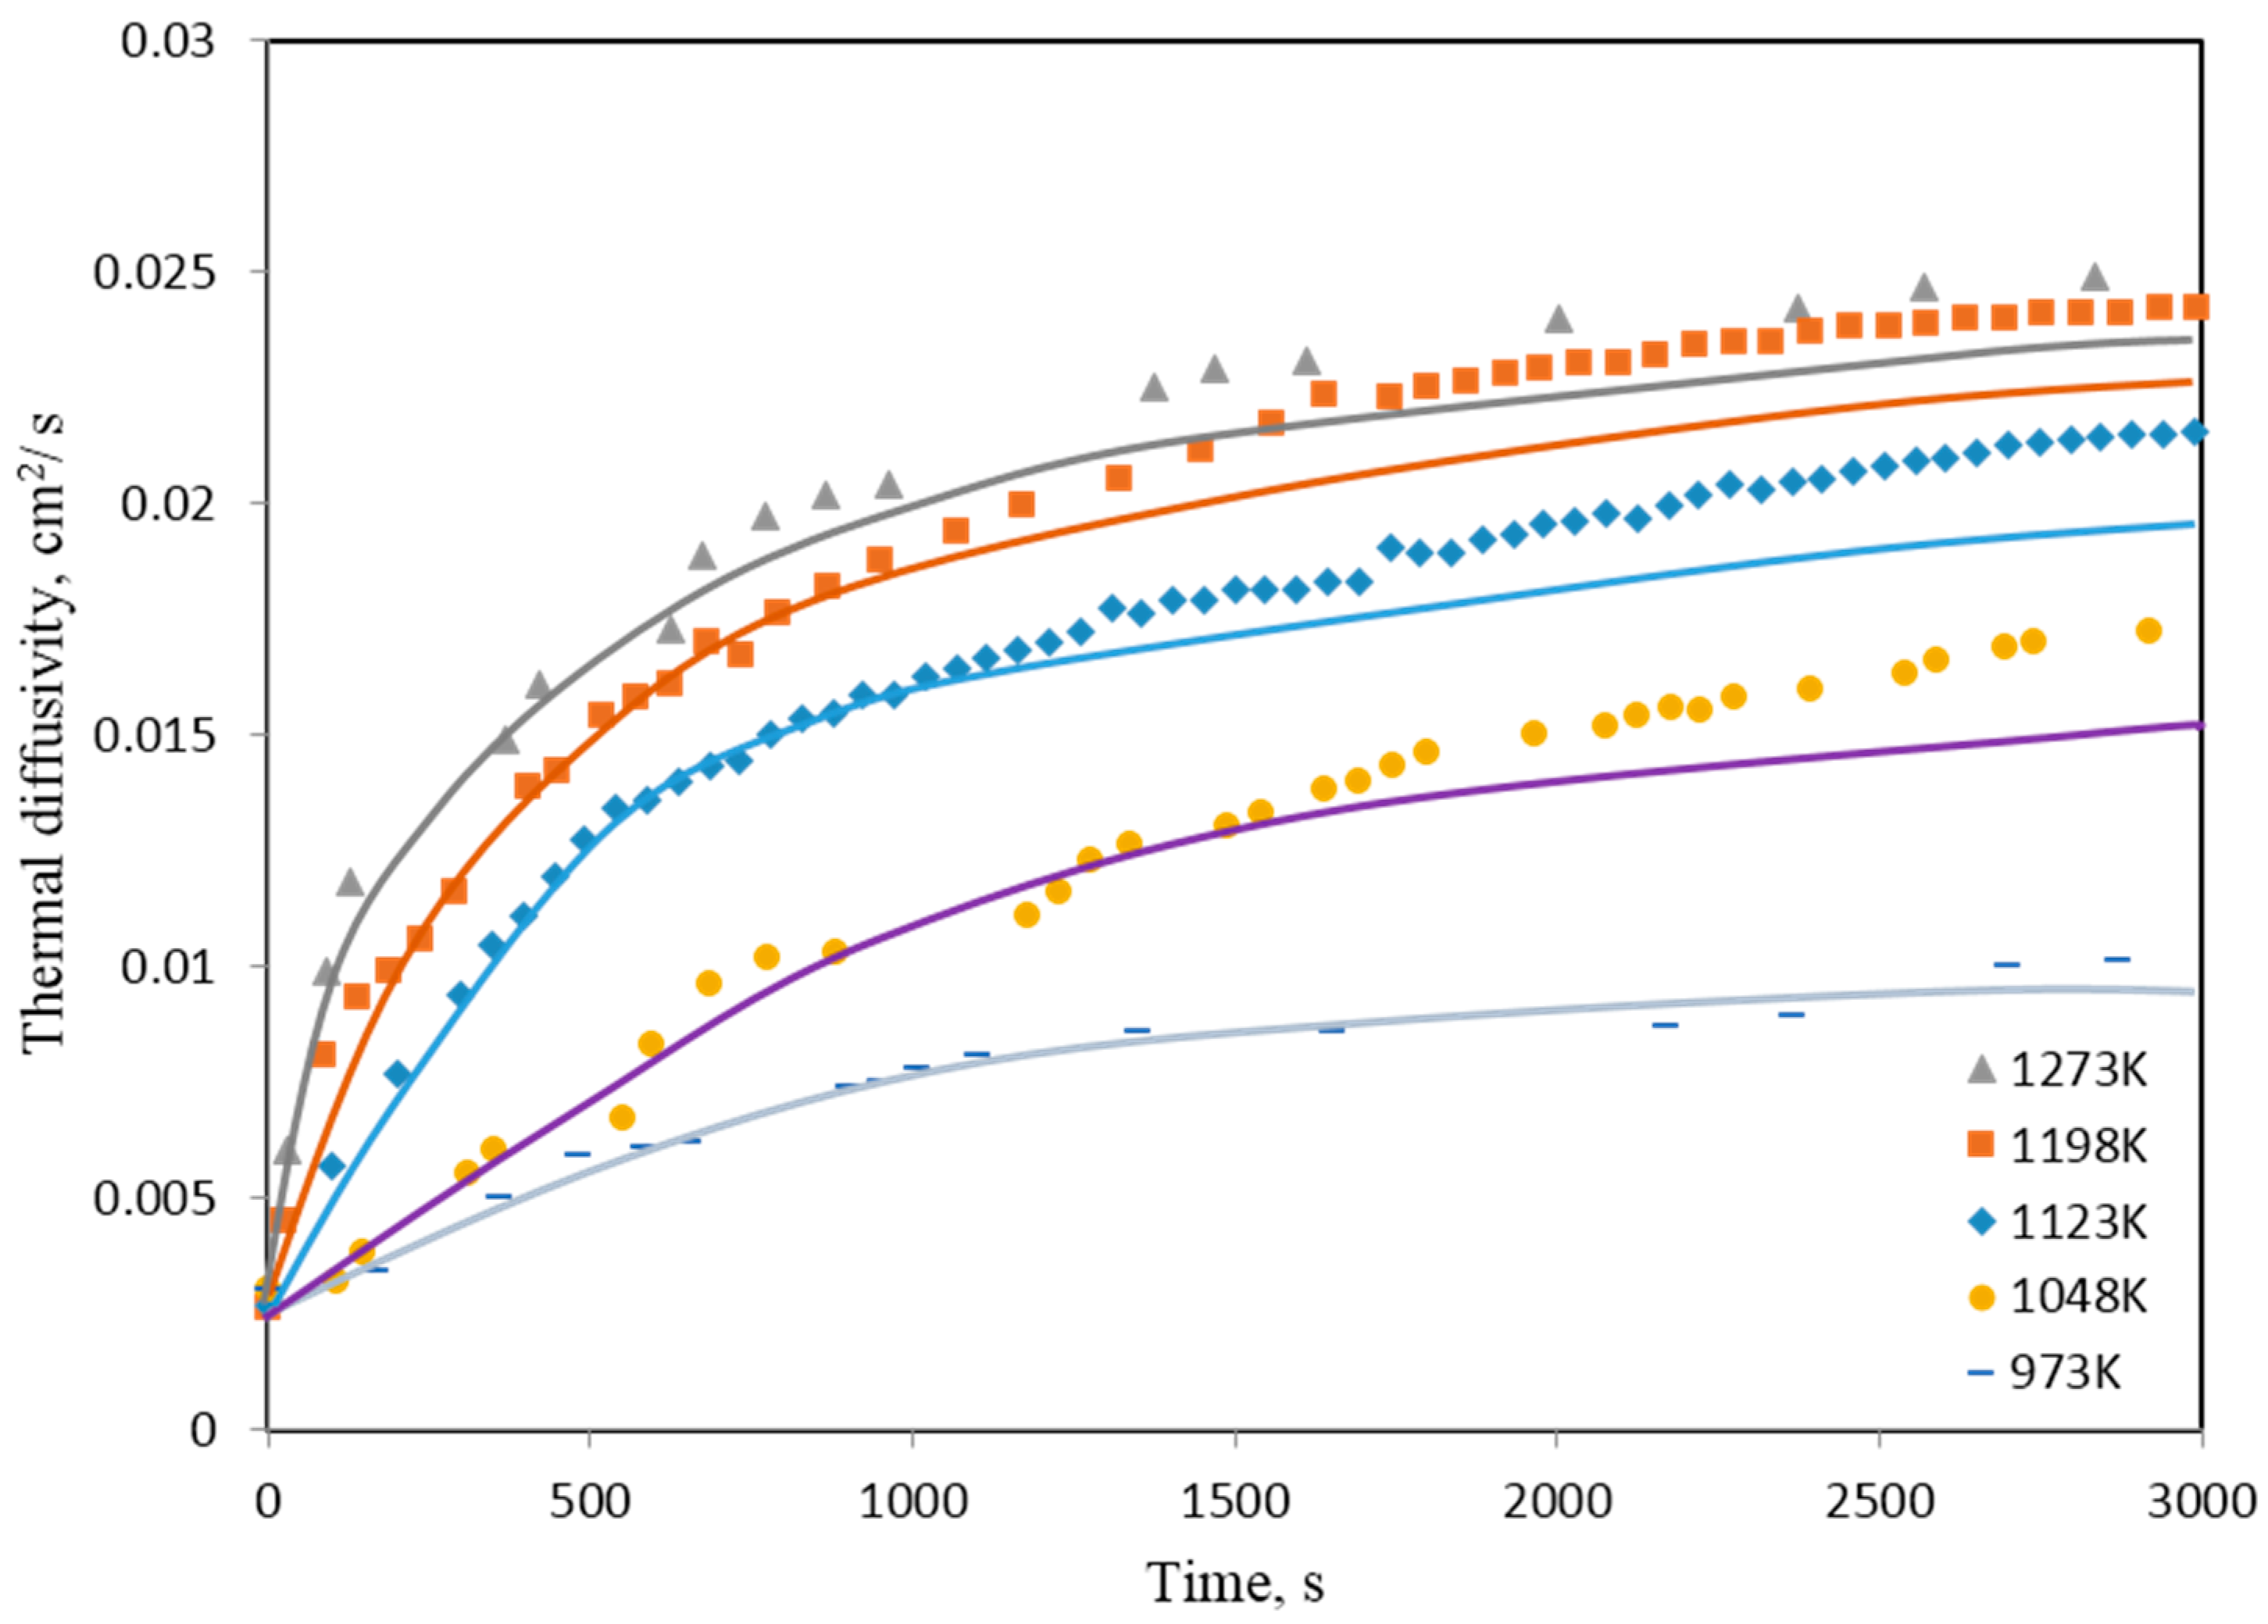
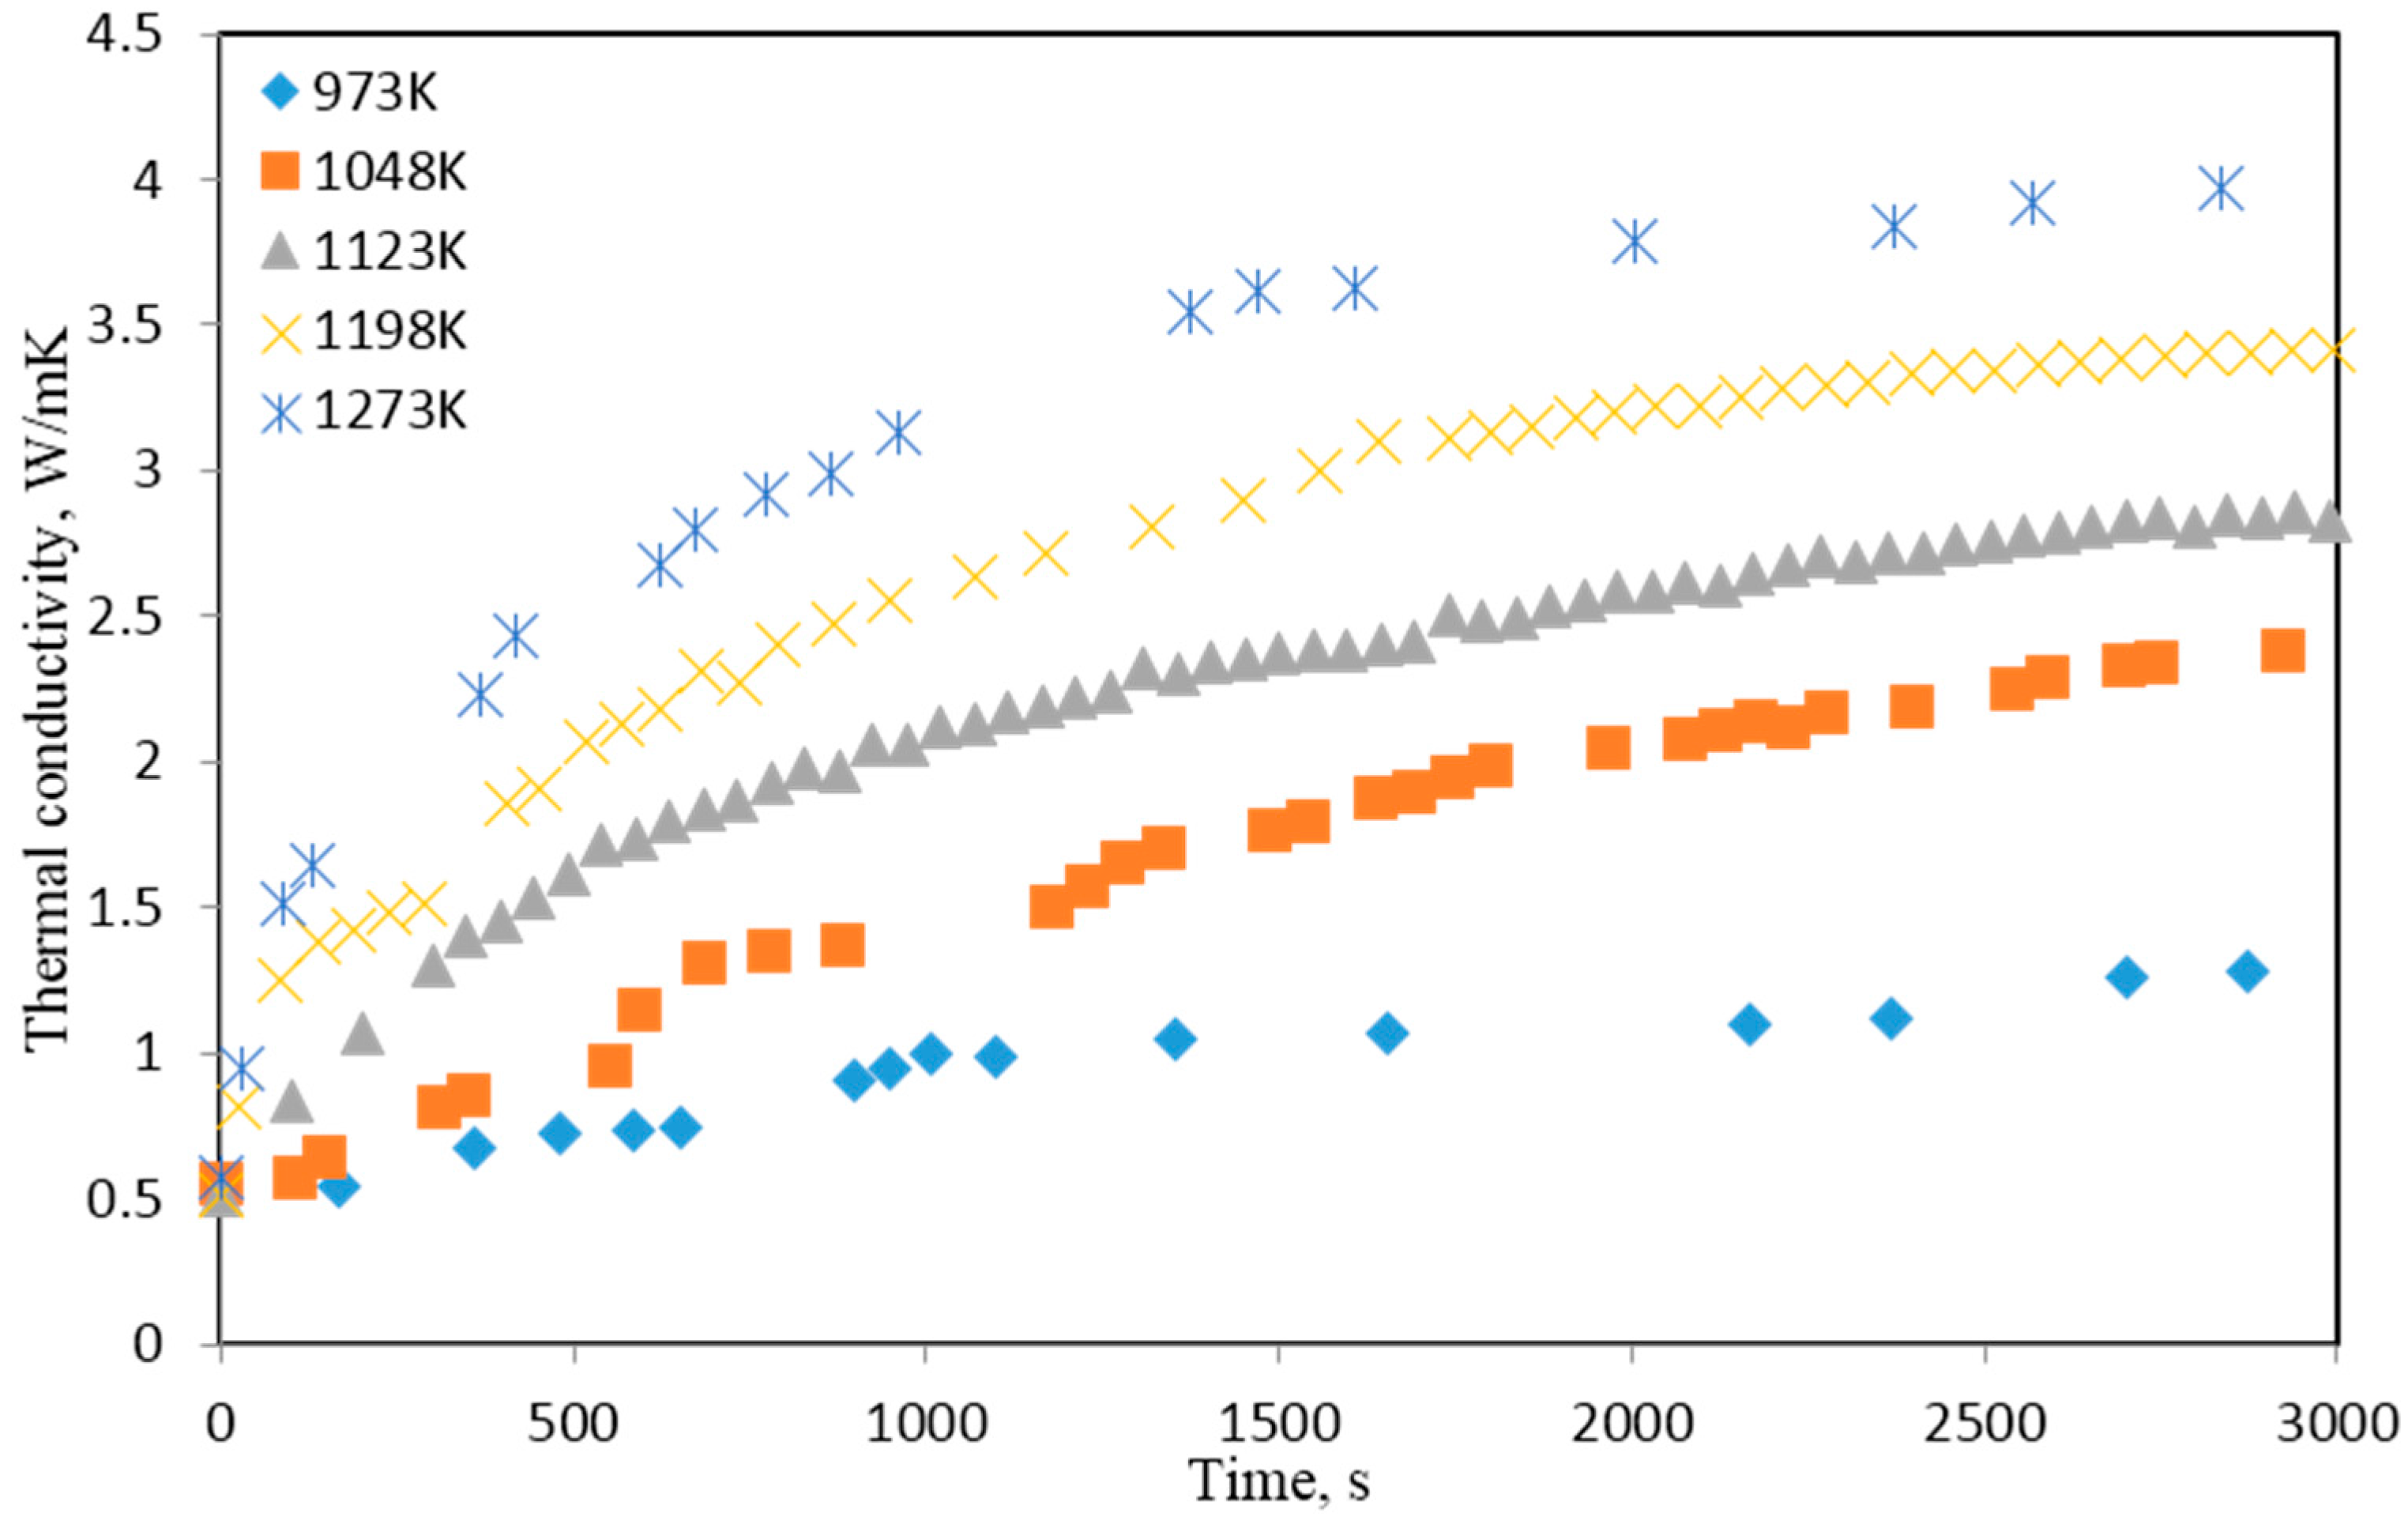
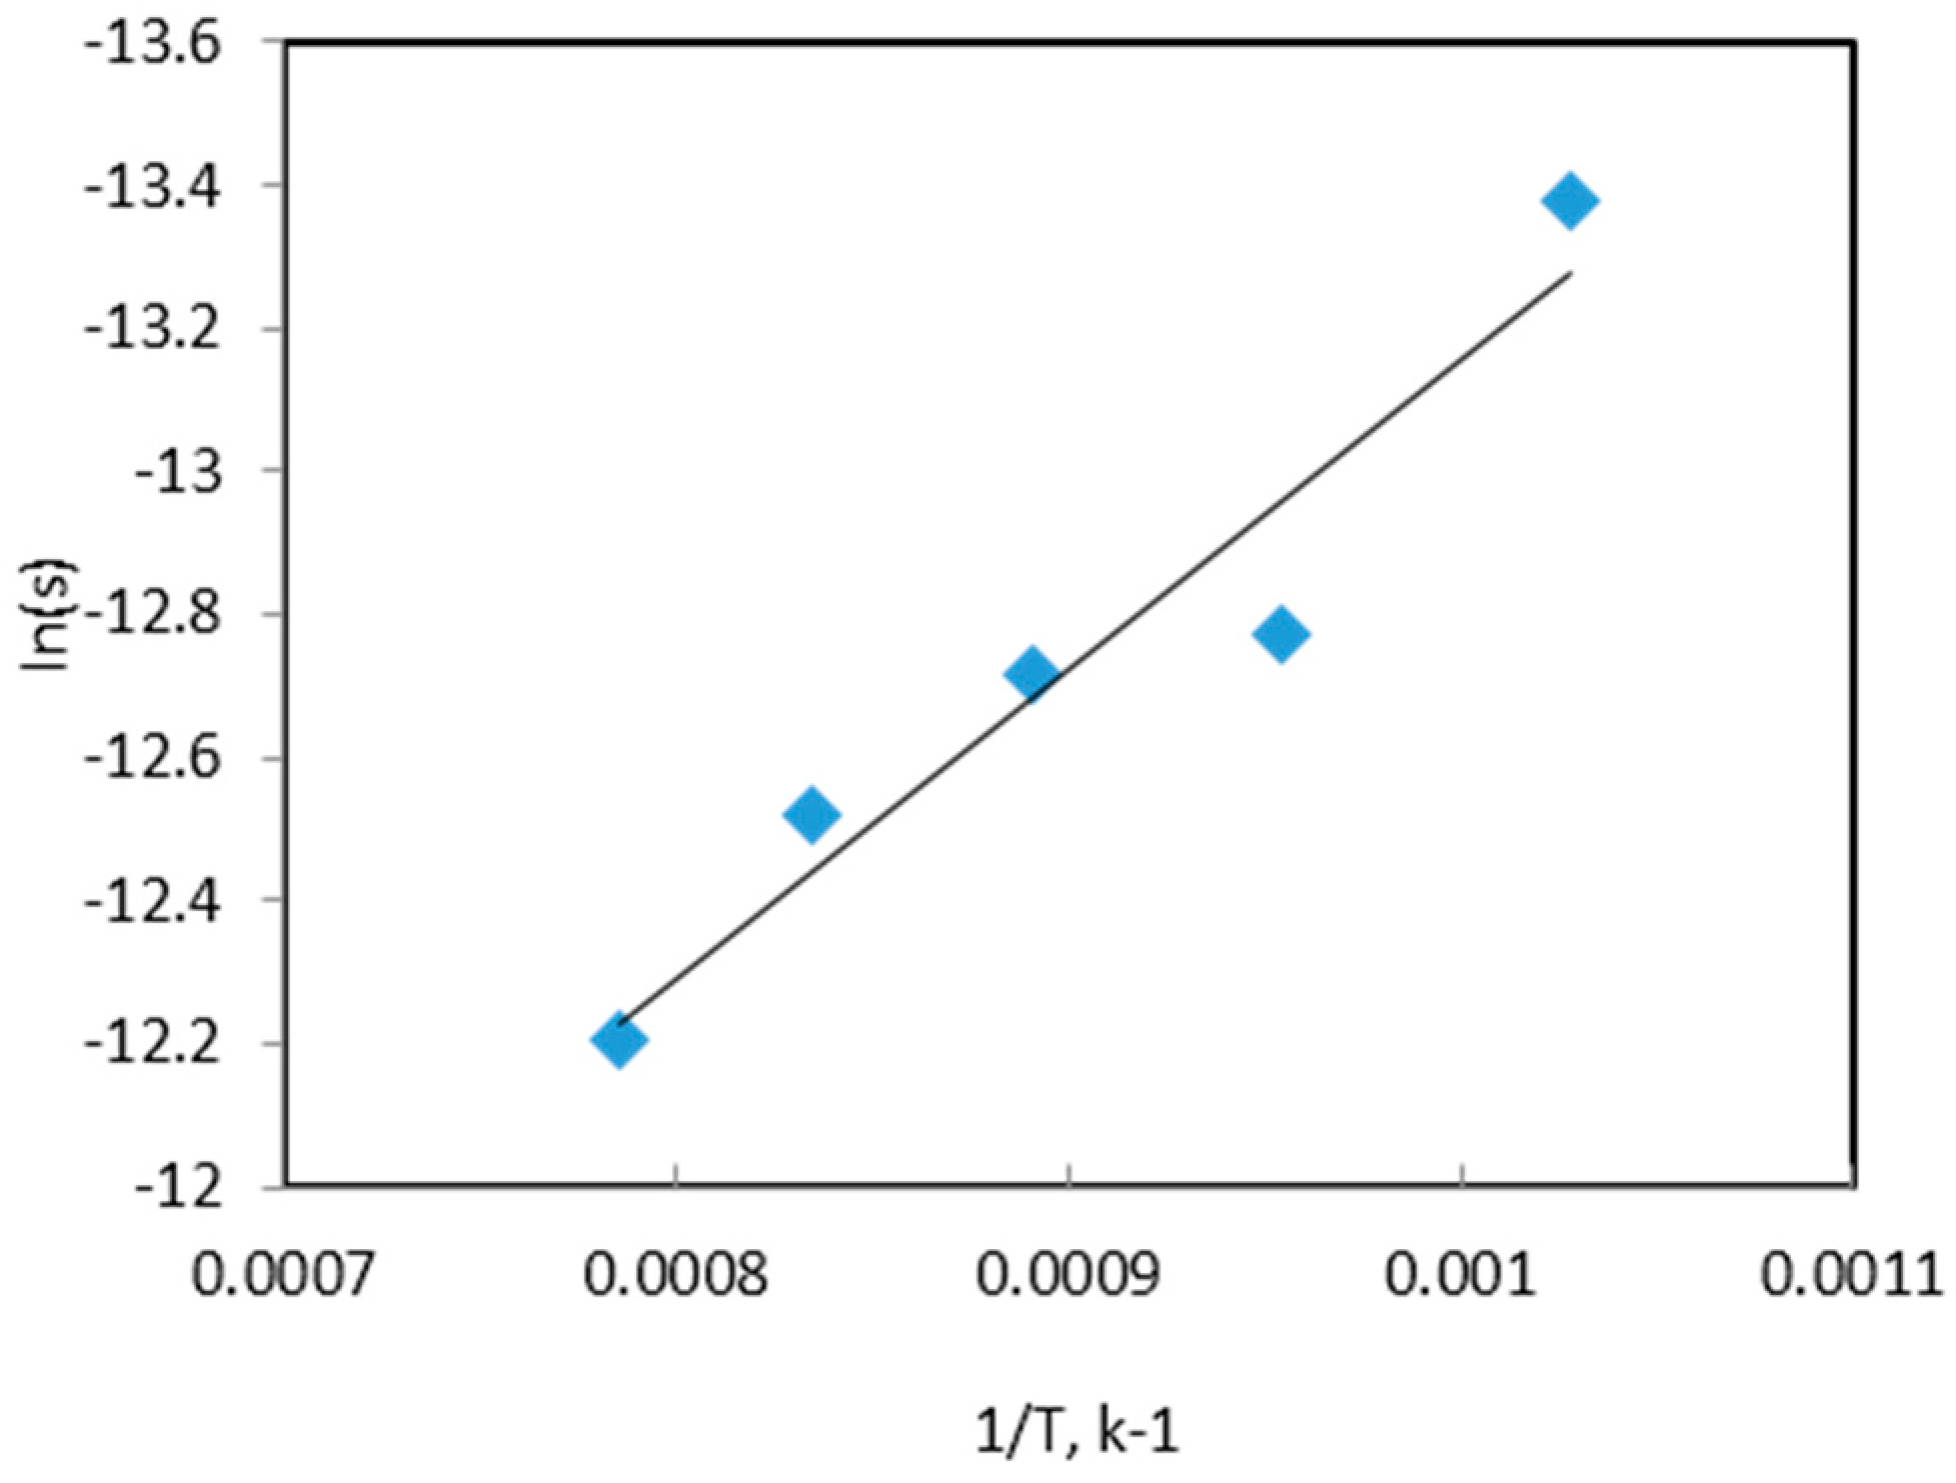
3.2.4. Thermal Diffusivity Measurements

Isothermal thermal diffusivity measurements of pressed pellets of NiWO4 were carried out in the temperature range from 973 to 1273 K under hydrogen using laser flash unit. Figure 17 shows the change of thermal diffusivity values as a function of time. In view of the shrinkage caused by sintering, the measured thermal diffusivity values were corrected according to the calculated thicknesses. The corrected values are plotted as solid lines in the same Figure. NiWO4 thermal diffusivity values were affected by the shrinking caused by sintering. Corrected thermal diffusivity curves deviate from the experimental points at the later stages.
As the sample bed get heated up in hydrogen, the chemical composition changes from the oxidic phase to metallic phase, which corresponds to initial fast increase in thermal diffusivity values. After complete reduction, the bed starts to sinter, which is explained by the sluggish increase in thermal diffusivity values in the later stages of the experiments. This explanation is further confirmed by the fact that heat is conducted by phonons in oxides and by electrons in metallic phases [16].
Thermal conductivity of a bed is expressed as a function of thermal conductivity of the gas, the solid and the void fraction of the bed. Conductivity can be considered as an over-all result of three mechanisms, namely; conduction, convection and radiation. Sun and Lu [17] reported that the heat transfer by convection is negligible for packed beds of fine particles. Moreover, it was reported that radiation became significant for 1 mm particle size above 673 K and 0.1 mm particles above 1773 K [18]. The average particle size of the studied NiWO4 powder was 2.5 μm. In view of these arguments, the radiation effect can be ruled out under the present experiment conditions.
Effective thermal conductivity is calculated based on λ = α C p ρ where α is the thermal diffusivity cm2/s, C p is the heat capacity J/Kg and ρ is the density g/cm3. In this, the apparent densities of the samples were calculated based on their volume and mass. The temperature dependence of specific heat was calculated by the principle of addition. Temperature and chemical composition dependence of the sample volume were measured manually by stopping the reaction at different points and rapidly cooling the sample in a stream of argon. Figure 18 shows the experimental values of effective thermal conductivity of pellets of NiWO4.
In the case of the reduction of an oxide by a gas, the outer layer of the oxide pellet is likely to be reduced first before the reduction proceeds towards the core. The reduction will occur along the sides as well. An outer metallic layer is likely to result in the conduction of heat along the sides of the pellet deviating from the axial heat flow across the pellet in the vertical direction. The possibility of such a conduction mechanism was examined in the present experimental series. It was found that, in the case of partially reduced pellets of NiWO4, there were grains of reduced oxides. However, microscopic examination of these pellets revealed that the metallic grains formed were largely unconnected with each other, possibly due to the loss of oxygen from the oxide leaving voids. In the early stages, heat conduction along the sides will also have a resistance due to the fact that the metallic layer would be very thin and the heat flow would not be substantial. As the reaction proceeds further, a significant amount of oxide in the bulk of the pellet would be reduced. In such a case, surface conduction effects would not have a serious impact on the results.
The activation energy for the reduction NiWO4 was calculated by an Arrhenius plot using the isothermal reduction rates at the initial stages of the reaction, which can be represented by the change in thermal diffusivity, at different temperatures. A plot of ln (s), where s = dα/dt, against 1/T is presented in Figure 19.
Based on the slope, activation energy value 91.4 kJ/mol was calculated. The calculated value was found to be higher than that obtained previously based on TGA experiments (37 kJ/mol). These inconsistencies required further investigation on the structural changes and reaction mechanism through the pellets. The difference can be explained, to some extent, on the basis of physical and structural changes during the process, since, thermal diffusivity is affected by change of porosity.
Sintering is a rate process, similar to reduction, influenced by temperature. Since the sintering has the dominant effect on diffusivity changes at later stages of the process, the degree of sintering may be expressed in terms of thermal diffusivity. In such a case, the activation energy of sintering can be calculated directly from the slopes of thermal diffusivity curves during the final stages (Figure 20). From the slopes of these curves an activation energy value of 36 kJ/mol was obtained.
The calculated activation energy of sintering was found to be less than that reported in the literature (160 kJ/mol [19] for Ni-W systems). One possible explanation is that the reduced metallic particles in the nascent state would have a significant population of active centers on the surface of each particle enhancing thereby the sintering process. Further, the presence of reducing atmosphere would prevent any formation of surface oxide coating and minimize the diffusion barrier due to these surface layers. Thus, a reducing atmosphere would promote sintering and is likely to lower the activation energy compared to inert atmosphere. Further, hydrogen molecules would diffuse into the pores and thereby facilitate the densification process via reaction with surface layers [20]. The physical capability of hydrogen to act as a lattice defect catalyst [21] would facilitate the movement of point defects and dislocations during sintering and thereby would lower the activation energy [22].

4. Conclusions

The present paper presents the work carried out at the Division of Materials Process Science, Royal Institute of Technology, Stockholm, Sweden on the hydrogen reduction of mixed oxides containing the refractory metals Mo and W. The main experimental technique used was TGA, fluidized bed reactor supplemented by thermal diffusivity measurements in one case. In all the cases, the products formed were characterized by standard methods.
The kinetics of reduction of the pure oxides were estimated and production of nano to micro grains of intermetallics was demonstrated. Up-scaling of thermo-gravimetric experiments using fluidized bed technique was successfully carried out. The up-scaling facilitates the mass production of intermetallics and also opens the possibility to produce other alloys in nano-range region. A varied range of Fe-Mo alloys could be produced utilizing the gas-solid reaction route in one step.
On the other hand, cemented carbide and nitrides were successfully produced utilizing friendly environmentally gases through short production route. The corresponding reaction kinetics and mechanism were identified. Thermal property of a material was used as a novel tool to track the reaction progress and evaluate the associated physical changes.
Therefore, it can be stated that the gas-solid reactions provide a very suitable process route to the production in bulk of intermetallics with suitable interstitials like carbon or nitrogen or both.

Acknowledgments

The financial support from the Swedish Research Council and CAMM–Centre of Advanced Mining and Metallurgy at Luleå University of Technology, Sweden is acknowledged.

Author Contributions

Hesham Ahmed, Ricardo Morales-Estrella and Seshadri Seetharaman conceived and designed the experiments; Hesham Ahmed and Ricardo Morales-Estrella performed the experiments; Hesham Ahmed, Ricardo Morales-Estrella, Nurni Viswanathan and Seshadri Seetharaman have analyzed the data; Hesham Ahmed and Ricardo Morales-Estrella wrote the paper; Nurni Viswanathan and Seshadri Seetharaman revised the paper and made in final form.

Conflicts of Interest

The authors declare no conflict of interest.

References

  1. Yang, M.; MacLeod, M.J.; Tessier, F.; DiSalvo, F.J. Mesoporous metal nitride materials prepared from bulk oxides. J. Am. Ceram. Soc. 2012, 95, 3084–3089. [Google Scholar] [CrossRef]
  2. Morales, R.; Sichen, D.; Seetharaman, S.; Arvanitidis, I. Reduction of Fe2MoO4 by hydrogen gas. Metall. Mater. Trans. B 2002, 33, 589–594. [Google Scholar] [CrossRef]
  3. Ahmed, H.M.; El-Geassy, A.A.; Viswanathan, N.N.; Seetharaman, S. Kinetics and Mathematical Modeling of Hydrogen Reduction of NiO-WO3 Precursors in Fluidized Bed Reactor. ISIJ Int. 2011, 51, 1383–1391. [Google Scholar] [CrossRef]
  4. Ahmed, H.M.; Seetharaman, S. Isothermal dynamic thermal diffusivity studies of the reduction of NiO and NiWO4 precursors by hydrogen. Int. J. Mater. Res. 2011, 102, 1336–1344. [Google Scholar] [CrossRef]
  5. Heijwegen, C.; Rieck, G. Determination of the phase diagram of the Mo-Fe system using diffusion couples. J. Less Common Met. 1974, 37, 115–121. [Google Scholar] [CrossRef]
  6. Kleykamp, H.; Schauer, V. Phase equilibria and thermodynamics in the Fe-Mo and Fe-Mo-O systems. J. Less Common Met. 1981, 81, 229–238. [Google Scholar] [CrossRef]
  7. Rawlings, R.; Newey, C. Study of the Iron-Molybdenum System by Means of Diffusion Couples. J. Iron Steel Inst. 1968, 206, 723. [Google Scholar]
  8. Morales, R.; Arvanitidis, I.; Seetharaman, S. Interinsic Reduction of MoO3 by Hydrogen. Z. Metall. 2000, 91, 589. [Google Scholar]
  9. Morales, R.; Seetharaman, S.; Agarwala, V. Mechanical and structural characterization of uniaxially cold-pressed Fe2Mo powders. J. Mater. Res. 2002, 17, 1954–1959. [Google Scholar] [CrossRef]
  10. Ahmed, H.M.; El-Geassy, A.A.; Seetharaman, S. Kinetics of Reduction of NiO-WO3 Mixtures by Hydrogen. Metall. Mater. Trans. B 2010, 41, 161–172. [Google Scholar] [CrossRef]
  11. Ahmed, H.M.; Seetharaman, S. Reduction-carburization of NiO-WO3 under isothermal conditions using H2-CH4 gas mixture. Metall. Mater. Trans. B 2010, 41, 173–181. [Google Scholar] [CrossRef]
  12. Bondarenko, V.; Pavlotskaya, E. High-temperature synthesis of tungsten carbide in a methane-hydrogen gas medium. Powder Metall. Met. Ceram. 1996, 34, 508–512. [Google Scholar] [CrossRef]
  13. Gao, L.; Kear, B. Synthesis of nanophase WC powder by a displacement reaction process. Nanostructured Mater. 1997, 9, 205–208. [Google Scholar] [CrossRef]
  14. Lebukhova, N.; Karpovich, N. Carbothermic reduction of cobalt and nickel tungstates. Inorg. Mater. 2006, 42, 310–315. [Google Scholar] [CrossRef]
  15. El-Geassy, A.; Nassir, N.A.; Ahmed, H.; Seetharaman, S. Simultaneous reduction nitridation for the synthesis of tungsten nitrides from Ni-W-O precursors. Powder Metall. 2013, 56, 411–419. [Google Scholar] [CrossRef]
  16. Taylor, R. Construction of apparatus for heat pulse thermal diffusivity measurements from 300–3000K. J. Phys. E Sci. Instrum. 1980, 13, 1193. [Google Scholar] [CrossRef]
  17. Sun, S.; Lu, W.K. Mathematical Modelling of Reactions in Iron Ore/Coal Composites. ISIJ Int. 1993, 33, 1062–1069. [Google Scholar] [CrossRef]
  18. Tsotsas, E.; Martin, H. Thermal conductivity of packed beds: A review. Chem. Eng. Process. Process Intensif. 1987, 22, 19–37. [Google Scholar] [CrossRef]
  19. Toth, I.; Lockington, N. The kinetics of metallic activation sintering of tungsten. J. Less Common Met. 1967, 12, 353–365. [Google Scholar] [CrossRef]
  20. Liu, L.; Loh, N.; Tay, B.; Tor, S.; Murakoshi, Y.; Maeda, R. Micro powder injection molding: Sintering kinetics of microstructured components. Scr. Mater. 2006, 55, 1103–1106. [Google Scholar] [CrossRef]
  21. Dominguez, O.; Bigot, J. Material transport mechanisms and activation energy in nanometric Fe powders based on sintering experiments. Nanostructured Mater. 1995, 6, 877–880. [Google Scholar] [CrossRef]
  22. Paul, B.; Jain, D.; Bidaye, A.; Sharma, I.; Pillai, C. Sintering kinetics of submicron sized cobalt powder. Thermochim. Acta 2009, 488, 54–59. [Google Scholar] [CrossRef]
Figure 1. The isothermal reduction curves of shallow powder beds FeMoO4 by hydrogen [2].
Metals 06 00190 g001
Figure 2. Arrhenius plot for the isothermal reduction of shallow powder beds of Fe2MoO4 [2].
Metals 06 00190 g002
Figure 3. The non-isothermal reduction curves of shallow powder bed of Fe2MoO4 [2].
Metals 06 00190 g003
Figure 4. Arrhenius plot for the non-isothermal reduction of shallow powder beds of Fe2MoO4 [2].
Metals 06 00190 g004
Figure 5. SEM micrograph of sponge-like porous Fe2Mo powder particle used for unidirectional compaction.
Metals 06 00190 g005
Figure 6. XRD pattern of the powder sample reduced by H2 gas showing the sharpest Bragg peaks corresponding to the Miller indices of Fe2Mo phase.
Metals 06 00190 g006
Figure 7. TEM micrographs of a Fe2Mo pellet pressed at 1 GPa showing: (a) domains of different orientations with perfect coherency at the particle interface; (b) SAD pattern showing microcrystalline structure; and (c) SAD pattern showing satellite reflection superimposed on microcrystalline pattern of Fe2Mo [9].
Metals 06 00190 g007
Figure 8. Experimental values of the fractional reduction of Fe2MoO4 by hydrogen in a fluidized bed reactor.
Metals 06 00190 g008
Figure 9. SEM micrographs showing the effect of reduction temperature on the microstructure of fluidizing powder; (a) 923 K, (b) 1023 K, (c) 1073 K, (d) 1173 K (at the same magnification) [9].
Metals 06 00190 g009
Figure 10. The mass changes for the reduction of the oxide precursors as a function of time. (a) Ni/(Ni + W) = 0.7; (b) Ni/(Ni + W) = 0.6; (c) Ni/(Ni + W) = 0.46; (d) Ni/(Ni + W) = 0.4 molar ratio [10].
Metals 06 00190 g010
Figure 11. Experimental results for fractional reduction as a function of time. (a) Ni/(Ni + W) = 0.7; (b) Ni/(Ni + W) = 0.5; (c) Ni/(Ni + W) = 0.4 molar ratio [3].
Metals 06 00190 g011
Figure 12. Schematic representation of fluidized powder bed [3].
Metals 06 00190 g012
Figure 13. XRD pattern for synthesized Ni-W alloy phases at 1023 K, where 0.7, 0.6, 0.5, 0.46 and 0.4 are Ni/Ni + W molar ratio [10].
Metals 06 00190 g013
Figure 14. SEM image of 0.4 Ni/(Ni + W) molar ratio at 1173 K, magnification 2000×.
Metals 06 00190 g014
Figure 15. Mass change percentage of the oxide mixture 10.67 wt. pct NiO and 89.33 wt. pct WO3 vs. time [11].
Metals 06 00190 g015
Figure 16. SEM images of a reduced-carburized 0.27 Ni/(Ni + W) molar ratio sample at 1273 K.
Metals 06 00190 g016
Figure 17. Effect of reaction progress on the thermal diffusivity values of pressed NiWO4. Symbols represent the experimental raw values while solid lines represent the corrected values [4].
Metals 06 00190 g017
Figure 18. Effect of reaction progress on the effective thermal conductivity values of pressed NiWO4.
Metals 06 00190 g018
Figure 19. Arrhenius plot for the reduction of NiWO4 by hydrogen using laser flash unit.
Metals 06 00190 g019
Figure 20. Arrhenius plot for sintering of NiWO4 using laser flash unit.
Metals 06 00190 g020
Table 1. Starting materials, their purity and corresponding supplier.
CompoundPurity %Supplier
MoO399.95Alfa Aesar; Karlsruhe, Germany
Fe2O399.8Alfa Aesar; Karlsruhe, Germany
Fe99.95Merck; Darmstadt, Germany
Fe98Merck; Darmstadt, Germany
NiO99Sigma-Aldrich (St. Louis, MO, USA)
WO399.9Atlantic Equipment Engineering (AEE) (Bergenfield, NJ, USA)
NiWO499Johnson Matthey Inc. (London, UK)
Iron with 98 pct was used for the fluidized bed experiments
Table 2. Calculated and experimentally obtained reaction rate constants of NiWO4 [3].
Temp., KComputed valuesExperimental values *
2nd stage3rd stage2nd stage3rd stage
9731.81 × 10−30.60 × 10−31.09 × 10−30.60 × 10⁻³
10482.26 × 10−30.87 × 10−32.17 × 10−30.88 × 10⁻³
11232.67 × 10−31.14 × 10−32.56 × 10−31.09 × 10⁻³
11983.00 × 10−31.43 × 10−33.06 × 10−31.49 × 10⁻³
12733.28 × 10−31.72 × 10−33.34 × 10−31.72 × 10⁻³
* First stage was not possible to determine experimentally.
Table 3. Activation energy for different NiO-WO3 mixtures [3,10].
(Ni/Ni+W)
molar ratio
Activation energy kJ/mol
1st stage *2nd stage3rd stage
TGA experiments
0.717.96251
0.617.55143.9
0.51837.935.5
0.4620.638.234.5
0.440.3 **
Fluidized bed experiments ***
0.7---58.650.8
0.5---36.335
0.4---46 **
* It was not able to distinguish the 1st stage in fluidized bed. ** No clear discontinuity was found in the reaction rate, so it was difficult to calculate the activation energy for each step. *** Activation energy calculation based on surface chemical reaction model.

