In the following section, ternary compounds are denoted by the Greek symbol τ and are numbered according to their order of appearance. Binary and ternary solid solutions are described using parentheses and superscripts. For example, the binary solid solubility of Zn in α-Mg is presented as (α-Mg)Zn and the ternary solid solubility of Zn in Mg3Nd is presented as (Mg3Nd).
3.1. Solid-Solid Diffusion Couples
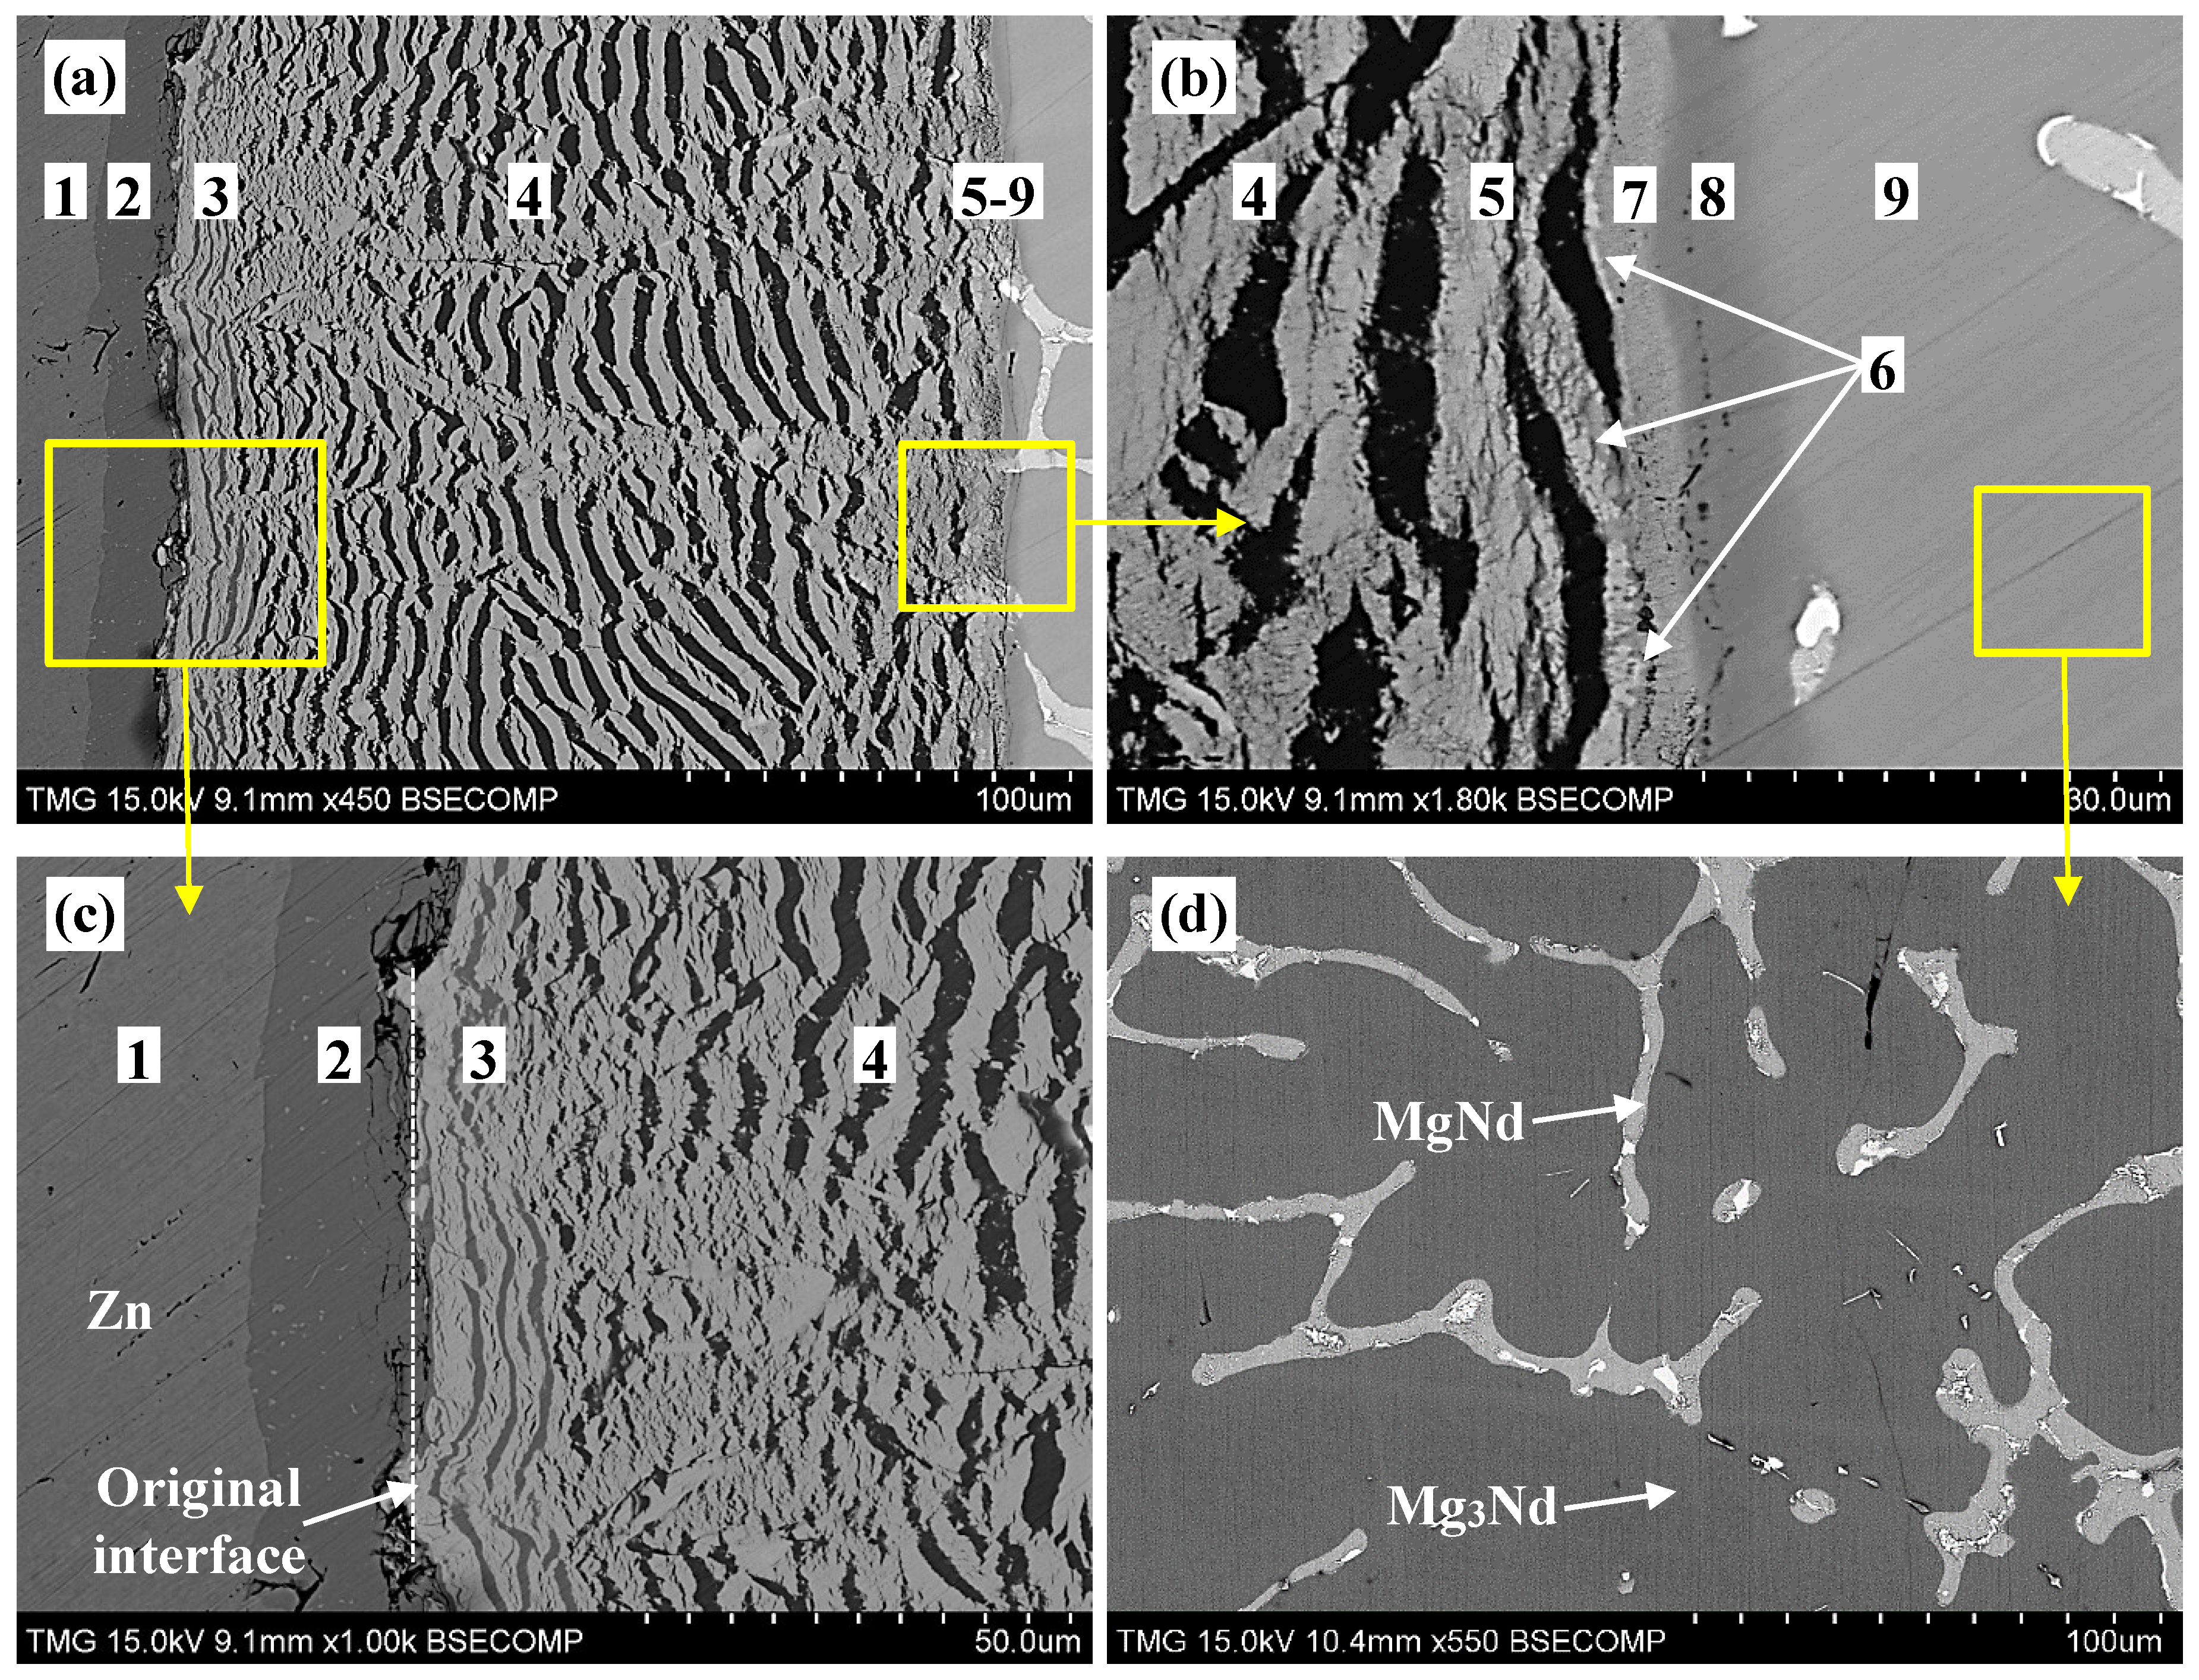
The end-members of diffusion couple #1 were made from pure zinc and a two-phase binary alloy containing Mg
3Nd and MgNd, as shown in
Figure 2d. The diffusion couple was annealed at 300 °C for 21 days. The SEM micrographs of diffusion couple #1 are shown in
Figure 2a–c. Nine diffusion zones in this diffusion couple were identified using WDS spot analysis (±1 atom %). The compositions of the constituents of these nine zones are given in
Table 1.
From
Figure 2 and
Table 1, diffusion zone #1 represents the pure-Zn end-member. Diffusion zone #2 represents the binary compound layer Mg
2Zn
11. Diffusion zones #3–5 represent two-phase layers. These are: (Nd
2Zn
17)+Mg
2Zn
11, (Nd
2Zn
17)+MgZn
2, and τ
1+MgZn
2, respectively. Three-phase equilibrium could be determined at every interface of these zones. For instance, the three-phase equilibria (Nd
2Zn
17)+Mg
2Zn
11+MgZn
2 was determined at the interface between zones #3 and #4. The three-phase equilibria (Nd
2Zn
17)+MgZn
2+τ
1 was determined at the interface between zones #4 and #5. Each of the diffusion zones #6–8 represent a single phase layer as follows: Mg
2Nd
2Zn
9 (denoted as τ
2 in this work), MgNdZn
2 (denoted as τ
3 in this work), and Nd(Mg,Zn)
3, respectively. Drits
et al. [
11] reported the existence of Mg
2Nd
2Zn
9 at 200 and 300 °C and proposed that it is in equilibrium with α-Mg in both isothermal sections. Zones #7 and #8 show that Zn substitutes for Mg at a constant Nd concentration of 25 atom %. The composition of Mg varied from 25 to 31.5 atom % in the τ
3 ternary compound, and from 51.2 to 75 atom % in the (Mg
3Nd) ternary solid solution. Zone #9 is the Mg
3Nd+MgNd end-member.
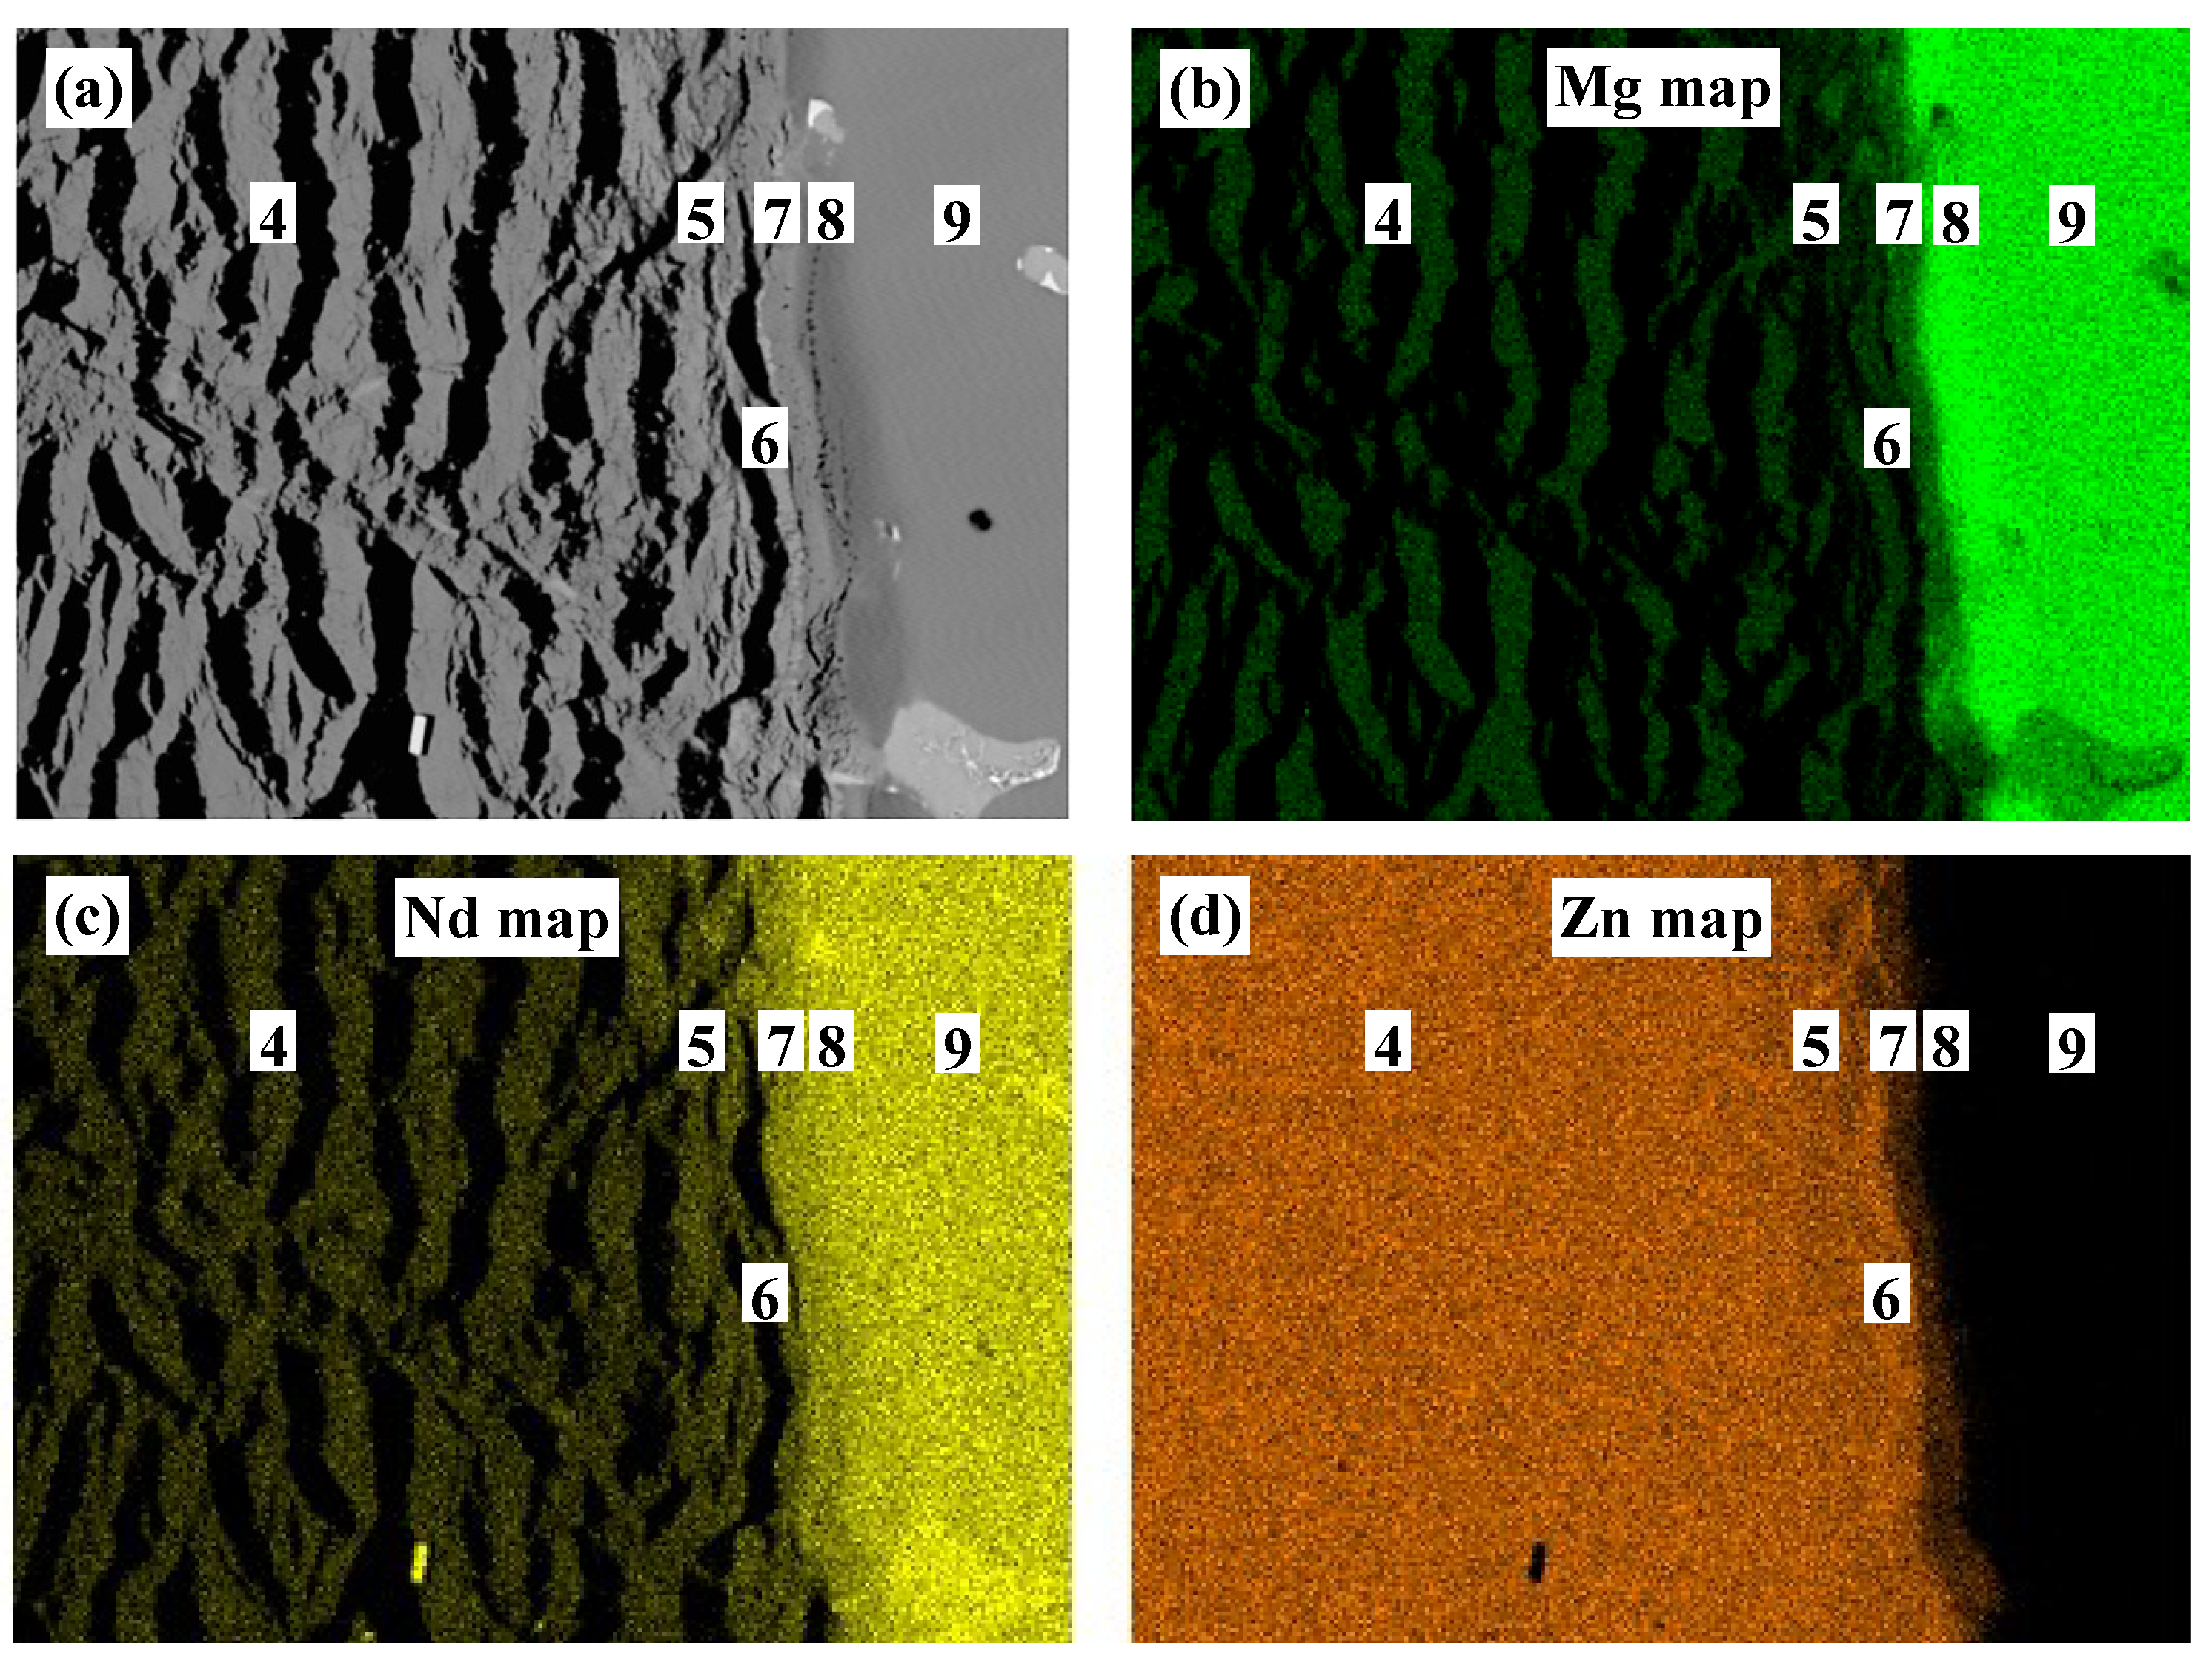
EDS elemental mapping was performed to determine the boundaries of the diffusion zones near the two-phase end-member (zone #9) as shown in
Figure 3. These maps proved that the observed morphology in diffusion couple #1 has planar features with alternating phases and not cracks. The elemental maps of Mg, Nd, and Zn distribution are presented in
Figure 3b–d, respectively.
According to EDS elemental mapping, the dark phase in
Figure 3a, zones #4 and #5, represent the MgZn
2 compound, whereas the bright dendrites represent the ternary and the Nd-containing binary phases. These phases are Nd
2Zn
17 in zone #4 and as τ
1 in zone #5. Zones #6 and #7 are τ
1 and τ
3 ternary compounds. Zone #8 is the (Mg
3Nd) ternary solid solution. These results were confirmed by WDS analysis, as listed in
Table 1.
It is usually difficult to locate the original interface between the two end-members after diffusion takes place. However, knowing the location of the original interface provides information regarding atomic flux leading to diffusion layer formation [
18]. The original interface of diffusion couple #1 was determined at the contacting interface between zones #2 and #3, as shown in
Figure 2c. This means that the diffusion reaction took place based on Mg and Zn atom, exchange with less mobility for Nd atoms. As a result, a very wide matrix containing Mg
2Zn
11 in zone #3, and MgZn
2 in zones #4 and #5, are formed, and the Nd-containing phases, the bright dendrites in
Figure 2a, appeared within this matrix. Similar morphologies were observed at 300 °C in the Ce-Mg-Zn system studied by our research group [
19]. The reason for having such periodic layer morphology could be due to the difference between the atomic sizes of Mg/Zn atoms that leads to lattice distortion, which imposes mechanical stresses that break the ternary compound layers. The atomic radius of Zn is about 133 pm, which is relatively smaller than the atomic radius of Mg (160 pm) [
20]. Also, when a diffusion couple consists of species with very different mobilities, various phases are grown at different growth rates. Therefore, the slowly growing phase will be under tension as the other phase grows rapidly, and it finally splits off from the reaction front [
21]. In this work, the mobility of Zn atoms is expected to be higher than that of Nd. Thus, the very mobile Zn atoms diffuse into the Mg-Nd end-member, leading to the formation of a Mg-Zn matrix and Mg-Nd-Zn ternary compounds.
Figure 2.
(
a–
c) SEM micrographs of diffusion couple #1 annealed at 300 °C for 21 days. The numbers represent the diffusion zones and correspond to those in
Table 1 and
Figure 4; (
d) is the SEM micrograph of MgNd+Mg
3Nd end-member.
Table 1.
WDS spot analysis of different diffusion zones of the diffusion couple #1.
| Zone | Description | Composition (atom %) | Corresponding Phase |
|---|
| Mg | Nd | Zn |
|---|
| 1 | Pure Zn (end-member) | - | - | 100 | Zn |
| 2 | Single-phase layer | 15.4 | - | 84.6 | Mg2Zn11 |
| 3 | Two-phase layer | 10.8 | 1.9 | 87.3 | (Nd2Zn17) |
| 14.7 | 85.3 | - | Mg2Zn11 |
| 4 | Two-phase layer | 2.0 | 8.9 | 89.1 | (Nd2Zn17) |
| 32.5 | 0 | 67.5 | MgZn2 |
| 5 | Two-phase layer | 6.5 | 29.5 | 64 | τ1 |
| 32.1 | - | 67.9 | MgZn2 |
| 6 | Single-phase layer | 14.5 | 14.7 | 71.8 | τ2 |
| 7 | Single-phase layer | 25.0–31.5 | 24.5 | 44.0–51.5 | τ3 |
| 8 | Single-phase layer | 51.2–75.0 | 24.6 | 0–24.2 | (Mg3Nd) |
| 9 | Two-phase alloy | 74.8 | 25.2 | - | Mg3Nd |
| (end-member) | 50.0 | 50.0 | - | MgNd |
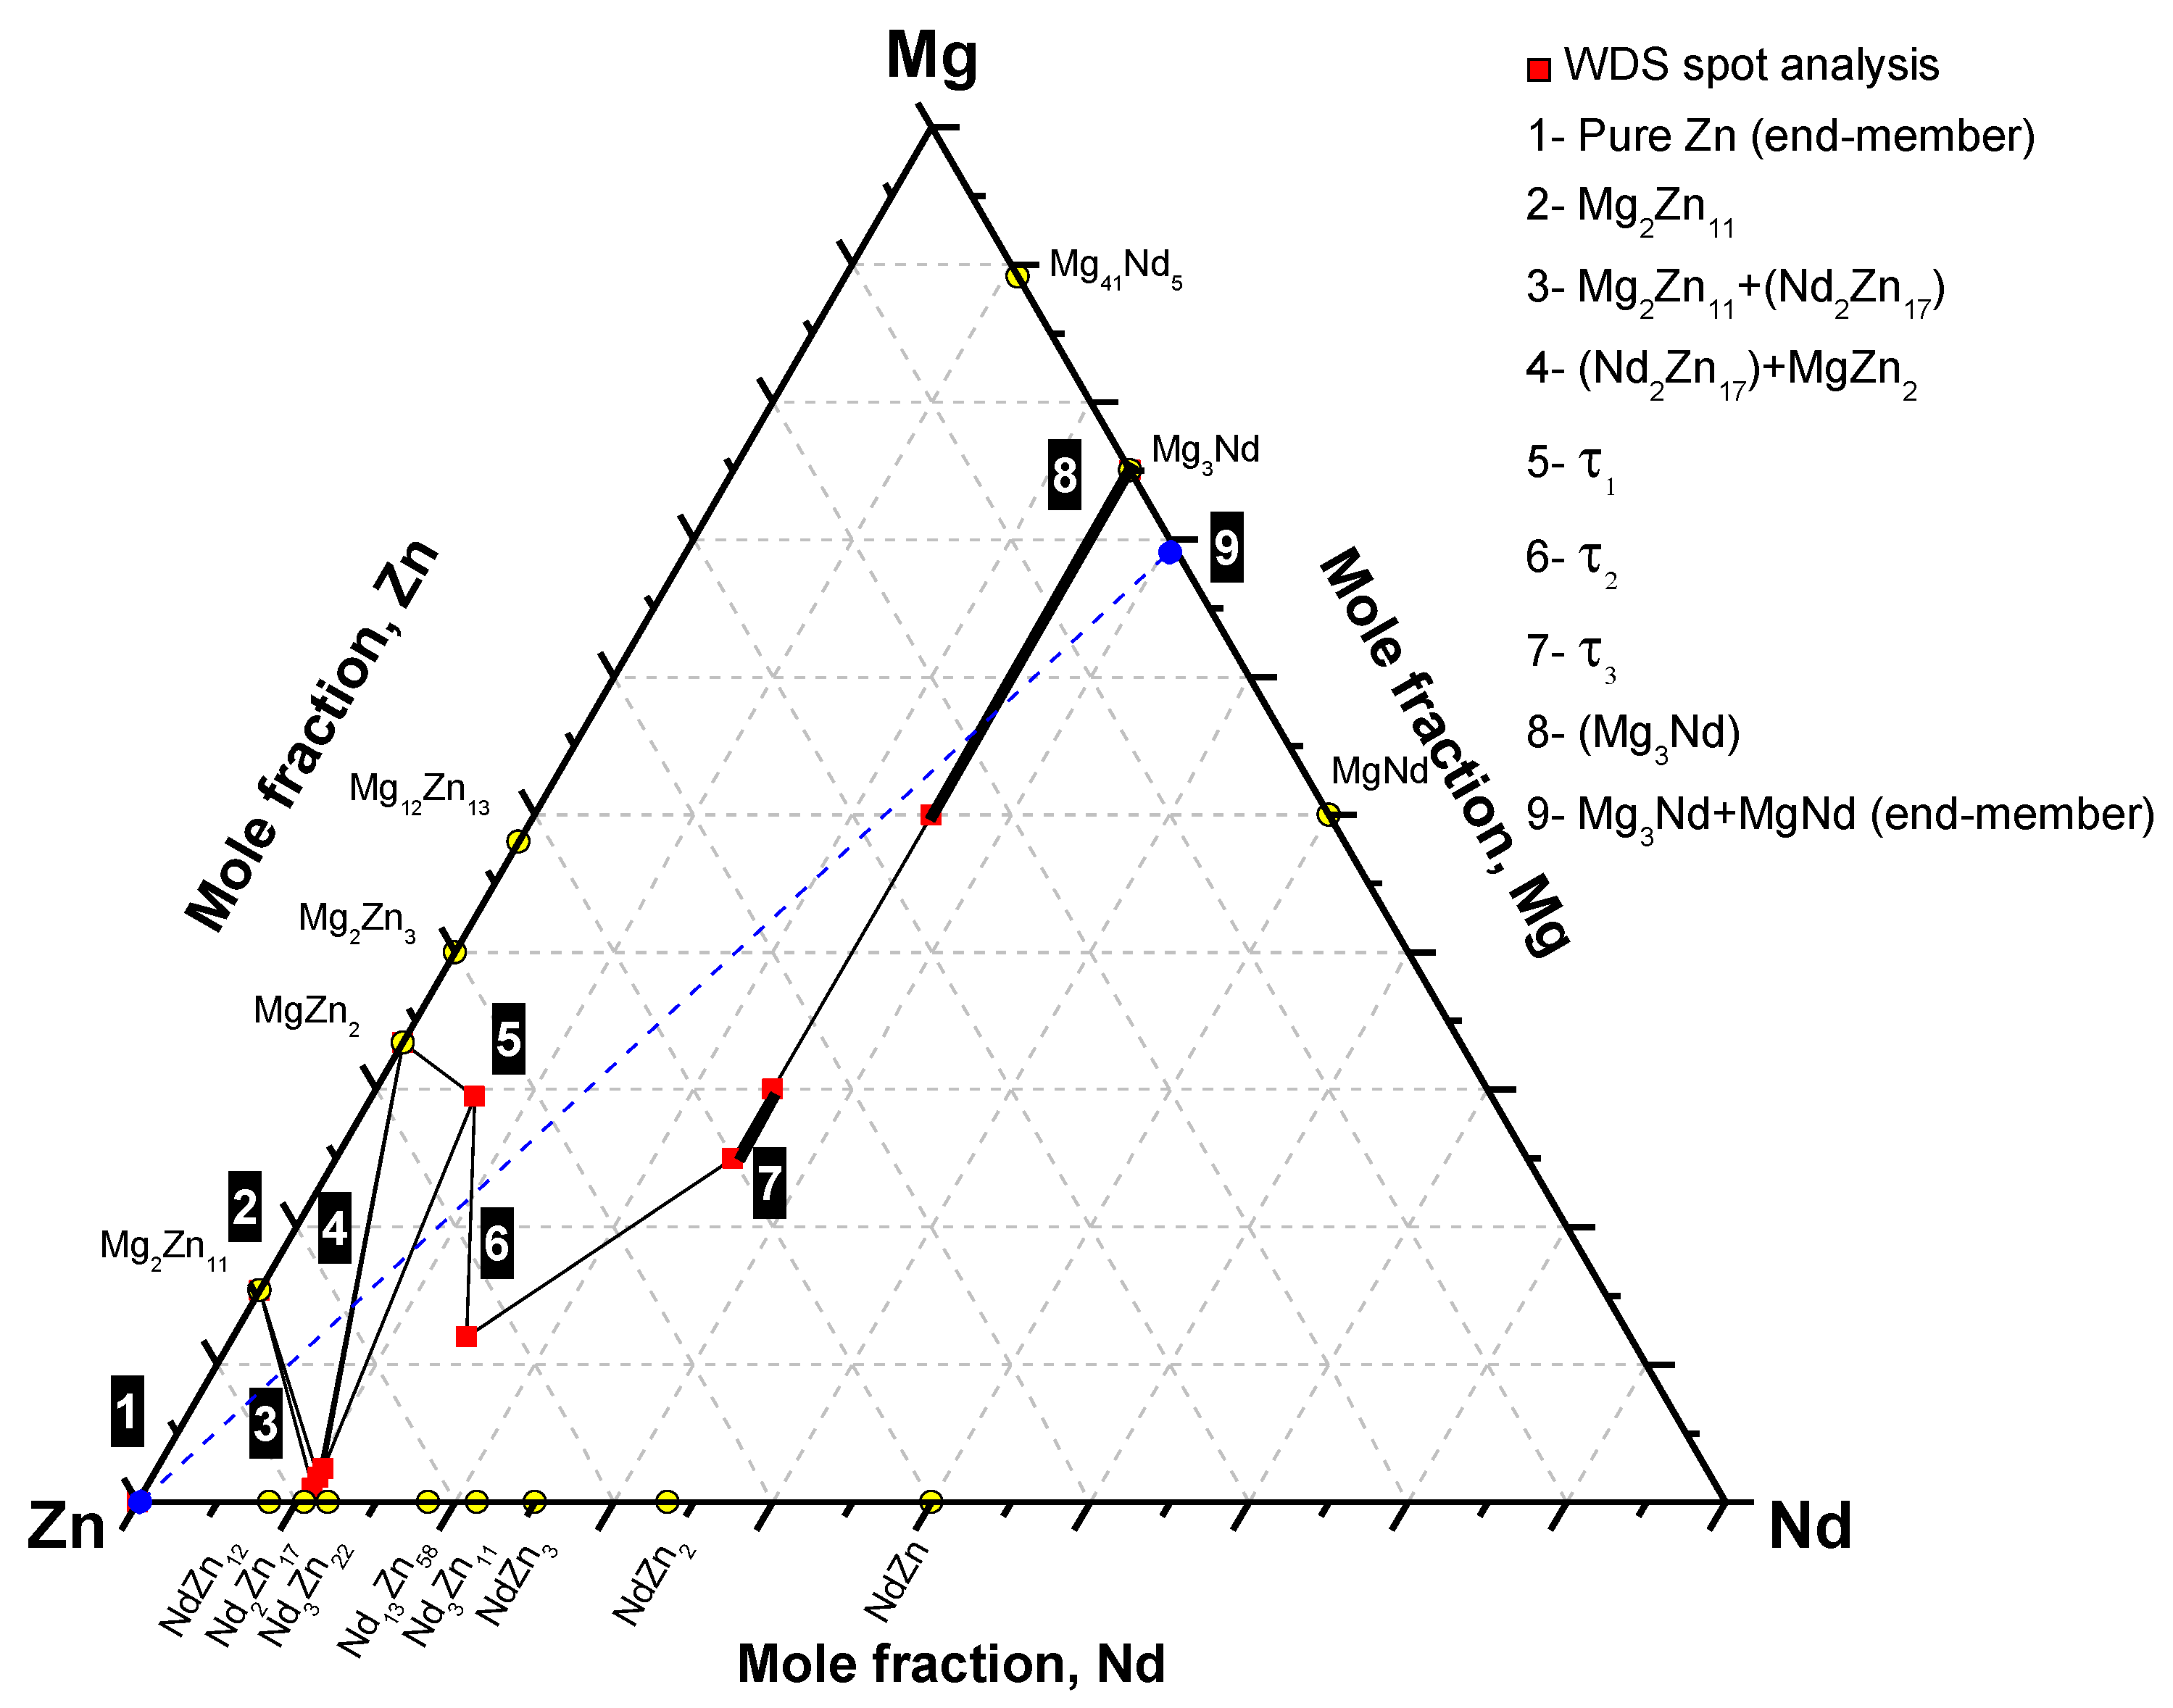
Based on the phase equilibria determined from diffusion couple #1, the phase equilibrium and diffusion path can be depicted as follows: pure Zn (end-member)/Mg
2Zn
11/Mg
2Zn
11+(Nd
2Zn
17)/(Nd
2Zn
17)+MgZn
2+Mg
2Zn
11/(Nd
2Zn
17)+MgZn
2/MgZn
2+(Nd
2Zn
17)+τ
1/MgZn
2+τ
1/τ
2/τ
3/(Mg
3Nd)/Mg
3Nd+MgNd (end-member). Accordingly, the phase relations can be represented graphically, as shown in
Figure 4. The two end-members are connected by a dashed line. The numbered boxes represent the corresponding diffusion zones in
Figure 2 and
Table 1.
Figure 3.
(a) SEM micrograph of diffusion couple #1 near zones #4–8; (b–d) EDS elemental maps for the elements Mg, Nd, and Zn, respectively. Readers are encouraged to see the online version for the colored maps.
Figure 4.
The phase equilibria depicted from diffusion couple #1.
SEM micrographs of diffusion couple #2, annealed at 300 °C for 40 days, are shown in
Figure 5a,b. A long annealing time (40 days) was required, because no successful diffusion occurred when a shorter annealing time (21 days) was used. This can be attributed to the composition of the end-members, because the diffusion process is governed by the affinity of different species to one another. For instance, the affinity of Nd to Zn is reduced in the presence of Mg. This can be attributed to the high diffusivity of Mg in both Zn and Nd [
22]. Evidence can be seen in the thickness of diffusion zones in diffusion couple #1, where very wide diffusion layers of Mg-Zn compounds were formed at 300 °C within 21 days only.
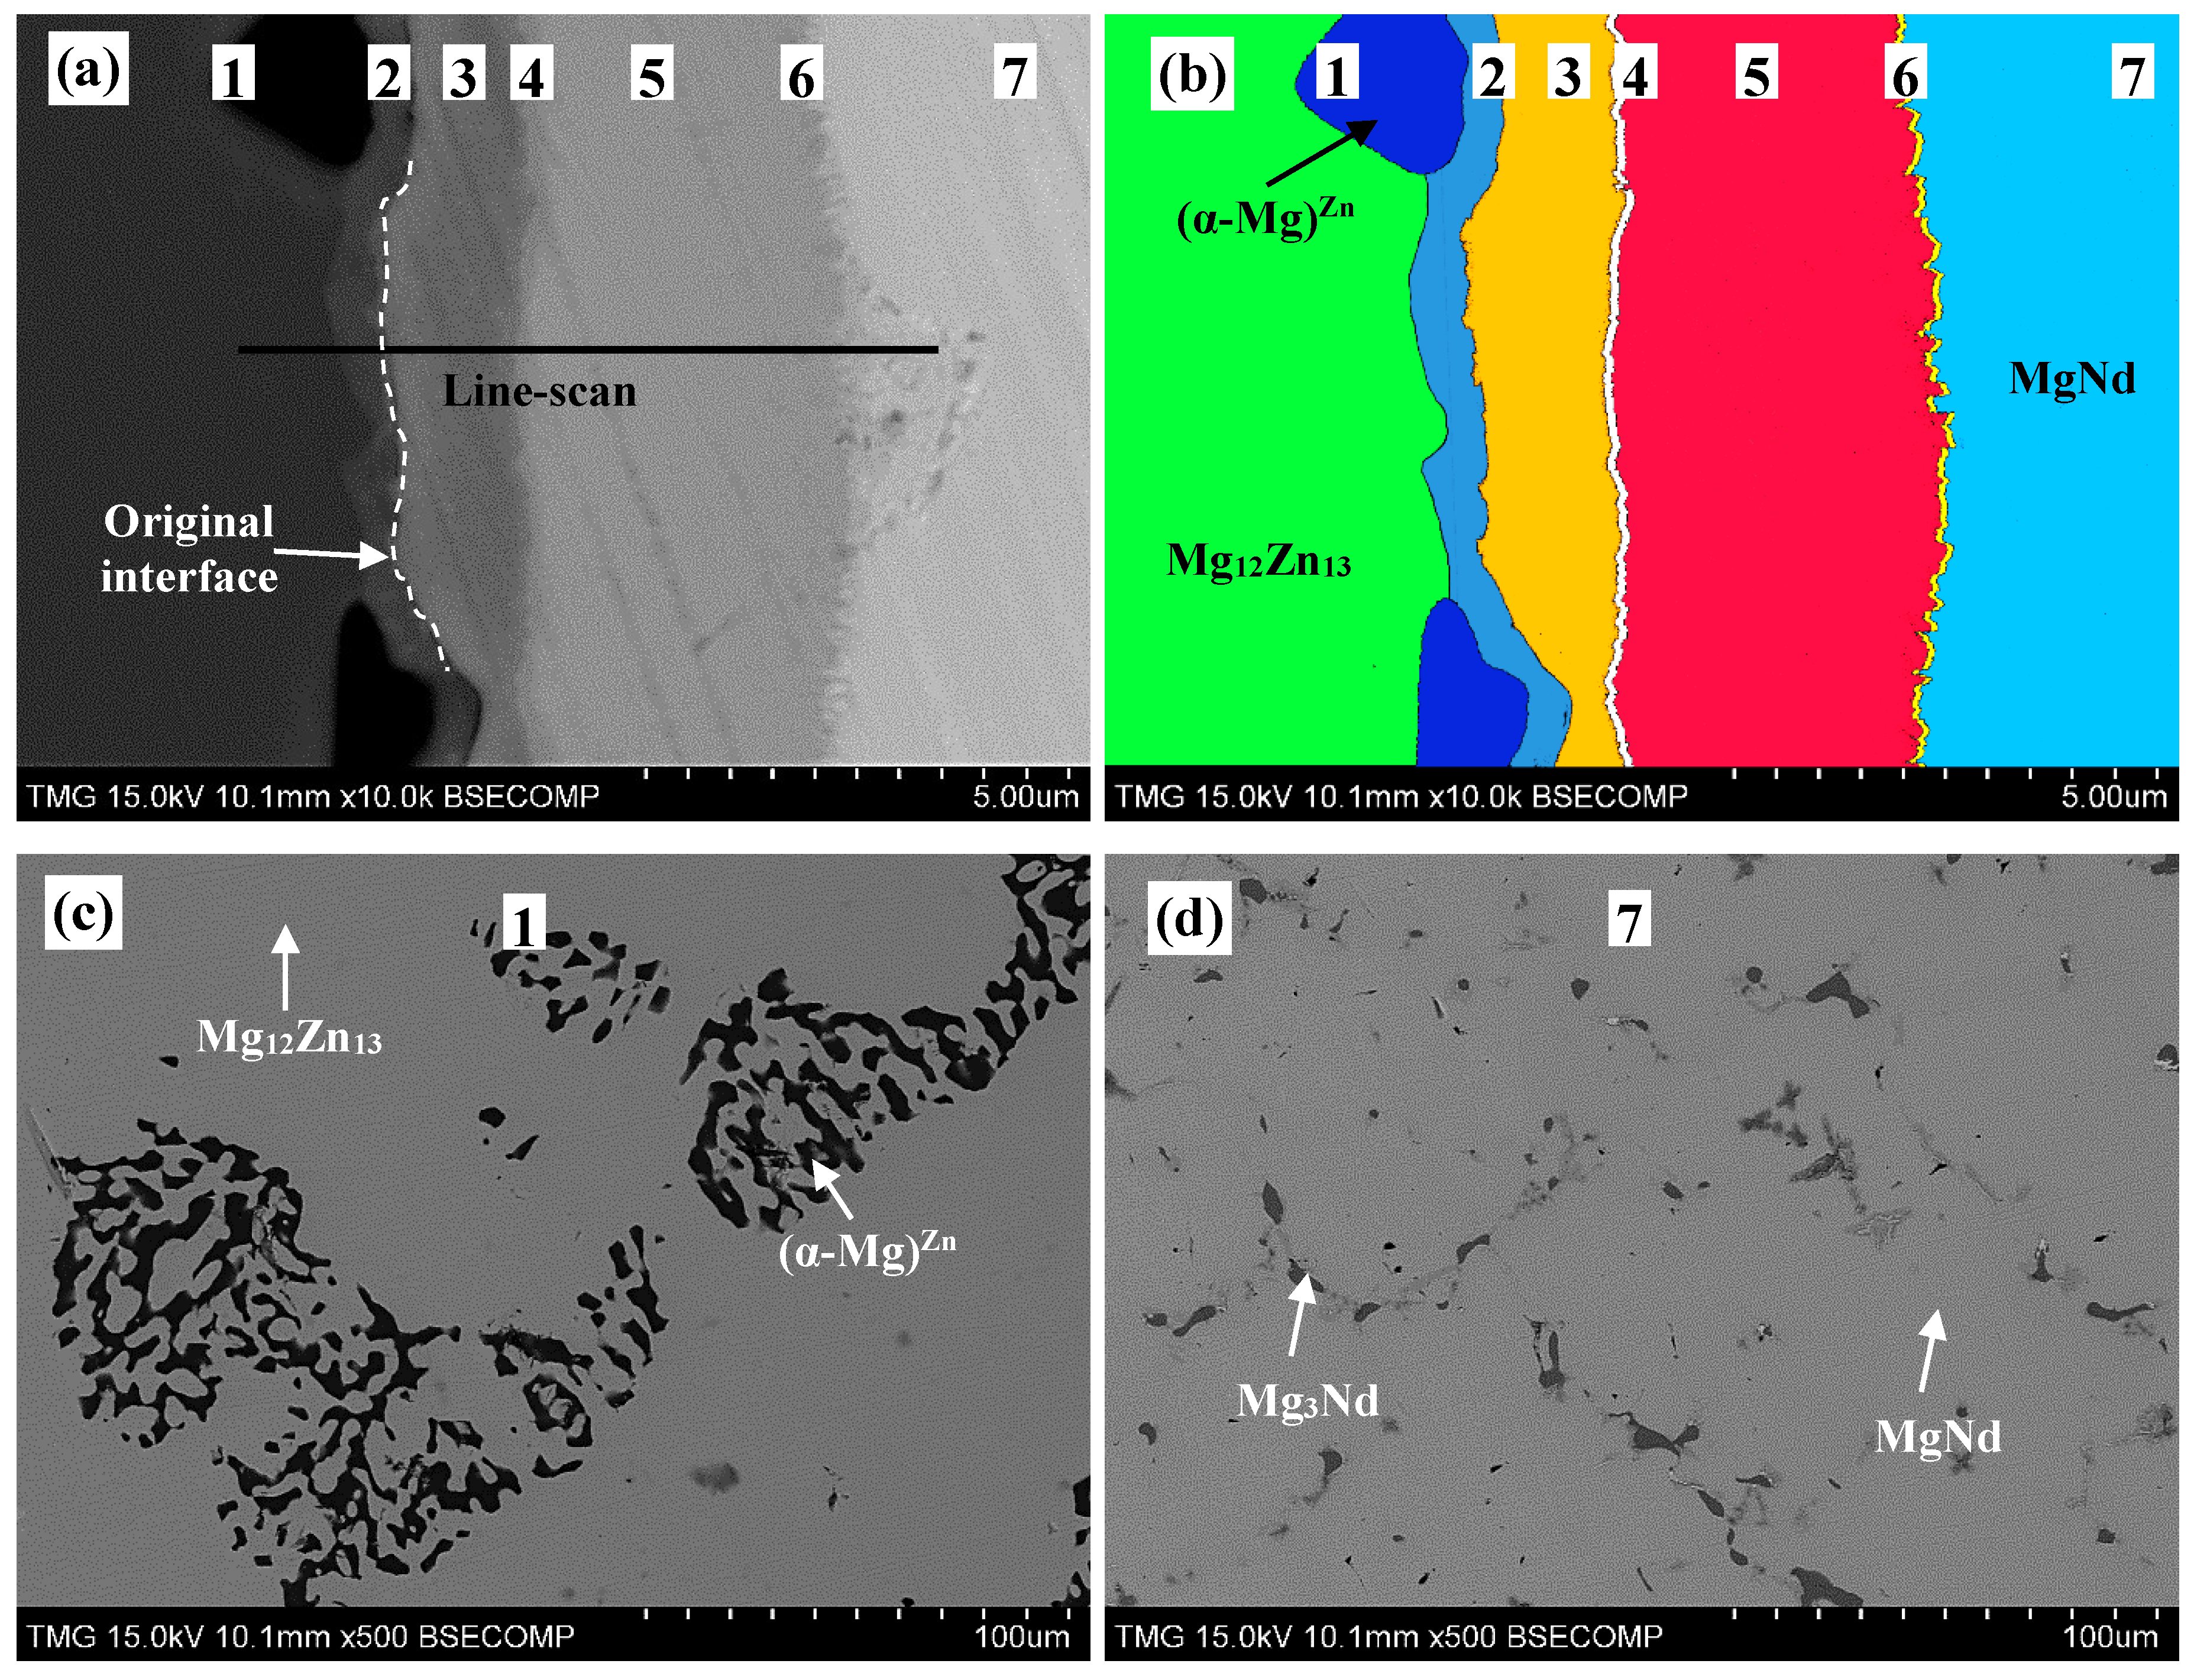
Both end-members of diffusion couple #2 were composed of two-phase binary alloys. The actual composition of the first end-member,
Figure 5c, is 63Mg-37Zn atom % and it contains Mg
12Zn
13 and (α-Mg)
Zn. The actual composition of the second end-member,
Figure 5d, is 55Mg-45Nd atom % and it contains Mg
3Nd and MgNd. WDS spot analysis, summarized in
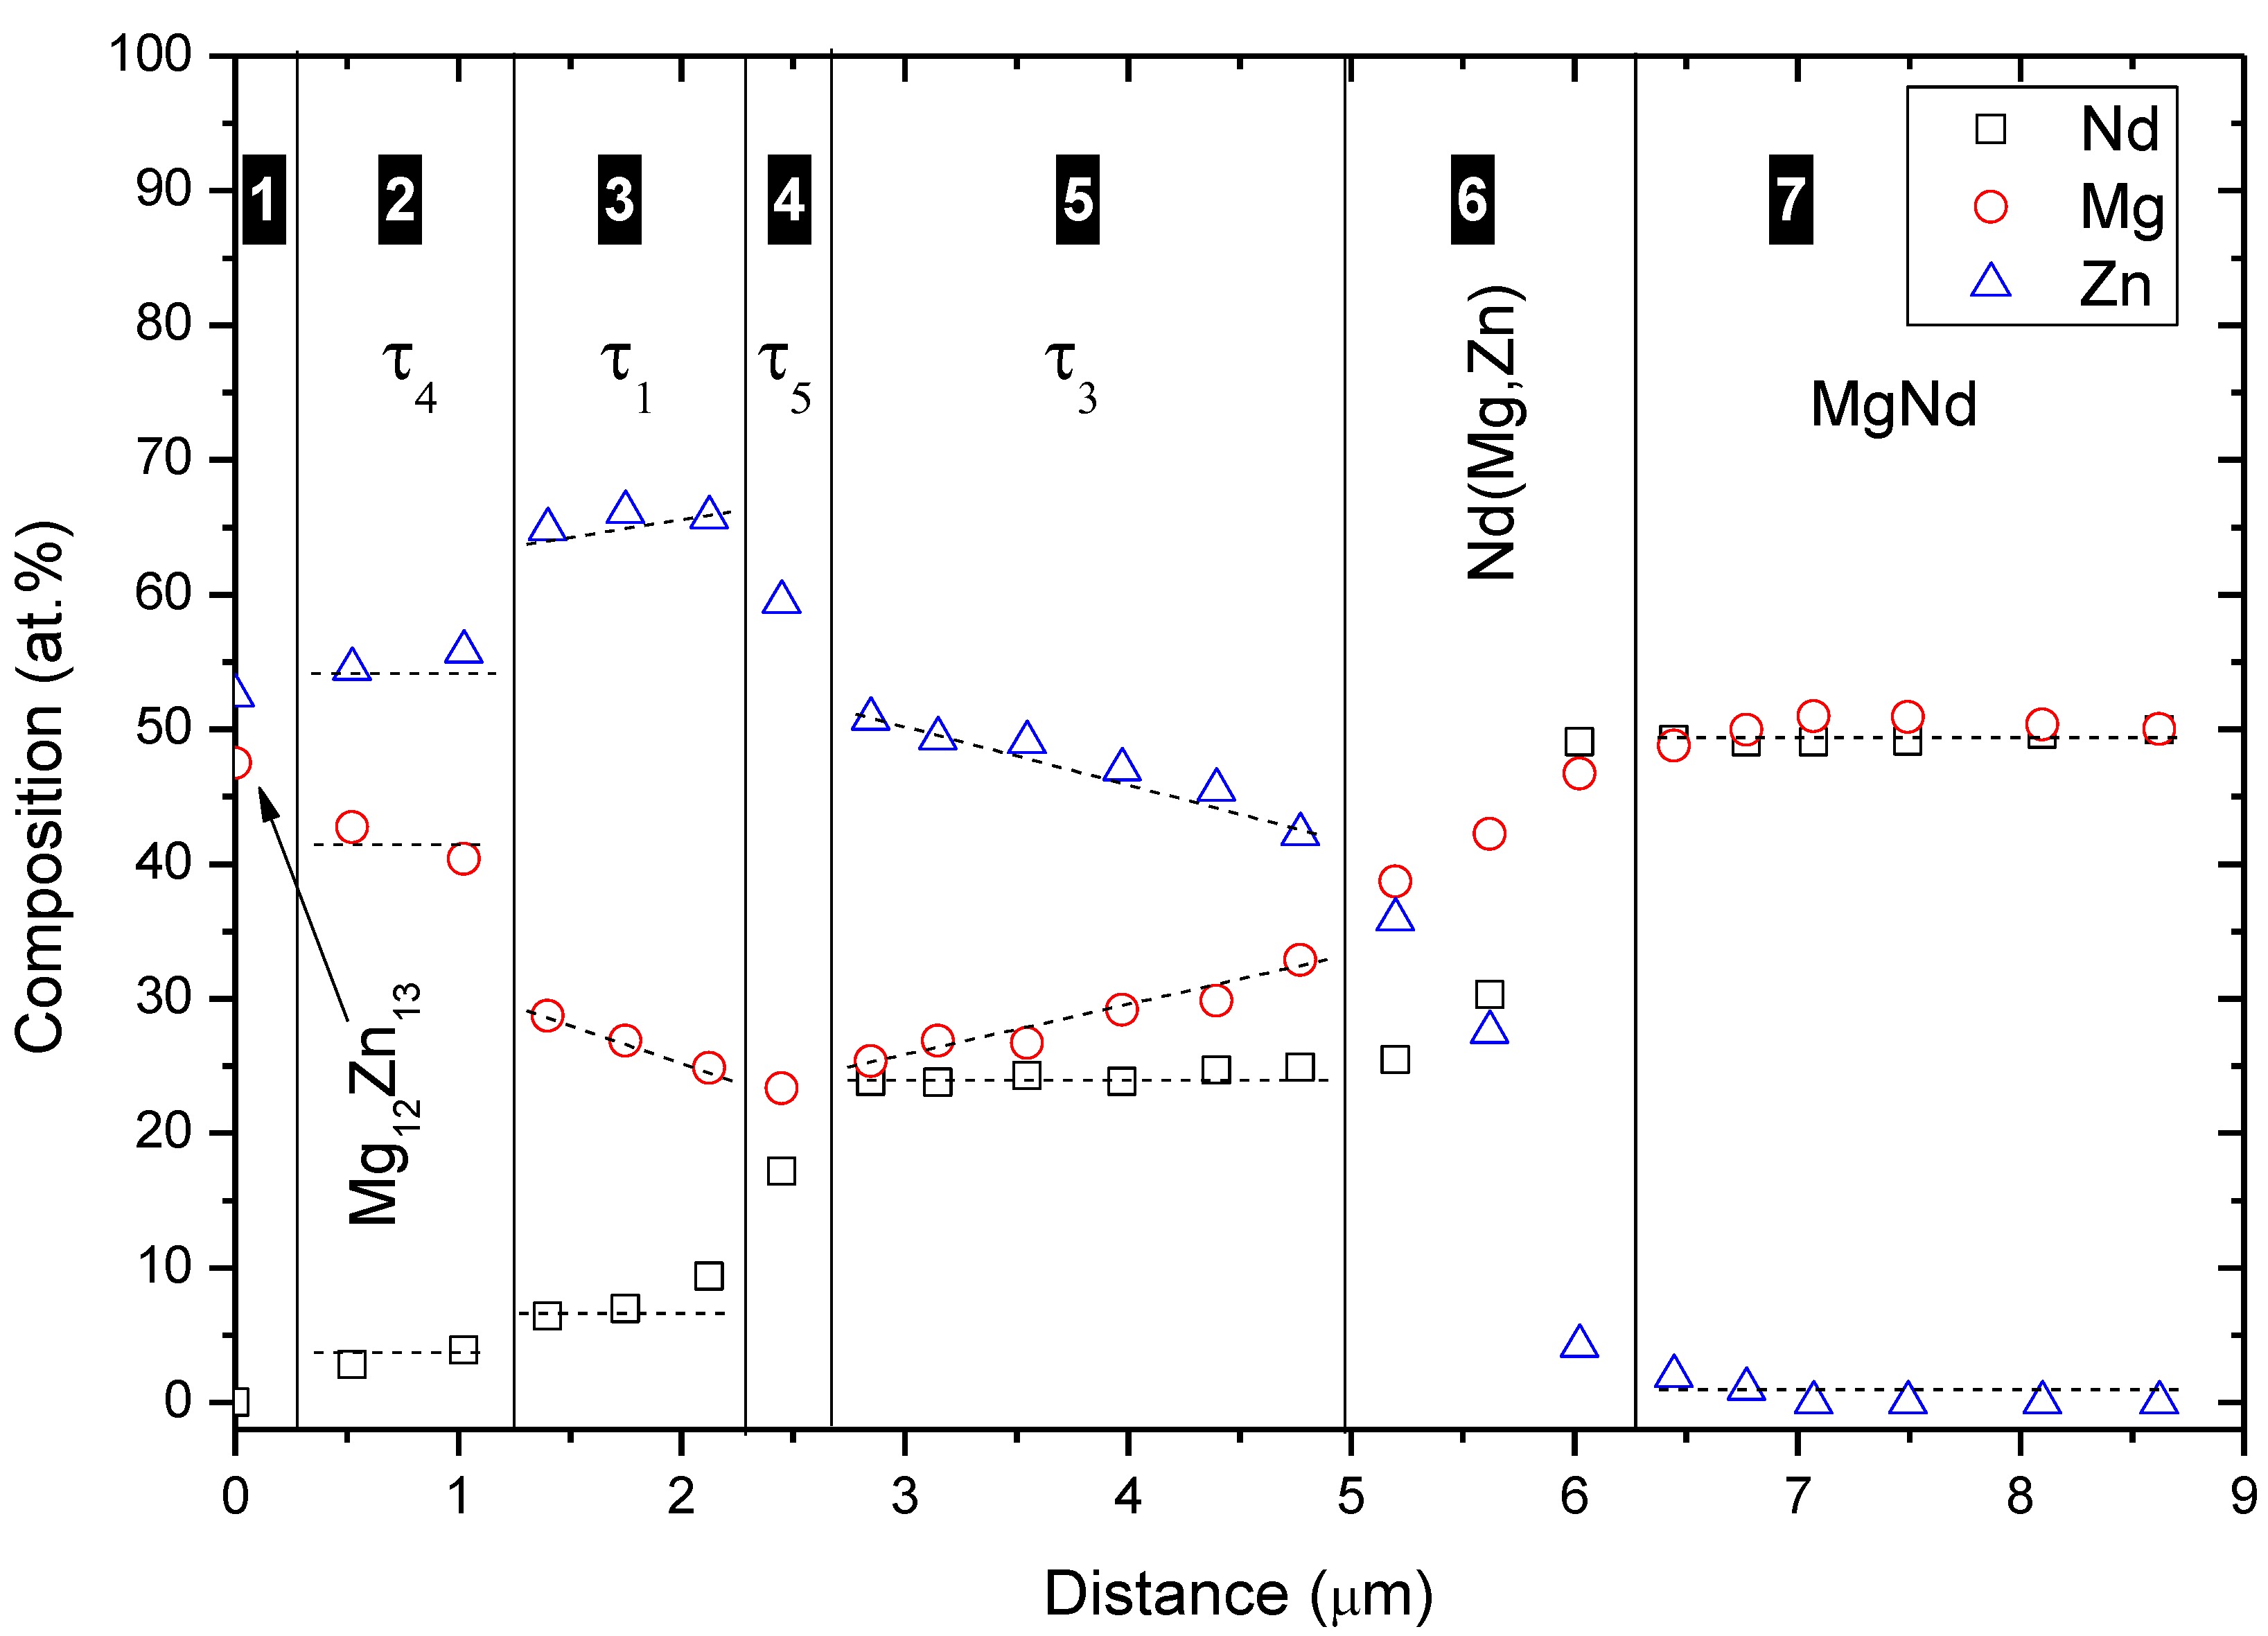
Table 2, was used to determine the composition of the diffusion zones and their constituents. A WDS line-scan, shown in
Figure 6, was performed across the diffusion zones of diffusion couple #2. The original interface location was determined at the junction between zones #2 and #3, as indicated in
Figure 5a,b.
Based on WDS spot analysis and line-scan, seven diffusion zones were determined. Diffusion zones #1 and #7 are the end-members. The SEM micrographs and WDS results revealed that the other diffusion zones are single-phase layers, unlike diffusion couple #1, where most of the layers contained two phases. Zone #2 is the Mg
40Nd
5Zn
55 ternary compound (denoted as τ
4 in this work), that conforms with that reported by [
15,
16]. Diffusion zones #3–6 represent single-phase diffusion layers as follows: τ
1, Mg
2NdZn
4 (denoted as τ
5 in this work), τ
3, and Nd(Mg,Zn), respectively.
Figure 5.
(
a) A SEM micrograph of diffusion couple #2 annealed at 300 °C for 40 days; (
b) the colored version of the same diffusion couple (readers are encouraged to see the online version for the colored image); (
c) is the (α-Mg)Zn+Mg
12Zn
13 end-member; and (
d) is the MgNd+Mg
3Nd end-member. The numbers represent the diffusion zones and correspond to those in
Table 2 and
Figure 7.
From the WDS results in
Figure 6 and
Table 2, τ
1 was recognized as a ternary solid solution extending from 26.6 to 29.5 atom % Mg at 6.5 atom % Nd, τ
3 extended from 24.6 to 38.0 atom % Mg at 25.0 atom % Nd, and Nd(Mg,Zn) extended from 43.3 to 48.1 atom % Mg at 50.0 atom % Nd. Diffusion couples do not provide the solubility limits very accurately. However, they are useful in detecting whether solubility exists or not. The exact solubility limits can be obtained using equilibrated key alloys. Besides, diffusion zones #4 and #6 are relatively thinner than other zones, which can lead to large errors in WDS results. Therefore, the composition of the corresponding compounds must be confirmed by the key alloys method.
The SEM micrograph in
Figure 5a and the colored version in
Figure 5b showed that (α-Mg)
Zn and Mg
12Zn
13 are in equilibrium with τ
4 from one side, and τ
4 is in equilibrium with τ
1 from the other side of the original interface of diffusion couple #2. Based on the phase equilibria determined from diffusion couple #2, the diffusion path can be depicted as follows: α-Mg+Mg
12Nd
13 (end-member)/τ
4/τ
1/τ
5/τ
3/(Mg
3Nd)/Nd(Mg,Zn)/Mg
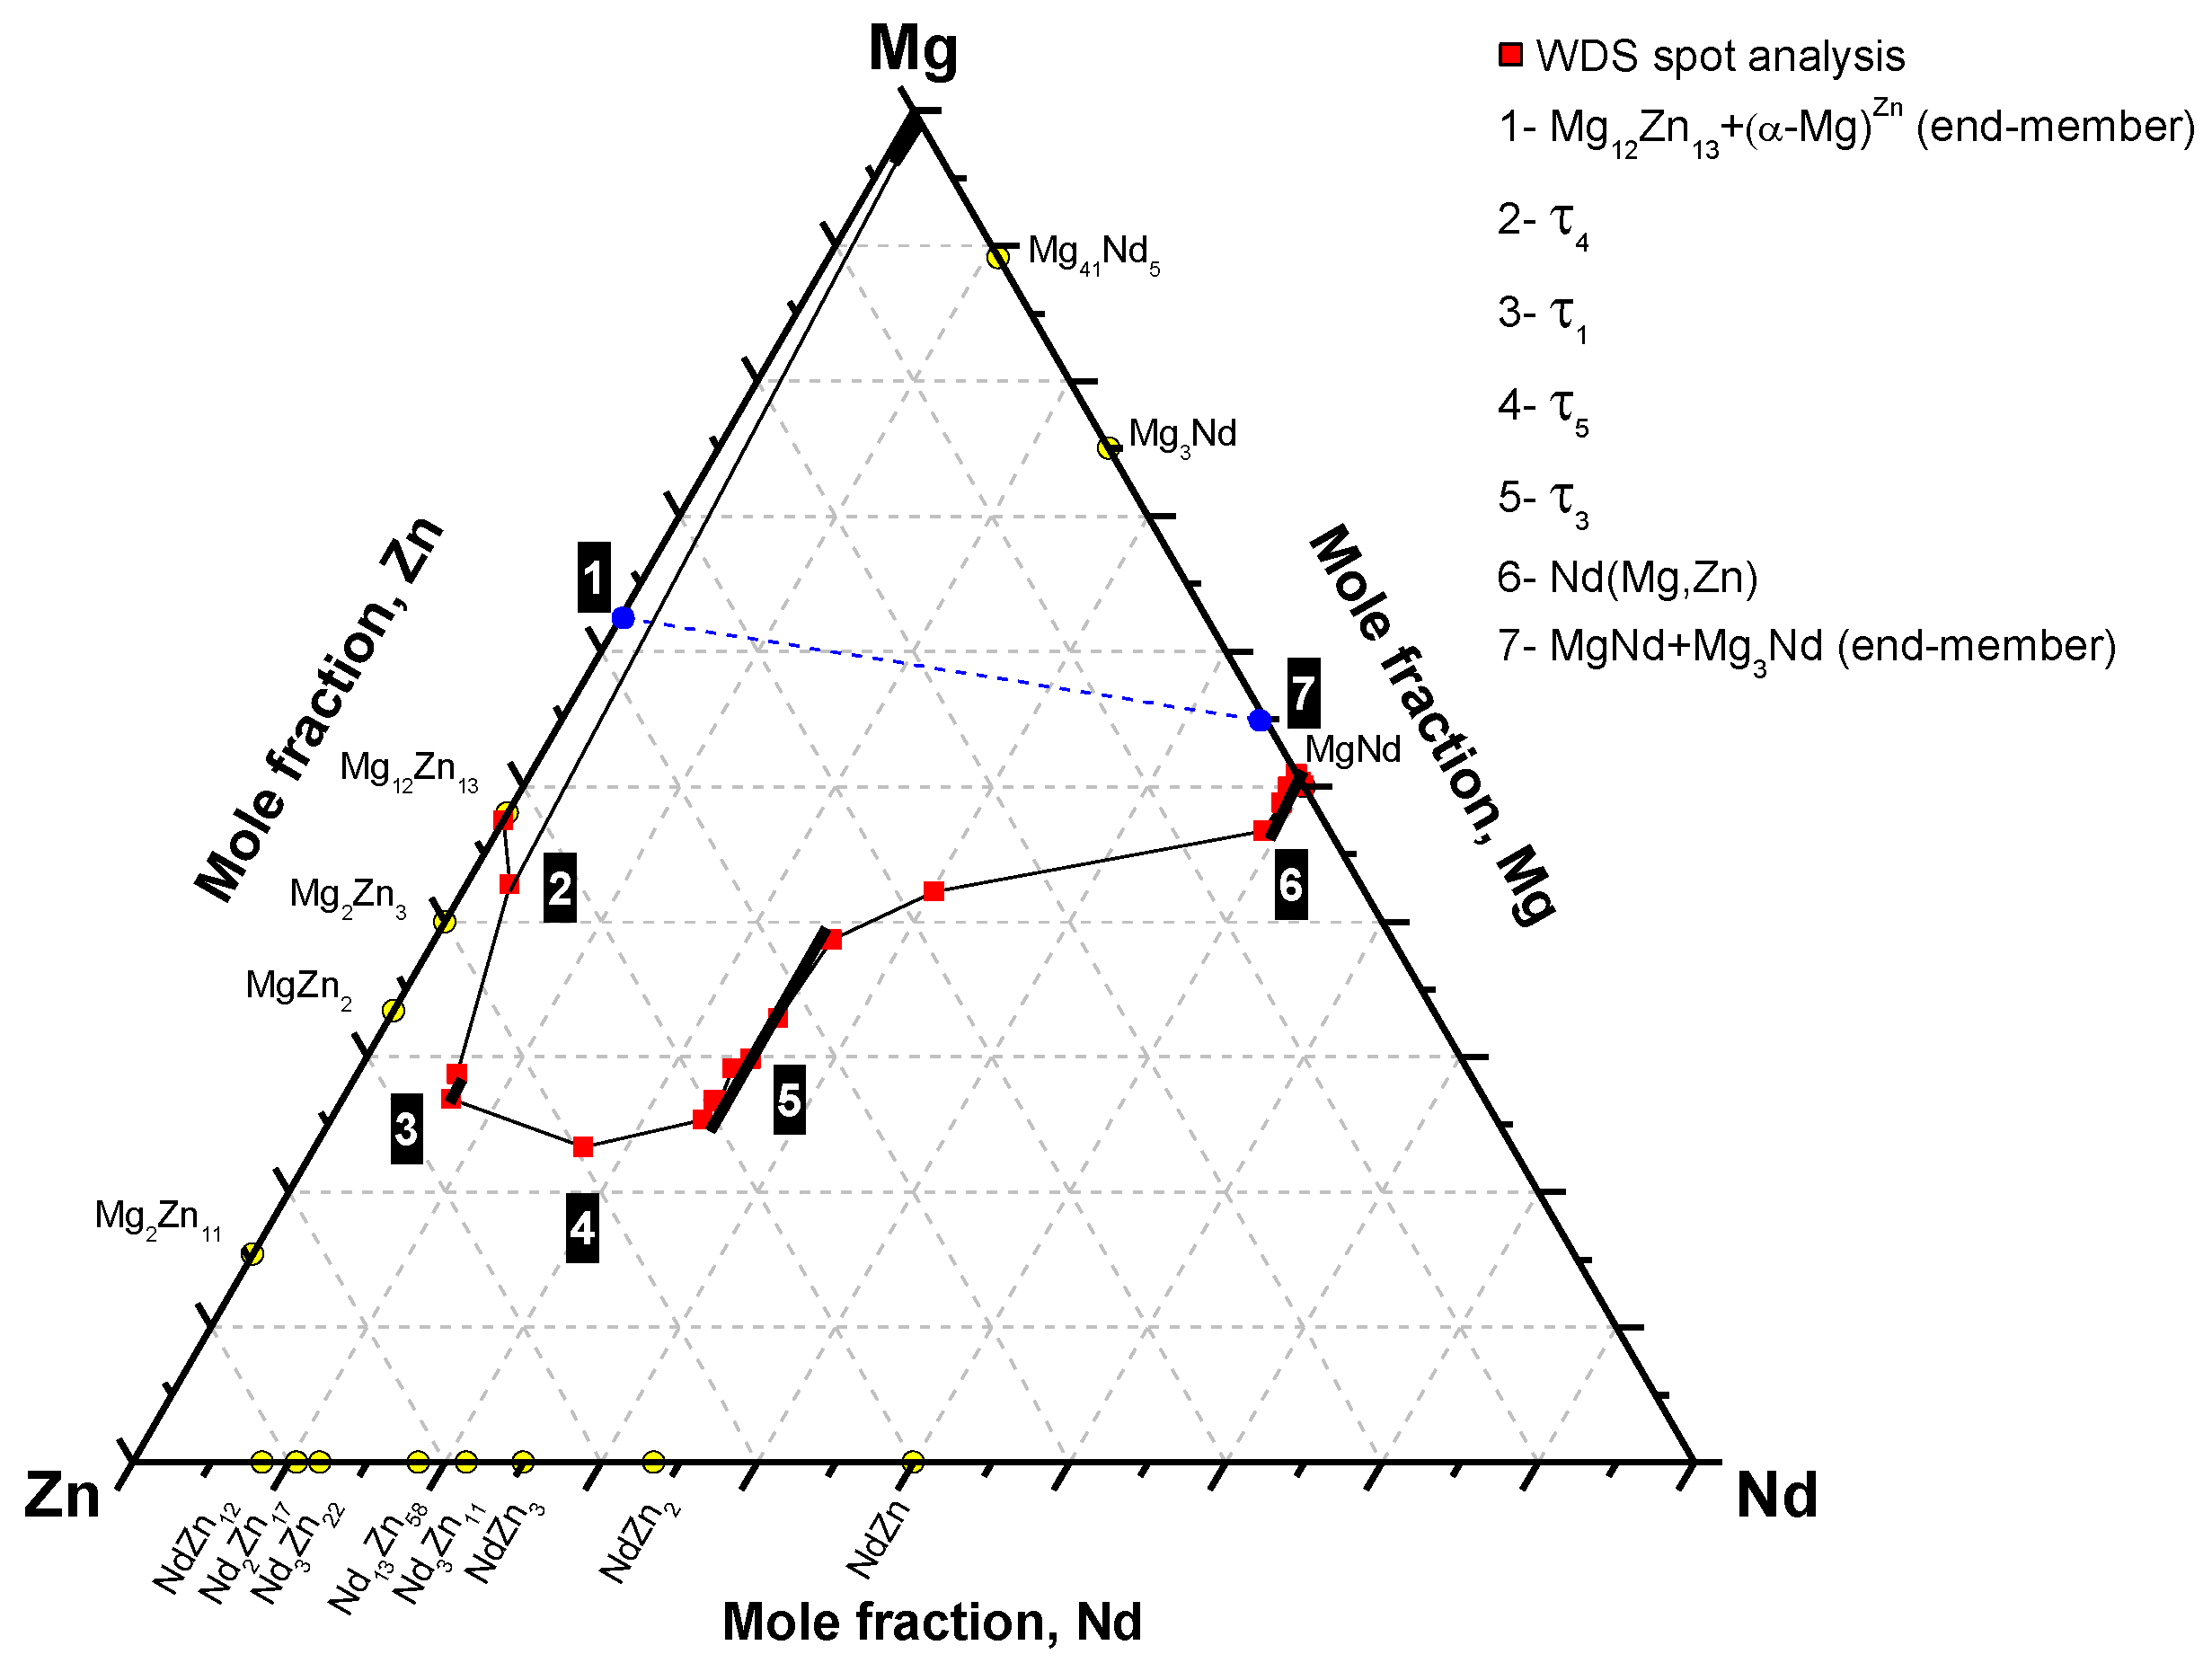
3Nd+MgNd (end-member). Accordingly, the phase relations can be represented graphically as shown in
Figure 7. The two end-members are connected by a dashed line.
Figure 6.
WDS line-scan across diffusion couple #2.
Table 2.
WDS spot analysis of diffusion zones of diffusion couple #2.
| Zone | Description | Composition (atom %) | Corresponding Phase |
|---|
| Mg | Nd | Zn |
|---|
| 1 | Two-phase alloy | 95.6 | - | 4.4 | (α-Mg)Zn |
| (end-member) | 47.3 | - | 52.7 | Mg12Zn13 |
| 2 | Single-phase layer | 45.6 | 1.8 | 52.6 | τ4 |
| 3 | Single-phase layer | 26.6–29.5 | 6.5 | 64.0–66.9 | τ1 |
| 4 | Single-phase layer | 28.8 | 13.1 | 58.1 | τ5 |
| 5 | Single-phase layer | 24.6–38.0 | 25.0 | 37.0–50.4 | τ3 |
| 6 | Single-phase layer | 43.3–48.1 | 50.0 | 1.9–6.7 | Nd(Mg,Zn) |
| 7 | End-member | 50.0 | 50.0 | - | MgNd |
Figure 7 shows that the diffusion path is mainly passing across the lower side of the line connecting the two end-members. However, the mass balance principle must be taken into account in any diffusion couple. To understand the mass balance in this diffusion couple, the diffusion reaction starting from zone #7 to zone #1 can be described as follows. In the case of binary diffusion couples, the growth of diffusion layers is sequential rather than simultaneous [
23]. However, the case could be different for ternary diffusion couples. Due to the presence of more than two species having different mobilities, layers can form simultaneously. For instance, if two of the diffusing species react to form a binary compound, the third element could be simultaneously consumed adjacent to the interface to form another layer. Evidence could be observed through the layers around the original interface, where the less mobile Nd atoms form τ
4 on one side, and the Zn atoms with high mobility form many layers on the other side. More specifically, Nd(Mg,Zn) firstly formed adjacent to MgNd (from zone #7) by dissolving diffusing Zn form zone #1. Simultaneously, Zn depletion from Mg
12Zn
13 produced a layer of τ
4, with low Nd concentration, in zone #2. The concentration of Zn increased gradually with the decrease in Mg and Nd concentrations, starting from zone #6 until the interface between zones #2 and #3, as illustrated in
Figure 6. As a result, the diffusion path, in
Figure 7, was pulled down towards the Zn-rich side. This could be due to the mobility of Zn atoms. In zone #3, there is Zn/Mg exchange at around 6.5 atom % Nd to form τ
1. At the end of zone #3, the diffusion path changed its direction towards the Mg-Zn side.
Figure 7.
The phase equilibria depicted from diffusion couple #2.
Diffusion couple experiments revealed the existence of five ternary compounds in the system at 300 °C. These are: τ1 (Mg7NdZn12), τ2 (Mg2Nd2Zn9), τ3 (MgNdZn2), τ4 (Mg40Nd5Zn55), and τ5 (Mg2NdZn4). The preliminary results obtained from this work showed that (α-Mg)Zn is in equilibrium with Mg12Zn13, τ1, and τ4. Also, the ternary compounds τ1 and τ3 were recognized with extended solid solubility. However, these results must be confirmed using equilibrated key alloys. The combined results of diffusion couples and key alloys improve the accuracy of the obtained phase equilibrium information. In the following section, the results obtained from equilibrated key alloys are discussed.
3.2. Equilibrated Key Alloys
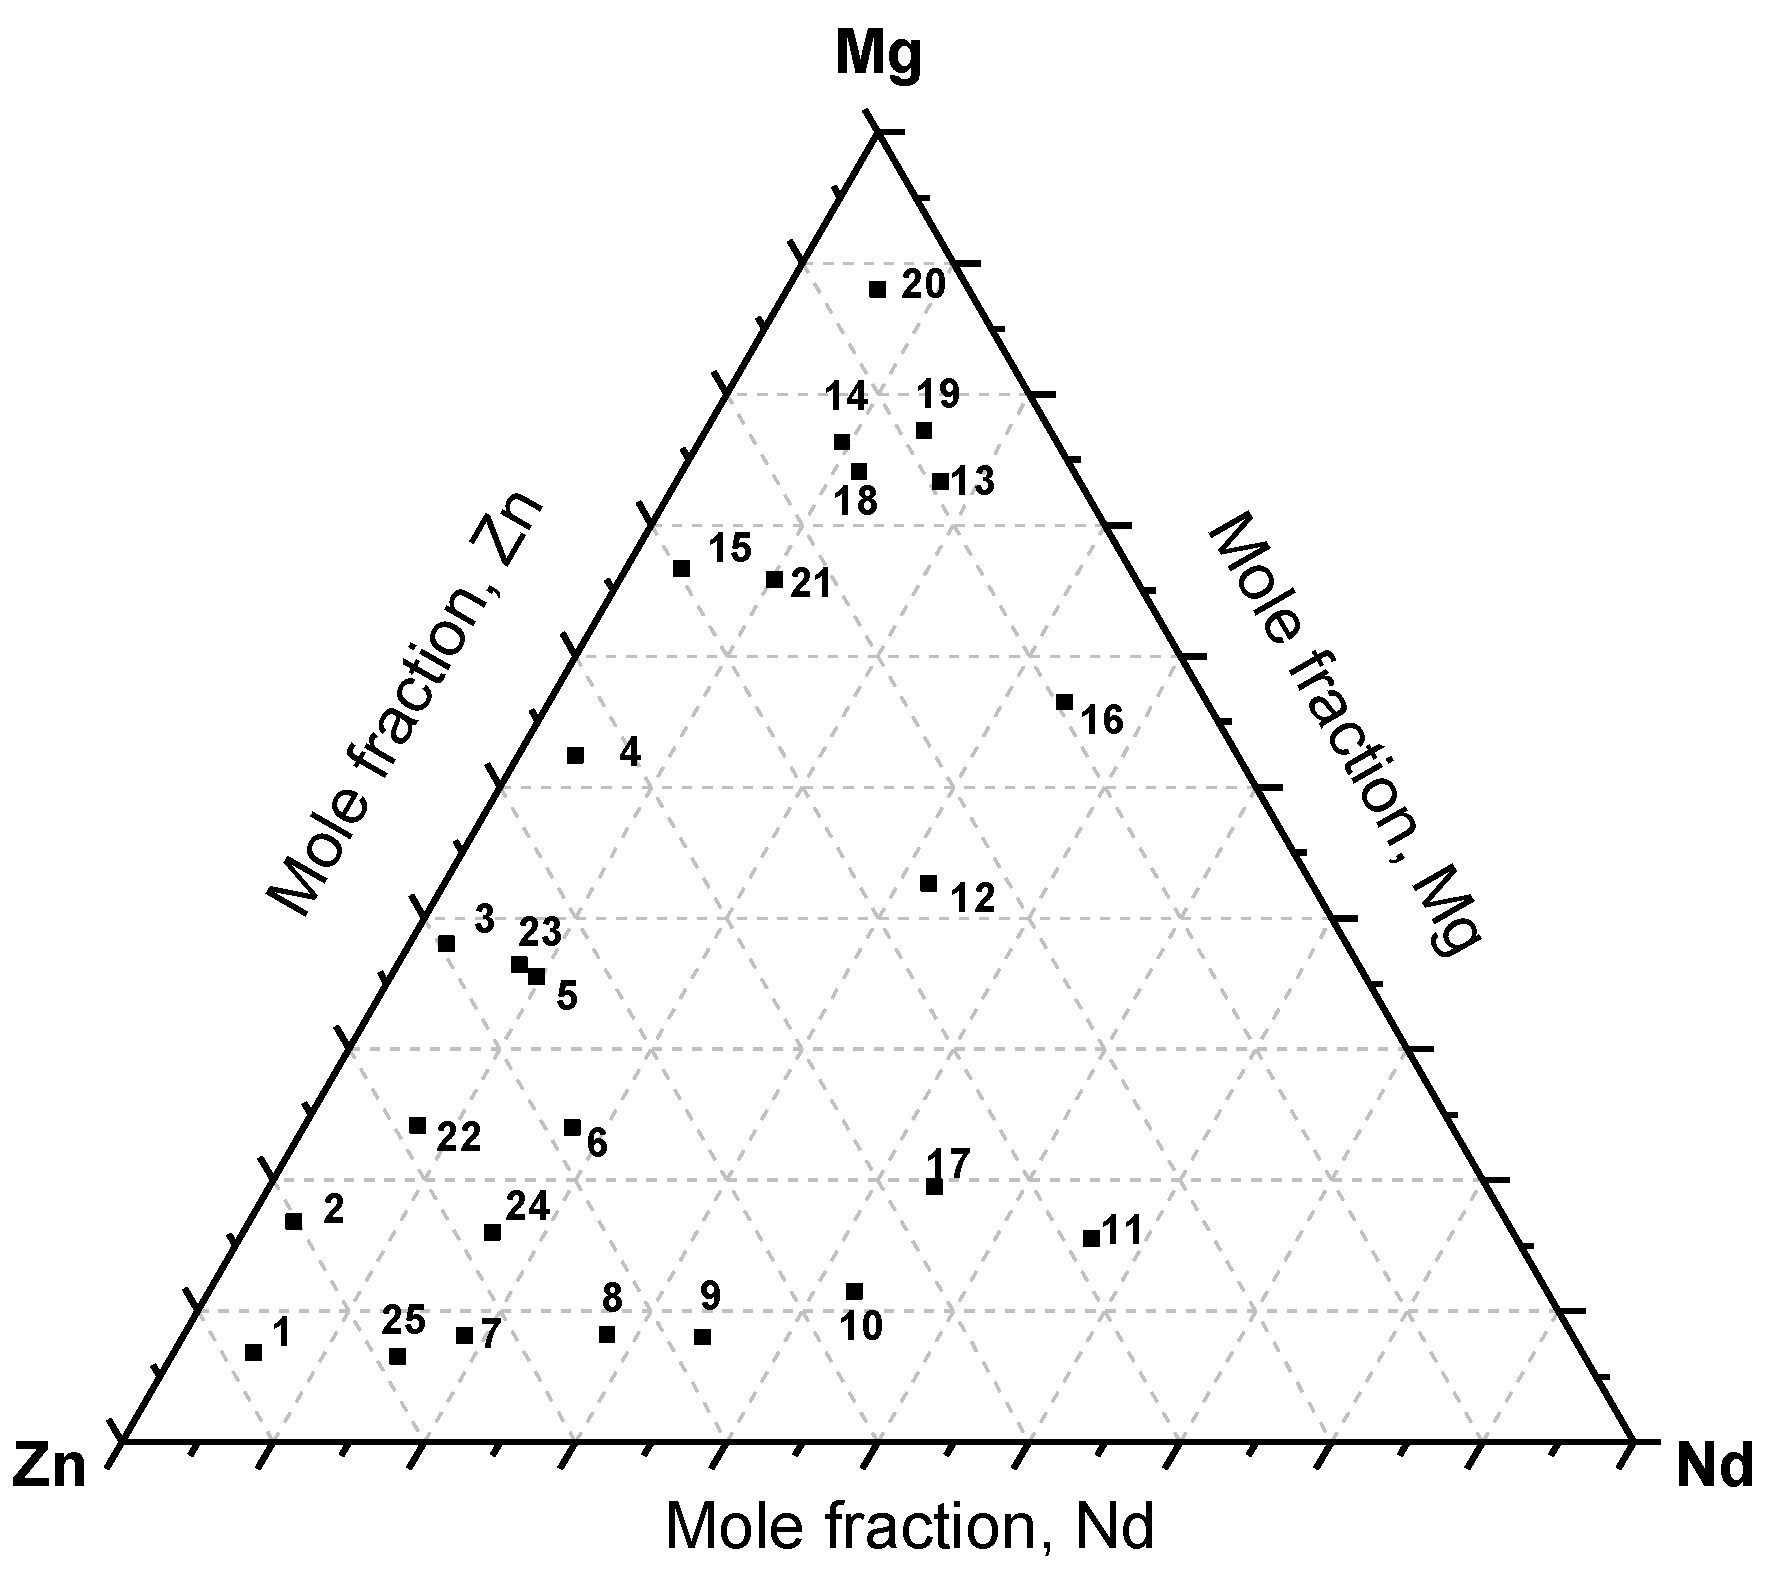
Twenty-five equilibrated key alloys, selected at different compositions of the Mg-Nd-Zn system, were annealed at different time intervals.
Figure 8 shows the distribution of the selected key alloys based on their actual composition obtained by SEM/EDS area analysis.
Because annealing was performed at 300 °C, a long time was required to achieve the equilibrium structure. For some compositions, annealing for about 45 days was not sufficient to homogenize the structure. In such cases, the equilibrium was inferred by comparing the as-cast microstructures and XRD patterns with the annealed ones.
Table 3 and
Table 4 list the experimental results obtained from equilibrated key alloys containing three-phase and two-phase equilibria, respectively. The question marks in the XRD results in
Table 3 denote that the crystal structure of the compound is unknown. The crystal structure of τ
1 was taken from [
14] and of τ
3 and τ
6 was taken from [
1].
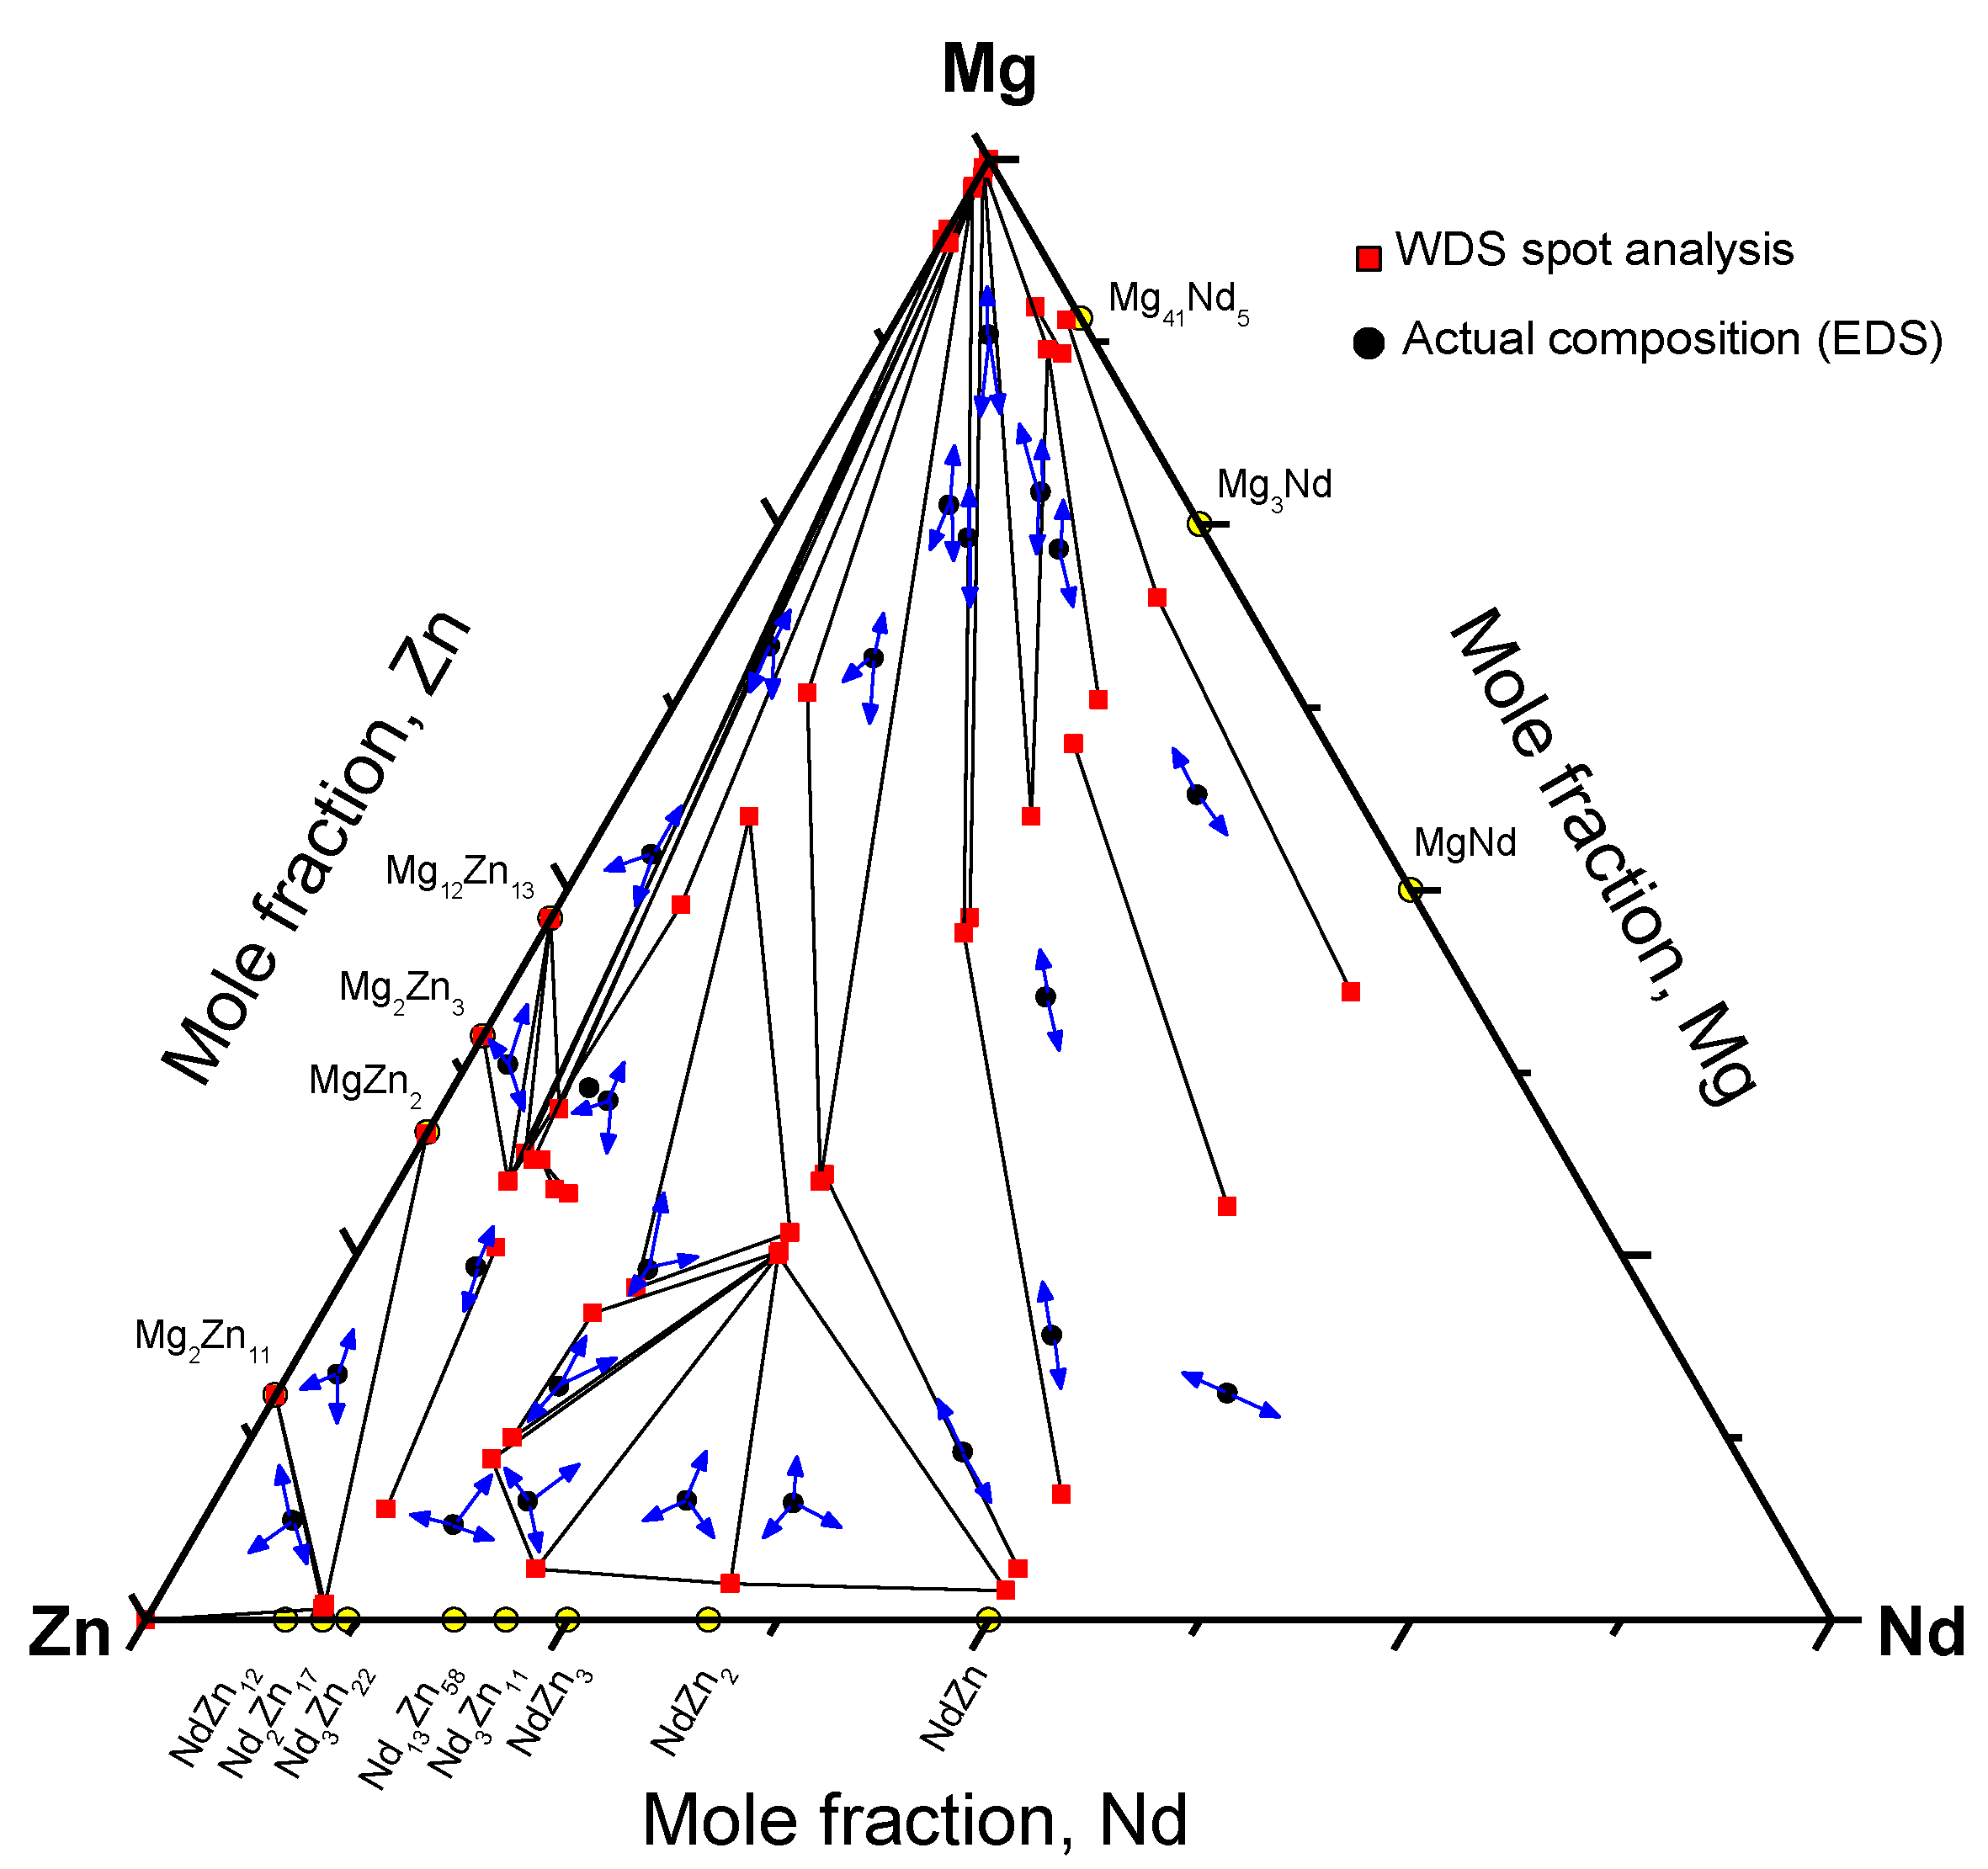
Figure 8.
The actual composition of the Mg-Nd-Zn key alloys.
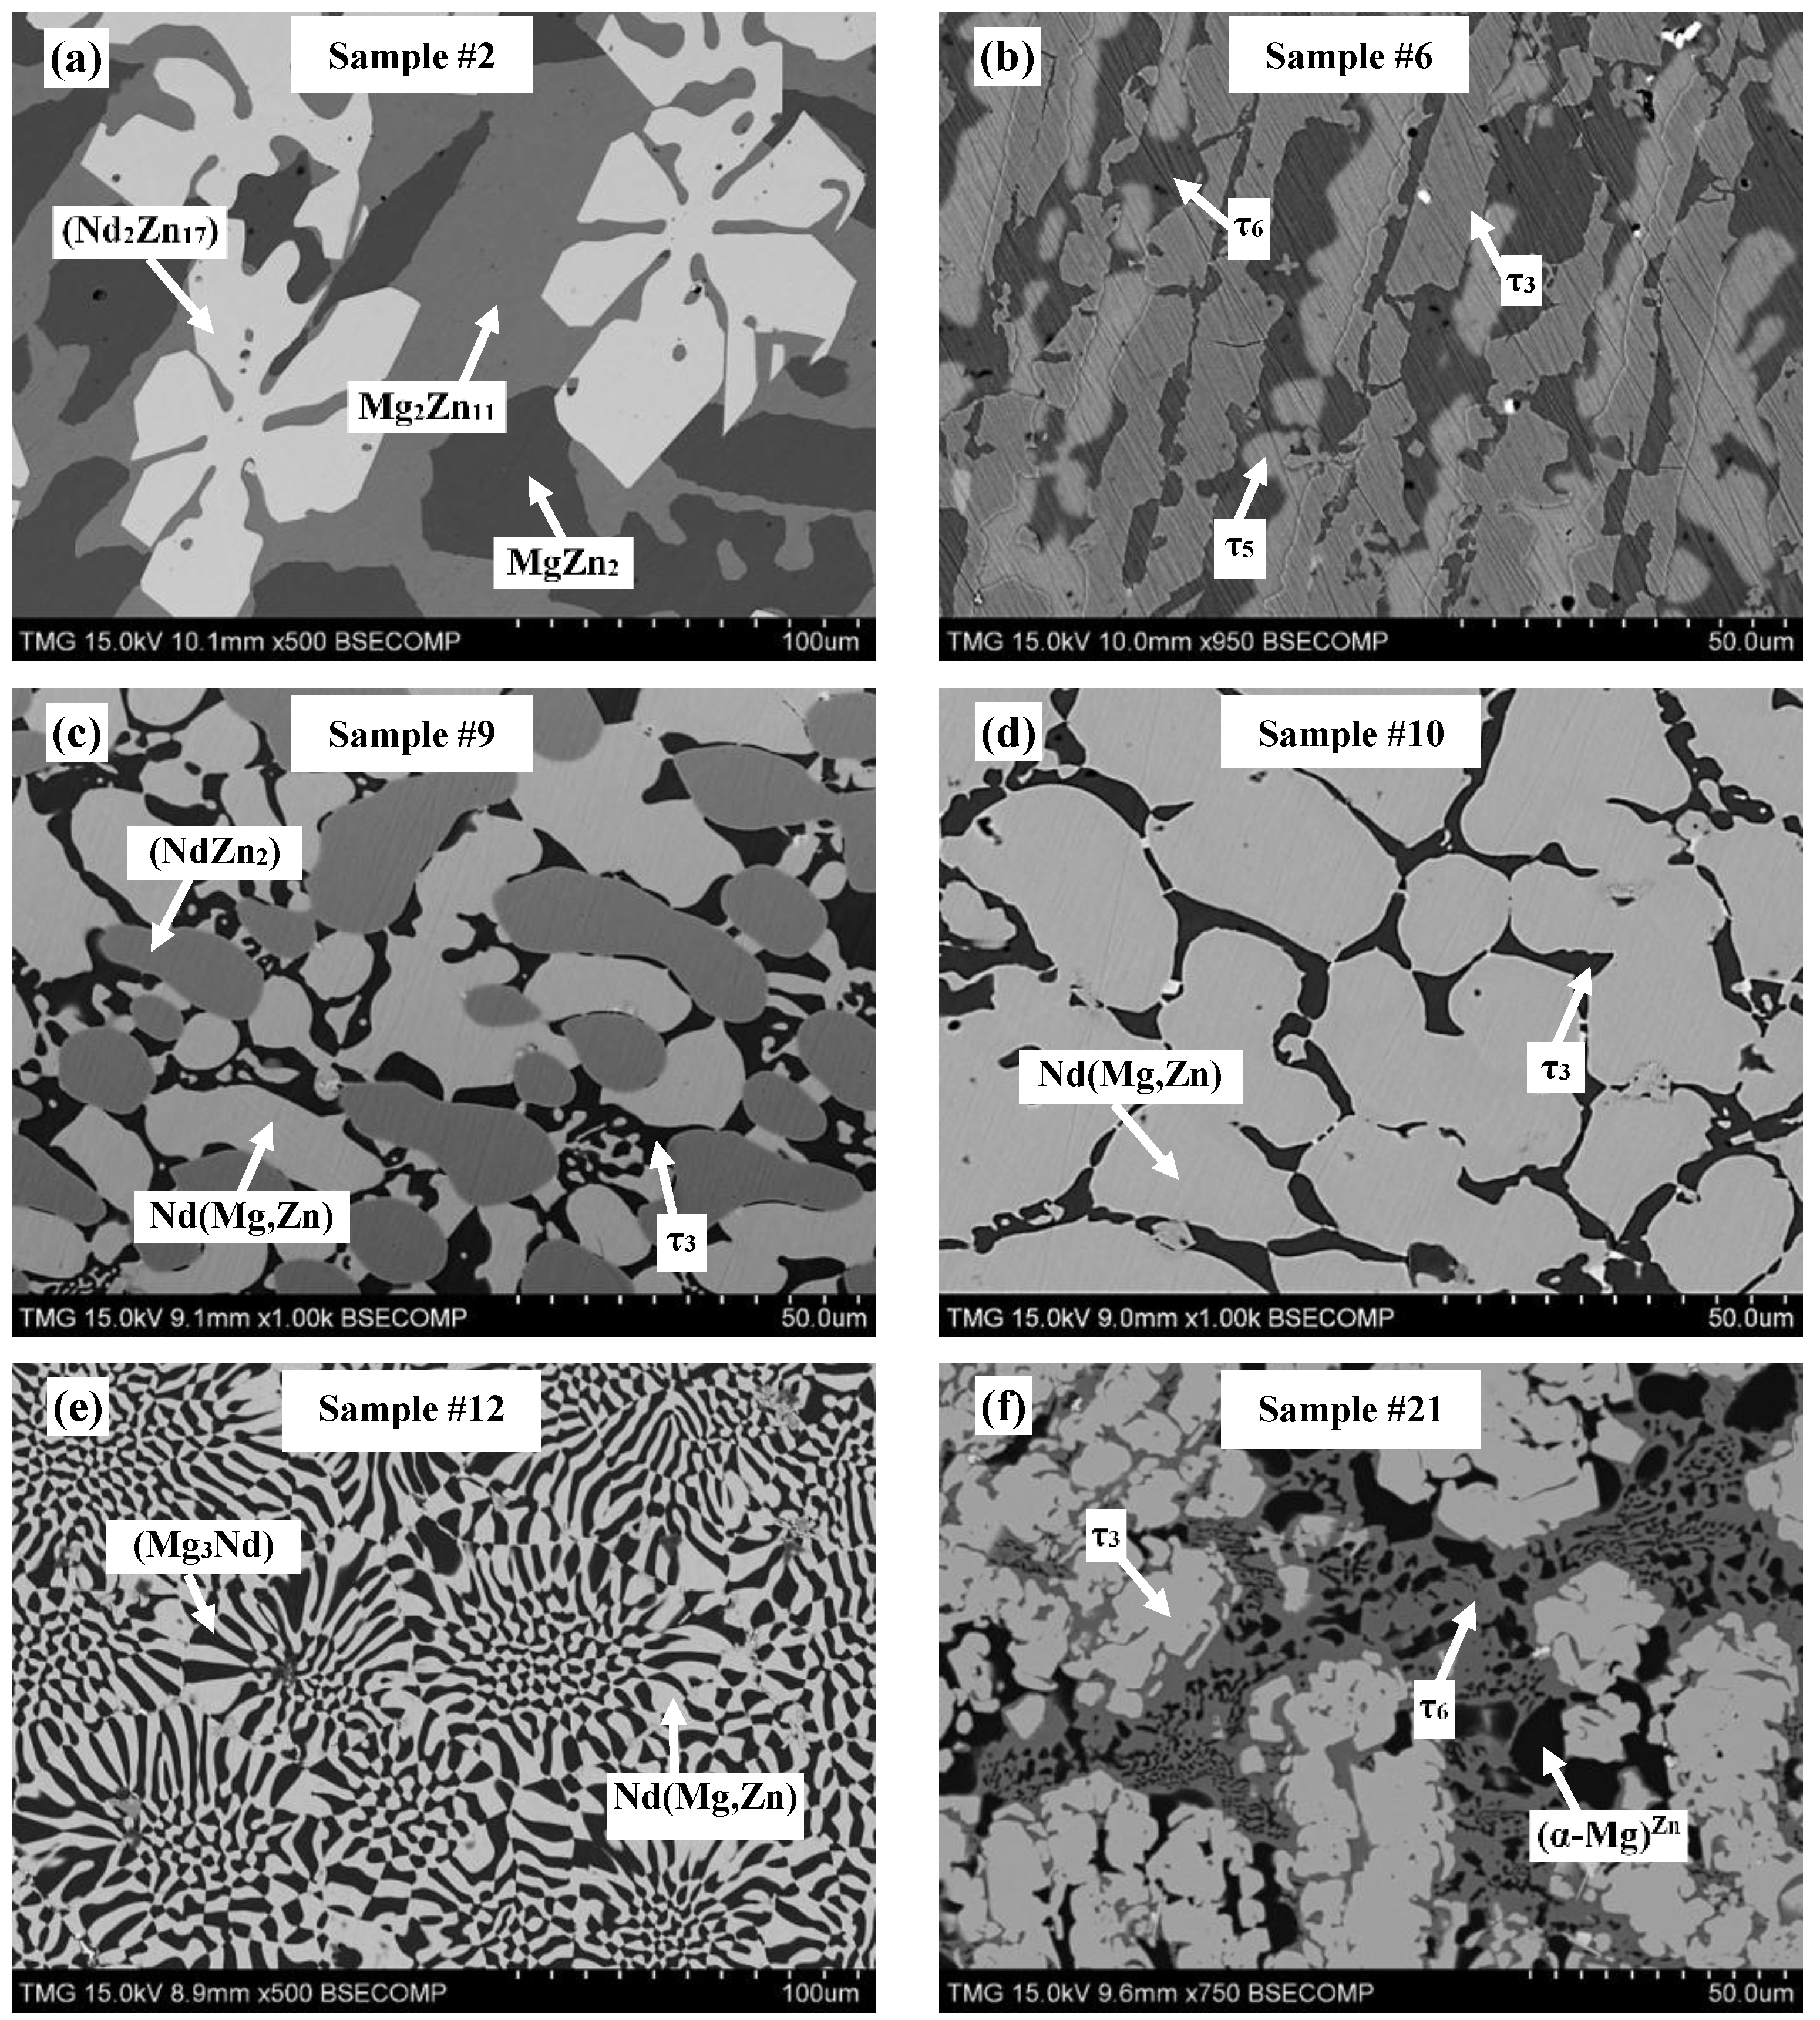
Figure 9.
SEM micrographs of alloys annealed at 300 °C selected from different regions in the Mg-Nd-Zn system: (a) sample #2, (b) sample #6, (c) sample #9, (d) sample #10, (e) sample #12, and (f) sample #21.
Table 3.
Actual composition of key alloys containing three-phase equilibria and their experimental results.
| Sample | Actual alloy Composition (atom %) | Phase Identification XRD | Phase Composition (atom %) | Corresponding Phase |
|---|
| Mg | Nd | Zn | Mg | Nd | Zn |
|---|
| 1 | 6.8 | 5.3 | 87.9 | Zn | - | - | 100.0 | Zn |
| Mg2Zn11 | 15.4 | - | 84.6 | Mg2Zn11 |
| (Nd2Zn17) | <1.0 | 10.1 | 89.1 | (Nd2Zn17) |
| 2 | 16.8 | 3 | 80.2 | Mg2Zn11 | 15.4 | - | 84.6 | Mg2Zn11 |
| MgZn2 | 33.3 | - | 66.7 | MgZn2 |
| (Nd2Zn17) | 1.1 | 10.1 | 88.9 | (Nd2Zn17) |
| 3 | 38.0 | 2.5 | 59.5 | Mg12Zn13 | 48.0 | - | 58.0 | Mg12Zn13 |
| Mg2Zn3 | 40.0 | - | 60.0 | Mg2Zn3 |
| τ1 | 32.0 | 7.0 | 61.0 | τ1 |
| 4 | 52.4 | 3.8 | 43.8 | (α-Mg)Zn | 95.2 | - | 4.8 | (α-Mg)Zn |
| 15 | 66.7 | 3.7 | 29.6 | Mg12Zn13 | 48.1 | - | 51.9 | Mg12Zn13 |
| ? | 34.9 | 7.0 | 58.1 | τ1 |
| 5 | 35.5 | 9.7 | 54.8 | (α-Mg)Zn | 95.3 | - | 4.7 | (α-Mg)Zn |
| τ6 | 49.0 | 7.2 | 43.8 | τ6 |
| τ1 | 30.0 | 6.5 | 63.5 | τ1 |
| 6 | 24 | 17.8 | 58.2 | τ6 | 54.8 | 8.3 | 36.9 | τ6 |
| ? | 22.7 | 17.6 | 59.7 | τ5 |
| τ3 | 26.5 | 24.9 | 48.6 | τ3 |
| 7 | 8.12 | 18.6 | 73.28 | (Nd3Zn11) | 3.5 | 21.4 | 75.1 | (Nd3Zn11) |
| τ3 | 25.1 | 25.0 | 49.9 | τ3 |
| ? | 11.0 | 15.0 | 74.0 | τ2 |
| 8 | 8.2 | 28 | 63.8 | (Nd3Zn11) | 3.5 | 21.4 | 75.1 | (Nd3Zn11) |
| (NdZn2) | 2.5 | 33.4 | 64.1 | (NdZn2) |
| τ3 | 26.2 | 25.0 | 48.8 | τ3 |
| 9 | 8.0 | 34.4 | 57.6 | (NdZn2) | 2.5 | 33.4 | 64.1 | (NdZn2) |
| Nd(Mg,Zn) | 2.0 | 50.0 | 48.0 | Nd(Mg,Zn) |
| τ3 | 28.3 | 25.0 | 46.7 | τ3 |
| 20 | 88.0 | 6.0 | 6.0 | (α-Mg)Zn | 99.4 | - | <1.0 | (α-Mg)Zn |
| (Mg41Nd5) | 87.0 | 10.0 | 3.0 | (Mg41Nd5) |
| (Mg3Nd) | 55.0 | 25.0 | 20.0 | (Mg3Nd) |
| 21 | 65.8 | 10.4 | 23.8 | (α-Mg)Zn | 98.2 | - | 1.8 | (α-Mg)Zn |
| τ6 | 63.5 | 7.5 | 29 | τ6 |
| τ3 | 30.0 | 25.0 | 45.0 | τ3 |
| 24 | 16.0 | 16.5 | 67.5 | ? | 21.0 | 16.0 | 63.0 | τ5 |
| τ3 | 25.2 | 25.0 | 49.8 | τ3 |
| ? | 12.5 | 15.5 | 72.0 | τ2 |
Table 4.
Actual composition of key alloys containing two-phase equilibria and their experimental results.
| Sample Number | Actual alloy Composition (atom %) | Phase Identification XRD | Phase Composition (atom %) | Corresponding Phase |
|---|
| Mg | Nd | Zn | Mg | Nd | Zn |
|---|
| 10 | 11.5 | 42.7 | 45.8 | Nd(Mg,Zn) | 3.5 | 50.0 | 46.5 | Nd(Mg,Zn) |
| τ3 | 30.5 | 25.0 | 44.5 | τ3 |
| 11 | 15.5 | 56.4 | 28.1 | Nd(Mg,Zn) | 19.0 | 50.0 | 31.0 | Nd(Mg,Zn) |
| Nd | 100.0 | - | - | Nd |
| 12 | 42.6 | 32.1 | 25.3 | Nd(Mg,Zn) | 28.3 | 50.0 | 21.7 | Nd(Mg,Zn) |
| (Mg3Nd) | 60.0 | 25.0 | 15.0 | (Mg3Nd) |
| 13 | 73.3 | 17.5 | 9.2 | (Mg41Nd5) | 89.0 | 10.1 | <1.0 | (Mg41Nd5) |
| (Mg3Nd) | 70.0 | 25.0 | 5.0 | (Mg3Nd) |
| 14 | 76.3 | 9.5 | 14.2 | (α-Mg)Zn | 98.8 | - | 1.2 | (α-Mg)Zn |
| (Mg3Nd) | 48.1 | 25.0 | 26.9 | (Mg3Nd) |
| 16 | 56.5 | 34.1 | 9.4 | Nd(Mg,Zn) | 43.0 | 50.0 | 7.0 | Nd(Mg,Zn) |
| (Mg3Nd) | 70.0 | 25.0 | 5.0 | (Mg3Nd) |
| 17 | 19.5 | 44 | 36.5 | Nd(Mg,Zn) | 8.6 | 50.0 | 41.4 | Nd(Mg,Zn) |
| (Mg3Nd) | 47.0 | 25.0 | 28.0 | (Mg3Nd) |
| 18 | 74.1 | 11.7 | 14.2 | (α-Mg)Zn | 97.8 | - | 2.2 | (α-Mg)Zn |
| (Mg3Nd) | 47.0 | 25.0 | 28.0 | (Mg3Nd) |
| 19 | 77.2 | 14.5 | 8.3 | (Mg41Nd5) | 87.0 | 10.0 | 3.0 | (Mg41Nd5) |
| (Mg3Nd) | 63.0 | 25.0 | 12.0 | (Mg3Nd) |
| 22 | 24.2 | 7.5 | 68.3 | (Nd2Zn17) | 7.5 | 10.5 | 82.0 | (Nd2Zn17) |
| τ1 | 29.0 | 6.5 | 64.5 | τ1 |
| 23 | 36.4 | 8.1 | 55.5 | (α-Mg)Zn | 94.3 | - | 5.7 | (α-Mg)Zn |
| τ1 | 31.5 | 7.2 | 61.3 | τ1 |
| 25 | 6.5 | 15 | 78.5 | (Nd2Zn17) | 7.0 | 10.5 | 82.5 | (Nd2Zn17) |
| τ1 | 25.5 | 7.5 | 67.0 | τ1 |
The microstructures of equilibrated key alloys selected from different regions of the Mg-Nd-Zn system are shown in
Figure 9. The equilibrated phases are labeled on the same micrographs. WDS analysis of all the equilibrated key alloys is shown graphically in
Figure 10, where the arrows point to the detected phases.
The existence of ternary compounds τ
1, τ
2, τ
3, and τ
5, detected by diffusion couple experiments, was confirmed using the equilibrated key alloys. Furthermore, key alloys revealed the presence of a ternary compound equilibrating with (α-Mg)
Zn. This compound was given the formula Nd(Mg,Zn)
11.5 in the work of Huang
et al. [
1] at 400 °C. It is denoted as τ
6 in the current work. We assume that τ
4 was not detected by key alloys due to the low Nd concentration, which falls within the WDS detection limits. Thus, the phase might be read as Mg
12Zn
13 for negligible Nd concentration. However, it was clearly recognized in diffusion couple #2, where τ
4 is in equilibrium with (α-Mg)
Zn, Mg
12Zn
13, and τ
1. More data and discussion regarding the ternary compounds and solid solutions are provided in the following sections.
Figure 10.
Phase equilibrium results obtained from WDS spot analysis of equilibrated key alloys, where the arrows point to the detected phases.
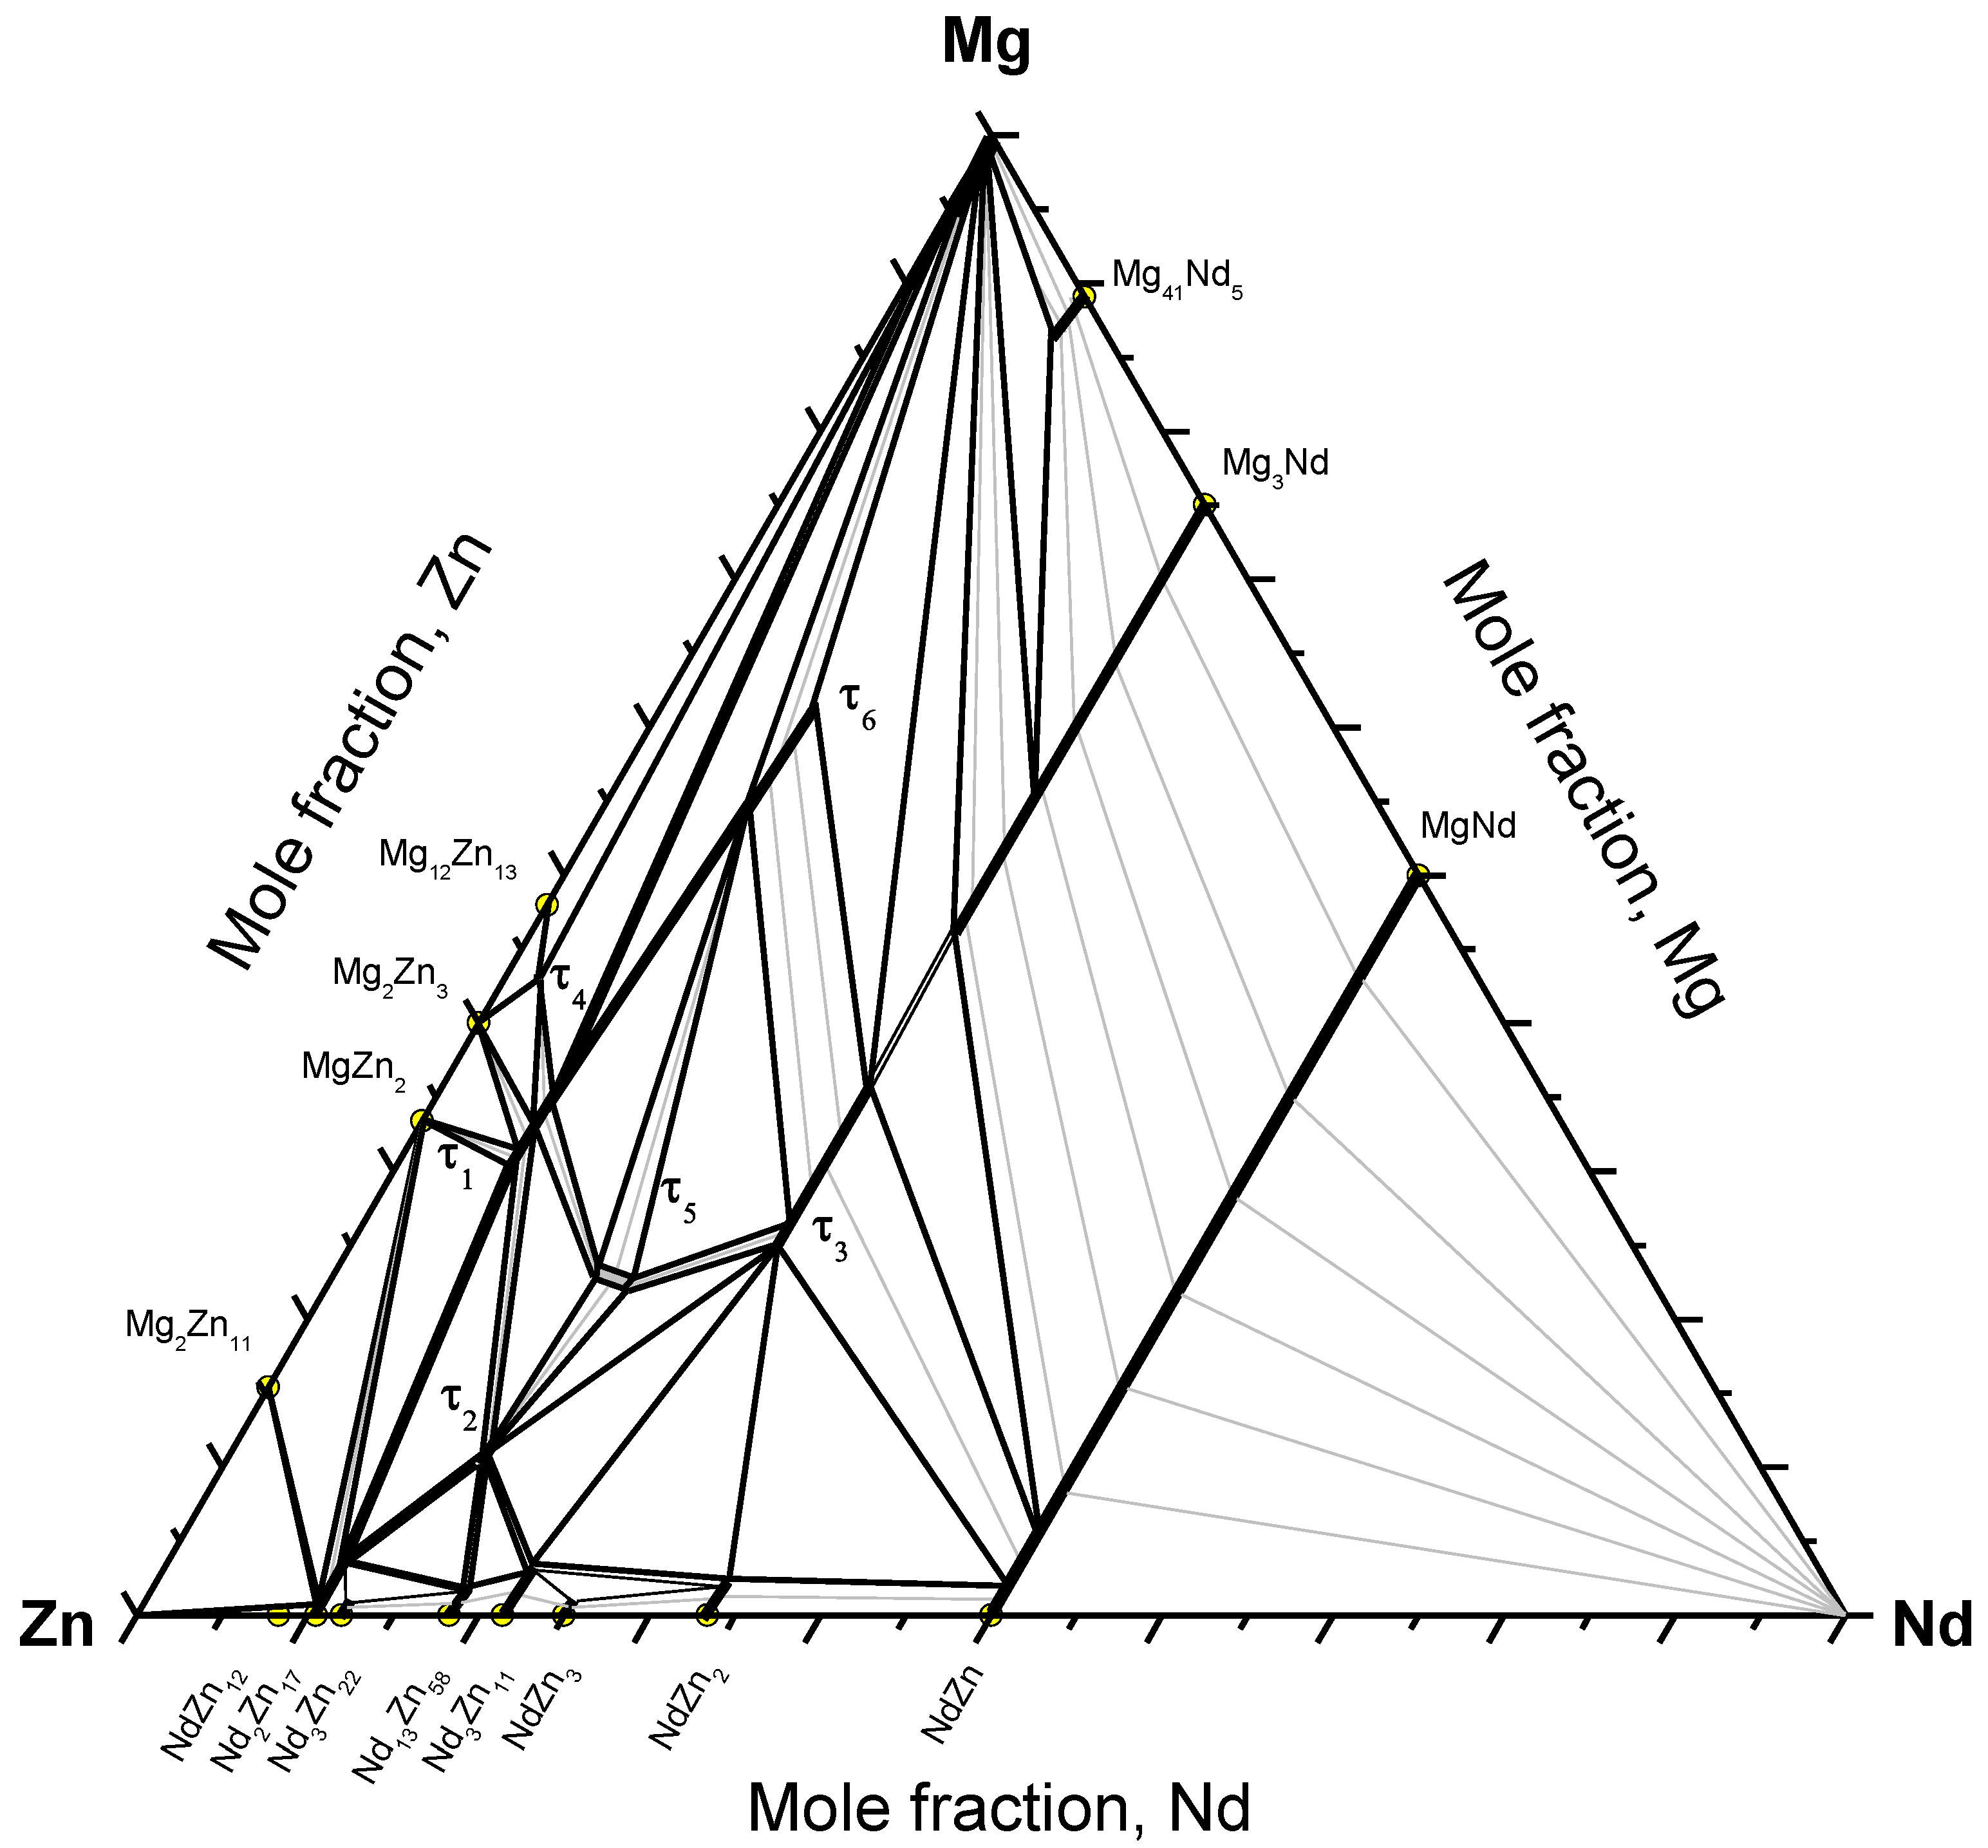
3.2.1. Ternary Compounds
Six ternary compounds in the Mg-Nd-Zn system were confirmed experimentally at 300 °C by diffusion couples and key alloys. The homogeneity range of these compounds was determined by WDS analysis. τ
1 extends from 29.0 to 35.0 atom % Mg at a constant Nd concentration of ~6.8 atom % and has a hexagonal crystal structure with lattice parameters of
a =
b = 1.5 nm and
c = 0.87 nm [
14]. τ
2 extends from 10.0 to 12.0 atom % Mg at a constant Nd concentration of 15.1 atom %. τ
3 extends from 25.0 to 36.0 atom % Mg at a constant Nd concentration of 25.0 atom % and has a face-centered cubic crystal structure with lattice parameters of
a =
b =
c = 0.68 nm [
1]. τ
5 was found with a homogeneity range of 22.0–23.5 atom % Mg, 15.5–17.6 atom % Nd and 59.1–61.8 atom % Zn. τ
6 extends from 54.1 to 61.3 atom % Mg at a constant Nd of 8.0 atom % and has a C-centered orthorhombic crystal structure with lattice parameters of
a = 0.965–0.984 nm,
b = 1.18–1.135 nm and
c = 0.946–0.963 nm [
1].
3.2.2. Solid Solutions
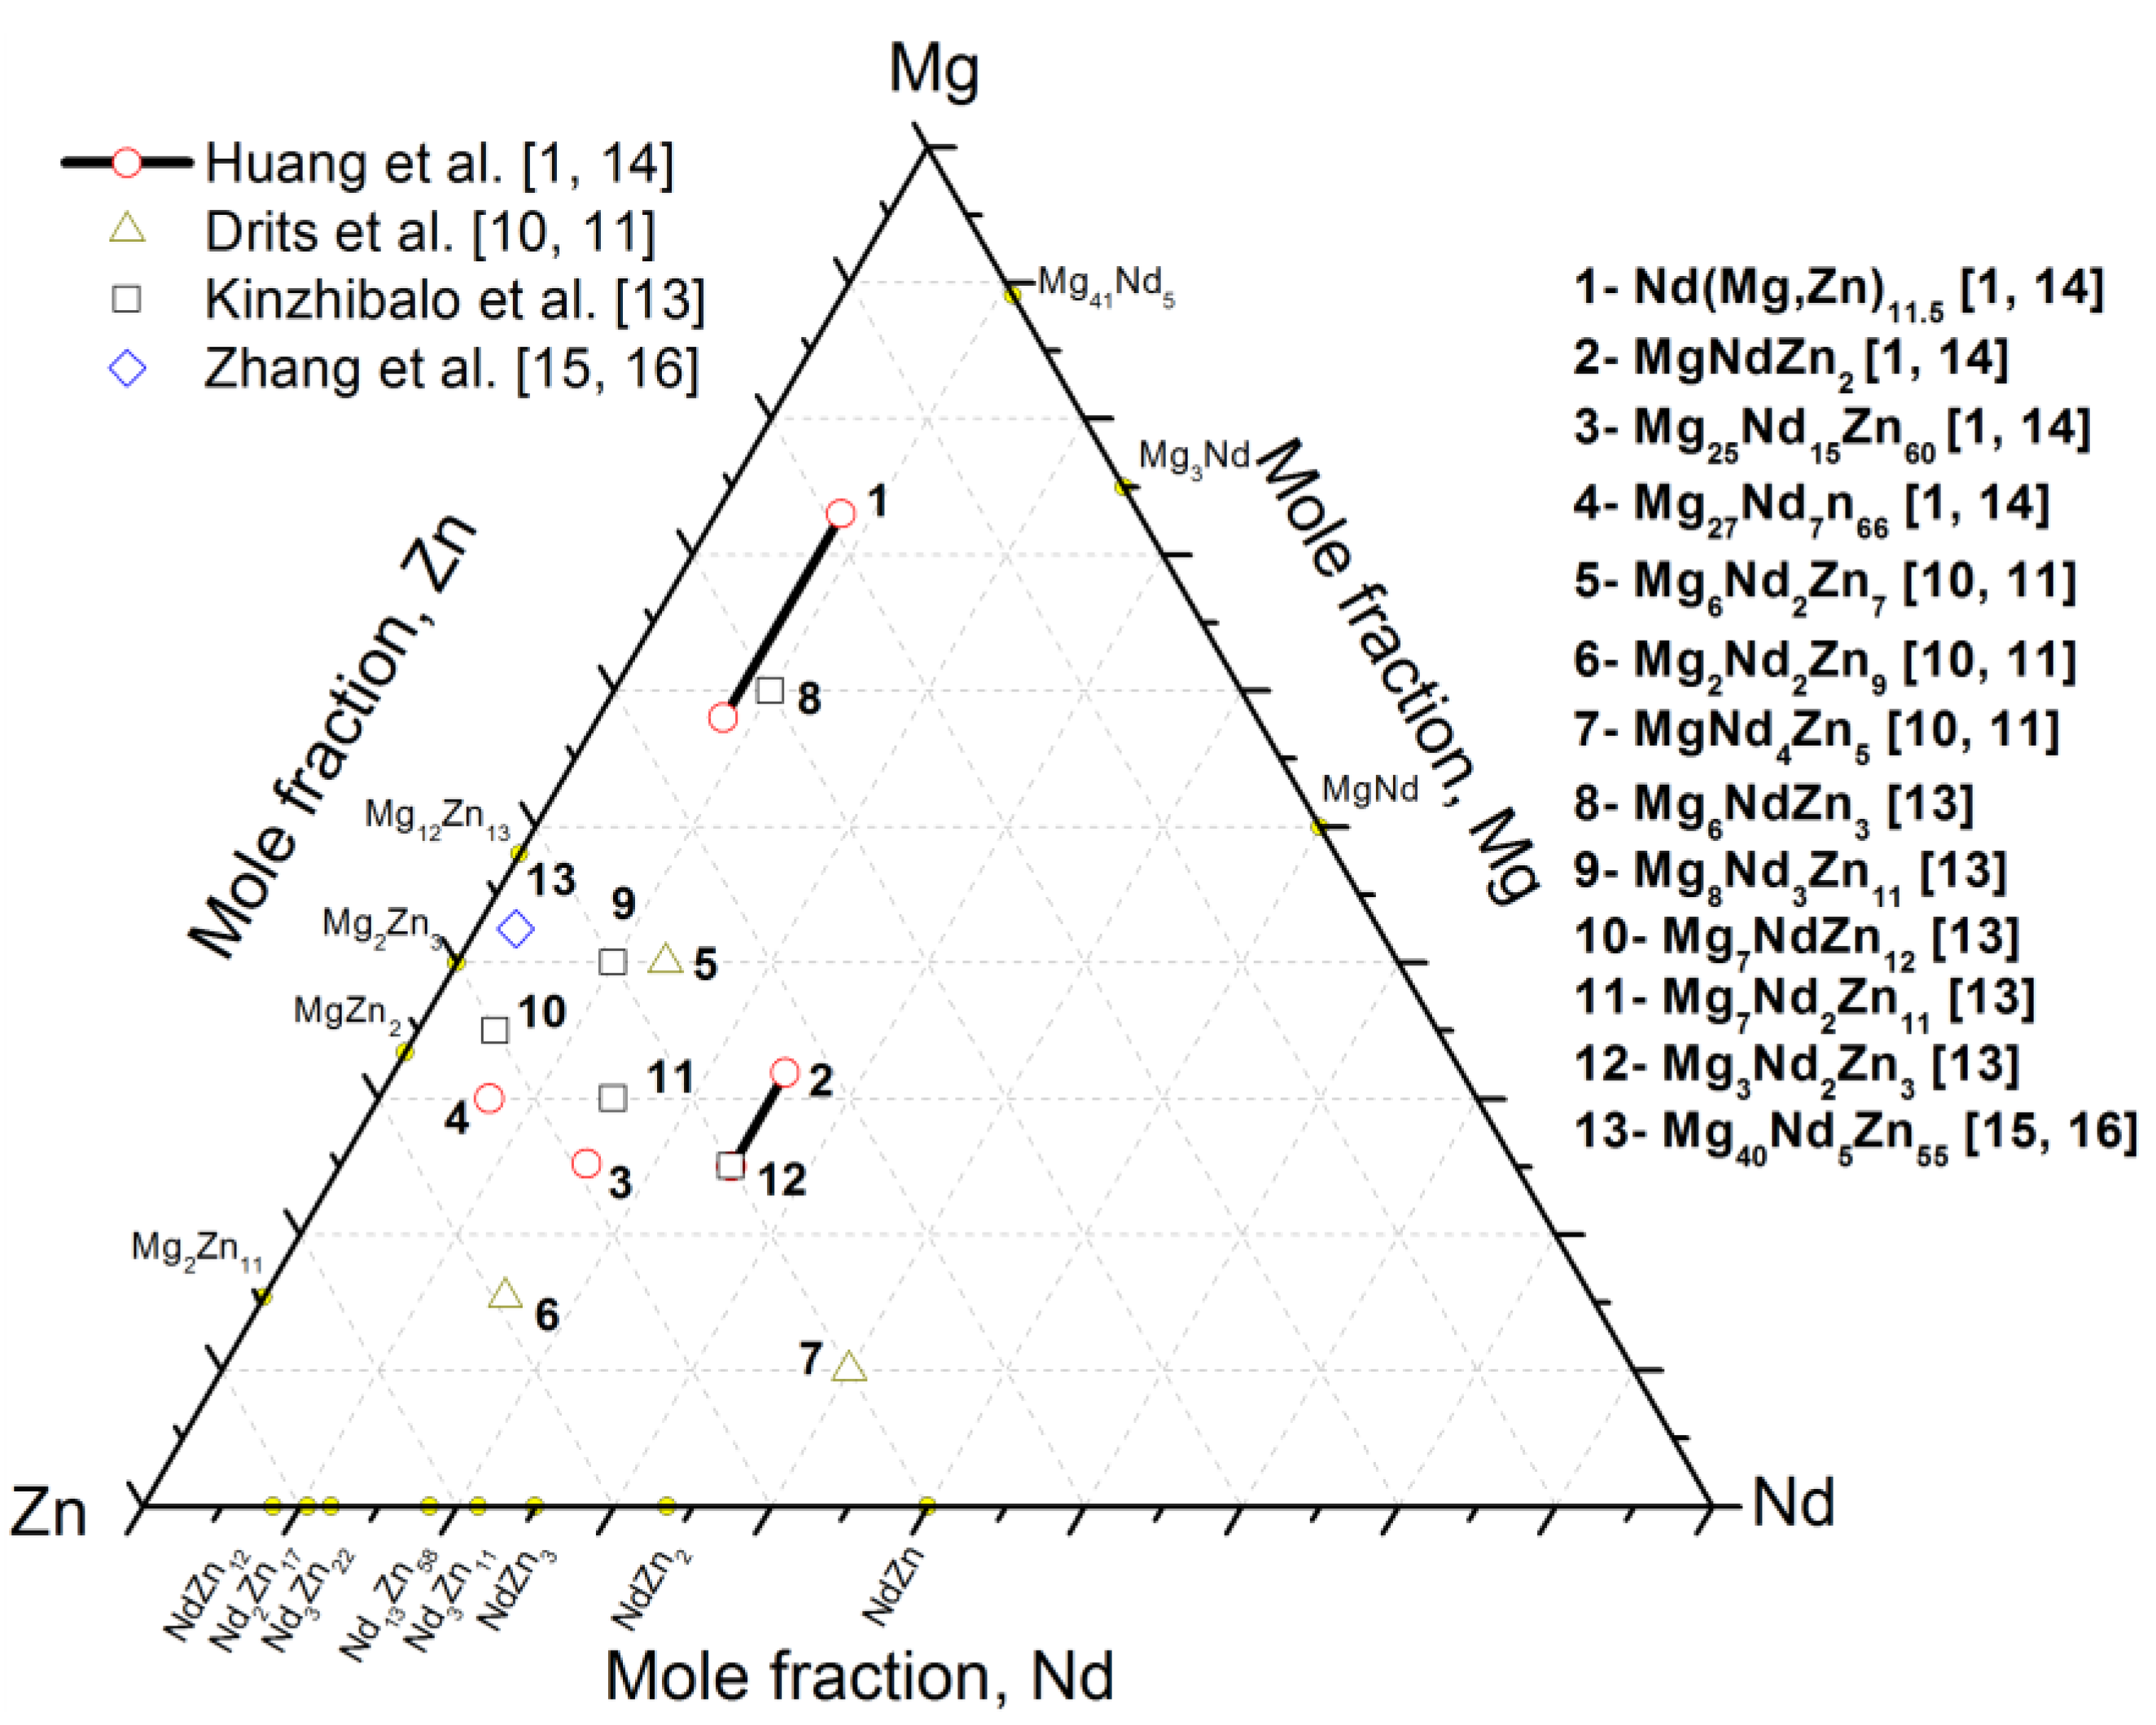
Although the binary solid solubility of Nd in Mg is negligible [
10,
11], Kinzhibalo
et al. [
13] showed that (α-Mg) contains ~5 atom % Nd in the Mg-Nd-Zn isothermal section at 300 °C. In this work, the solubility of Nd in α-Mg is negligible and the maximum solid solubility of Zn in (α-Mg)
Zn was measured as 4.8 atom % Zn at 300 °C.
The ternary solubility of Zn in Mg-Nd compounds was found to increase with a decrease in Mg concentration. For instance, (Mg
41Nd
5) was found to have an extended solubility of 3.1 atom % Zn, whereas (Mg
3Nd) was found to have 30.0 atom % Zn. MgNd was found to have a complete substitution of Mg by Zn. Thus, the complete solid solubility line Nd(Mg,Zn) was established between MgZn and NdZn. This was also reported in the literature for this system at 300 °C [
13] and confirmed in the current work.


