Article

The Effect of Indium Content on the Atomic Environment and Cluster Stability of GeSe4Inx=10,15 Glasses

by
Georgios S. E. Antipas
*,
Eleni Mangiorou
and
Evangelos Hristoforou
School of Mining Engineering and Metallurgy, National Technical University of Athens, Zografou Campus, Athens 15780, Greece
*
Author to whom correspondence should be addressed.
Metals 2015, 5(1), 102-118; https://doi.org/10.3390/met5010102
Submission received: 27 October 2014 / Accepted: 8 January 2015 / Published: 14 January 2015

Abstract

:
The atomic environments of two chalcogenide glasses, with compositions GeSe4In10 and GeSe4In15, were studied via Reverse Monte Carlo and Density Functional Theory. Indium content demoted Ge–Se bonding in favor of Se-In while the contribution of Se–Se in the first coordination shell order was faint. Upon transition to the richer In glass, there was formation of rich Ge-centered clusters at radial distances further than 4 Å from the RMC box center, which was taken to signify a reduction of Ge–Se interactions. Cluster coordination by Se promoted stability while, very conclusively, In coordination lowered cluster stability by intervening in the Ge–Se and Se–Se networks.

1. Introduction

Original interest in the Ge–Se matrix stems from its popularity in the synthesis of semiconducting materials and, in turn, investigation of electron transport in disordered Ge–Se systems is actively pursued [1,2]. The addition of a third component in Ge–Se-based glasses has raised interest regarding the system’s structure [3,4] in applications such as amorphous chalcogenide membranes and ion selective electrodes for the detection of metals in aqueous solutions [5]. Two properties regarding the amorphous Ge–Se matrix are of particular importance in applications: the material’s optical band gap [1,6] (for example, Ge–Se vibrational spectroscopy [7] has revealed the instrumental role of the system’s band gap on the electrical properties of Ge–Se based semiconductors) and the effect of alloying additions in the Ge–Se matrix. Typically, the introduction of Bi or Pb in a Ge–Se glass induces a change in the electrical conductivity from p- to n-type, accompanied by a reduction of the electrical resistance [8].
Indium elemental additions have been determined to affect the Ge–Se glass transition temperature (Tg) in the range of 5–8 at% In [9]. On the assumption that In atoms bond tetrahedrally, it has been shown that the Fermi energy, EF, moves towards the valence band with increasing In content maintaining the materials p-type character [10]. Moreover, for In content up to 10 at%, the ternary material’s optical band gap is unaffected while its electrical activation energy is greatly affected [10], hence the role of the solute is not settled. In ternary chalcogenide glasses for which the composition of two elements is fixed, atomic volume appears to be determined by the average coordination requirement of each species [11]. In mostly covalent glasses, the coordination number obeys the 8-N rule, where N is the valency of an atom [11]. It has previously been suggested that a stable vitreous state in chalcogenide glasses can be obtained only if enough lone-pair electrons exist in the structure of the chalcogenide system [12] and that the cation in the chalcogenide glasses may interact with the lone-pair electrons of a bridging chalcogen atom and influence the glass forming ability. Most of the charged additives introduced into chalcogenide matrices tend to occupy the lowest-energy configuration (i.e., they satisfy the 8-N rule) [10] thus, they do not perturb the equilibrium between acceptor and donor defects and they do not substantially affect the material’s physical properties. There are, however, cases of certain additives that adopt charged configurations and which can result in a reduction of the electronic activation energy [10].
In a previous contribution, the atomic topology of ternary Ge–Se–In glasses was determined by X-ray Diffraction (XRD), Neutron Diffraction (ND) and Extended X-ray Absorption Fine Structure (EXAFS) experiments in conjunction with Reverse Monte Carlo (RMC) fitting of the total scattering datasets [13]. The simultaneous modeling of the experimental datasets for each composition enabled the determination of partial pair distribution functions and the extraction of the local atomic order in these glasses. Here, we extend the discussion of local atomic order of the GeSe4Inx system for values of x (atomic concentrations) equal to 10 and 15; we discuss the realm of the systems’ electronic structure and we provide evidence that both systems may, in fact, be characterized on the basis of discrete Ge-, Se-, and In-centered atomic clusters, selected on the basis of the variation of atomic topology in the RMC supercell.

2. Methodology

Two amorphous chalcogenide systems with nominal compositions of GeSe4In10 and GeSe4In15 were studied; both systems were originally synthesized in [13] from elemental Ge, Se and In (all elements were of 99.99% purity), by sealing the required alloy constituents in quartz ampoules under an underpressure of 10−3 Pa and heating the mixtures up to 1273 K under continuous vibration stirring, at a rate of 2 K/min. The samples were then quenched in a mixture of ice and water and total scattering datasets were obtained by X-Ray (XRD) and Extended X-Ray Absorption Fine Structure (EXAFS) spectroscopy. The XRD datasets were recorded by a Ge solid-state detector at the BW5 facility in HASYLAB, DESY at incident beam energy of 100 keV with a cross section equal to 4 mm2 and appropriate corrections (background, absorption, polarization) were imposed on the resultant data. EXAFS transmission datasets (approximately 1/e) were attained with a step size of 0.5 eV in the vicinity of the absorption edge for Ge, Se and In K-edges at the HASYLAB X beamline [13].
The materials’ total structure factors, S(Q), were estimated on the basis of the experimental X-ray and neutron scattering intensities attained; The total S(Q) data were then correlated to the partial structure factors, Sij(Q) via the Faber–Ziman formalism [14]. According to the formalism, the atomic weights, wij, representing the correlation between any two atomic species i and j during X-ray scattering are first defined as
w i j ( Q ) = ( 2 δ i j ) c i c j f i ( Q ) f j ( Q ) f ( Q ) 2
where Q is the scattering wavevector, equal to 4πsin(θ)/λ, θ is half of the scattering angle, λ is the radiation wavelength, δij is the Kronecker delta function, ci is the molar fraction of the ith element in the system and fi is the element’s form factor. The system’s partial structure factors are then related to the experimentally established total S(Q) via the expression
S ( Q ) = i j w i j ( Q ) S i j ( Q )
The Faber–Ziman partial structure factors, Sij(Q), are, in turn, linked to the partial pair distribution functions (PDF), gij(r), through the relation
g i j ( r ) = 1 + 1 2 π 2 ρ 0 r 0 Q ( S i j ( Q ) 1 ) sin ( Q r ) d Q
where r is the real space (Cartesian) variable and ρο is the alloy’s number density.
In the current work, both the total and partial PDF from the Fourier-transformed structure factors originally obtained were fitted by the RMC method via use of the molecular RMC_POT code [15]. In our simulation we retained the minimum interatomic distances (cut-offs) as established in [13]. Aside from cut-offs, partial distances of furthest approach within the first coordination shell were also defined; both cut-offs and distances of furthest approach are listed in Table 1. We note here that the exact stoichiometries of the models considered were (Ge0.2Se0.8)100−xInx, where x = 10 and 15, for which GeSe4Inx is shorthand notation for the relationship between the Ge and Se species. Hence, number density and its corresponding mass density refer to the exact stoichiometries. Additionally, we note that mass density measurements for the systems at hand are scarce and the principal density estimates are based on the work by Saffarini [16,17], who also provided a phenomenological expression accounting for mass density in respect to content; that work was compiled by Kaban et al. [13] to derive the number densities utilized here. The RMC simulation boxes each contained 3000 atoms with a number density of 0.0328 atoms/Å3 estimated on the basis of GeSe4In10 and 0.0335 atoms/Å3 estimated on the basis of GeSe4In15 models.
Following RMC fitting, a number of Ge-, Se- and In-centered clusters were selected as indicative of various sites within the RMC supercell, on the basis of the radial distribution of atomic environment statistics. In previous instances of metallic glass cluster analysis [18] we have considered the metal center coordinated solely by nearest neighbors; here we treated the more realistic case of clusters inclusive of the center’s second coordination shell.
Table 1. Partial interatomic cut-offs rmin, as well as distances of furthest approach, rmax, used in this study (all distances are in Å). The first column contains the atomic pair which defines each partial. The interatomic cut-off and the distance of furthest approach are the minimum and maximum distance, respectively, which is allowed between the two closest neighbours defined by the partial.
PartialGeSe4In10GeSe4In15
rminrmaxrminrmax
Ge–Se2.002.951.952.95
Se–Se1.952.752.052.75
Se–In2.302.902.302.90
As the clusters isolated from the RMC supercell do not, in principle, correspond to any particular level of theory, they were relaxed, keeping the atom coordinates of the second coordination shell frozen, within the premise of DFT and were further analyzed for molecular orbital interactions-induced stability. Spin unrestricted DFT relaxation was carried out in the GGA BLYP [19,20] level of theory, where single-electron wave functions were expanded into uncontracted Slater-type orbitals (STO) comprising a triple-ζ basis set with two sets of polarization functions by use of the a TZ2P basis set. Calculations were all-electron for all three of the Ge ([Ar]3d104s24p2), Se ([Ar]3d104s24p4) and In ([Kr]4d105s25p1) atomic structures, corrected for relativistic effects using the zero-order regular approximation (ZORA) [21,22,23]; the latter is a requirement raised by the presence of In. All DFT calculations were performed with the Amsterdam density functional (ADF) program [24].

3. Results and Discussion

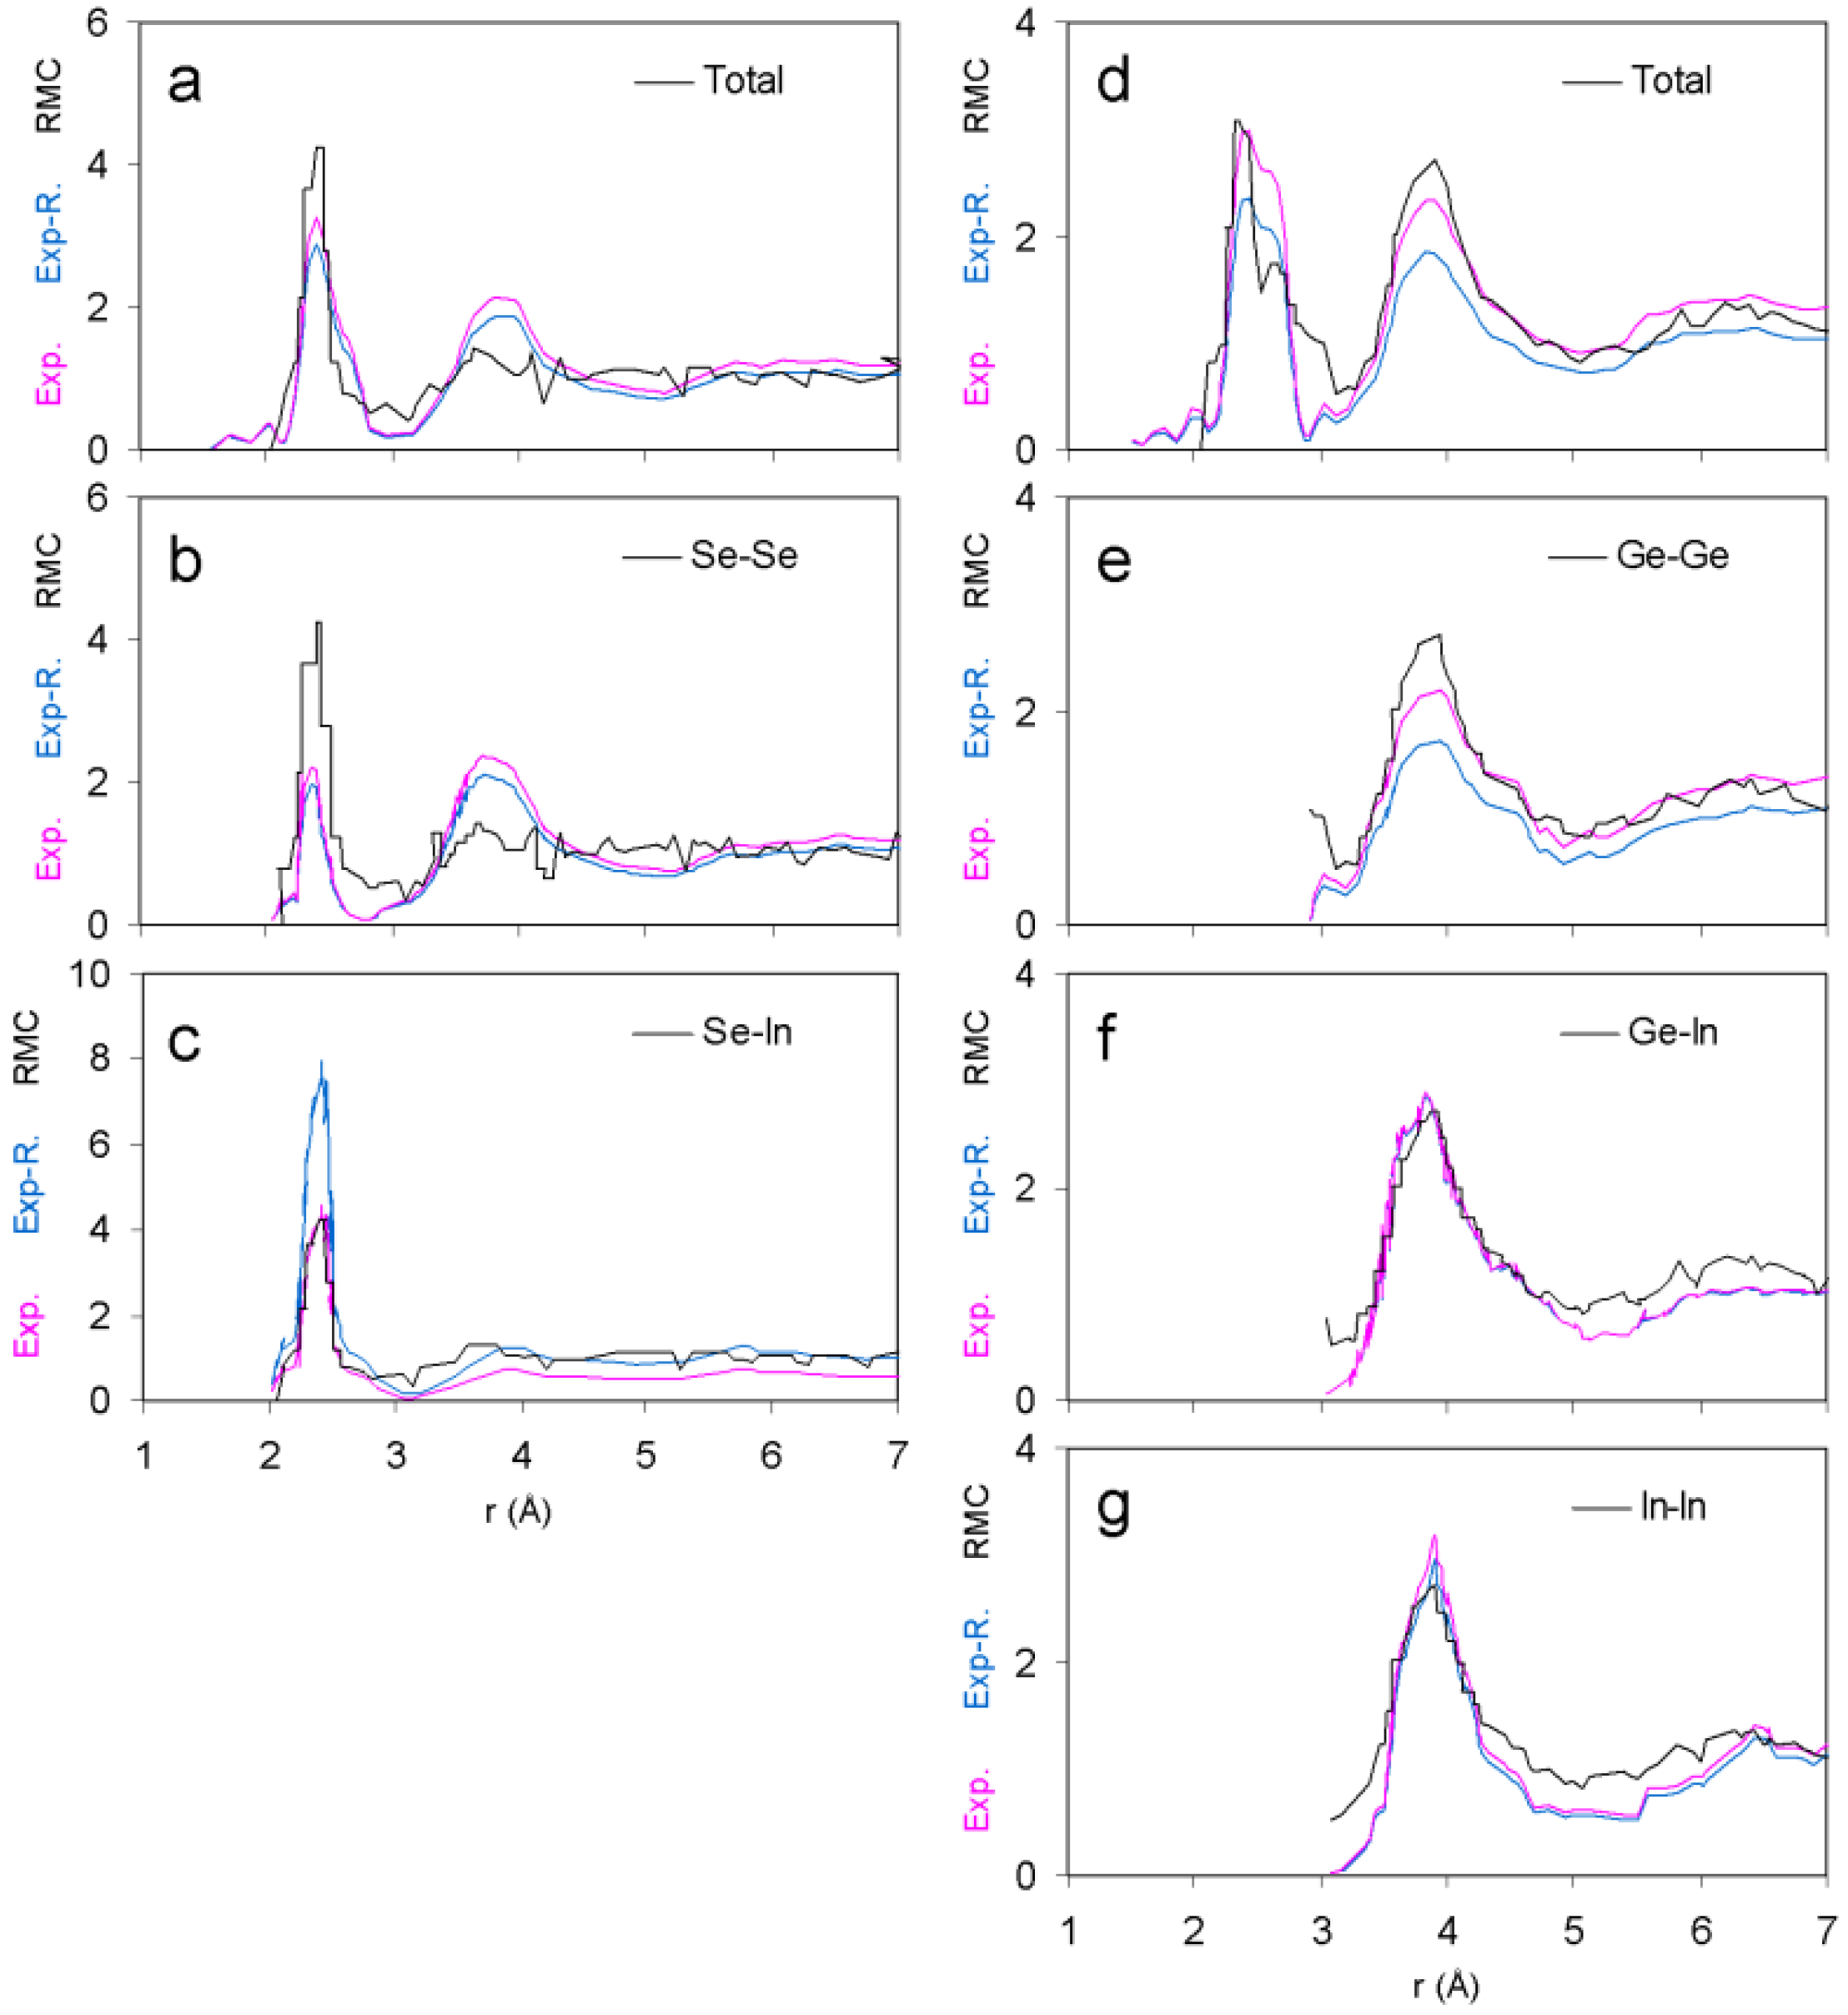
3.1. Pair Distribution Functions

The fit of the RMC total and partial pair distribution functions, g(r), to the experimental XRD data is shown in Figure 1 while working residuals, Rw, of the RMC goodness of fit for different partials of both systems are presented in Table 2. In both GeSe4In10 and GeSe4In15, the first coordination shell peak was at 2.4 Å and the peak extended up to 2.6 Å. It is usual for Se–Se and Ge–Se nearest neighbor distances to lie well within the first shell of interatomic interactions of complex Ge–Se–In systems, as determined by ND (Se–Se peak at 2.32 Å and Ge–Se peak at 2.36 Å, respectively) [25]. However, we noticed considerable variance in the partials that comprised the first coordination shell in respect to In content. In the case of GeSe4In10, primary contributions in the first shell came from Ge–Se and Se–In at almost comparable intensities, with only a faint participation of Se–Se. Interestingly, the extra In content of the GeSe4In15 system appeared to have substantially demoted contributions from Ge–Se in favor of Se–In, the latter shaping the shell almost exclusively. The Se–In peak has been determined by EXAFS to lie in the range 2.58–2.61 Å for widely varying Ge–Se–In formula units of glassy systems (e.g., Ge, Se and In atom numbers in the range 5–28, 65–80 and 6–20, respectively) [26]. The role of Se–Se in the first coordination shell was faint, in similarity to GeSe4In10.
Table 2. Total and partial working residuals, Rw, of the RMC goodness of fit for the GeSe4In10 and GeSe4In15 systems.
TotalGe-GeSe-SeIn-InGe-InSe-In
GeSe4In100.310.160.410.230.160.46
GeSe4In150.260.210.360.180.140.40
Figure 1. A comparison of RMC-derived vs. experimental total and partial pair distribution functions for GeSe4In10 (ac) and GeSe4In15 (dg). Color coding is as follows: experimental data—pink line; renormalized experimental data, blue line; and RMC, black line. Experimental data renormalization factors were: (a) 1.132420, (b) 1.122437, (c) 0.574149 for the GeSe4In10 system and (d) 1.266068, (e) 1.270162, (f) 1.009675 and (g) 1.082473 for the GeSe4In15 system. We note that renormalization comprised linear regression of the experimental data in the final stage of the RMC simulation towards achieving a better fit to the RMC solution.
Metals 05 00102 g001
In both systems, interactions beyond the first coordination shell revealed an almost-identical behavior of all partials involved. The peak of the total PDF second coordination shell was at 2.9 Å while the shell extended up to 3.2 Å for both systems. Here, decisive contributions towards second shell formation came from the Se-In partial with minute contributions from Ge-In and this behavior was common the two alloys. Also, third shell interatomic interactions comprised two overlapping peaks. In both alloys these peaks were at 3.3 and 3.5 Å and were owing to a combination of Se-In and In-In interactions; the third coordination shell extended up to about 4.1 and 4.3 Å for GeSe4In10 and GeSe4In15, respectively. Longer-range order in the GeSe4In10 system was exclusively due to the In–In partial.

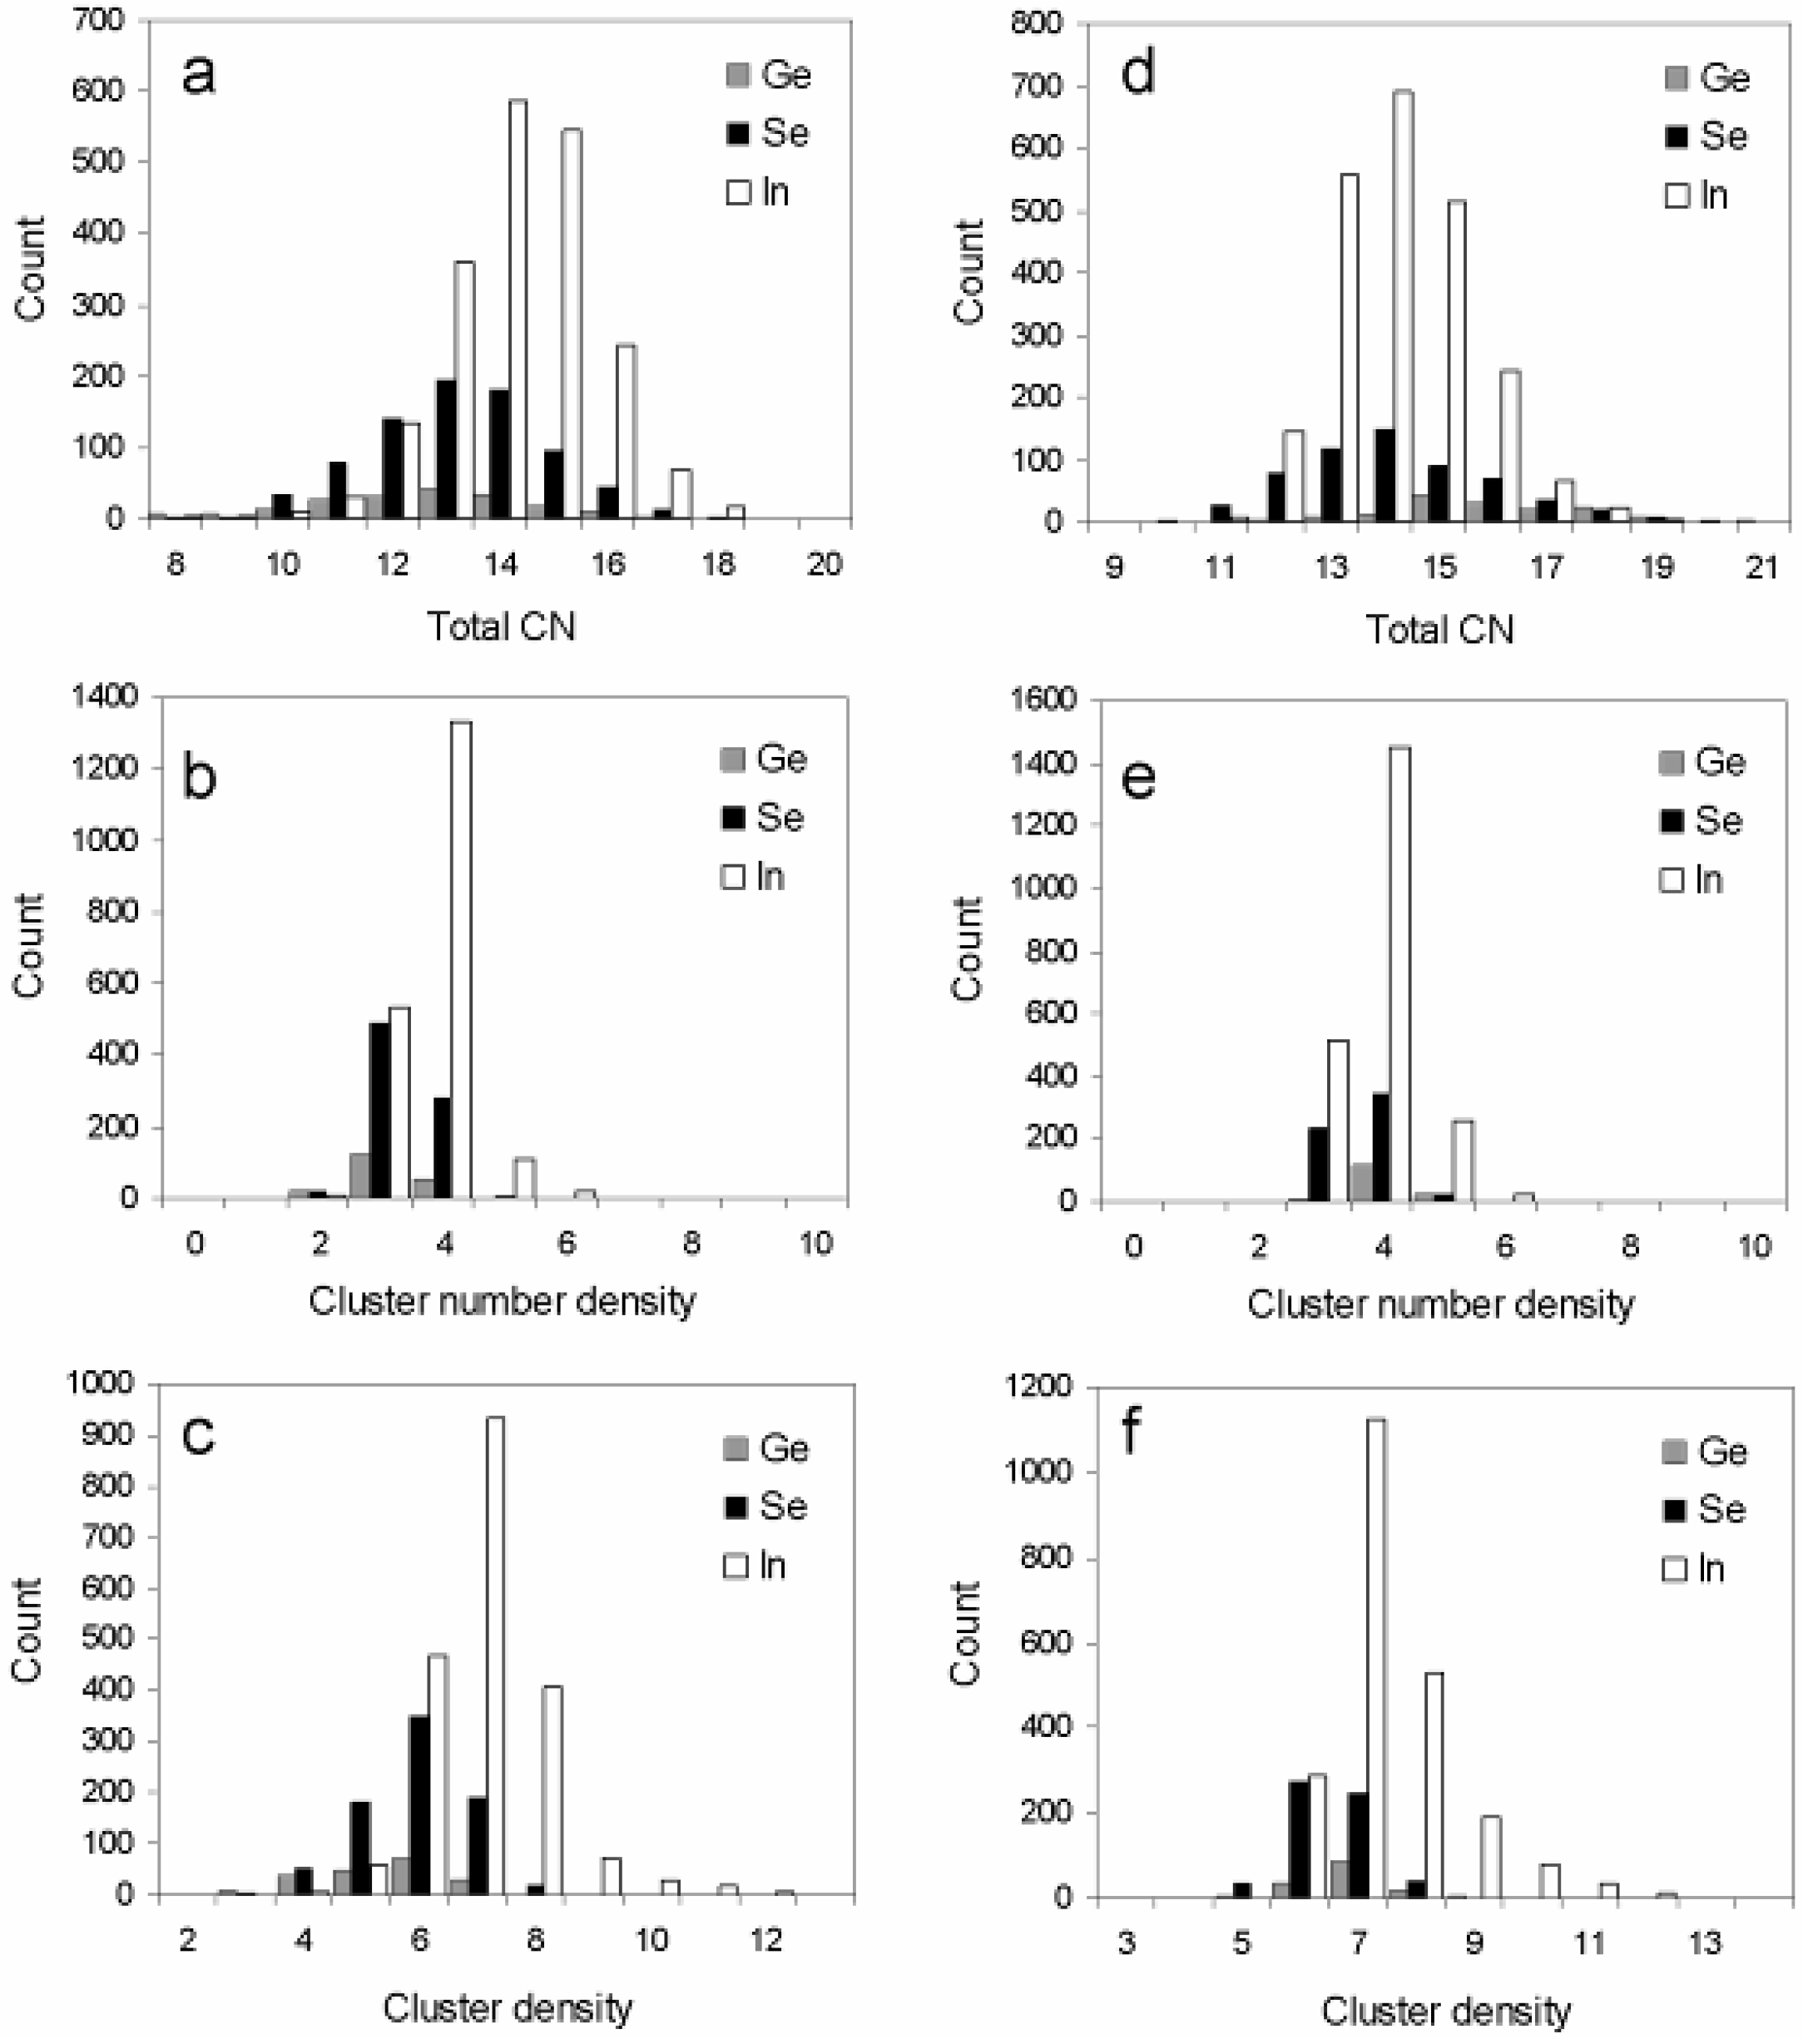
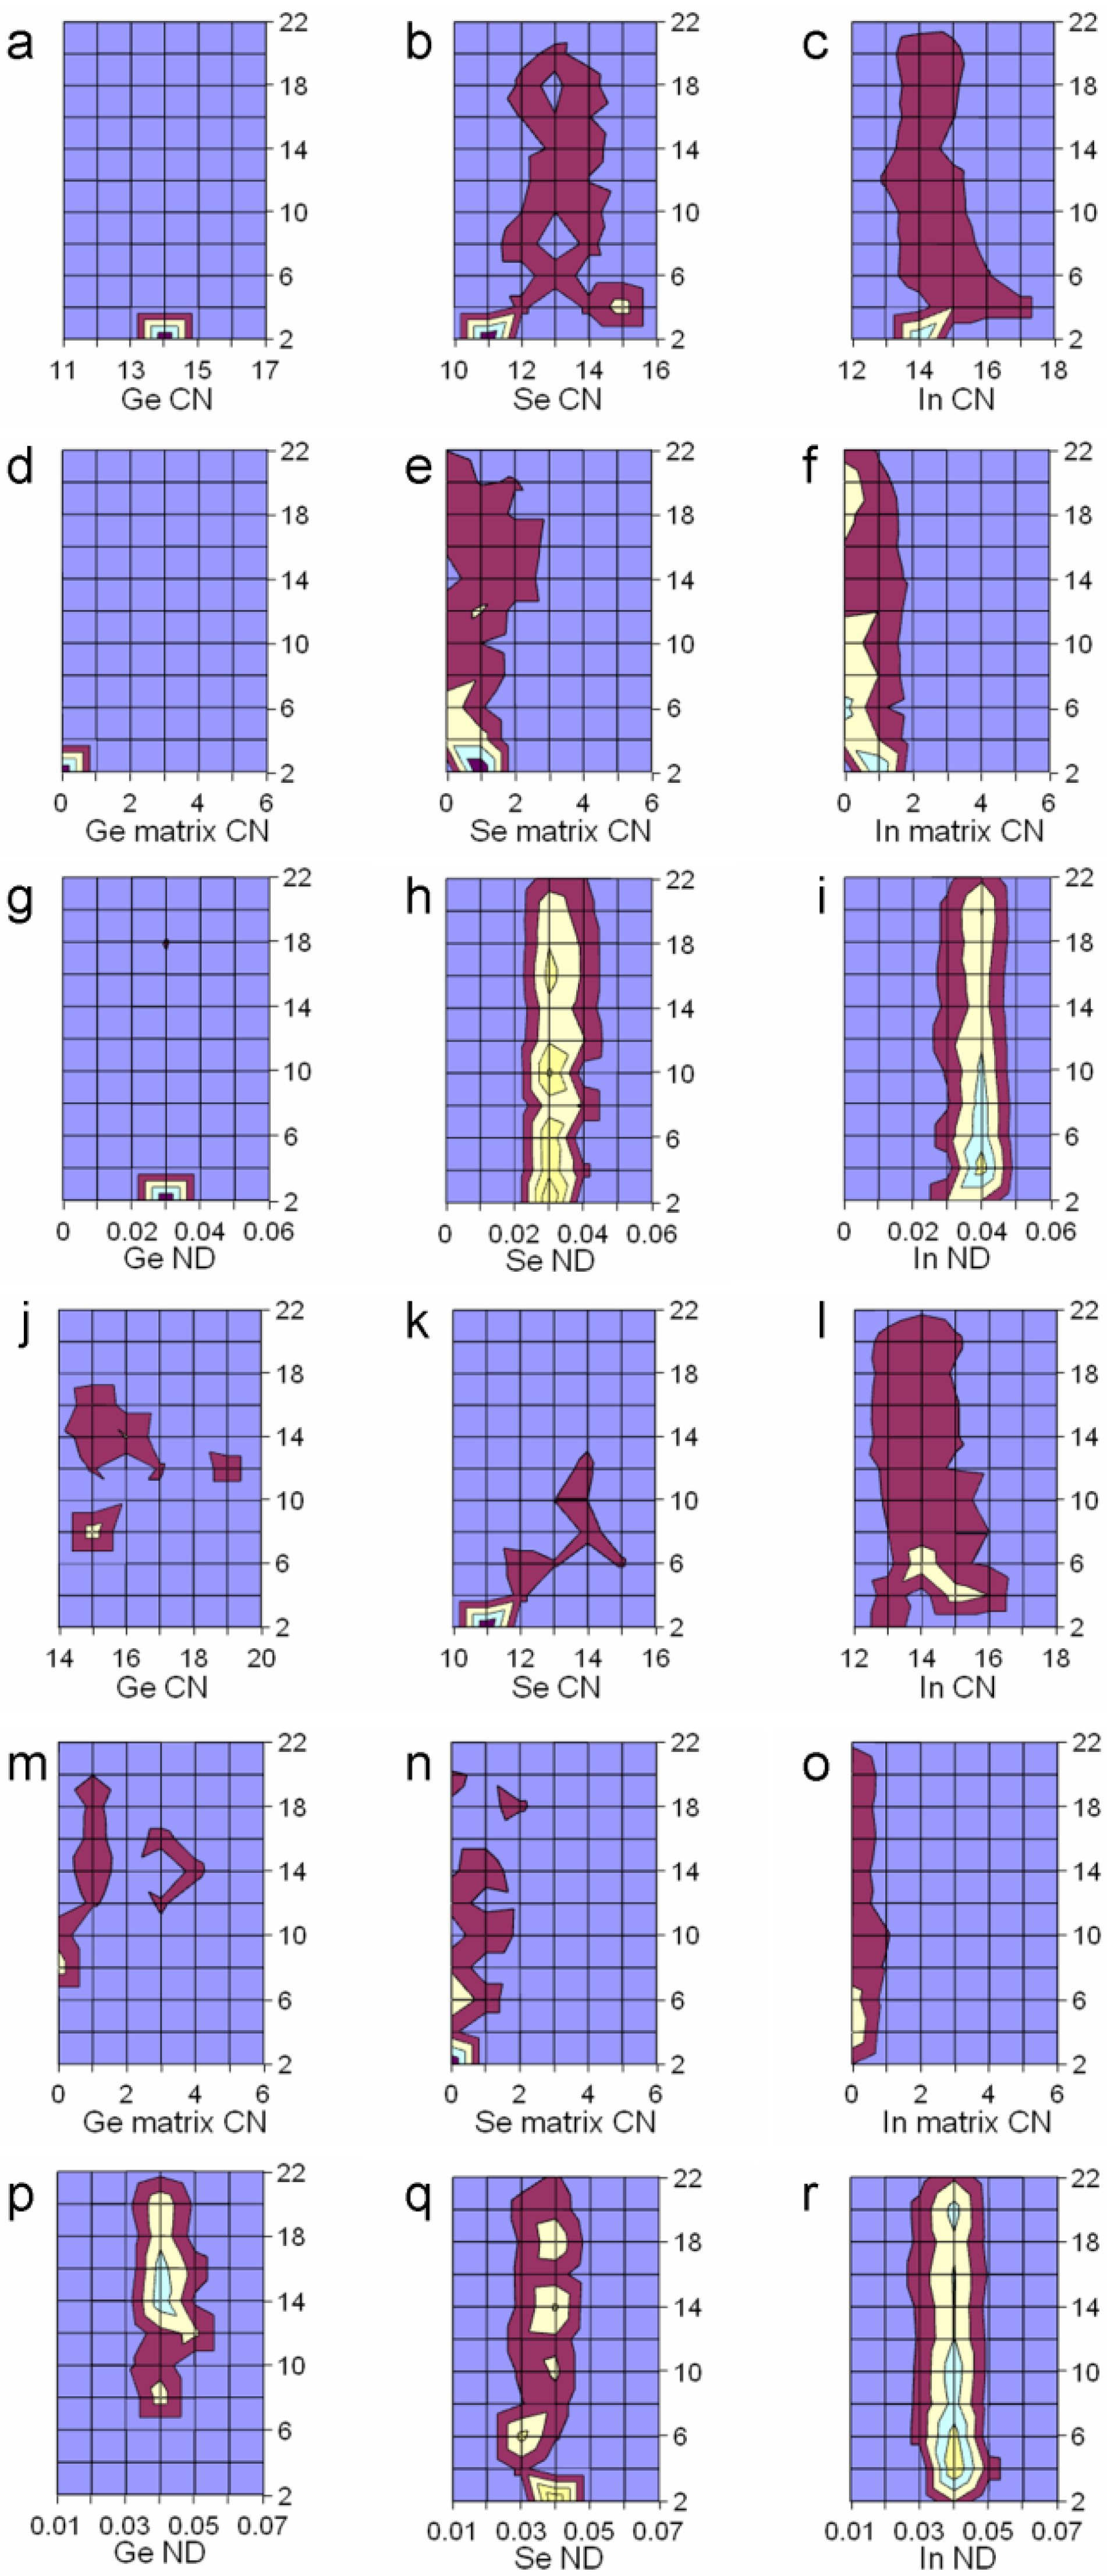
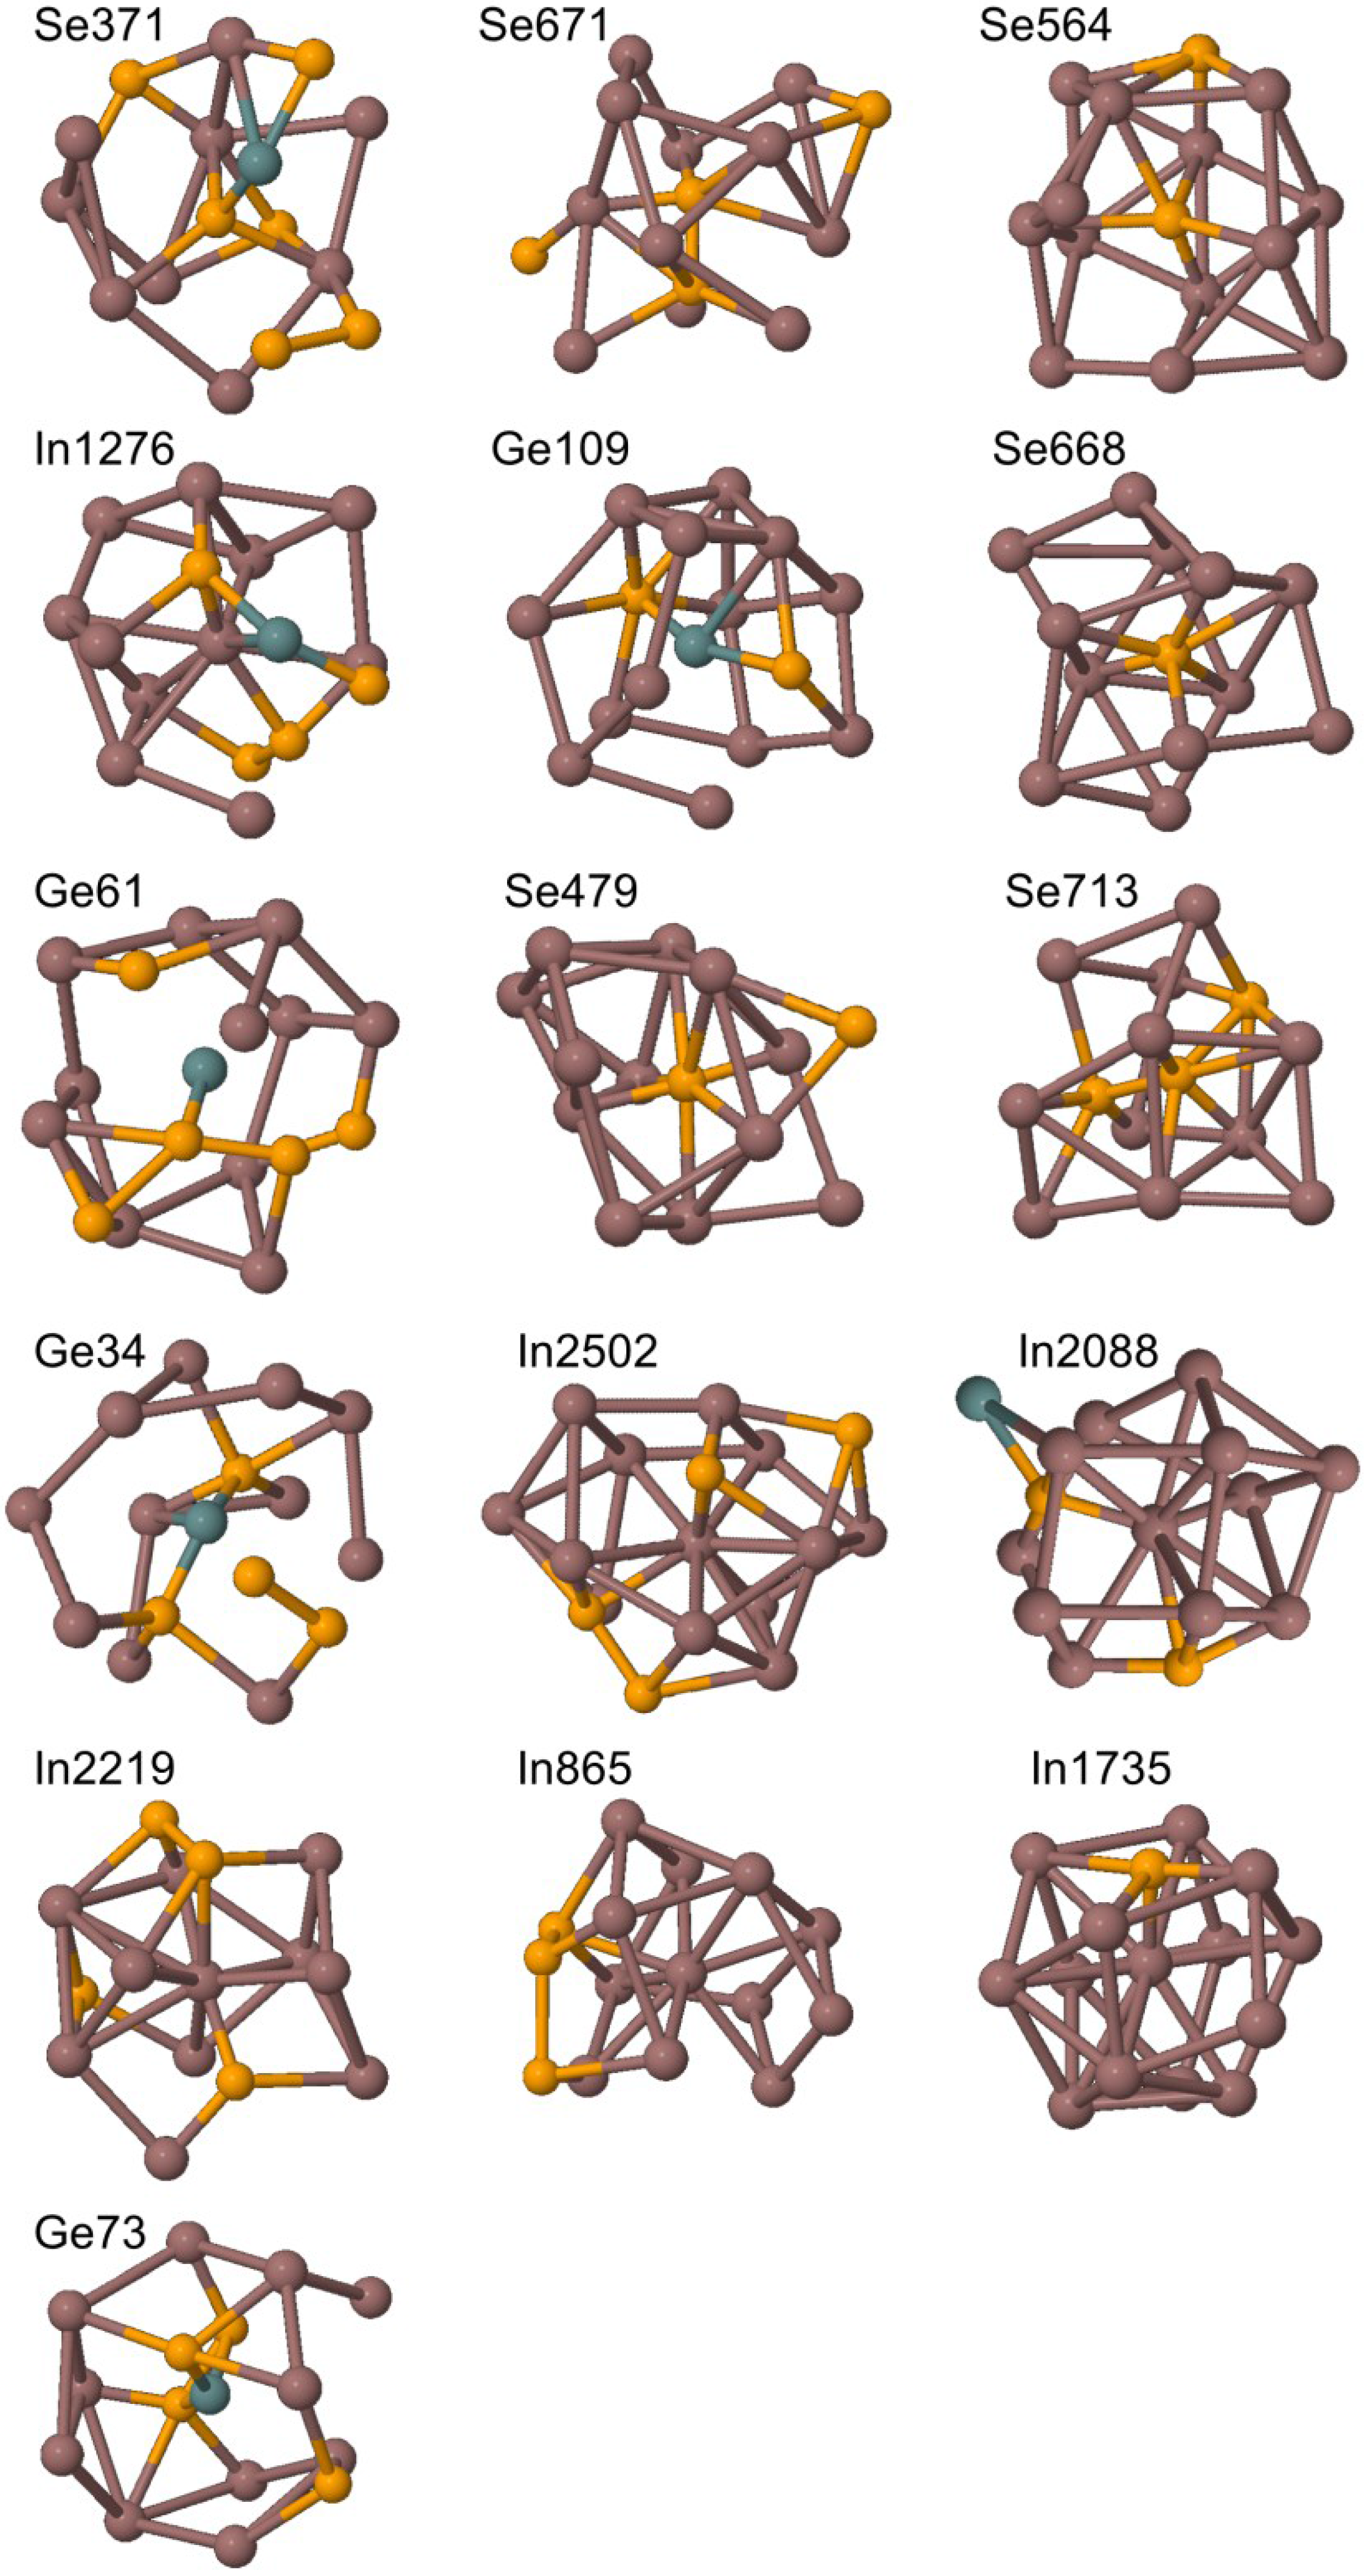
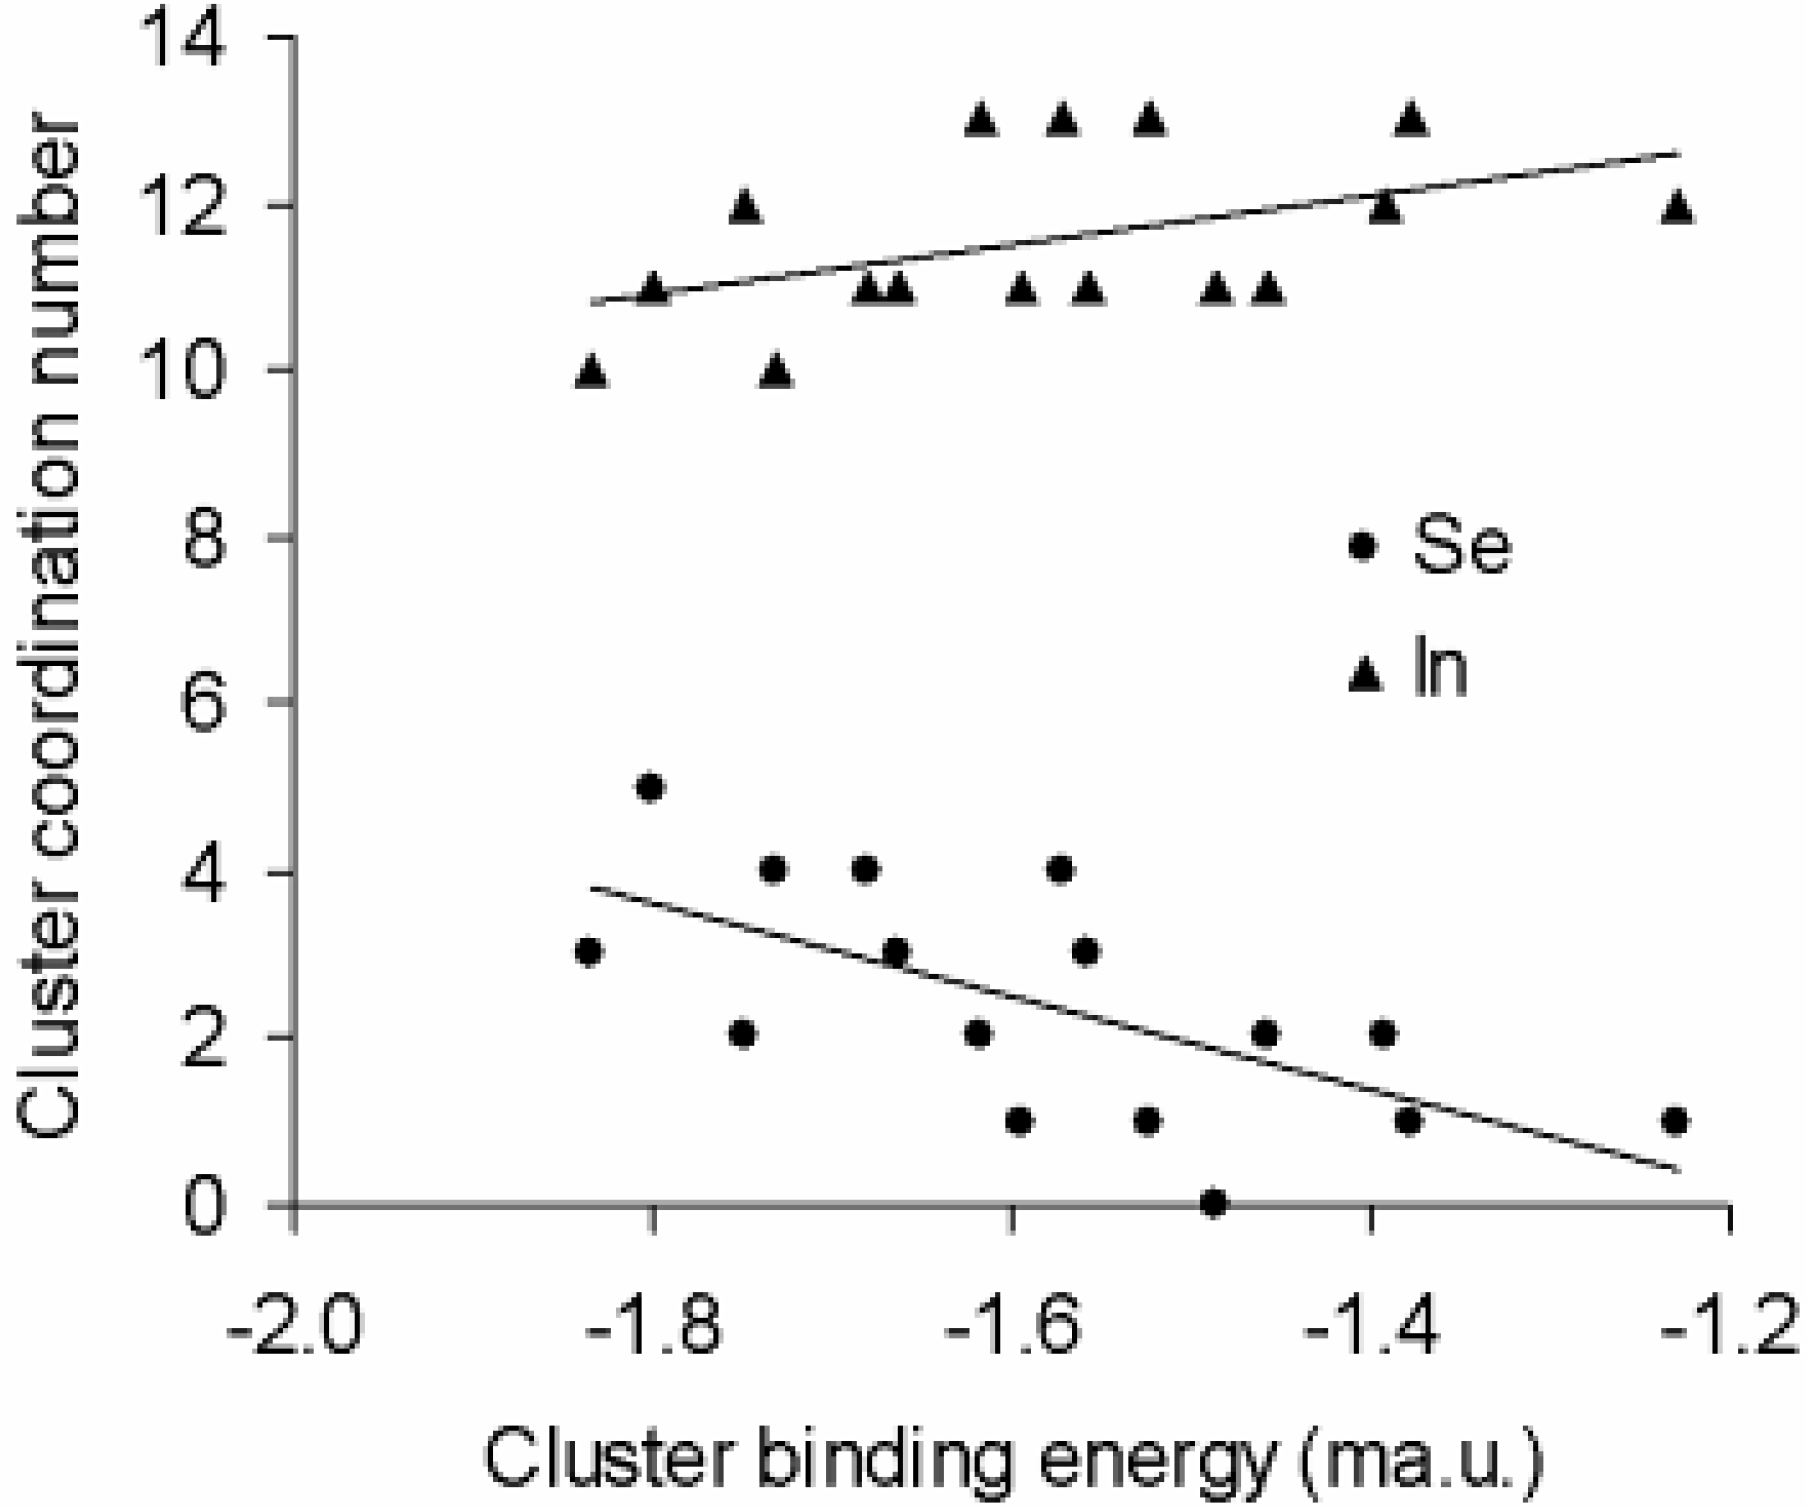
3.2. Atomic Environment Statistics and Cluster Selection

Histograms of atom coordination number, cluster number density and cluster mass density within the second coordination shell of interatomic interactions are shown in Figure 2. In the GeSe4In10 system, average coordination of the Ge, Se and In species was 12.51, 13.17 and 14.26, respectively. The same quantities in the GeSe4In15 alloy were 16.11, 14.15 and 14.20, respectively. The marked increase of Ge coordination in the GeSe4In15 alloy was owing to a broader and higher Ge–Se peak compared to GeSe4In10; hence transition to a higher In content caused an increase in Ge and Se coordination but left In coordination largely unaffected. In comparison, Ge, Se and In nearest neighbor coordination in the GeSe4In10 system was 3.28, 2.36, 1.07, while the same quantities for the case of the GeSe4In15 system were 2.04, 2.15, 1.06, respectively; as discussed in 3.1, the reduction of Ge average coordination was purely due to Se depletion in favor of bonding with In. Therefore, upon transition from GeSe4In10 to GeSe4In15, the excess In mediates more intense interaction between Se and In, a side-effect of which is Se depletion from the first coordination shell of Ge atoms. The Se species, however, remains within Germanium’s second coordination shell, hence the increased average coordination of the Ge centers.
On the basis average atomic coordination, average cluster number density as well as cluster radial distribution of these quantities, we selected a number of clusters as representative of the RMC supercell; cluster radial distributions were constructed by first considering clusters centered on each of the atomic species in the RMC supercell and surrounded inclusive of second nearest neighbors. Then, the center’s average and partial coordination numbers as well as the cluster’s number density and average density were binned based on the center’s distance from the RMC supercell center, normalized by the volume of the spherical shell corresponding to each bin. Normalization by the volume of the spherical shell intrinsically created a bias towards coordination features located close to the RMC box origin.
The radial variation of metal center coordination number and cluster number density is shown in Figure 3. In the case of the GeSe4In10 system, Ge-centered clusters revealed a principal tendency for 14-fold coordination (see Figure 3a) at average number density in the region of 0.03 atoms/Å3 (rounded up to two decimal points—see Figure 3g). The locus of the highest concentration of such 14-fold coordinated clusters was the region up to a radial distance of 4 Å from the RMC box origin. Interestingly, there was little to no tendency for coordination of Ge centers by Ge surface atoms (see Figure 3d) mainly due to the small number of Ge atoms in the system. Se and In coordination features were interrelated and they will be discussed alongside. As seen in Figure 3b, Se principal coordination was 11 up to 4 Å from the RMC box origin. A second Se coordination feature involved 15 atoms to within 6 Å from the origin. These two features appear to loosely overlap with In coordination of 14 and as high as 17 up to 4 Å from the RMC box origin (see Figure 3c). The extent of Se–In interaction was in fact wide, as reflected in the similarity of the surfaces in Figure 3b,c, covering up to 21 Å of radial distance. Another common feature between Se- and In-centered clusters was that they both consistently involved no more than two Ge surface atoms along the whole of the RMC box radial direction (see Figure 3e,f).
Figure 2. Particle histograms (i.e., number of particles in each histogram bin vs. coordination number, CN, cluster number density and mass density) within the second coordination shell of interatomic interactions. Panels (a) to (c) refer to GeSe4In10 and panels (d) to (f) refer to GeSe4In15. The cluster number density values must be multiplied by 0.01 to yield units of atoms/Å3. Cluster density is expressed in g/mL.
Metals 05 00102 g002
In the case of the GeSe4In15 alloy, Ge coordination in the vicinity of the RMC box origin was demoted in favor of 15-fold coordination at a radius of 8 Å, as shown in Figure 3j. One possible physical connotation attached to this transition could be the increase of coordination variability of the Ge species along the radial direction, mediated by the excess In content. The term variability is meant to denote coordination features close to the RMC box origin becoming smoother (less ‘important’ in radial distribution terms) with the simultaneous surfacing of features at further radial positions becoming more distinguishable (for example see features between 12 and 16 radial Å in Figure 3j). Such a transition would certainly entail breaking of Ge–Se bonds, as the prevailing partial towards Ge-induced order in the GeSe4In10 system was Ge–Se; correspondingly, there was reduced variability observed in Se coordination features (see Figure 3k in comparison to Figure 3b); this suggests that Se assumed specific bonding interactions, which, in fact, were in conjunction with the In species as shown by the presence of both species in features up to 4 Å of radial distance (see Figure 3k in conjunction with Figure 3l). Moreover, the coordination requirements of both Se and In for Ge surface species were reduced, in comparison to the GeSe4In10 system (see Figure 3n,o); inevitably, the Ge species not serving as closest neighbors of the Se and In species close to the RMC box origin, are the ones creating the coordination motifs of Figure 3j. Hence, another feature of the excess In content is the formation of rich Ge-centered clusters at radial distances further than 4 Å from the RMC center. Details of the selected clusters are listed in Table 3 while cluster geometries are shown in Figure 4.
Figure 3. Surface plots of the radial distribution of coordination and number density for Ge-, Se- and In-centered clusters (the radial direction is measured from the origin of the RMC simulation box and is the vertical axis in units of Å). Panels (a) to (i) refer to the GeSe4In10 system while (j) to (r) refer to GeSe4In15. Horizontal axis notation is as follows: CN: average coordination number, matrix CN: average coordination of the cluster center by Ge (“matrix” refers to the first atomic species in the chemical formula, i.e., Ge, by convention), ND: number density (atoms/Å3) and D: density (g/mL). Increasing iso-surface values are shown as a progression of blue, dark red, pale white, yellow, cyan and dark brown colors.
Metals 05 00102 g003
Table 3. A list of the most characteristic clusters of the GeSe4In10 and GeSe4In15 systems selected on the basis of the radial distributions of cluster center average coordination, cluster center coordination by the matrix species (Ge) and cluster number density. In the forthcoming discussion, cluster notation will be defined by mention of the reference system first (e.g., GeSe4In10) followed by the center atom and the cluster designation, which is unique to the cluster (e.g., Ge34, hence the cluster corresponding to the first row of this table will be GeSe4In10-Ge34).
Reference systemCenter atom Cluster designationAverage coordination of cluster centerCluster density (g/mL)Cluster number density (Atoms/Å3)Central atom distance from RMC box origin (Å)Number of Ge surface atomsNumber of Se surface atomsNumber of In surface atoms
GeSe4In10Ge34146.2680.03(2859)2.8650212
GeSe4In10Se248146.4100.03(3600)3.0371112
GeSe4In10Se371115.5980.03(0197)2.734128
GeSe4In10In1276147.7090.04(1329)1.2561310
GeSe4In10In2088156.7160.03(5206)4.5131212
GeSe4In15Ge61166.9950.03(8950)9.4410511
GeSe4In15Ge73157.2240.03(9512)23.1480411
GeSe4In15Ge109157.0530.03(6971)23.0750213
GeSe4In15Se479126.7790.03(4477)6.7150111
GeSe4In15Se564146.7650.03(4554)8.2280113
GeSe4In15Se668117.5180.03(7109)2.0860011
GeSe4In15Se671147.7130.04(1187)8.2770311
GeSe4In15Se713135.8780.03(0678)5.7710211
GeSe4In15In865147.5630.03(9488)6.1240311
GeSe4In15In1735146.7720.03(3854)5.8100113
GeSe4In15In2219147.4580.03(9824)5.4670410
GeSe4In15In2502177.5820.04(0358)6.2670413
Figure 4. Geometries of the most representative clusters as isolated from the RMC supercell. Cluster designations refer to Table 3. Color coding is as follows: In, dark purple; Se, orange; and Ge, dark blue.
Metals 05 00102 g004

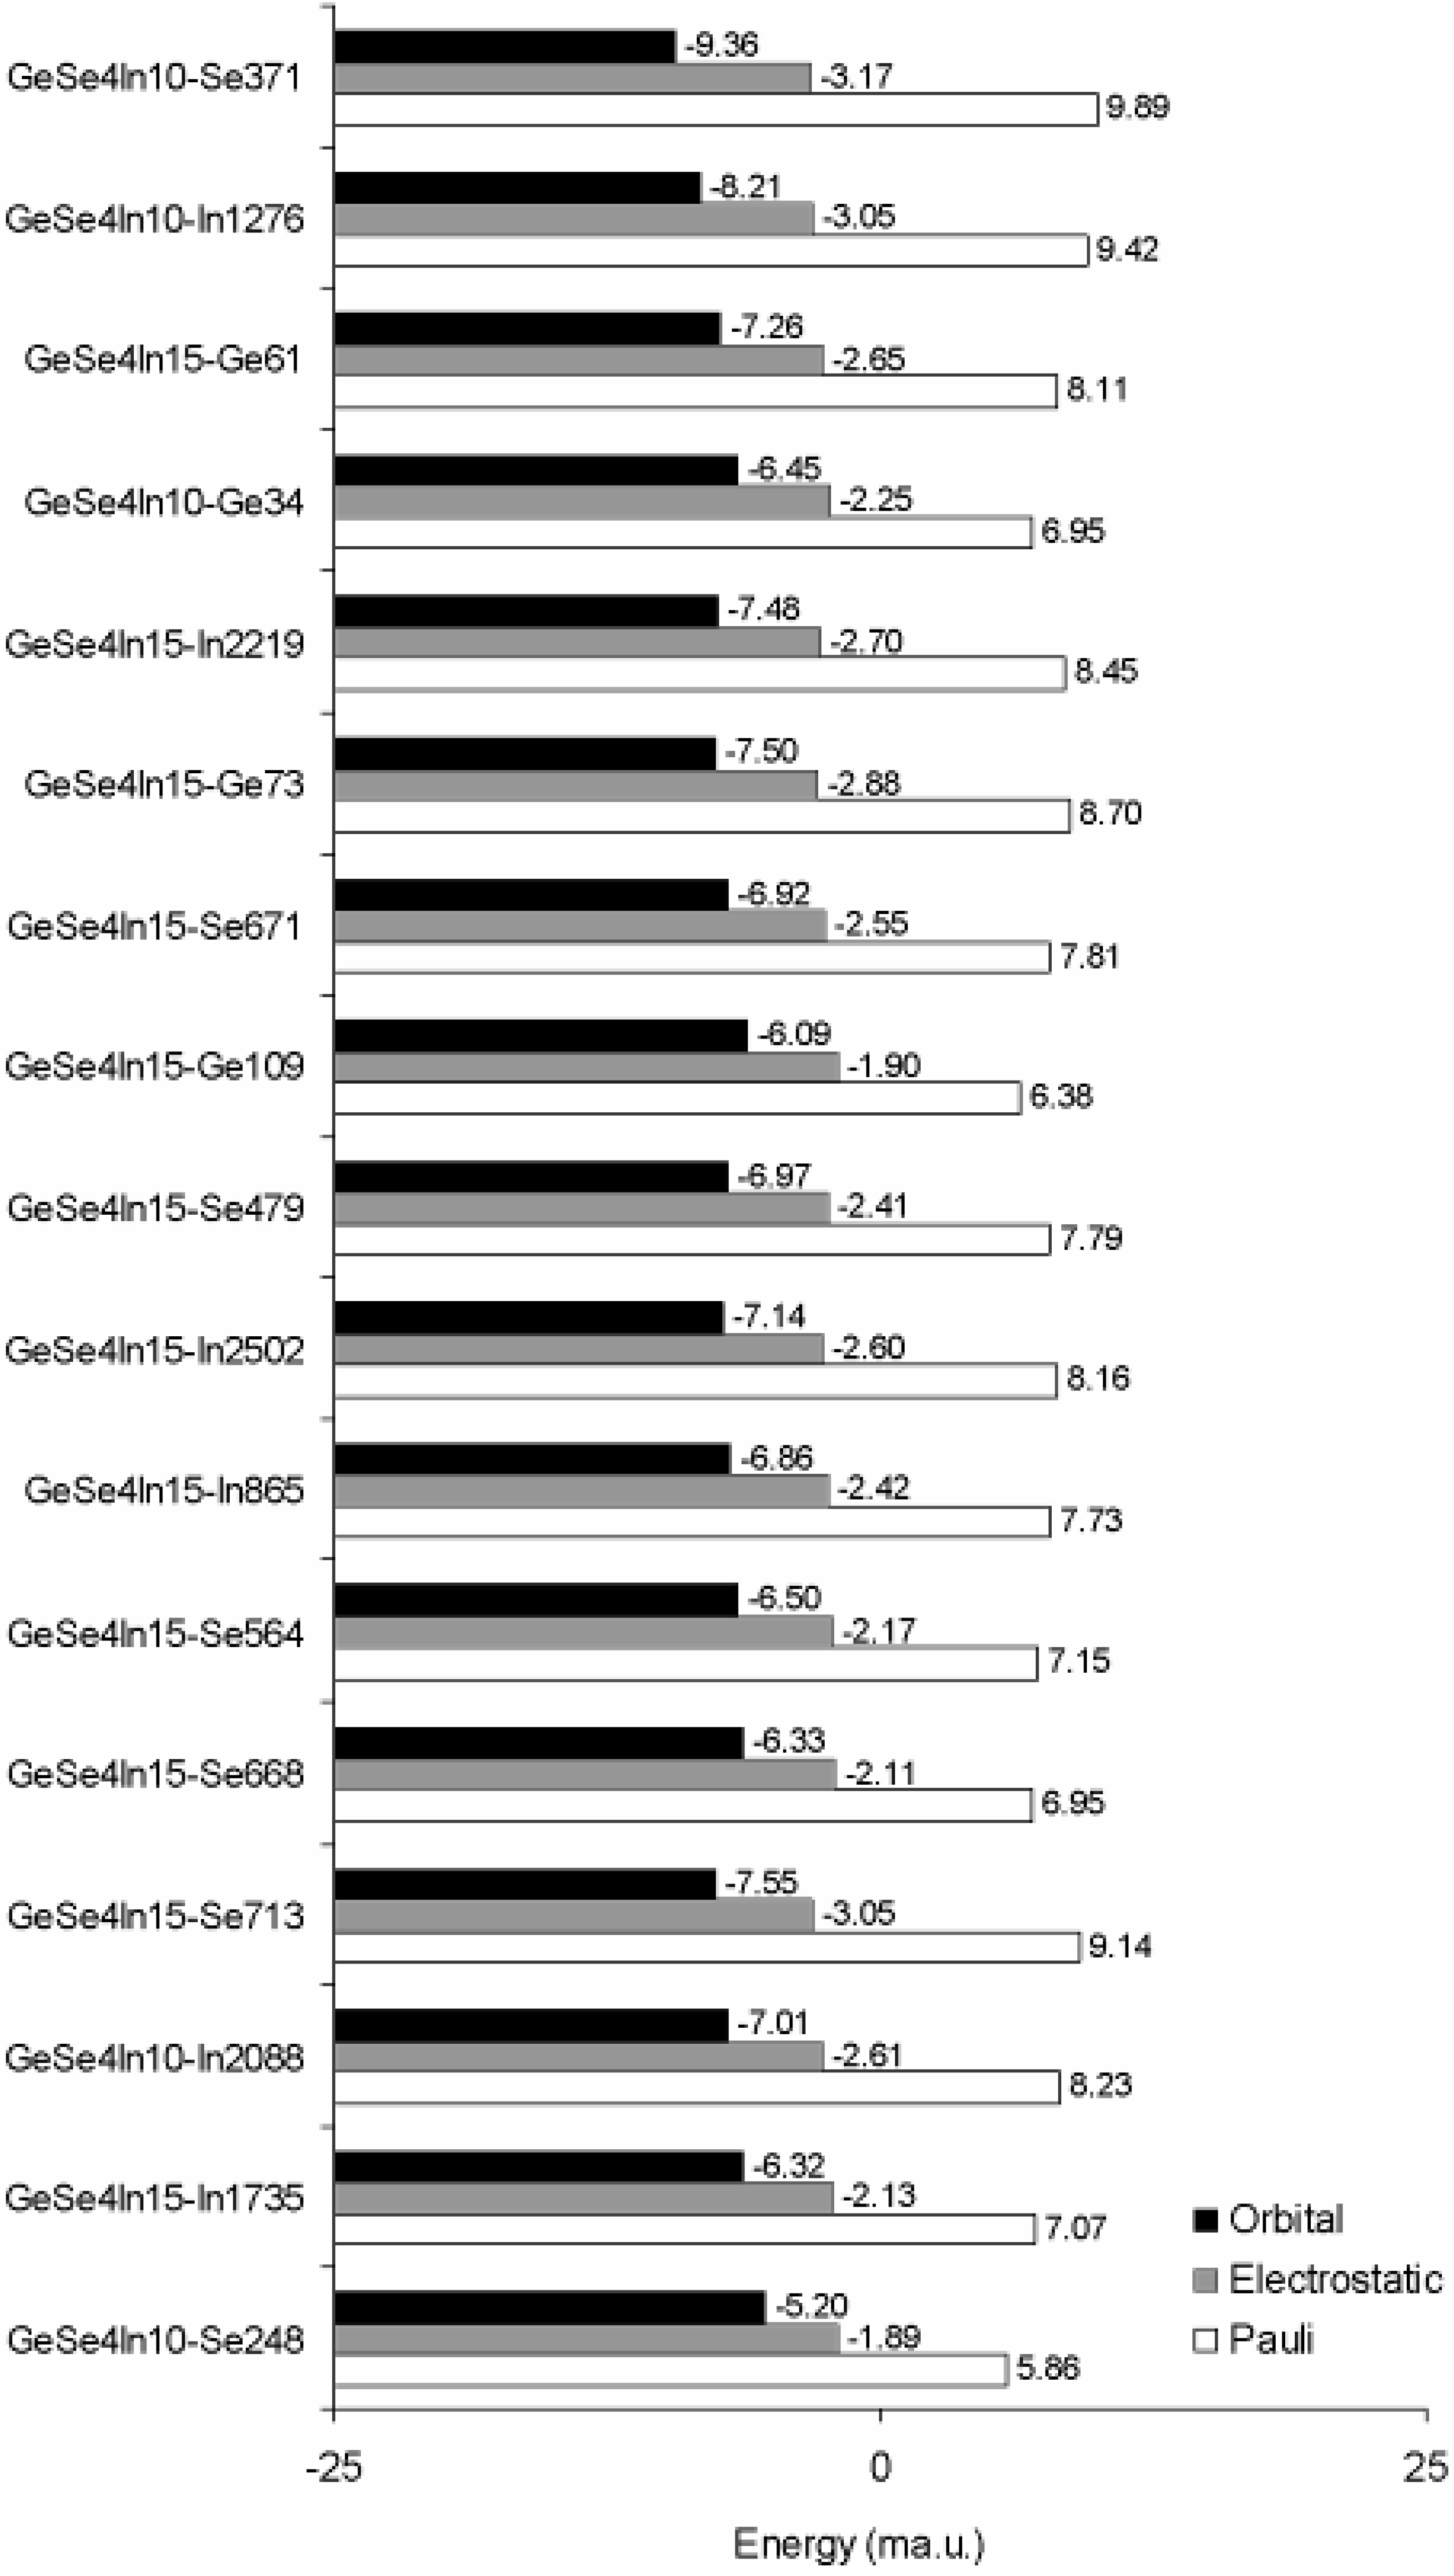
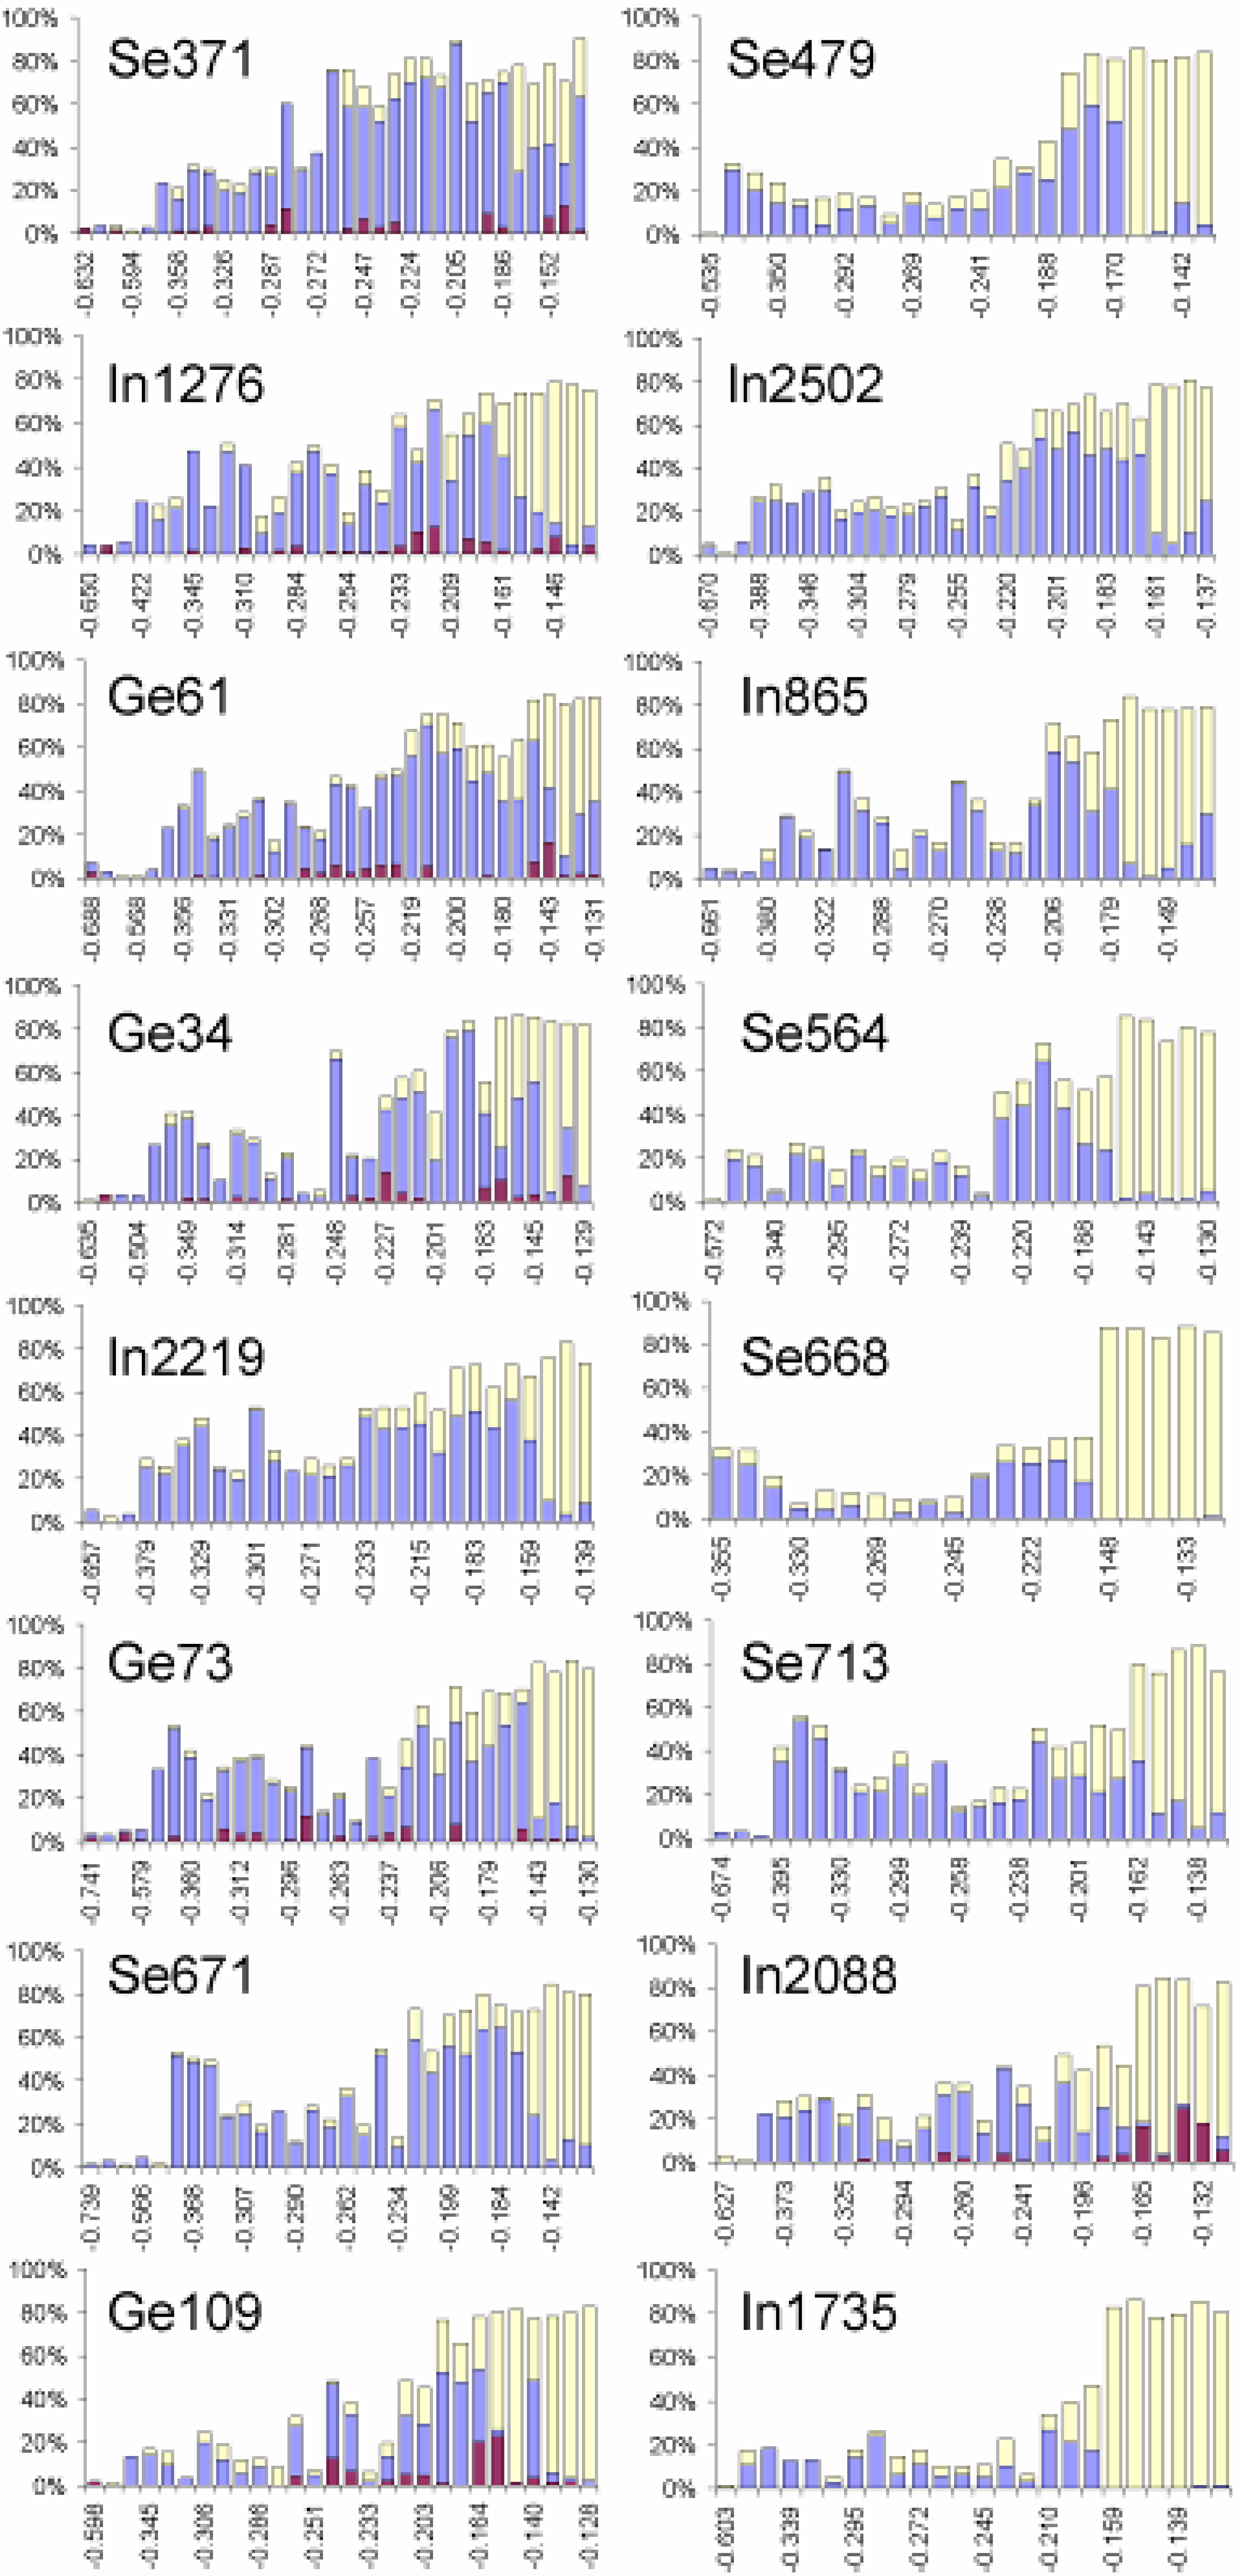
3.3. Binding Energy Decomposition and Molecular Orbital Interactions

In our previous study of covalent glasses, it was shown that the ground state of isolated metallic clusters was best described by negatively charged moieties [18] of rather high spin multiplicities (typically up to 12). Cluster relaxation was as a matter of principle not possible under charge neutrality, and it, thus, required charge compensations accompanied by spin polarization. In the current study we have required that all clusters be charge-neutral, spin-unpolarized moieties if possible, while we have considered the lowest spin multiplets for clusters for which charge neutrality demanded spin compensation. As it turned out, the majority of the clusters considered did, in fact, relax at lower energy states under the effect of spin polarization. Cluster spin polarization and binding energy decomposition is listed in Table 4 and the decomposition of cluster binding energy into its constituent Pauli, electrostatic and orbital interaction energies is presented in Figure 5. The principal feature of cluster stability was the extent of orbital interactions energy. Secondarily, the difference between orbital interactions and Pauli repulsion could also be correlated to cluster stability. Invariably, electrostatic interactions were not deemed to be monotonically related to the stability of the complexes studied.
Table 4. Spin polarization, number of electrons, Ne, and binding energy decomposition for the clusters studied.
Cluster nameSpin polarizationNePauli (a.u.)Electrostatic (a.u.)Orbital Interactions (a.u.)
GeSe4In10-Se37115265.201−1.666−4.925
GeSe4In10-In127616736.341−2.053−5.522
GeSe4In15-Ge6117416.011−1.966−5.379
GeSe4In10-Ge3416884.781−1.545−4.439
GeSe4In15-In221916755.701−1.823−5.046
GeSe4In15-Ge7317076.151−2.035−5.304
GeSe4In15-Se67116755.269−1.721−4.671
GeSe4In15-Ge10917374.701−1.401−4.491
GeSe4In15-Se47906074.729−1.465−4.231
GeSe4In15-In250218226.708−2.134−5.866
GeSe4In15-In86506905.335−1.673−4.737
GeSe4In15-Se56417055.040−1.528−4.586
GeSe4In15-Se66805733.983−1.207−3.626
GeSe4In15-Se71316415.860−1.955−4.839
GeSe4In10-In208807376.065−1.924−5.166
GeSe4In15-In173507205.094−1.535−4.551
GeSe4In10-Se24816884.032−1.301−3.576
A rather more concrete measure of cluster stability, however, was highlighted by cluster center coordination. Cluster binding energy in respect to the center’s Se and In coordination numbers is shown in Figure 6, where coordination by Ge atoms was not included as Ge content was too low to provide meaningful statistics. Based on the trends shown in Figure 6, it became clear that cluster stability (regardless of the position and the species type of cluster center) was fundamentally correlated to coordination by Se. As laid out in 3.1, order within the first coordination shell involved the Ge–Se and Se–In partials while the effect of In came into effect beyond the first shell. Therefore, we deem that Ge–Se and Se–In bonding promotes cluster stability and, correspondingly, the intervention of the In species which caused breaking of these bonds contributed towards a lower binding energy, also as shown in Figure 5.
Figure 5. Binding energy decomposition of the most representative clusters for both systems under study. From top to bottom, cluster energy is in ascending energy order (thus, clusters GeSe4In10-Se371 and GeSe4In10-Se248 are the most cohesive and least cohesive, respectively).
Metals 05 00102 g005
Figure 6. Cluster binding energy, normalized by the number of electrons in each cluster, in respect to the center’s partial coordination numbers by the Se and In species. Ge content was always too low to provide a meaningful trend on the same plot.
Metals 05 00102 g006
Atomic orbital t1u contributions for the most representative clusters under study are shown in Figure 7, as percentages of total molecular orbital density. There was no monotonic relationship between cluster binding energy and the contribution of atomic orbitals. At first glance, the participation of Ge in MO’s is not symptomatic to the system and in extension it is neither symptomatic to In content. Also, Ge contributions were not particular to the cluster center’s average coordination. However, in the GeSe4In10 system, Ge contributed towards higher lying MO’s while this was not the case in GeSe4In15. All high lying MO’s of the latter system either involved pure In contributions (e.g., see clusters Se668 and In1735 in Figure 7) or fractional valence contributions from Se mixed with major contributions from In (see clusters In2219, Se671, Se479, In2502, In865 and Se564 and Se713 in Figure 7). The competition between Ge and In conforms to a previously established observation that at high effective In concentrations, In atoms tend to engage Ge atoms by entering into GeSe4/2 tetrahedra and adopting Ge–In bonds [10]. However, the landmark feature of both systems was the cooperation between Se and In. We consider this to be reminiscent of In2Se3 structural units, as these have been frequently mentioned as responsible for short-range ordering in a wide range of glasses [26]. Gradual addition of Indium to these glasses has been reported as responsible for the replacement of stronger Ge–Se bonds by weaker Ge–Ge interactions towards formation of In2Se3 units [10] or towards the substitution of lone Se atoms in (Se)n chains [2]. As we have already reported in [27], Indium saturation of Se bonds is more effective at high In/Se ratios. At lower ratios, such as the GeSe4In10 system, the effect of Ge–Se cooperation is swift to set back in and a depiction of this is provided in Figure 6 by the GeSe4In10 clusters. This trend is also on a par with observations that increasing Ge/Se ratios caused the replacement of Se–Se and Se–In bonds by Ge–Ge, Ge–Se and Ge–In bonds [28] while increasing In content saturates Se–In bonds at the expense of Ge [6].
Figure 7. Atomic orbital t1u contributions as a percentage of total molecular orbital density for the most representative clusters under study. Color notation is as follows: Ge, dark red; Se, light blue; and In, light yellow.
Metals 05 00102 g007

4. Conclusions

The combined analysis of RMC atomic environment statistics and DFT study of a number of representative clusters of the GeSe4In10 and GeSe4In15 glasses allowed the following conclusions to be drawn:
(1)
The extra In content of the GeSe4In15 system appeared to have substantially demoted contributions from Ge–Se in favor of Se–In, which shaped the shell almost exclusively. The role of Se–Se was faint, in similarity to GeSe4In10.
(2)
In both glasses studied, interactions beyond the first coordination shell revealed great similarity among the shapes of the partials involved. The Se–In partial was instrumental towards second coordination shell formation; Ge–In contributed only fractionally towards second coordination and this behavior was common to both alloys. Third shell interatomic interactions comprised two overlapping peaks at 3.3 and 3.5 Å due to Se–In and In–In interactions.
(3)
The excess In content in GeSe4In15 mediated the formation of rich Ge-centered clusters at radial distances further than 4 Å from the RMC center, an effect which also flagged the reduction of bonding between Ge and Se near the RMC center.
(4)
Ge–Se and Se–In bonding promoted overall cluster stability and the intervention of excess In caused breaking of these bonds contributed towards a lower binding energy.
(5)
The introduction of excess In resulted in higher Se–In cooperation towards frontier orbitals. Direct interactions between Ge and In were scarce and limited to the GeSe4In10 glass. On the whole, Ge and Se competed for connectivity with Se over the whole range of valence electron energies; however, Indium, particularly in the GeSe4In15 system, was far more effective in bonding with Se.

Author Contributions

EH and GA designed the analysis methodology, interpreted the results and wrote the paper. EM and GA performed the analysis. All authors discussed on the paper throughout all of the stages.

Conflicts of Interest

The authors declare no conflict of interest.

References

  1. Saffarini, G.; Saiter, J.M.; Schmitt, H. The composition dependence of the optical band gap in Ge–Se–In thin films. Opt. Mater. 2007, 29, 1143–1147. [Google Scholar] [CrossRef]
  2. Kumar, A.; Husain, M.; Swarup, S.; Nigam, A.N.; Kumar, A. X-ray spectroscopic studies in glassy semiconducting Ge20Se80 and Ge20Se80-xInx alloys. Physica B 1990, 162, 177–180. [Google Scholar] [CrossRef]
  3. Dejus, R.J.; Susman, S.; Volin, K.J.; Montague, D.G.; Price, D.L. Structure of vitreous AgGeSe. J. Non-Cryst. Solids 1992, 143, 162–180. [Google Scholar] [CrossRef]
  4. Usuki, T.; Uemura, O.; Fujimura, K.; Kameda, Y. Local arrangement in Ge-Se-In glasses. J. Non-Cryst. Solids 1995, 192–193, 69–73. [Google Scholar] [CrossRef]
  5. Conde Garrido, J.M.; Ureña, M.A.; Arcondo, B. Ion selective electrodes based on chalcogenide glasses. J. Alloys Compd. 2010, 495, 356–359. [Google Scholar] [CrossRef]
  6. Sharma, I.; Tripathi, S.K.; Monga, A.; Barman, P.B. Electrical properties of a-Ge-Se-In thin films. J. Non-Cryst. Solids 2008, 354, 3215–3219. [Google Scholar] [CrossRef]
  7. Goyal, D.R.; Maan, A.S. Far-infrared absorption in amorphous Sb15GexSe85−x glasses. J. Non-Cryst. Solids 1995, 183, 182–185. [Google Scholar] [CrossRef]
  8. Tohge, N.; Minami, T.; Yamamoto, Y.; Tanaka, M. Electrical and optical properties of n-type semiconducting chalcogenide glasses in the system Ge-Bi-Se. J. Appl. Phys. 1980, 51, 1048–1053. [Google Scholar] [CrossRef]
  9. Giridhar, A.; Mahadevan, S. The Tg versus Z dependence of glasses of the Ge-In-Se system. J. Non-Cryst. Solids 1992, 151, 245–252. [Google Scholar] [CrossRef]
  10. Rabinal, M.K.; Sangunni, K.S.; Gopal, E.S.R. Chemical ordering in Ge20Se80−xInx glasses. J. Non-Cryst. Solids 1995, 188, 98–106. [Google Scholar] [CrossRef]
  11. Tanaka, K. Structural phase transitions in chalcogenide glasses. Phys. Review B 1989, 39, 1270–1279. [Google Scholar] [CrossRef]
  12. Liang, Z. Chemical bond approach to the chalcogenide glass forming tendency. J. Non-Cryst. Solids 1991, 127, 298–305. [Google Scholar] [CrossRef]
  13. Kaban, I.; Jovari, P.; Petkova, T.; Petkov, P.; Stoilova, A.; Hoyer, W.; Beuneu, B. Structure of GeSe4-In and GeSe5-In glasses. J. Phys. Condens. Matter 2010, 22, 404205. [Google Scholar] [CrossRef] [PubMed]
  14. Faber, T.E.; Ziman, J.M. A theory of the electrical properties of liquid metals. Philos. Mag. 1965, 11, 153–173. [Google Scholar] [CrossRef]
  15. Gereben, O.; Pusztai, L. RMC_POT: A computer code for reverse Monte Carlo modeling the structure of disordered systems containing molecules of arbitrary complexity. J. Comput. Chem. 2012, 33, 2285–2291. [Google Scholar] [CrossRef] [PubMed]
  16. Saffarini, G. Fragmentation of Ge1−xSnxSe2 glasses. Solid State Commun. 1994, 10, 677–681. [Google Scholar] [CrossRef]
  17. Saffarini, G. Atomic density versus average coordination number in Ge–In–Se glasses. Phys. Status Solidi 1999, 2, 261–265. [Google Scholar] [CrossRef]
  18. Antipas, G.S.E. Molecular orbital interactions in glass-forming Zr70Cu30 liquid quasicrystals. J. Alloys Compd. 2013, 578, 565–570. [Google Scholar] [CrossRef]
  19. Becke, A.D. Density-functional exchange-energy approximation with correct asymptotic behavior. Phys. Rev. A 1988, 38, 3098–3100. [Google Scholar] [CrossRef]
  20. Lee, C.; Yang, W.; Parr, R.G. Development of the Colle-Salvetti correlation-energy formula into a functional of the electron density. Phys. Rev. B 1988, 37, 785–789. [Google Scholar] [CrossRef]
  21. Van Lenthe, E.; Baerends, E.J.; Snijders, J.G. Relativistic total energy using regular approximations. J. Chem. Phys. 1994, 101, 9783–9792. [Google Scholar] [CrossRef]
  22. Belanzoni, P.; van Lenthe, E.; Baerends, E.J. An evaluation of the density functional approach in the zero order regular approximation for relativistic effects: Magnetic interactions in small metal compounds. J. Chem. Phys. 2001, 114, 4421–4433. [Google Scholar] [CrossRef]
  23. Van Lenthe, E.; van der Avoird, A.; Wormer, P.E.S. Density functional calculations of molecular hyperfine interactions in the zero order regular approximation for relativistic effects. J. Chem. Phys. 1998, 108, 4783–4796. [Google Scholar]
  24. Amsterdam Density Functional Program; Vrije Universiteit: Amsterdam, The Netherlands, 2010.
  25. Salmon, P.S. Structure of liquids and glasses in the Ge–Se binary system. J. Non-Cryst. Solids 2007, 353, 2959–2974. [Google Scholar] [CrossRef]
  26. Ledru, J.; Saiter, J.M.; Saffarini, G.; Benazeth, S. An EXAFS investigation of the local order around indium in Ge–Se–In glasses. J. Non-Cryst. Solids 1998, 232–234, 634–637. [Google Scholar] [CrossRef]
  27. Antipas, G.S.E.; Mangiorou, E.; Hristoforou, E. Solute-solvent interactions and atomic cohesion in GeSe4 and GeSe4In5 metallic glasses. Mater. Res. Express 2014, 1, 015202. [Google Scholar] [CrossRef]
  28. Abdel-Rahim, M.A.; Hafiz, M.M.; El-Nahass, M.M.; Shamekh, A.M. Influence of composition on optical and electrical properties of Ge–Se–In thin films. Physica B 2007, 387, 383–391. [Google Scholar] [CrossRef]

