Article

Behavior of Two Dental Alloys as Ingot and Cast Crown in Artificial Saliva

by
Anca Porumb
1,
Santiago Brito-Garcia
2,
Julia Claudia Mirza-Rosca
2,3,* and
Anca Fratila
4
1
Dental Medicine Department, University of Oradea, 410068 Oradea, Romania
2
Mechanical Engineering Department, Las Palmas de Gran Canaria University, 35017 Tafira, Spain
3
Materials Engineering and Welding Department, Transilvania University of Brasov, 500036 Brasov, Romania
4
Dentistry and Nursing Department, Lucian Blaga University of Sibiu, 550024 Sibiu, Romania
*
Author to whom correspondence should be addressed.
Metals 2024, 14(4), 398; https://doi.org/10.3390/met14040398
Submission received: 23 February 2024 / Revised: 26 March 2024 / Accepted: 27 March 2024 / Published: 28 March 2024

Abstract

:
Dental alloys based on Co or Ni are commonly used in dentistry to fabricate dental prostheses, including crowns, bridges, and partial dentures, but even though both alloys are highly biocompatible, some patients may experience allergic reactions to nickel. This comparative study investigated the behavior of two dental alloys in the oral cavity, analyzing their microstructure, corrosion behavior, elastic modulus, hardness, and tensile strength for ingot and cast crowns. The microstructures of commercial Ni-Cr and Co-Cr samples were analyzed using optical microscopy, scanning electron microscopy (SEM), and X-Ray Diffraction (XRD); elastic modulus and corrosion behavior were determined after immersing the samples in artificial saliva. Ni-Cr alloy has a corrosion potential more negative than Co-Cr alloy; this means that the first alloy is more likely to undergo corrosion than the second alloy. Ni-Cr sample with a higher elastic modulus is generally more rigid and less flexible than Co-Cr sample with a lower elastic modulus. The analyzed Co-Cr alloy has a higher resistance to corrosion, resulting in a more esthetically pleasing and longer-lasting restoration. The Co-Cr alloy also has a lower density than the Ni-Cr alloy, which, combined with its strength-to-weight ratio, makes them ideal for partial dentures where the prosthesis needs to be lightweight. The Co-Cr alloy is more flexible than the Ni-Cr alloy, making it stronger and more durable. This makes them an ideal choice for dental prostheses that need to withstand high stresses and loads.

1. Introduction

The use of dental prostheses with metal frames dates to ancient civilizations including the Egyptians, Greeks, and Romans who manufactured dental reconstructions out of gold, silver, and other metals. Simple metal wires or plates were joined to false teeth in these early prostheses, which were simple and straightforward. But the widespread use of metal frameworks in dentistry did not start until the 18th century [1]. French dentist Pierre Fauchard developed a technique in 1728 for attaching prosthetic teeth to neighboring healthy teeth using gold wire. This method, referred to as the “bridge,” served as the model for contemporary dental bridges, which frequently incorporate metal frameworks to support the false teeth.
Beginning in the twentieth century, dental laboratories started to create metal alloys expressly for dental use, such as gold alloys. However, because gold is an expensive metal, other substitute alloys with lower costs and densities have also been created for tooth restoration (for instance, nickel and cobalt–chromium alloys). With the aid of these alloys, dental restorations that could withstand the strains of chewing and biting were made to be more robust and long-lasting. Today, metal frameworks from Ni-Cr (nickel–chromium) and Co-Cr (cobalt–chromium) dental alloys are commonly used in dentistry to fabricate dental prostheses, including crowns, bridges, and partial dentures.
The human body contains extremely little amounts of nickel; yet, elevated concentrations have the potential to be dangerous [2]. The Nickel Directive, which the European Union introduced in 1994, substantially strengthened the position against the inclusion of nickel in materials. The defined threshold is 0.5 μg/cm2/week, which applies to consumer goods containing nickel that come into prolonged and direct contact with the skin. The maximum allowable amount of nickel released from articles placed into pierced regions of the body is 0.2 μg/cm2/week [3]. Nickel is now thought to be a harmful element. It has been estimated that approximately 1 in 10 individuals have a nickel allergy [4]. The objective of this legislation was to set a maximum allowable level of nickel emission in order to prevent the development of primary nickel sensitization. However, given the vague symptoms of this allergy, it is plausible that the official number is underestimated and that there are more people who are allergic. Being exposed to nickel has been related to several systemic illnesses [5]. But the nickel–chromium alloys have the advantages of very good ceramic adhesion and easy processing; the predisposition to corrosion is highly dependent of chromium content [6] and the biocompatibility can be increased using new digital techniques of fabrication [7]. According to its composition and nature, the oral mucosa diffuses nickel ions more quickly than the skin does, and there is very little chance of sensitization inside the mouth [8]. As of this moment, Ni accumulations in the body are not documented.
Co-Cr alloys, on the other hand, are highly resistant to wear and corrosion [9], and are used primarily for anterior (front) teeth restorations where esthetics are important. Co-Cr alloys also have a high strength-to-weight ratio, making them ideal for partial dentures where the prosthesis needs to be lightweight, but their shear bond strength of porcelain is dependent on multiple firings [10], post treatment [11], technique of fabrication [12,13,14,15,16], and surface properties [17].
Both Ni-Cr and Co-Cr alloys can be cast or milled, allowing for the fabrication of precise dental restorations that closely match the shape and color of natural teeth. They are also compatible with a variety of dental ceramics, allowing for the creation of highly esthetic restorations that mimic the appearance of natural teeth. Overall, Ni-Cr and Co-Cr alloys are widely used in dentistry due to their biocompatibility, strength, durability, and esthetic qualities but there are few studies far available referring to the comparison among materials in terms of their properties [18].
The specific aim of this study was to compare two commercial dental alloys, one Co-Cr and other Ni-Cr, analyzing their microstructure, corrosion behavior, elastic modulus, and microhardness of ingot and cast crown in order to help clinicians to predict the appropriate behavior of them in oral cavity.

2. Materials and Methods

2.1. Selection and Samples Preparation

In order to carry out the study, samples in the form of cylindrical ingots of Ni-Cr alloy (Ivoclar Vivadent, Madrid, Spain) and Co-Cr (Jelenko Dental Alloys, San Diego, CA, USA) alloy with the composition presented in Table 1, were used.
As a preliminary step to the analysis techniques, several processes of sample preparation were carried out such as mounting in phenolic resin, cutting with a Buehler IsoMet 4000 precision saw (Chicago, IL, USA), polishing with the Struers TegraPol-11 polisher (Copenhagen, Denmark), and, finally, cleaning in an ultrasonic devise Ultrasons-HD (Selecta, Santiago de Compostela, Spain), as shown in Figure 1.

2.2. Microstructure

Metallography spatially arranges the various states, compounds, contaminants, and potential mechanical defects present in a metallic solid. The samples were prepared for metallographic analysis following the ASTM E3-11 (2017) standard [19]. Each sample was submerged in a solution containing 100 mL of water, 3 mL of hydrofluoric acid, and 6 mL of nitric acid for around 25 s. The OLYMPUS PME 3 microscope from Olympus Corp., Tokyo, Japan, was used for optical examinations of the etched surface. Scanning electron microscopy was applied to examine the samples (SEM, Zeiss Sigma 300 VP, Carl Zeiss, Jena, Germany) as indicating ISO/TS 21383:2021 [20]. Using the secondary electron detector, the SEM was run in high vacuum mode at a cathode voltage of 20 kV. (SE). Furthermore, Energy Dispersive X-ray (EDS) was used to ascertain the chemical make-up of the alloys following homogenization. The phase analysis of the materials was conducted using a Bruker™ D8 ADVANCE XRD diffractometer. The investigation utilized CuK radiation (1.5406 Å) with a step size of 0.02°, a power of 45 kV, and a current of 40 mA within the 2θ range of 20–100.

2.3. Electrochemical Tests

An electrochemical test was performed in an electrochemical standard 3-electrodes cell with a platinum counter electrode and saturated calomel reference electrode, following ISO 10271:2020 [21]. The samples were immersed for 24 h in artificial saliva (composition in g/L: 0.4 KCl; 0.4 NaCl; 0.9 CaCl·2H2O; 0.7 NaH2PO4·2H2O; 1.1 urea), and the corrosion measurements (corrosion potential and Electrochemical Impedance Spectroscopy) were performed using a BioLogic Essential SP-150 Potentiostat from Seyssinet-Pariset in France. “Potentio Electrochemical Impedance Spectroscopy” was chosen for the impedance measurements in a frequency range of 100 mHz to 100 KHz and with an AC potential amplitude of 20 mV. To analyze the behavior of the dental alloys in oral conditions, the impedance spectra were recorded at five different DC potentials in the range of −400 mV to +400 mV vs. SCE with a step of 200 mV, permitting the system to stabilize for 5 min at each potential. To represent the experimental data, Nyquist and Bode diagrams were utilized, and to simulate the results, equivalent circuits (EC) were employed [22].

2.4. Microhardness

Each sample underwent ten tests using the Future Tech FM-810 hardness tester from Kawasaki, Japan. The measurements were conducted with an applied force of 500 g and a dwell time of 15 s, following the guidelines of ISO 14577-1:2015 [23]. The iVicky program was utilized to automatically measure diagonal lengths and calculate Vickers microhardness values. Plotting was conducted to analyze the relationship between the number of indents generated and the hardness.

2.5. Tensile Test and 3-Point Bending Test

The Bose ElectroForce® 3100 testing apparatus (Framingham, MA, USA), sustaining an applied force of up to 20 N, was employed to conduct the tensile strength and three-point bending test, which conform to the ISO 22674:2022 [24] and ISO 7438:2020 [25] standards.

2.6. Statistical Analysis

Each sample underwent the experiment ten times, and the findings are shown as a mean standard deviation (SD). The Mann–Whitney U test, a non-parametric analysis, was employed to establish statistical significance. Statistics were deemed significant at p 0.05.

3. Results

3.1. Microstructure Analysis

A proper analysis of the microstructure of these samples requires an understanding of how grain size influences corrosion processes. Smaller grain sizes lead to higher critical current density, as grain boundaries store internal energy that promotes corrosion. Figure 2 displays images of the samples’ surfaces following etching. Once the electrochemical etching has been carried out, the crystalline structure of the Co-Cr sample and Ni-Cr sample can be seen (see Figure 2).
Scanning electron microscopy (SEM) and energy-dispersive X-ray spectroscopy (EDS) mapping are analytical techniques commonly used to study the microstructure and elemental composition of materials [26]. In the case of Ni-Cr and Co-Cr dental alloys, SEM and EDS mapping can provide valuable information on the distribution of elements within the alloy and the presence of any defects or inclusions (see Figure 3 and Figure 4).
The Ni-Cr alloy has a dendritic structure (see Figure 2a), characteristic of cast alloys, that forms upon solidification following medium- to high-speed cooling. The Ni-Cr alloy’s microstructure exhibits a uniform cellular pattern with distinct cellular boundaries. This occurred because of the quick solidification and intense temperature differences in the molten material as it was melting.
Usually, Ni-Cr alloys also contain (see Table 2), in smaller concentrations, Al, which is a hardening element, and Si, which is a deoxidizing element. This alloy constitutes a support for fused porcelain.
Analyzing the SEM Image for the Co-Cr alloy (see Figure 4), it can be observed to have a dendritic structure with homogeneous morphology.
The percentage of crystallinity is evaluated by previously estimating what percentage of the diffraction pattern will be amorphous, according to the percentage ratio between the area corresponding to the amorphous zone and the global area. Subsequently, measuring difference, the percentage of crystallinity is evaluated. The analysis of XRD spectra (Figure 5) shows that the Ni-Cr alloy has a predicted crystalline phase of 47.2% and the Co-Cr alloy has 23.4%.

3.2. Corrosion Potential

The corrosion potential of an alloy is the electrode potential at which the rate of corrosion of the alloy is in equilibrium with the rate of its corrosion protection. In other words, it is the voltage at which the corrosion of the alloy is neither accelerating nor slowing down, but is occurring at a steady, constant rate.
The corrosion potential (open circuit potential OCP) is an important parameter in materials science and corrosion engineering, as it provides information about the susceptibility of alloys to corrosion and the effectiveness of corrosion protection strategies. It is often used in the design and selection of materials for use in corrosive environments, as well as in the development of corrosion-resistant coatings and treatments.
In general, alloys with a higher corrosion potential are more resistant to corrosion than those with a lower potential.
From the data acquired, the curves of the two samples show completely different behaviors, since, under initial conditions, the values of the potentials differ by 200 mV (see Figure 6). Because the Ni-Cr alloy has a corrosion potential more negative than the Co-Cr alloy, it means that the first alloy is more likely to undergo corrosion than the second alloy. This is because the more negative the corrosion potential of an alloy, the more easily it will lose electrons and oxidize, leading to the formation of metal ions and ultimately to corrosion. Following three hours of immersion (see Table 3), the Ni-Cr sample’s corrosion potential abruptly dropped to −0.452 V, causing the oxidation of the sample. Moreover, the Ni-Cr sample’s potential began to rise until it attained a particular level of stability. In contrast, the Co-Cr sample’s potential marginally increased to −0.121 V as a result of the passivation of the dental material, and, therefore, no damage of the passive layer occurred [27,28]. It was reported that the presence of niobium in the composition of the Co-Cr alloy is important for increasing the corrosion resistance of the Co-Cr alloy [29].
Consequently, the qualitative passivation tendencies of the two samples were discovered after immersing the alloys in artificial saliva for 24 h.

3.3. Electrochemical Impedance Spectroscopy (EIS)

The potential of metallic materials in a patient’s mouth can vary because of several factors such as the composition of saliva, the presence of other metals in the mouth, the temperature of the oral cavity, and exposure to different chemical agents from food. These factors highlight the importance of considering the potential variation of metallic materials in the mouth when assessing the resistance of dental alloys to corrosion.
The potential values of dental alloys in the human mouth can vary widely depending on the microstructure, temperature, and chemical agents from the food, and generally ranges from −0.8 to −0.1 V for Ni-Cr and Co-Cr alloys. The electrochemical impedance spectroscopy method is a sophisticated technique utilized to assess the electrochemical system’s behavior. This is achieved by constructing an equivalent circuit that models the actual system. To gather additional information about the corrosion resistance characteristics of the dental alloys, measurements of the AC impedance were taken while immersing the surfaces of both metallic alloys in Artificial saliva at five different potential values, with a time for stabilization of 10 min at each potential. Bode diagrams were used to plot the logarithmic curves of the impedance modulus and phase angle against the logarithmic frequency of the Co-Cr and Ni-Cr samples. Figure 7a–d confirms that higher impedance and phase angle values are observed with more positive applied potentials, represented by the more negative and positive corrosion potential curves (see Table 4). This indicates that the Ni-Cr and Co-Cr corrosion processes occurred in a single stage, as observed in the Bode phase curves. Moreover, the phase angle increased with increasing potential values. As a result, the Co-Cr alloy exhibited greater corrosion resistance. The Nyquist plots were obtained to compare the fictitious impedance values to the actual values. Figure 7e,f displays a capacitive arc in each example, with a greater radio value for the Co-Cr sample.
Also, the experimental results were fitted with the simple circuit (R(QR)) presented in Figure 8, and the results of the adjustment are displayed in Table 5. The basic circuit was utilized to fit the experimental data that was gathered, and in this case, the parallel pairing of a resistor R1 and a constant phase element Q1 in series with the electrolyte resistance Rsol expresses the theoretical transfer function, Z(ω). Sweeping at high frequencies can be used to determine the value of the electrolyte resistance, or Rsol. R1 is a substitute for Rct, the charge transfer resistance. The interactions between the electrode and electrolyte at their interface are related to the capacitance of the double layer Cdl (Q1). To account for the heterogeneities of the passive film created on the metallic surface, a constant phase element (CPE) was selected rather than an ideal capacitance [30].
Boukamp has proposed an equation for the impedance of the Constant Phase Element [31]:
Z = (jω)−n Y0
This includes the following parameters: j, an imaginary number (j2 = −1); ω, the angular frequency in rad/s; Y0, the constant of the CPE expressed in S(s·rad−1)n; and n, the power number that indicates the deviation from ideal performance, and is equal to α(π/2) where α is the CPE’s constant phase angle in radians.
The presented data in Table 4 indicates that the Rsol value remained relatively constant throughout the experiment. This is likely due to factors that affect its value, such as the stability of the exposed surface and the concentration of ions in the artificial saliva solution, remaining unchanged. Both metallic alloys studied showed an increase in R1 value until 200 mV when exposed to the Artificial saliva, indicating an increase in the passive film’s thickness on the alloy’s surface. After 200 mV, the Ni-Cr alloy had the highest R1 value, indicating the highest resistance to corrosion and the lowest release rate of metallic ions into surrounding environment, likely because of the growth of a well-protected passive film. However, at all potentials up to 200 mV, the Co-Cr alloy demonstrated superior corrosion resistance (higher R1 value) compared to the Ni-Cr based alloys, which may be attributed to the growth of a more adherent Cr-rich passive oxide film on its surface.
The equivalent capacitance of the Constant Phase Element (CPE) was modelled as a non-ideal capacitor containing the capacitance of the layer C and a roughness factor n, using the formula:
C = (Y0R1)1/n/R1
The layer capacitance can be expressed with the following equation:
C = εε0A/d
where A is the testing area, d the layer thickness, ε the dielectric constant of the layer, and ε0 the free space permittivity. The value of ε was assumed to be independent of potential over the studied range.
So Y0 is inversely proportional to d and the reduction in Y0 for both alloys (see Table 5) indicates that dense oxide layer on the alloys’ surfaces become thicker by increase of the potential. The dielectric constants of the oxides formed on the surface of the alloys are very similar, 11.9 for NiO, 12 for Cr2O3, and 12.9 for CoO; and taking into account that Cr2O3 is the predominant oxide on the surface of both alloys studied, from Table 5 we can conclude that the thickness of the passive layer formed on Co-Cr alloy is at least two times greater than the thickness of the one formed on Ni-Cr alloy.

3.4. Microhardness

It is well recognized that a variety of factors, independent of the metal alloy employed for production, influence the hardness of created prostheses. According to reports, a prosthesis’s hardness can differ based on the fabrication process it uses, including milling, 3D printing, casting (which can vary depending on the mold used even when using the same casting procedure), and the rate at which the prosthesis cools down after casting. It has been shown that, as grain size increases during the alloy casting process, mechanical strength and surface hardness decrease, even though changes in grain size are independent to changes in yield strength and hardness in the case of gold alloys [32,33]. This study’s findings showed that, for both alloys, the hardness of the cast crown was much lower than the ingot’s (see Table 6). The casting technique utilized in this study was one that dental laboratories frequently employ to create cast crowns. As a result, when creating cast crowns for patients, each metal alloy may experience a reduction in hardness at a level comparable to what was previously described when comparing ingots. It is thought that for clinicians to anticipate the right mechanical qualities, they must be aware of this drop in hardness and tensile strength.

3.5. Bending Test and Tensile Test

A measurement of a material’s stiffness or elasticity is the Young’s modulus. In the elastic range of deformation, it is the ratio of stress to strain. Several testing techniques, such as tensile testing, compression testing, and three-point bending testing, can be used to estimate the Young’s modulus.
The three-point bending test is a frequently employed technique for figuring out a material’s Young’s modulus. A rectangular or cylindrical specimen of the material is supported by two points during this test, and a third point applies a load to the specimen’s center. A displacement sensor is used to measure the deflection that results from the specimen bending due to the load.
The Young’s modulus is calculated using the equation:
E = 4 F L π d 3 y
where:
  • E = Young’s modulus
  • F = force applied to the specimen
  • L = span between the supports
  • d = diameter or width of the specimen
  • y = deflection of the specimen at the center
Prior to performing the test, the specimen’s dimensions are measured, and it is then positioned on the supports. The load is then gradually applied to the specimen’s center until a maximum value is reached. Throughout the test, the deflection is measured at regular intervals. The weight is then removed.
Using the equation above, the Young’s modulus can be determined from the test data. The three-point bending test is a non-destructive testing technique, allowing the specimen to be used again for additional testing. It is also a relatively simple and inexpensive method, making it a popular choice for determining the Young’s modulus of a wide range of materials.
Thus, the null hypothesis that there would be similar microstructures and mechanical properties among the groups with different chemical composition was rejected.
This means that Ni-Cr sample with a higher elastic modulus (see Table 6) is generally more rigid and less flexible than Co-Cr sample with a lower elastic modulus. This is very important, taking into account that changing the internal design of a dental framework did not affect the elastic modulus or the percentage of elongation [34]. In both cases, the obtained elastic modulus is better than for other dental materials [35].

4. Conclusions

The biocompatibility of dental alloys can be affected by corrosion products, resulting from the exposure to a simulated body fluid and modifications to the corrosion potential in service. These factors may cause the liberation of metallic ions, leading to local swelling or systemic allergic responses in the surrounding tissue.
To investigate this, samples of commercial Co-Cr and Ni-Cr alloys were analyzed by exposing them to artificial saliva at different potentials and examining the growth of a passive oxide film using OCP and EIS spectra. The results obtained from these experiments are consistent with SEM and EDS analyses. EIS experiments were well-suited to a simplified standard equivalent circuit model with a single time constant. The data show that the Co-Cr alloy showed superior corrosion resistance compared to Ni-Cr alloys up to 200 mV, with resistance values increasing for both alloys as the potential grows.
Regardless of the population’s feeding habits or temperature, which can alter the potential of the dental prosthetic devices, the studied alloys exhibited excellent corrosion resistance. As a result, both alloys are recommended for treating patients with dental prostheses containing metal frameworks. For the older patients who already have Ni-Cr prostheses and have had no problems with them for years, they can be offered the same material with the certainty that there will be no galvanic corrosion (the electrochemical parameters of ingots and crowns are very similar). Upon comparative analysis, it was found that the Co-Cr alloy displays heightened resistance to corrosion, leading to dental restorations that are not only more aesthetically pleasing, but also have a longer life expectancy. Furthermore, the Co-Cr alloy boasts a lower density when compared to Ni-Cr alloy, which renders it a suitable choice for creating thinner and more visually appealing dental restorations. The flexibility of the Co-Cr alloy also surpasses that of Ni-Cr alloy, thereby improving its strength and durability. Consequently, the Co-Cr alloy is a preferred option for dental prostheses that require the ability to endure high stresses and loads.

Author Contributions

Conceptualization, J.C.M.-R. and A.P.; methodology, A.F.; software, S.B.-G.; validation, J.C.M.-R.; formal analysis, A.F.; investigation, A.F. and A.P.; data curation, A.F.; writing—original draft preparation, A.P.; writing—review and editing, J.C.M.-R.; visualization, S.B.-G. All authors have read and agreed to the published version of the manuscript.

Funding

This work was supported by the infrastructure of Cabildo de Gran Canaria, projects number CABINFR2019-07 and CABINFR2019-08.

Data Availability Statement

The original contributions presented in the study are included in the article, further inquiries can be directed to the corresponding author.

Conflicts of Interest

The authors declare there are no conflicts of interest relevant to this study.

References

  1. Marin, E. History of dental biomaterials: Biocompatibility, durability and still open challenges. Herit. Sci. 2023, 11, 207. [Google Scholar] [CrossRef]
  2. Cempel, M.; Nikel, G. Nickel: A review of its sources and environmental toxicology. Pol. J. Environ. Stud. 2006, 15, 375–382. [Google Scholar]
  3. Baker, M. European Standards Developed in Support of the European Union Nickel Directive. In Metal Allergy: From Dermatitis to Implant and Device Failure; Chen, J.K., Thyssen, J.P., Eds.; Springer International Publishing: Cham, Switzerland, 2018; pp. 23–29. ISBN 978-3-319-58503-1. [Google Scholar]
  4. Schäfer, T.; Böhler, E.; Ruhdorfer, S.; Weigl, L.; Wessner, D.; Filipiak, B.; Wichmann, H.E.; Ring, J. Epidemiology of contact allergy in adults. Allergy Eur. J. Allergy Clin. Immunol. 2001, 56, 1192–1196. [Google Scholar] [CrossRef] [PubMed]
  5. Denkhaus, E.; Salnikow, K. Nickel essentiality, toxicity, and carcinogenicity. Crit. Rev. Oncol. Hematol. 2002, 42, 35–56. [Google Scholar] [CrossRef] [PubMed]
  6. Garcia-Falcon, C.M.; Gil-Lopez, T.; Verdu-Vazquez, A.; Mirza-Rosca, J.C. Corrosion behavior in Ringer solution of several commercially used metal alloys. Anti-Corros. Methods Mater. 2021, 68, 324–330. [Google Scholar] [CrossRef]
  7. Yun, C.-S.; Hanawa, T.; Hong, M.-H.; Min, B.K.; Kwon, T.-Y. Biocompatibility of Ni–Cr alloys, with the same composition, prepared by two new digital manufacturing techniques. Mater. Lett. 2021, 305, 130761. [Google Scholar] [CrossRef]
  8. Waasdorp, M.; Krom, B.P.; Bikker, F.J.; van Zuijlen, P.P.M.; Niessen, F.B.; Gibbs, S. The bigger picture: Why oral mucosa heals better than skin. Biomolecules 2021, 11, 1165. [Google Scholar] [CrossRef] [PubMed]
  9. Garcia-Falcon, C.M.; Gil-Lopez, T.; Verdu-Vazquez, A.; Mirza-Rosca, J.C. Electrochemical characterization of some cobalt base alloys in Ringer solution. Mater. Chem. Phys. 2021, 260, 124164. [Google Scholar] [CrossRef]
  10. Ashtiani, A.H.; Mardasi, N.; Fathi, A. Effect of multiple firings on the shear bond strength of presintered cobalt-chromium alloy and veneering ceramic. J. Prosthet. Dent. 2021, 126, 803.e1–803.e6. [Google Scholar] [CrossRef]
  11. Zhou, Y.; Dong, X.; Li, N.; Yan, J. Effects of post-treatment on metal-ceramic bond properties of selective laser melted Co-Cr dental alloy. Part 1: Annealing temperature. J. Prosthet. Dent. 2023, 129, 657.e1–657.e9. [Google Scholar] [CrossRef]
  12. Aldhohrah, T.; Yang, J.; Guo, J.; Zhang, H.; Wang, Y. Ion release and biocompatibility of Co-Cr alloy fabricated by selective laser melting from recycled Co-Cr powder: An in vitro study. J. Prosthet. Dent. 2023, 130, 393–401. [Google Scholar] [CrossRef] [PubMed]
  13. Wu, M.; Dong, X.; Qu, Y.; Yan, J.; Li, N. Analysis of microstructure and fatigue of cast versus selective laser-melted dental Co-Cr alloy. J. Prosthet. Dent. 2022, 128, 218.e1–218.e7. [Google Scholar] [CrossRef] [PubMed]
  14. Şahin, M.; Ünalan, F.; Mutlu, İ. Corrosion, ion release, and surface hardness of Ti-6Al-4V and cobalt-chromium alloys produced by CAD-CAM milling and laser sintering. J. Prosthet. Dent. 2022, 128, 529.e1–529.e10. [Google Scholar] [CrossRef] [PubMed]
  15. Altuntas, M.C.; Guleryuz, A. Evaluation of the relationship between metallurgical properties and metal-ceramic bond characteristics of Co-Cr alloys manufactured by different techniques. Metals, 2023; 130, 937.e1–937.e10. [Google Scholar] [CrossRef]
  16. Chang, H.-S.; Peng, Y.-T.; Hung, W.-L.; Hsu, M.-L. Evaluation of marginal adaptation of Co Cr Mo metal crowns fabricated by traditional method and computer-aided technologies. J. Dent. Sci. 2019, 14, 288–294. [Google Scholar] [CrossRef] [PubMed]
  17. Xing, X.; Hu, Q.; Liu, Y.; Wang, Y.; Cheng, H. Comparative analysis of the surface properties and corrosion resistance of Co-Cr dental alloys fabricated by different methods. J. Prosthet. Dent. 2022, 127, 497.e1–497.e11. [Google Scholar] [CrossRef] [PubMed]
  18. Garcia-Falcon, C.M.; Gil-Lopez, T.; Verdu-Vazquez, A.; Mirza-Rosca, J.C. Analysis and Comparison of the Corrosive Behavior of Nickel-Based and Cobalt-Based Dental Alloys. Materials 2021, 14, 4949. [Google Scholar] [CrossRef] [PubMed]
  19. ASTM E3-11(2017); Standard Guide for Preparation of Metallographic Specimens. ASTM International: West Conshohocken, PA, USA, 2017.
  20. ISO/TS 21383:2021; Microbeam Analysis—Scanning Electron Microscopy—Qualification of The scanning Electron Microscope for Quantitative Measurements. ISO: Geneva, Switzerland, 2021.
  21. ISO 10271:2020; Dentistry—Corrosion Test Methods for Metallic Materials. ISO: Geneva, Switzerland, 2020.
  22. ISO 16773-1-4:2016; Electrochemical Impedance Spectroscopy (EIS) on Coated and Uncoated Metallic Specimens. ISO: Geneva, Switzerland, 2016.
  23. ISO 14577-1:2015; Metallic Materials—Instrumented Indentation Test for Hardness and Materials Parameters—Part 1: Test Method. ISO: Geneva, Switzerland, 2015.
  24. ISO 22674:2022; Dentistry—Metallic Materials for Fixed and Removable Restorations and Appliances. ISO: Geneva, Switzerland, 2022.
  25. ISO 7438:2020; Metallic Materials—Bend Test. International Organization for Standardization: Geneva, Switzerland, 2020.
  26. ASTM E 1508-12a (2019); Standard Guide for Quantitative Analysis by Energy-Dispersive Spectroscopy. American Society for Testing and Materials: West Conshohocken, PA, USA, 2019.
  27. Fratila, A.; Jimenez-Marcos, C.; Mirza-Rosca, J.C.; Saceleanu, A. Mechanical properties and biocompatibility of various cobalt chromium dental alloys. Mater. Chem. Phys. 2023, 304, 127867. [Google Scholar] [CrossRef]
  28. Mercieca, S.; Caligari Conti, M.; Buhagiar, J.; Camilleri, J. Assessment of corrosion resistance of cast cobalt- and nickel-chromium dental alloys in acidic environments. J. Appl. Biomater. Funct. Mater. 2018, 16, 47–54. [Google Scholar] [CrossRef]
  29. Jiménez-Marcos, C.; Mirza-Rosca, J.C.; Fratila, A.; Saceleanu, A. Influence and Comparison of the Properties of Three Cobalt-Chromium Dental Alloys. Microsc. Microanal. 2023, 29, 156–160. [Google Scholar] [CrossRef]
  30. Socorro-Perdomo, P.P.; Florido-Suárez, N.R.; Voiculescu, I.; Mirza-Rosca, J.C. Comparative eis study of alxcocrfeni alloys in ringer’s solution for medical instruments. Metals 2021, 11, 928. [Google Scholar] [CrossRef]
  31. BOUKAMP, B. A Nonlinear Least Squares Fit procedure for analysis of immittance data of electrochemical systems. Solid State Ionics 1986, 20, 31–44. [Google Scholar] [CrossRef]
  32. Øilo, M.; Nesse, H.; Lundberg, O.J.; Gjerdet, N.R. Mechanical properties of cobalt-chromium 3-unit fixed dental prostheses fabricated by casting, milling, and additive manufacturing. J. Prosthet. Dent. 2018, 120, 156.e1–156.e7. [Google Scholar] [CrossRef] [PubMed]
  33. Cha, M.S.; Lee, S.W.; Huh, Y.H.; Cho, L.R.; Park, C.J. Correlation between microhardness and wear resistance of dental alloys against monolithic zirconia. J. Adv. Prosthodont. 2021, 13, 127–135. [Google Scholar] [CrossRef]
  34. Ekren, O.; Kocak, E.F.; Ucar, Y. Effect of internal design changes on the mechanical properties of laser-sintered cobalt-chromium specimens. J. Prosthet. Dent. 2023, 129, 508–512. [Google Scholar] [CrossRef]
  35. Chun, K.J.; Lee, J.Y. Comparative study of mechanical properties of dental restorative materials and dental hard tissues in compressive loads. J. Dent. Biomech. 2014, 5, 1758736014555246. [Google Scholar] [CrossRef]
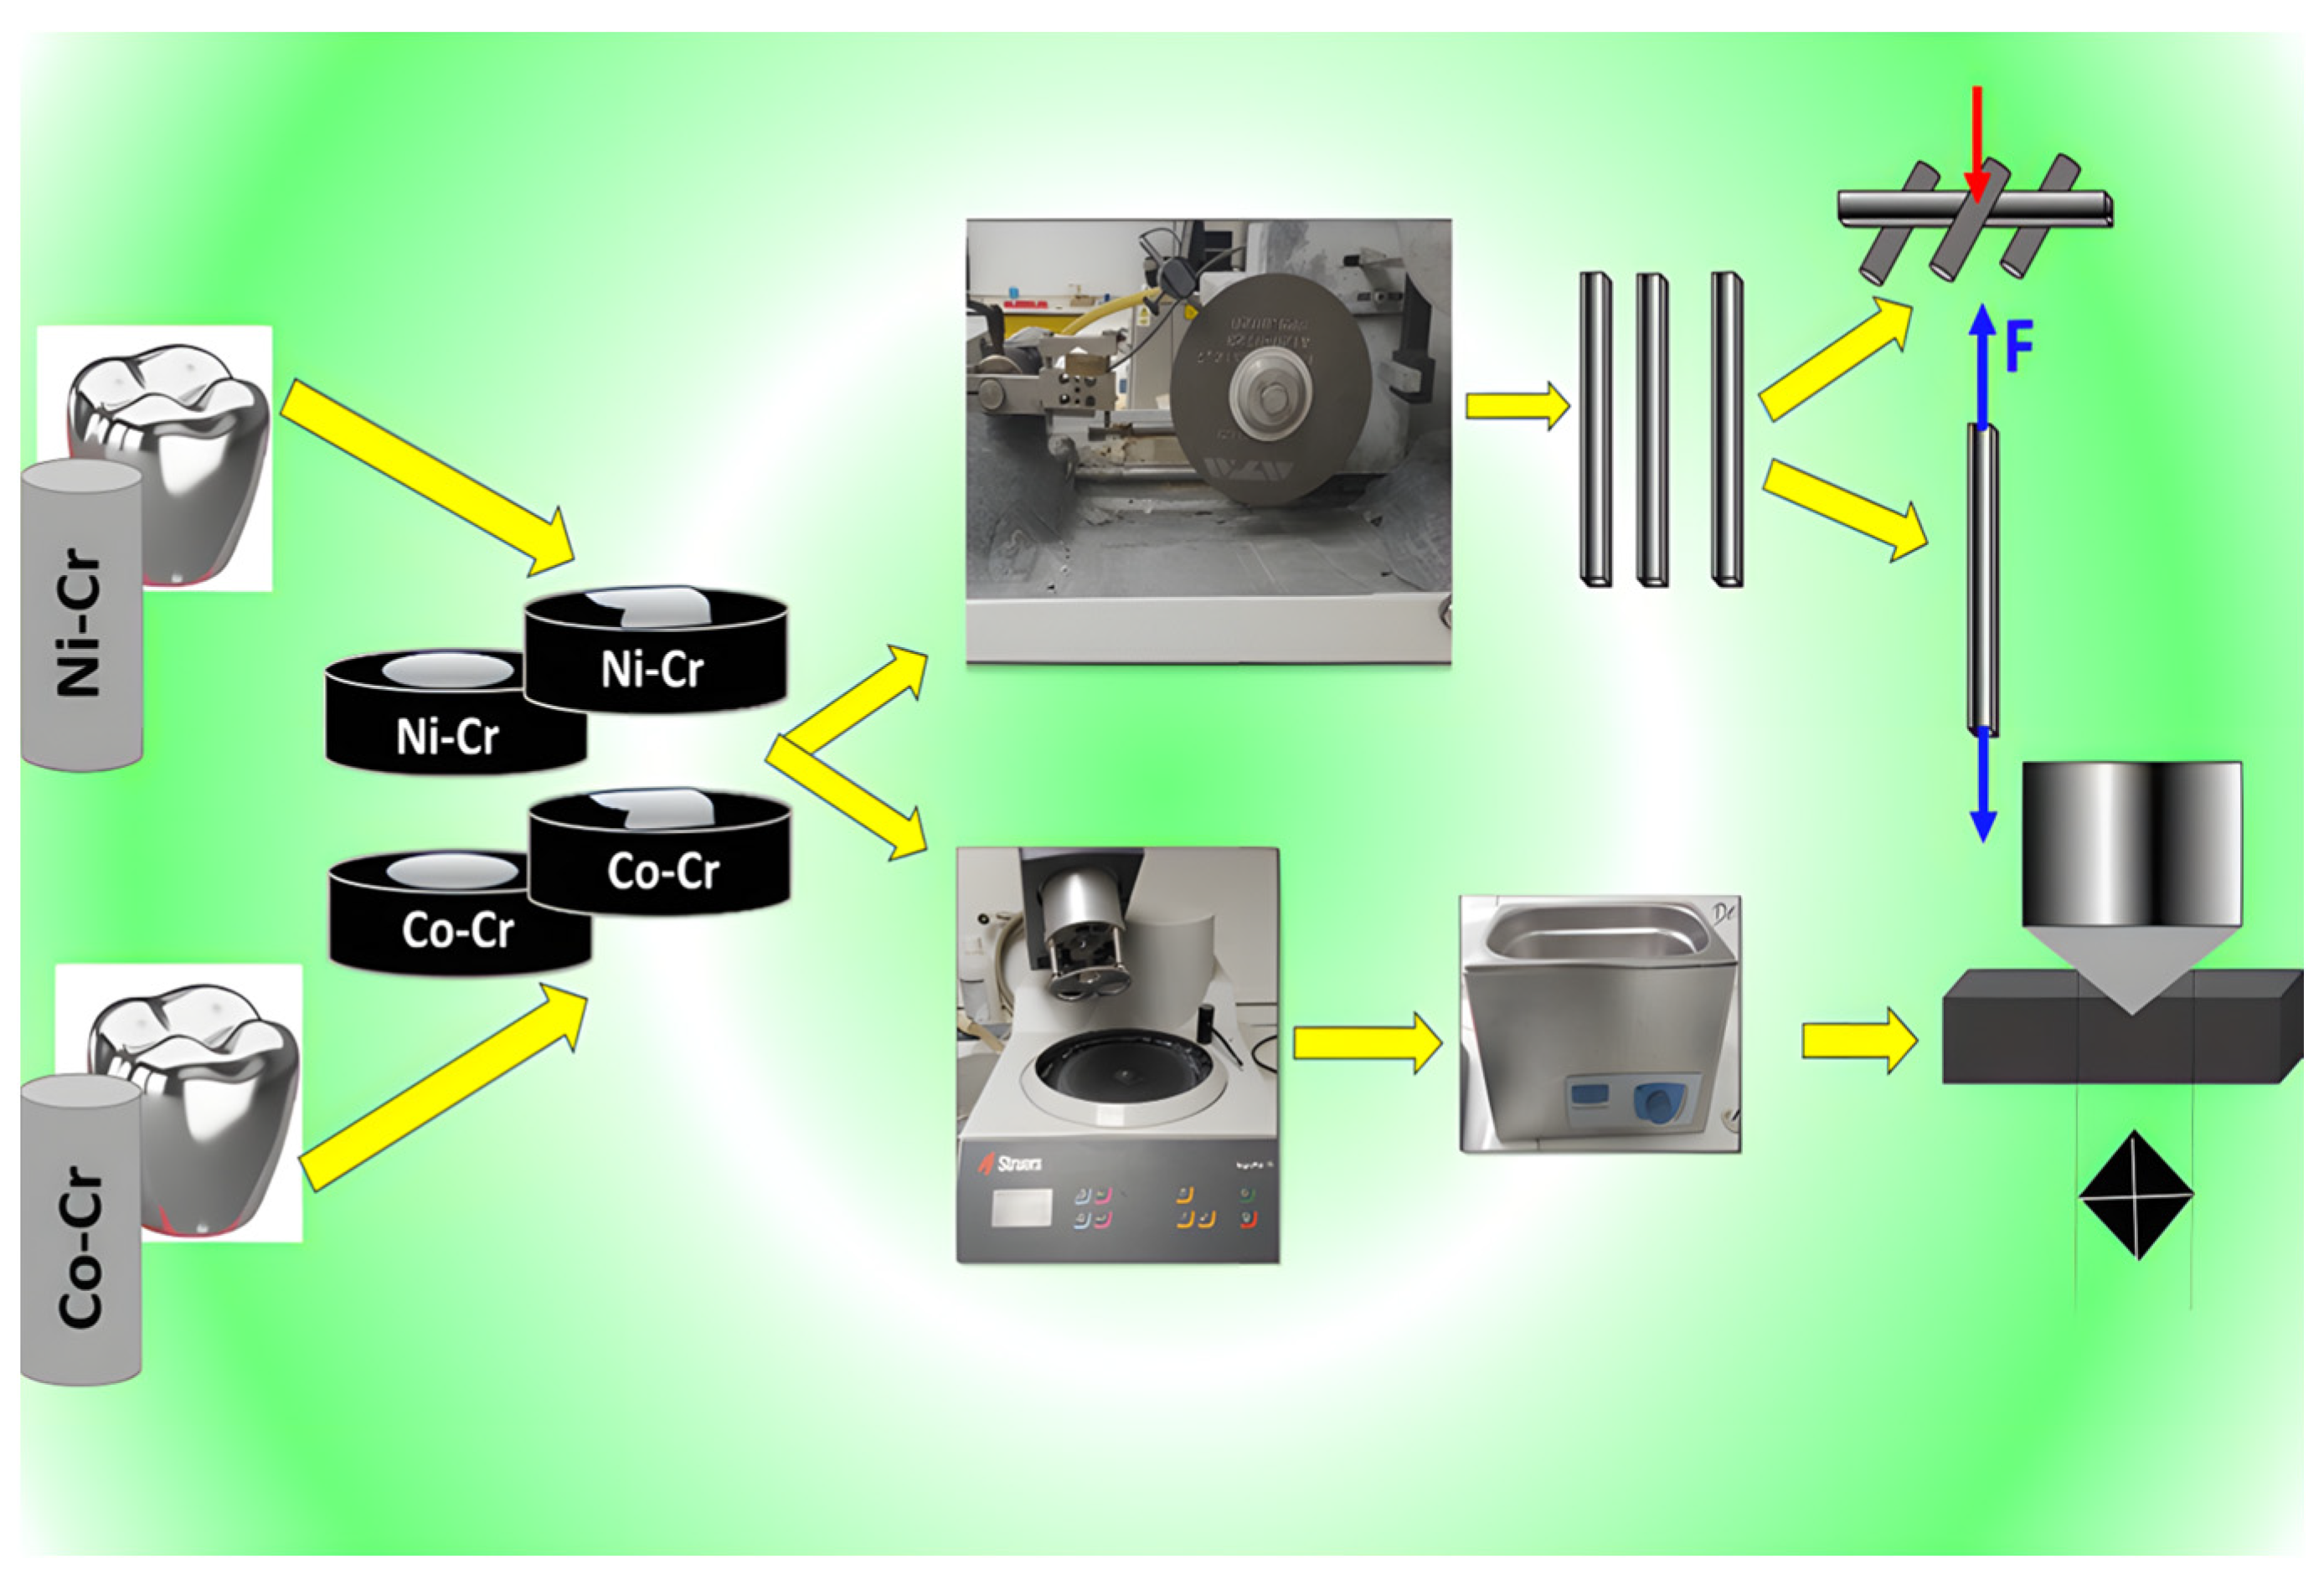
Figure 1. Graphic illustration of the material preparation.
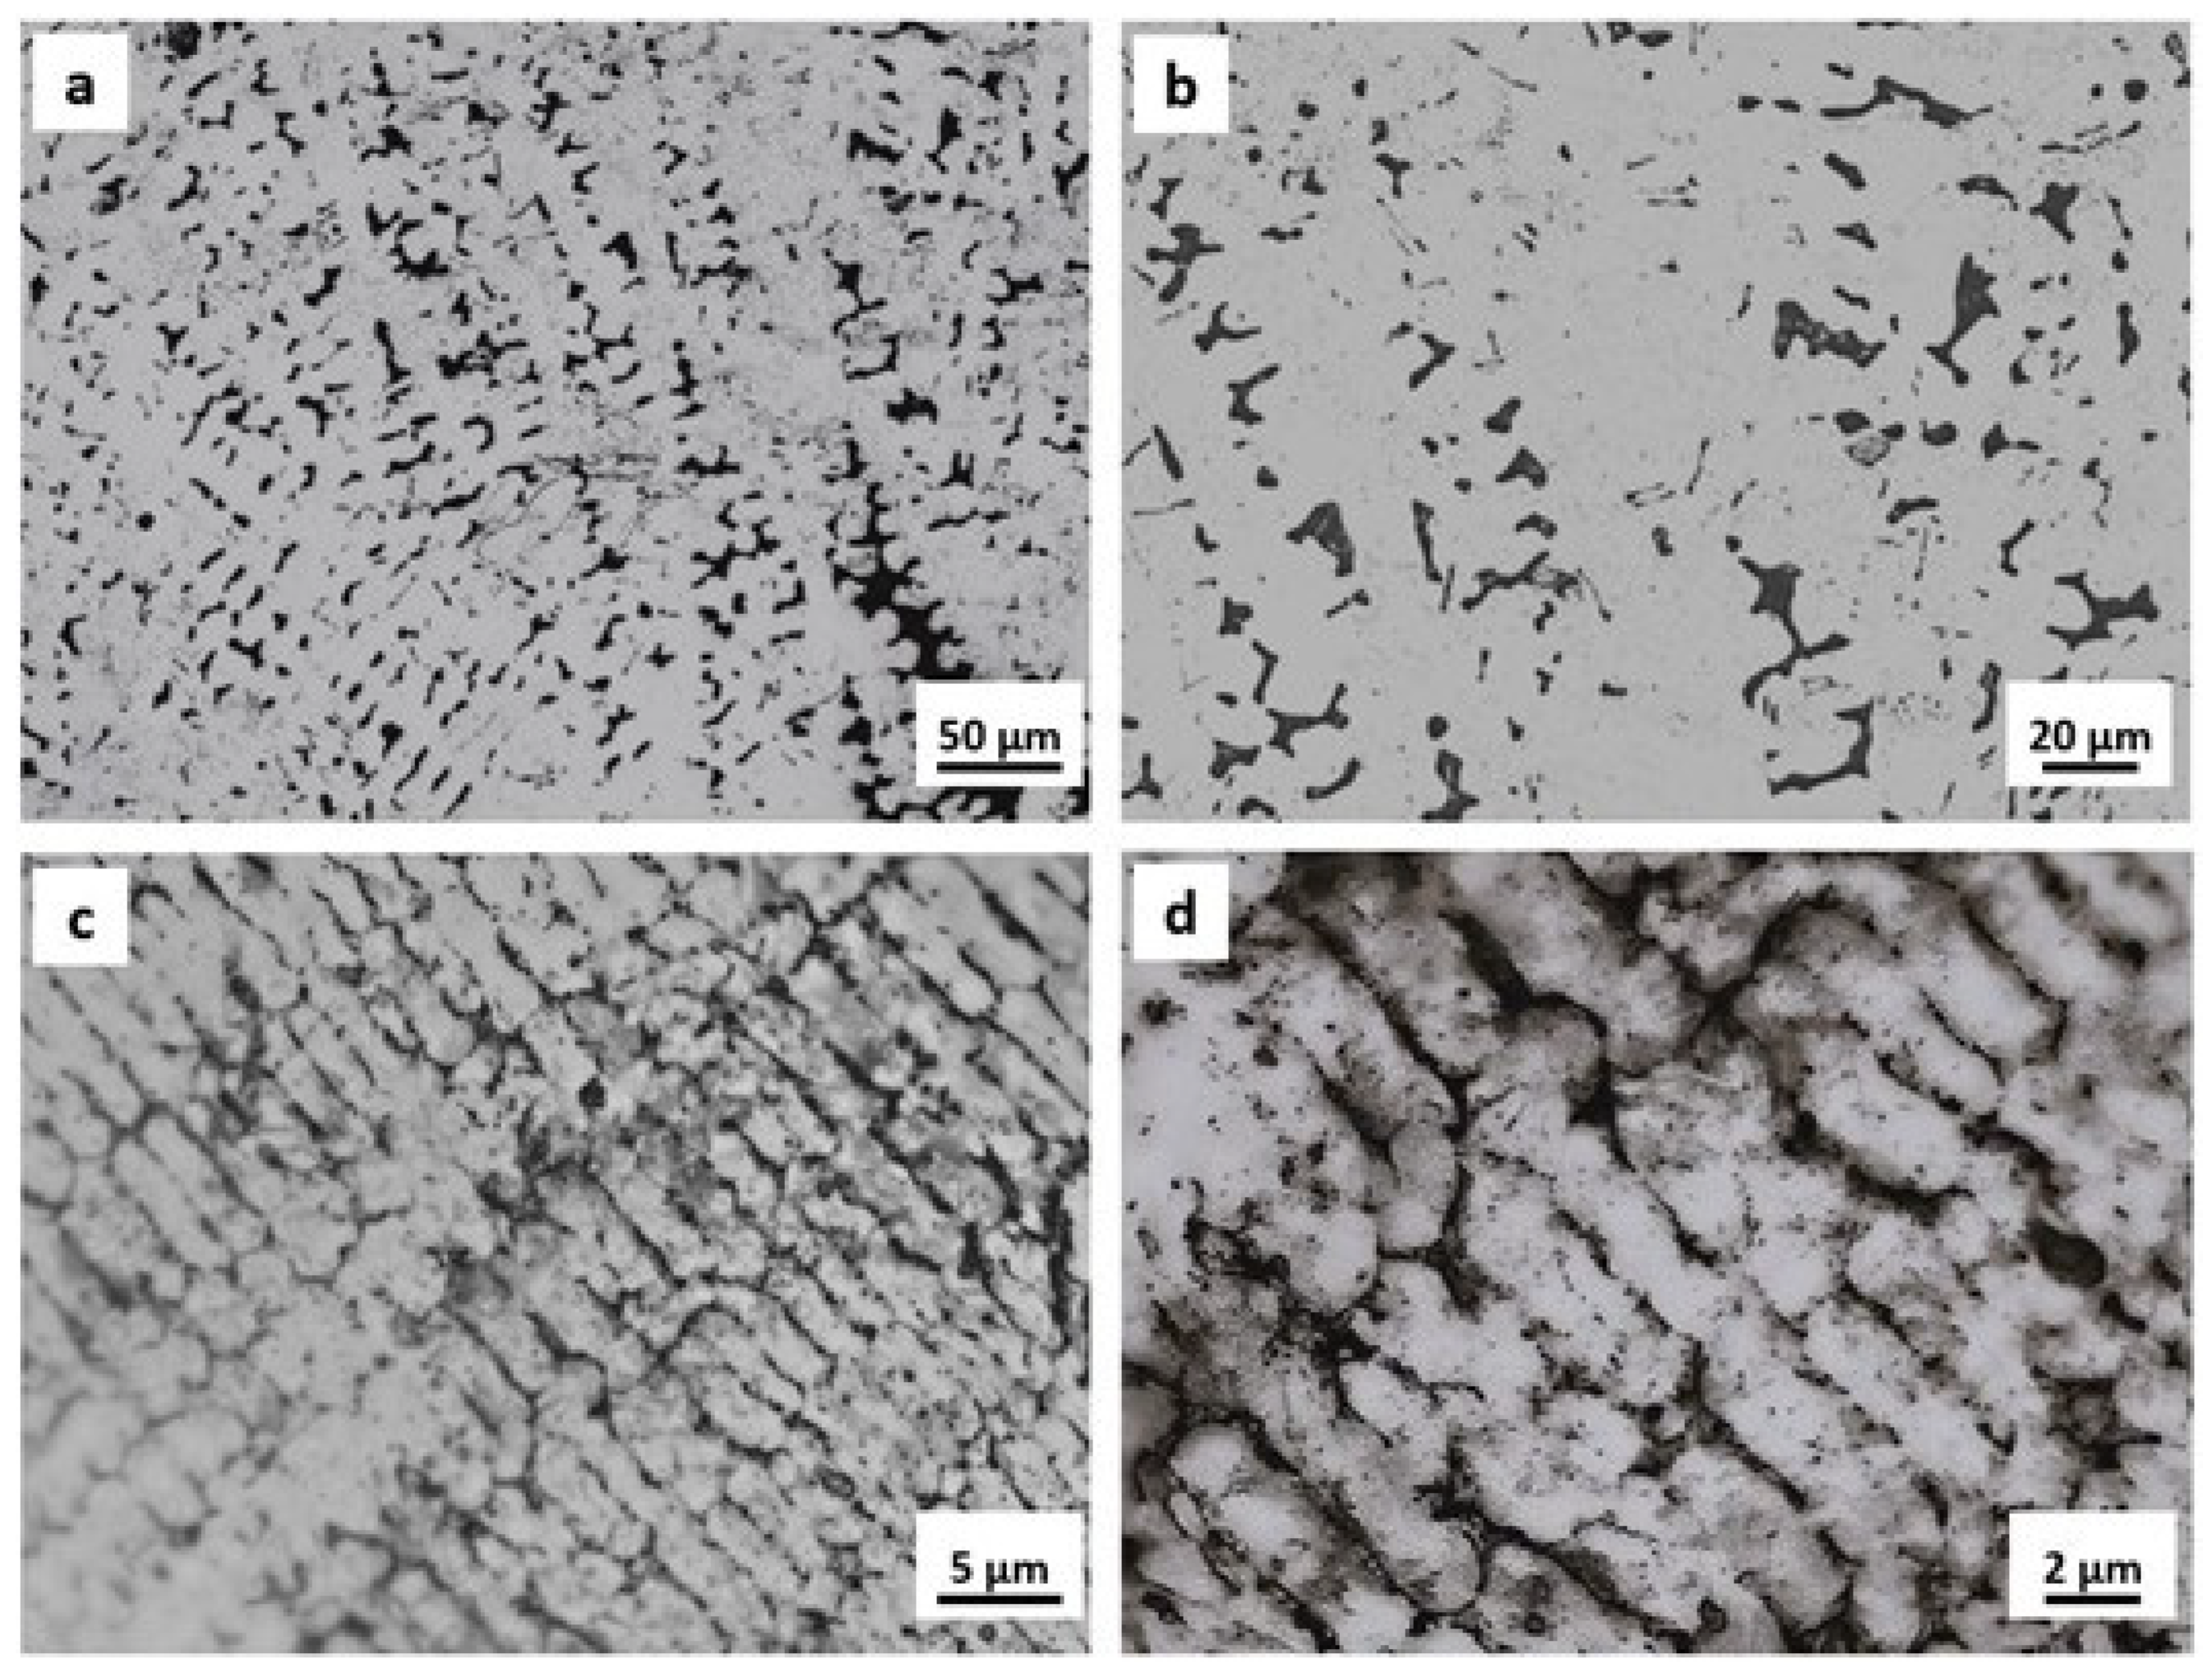
Metals 14 00398 g001
Figure 2. Optical microstructure after etching: for Ni-Cr sample (a,b) and for Co-Cr sample (c,d).
Metals 14 00398 g002
Figure 3. 
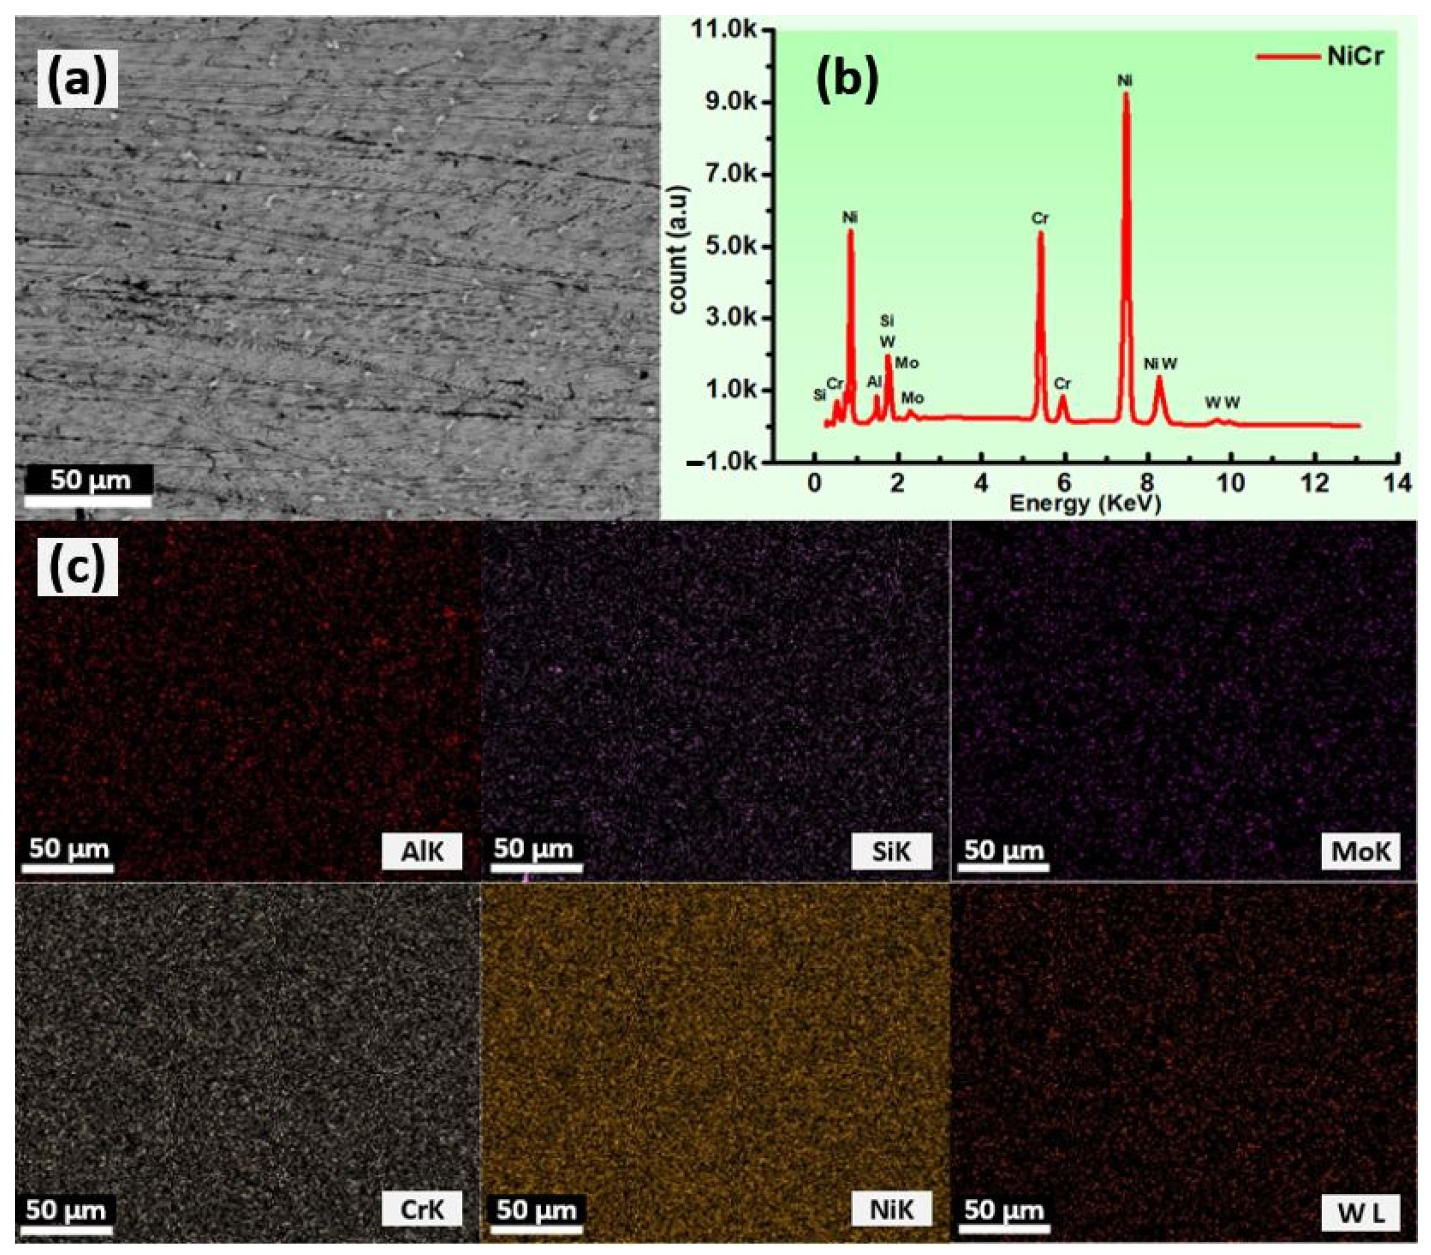
(a) Microstructure; (b) EDS on selected area; (c) elemental mapping of Ni-Cr sample.
Metals 14 00398 g003
Figure 4. 
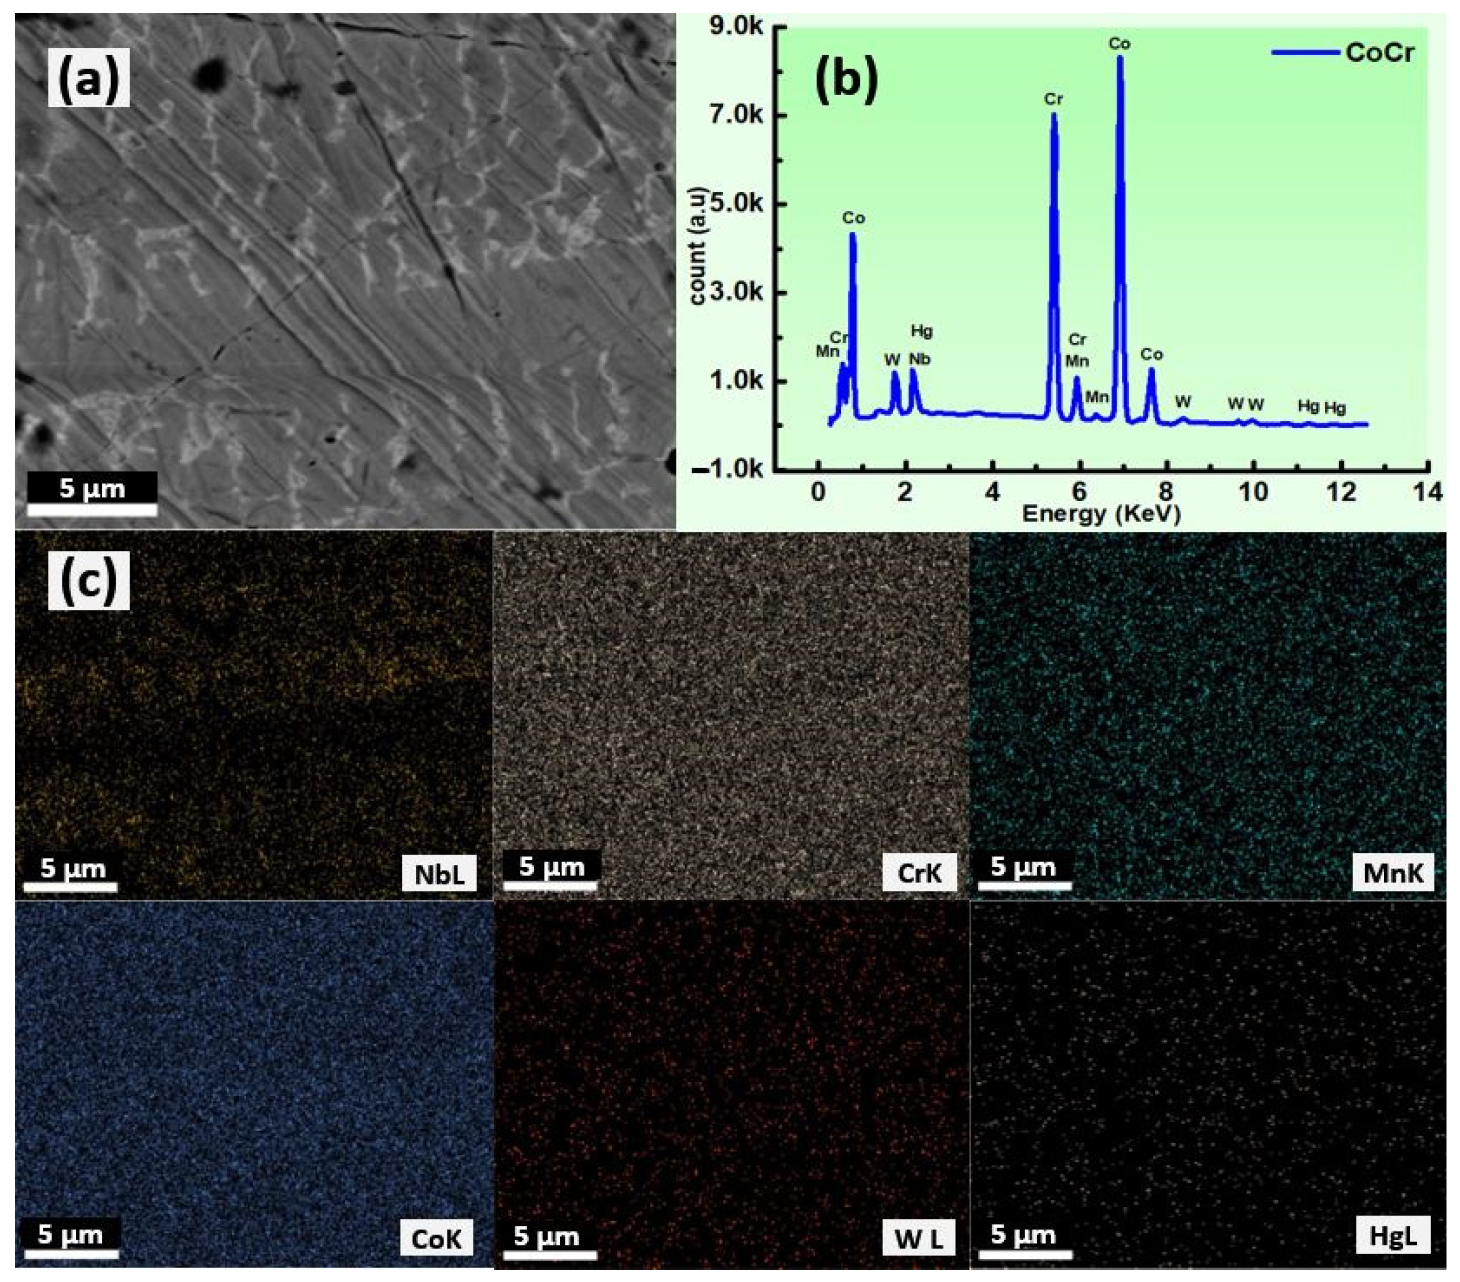
(a) Microstructure; (b) EDS on selected area; (c) elemental mapping of Co-Cr sample.
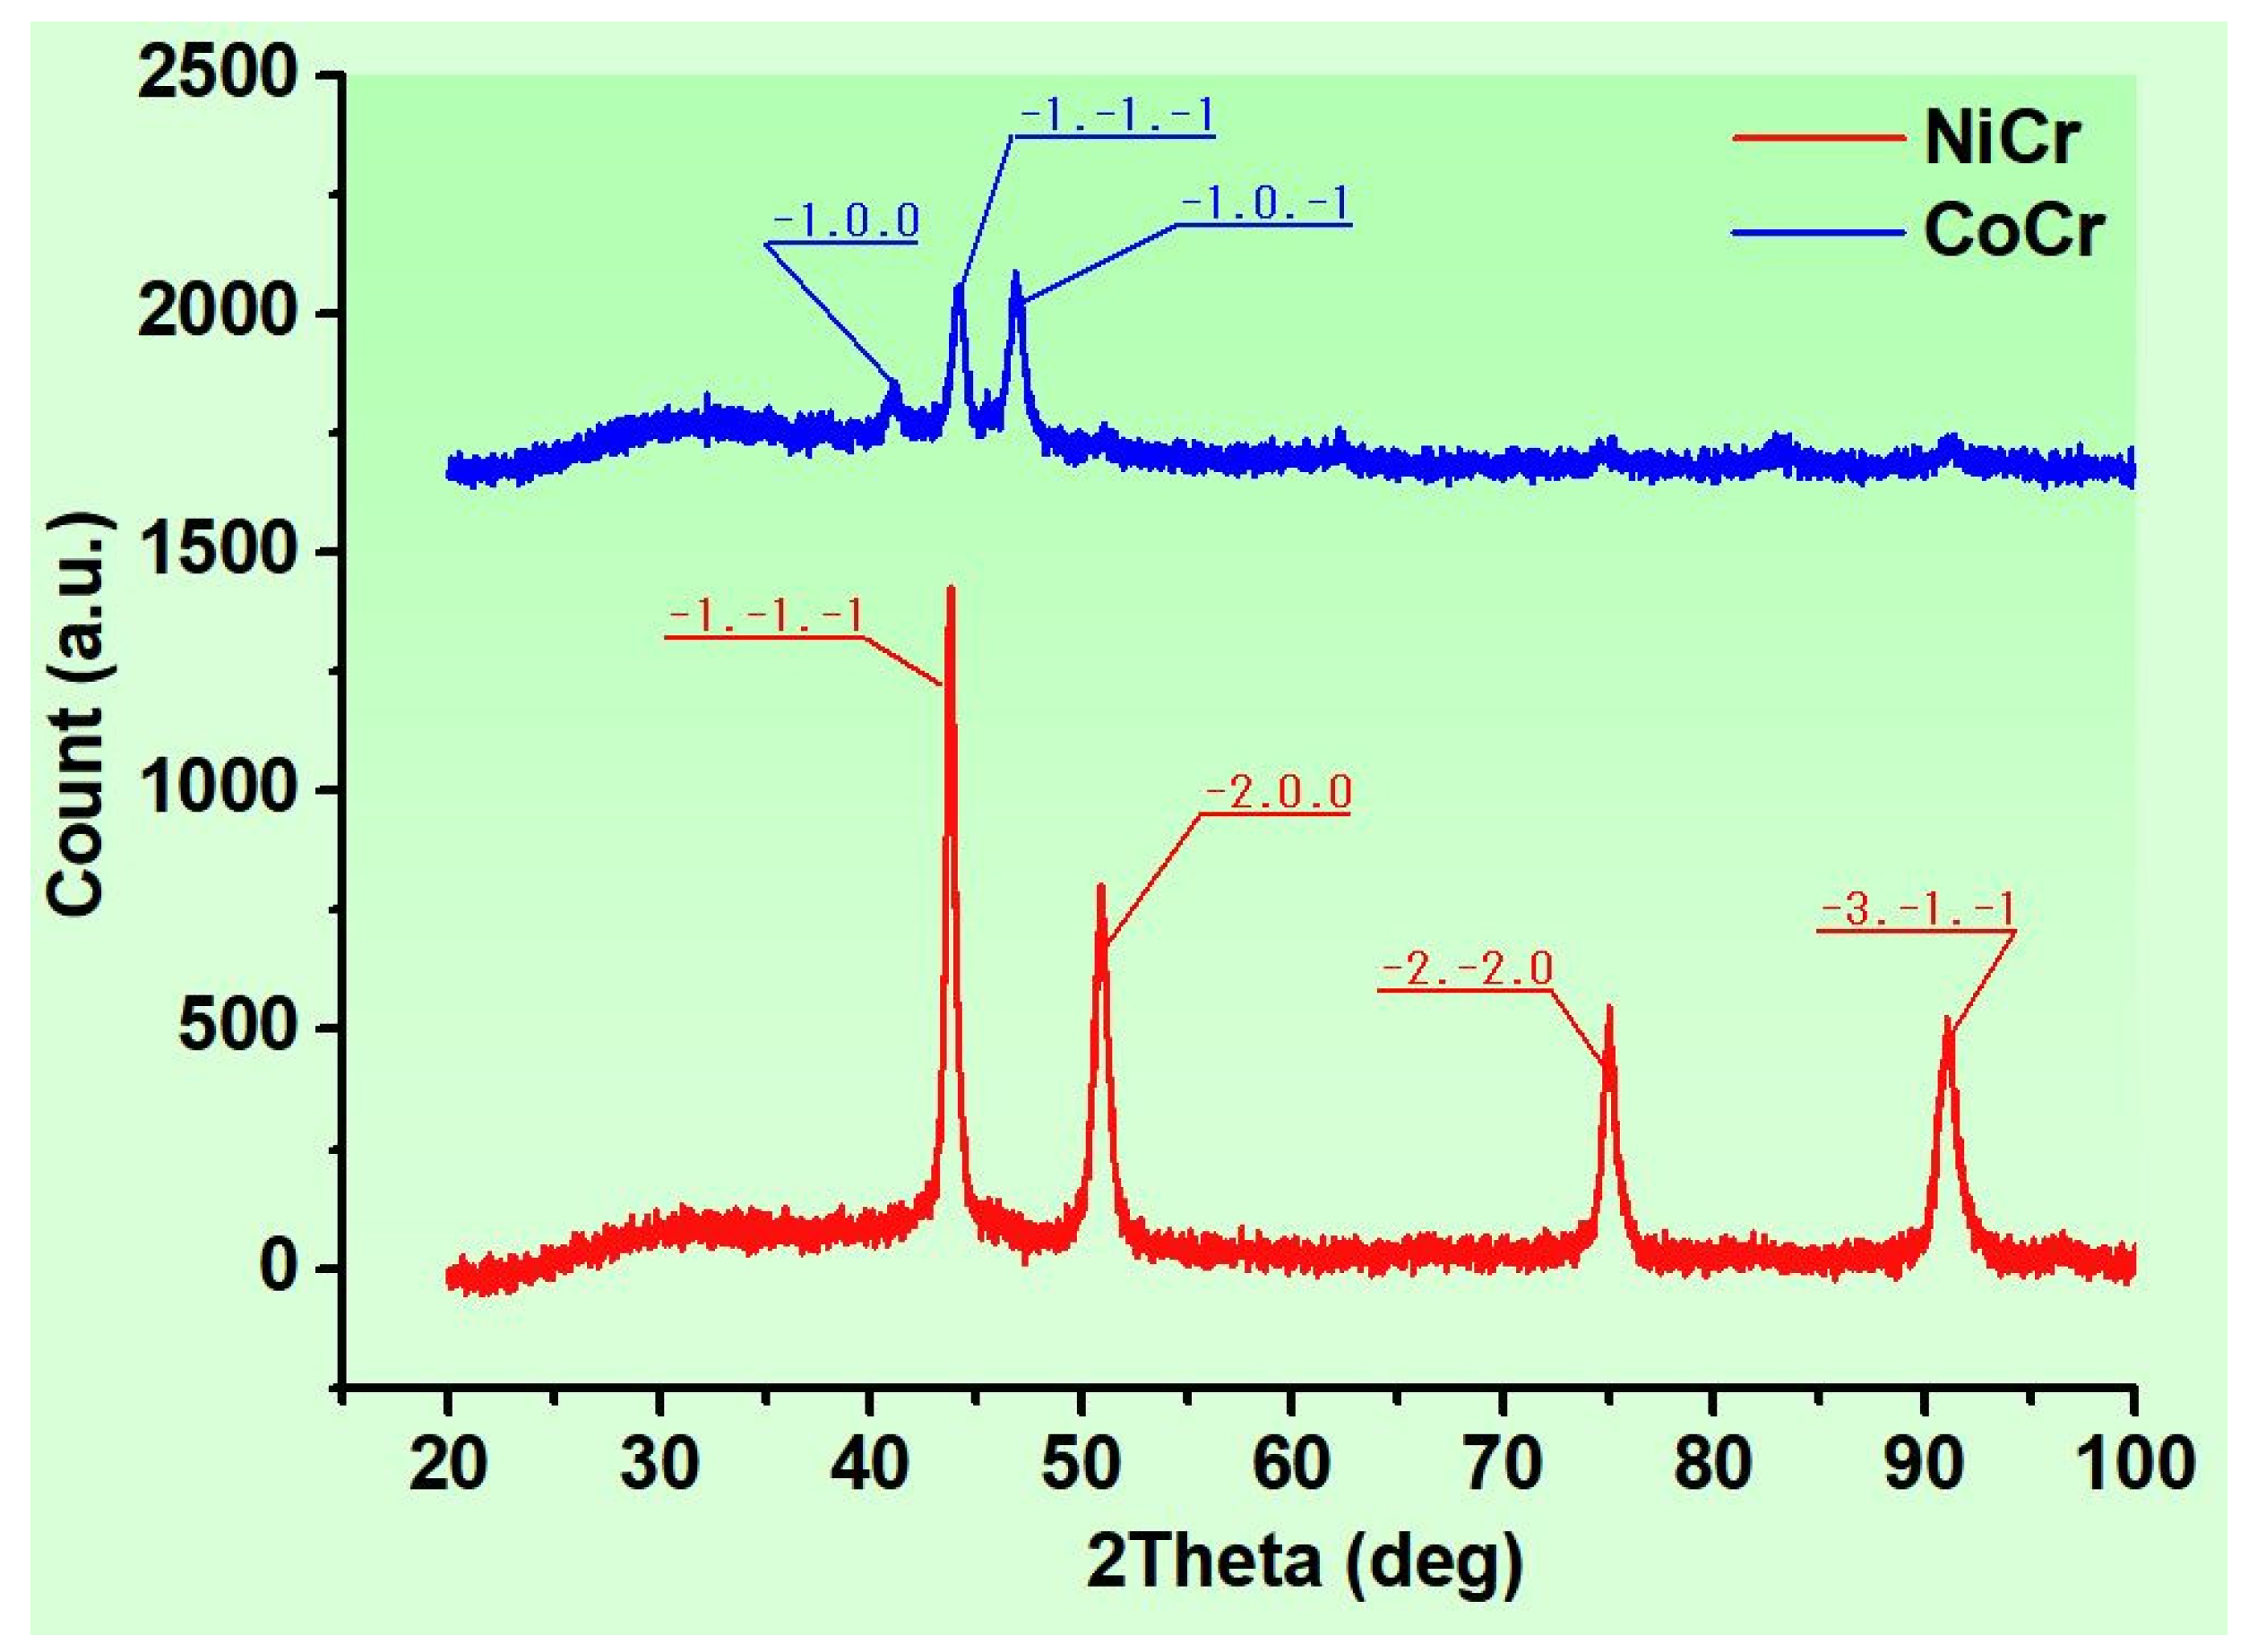
Metals 14 00398 g004
Figure 5. XRD spectra for Ni-Cr and Co-Cr dental alloys.
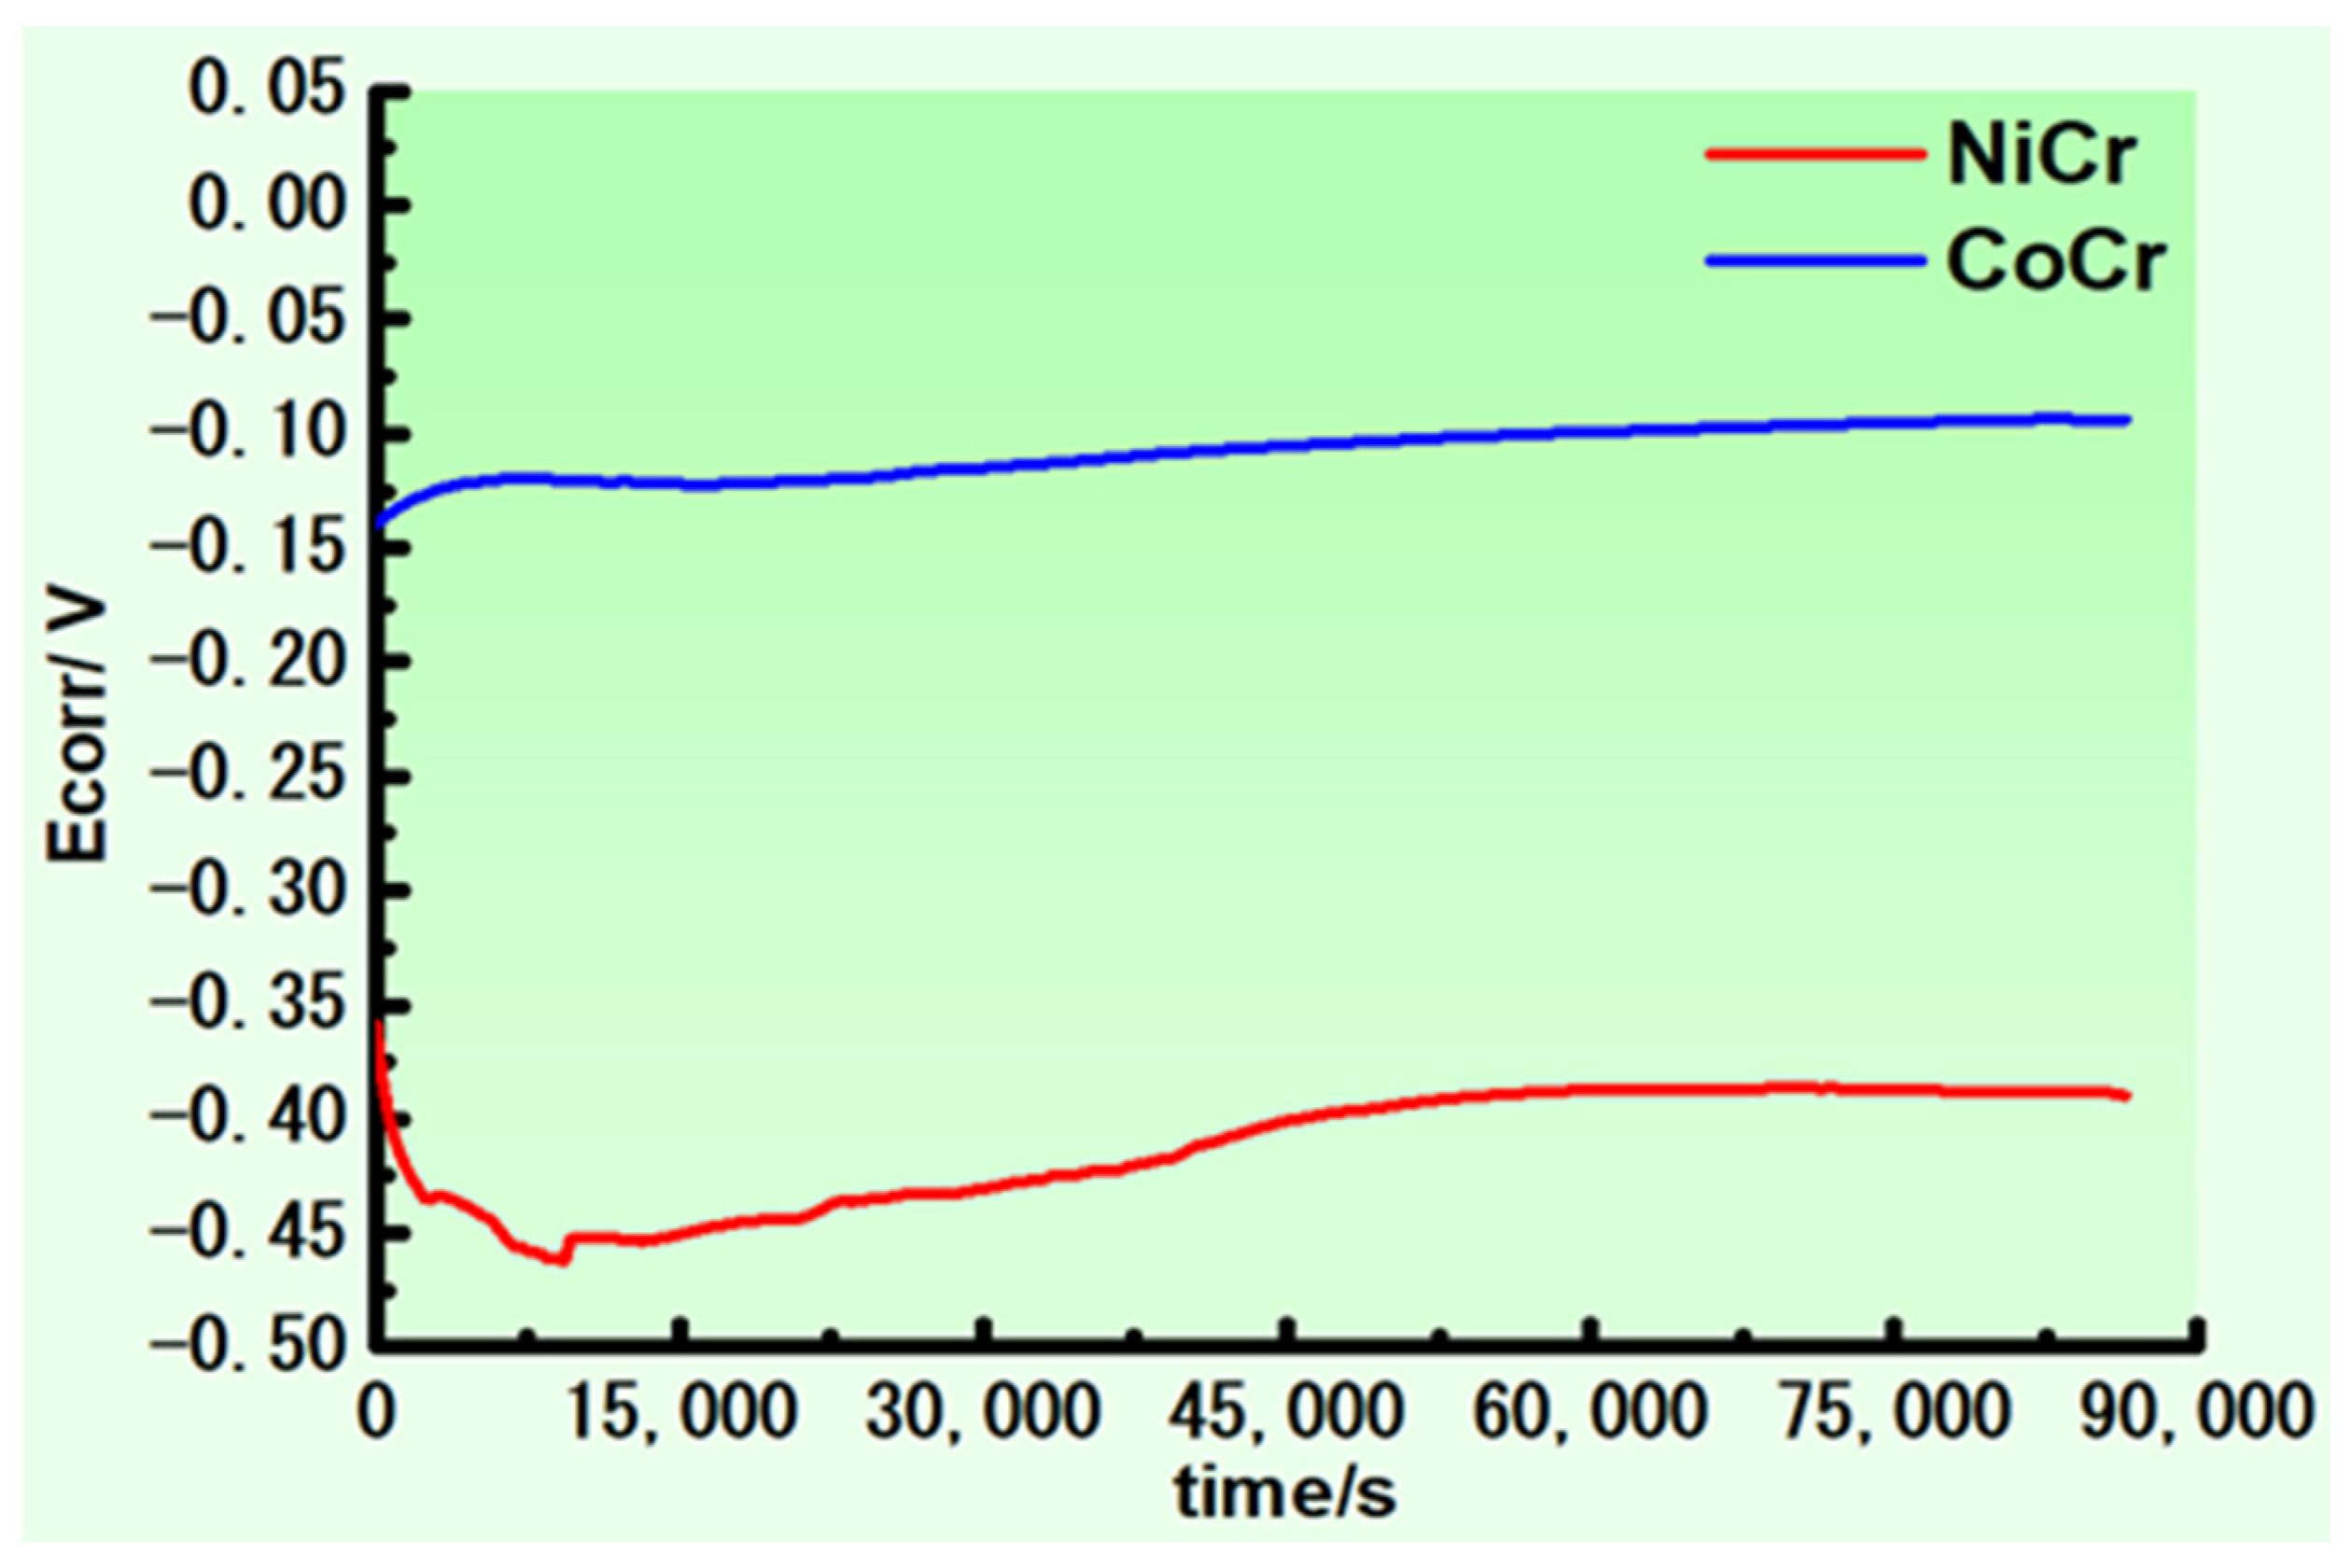
Metals 14 00398 g005
Figure 6. Corrosion potential curves for Ni-Cr and Co-Cr samples after 24 h immersion.
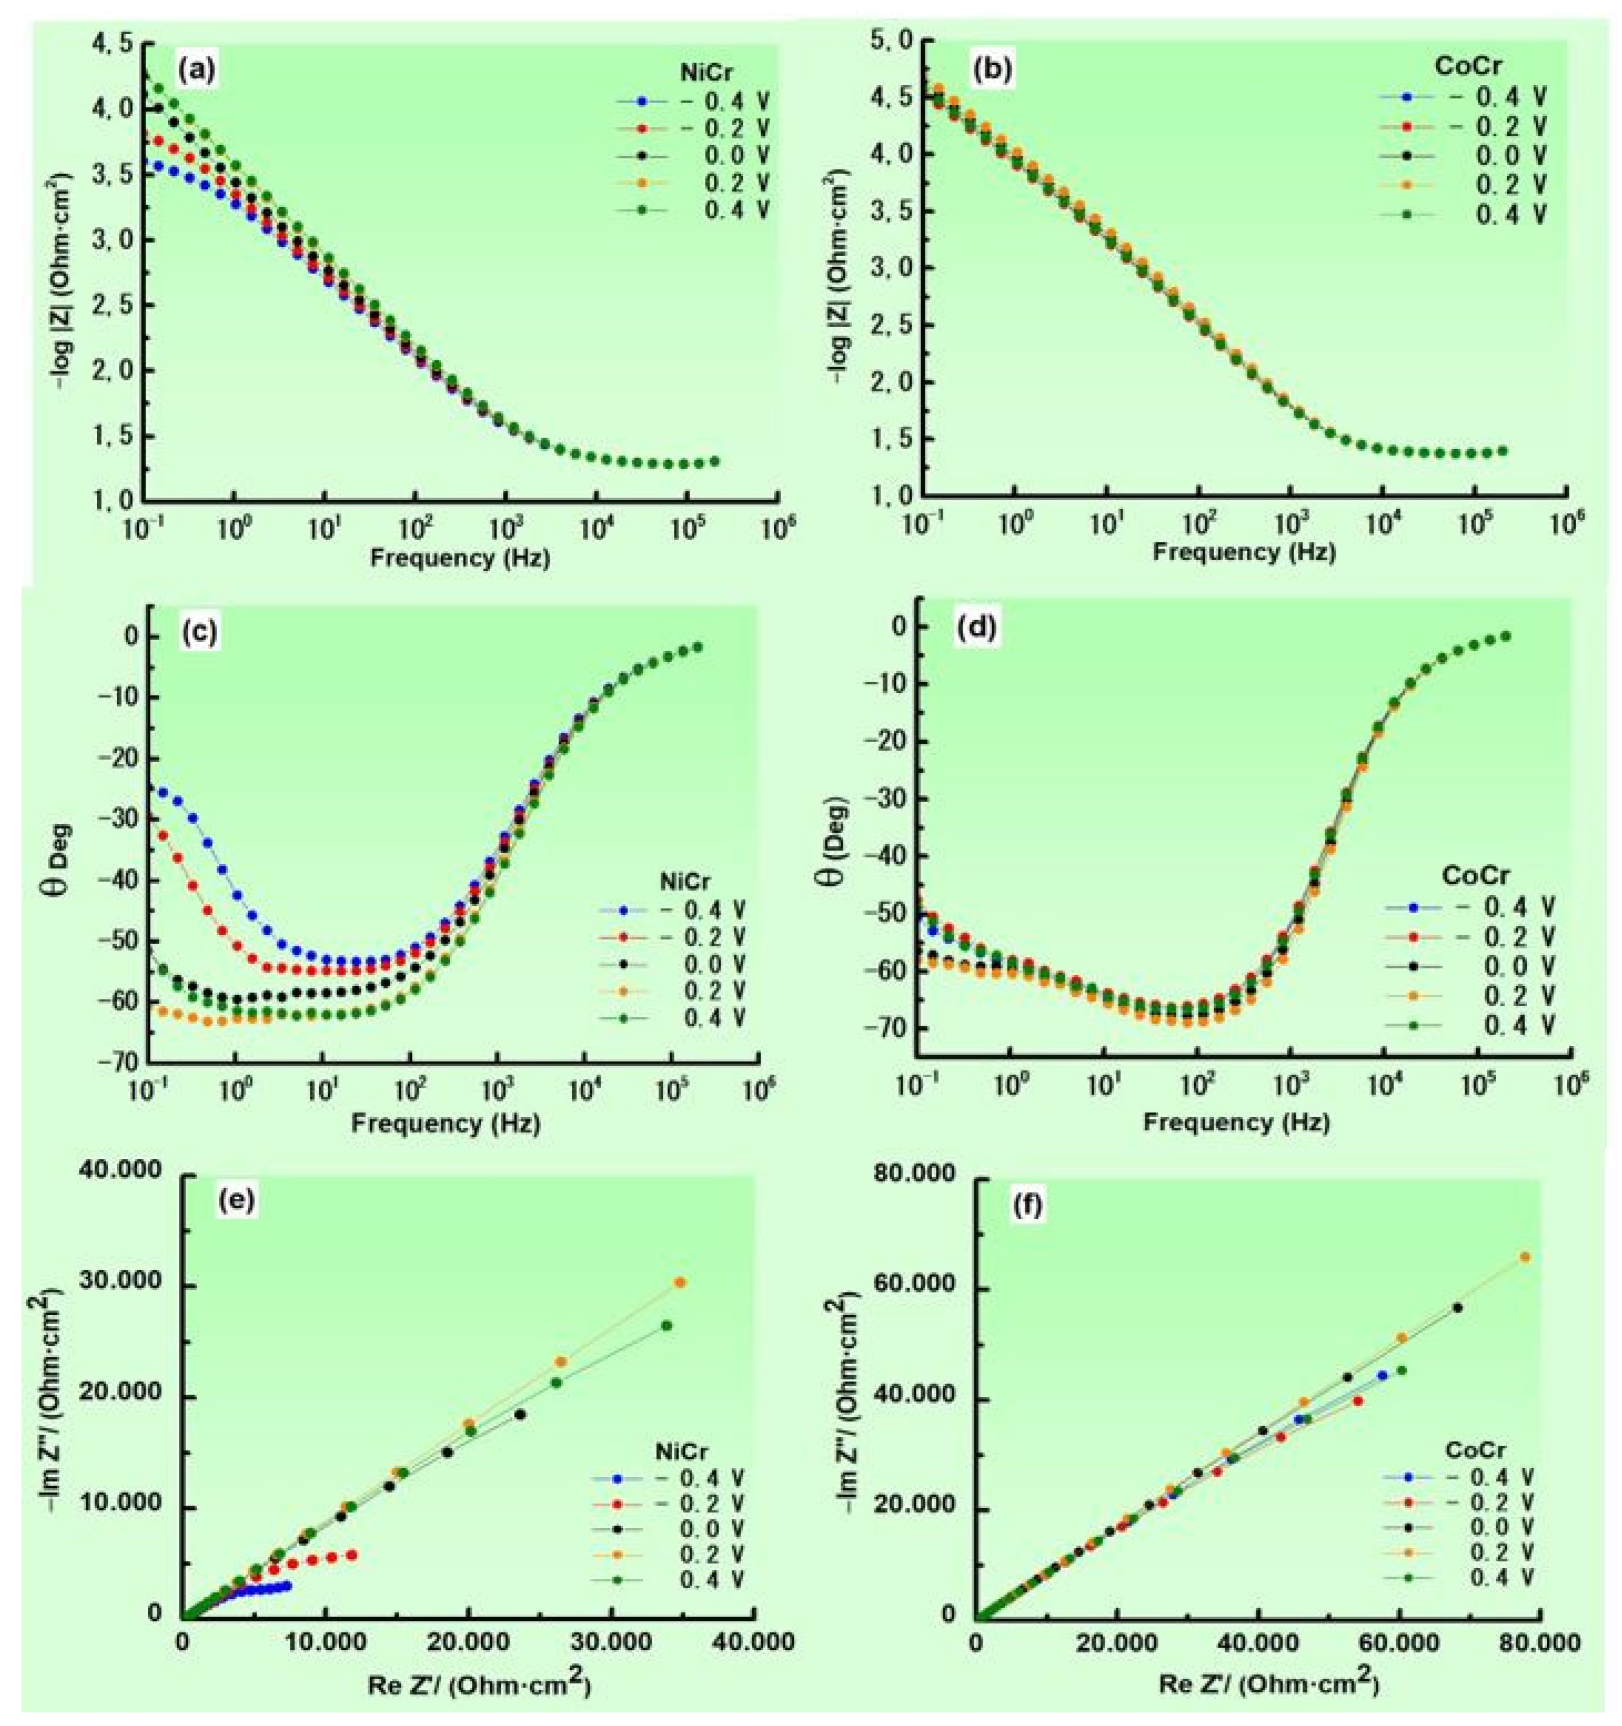
Metals 14 00398 g006
Figure 7. Bode impedance. Bode phase and Nyquist diagrams of Ni-Cr (a,c,e) and Co-Cr (b,d,f) samples at ±0.400 V.
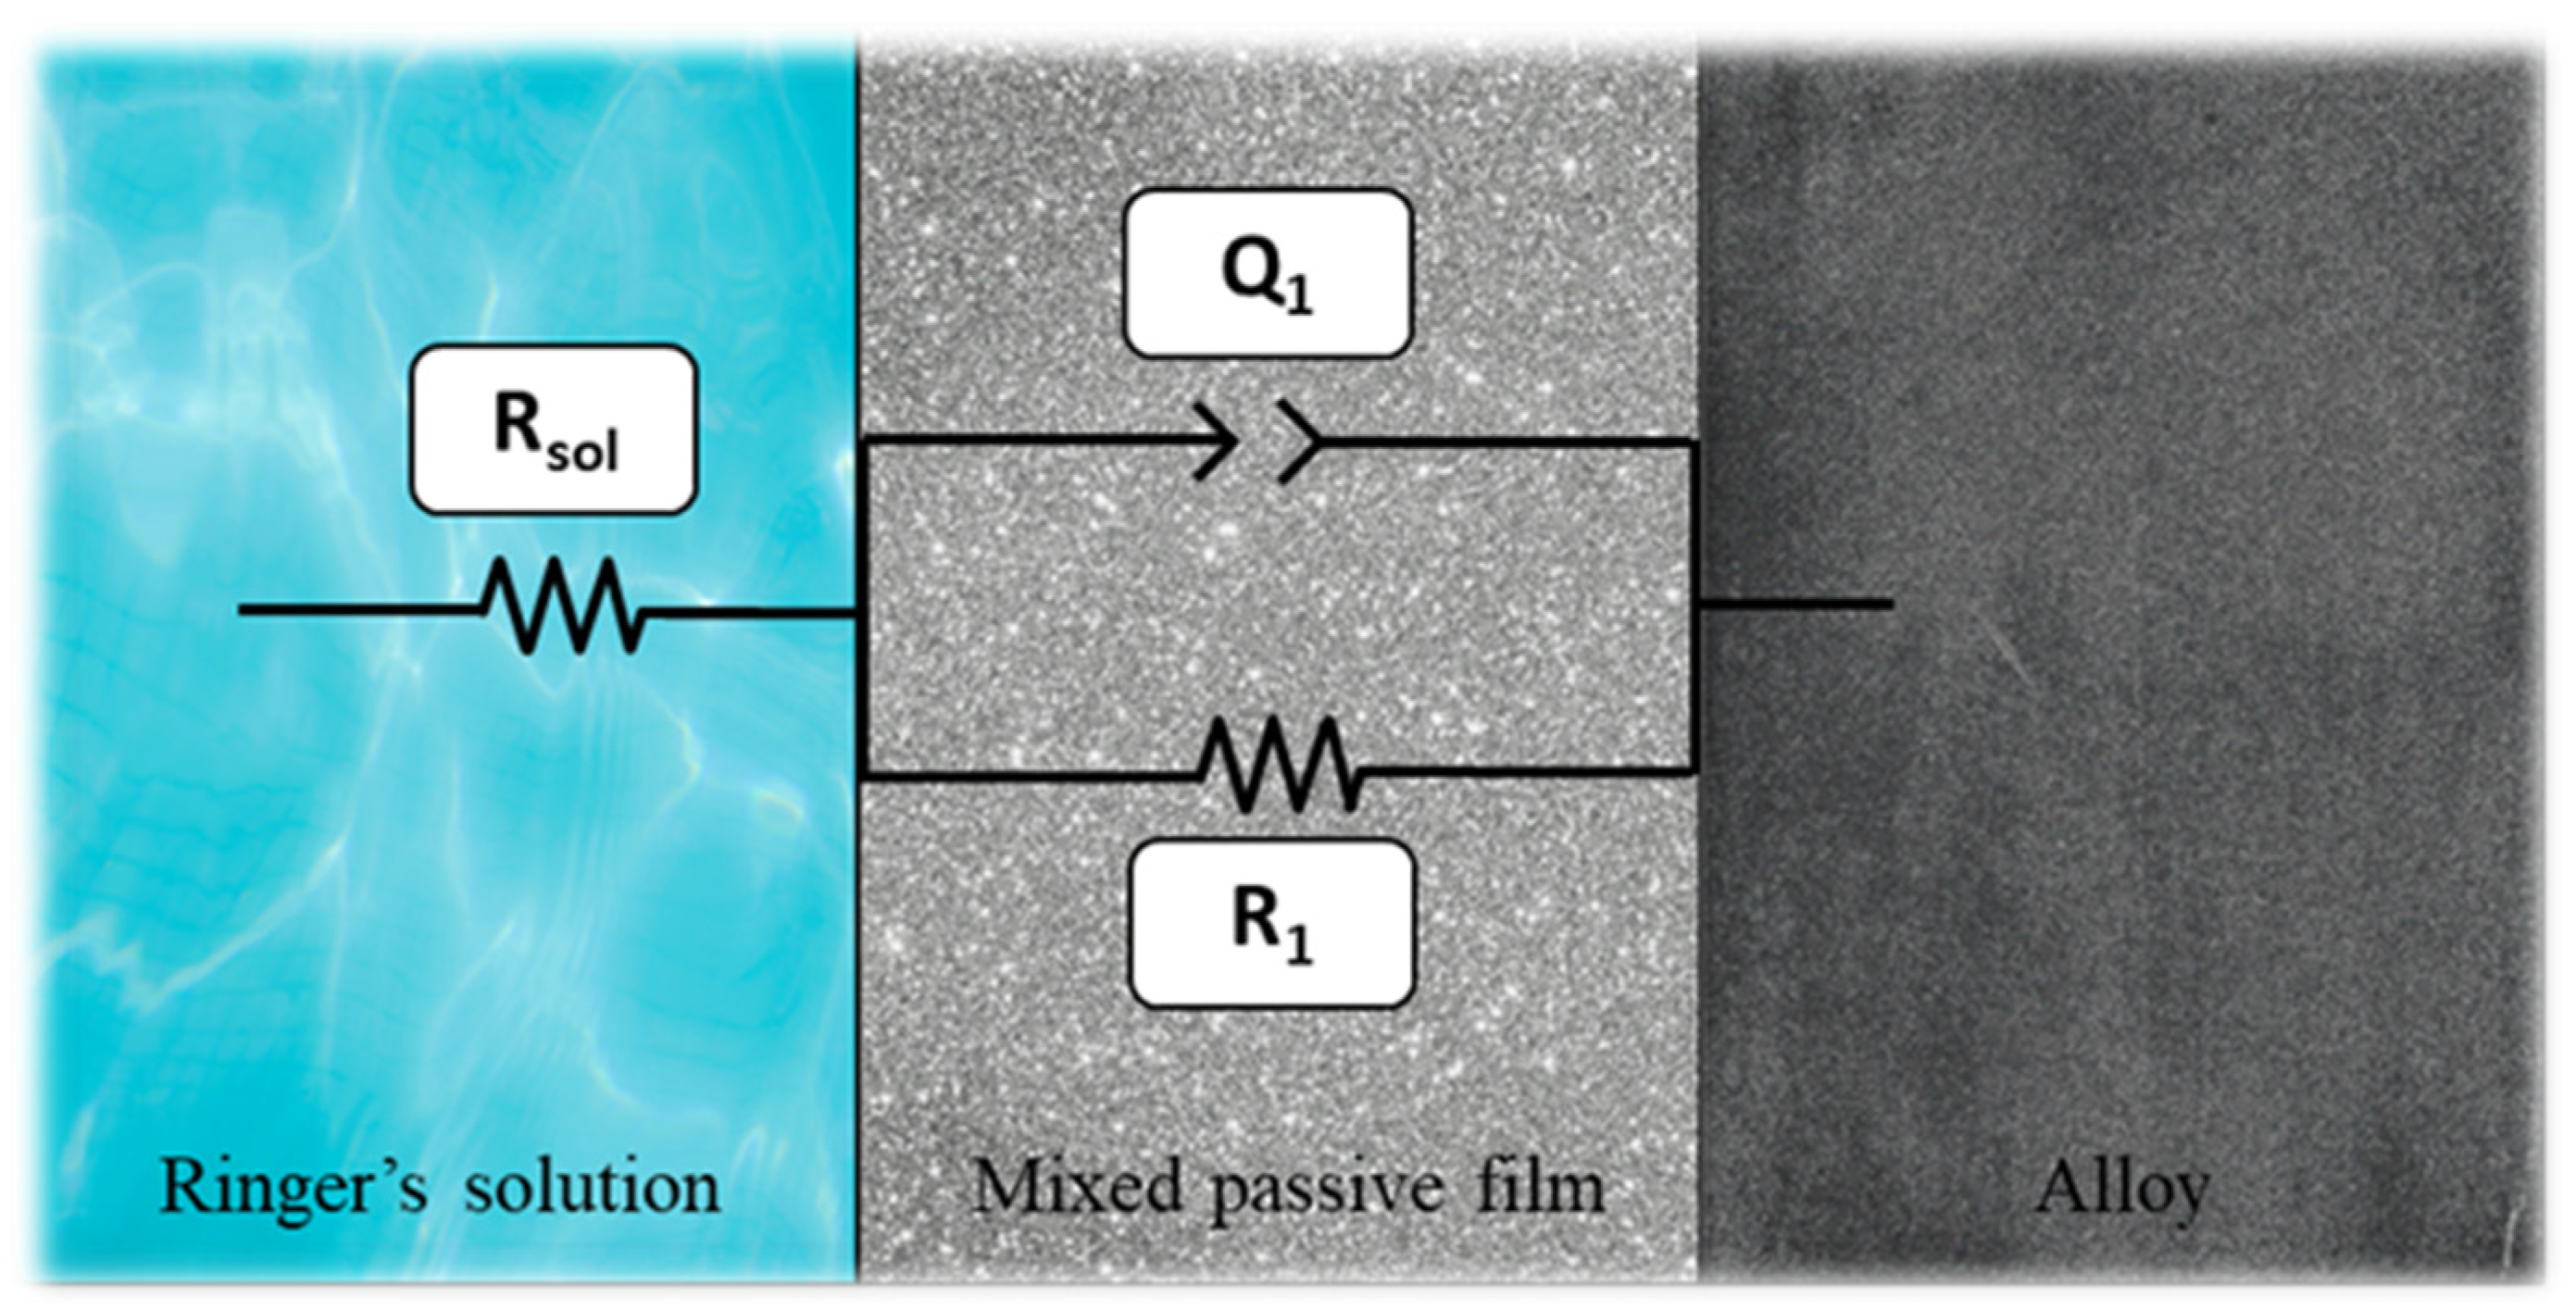
Metals 14 00398 g007
Figure 8. Equivalent circuit R(QR) to adjust impedance data from −0.400 V to 0.400 V.
Metals 14 00398 g008
Table 1. Composition (in wt%) of the alloys under study.
SampleNiCoCrWSiAlMoFe
Ni-Cr61.4-25.7-1.5<1.011-
Co-Cr-59.531.53.02.0-5<1.0
Table 2. EDS quantification results of the samples studied.
ElementsNi-CrCo-Cr
wt.%at.%wt.%at.%
AlK2.725.67--
SiK3.507.00--
MoL1.060.62--
CrK21.1122.8330.4434.53
NiK64.3661.66--
W L7.252.223.401.09
NbL--2.481.57
MnK--1.331.43
CoK--60.8960.95
HgL--1.470.43
Table 3. Corrosion potential results: initial, after 3 h, and after 24 h for the two samples submerged in artificial saliva and kinetic parameters of corrosion process.
AlloyEcorr, V vs. SCEicorrRpΒaΒcipassEbd
InitialAfter 3 hAfter 24 hµA/cm2KΩ/cm2mV/DIVmV/DIVµA/cm2mV
Ni-Cr−0.359−0.452−0.3900.20112157883.82620
Co-Cr−0.139−0.121−0.0940.2498164844.14600
Table 4. Results obtained in the Bode diagrams of the samples studied.
Potential (V)AlloysMax. Impedance (Ω)Max. Phase Angle (°)
−0.400Ni-Cr7.24 × 10353
Co-Cr5.76 × 10466
−0.200Ni-Cr1.18 × 10455
Co-Cr5.41 × 10466
0.000Ni-Cr2.36 × 10460
Co-Cr6.82 × 10468
0.200Ni-Cr3.48 × 10463
Co-Cr7.78 × 10469
0.400Ni-Cr3.38 × 10462
Co-Cr6.03 × 10467
Table 5. Equivalent circuit R(QR) of the studied samples when applying potentials from −0.400 V to 0.400 V.
Potential (V)SamplesParameters
Rsol (Ω·cm2)Y01 (S·secn/cm2)n1R1 (Ω·cm2)
−0.400Ni-Cr17.331.30 × 10−40.664.97·103
Co-Cr21.002.78 × 10−50.756.75·104
−0.200Ni-Cr17.311.22 × 10−40.664.97·104
Co-Cr21.002.88 × 10−50.755.83·104
0.000Ni-Cr17.331.05 × 10−40.687.55·104
Co-Cr20.912.47 × 10−50.768.92·104
0.200Ni-Cr17.507.62 × 10−50.712.75·105
Co-Cr20.902.15 × 10−50.771.02·105
0.400Ni-Cr17.517.18 × 10−50.717.46·104
Co-Cr20.972.68 × 10−50.766.48·104
Table 6. Values of microhardness, elasticity modulus, and tensile strength for the tested samples of Ni-Cr and Co-Cr (IN—ingot; CC—cast crown).
Mean Parameter ± Standard DeviationNi-CrCo-Cr
INCCINCC
Vickers microhardness231.6 ± 11.2182.2 ± 11.5425.4 ± 16.2326.6 ± 14.2
Young´s modulus (GPa)201.5 ± 16.2128.9 ± 22.9282.2 ± 15.8110.7 ± 12.9
Tensile strength (MPa)720.3 ± 26.5386.6 ± 12.41310.2 ± 28.8623.3 ± 12.2
Disclaimer/Publisher’s Note: The statements, opinions and data contained in all publications are solely those of the individual author(s) and contributor(s) and not of MDPI and/or the editor(s). MDPI and/or the editor(s) disclaim responsibility for any injury to people or property resulting from any ideas, methods, instructions or products referred to in the content.

