Article

High-Temperature Oxidation and Microstructural Changes of Al0.75CoCrFeNi High-Entropy Alloy at 900 and 1100 °C

by
Akhmad Ardian Korda
1,*,
Mohamad Ali Akbar
1,
Fadhli Muhammad
1,*,
Tria Laksana Achmad
1,
Budi Prawara
2,
Djoko Hadi Prajitno
3,
Bagus Hayatul Jihad
4,
Muhamad Hananuputra Setianto
4 and
Eddy Agus Basuki
1
1
Department of Metallurgical Engineering, Faculty of Mining and Petroleum Engineering, Institut Teknologi Bandung, Bandung 40132, Indonesia
2
Research Centre for Advanced Materials, National Research and Innovation Agency (BRIN), Tangerang Selatan 15314, Indonesia
3
Research Organization for Nuclear Technology, National Research and Innovation Agency (BRIN), Bandung 40132, Indonesia
4
Research Centre for Rocket Technology, Research Organization for Aeronautics and Space, National Research and Innovation Agency (BRIN), Kabupaten Bogor 16350, Indonesia
*
Authors to whom correspondence should be addressed.
Metals 2024, 14(1), 33; https://doi.org/10.3390/met14010033
Submission received: 24 November 2023 / Revised: 20 December 2023 / Accepted: 26 December 2023 / Published: 28 December 2023

Abstract

:
The development of high-entropy alloys (HEAs) for high-temperature applications has been driven by the limitation of nickel-based superalloys in achieving optimal efficiency at higher temperatures for higher efficiency in power generation engines. The alloys must have high oxidation resistance and microstructural stability at high temperatures. Relatively equimolar multi elements involved in HEAs produce microstructure containing a single solid solution or multiphase that improves the mechanical properties and oxidation resistance resulting from sluggish diffusion and core effects. In this study, the oxidation behavior and microstructural changes of Al0.75CoCrFeNi HEA at 900, 1000, and 1100 °C in air atmosphere were investigated. Based on the XRD and SEM-EDS analysis, the mechanism of oxide scale formation and microstructural changes of the substrate are proposed. The results show that the oxidation behavior of the alloy follows a logarithmic rate law. Different oxide compounds of CoO, NiO, Cr2O3, and CrO3, θ-Al2O3, α-Al2O3, and Ni(Cr,Al)2O4 with semicontinuous oxides of Al2O3 with Cr2O3 subscale and an oxide mixture consisting of spinel of Ni(Cr,Al)2O4 and Co(Cr,Al)2O4 were found. During oxidation, Widmanstätten of FCC-A1 and BCC-B2/A2 phases in the substrate have changed. Spheroidization of B2 and a reduction in volume fraction decrease the hardness of the substrates.

1. Introduction

Nickel-based superalloys are considered the most successful alloy system for high-temperature applications. These materials are mostly used as turbine blades in aircraft jet engines, as well as other high temperature components such as in rocket nozzles and nuclear power plants [1,2,3]. Precipitates of ordered coherent intermetallic γ′-Ni3(Al,Ti) play an important role as the prime alloy strengthener in nickel-based superalloys. However, these materials have approached their peak operating temperatures close to their γ/γ′ equilibrium solvus temperatures, beyond which complete dissolution of γ′ precipitate can occur and leave a relatively weak matrix of γ solid solution [4,5]. Thermodynamics theory confirms that increasing energy efficiency of the power engines requires higher temperature operations. Due to the limitation of nickel-based superalloys, research activities on materials with properties beyond superalloys have appeared massively in recent decades [6,7]. Among many candidates, high-entropy alloys (HEAs) are considered a group of materials that exhibit good combinations of strength and resistance to oxidation at elevated temperatures. This group of materials has unique properties suitable for high-temperature applications such as low diffusion rates, high mechanical properties, and cocktail effects [8,9]. The configuration entropy of the alloy based on the Boltzmann equation has been considered as the atomic concept to define the HEA. With this concept Yeh et al. [10] have proposed the following equations to define the configuration entropy of HEA [7].
S c o n f = k ln w = R ( 1 n ln 1 n + 1 n ln 1 n + 1 n ln 1 n ) ,
= R ln 1 n = R ln n ,
where R is a gas constant of 8.314 J/K mol. Configuration entropies equal to or higher than 1.5R have been accepted to define high-entropy alloys [11,12].
Two groups of HEAs have been developed for high-temperature applications, i.e., refractory high-entropy alloys (RHEAs) and transition metal high-entropy alloys (TM HEAs) [13]. In the second group of HEAs, AlCoCrFeNi has been intensively studied [12,13,14], with particular emphasis on the effect of Al composition variations on the microstructural stability and mechanical properties of the alloys. These alloys have been reported to form two phases of face-centered cubic A1 and body-centered cubic B2, which possess good mechanical properties at high temperatures [15]. Zhang et al. [16] have shown that the volume fraction of B2 phase in AlxCoCrFeNi increases when aluminum content in the alloys is increased and this makes the alloy brittle [15]. Furthermore, it is reported that the single phase of A1 FCC is stable when the mole fraction of aluminum in these alloys is less than 0.45, while the B2 BCC phase dominates when the aluminum content is higher than 0.88. This phase stability in this alloy has been related to its valence electron concentration [13] as well as lattice distortion due to atomic size mismatch [17].
High-entropy alloy has a high tendency to form a single solid solution phase [12]. Only when careful selection of chemical composition to fulfill the HEA parameters is carried out could solid solution and not intermetallic compounds form [16]. The formation of intermetallic compounds as a matrix is usually avoided because these phases are usually brittle [7]. In addition, HEAs have high structural stability by extending the solid solution stability region in the phase diagrams [18]. In addition, regular solid solution is also strongly affected by the enthalpy of mixing. Zhang et al. [19] have introduced a parameter Ω as absolute value of the ratio between multiplication of alloy melting point and the entropy of mixing to the enthalpy of mixing, i.e.,
Ω = T m . Δ S m i x / Δ H m i x ,
Together with the value of atomic misfit, this parameter can be used to predict the type of alloy whether solid solution or intermetallic compound. Moreover, the atomic size misfits in the alloy give heterogeneous lattice strain and make HEAs normally have sluggish diffusion as the result of atoms tending to move slowly [20,21].
The pre-exponential factor in the diffusion coefficient of each atom is considered as follows [22].
D = k T h exp S * k exp H * k T ,
D 0 = k T h exp S * k ,
where k is Boltzmann constant, S* is entropy of activation, H* is enthalpy of activation, T is absolute temperature and h is Plank’s constant. Therefore, it is predicted that the diffusivity of the element decreases when entropy of activation and give a sluggish diffusion effect [23]. This effect gives the possibility that HEAs can be used for high-temperature applications at temperatures above about 0.6Tm as the microstructural changing is usually a diffusion-controlled process so that the microstructure stability would be high [24].
However, Miracle and Senkov [17] have argued that all investigations supporting the sluggish diffusion properties in HEAs were based on secondary observation. Several studies have shown that increasing the element content in HEA did not linearly decrease the diffusion rate of the elements in the alloys [25]. For example, Vaidya et al. [22] described that diffusion in CoCrFeMnNi was faster than that in CoCrFeNi, although the configurational entropy of quinary is higher than that of quarternary. Meanwhile, the melting point of CoCrFeMnNi is lower than that of CoCrFeNi because Mn lowers the melting point of the alloy. Therefore, the pre-exponential factor for the diffusivity (Do) of CoCrFeMnNi would be lower than that of CoCrFeNi. Decreasing diffusivity can also result from increasing lattice distortion in alloys [26]. HEAs have relatively high lattice distortion [12,16] due to the large atomic size differences of the elements in the alloys [16,27]. This lattice distortion of the alloy can also be seen in the reduction in Bragg’s diffraction intensities [28].
For HEAs to be used for high-temperature applications, the alloys must have high resistance to high-temperature oxidation in addition to high microstructural stability. Compact and continuous scales of Cr2O3 and Al2O3 are typically used as a protective layer against oxidation because these oxides are known to have low growth rates. While relatively high aluminum content HEA, as found in equiatomic AlCoCrFeNi, is predicted to have high oxidation resistance, it increases the brittleness of the material. Therefore, it is generally recommended that reducing the aluminum content will decrease the brittleness of the material.
Several studies have been conducted on the high temperature behavior of AlCoCrFeNi alloys. However, only limited studies on the oxidation resistance of AlCoCrFeNi HEAs were found in the literature [9,29,30,31]. Lu et al. [32] demonstrate that lower diffusion rate of Al in the AlCoCrFeNi is beneficial to lower oxidation rate thus improving oxidation resistance. Butler et al. investigated the effect of aluminum content in as-cast AlxCoCrFeNi on oxidation behavior at 1050 °C [9,33]. They found that alloys with relatively low aluminum content formed discontinuous layers of Cr2O3 on the outer part of the scale and internal oxide of Al2O3. In alloys with high aluminum contents, continuous Al2O3 is formed. A thorough and systematic study is required to evaluate the oxidation behavior of Al0.75CoCrFeNi HEA at high temperatures concerning the microstructure of the alloy. The present study aims to find out the effect of high-temperature oxidation on microstructural changes and oxidation behavior of Al0.75CoCrFeNi alloy. Isothermal oxidation simulations were carried out at 900, 1000, and 1100 °C. The effect of spallation of the protective scale during oxidation, especially at 1100 °C, is also discussed.

2. Materials and Methods

The alloy was prepared from high purity Al, Co, Cr, Fe, and Ni, obtained from Sigma Aldrich, by melting in a mini single arc furnace purged with high purity (≥99.9%) argon. To ensure homogeneity, the alloy was melted four times. The alloy button was then homogenized at 1100 °C for 10 h in a tube furnace purged with argon to prevent oxidation. The as-homogenized alloy was then sectioned into several coupons with an average size of approximately 8 × 7 × 2 mm3 using an electric discharge machine. The coupons were polished using SiC paper up to #2000, followed by a 3 µm alumina suspension, and then cleaned in ethanol using an ultrasonic cleaner for 15 min. An as-homogenized sample was taken to analyze the chemical content and microstructure of the alloy using energy dispersive X-ray spectroscopy (EDS) equipped in a scanning electron microscope (SEM) (JCM-7000 NeoScope™, JEOL, Tokyo, Japan) with an acceleration voltage of 15 kV.
The coupon samples were subjected to atmospheric isothermal oxidation in a tube furnace at temperatures of 900 and 1100 °C for 2, 16, and 40 h. Oxidation at 1100 °C for a longer period of 168 h was also carried out. The weight gain of each sample was measured and characterized by XRD and EDS-SEM to find out the oxidation behavior of the material. A chemical solution of 1.5% HNO3 + 2.5% H2SO4 + 46% HCl + 50% ethanol was utilized as an etching solution to reveal the microstructure of the as-homogenized and as-oxidized samples. The etchant preferentially dissolved Al-rich phases but not stable oxides on the scales. Surface oxides were identified by XRD (SmartLab, Rigaku, Tokyo, Japan) using Cu-Kα radiation (λ = 1.54 Å) for 2θ in the range of 20–90° at a voltage and current of 40 kV and 15 mA, respectively. The reading time was taken at 10°/min. This method investigates relatively thin layers of oxides on the surface of the scales. Meanwhile, the microstructural stability of the alloy was investigated by studying the volume fraction changing during the heating of oxidation tests using ImageJ 1.53t software (Wayne Rasband and contributors, National Institute of Health, USA).

3. Results and Discussion

3.1. Empirical Approach Using Hume Rothery Law

It is important to predict the microstructure of the Al0.75CoCrFeNi based on the empirical approach using Hume Rothery law. The lattice misfit (δ) of elements in the alloy was calculated in Excel using Goldshmidt atomic radius of the elements based on the following equation.
δ = i = 1 n x i 1 r i i = 1 n x i r i 2 ,
It was found that the lattice misfit is 5.29, in which among the five elements in the alloy, aluminum has the largest size. Meanwhile, the valency electron concentration of the alloy was calculated based on the following equation.
V E C = i = 1 n χ i V E C i ,
where Xi and VECi are atomic fraction and electron valence concentration of each element in the alloy, respectively. The calculation gives a VEC of 7.42. Furthermore, calculations were conducted on entropy and enthalpy of mixing as well as the melting point of the alloy. The omega value, expressed as Ω = |Tm. ΔSmix/ΔHmix|, was found to be 1.65. However, it should be noted that the entropy of mixing is basically the configurational entropy, and the enthalpy of mixing was approached from the binary systems, where the negative values of Δ H mix tend to make the alloy in an ordered intermetallic structure, while at positive values, it will produce a solid solution [15,16,34]. However, according to Zhang et al., based on parameter of Ω that makes the Al0.75CoCrFeNi has Ω > 1, they stated that the role of entropy of mixing is more dominant compared to the melting point [16,34]. The results predict that the Al0.75CoCrFeNi alloy has a microstructure containing two phases of A1-FCC and B2-BCC. However, A2 BCC might also occur [20,24]. Relatively large misfit in the alloy produces localized lattice strain that increases the strength of the alloy [21,35].
When the entropy of the alloy and the diffusion coefficient given in equation 5 are considered, Al0.75CoCrFeNi has low diffusion kinetics [15,26]. Combining this low diffusion and local lattice strain resulted from high %δ would produce a sluggish diffusion effect. However, it should be noted that this relatively high atomic size difference in the alloy increases the Gibbs free energy of the alloy and reduces the stability of the microstructure [36,37]. Therefore, the stability of the microstructure Al0.75CoCrFeNi at high temperature needs to be investigated further.
Calculation on VEC as suggested by Guo et al. [38] was carried out to predict the crystal structures of the phases that occur in the alloy. It was found that the VEC of Al0.75CoCrFeNi is 7.42 and this indicates the stability of two phases of FCC + BCC. It is predicted that this gives a combination of relatively ductile FCC and hard BCC phase that produces optimum mechanical properties in terms of alloy toughness [16,26]. The involvement of Al in the alloy stabilizes the BCC structure [39,40] and increases the possibility for B2 phase to form. Increasing Al content in the alloy increases the volume fraction of B2 in the alloy.
In terms of mechanical properties, the high atomic size of Al increases the internal stresses of the lattices [41] and increases the solid solution strengthening of the alloy. While the involvement of B2 phases in the alloy increases the alloy strength [16,26], FCC provides alloy ductility [11,16]. In addition, this phase has higher Δ H f v and Δ H m v [42] compared with that of BCC phase, and this makes the substitution diffusion in FCC phase lower than in BCC phase. Therefore, even though Cr acts as the strong element to increase the driving force for sigma phase formation [43], the existence of FCC forming elements such as Ni in Al0.75CoCrFeNi HEA can reduce the possibility for the sigma phase to occur [44]. In addition, the sigma phase is normally formed only at temperatures below about 800 °C in Al-CoCrFeNi alloy system [24]. Therefore, sigma phase is predicted to be absent in the alloy studied at temperatures studied.

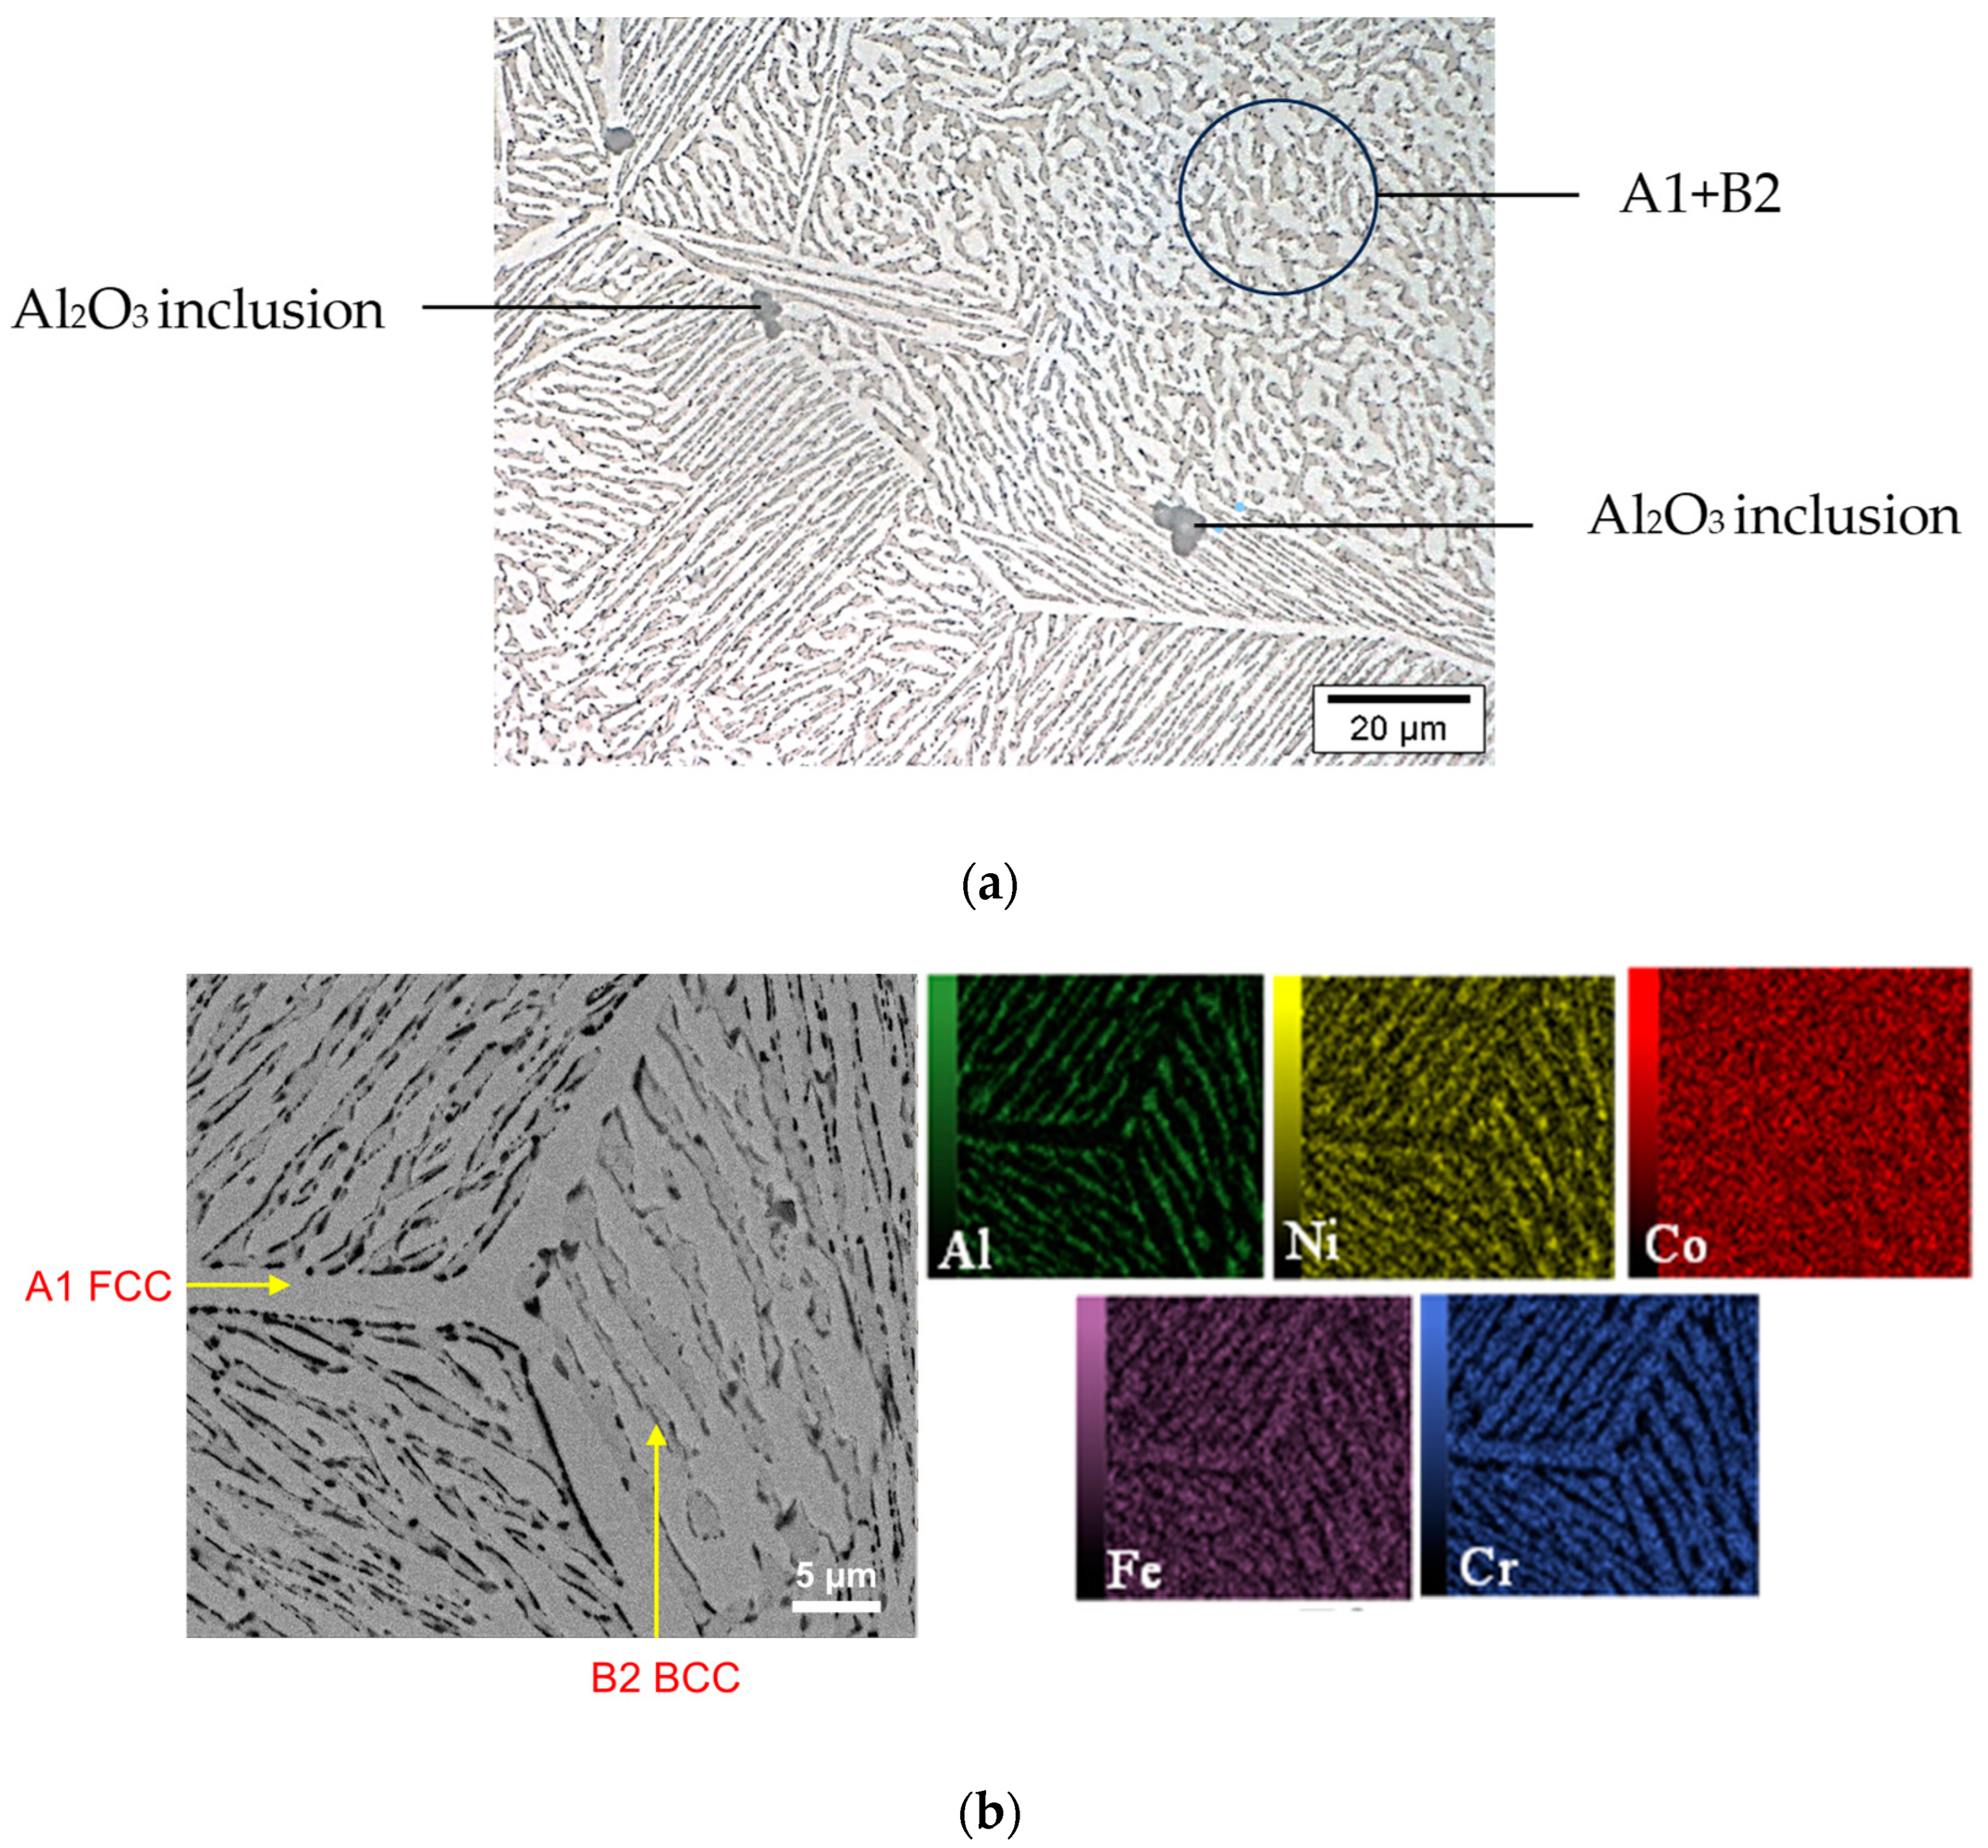
3.2. As-Homogenized Alloy

From the EDS analysis, it is confirmed that the chemical composition of the as-homogenized alloy has slightly changed from the raw materials, as shown in Table 1. It is seen that the Al content in the alloy has decreased while Co is relatively constant and Cr, Fe, and Ni have slightly increased. Aluminum loss during melting is predicted due to the oxidation of Al during melting, even though the argon gas used has high purity, as seen in some inclusions of Al2O3 found in the microstructures of the as-homogenized alloy (Figure 1). Recalculation on the configurational entropy of the as homogenized gives ΔSconfig equal 1.6R indicating that the alloy still in the range of HEA.
The microstructures of the as-homogenized sample, shown in Figure 1, indicate that Al0.75CoCrFeNi HEA is composed of Widmanstätten laths of two different phases, and this meets with what has been found in other investigations [45,46]. The elemental mapping shows that Co is distributed relatively homogenously in both phases, while Fe and Cr are mostly partitioned in the main plate that grows along and from the grain boundaries indicated by relatively bright color in the optical micrograph. This Fe- and Cr-rich plate is essentially the A1-FCC phase as found in previous studies [47,48]. On the other hand, Ni and Al partition in the area between the branch of the primary plates and has been characterized as B2-BCC or NiAl phase [48,49,50]. The average hardness of the as-homogenized alloy using Vickers hardness tests gave 367 HV. This result is slightly higher compared with that obtained by Liu et al., which is 320 HV [51].

3.3. Oxidation Behavior

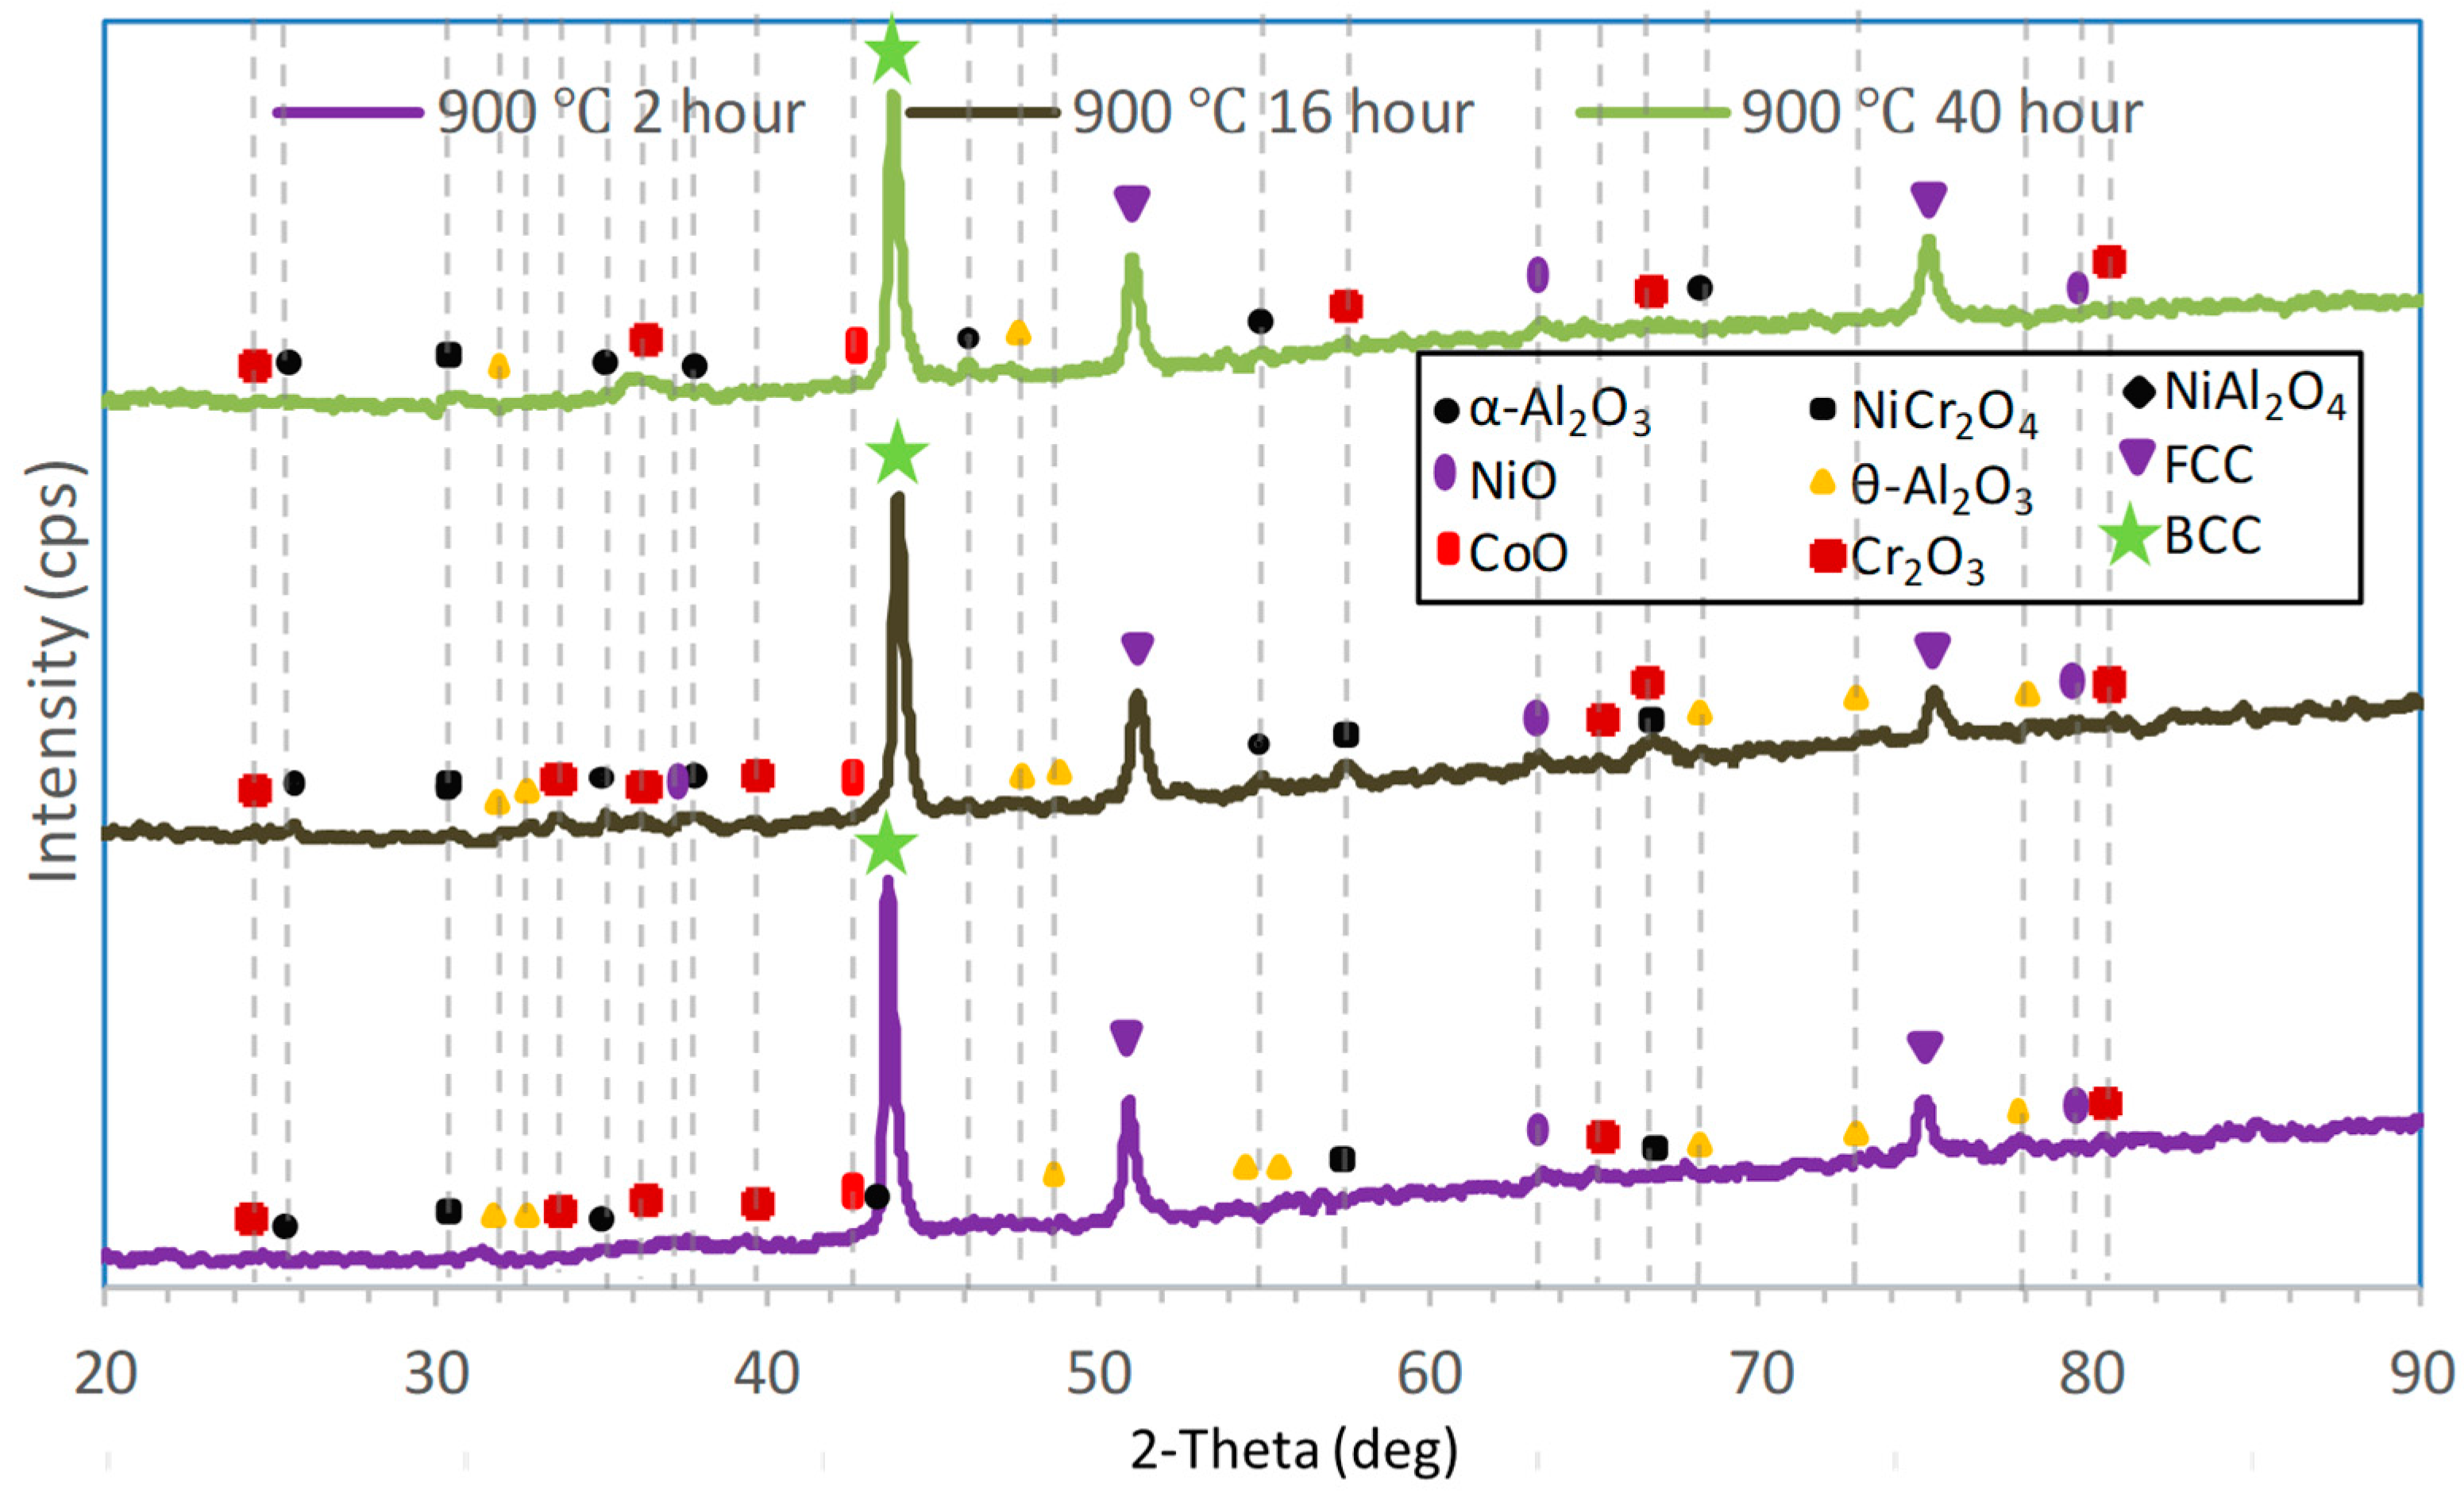
3.3.1. Surface Oxides from XRD Results

The oxidation mechanism of Al0.75CoCrFeNi HEA can be approached from the proposed model of Giggins–Petit for ternary Ni-Al-Cr systems that are classified into three groups [52]. Mohanty et al. [53] have stated that Al0.75CoCrFeNi HEA belongs to group III as the oxidation of this alloy produced thick, continuous Al2O3 below a layer of Cr2O3. Considering that the studied material is a concentrated alloy with nearly uniform concentration, it is possible for all oxides to form during transient oxidation. However, this study did not identify any iron oxides through XRD characterization. Previous studies on the oxidation of HEA have also reported the absence of iron oxides [9,53,54]. The oxidation behavior of the Al0.75CoCrFeNi alloy in the transient state is significantly influenced by the partition of elements in the A1 and B2 phases. Specifically, Fe and Cr exhibit a preference for partitioning in A1. However, Ni and Al are strongly partitioned into B2, and Co is relatively homogeneously distributed in both phases. During the early stages of oxidation, FeO and Cr2O3, as well as CoO, can form on the surface of the A1 phase. On the other hand, NiO, Al2O3, and CoO can occur on the B2 surface.
Referring to the Ellingham–Richardson diagram for oxide formation, the stability order for oxides at 1100 °C is Al, Cr, Fe, Co, and Ni. Meanwhile, the parabolic rate constants at the same temperature are in the order of Fe, Co, Ni, Cr, and Al [55]. This indicates that iron oxide has the fastest rate among the other oxides. Other researchers have found the absence of single iron oxide to be related to the spinel formation of NiFeO [9] and Co(Cr,Fe)2O4 [56]. However, based on the XRD patterns presented in Figure 2, Figure 3 and Figure 4, no iron-containing spinel was detected in this study. Additionally, EDS analysis of a specific surface area, as shown in Figure 5, revealed the presence of oxides relatively rich in iron.
The XRD diffraction patterns of samples surface after oxidation at 900 and 1100 °C are depicted in Figure 2, Figure 3 and Figure 4. In both patterns, the highest intensity peaks indicate phases in the substrate, i.e., A1-FCC and B2-BCC that make the other peaks not exposed. Hu et al. [56] have also found relatively low intensity peaks of oxides in their oxidation investigation on AlCoCrFe at 1100 °C for 620 h. These facts were predicted as the results of a relatively thin layer of scales formed on the surface of all samples, even on the sample oxidized at 1100 °C for 168 h. At 900 °C oxides of NiO, CoO, α-Al2O3, θ-Al2O3, Cr2O3, and spinel of NiCr2O4 and NiAl2O4 were identified. Other oxides of CrO3 were found in the sample oxidized at 1100 °C.
Because the elements, except Co, are not homogeneously distributed in the alloy but tend to partition into A1 and B2, the oxidation would be initially localized in different phases when exposed to air at high temperatures. At the transient oxidation stage, A1 phase rich in Fe and Cr would form Cr2O3 and the iron oxides of FeO, Fe3O4, and Fe2O3, while B2 produces NiO and Al2O3. During this early stage, the spinel of FeCr2O4 and NiAl2O4, as well as (Fe,Co)Cr2O4 and (Ni,Co)Al2O4, can occur. Meanwhile, singular oxides of NiO and Al2O3 are expected to form from B2 phase. From both phases, CoO might also be formed. However, no iron oxides were found in the XRD patterns of samples oxidized at 900 and 1100 °C, even though the free energy formation for iron oxides are lower than that of NiO and CoO. It is also expected that mixed spinel of Ni(Cr,Al)2O4 might also form even though no XRD peak indicates these mixed oxides formation.
Diffractograms of CoO and NiO for 2 h oxidation indicate higher peaks compared with those obtained in longer times. Substitution reactions of these oxides with Al and Cr were predicted to be responsible for these facts. However, as the CoO and NiO formation require higher oxygen partial pressures and more stable oxides of Al2O3 and Cr2O3 have occurred in 16 and 40 h, no further CoO and NiO would be formed. From the occurrence of oxides on the samples oxidized in 2 h at 1100 °C, it is believed that the transient stage for oxidation has passed, which is especially indicated by the appearance of Al2O3 and Cr2O3. This steady-state formation of Al2O3 can be seen from increasing the intensity of α-Al2O3 peaks for 2θ of 35.141 and 35.141 planes with oxidation time. The intensity of Cr2O3 for 2θ of 41.615° plane also increased with time from 2 to 16 h but decreased from 16 to 40 h and disappeared after oxidation for 168 h. The formation of other stable oxides of Cr2O3 is also an indication for the end transient oxidation. However, this oxide would be further oxidized into CrO3 at 1100 °C but not at 900 °C.
Several clusters with ridge morphology occurred on the scale surface of the sample oxidized at 1000 °C for 40 h as shown in micrographs of Figure 6. This occurrence of ridge morphology indicates the formation of α-Al2O3. Zhang et al. [54] have reported previously that within an alloy system of Al-Co-Cr-Fe-Ni featuring a combination of BCC-B2 rich in Ni and Al, and FCC-A1 rich in Fe and Cr, the growth of columnar α-Al2O3 occurred longitudinally. Initially, α-Al2O3 emerged from the B2 phase, acting as a ridge, followed by the formation of columnar α-Al2O3 from the A1 phase at the base of the ridge. These characterization results support the findings of Doychack et al. [57] for θ-Al2O3 with platelet morphology. The different morphology of α-Al2O3 at 900 and 1000 °C for 40 h indicates that this alumina still maintained its metastable θ-Al2O3 morphology. The SEM photographs reveal that the surface samples oxidized at different temperatures exhibit distinct morphologies, indicating a significant impact of temperature on the kinetics of oxide formation. At 900 °C, platelets of Al2O3 and polyhedral of Cr2O3 were observed, and this difference in morphology is influenced by the formation kinetics of both oxides. The XRD patterns show that the Al2O3 appeared as monoclinic θ-Al2O3 and trigonal α-Al2O3 crystal structures. The results indicate that after being held at 900 °C for 40 h, certain portions of metastable θ-Al2O3 underwent a transformation into the more stable α-Al2O3. Levin [58] has previously discussed the transformation of different alumina crystal structures at high temperatures (γ → δ→ θ → α-Al2O3). The diffractograms also revealed the formation of both θ-Al2O3 and α-Al2O3 alumina oxides after being held at 1000 °C for 40 h. Additionally, clusters with ridge morphology were found in this study, indicating the formation of α-Al2O3. Zhang et al. [54] described the formation of ridge morphology in the AlCoCrFeNi alloy system. Initially, the longitudinal columnar of α-Al2O3 forms as a ridge, followed by the short columnar of α-Al2O3 located at the bottom of the ridge. Flake or platelet morphologies of α-Al2O3 were observed at 900 and 1000 °C, indicating that the stable α-Al2O3 still retained its previous metastable θ-Al2O3 morphology. In addition, some areas have relatively low oxygen and aluminum content, showing that spallation of alumina scale had happened, but did not expose freely the substrate. Similar phenomena have been found in oxidation of other alloy systems, i.e., Ni-Cr-Al-Zr [57].
The columnar structure of α-Al2O3 was also identified on the sample oxidized at 1100 °C for 40 h but showed cracks on the scales and some parts of the oxide scale had spalled. The occurrence of Al2O3 with whiskers morphology indicated that the transformation of platelet θ-Al2O3 into ridge α-Al2O3 had not fully occurred. Cracks and spallation that were also found in clusters with whiskers morphology show that this morphology had inadequate adherence, suggesting it did not form a compact scale. A relatively large difference in thermal expansion between the oxide scale and substrate was the cause of scale spallation. The addition of small amounts of elements of Ce, Hf, Y, or Zr less than 1% is expected and can increase the spalling resistance of the oxide scales [59,60].
EDS mapping on the surface sample after oxidation at 1100 °C for 168 h (7 days) is depicted in Figure 7. It is seen that most surface oxide of the scale is dominated by aluminum oxide. However, some parts of the scale show areas rich in Fe, Cr, Co, Ni, indicating that some part of alumina oxide scale had spalled and revealed areas of new exposed substrate. Oxidation at 1100 °C for 168 h produced oxides with different morphologies as seen in Figure 8. Whiskers, flakes, and needle-like morphologies were found on the scale surface, dominated by whiskers. No cracks were found on this scale, indicating that the oxide scale formed after a relatively long time of oxidation had a more compact protective scale. EDS analysis on this area confirmed that this oxide had relatively low aluminum content. Investigation carried out by Zhang et al. [54] has revealed that ring-like morphology was essentially Al2O3 below which spinel commenced to grow. The larger size of Al2O3 flake in the sample oxidized at 1100 °C for 168 compared with that which occurred in 40 h indicates that the scale is more protective, as the larger grains of oxide in the scale decrease the rate for scale formation [57].

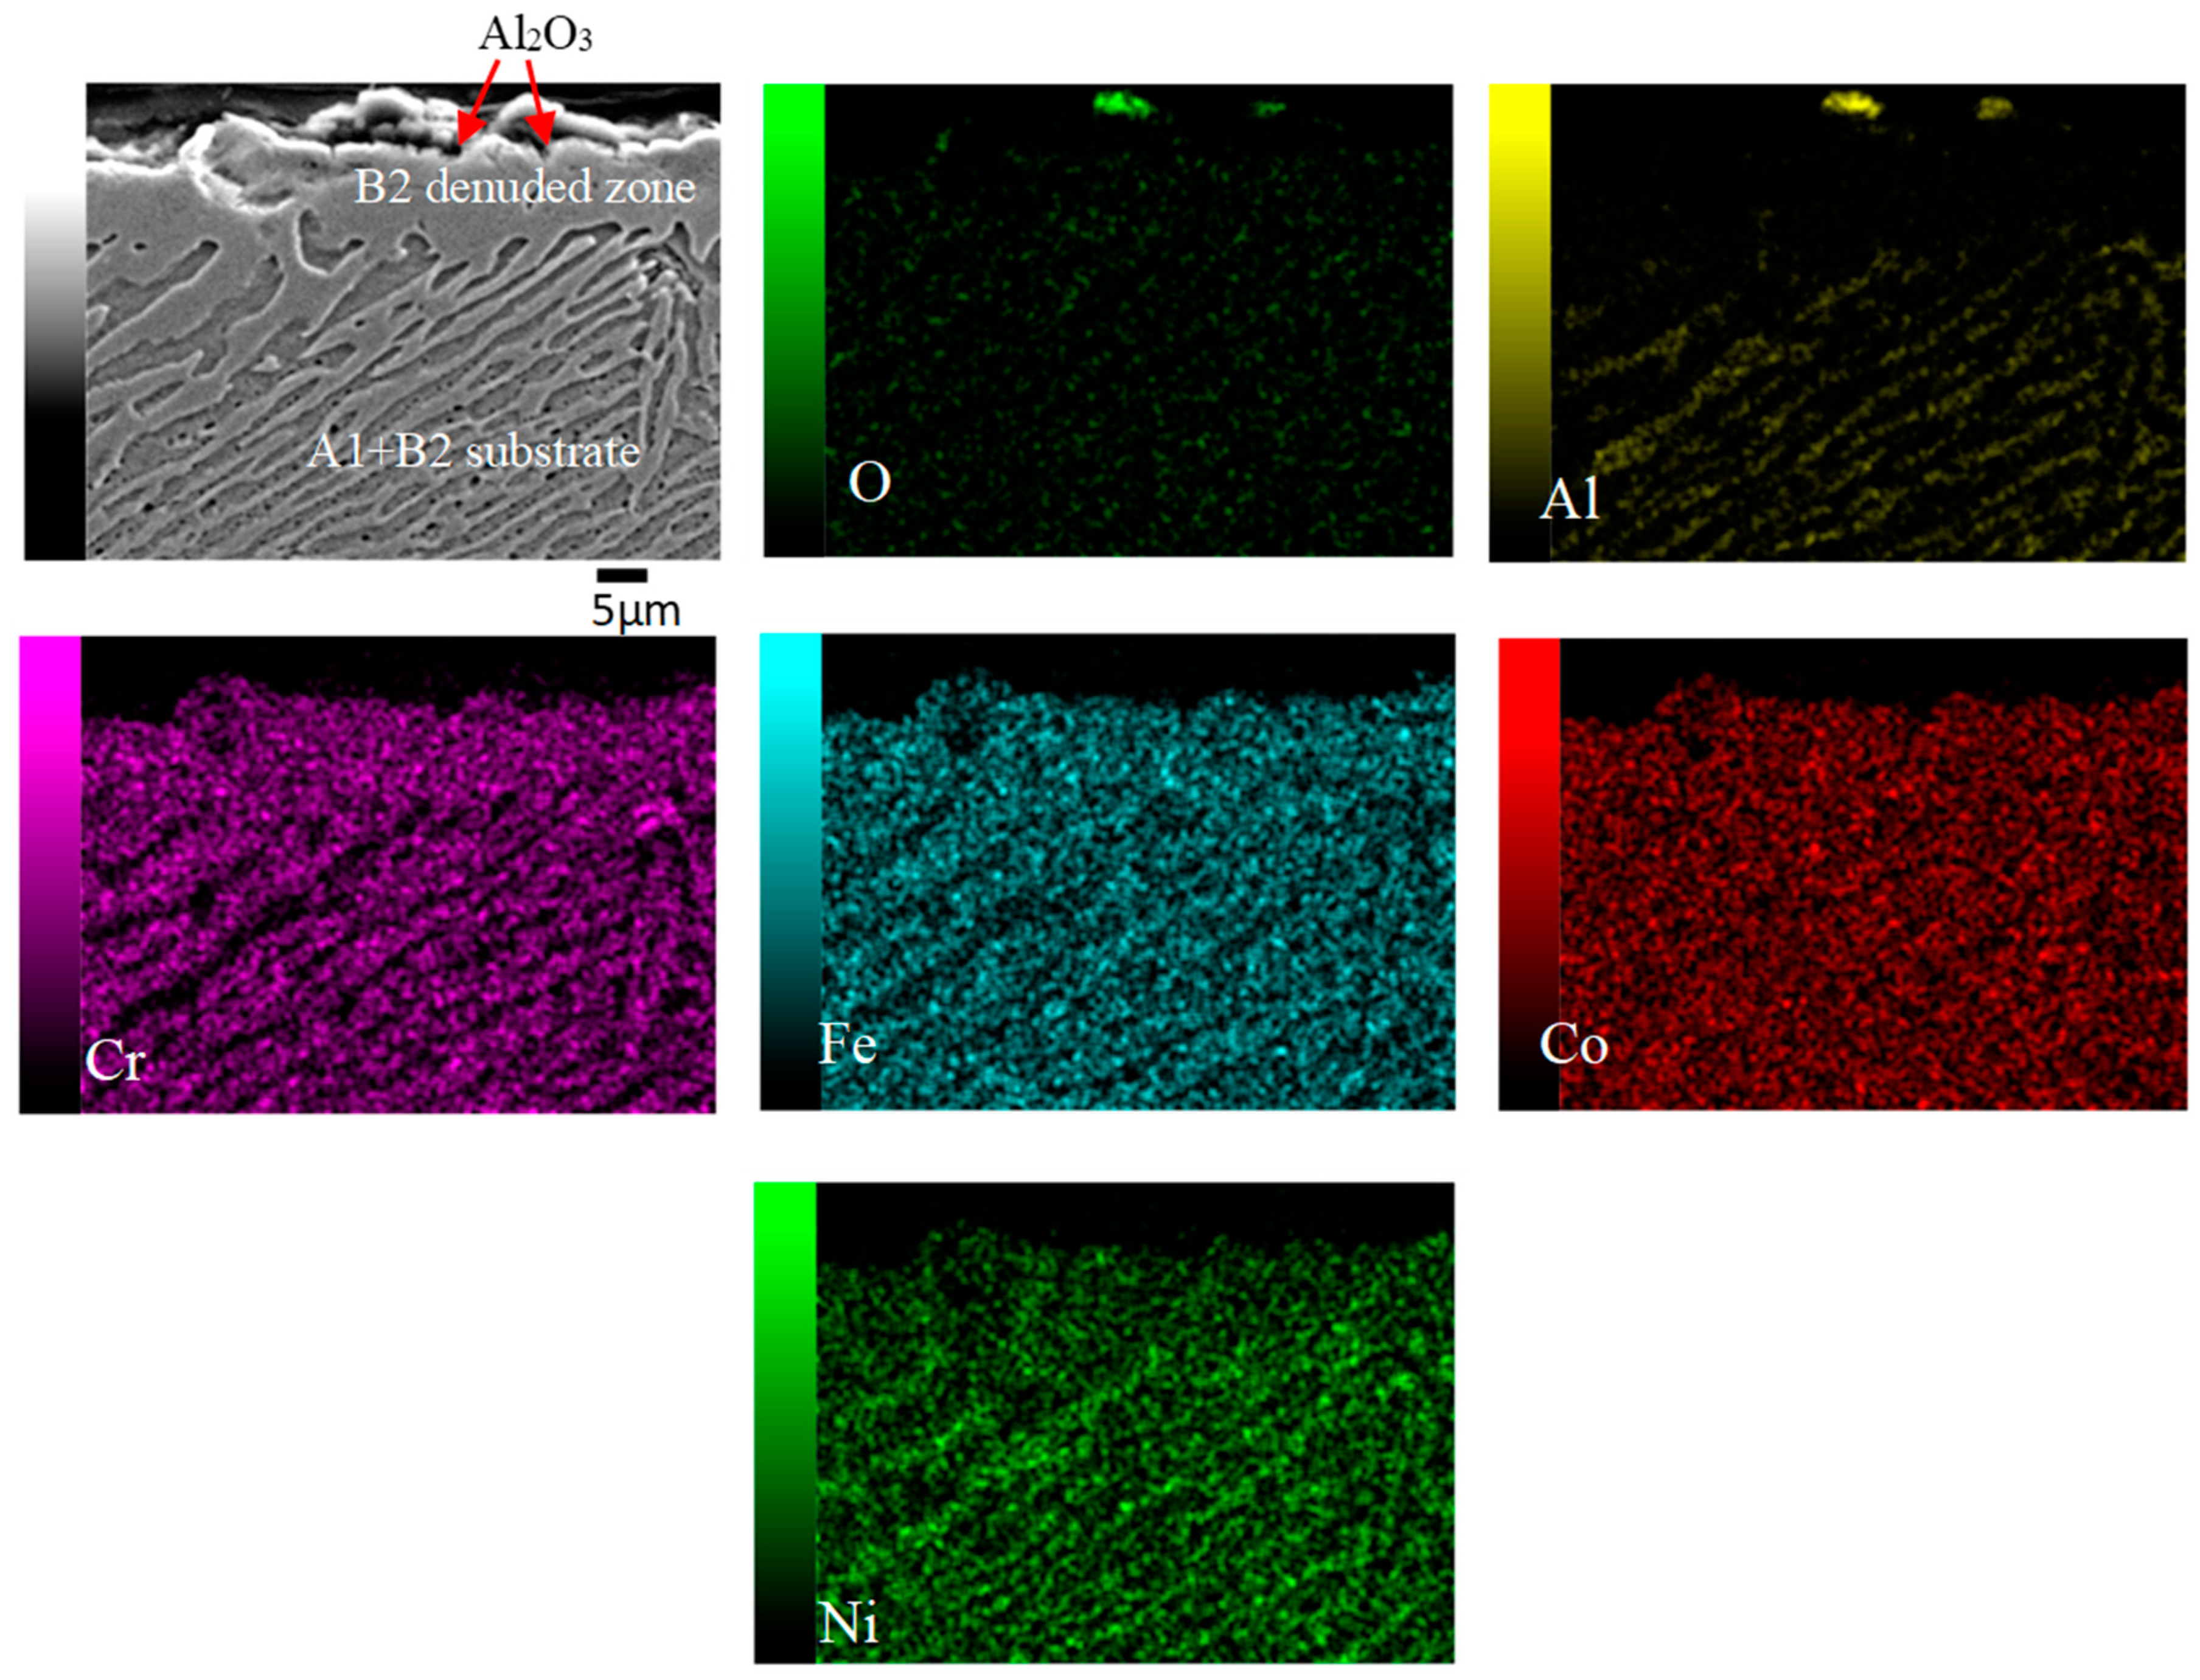
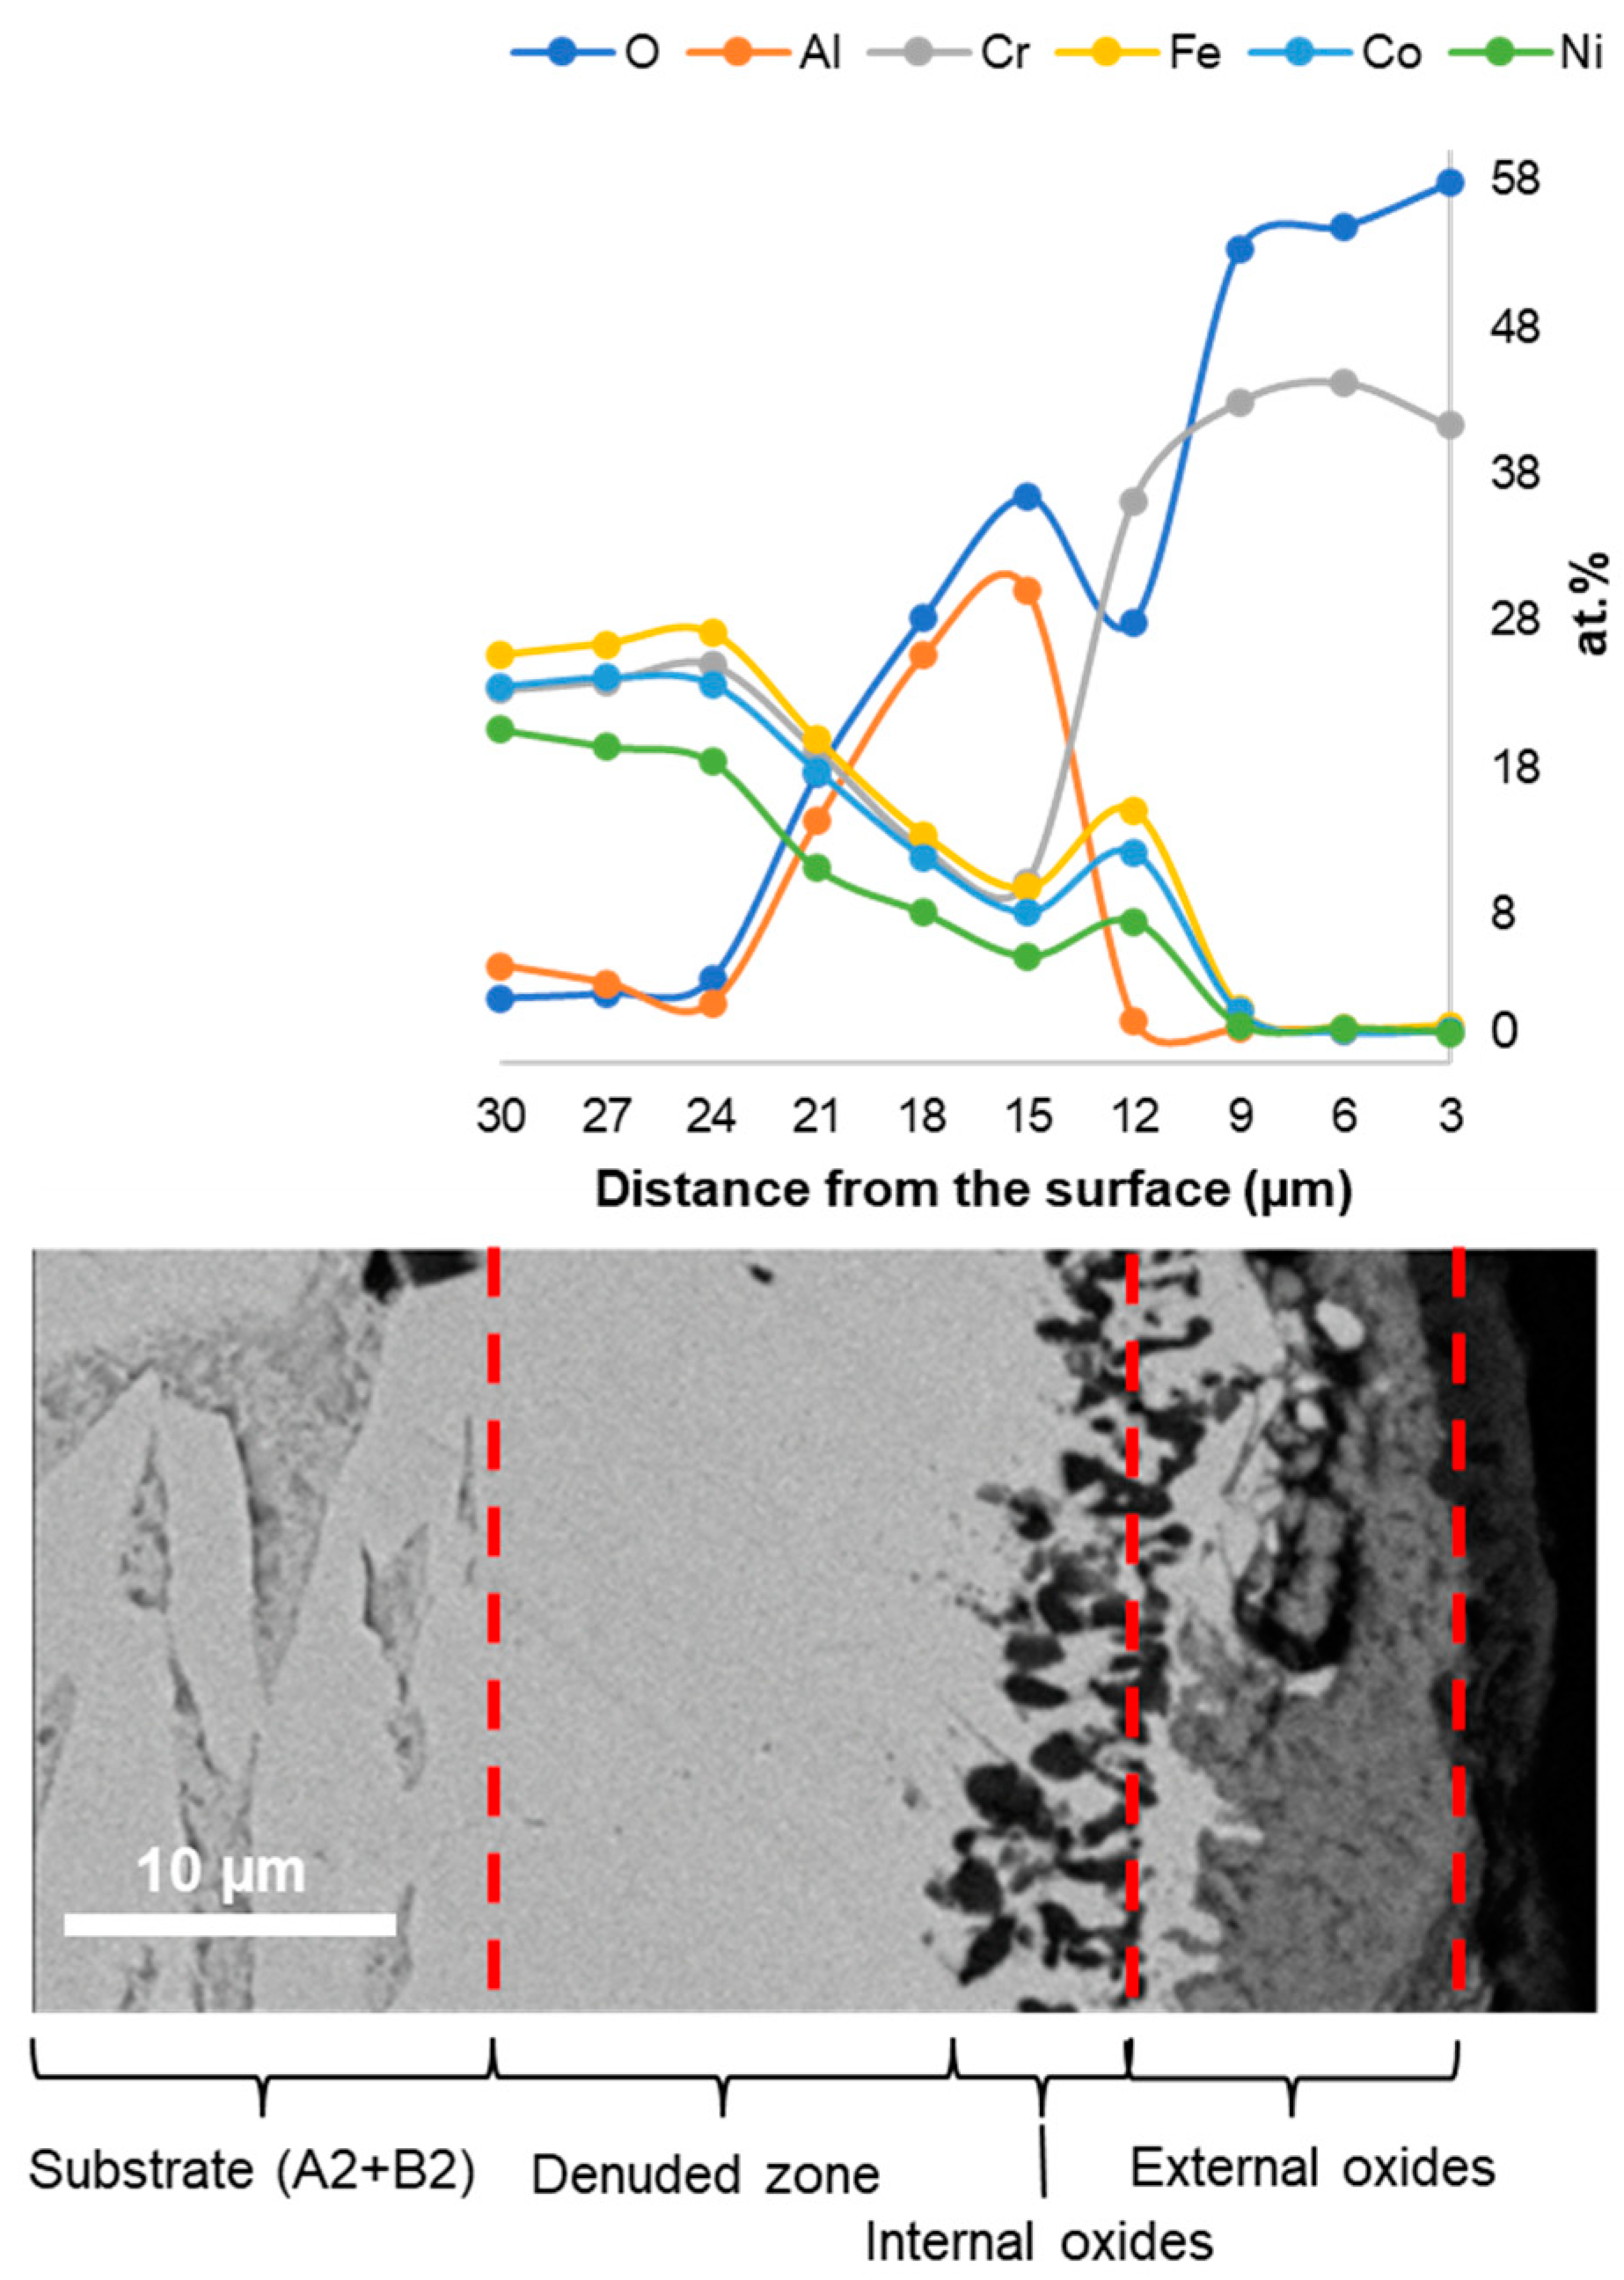
3.3.2. Cross-Section Analysis

EDS analysis on cross sections of the oxidized samples has been conducted to investigate different layers of oxides in the scales and the microstructure of substrate underneath the oxide scale. Figure 9 and Figure 10 show the microstructures of cross-section samples after oxidation at 900 and 1000 °C both for 40 h. The scales of both samples consist of essentially Al2O3 and Cr2O3, but the presence of spinel of NiCr2O4 + Al2O4 was also identified. All oxidized samples have shown the formation of a B2-denuded zone between the oxide scale and A1 + B2 substrate, as shown in Figure 9 and Figure 10. These zones are A1 phase, and the thickness was larger in the samples oxidized at higher temperatures and longer times. The EDS analysis on these regions has confirmed the depletion of Al as the result of platelet or flake θ-Al2O3 formation in the scale where Al3+ diffused outwardly in θ-Al2O3. However, no depletion of Cr has been found in these denuded zones, even though this element was used to produce polyhedral Cr2O3 in the scales. This indication of low diffusivity of Al in the denuded zone is due to the fact that Al has the largest Goldschmidt atomic radii [61].
Oxidation at 1100 °C for 2 h produced a relatively thick oxide scale, as can be seen in Figure 11. The EDS analysis on several areas from the outer zone up to the substrate has given variation in chemical compositions of the cross section. The elemental X-ray mappings show that most of the scale consists of aluminum oxide, probably Al2O3, but on the top of the scale, there were other transient oxides of Fe, Ni, and Co. Alumina remained as the major oxide scale when oxidation was extended in 16 h (see Figure 12). However, some parts of the substrate–oxide scale interface show buckling and produced cracks along the interface. This has resulted from the relatively large difference in volume between the oxides formed and metals origin in substrate that produce compressive stress.
The EDS analysis shows that at the bottom of the scale, below the α-Al2O3 layer, mixed oxides might occur, probably spinel and oxides of Fe, Co, and Ni. This indicates that the alumina layer in the scale acts as a protective layer. Equiaxed grains of alumina in this layer reduce oxygen diffusion inwardly through the scale, therefore decreasing the oxygen partial pressure [56]. Ellingham diagrams confirm that oxides of Cr, Fe, Co, and Ni require higher oxygen partial pressure than Al2O3. Substrate close to the substrate–scale interface had an aluminum content at a relatively high level of 7.81 at.%. that can produce an alumina scale as found in Ni-Cr-Al systems [9]. Oxidation at 1100 °C for 40 h produced a layer of Al2O3 at the external scale, as shown in Figure 13. A similar result was obtained by Butler et al. [9] when oxidation was carried out at 1050 °C for 50 h. The alumina layer consists of equiaxed grains of α-Al2O3, as also found by XRD analysis, showing the formation of ridge morphology, and acting as protective layer [56,57].
The EDS analysis, as discussed earlier, confirmed that the scale of the sample oxidized at 1100 °C for 168 h was essentially Al2O3. However, some areas were not covered by alumina, but oxides of other elements. The areas were exposed after some parts of alumina scale were spalled. Investigation into these areas in the cross-section position revealed that the scale consisted of external oxide of Cr2O3 beneath, and there were mixed oxides of iron, nickel, and cobalt as well as discrete internal oxide of Al2O3, as depicted in Figure 14. This characteristic of cross-section microstructure shows that these areas have experienced spallation during oxidation. Some Cr2O3 had further oxidized when exposed to oxygen in the air to form CrO3, as revealed by the XRD analysis.

3.4. Oxidation Mechanism

Referring to the study carried out by Butler et al. [9], there were significant differences between oxidation mechanisms of as-cast and as-homogenized Al0.75CoCrFeNi alloy. Oxidation of the as-cast alloy at 1050 °C produced an external oxide of chromia and internal oxide of alumina. Conversely, a single alumina layer was produced on the as-homogenized alloy. Stott et al. [62] have studied the oxidation behavior of MCrAl (M = Fe, Co, Ni) alloy and proposed eight different oxidation mechanisms. Meanwhile, Giggins and Pettit [63] proposed three oxidation mechanisms in Ni-Cr-Al alloy systems. Mohanty et al. [53] and Butler et al. [9] suggested that the oxidation mechanisms of this alloy follow type 3 of Giggins and Pettit, in which scale with external layer of Al2O3 and internal spinel or complex oxides would take place.
The microstructure of the alloy should affect the early stage of oxidation. Due to the presence of two phases in the Al0.75CoCrFeNi alloy—namely, A1-FCC rich in Fe and Cr, and B2-BCC rich in Ni and Al—with Co distributed relatively homogeneously across both phases, different oxidation mechanisms can occur on these phases. Iron and cobalt oxides form on the A1 surfaces, but then are reduced by Cr to produce Cr2O3 and spinel of FeCr2O4. Conversely, on the B2 phase, nickel and cobalt oxides are further reduced by Al, resulting in the formation of metastable Al2O3 and the spinel NiAl2O3.
The metastable oxide θ-Al2O3 undergoes transformation into the stable α-Al2O3 following a transient oxidation stage. After oxidation for 2 h, some θ-Al2O3 had transformed to α-Al2O3. At oxidation at 900 and 1000 °C, it is expected that the transformation of δ-Al2O3 to θ-Al2O3 might occur. However, as no δ-Al2O3 was found in this study, we predict that it was due to Ni2+ acting as an inhibitor for the formation of δ-Al2O3 [58]. The consumption of Al from B1 produces a B2-denuded zone underneath the oxide scales. This zone is essentially A1 as a result of both the dissolution of B2 and interdiffusion among elements in the B2-denuded zone and A1.
Meanwhile, the occurrence of Cr2O3 acts as oxygen absorber for the formation of Al2O3. In α-Al2O3, chromium can participate in a trigonal corundum as an isotope of Cr3+ [58]. Airiskallio et al. have discussed how the formation of Cr2O3 occurs faster compared with Al2O3. In this case, chromium diffuses along defects such as grain boundaries to the surface to form Cr2O3 and then the substitution reaction of Cr2O3 + 2Al → 2Cr + Al2O3 takes place. It should be noted that the crystal structure of corundum is similar to Cr2O3 and the substrate–chromia interface is believed to act as the nucleation site for corundum formation. These mechanisms explain why oxidation for 2 h at all temperatures studied produced a relatively continuous layer of Al2O3 in the scale on the overall alloy surface.
Following the transient stage, the subsequent steady state begins when scale growth is primarily dominated by a specific oxide. If the diffractogram of the sample oxidized at 900 °C is noticed, the dominant oxide that had higher peaks is Cr2O3 compared with other oxides. Oxides of NiO and CoO showed decreasing their intensity at similar 2θ planes. This could happen because of substitution reactions with Cr or Al that have higher affinity with oxygen. The formation of protective layers of Cr2O3 or Al2O3 reduces inward diffusion of O2− to the substrate–scale interface making partial pressure of O2− decrease. When the partial pressure of oxygen is inadequate for formation of NiO and CoO, then these oxides would not occur. This result follows Zhang et al. [54] who have reported that spinel and other oxides such as NiO and CuO were not increased with oxidation times when a protective layer of Al2O3 had formed.
Some parts of scale cracked and spalled when steady state stage was in progress. This happened in samples oxidized at 900 °C for 40 h. Meanwhile, stable alumina formed at 900 °C for 16 h and the percentage increased up to 40 h but was less than the amount of chromia. This is because the transformation into stable alumina mostly occurs at higher temperatures, i.e., 1000–1100 °C [58]. Therefore, oxidation of Al0.75CoCrFeNi alloy at 900 °C produced external scale consisting of alumina and chromia with CoO and NiO at the inner part of the scale.
In principle, a similar mechanism at 900 °C applies to the transient stage of oxidation at 1000 °C and 1100 °C. Stable alumina (α-Al2O3) formed in 2 h and then followed by Cr2O3 and transformation of NiAl2O4 to α-Al2O3 when oxidation was extended to 16 h. In addition, CrO3 has also occurred. Oxidation for 40 h caused some XRD peaks for Cr2O3 to disappear accompanied by decreasing CrO3 peaks. The reason for these facts is that Cr2O3 oxidized to form a volatile oxide of CrO3, but substitution of aluminum into Cr2O3 might also be possible [64]. Meanwhile, the intensity for NiO had increased with oxidation for 16 h, but no significant addition was found in 40 h. Similar phenomena had happened for CoO but some of its XRD peaks had disappeared in 40 h. Therefore, oxidation at 1000 and 1100 °C produced external Al2O3 at the outer part of the scale, below which a mixture of spinel as well as NiO and CoO occurred. However, some parts of the alumina layer had spalled exposing mixed oxides of Cr2O3, spinel, as well as NiO and CoO.
When characterizing the areas where alumina has spalled in the sample oxidized at 1100 °C for 168 h or 7 days, as shown in Figure 15, it is seen that the outer part of the scale consists of Cr2O3 and below it mixed oxides of iron, nickel, and cobalt. Internal oxide of Al2O3 was found distributed under the scale in the denuded zone. During oxidation at 1100 °C for longer periods, the formation of external layer of stable Al2O3 continued, consuming aluminum atoms from the denuded zone. While diffusion of Al from the substrate into interface substrate-Al2O3 interface is relatively slow and made this area rich in other elements. When Al2O3 was spalled and exposed to the air, this substrate oxidized and formed a layer of Cr2O3 on the outer part of the new scale, under which other mixed oxides of Fe, Ni, and Co were formed. Spinel of NiCr2O4 would be formed as the iron can reduce the activation energy of this spinel and increasing the diffusion of Ni and Cr in the substrate had increased the formation of this depleted aluminum spinel. Formation of spinel and other oxides occurs by increasing the aluminum content in the substrate. The low oxygen partial pressure in this substrate triggered the formation of Al2O3. However, because the aluminum concentration in this substrate was below the critical concentration for the formation of continuous Al2O3, further oxidation produced discrete internal oxide of Al2O3 [9,65,66].

3.5. Oxidation Kinetics

Figure 16 shows the specific weight changes of the oxidized samples in mg/cm2 at 900 and 1100 °C for different times in hours. Interesting results were identified for the sample oxidized at 1000 °C which decreased the weight change from 16 to 40 h. The most possible reason for this is that Cr2O3 further oxidized to form CrO3. The XRD results have shown that the peaks for Cr2O3 at 2θ of 33.675°; 36.336°; and 54.981° for the sample oxidized at 1000 for 16 h are relatively high but decreased after 40 h. The transformation of Cr2O3 into CrO3 has reduced the oxidized sample because the density of Cr2O3 is 5.22 gr/cm3 while CrO3 is 2.40 g/cm3. Meanwhile, the weight change curve for 1100 °C is in the position between the curves for 900 and 1000 °C. Two factors made this happen. The first is the fact that the dominant oxide formed at 1100 °C was Al2O3. The densities of the metastable oxides (δ-γ-θ-θ′-θ″), which are in the range of 3.6–3.65 gr/cm3, and the stable corundum, which has a density of 3.99 gr/cm3 [58], are all lower than that of Cr2O3 which is 5.22 gr/cm3. The second factor is that the oxidation of Cr2O3 to CrO3 was shown by the diffractogram of the 46.696° plane.
The oxidation kinetics of the Al0.75CoCrFeNi alloy were defined by carrying out fittings by power laws.
m = k t 1 n
where ∆m is the weight gain per initial surface area in mg/cm2, t is time in hours, k the oxidation rate constant, and n the time exponent. Table 2 displays the possible oxidation rates with the corresponding rate constants obtained after fitting. Previous studies have shown that the oxidation of AlCoCrFeNi HEAs follows parabolic rate laws [65]. In summary, the oxidation resistance of AlCoCrFeNi HEAs during isothermal oxidation tests is highly dependent on both temperature and time. It is important to note that this study focused on gaining a fundamental understanding of oxide formation and growth mechanisms through relatively short-term oxidation tests, rather than detailed oxidation kinetics such as oxidation rate.

3.6. Microstructural Evolution

The volume fraction of B2 in the alloy originally in the as-homogenized sample is 48.98%, and this is slightly higher compared with the 45% that was found in the alloy studied by Shi et al. Heating at high temperatures for various times resulted in decreasing the volume fraction of the B2 phase, as shown in Figure 17a. Two possibilities are predicted as the cause of this phenomenon. Firstly, the consumption of aluminum from the B2 phase as Al-rich phase for alumina scale formation during oxidation. Secondly, it is due to the coarsening of the B2 phase triggered by the reduction in the B2-A1 interface for decreasing the Gibbs free energy of the alloy. While the first possibility has been supported by Lu et al. [66], coarsening of the second phase during heating has been rigorously investigated in many alloy systems, especially in nickel-based superalloys containing precipitates of γ′-Ni3(Al,Ti) [67]. As B2 was basically in plate morphology, coarsening of B2 was measured from the changing in thickness of the B2 plates. As shown in Figure 17b, the thickness of the B2 plates increased with time. This microstructural change was accompanied by decreasing the hardness, as shown in Figure 18.
Moreover, the microstructures shown in Figure 19 indicate the formation of a B2 depletion zone underneath oxide scales due to the need for aluminum for alumina formation. Dissolution of B2 commenced when aluminum in B2 diffused into the A1 matrix and further diffused to the matrix–alumina interface. While the depletion zone enlarged with time, the B2 phase changed its morphology into more rounded, the process is known as spheroidization, as also found by John et al. [68] in Al0.7CoCrFeNi HEA when the alloy was heated at 1000 °C for 1 h. This spheroidization is expected to occur together with the coarsening process [69].

4. Conclusions

High-temperature oxidation simulations were conducted on Al0.75CoCrFeNi HEA to investigate the oxidation behavior and microstructural changes of the matrix at 900, 1000, and 1100 °C for 2, 16, and 40 h. The SEM-EDS confirmed that the materials had microstructure typically consisting of lamellar A1 and B2 phases, as predicted by the Hume Rothery law and valency electron concentration value. During oxidation, the B2 phase in the matrix underwent spheroidization, resulting in a decrease in its volume fraction and a reduction in the matrix hardness. The scales that formed on the surface of the oxidized samples consisted of various oxides, including CoO, NiO, Cr2O3, and CrO3, alumina (θ-Al2O3 and α-Al2O3), as well as Ni(Cr,Al)2O4. At temperatures higher than 1000 °C for 168 h, the Al2O3 did not cover the entire scale surface but instead formed as islands. Complex oxides occurred on the cluster without alumina. At the lower temperature of 900 °C, the external scale consisted of alternating layers of alumina and chromia, underneath which complex oxides were present.

Author Contributions

Conceptualization, M.A.A., B.P., B.H.J. and E.A.B.; Methodology, M.A.A., B.P., B.H.J. and E.A.B.; Validation, A.A.K., M.A.A., F.M., T.L.A. and E.A.B.; Formal analysis, M.A.A. and M.H.S.; Investigation, A.A.K., M.A.A., F.M., T.L.A. and E.A.B.; Data curation, M.A.A. and M.H.S.; Writing—original draft, A.A.K., M.A.A. and E.A.B.; Writing—review & editing, F.M., T.L.A., B.P., D.H.P., B.H.J. and M.H.S.; Resources, B.P. and D.H.P.; Funding acquisition, E.A.B. All authors have read and agreed to the published version of the manuscript.

Funding

This research was funded by the Program Riset dan Inovasi untuk Indonesia Maju (RIIM) Gelombang 2 the National Research and Innovation Agency (BRIN) and Educational Fund Management Institution (LPDP), grant number 78/IV/KS/11/2022 and 834/IT1.B07/KS.00/2022.

Data Availability Statement

The data presented in this study are available on request from the corresponding author. The data are not publicly available due to privacy.

Acknowledgments

The authors would like to acknowledge the support from PT Gunbuster Nickel Industry for providing the SEM-EDS (JCM-7000 NeoScope™, JEOL, Tokyo, Japan) used for analysis the samples in this work.

Conflicts of Interest

The authors declare no conflict of interest.

References

  1. Turchi, A.; Bianchi, D.; Nasuti, F.; Onofri, M. A Numerical Approach for the Study of the Gas–Surface Interaction in Carbon–Phenolic Solid Rocket Nozzles. Aerosp. Sci. Technol. 2013, 27, 25–31. [Google Scholar] [CrossRef]
  2. Katsarelis, C.; Chen, P.; Gradl, P.; Protz, C.; Jones, Z.; Ellis, D.; Evans, L. Additive Manufacturing of NASA HR-1 Material for Liquid Rocket Engine Component Applications. In Proceedings of the JANNAF Dec 2019; Tampa, FL, USA, 9–13 December 2019. Available online: https://ntrs.nasa.gov/search.jsp?R=20200001007 (accessed on 31 May 2023).
  3. Shahwaz, M.; Nath, P.; Sen, I. A Critical Review on the Microstructure and Mechanical Properties Correlation of Additively Manufactured Nickel-Based Superalloys. J. Alloys Compd. 2022, 907, 164530. [Google Scholar] [CrossRef]
  4. Pollock, T.M.; Tin, S. Nickel-Based Superalloys for Advanced Turbine Engines: Chemistry, Microstructure and Properties. J. Propuls. Power 2006, 22, 361–374. [Google Scholar] [CrossRef]
  5. Xia, W.; Zhao, X.; Yue, L.; Zhang, Z. A Review of Composition Evolution in Ni-Based Single Crystal Superalloys. J. Mater. Sci. Technol. 2020, 44, 76–95. [Google Scholar] [CrossRef]
  6. Heilmaier, M.; Krüger, M.; Saage, H.; Rösler, J.; Mukherji, D.; Glatzel, U.; Völkl, R.; Hüttner, R.; Eggeler, G.; Somsen, C.; et al. Metallic Materials for Structural Applications beyond Nickel-Based Superalloys. JOM 2009, 61, 61–67. [Google Scholar] [CrossRef]
  7. Yeh, A.-C.; Tsao, T.K.; Chang, Y.J.; Chang, K.C.; Yeh, J.-W.; Chiou, M.-S.; Jian, S.-R.; Kuo, C.-M.; Wang, W.R.; Murakami, H. Developing New Type of High Temperature Alloys–High Entropy Superalloys. Metall. Mater. Eng. 2015, 2015, 1–4. [Google Scholar]
  8. Li, Z.; Pradeep, K.G.; Deng, Y.; Raabe, D.; Tasan, C.C. Metastable High-Entropy Dual-Phase Alloys Overcome the Strength–Ductility Trade-Off. Nature 2016, 534, 227–230. [Google Scholar] [CrossRef]
  9. Butler, T.M.; Pavel, M.J.; Weaver, M.L. The Effect of Annealing on the Microstructures and Oxidation Behaviors of AlCoCrFeNi Complex Concentrated Alloys. J. Alloys Compd. 2023, 956, 170391. [Google Scholar] [CrossRef]
  10. Murty, B.S. High-Entropy Alloys; Butterworth-Heinemann: Oxford, UK, 2014. [Google Scholar]
  11. Cantor, B.; Chang, I.T.H.; Knight, P.; Vincent, A.J.B. Microstructural Development in Equiatomic Multicomponent Alloys. Mater. Sci. Eng. A 2004, 375–377, 213–218. [Google Scholar] [CrossRef]
  12. Yeh, J.W.; Chen, S.K.; Lin, S.J.; Gan, J.Y.; Chin, T.S.; Shun, T.T.; Tsau, C.H.; Chang, S.Y. Nanostructured High-Entropy Alloys with Multiple Principal Elements: Novel Alloy Design Concepts and Outcomes. Adv. Eng. Mater. 2004, 6, 299–303. [Google Scholar] [CrossRef]
  13. Tokarewicz, M.; Grądzka-Dahlke, M. Review of Recent Research on AlCoCrFeNi High-Entropy Alloy. Metals 2021, 11, 1302. [Google Scholar] [CrossRef]
  14. Wu, J.; Yang, Z.; Xian, J.; Gao, X.; Lin, D.; Song, H. Structural and Thermodynamic Properties of the High-Entropy Alloy AlCoCrFeNi Based on First-Principles Calculations. Front. Mater. 2020, 7, 590143. [Google Scholar] [CrossRef]
  15. Bhadeshia, H.K.D.H. High Entropy Alloys. Mater. Sci. Technol. 2015, 31, 1139–1141. [Google Scholar] [CrossRef]
  16. Zhang, Y.; Zuo, T.T.; Tang, Z.; Gao, M.C.; Dahmen, K.A.; Liaw, P.K.; Lu, Z.P. Microstructures and Properties of High-Entropy Alloys. Prog. Mater. Sci. 2014, 61, 1–93. [Google Scholar] [CrossRef]
  17. Miracle, D.B.; Senkov, O.N. A Critical Review of High Entropy Alloys and Related Concepts. Acta Mater. 2017, 122, 448–511. [Google Scholar] [CrossRef]
  18. Jayaraj, J.; Thirathipviwat, P.; Han, J.; Gebert, A. Microstructure, Mechanical and Thermal Oxidation Behavior of AlNbTiZr High Entropy Alloy. Intermetallics 2018, 100, 9–19. [Google Scholar] [CrossRef]
  19. Zhang, J.J.; Yin, X.L.; Dong, Y.; Lu, Y.P.; Jiang, L.; Wang, T.M.; Li, T.J. Corrosion Properties of AlxCoCrFeNiTi0·5 High Entropy Alloys in 0·5M H2SO4 Aqueous Solution. Mater. Res. Innov. 2014, 18 (Suppl. S4), S4-756–S4-760. [Google Scholar] [CrossRef]
  20. Lu, C.; Yang, T.; Jin, K.; Gao, N.; Xiu, P.; Zhang, Y.; Gao, F.; Bei, H.; Weber, W.J.; Sun, K.; et al. Radiation-Induced Segregation on Defect Clusters in Single-Phase Concentrated Solid-Solution Alloys. Acta Mater. 2017, 127, 98–107. [Google Scholar] [CrossRef]
  21. Yang, T.; Xia, S.; Guo, W.; Hu, R.; Poplawsky, J.D.; Sha, G.; Fang, Y.; Yan, Z.; Wang, C.; Li, C.; et al. Effects of Temperature on the Irradiation Responses of Al0.1CoCrFeNi High Entropy Alloy. Scr. Mater. 2018, 144, 31–35. [Google Scholar] [CrossRef]
  22. Vaidya, M.; Pradeep, K.G.; Murty, B.S.; Wilde, G.; Divinski, S.V. Bulk Tracer Diffusion in CoCrFeNi and CoCrFeMnNi High Entropy Alloys. Acta Mater. 2018, 146, 211–224. [Google Scholar] [CrossRef]
  23. Vaidya, M.; Trubel, S.; Murty, B.S.; Wilde, G.; Divinski, S.V. Ni Tracer Diffusion in CoCrFeNi and CoCrFeMnNi High Entropy Alloys. J. Alloys Compd. 2016, 688, 994–1001. [Google Scholar] [CrossRef]
  24. Stryzhyboroda, O.; Witusiewicz, V.T.; Gein, S.; Röhrens, D.; Hecht, U. Phase Equilibria in the Al–Co–Cr–Fe–Ni High Entropy Alloy System: Thermodynamic Description and Experimental Study. Front. Mater. 2020, 7, 270. [Google Scholar] [CrossRef]
  25. Jones, N.G.; Izzo, R.; Mignanelli, P.M.; Christofidou, K.A.; Stone, H.J. Phase Evolution in an Al0.5CrFeCoNiCu High Entropy Alloy. Intermetallics 2016, 71, 43–50. [Google Scholar] [CrossRef]
  26. Pickering, E.J.; Jones, N.G. High-Entropy Alloys: A Critical Assessment of Their Founding Principles and Future Prospects. Int. Mater. Rev. 2016, 61, 183–202. [Google Scholar] [CrossRef]
  27. Xia, S.; Wang, Z.; Yang, T.; Zhang, Y. Irradiation Behavior in High Entropy Alloys. J. Iron Steel Res. Int. 2015, 22, 879–884. [Google Scholar] [CrossRef]
  28. Yeh, J.-W.; Chang, S.-Y.; Hong, Y.-D.; Chen, S.-K.; Lin, S.-J. Anomalous Decrease in X-Ray Diffraction Intensities of Cu–Ni–Al–Co–Cr–Fe–Si Alloy Systems with Multi-Principal Elements. Mater. Chem. Phys. 2007, 103, 41–46. [Google Scholar] [CrossRef]
  29. Esmaily, M.; Qiu, Y.; Bigdeli, S.; Venkataraman, M.B.; Allanore, A.; Birbilis, N. High-Temperature Oxidation Behaviour of AlxFeCrCoNi and AlTiVCr Compositionally Complex Alloys. NPJ Mater. Degrad. 2020, 4, 25. [Google Scholar] [CrossRef]
  30. Listyawan, T.A.; Agustianingrum, M.P.; Na, Y.S.; Lim, K.R.; Park, N. Improving High-Temperature Oxidation Behavior by Modifying Al and Co Content in Al–Co–Cr–Fe–Ni High-Entropy Alloy. J. Mater. Sci. Technol. 2022, 129, 115–126. [Google Scholar] [CrossRef]
  31. Veselkov, S.; Samoilova, O.; Shaburova, N.; Trofimov, E. High-Temperature Oxidation of High-Entropic Alloys: A Review. Materials 2021, 14, 2595. [Google Scholar] [CrossRef]
  32. Lu, J.; Ren, G.; Chen, Y.; Zhang, H.; Li, L.; Huang, A.; Liu, X.; Cai, H.; Shan, X.; Luo, L.; et al. Unraveling the Oxidation Mechanism of an AlCoCrFeNi High-Entropy Alloy at 1100 °C. Corros. Sci. 2022, 209, 110736. [Google Scholar] [CrossRef]
  33. Butler, T.M.; Weaver, M.L. Oxidation Behavior of Arc Melted AlCoCrFeNi Multi-Component High-Entropy Alloys. J. Alloys Compd. 2016, 674, 229–244. [Google Scholar] [CrossRef]
  34. Yang, X.; Zhang, Y. Prediction of High-Entropy Stabilized Solid-Solution in Multi-Component Alloys. Mater. Chem. Phys. 2012, 132, 233–238. [Google Scholar] [CrossRef]
  35. He, M.-R.; Wang, S.; Shi, S.; Jin, K.; Bei, H.; Yasuda, K.; Matsumura, S.; Higashida, K.; Robertson, I.M. Mechanisms of Radiation-Induced Segregation in CrFeCoNi-Based Single-Phase Concentrated Solid Solution Alloys. Acta Mater. 2017, 126, 182–193. [Google Scholar] [CrossRef]
  36. Pickering, E.J.; Muñoz-Moreno, R.; Stone, H.J.; Jones, N.G. Precipitation in the Equiatomic High-Entropy Alloy CrMnFeCoNi. Scr. Mater. 2016, 113, 106–109. [Google Scholar] [CrossRef]
  37. Guo, X.; Yu, J.; Hou, Y.; Zhang, Y.; Wang, J.; Li, X.; Liao, H.; Ren, Z. Manganese Removal from Liquid Nickel by Hydrogen Plasma Arc Melting. Materials 2019, 12, 33. [Google Scholar] [CrossRef] [PubMed]
  38. Guo, S.; Ng, C.; Lu, J.; Liu, C.T. Effect of Valence Electron Concentration on Stability of Fcc or Bcc Phase in High Entropy Alloys. J. Appl. Phys. 2011, 109. [Google Scholar] [CrossRef]
  39. Wu, J.-M.; Lin, S.-J.; Yeh, J.-W.; Chen, S.-K.; Huang, Y.-S.; Chen, H.-C. Adhesive Wear Behavior of AlxCoCrCuFeNi High-Entropy Alloys as a Function of Aluminum Content. Wear 2006, 261, 513–519. [Google Scholar] [CrossRef]
  40. Bernhard, M.; Fuchs, N.; Presoly, P.; Angerer, P.; Friessnegger, B.; Bernhard, C. Characterization of the γ-Loop in the Fe-P System by Coupling DSC and HT-LSCM with Complementary in-Situ Experimental Techniques. Mater. Charact. 2021, 174, 111030. [Google Scholar] [CrossRef]
  41. Egami, T. Atomic Level Stresses. Prog. Mater. Sci. 2011, 56, 637–653. [Google Scholar] [CrossRef]
  42. Ramunni, V.P.; Rivas, A.M.F. Diffusion Behavior of Cr Diluted in Bcc and Fcc Fe: Classical and Quantum Simulation Methods. Mater. Chem. Phys. 2015, 162, 659–670. [Google Scholar] [CrossRef]
  43. Hsieh, C.-C.; Wu, W. Overview of Intermetallic Sigma Phase Precipitation in Stainless Steels. ISRN Met. 2012, 2012, 732471. [Google Scholar] [CrossRef]
  44. Wang, X.J.; Xu, M.; Liu, N.; Liu, L.X. The Formation of Sigma Phase in the CoCrFeNi High-Entropy Alloys. Mater. Res. Express 2021, 8, 076514. [Google Scholar] [CrossRef]
  45. Wang, W.-R.; Wang, W.-L.; Yeh, J.-W. Phases, Microstructure and Mechanical Properties of AlxCoCrFeNi High-Entropy Alloys at Elevated Temperatures. J. Alloys Compd. 2014, 589, 143–152. [Google Scholar] [CrossRef]
  46. de Jeer, L.T.H.; Ocelík, V.; De Hosson, J.T.M. Orientation Relationships in Al0.7CoCrFeNi High-Entropy Alloy. Microsc. Microanal. 2017, 23, 905–915. [Google Scholar] [CrossRef] [PubMed]
  47. Hecht, U.; Gein, S.; Stryzhyboroda, O.; Eshed, E.; Osovski, S. The BCC-FCC Phase Transformation Pathways and Crystal Orientation Relationships in Dual Phase Materials from Al-(Co)-Cr-Fe-Ni Alloys. Front. Mater. 2020, 7, 287. [Google Scholar] [CrossRef]
  48. Gwalani, B.; Wang, T.; Jagetia, A.; Gangireddy, S.; Muskeri, S.; Mukherjee, S.; Lloyd, J.T.; Banerjee, R.; Mishra, R.S. Dynamic Shear Deformation of a Precipitation Hardened Al0.7CoCrFeNi Eutectic High-Entropy Alloy Using Hat-Shaped Specimen Geometry. Entropy 2020, 22, 431. [Google Scholar] [CrossRef] [PubMed]
  49. Abuzaid, W.; Sehitoglu, H. Plastic Strain Partitioning in Dual Phase Al13CoCrFeNi High Entropy Alloy. Mater. Sci. Eng. A 2018, 720, 238–247. [Google Scholar] [CrossRef]
  50. Asabre, A.; Gemagami, P.; Parsa, A.B.; Wagner, C.; Kostka, A.; Laplanche, G. Influence of Mo/Cr Ratio on the Lamellar Microstructure and Mechanical Properties of as-Cast Al0.75CoCrFeNi Compositionally Complex Alloys. J. Alloys Compd. 2022, 899, 163183. [Google Scholar] [CrossRef]
  51. Liu, M.; Zhang, S.; Li, F.; Wang, L.; Wang, Z.; Wang, Z.; Sha, Y.; Shen, Q. Effect of Annealing Treatment on the Microstructure and Hardness of AlxCoCrFeNi (x = 0.75, 1.25) High Entropy Alloys. J. Mater. Eng. Perform. 2022, 31, 1444–1455. [Google Scholar] [CrossRef]
  52. Benz, M.G. Preparation of Clean Superalloys. In Impurities in Engineering Materials: Impact, Reliability, and Control; Briant, C., Ed.; Routledge: New York, NY, USA, 2017; pp. 31–48. [Google Scholar] [CrossRef]
  53. Mohanty, A.; Sampreeth, J.K.; Bembalge, O.; Hascoet, J.Y.; Marya, S.; Immanuel, R.J.; Panigrahi, S.K. High Temperature Oxidation Study of Direct Laser Deposited AlXCoCrFeNi (X = 0.3,0.7) High Entropy Alloys. Surf. Coat. Technol. 2019, 380, 125028. [Google Scholar] [CrossRef]
  54. Zhang, F.; Wang, L.; Yan, S.; Yu, G.; Chen, J.; Yin, F. High Temperature Oxidation Behavior of Atmosphere Plasma Sprayed AlCoCrFeNi High-Entropy Alloy Coatings. Mater. Chem. Phys. 2022, 282, 125939. [Google Scholar] [CrossRef]
  55. Gleeson, B. High-Temperature Corrosion of Metallic Alloys and Coatings. In Materials Science and Technology: A Comprehensive Treatment; Wiley: Hoboken, NJ, USA, 2000; pp. 173–228. [Google Scholar] [CrossRef]
  56. Hu, J.; Gu, C.; Li, J.; Li, C.; Feng, J.; Jiang, Y. Microstructure and Oxidation Behavior of the Y/Ta/Hf Co-Doped AlCoCrFeNi High-Entropy Alloys in Air at 1100 °C. Corros. Sci. 2023, 212, 110930. [Google Scholar] [CrossRef]
  57. Doychak, J.; Smialek, J.L.; Mitchell, T.E. Transient Oxidation of Single-Crystal β-NiAl. Met. Trans. A 1989, 20, 499–518. [Google Scholar] [CrossRef]
  58. Levin, I.; Brandon, D. Metastable Alumina Polymorphs: Crystal Structures and Transition Sequences. J. Am. Ceram. Soc. 1998, 81, 1995–2012. [Google Scholar] [CrossRef]
  59. Lu, J.; Chen, Y.; Zhang, H.; Ni, N.; Li, L.; He, L.; Mu, R.; Zhao, X.; Guo, F. Y/Hf-Doped AlCoCrFeNi High-Entropy Alloy with Ultra Oxidation and Spallation Resistance. Corros. Sci. 2020, 166. [Google Scholar] [CrossRef]
  60. Babic, V.; Geers, C.; Panas, I. Reactive Element Effects in High-Temperature Alloys Disentangled. Oxid. Met. 2020, 93, 229–245. [Google Scholar] [CrossRef]
  61. Takeuchi, A.; Inoue, A. Quantitative Evaluation of Critical Cooling Rate for Metallic Glasses. Mater. Sci. Eng. A 2001, 304–306, 446–451. [Google Scholar] [CrossRef]
  62. Stott, F.H.; Wood, G.C.; Hobby, M.G. A Comparison of the Oxidation Behavior of Fe-Cr-Al, Ni-Cr-Al, and Co-Cr-Al Alloys. Oxid. Met. 1971, 3, 103–113. [Google Scholar] [CrossRef]
  63. Giggins, C.S.; Pettit, F.S. Oxidation of Ni-Cr-Al Alloys between 1000° and 1200 °C. J. Electrochem. Soc. 1971, 118, 1782–1790. [Google Scholar] [CrossRef]
  64. Uhlig, H.H. Initial Oxidation Rate of Metals and the Logarithmic Equation. Acta Met. 1956, 4, 541–554. [Google Scholar] [CrossRef]
  65. Gabrysiak, K.N.; Gaitzsch, U.; Weißgärber, T.; Kieback, B. Oxidation and Hot Gas Corrosion of Al–Cr–Fe–Ni-Based High-Entropy Alloys with Addition of Co and Mo. Adv. Eng. Mater. 2021, 23, 2100237. [Google Scholar] [CrossRef]
  66. Lu, J.; Li, L.; Zhang, H.; Chen, Y.; Luo, L.; Zhao, X.; Guo, F.; Xiao, P. Oxidation Behavior of Gas-Atomized AlCoCrFeNi High-Entropy Alloy Powder at 900–1100 °C. Corros. Sci. 2021, 181, 109257. [Google Scholar] [CrossRef]
  67. Tang, S.; Ning, L.K.; Xin, T.Z.; Zheng, Z. Coarsening Behavior of Gamma Prime Precipitates in a Nickel Based Single Crystal Superalloy. J. Mater. Sci. Technol. 2016, 32, 172–176. [Google Scholar] [CrossRef]
  68. John, R.; Nagini, M.; Govind, U.; Malladi, S.R.K.; Murty, B.S.; Fabijanic, D. Microstructural Evolution and Effect of Heat Treatment on the Precipitation and Mechanical Behavior of Al0.7CoCrFeNi Alloy. J. Alloys Compd. 2022, 904, 164105. [Google Scholar] [CrossRef]
  69. Xu, J.; Zeng, W.; Zhang, X.; Zhou, D. Analysis of Globularization Modeling and Mechanisms of Alpha/Beta Titanium Alloy. J. Alloys Compd. 2019, 788, 110–117. [Google Scholar] [CrossRef]
Figure 1. Microstructure of as-homogenized sample (a) in an optical micrograph and (b) the corresponding elemental EDS mapping.
Metals 14 00033 g001
Figure 2. X-ray diffraction patterns of the alloy after oxidation 900 °C for 2 up to 40 h.
Metals 14 00033 g002
Figure 3. X-ray diffraction patterns of the alloy after oxidation 1000 °C for 2 up to 40 h.
Metals 14 00033 g003
Figure 4. X-ray diffraction patterns of the alloy after oxidation 1100 °C for 2 up to 168 h.
Metals 14 00033 g004
Figure 5. (a) Back scattered Electron image and (b) secondary electron image of the surface microstructure, and corresponding EDS analysis of the sample after oxidation at 900 °C for 40 h showing (c) plate and (d) polyhedral morphologies. Points 1 and 2 in (a,b) indicate the area of EDS analysis with chemical composition as shown in the table.
Metals 14 00033 g005
Figure 6. Surface microstructure and corresponding EDS analysis of the sample after oxidation at 1000 °C for 40 h showing flakes and ridge morphologies. Point 1, 2, and 3 indicate the area of EDS analysis with chemical composition as shown in the table.
Metals 14 00033 g006
Figure 7. Surface microstructure and EDS mapping of the sample after oxidation at 1100 °C for 168 h.
Metals 14 00033 g007
Figure 8. Surface microstructure and corresponding EDS analysis of the sample after oxidation at 1100 °C for 168 h. Points 1–5 indicate the area of EDS analysis with chemical composition as shown in the table.
Metals 14 00033 g008
Figure 9. Microstructure and EDS mapping of a cross-section sample after oxidized at 900 °C for 40 h.
Metals 14 00033 g009
Figure 10. Microstructure and EDS point analysis of a cross-section sample after oxidation at 1000 °C for 40 h.
Metals 14 00033 g010
Figure 11. Microstructure and EDS mapping of a cross-section sample after oxidation at 1100 °C for 2 h.
Metals 14 00033 g011
Figure 12. Microstructure and EDS point analysis of a cross-section sample after oxidation at 1100 °C for 16 h.
Metals 14 00033 g012
Figure 13. Microstructure and EDS mapping of a cross-section sample after oxidation at 1100 °C for 40 h.
Metals 14 00033 g013
Figure 14. Microstructure and EDS point analysis of a cross-section sample after oxidation at 1100 °C for 168 h.
Metals 14 00033 g014aMetals 14 00033 g014b
Figure 15. Concentration profiles of elements on a cross-section of sample oxidation at 1100 °C for 168 h in the area that scale had spalled.
Metals 14 00033 g015
Figure 16. Fitted weight gain curves of Al0.75CoCrFeNi HEA at various temperatures.
Metals 14 00033 g016
Figure 17. Effect of temperature and time of heating for oxidation on (a) B2 volume fraction, and (b) average thickness of B2 at different temperatures and times.
Metals 14 00033 g017
Figure 18. Effect of temperature and time of heating for oxidation on the hardness of the substrate.
Metals 14 00033 g018
Figure 19. Changes of substrate microstructure from as homogenized and after oxidized at 900 and 1100 °C for 40 h.
Metals 14 00033 g019
Table 1. Comparison of the alloy before and after melting.
ElementAs-Designed (at.%)As-Homogenized (at.%)
Al15.7912.45
Co21.0522.02
Cr21.0521.19
Fe21.0521.92
Ni21.0522.42
Table 2. Oxidation rate with the corresponding rate constants at various temperatures.
Temperature (°C)Rate Constant Kpn
9001.038 × 10−4 mg6.667/cm13.334.h6.667
10004.841 × 10−3 mg3.704/cm7.408.h3.704
11001.92 × 10−3 mg3.571/cm7.142.h3.571
Disclaimer/Publisher’s Note: The statements, opinions and data contained in all publications are solely those of the individual author(s) and contributor(s) and not of MDPI and/or the editor(s). MDPI and/or the editor(s) disclaim responsibility for any injury to people or property resulting from any ideas, methods, instructions or products referred to in the content.

