Review

Progress in Simulation Modeling Based on the Finite Element Method for Electrical Discharge Machining

by
Liwei Li
1,
Shuo Sun
1,
Wenbo Xing
1,
Yuyan Zhang
1,
Yonglei Wu
1,
Yingjie Xu
1,2,
Hongyan Wang
2,
Guojun Zhang
2,3,* and
Guofu Luo
4,*
1
Henan Key Laboratory of Intelligent Manufacturing of Mechanical Equipment, Zhengzhou University of Light Industry, Zhengzhou 450002, China
2
Guangdong Provincial Key Laboratory of Digital Manufacturing Equipment, Guangdong HUST Industrial Technology Research Institute, Dongguan 523808, China
3
School of Mechanical Science & Engineering, Huazhong University of Science and Technology, Wuhan 430074, China
4
Faculty of Engineering, Huanghe Science and Technology University, Zhengzhou 450005, China
*
Authors to whom correspondence should be addressed.
Metals 2024, 14(1), 14; https://doi.org/10.3390/met14010014
Submission received: 17 November 2023 / Revised: 9 December 2023 / Accepted: 14 December 2023 / Published: 21 December 2023

Abstract

:
Electrical Discharge Machining (EDM) is a machining method commonly used to produce complex shapes and deep holes by eroding hard metals with an electric arc. There is a growing demand for process simulation using finite element models in order to improve the quality and efficiency of EDM, to reduce costs, to improve resource efficiency, and to facilitate its application in critical areas such as aerospace and mechanical engineering. Finite element models have greatly improved the prediction accuracy of EDM processes, simulated complex hybrid machining processes, and provided important guidance for the optimization of EDM processes. This paper systematically reviews the research progress of finite element modeling for EDM. Finite element method modeling is evaluated mainly in terms of four indicators: material removal rate, surface roughness, tool wear ratio, and recast layer thickness. Firstly, the importance and application of EDM are described, and the EDM finite element method modeling and its advantages are summarized. Then, the single-spark simulation model and the multi-spark simulation model of EDM are compared and discussed. Among the mainstream finite element models, the prediction error of the material removal rate for single-spark simulation ranges from 8.2% to 14.75%, while the prediction error of the recast layer thickness for multi-spark simulation can be as low as 1.98%. Finally, the applications of finite element modeling in EDM hybrid machining processes’ performance prediction and new material machining are summarized, and future research directions and trends in EDM finite element modeling are predicted.

1. Introduction

EDM has a long history, with Benjamin Chew Tilghman of Philadelphia receiving a U.S. Patent (No. 416873) in 1889 for an invention titled the “Cutting of Metals by Electricity” [1], and Karl Strobel filing a patent application for an electric arc cutter in 1932 (patented in 1936) [2]. In the 1940s, Soviet physicists pioneered the application of electroerosion principles to manufacturing, leading to the emergence of electrical discharge machining (EDM) technology. This technology exhibited distinct advantages in machining high-hardness materials and complex workpieces. EDM technology finds extensive use in machining aerospace alloys and manufacturing molds. For aerospace system production, computerized numerical control EDM has emerged as a highly suitable machining method [3,4]. Studies have demonstrated that EDM offers significant advantages in machining tough and structurally complex materials, which are often challenging to process using conventional mechanical techniques [5,6]. In precision machining, EDM has found wide-ranging applications, and researchers have developed precision manufacturing methods based on EDM to meet the performance needs of high-frequency electrical devices [7,8,9]. According to Research and Markets, the global market for die-sinking and wire-cut EDM was valued at USD 2.347 billion in 2022 and is forecasted to reach USD 6.67 billion by 2030, with a compound annual growth rate of 6.5% from 2023 to 2030 [10]. The indispensable importance of EDM is readily apparent [11].
In EDM, the electrode materials of both the tool and workpiece rapidly evaporate and melt within a matter of microseconds due to the elevated temperatures within the confined space filled with dielectric fluid [12]. Hence, it is imperative to determine the appropriate process parameters to achieve satisfactory machining results [13]. One effective approach is to employ suitable modeling and optimization techniques to establish the relationship between process performance and its key input parameters. Nevertheless, the complexity of electrical discharges during EDM renders it challenging to experimentally observe the discharge process and quantify the material removal mechanisms [14,15]. EDM has found extensive applications, as illustrated in Figure 1, which delineates its characteristics, and various applications in the aerospace, mold, nuclear, defense, electronics, and medical sectors [16]. In the aerospace industry, wire EDM is employed to machine the commonly used titanium alloy, Ti6Al4V [17]. In the mold industry, EDM is commonly used to manufacture molds with complex shapes [18]. Furthermore, EDM is extensively employed for machining nickel-based superalloys in nuclear applications [19]. Hence, the development of precise EDM process models, which involve a comprehensive understanding of machining mechanisms and the identification of appropriate process parameters, is of utmost importance for reliable EDM process predictions.
EDM’s performance depends on multiple process parameters, and combining the results of multiple discharges is not as simple as linearly superimposing individual discharge outcomes. Consequently, simulating EDM presents challenges. Nevertheless, scientists have made significant progress in recent years in the development and optimization of various EDM simulation models, encompassing finite element method (FEM) models [20], molecular dynamics models [21], and computational fluid dynamics models [22]. Of these, FEM models have gained widespread usage due to their straightforward structure, high prediction accuracy, and direct experimental validation. Scientists frequently use FEM models to predict machining performance [23]. Scholars have employed the FEM to investigate the dynamic process of generating three-dimensional surface topography when continuous electrical discharge machining is applied to the workpiece surface. FEM models have also been used to explore topics such as energy distribution ratios during machining [24,25], discharge channel radii [26], and plasma motion [27]. Moreover, FEM models have been developed for ultrasonic-assisted EDM (US-EDM), magnetic field-assisted EDM (MF-EDM), EDM employing non-conductive ceramic electrodes, and the EDM of novel materials [28,29,30,31].
This paper’s primary focus is on finite element modeling, specifically emphasizing the FEM models of EDM. The FEM model of EDM is a mathematical representation created using the finite element analysis method to describe the electrical discharge phenomenon and simulate machining results. This model is usually rooted in the theories of continuous media and electromagnetic fields. It deconstructs the complex electrical discharge process into a discrete system model composed of three-dimensional unit meshes to address specific concerns [24]. The main goal of this paper is to offer a comprehensive overview of the latest advancements in FEM models for EDM. The article thoroughly explores the theoretical modeling and application domains of FEM models. In Section 2, the review examines single-spark FEM models, used to evaluate essential performance indicators in EDM, such as the material removal rate (MRR), surface roughness (SR), tool wear ratio (TWR), and recast layer thickness (RLT). Section 3 discusses multi-spark FEM models, which are employed to simulate the machining process and conduct thorough investigations of four performance metrics: the MRR, Ra, TWR, and RLT. In Section 4, the review focuses on the practical application areas of electrical discharge machining, while Section 5 provides a summary of this investigation’s content and offers insights into future research directions.

2. Single-Spark Simulations

EDM is widely utilized but has inherent limitations. The assessment of EDM’s performance and the exploration of avenues for its enhancement are of utmost significance. The principal performance metrics for EDM assessment comprise the MRR, SR, TWR, and RLT. Numerous researchers strive to predict machining performance using single-spark FEM models. Single-spark discharge simulation entails the finite element modeling of an individual discharge event within the EDM process. It is favored for predicting individual discharge events because of its modeling and analysis simplicity. Single-spark FEM models excel in predicting workpiece surface crater profiles and can be extended to multi-spark scenarios to anticipate the surface structures achieved in EDM [32]. The EDM process faces several challenges, including its low machining efficiency, high SR, and difficulties in meeting high-precision requirements, which constrain its broad applicability [33]. Therefore, this section offers a comprehensive review of FEM models for predicting four critical performance indicators when evaluating EDM’s performance: the MRR, SR, TWR, and RLT. Additionally, we reevaluate the accuracy of various heat source models in performance prediction, providing valuable insights for future research. In the EDM process, the choice of thermal input in the model is a crucial consideration. Hence, this section categorizes models, based on the type of thermal source, into non-Gaussian heat sources and Gaussian heat sources to explore their influence on performance prediction.

2.1. Material Removal Rate

The MRR quantifies the volume of material removed per minute, calculated as the ratio of the removed material’s volume to machining time [34]. In the early stages of finite element modeling of the heat transfer process, various assumptions were employed, including cylindrical spark plasma, a uniform disc heat source, a point heat source, a constant heat source or expanding heat flux radius, and constant thermophysical properties [13]. Tariq Jilani and Pandey [35] developed a finite element model incorporating a disc-shaped heat source to study heat transfer and its impact on metal removal and machining in EDM. They observed that with an increase in the heat source’s diameter, the pulse power density decreased, leading to a reduction in MRR. Later, Tariq Jilani and Pandey [36] further introduced an analytical model to compute metal removal rates and wear rates, specifically, of non-rectangular pulse current conditions in EDM. They presented an analytical calculation model for the single-spark erosion of metal in EDM. They investigated the influence of plasma channel growth on metal removal and found a strong correlation between theoretical and experimental results. Dibitonto et al. [37] introduced a cathode erosion model to predict the temperature distribution influenced by a single pulse discharge, taking into account a point heat source, constant material properties, fixed values of fc (the fraction of power entering the cathode) = 0.18, and a plasma flushing efficiency (PFE) = 100%. In their experimental work, they found that for low discharge energies (<100 mJ), the predicted SR (Rmax) closely matched the experimental value, while for high discharge energies (≥100 mJ), the predicted MRR approached the experimental value. Additionally, their research group [38] introduced an anode erosion model for predicting the temperature distribution in spark discharges. This model had the capability to re-solidify melted discharge craters. In the case of the short pulse-on times associated with wire electrical discharge machining (WEDM), the model could provide a qualitative prediction of the maximum of the anode erosion curve. Salonitis et al. [39] created a straightforward thermal FEM model that projected that the MRR increased with a rising discharge current and arc voltage. Additionally, they noted that the MRR increased with a longer spark duration, with arc voltage exerting the most substantial influence on the MRR. The model exhibited an average deviation of approximately 8.2% between the experimental average MRR and the theoretically predicted values.
To better represent the heat source distribution in the EDM process, Eubank et al. [40] introduced Gaussian heat source models for the anode, cathode, and cylindrical plasma. Their comparative analysis revealed that Gaussian heat sources could more accurately simulate the thermal distribution during machining than disc heat sources. In FEM models for EDM, there has been a progressive shift from disc or point heat sources to Gaussian heat sources, aiming to better reflect real-world conditions and enhance simulation accuracy. Figure 2a illustrates a schematic diagram of a Gaussian distribution. According to Dibitonto et al.’s research [30], the average prediction error for the MRR exceeded 50%. In addition, the prediction error of the model proposed by Joshi and Pande [41] was lower than that of the model by Dibitonto et al. [37]. This was primarily attributed to the utilization of a Gaussian heat flux distribution in the FEM, a phenomenon also corroborated in the research conducted by Ming et al. [42]. The pulse-on time significantly influenced the prediction error in the FEM models. In the context of micro-electrical discharge machining (micro-EDM), the errors in predicting the crater radius and depth were minimal [43]. To mitigate model prediction errors, Joshi and Pande [14] devised an FEM combining a Gaussian heat source with temperature-dependent material properties and a spark radius contingent on the discharge current and duration. The results demonstrated that the average prediction error for the MRR was less than 10%. Additionally, Joshi and Pande [41] formulated a thermophysical model for the EDM process using FEM and conducted a numerical analysis of single-spark operations in EDM. The simulation results of the single-spark simulation model are depicted in Figure 2c,d. In the experiment, the workpiece material is AISI P20 mold steel and the tool material is copper, which produces several single-spark pits on the workpiece specimen. These results indicated that the trends in the simulation analysis closely aligned with experimental results, affirming that the developed thermophysical model could facilitate comprehensive parameter studies to comprehend EDM’s process performance without necessitating physical experiments.
Singh [25] employed heat transfer equations to experimentally determine the distribution of input discharge energy in electrical discharge machining. Across various machining parameters, the MRR exhibited remarkable consistency, and the MRR was contingent on the fraction of energy transferred to the workpiece (Fcw). Moreover, this fraction was determined by the pulse duration, current, electrode polarity, and the specific combination of the workpiece and tool electrodes. It ranged from 6.1% to 26.82%, varying with changes in current and pulse duration, while numerous thermal models for predicting MRR used a constant value, resulting in less accurate predictions. Wang et al. [46] developed an FEM incorporating a Gaussian heat source to forecast the temperature distribution at the cathode discharge point in a single EDM discharge. The simulation results of the heat-affected zone revealed the dynamics of the temperature distribution, offering a more comprehensive insight into the material removal mechanism in EDM. Furthermore, Ming et al. [42] incorporated variable a fc and PFE dependent on the discharge energy in their proposed single-spark simulation model. Validation experiments demonstrated that the proposed hybrid intelligent process model exhibited strong accuracy in predicting the MRR, with an average error of 14.75% for the MRR. Kuriachen et al. [47] developed a transient three-dimensional thermophysical model employing the finite volume method to calculate the geometries of craters in single-spark micro-EDM processing. The model incorporated a Gaussian heat flux distribution, a constant spark radius, and a percentage distribution of supplied energy to estimate the temperature distribution along three directions on the workpiece. They conducted a thorough thermal analysis of a single spark, comparing the model’s outcomes with previously published results and their experimental findings. The results demonstrated good agreement between the model calculations and the experimental outcomes. Singh et al. [45] conducted a numerical simulation of the micro-EDM process, employing a thermal-fluid coupling model. They validated the numerically simulated craters against individually generated experimental craters. Reasonable predictions were made for the diameters and depths of the discharge cavities, with errors of 12% and 13%, respectively. Figure 2b depicts a schematic diagram of the two-dimensional model utilized in the single-spark numerical simulation of the micro-EDM process. In summary, the establishment of EDM FEM models using suitable heat source distributions and parameters allows them to relatively accurately predict the MRR, offering a foundation for further optimization.

2.2. Surface Roughness

SR is employed to characterize the smoothness of a workpiece’s surface, with Ra commonly serving as the standard metric. It delineates the geometric texture and quality of the workpiece’s surface, encompassing parameters such as the SR and profile. Two-dimensional roughness parameters continue to be the most commonly used metrics for characterizing roughness. The arithmetic mean deviation of the assessed profile, frequently denoted as Ra, is the most widely employed roughness parameter in industry for quantifying surface roughness [48]. SR holds critical significance for the functionality and longevity of workpieces, with measurements obtained from instruments such as roughness measuring machines commonly employed to assess surface quality. Marafona et al. [49] created a two-dimensional finite element model based on a heat source. They compared the results of the finite element analysis with experimental data from AGIE SIT tables, which have been utilized by other researchers. As illustrated in Figure 3a, the SR trend at the cathode, as predicted by the finite element analysis model, was closely aligned with that of AGIE SIT. Salonitis et al. [39] formulated a straightforward two-dimensional finite element model based on a heat source. In this model, the average deviation between experimentally obtained average SRs and theoretically predicted values was approximately 6.1%. The deviation also increased with longer spark discharge durations. The study concluded that arc voltage exerted the most significant influence on the average SR, whereas pulse-off time had a minimal discernible impact. This trend aligned with the findings from other published experimental studies. Figure 3b shows the SR of any machined surface, depending on the size of the pits on the surface.
Likewise, models that incorporate Gaussian heat sources can provide more accurate predictions of the SR. Ming et al. [42] integrated the variables fc and PFE, dependent on discharge energy, into their proposed single-spark simulation model. Validation experiments confirmed that the proposed hybrid intelligent process model exhibited good accuracy in predicting Ra, with an average error of 20.74%. Assarzadeh and Ghoreishi [53] introduced a novel approach for accurately predicting the roughness parameter of the electrical EDM process surface. Their method considered the impact of continuous discharges and PFE. They developed an iterative statistical method that considered a normal distribution of surface heights and the influence of each crater cavity formed due to repeated discharges on the surface profile. Reasonable experimental validation was conducted, and the results closely matched the model’s predictions. Philip et al. [54] developed a mathematical model for SR on electrically discharge-textured Ti6Al4V using Gaussian heat sources. The empirical examinations used to substantiate the formulated modeling approach were carried out on a SPARKONIX Die Sinker EDM apparatus (Model: ENC 20/35/50) and Electronica (SMART CNC/XPERT). The observed error between the predicted Ra values and actual Ra values ranged from approximately 8% to 25%. Figure 3c illustrates the surface texture’s Ra of the indentation with intermittent discharge; following the impact discharge in an abrasive liquid slurry, the surface roughness pattern exhibited reduced oscillation in contrast to the discharge in insulating oil. George et al. [55] constructed a finite element model using Gaussian heat sources. Their model predicted the three-dimensional SR of face-milled Inconel 825 specimens. Validation results for the SR closely aligned with the proposed model, with an average absolute error of 10.05%. Ming et al. [13], when comparing prediction errors in the machining performance of prominent single-spark FEM simulations, observed that at low discharge energies (<100 mJ) the predicted Rmax error was lower, while at high discharge energies (≥100 mJ) the predicted Rmax error was higher. The results indicated that Ra prediction errors were more favorable at low pulse-on times (<200 µs) compared to high pulse-on times (≥200 µs). Figure 3d illustrates a MATLAB simulation portraying the heat flux distribution in the workpiece at the conclusion of the “pulse-on” stage. The dotted white line represents the radial temperature distribution on the top surface of the workpiece from the center of the single discharge, which determines the size of the crater. The dashed white line represents the consequent boundary of the molten material with the bulk substrate. It also shows the temperature distributions across the entire top surface (indicated by a white dashed line) and the interface between the melting material and the substrate (also marked by a white dashed line) [52]. Li et al. [56] developed a thermal-fluid coupling model for the single pulse discharge process, utilizing Gaussian heat sources. Their findings indicated that the continuous discharge EDM material removal model exhibited a SR prediction error of 8.26%.

2.3. Tool Wear Ratio

The TWR is a critical metric for assessing productivity and efficiency in EDM. It is directly linked to machining parameters and is influenced by the machining power and the energy of single pulse discharges. Marafona et al. [49] developed a two-dimensional axisymmetric thermal–electric model to analyze spark generation in the liquid dielectric. They compared their finite element analysis results with experimental data from the AGIE SIT tables utilized by other researchers. The TWR results closely matched the values reported by the researchers who used the table. Figure 4a illustrates the temperature distribution at the cathode and anode. Joshi and Pande [14] created an intelligent EDM model that combined FEM models and artificial neural networks. The ideal BPNN (backpropagation neural network) structure is acquired by adjusting the quantity of the concealed layers, and the quantity of neurons within these covert layers for this instruction is 4–8–12–4. The initial “4” denotes four inputs, and the ultimate “4” indicates four outputs. Eight and 12 signify the count of neurons in the covert layer. They discovered that the optimal network architecture of 4–8–12–4 achieved highly accurate predictions for TWR, with an accuracy of 17.34%. Additionally, Joudivand Sarand et al. [57] developed a comprehensive numerical model for tool wear using finite element modeling and inverse heat conduction techniques. The experiments were conducted using a TA-EDM 204H concave die EDM machine, and high-strength AISI H13 steel was selected as the workpiece material. Comparisons between the numerical and experimental data demonstrated that the developed finite element model and inverse heat conduction technology could estimate tool wear with an average error of 4.83%. Papazoglou et al. [58] conducted experimental and simulation studies on the EDM of grade 2 titanium. They measured and calculated machining performance metrics such as the TWR under various applied currents and pulse numbers. Figure 4b displays a comparison between the actual and predicted TWR values. The results indicated that the TWR was primarily influenced by pulse-on time, with longer pulse durations leading to a reduced TWR. The TWR increased with an increasing number of pulse-on cycles.

2.4. Recast Layer Thickness

In the process of EDM, electrical discharges melt the workpiece surface. Some of the melted material is expelled by the electrode, while the remaining material resolidifies in place. This resolidified layered structure is referred to as the recast layer. The RLT represents the depth or height of the layer of material that is melted and re-deposited onto the workpiece surface during EDM discharges, typically measured in microns. The RLT significantly affects part performance because thicker recast layers tend to reduce the wear resistance and fatigue life of the part’s surface. Vignesh and Ramanujam [59] developed a physical model to predict the MRR and validated it through experiments. Research results demonstrated that at discharge pulse durations of 106, 109, and 112 µs, the percentage error between their experimental and predicted values was 41.6%, 21.2%, and 15%, respectively. This discrepancy was due to the re-deposition of the removed material onto the workpiece surface. Therefore, it is necessary to investigate the RLT in the context of EDM. Pandey and Jilani [60] developed a two-dimensional disc heat source model that accurately calculated the heat-affected zone’s thickness caused by a single spark. They achieved a strong correlation between predicted and experimental values. The model could also effectively estimate the extent of the thermal damage to the electrode materials during the EDM process. Shabgard et al. [61] conducted simulations of single discharges in magnetic-assisted EDM using FEM models to obtain the temperature distribution and crater dimensions on the workpiece surface. Their numerical and experimental results for the RLT showed good agreement, with a maximum error of 8.8%.
Figure 5 depicts the prediction and analysis of the RLT using FEM models.
Joudivand Sarand et al. [57] considered the individual and combined effects of thermophysical and electrical parameters in their modeling, achieving an average error of 3.96% in estimating the RLT. Zhang et al. [63] introduced a mathematical thermophysical model that incorporated the wire vibration during wire-cutting. They found that their relative error in estimating the RLT was less than 20% compared to experimental results. Figure 5a illustrates a noteworthy rise in the depth of the indentation, attributable to a rise in the duration of pulsation, aligning with an escalation in the thickness of the layer. Gholipoor et al. [64] conducted a finite element simulation of the single-spark discharge process in EDM. They utilized a numerical model to investigate the effects of pulse current and duration as input parameters on the RLT of molten material in machined surface craters. The results demonstrated that an increasing pulse current improved the PFE, whereas a longer pulse duration decreased the PFE and increased the RLT. George et al. [62] developed an analytical model of the RLT during wire-cut EDM. The model exhibited strong performance in predicting the RLT, with an average absolute error of 5.12%. Figure 5b illustrates the variation between the predicted and measured wire layer thickness (WLT) with respect to discharge energy. In single-spark discharge machining, the RLT and SR are two interrelated but distinct concepts. Achieving excellent surface quality involves eliminating defects on the parent surface, minimizing the RLT, and controlling the SR.

2.5. Summary

This section primarily reviews the research advancements in modeling and simulating key technical parameters in EDM, including the MRR, SR, TWR, and RLT. The researchers discovered that refining the forecast precision of the model involved incorporating a Gaussian distribution of the thermal flux and considering the fluctuation in the radius of the EDM with respect to the discharge current and the duration of the discharge. This adjustment aimed to bring the model into closer alignment with the real conditions of the process. Early models employed basic disk and point heat sources, with a gradual shift towards adopting Gaussian heat source distributions for enhanced accuracy. The research indicates that Gaussian heat sources offer superior accuracy in predicting the thermal distribution and machining outcomes in EDM. Additionally, this section provides a summary of the modeling accuracy for each key indicator, with the average MRR error typically limited to within approximately 10%, the average SR error to within 20%, and the average TWR error to within 5%. Table 1 presents a comparison of the prominent FEM models simulating the single-spark process in EDM. Research findings illustrate that the utilization of suitable models and parameters can proficiently forecast EDM performance metrics, offering theoretical guidance for further optimizing the EDM process.

3. Multi-Spark Simulations

In finite element modeling and the simulation of EDM, two categories exist: single-spark simulations and multi-spark simulations. Shahane and Pande [65] introduced an innovative approach for simulating the occurrence of multiple sparks with overlapping craters by modifying the transient heat transfer model originally designed for single sparks. In multi-spark simulations, EDM is conducted through a sequence of single-spark events. The initiation of sparks is inherently random, often occurring in clusters while maintaining a minimum distance between the tool and the workpiece [66]. Research has shown that, in contrast to single-spark models, multi-spark models provide MRR predictions that align more closely with experimental findings. Multi-spark simulations offer several advantages over single-spark simulations, including enhanced realism, accuracy, the capability to simulate intricate machining processes, improved simulation precision, and broader applicability. However, due to variations in the position and pressure of dielectric media, such as bubbles and solid particles within the gap, which change with time and location, it is not possible to obtain the result of multiple discharges through a simple linear superposition of individual discharge outcomes [67,68]. Therefore, the study of multi-spark simulations is crucial.

3.1. Material Removal Rate

In FEM models of EDM, simulations of multi-spark EDM predominantly employ Gaussian heat sources. Izquierdo et al. [69] developed a numerical model for the EDM process that accounted for the impacts of multiple discharges. This model computed the internal temperature distribution of the workpiece using finite difference methods and utilized Gaussian heat sources to simulate the EDM surface. EDM trials were conducted on an ONA TECHNO H300 SEDM apparatus, employing a copper electrode with a square cross-sectional area measuring 30 × 30 mm2, and external rinsing facilitated by a flushing nozzle. With optimal input parameters, the MRR prediction error remained below 3%. Figure 6d illustrates the evolution of the material removal volume per discharge during the EDM process. The modeling of Philip et al. [70] focused on the propagation of multiple sparks. Shahane and Pande [65] introduced and implemented an innovative strategy to create a multi-spark model with overlapping craters. This model considered factors such as spark aggregation, Gaussian heat flux, temperature-dependent material properties, and the influence of the latent heat of fusion. The predictions of the multi-spark model closely matched experimental values, with a deviation of approximately 50%. Figure 6a depicts the experimental MRR data, alongside the ratios of the MRR from both single-spark and multi-spark models to the experimental MRR. H. Saikiran et al. [71] conducted MRR modeling of the Orvar Supreme H-13 EDM process using an axisymmetric model. They extended this single-spark model into multi-spark machining by calculating the MRR based on the number of pulses. The experiments were carried out on a CNC die-sinking EDM machine and compared with the analytical results, and a high degree of agreement was observed. Almacinha et al. [72] observed that the presence of multiple discharges had a significant impact on the MRR during the machining process. Incorporating this effect into the volume removed by a single discharge led to predicted MRR values that closely matched the experimental data. Razeghiyadaki et al. [73] employed a simplified two-dimensional numerical heat conduction equation along with supplementary assumptions. They demonstrated that their model exhibited good agreement with experimental results, thereby validating their numerical approach. In comparison to the standard finite element model, the finite element model considering instantaneous evaporation enhanced its concurrence with the MRR experimental values by 1.5%. Figure 6a illustrates the comparison of the MRR between the numerical model and the experimental values obtained by Almacinha [72]. Yakup Yildiz [74] employed a three-dimensional finite element model to forecast white layer thickness and the MRR. The numerical solutions from the model were compared with experimental data, yielding an average MRR prediction error of 3.34%. Figure 6b illustrates the MRR as a function of the discharge current and the modeling approach. In comparison to the theoretical thermal model, the results from the finite element model closely approximated the experimental findings.

3.2. Surface Roughness

Figure 7 presents the prediction and analysis of SR using multi-spark simulation FEM models. Kurnia et al. [75] introduced a micro-EDM SR model based on estimating crater geometry. The model incorporated surface factors, accounting for effects, such as overlapping craters, scratches, microcracks, and re-attached debris, from the real machining process. In this initial study, the theoretical results from the proposed model were compared to the corresponding experimental results, revealing an average Ra error of 6.5%. Ti6Al4V was employed as a validation material to assess the applicability of the SR prediction model to different materials. Izquierdo et al. [69] developed a numerical model of the EDM process that considered the effects of multiple discharges. The model calculated the internal temperature field of the workpiece using finite difference methods and considered the impact of continuous discharges on the EDM surface. Under optimal input conditions, the prediction error for the surface finish was below 6%. Razeghiyadaki et al. [73] similarly predicted the SR, observing an increase in the predicted SR with a higher discharge energy. Figure 7a shows that the gray curve “FEM” is the predicted data from this model. The SR predicted by this model is very close to the experimental data, compared to the Salonitis model [39]. One possible explanation for the variance between Salonitis’ model and this model is that Salonitis’ model relied on numerous simplified assumptions, including a uniform heat source. This model and Salonitis’ model exhibited deviations of 6.4% and 7.5%, respectively, from their experimental values.
Multi-spark simulation is continuously advancing due to its accurate predictions. Jithin et al. [76] employed numerical simulation methods to replicate the gradual development of surface topography resulting from the continuous application of spark discharges to the surface texture formed by previous discharges. The multi-spark model adopted random spark distributions in position, energy level, and time sequence. For surface generation, the validation of the SR prediction values for different parameter combinations, using Ti6Al4V steel and M300 steel as workpiece materials, revealed a strong agreement between the predicted and measured values, with prediction errors ranging from 6% to 17.5%. Figure 7b presents another comparison of the surface topographies by measuring Ra along 50 cross-sections of both surfaces and comparing their Ra distributions. Jithin et al. [79] developed a multi-spark discharge model to predict average Ra, taking into account the random distribution of crater profiles. The multi-spark model was used to simulate the surface profile, while the single-spark model assessed crater profiles. With the adoption of more realistic assumptions, the model reduced the average Ra prediction error to 11.5%. The average relative error in predicting surface roughness was 8.26% for the EDM continuous discharge removal model developed by Abed et al. [77]. Figure 7c shows that the predicted values of the model are in general agreement with the experimental measurements. Jamunkar and Sundaram [78] introduced a multi-spark model that yielded the normal distribution of SR values for various EDM process parameters. The simulated EDM surface was created through finite element analysis and online EDM monitoring techniques. The measured EDM SR values fell within the predicted range. The simulated surface included multiple overlapping, small impact craters produced by individual sparks. For the validation experiments, SS304 and AISI 304 workpieces were machined, with a 4 mm hollow copper tool, using the EDM process. The maximum deviation between the predicted and measured values was 0.76 µm. Figure 7d illustrates the normal distribution of the SR values.

3.3. Tool Wear Ratio

The TWR is a crucial indicator of machining quality and economic efficiency. Predicting and controlling the TWR is of paramount importance for optimizing the electrical discharge machining process. Figure 8a illustrates the estimated response surface of electrode wear while varying the parameters of intensity and pulse time. Observably, as the intensity factor decreases to its minimum value, there is a declining trend in wear value, which reverses and begins to increase after reaching the minimum. Puertas et al. [80] developed a finite element model using design experimentation techniques to determine the optimal machining conditions for the finishing stage. In the context of electrode wear, it is evident that the intensity factor exerts the most significant influence, followed by its pure quadratic effect and interaction effect with pulse time. To achieve reduced electrode wear values within the defined working range, it is advisable to use an intensity factor value near the tool’s central value (i.e., I = 4) or slightly higher, in conjunction with low pulse time values. Kim et al. [81] conducted both experimental and numerical investigations on the micro-EDM of molybdenum. Their findings indicated a significant increase in the TWR when the pulse duration exceeded 2 µs. The combination of high voltage and extended pulse duration led to severe tool wear. In multi-spark micro-EDM experiments, debris composed primarily of a mixture of molybdenum and tungsten has been observed around the generated holes. Barenji et al. [82] applied a response surface methodology to predict and optimize the TWR in the EDM process of AISI D6 tool steel. They also developed a numerical model for predicting the TWR. For the validation experiments, AISI D6 tool steel of 20 mm diameter and 20 mm thickness was used for the workpiece. In addition, round electrolytic copper of 18 mm diameter was used as the electrode and commercial kerosene was used as the dielectric. Their findings revealed that minimizing the TWR occurred when the pulse-on time, pulse current, and input voltage were set at 40 µs, 14 A, and 150 V, respectively. As depicted in Figure 8b, within the spectrum of EDM process parameters, the predicted response values closely aligned with the actual response values, as indicated by the even distribution of data points along the 45° line. In micro-EDM drilling, it is common practice to employ regression models for the prediction of the MRR and TWR based on the applied machining parameters. To enhance prediction accuracy, Bellotti et al. [83] investigated the effectiveness of data-driven regression models in predicting tool wear and material removal. By incorporating process monitoring data as inputs into the regression models, they achieved a significant reduction in errors when predicting the TWR, approximately 85%.

3.4. Recast Layer Thickness

Research has indicated that the surface erosion caused by sparks on workpieces results in the formation of a hard recast layer, commonly referred to as a white layer. During the EDM process, sparks generated by the discharge melt and vaporize a small region on the electrode’s surface. When the pulse-on time concludes, a small quantity of molten material is expelled from the surface, and the residual liquid solidifies. The resulting recast layer typically exhibits fine grains and high hardness. It can also form alloys with carbon derived from the cracked dielectric or materials from the tool [84]. The RLT generated in the EDM process serves as a critical process performance indicator. It offers insights into the degree of surface crack propagation and the thickness of the alloyed functional layer on the machined surface. Manufacturers typically employ finishing machining operations such as grinding to eliminate the recast layer. The white recast layer can be effectively removed to achieve a polished surface finish by utilizing silicon carbide grinding with the aid of a lubricant. Polishing entails the removal of material from the EDM surface, but excessive material removal can result in a loss of tolerance. It is of the utmost importance to determine the average RLT to establish the appropriate conditions for polishing and grinding [84].
Tan and Yeo [85] introduced a numerical model that relies on multiple discharges to predict the RLT generated in micro-EDM. In this approach, the recast layer was regarded as a composite formed by individual crater recast zones resulting from a series of multiple discharges. The model featured a peak discharge current of 1.45 A, pulse-on times spanning from 166 ns to 606 ns, and projected RLT values within the range of 1.0 µm to 1.82 µm. For pulse times of 166 ns, 362 ns, and 606 ns, the corresponding average RLT values were 1.10 µm, 1.37 µm, and 1.75 µm, respectively. Shabgard et al. [86] developed a three-dimensional axisymmetric model employing FEM models to simulate the temperature distribution in EDM and estimate the surface integrity characteristics of AISI H13 tool steel workpieces. The examined surface integrity characteristics included the white layer thickness, heat-affected zone depth, and average thickness. The study investigated the effects of pulse time and pulse current. Both numerical and experimental findings indicated that increasing the pulse time resulted in greater white layer thickness, heat-affected zone depth, and surface porosity. The finite element model successfully predicted workpiece white layer thickness (WT) with an average deviation of 9.65%. Yakup Yildiz [74] employed a three-dimensional finite element model to predict white layer thickness, and his results demonstrated a strong agreement between his finite element analysis and experimental findings. The average errors for predicting white layer thickness using the FEM were 1.98%. In Figure 9a, it is evident that at lower discharge currents, the outcomes from the thermal model significantly deviated from those of the experimental and FEM models. Conversely, the experimental results closely matched the results obtained from the finite element model. Yadav and Pradhan [87] determined the thicknesses of the recast layer and martensite layer during the wire-cut EDM of D2 steel by employing numerical and quantitative expression methods. Recast zones were identified through multiple discharge sequences. In prior experiments, Rajurkar and Pandit [88] achieved a RLT of 8.0 µm in D2 steel using a 20 A current. Conversely, their current numerical simulation model predicts an RLT value of 10.2 µm, demonstrating strong agreement. Figure 9b visually presents the alignment between the numerically estimated RLT and the published experimental values. The simulation results are depicted in blue, while the experimental results are shown in red.

3.5. Summary

This section primarily presents the advancements in multi-spark simulation within the context of finite element modeling for EDM. In contrast to single-spark simulation, multi-spark simulation takes into account the randomness and overlapping effects of sparks. Researchers have found that the discharge locations of the multi-spark simulations were characterized as follows: the discharge locations were random, taking into account the effect of bubbles or debris on the discharge locations; and the discharge locations were located at the maximum point of the electric field. This approach enables a more realistic and accurate simulation of complex machining processes, producing results that closely align with experimental data. This section provides a systematic summary of the modeling efforts in multi-spark simulations to predict MRRs, SR, TWRs, and RLTs. Research findings indicate that multi-spark models can effectively manage the prediction errors for these critical parameters, maintaining them at approximately 3%, 6.5%, 5%, and 2%, respectively. Table 2 provides a comparison of the existing methods for multi-spark finite element simulation in EDM processes. In summary, multi-spark simulation represents the evolving direction of finite element modeling for EDM, offering improved accuracy in predicting machining effects. However, it is crucial to consider the interactions between different sparks.

4. Hybrid Machining Simulations

Within EDM, the residual material fragments near the workpiece and the tool electrode tend to amass in the machining gap. This accumulation impedes the ionization process and leads to the generation of secondary discharge pulses [89]. These abnormal discharges, primarily short circuits and arcing, are the principal causes of this impediment. The excessive accumulation of debris can result in a low MRR, a high electrode wear rate, compromised surface integrity, pronounced microcracks, thick recast layers, the substantial dissipation of discharge energy, and the emission of harmful byproducts [90,91]. The development of effective strategies for purging or eliminating debris from the spark gap has emerged as a critical challenge in EDM technology. In the context of EDM, materials must exhibit a degree of electrical conductivity. While traditional EDM methods can effectively machine advanced conductive ceramics, the EDM of semiconductors and advanced non-conductive ceramics presents substantial challenges [92]. To tackle these challenges, researchers have devised hybrid process models. In the case of non-conductive materials, scientists construct an auxiliary conductive electrode on the surface of such materials to facilitate spark discharges. When it comes to machining novel materials, EDM has demonstrated noteworthy advantages [93]. Researchers have consistently explored the use of EDM with new materials [94], and the applications of EDM are on the rise.

4.1. Material Removal Rate

Given the complex effects of magnetic fields and ultrasonic vibrations on EDM, which add complexity to simulation modeling, many of the existing FEM models have resorted to simplifications. Magnetic-assisted EDM FEM models integrate the influences of magnetic fields into EDM models primarily by adjusting pertinent parameters within the electrical and thermal conduction equations to accommodate the physical impacts of the magnetic field. In Figure 10b, a schematic illustrates the debris propelled by magnetic forces within the machining gap. This magnetic barrier streamlines the process of removing machining debris emitted from the gap, making it more efficient. Bonny et al. investigated the influences of secondary electroconductive phases (comprising 40 vol% WC, TiCN, or TiN) on the EDM of ZrO2 ceramic composites [95]. As depicted in Figure 10c, with a discharge current of 350 A, a pulse-on time of 2.4 µs, and a pulse cycle of 20 µs, the maximum MRR for ZrO2-WC reached 33.54 mm2/min. Figure 10d illustrates the trade-off of achieving the desired surface roughness at the expense of a reduced MRR, a pattern similar to that observed in the EDM of metallic materials [96]. Gupta and Joshi [97] formulated a mathematical model that accounts for the influence of plasma confinement under a magnetic field, the reduction in the mean free path, and the effects of magnetic pulsations. Within dry EDM, the magnetic field affects the dimensions of both single and multiple discharge craters. According to the model’s predictions, under multi-spark conditions, the hole diameter decreased with the increasing magnetic field strength. However, at higher magnetic field values, the hole diameter increased due to the prevailing electrostatic repulsion force. In the context of single-spark discharge machining, the model’s forecasts for crater diameters and depths closely approximated the corresponding experimental values, irrespective of the presence of a magnetic field. At moderate energy levels, the model exhibited an average error of 10% in predicting crater diameters and a 9% error in predicting depths for single spark discharges. Beravala and Pandey [98] formulated a mathematical model to predict the MRR in the context of EDM, considering the combined influences of air and magnetic fields. The developed mathematical model primarily accounted for three physical phenomena: the decrease in energy density resulting from plasma expansion, the increase in the MRR due to assistance from a liquid–gas medium, and the reduction in the electron mean free path due to the presence of a magnetic field. The MRR expression derived from the model was validated under all experimental conditions except those utilized to derive constants. The experimental results demonstrated that the prediction error of the model for MRRs was less than 10%.
The US-EDM finite element model builds upon the conventional EDM model by incorporating the physical effects of ultrasonic vibration. As illustrated in Figure 10a, a direct ultrasonic vibration-assisted method was employed, along with abrasives, to polish the conductive layer and craters of a workpiece, resulting in the attainment of a high-quality SR. In a study by Shabgard et al. [99], both experimental investigations and mathematical modeling were conducted to analyze the characteristics of EDM and US-EDM on AISI H13. Their findings revealed that the application of ultrasonic vibration to the workpiece significantly enhanced the MRR in the finish machining mode, tripling its value. Zhang et al. [100] introduced a hybrid machining technique that combines ultrasonic vibration and magnetic field assistance with electric spark wire-cutting. This approach aims to enhance machine tool performance. The study examined the effects of critical process parameters on the MRR and surface quality, including SR and surface crack density, in the context of Ti6Al4V machining. A comprehensive comparison revealed that the hybrid technique, combining ultrasonic vibration and magnetic field assistance with electric spark wire-cutting, continued to offer clear advantages in striking a balance between machining efficiency and surface quality.
In addition to the well-known MF-EDM and US-EDM, it is worth highlighting other noteworthy hybrid processes. H.K. Kansal et al. [44] developed a two-dimensional axisymmetric model for powder-mixed electrical discharge machining (PMEDM) using FEM models. The model incorporated various critical elements, such as temperature-dependent material properties and heat source characteristics (with a Gaussian heat distribution), to forecast the thermal dynamics and material removal mechanisms in the PMEDM process. A strong correlation (correlation coefficient = 0.91) was observed between the calculated MRR and the predicted MRR. The validation experiments were conducted using AISI D2 mold steel with a workpiece size of 100 mm × 50 mm × 10 mm. After adding graphite powder with an average particle size of 30 μm, the workpiece was processed in commercially available kerosene. Both in theoretical predictions and experimental validations, the MRR achieved through PMEDM consistently surpassed that of traditional EDM. This superiority was attributed to the presence of powder suspensions in the EDM dielectric, which promoted a uniform dispersion of thermal energy in all directions within the plasma channel.
Figure 10. Prediction and analysis of MRR in hybrid machining simulations. (a) Schematic diagram of ultrasonic vibration-assisted EDM with abrasives, reproduced from [101], permission with J·STAGE, 2010. (b) Schematic diagram of the debris driven by the magnetic force in the machining gap, reproduced from [102], permission with Elsevier, 2008. (c) Relationship between MRR and pulse-on time (pulse duration) when machining advanced ZrO2 ceramic composites with different secondary electroconductive phases, reproduced from [95], permission with Elsevier, 2008. (d) The relationship between MRR and Ra in each experiment on processing Si-SiC, reproduced from [96], permission with Elsevier, 2010.
Metals 14 00014 g010

4.2. Surface Roughness

The hybrid EDM process with intelligent optimization algorithms [103,104] offers a significant enhancement in surface quality, which holds critical importance for improving workpiece performance, reducing the need for secondary machining, increasing manufacturing efficiency, broadening application domains, and reducing the process’s environmental impact [105]. Ming et al. [31] conducted a comprehensive study that amalgamated theoretical and experimental research to introduce an innovative thermophysical model for EDM. The model computes the energy flow and temperature distribution within workpieces, tool electrodes, and discharge channels for both single-spark and continuous-spark scenarios. During the experiment, a modifiable magnetic apparatus producing a magnetic force was positioned around the SKD11 workpiece. The machining temperatures at the upper and lower sections of the workpiece were tracked using thermocouples of the Pt100 type. Both simulation and experimental investigations demonstrate the superiority of magnetic field-assisted electrical discharge machining over conventional EDM, particularly in terms of surface integrity and discharge stability. Furthermore, the magnetic field effect enhances its energy efficiency by 15.2%. To achieve a balance between energy efficiency and Ra, the optimal combination of cutting parameters is as follows: a magnetic field strength of 0.2 T, a discharge current ranging from 7 to 9 A, and a pulse duration of 300 µs. As depicted in Figure 11a, with a pulse duration of 300 µs, the Ra achieved by hybrid EDM consistently surpasses that of conventional EDM. Ming et al. [106] carried out a comparative investigation of MF-EDM on both magnetic and non-magnetic materials. Initially, a series of MF-EDM experiments were conducted on specific magnetic materials, such as SKD11, and non-magnetic materials, like Ti6Al4V, to assess their surface quality. Subsequently, a comprehensive analysis was carried out to examine the impact of the magnetic field and servo voltage on the performance of MF-EDM machines, considering both SKD11 and Ti6Al4V materials. In the case of the SKD11 material, a significant increase in the servo voltage results in a greater surface roughness. Conversely, for the Ti6Al4V material, a servo voltage of 71V produces the desired SR.
Ultrasonic vibration enhances the surface quality of EDM. It can reduce the SR, microcracks, bubbles, and other defects, thereby enhancing the smoothness and uniformity of the machined surface [107]. Ghiculescu et al. [28] conducted a study on the modeling the material removal mechanisms at a microscopic geometrical level using computer-aided finite element analysis for ultrasonic-aided electrical discharge machining. The results of the finite element analysis revealed that accumulated micro-jets nearly eliminated the molten material caused by discharging, resulting in a 500% increase in the machining rate. The SR improved by up to 50%. Pupaza et al. [108] investigated the phenomena that occurring during the US-EDM of conductive metal matrix composites (EC-MMCs-Al/Al2O3p). Using finite element techniques, the study described the thermal shock phenomenon and its influence on the material removal process. The efficiency of US-EDM was lower during rough machining compared to finish machining. It was observed that by using shorter pulse durations and longer pause intervals to maximize the number of discharges within a single oscillation cycle, the use of ultrasonic vibration increased the machining rate and reduced the pulse energy to achieve a lower SR. In their study, Wang et al. [107] examined the mechanisms involved in the surface generation in ultrasonic vibration-assisted electrical EDM. They developed a microscopic material removal volume model for single-spark EDM based on the characteristics of the EDM removal mechanism and the influence of ultrasonic vibration energy. The study revealed that ultrasonic vibration led to an increased overlap of adjacent molten craters, resulting in a reduction in the carbon area and a smoother surface. The introduction of ultrasonics reduced the SR by 15.8% to 29.1%. Furthermore, Tang et al. [109] conducted a thermally and electrically coupled simulation of powder-mixed EDM on functionally graded SiC/Al materials, validating the results against experimental data. In comparison to conventional EDM, PMEDM improved the machining efficiency by 16.34% and reduced the SR by 29.42%. Figure 11b shows the surface topography simulation of the EDT performed on SS 304 at the 20 A, 50 µs, and 50 V parameter combination; it matches the measured surface morphology quite well.

4.3. Tool Wear Ratio

Tool wear is a prevalent and unavoidable phenomenon in EDM, with significant implications for machining precision, surface quality, and efficiency [110,111]. The monitoring and analysis of tool wear facilitate timely interventions to preserve machining quality and prolong the tool’s lifespan. Ming et al. [31] combined theoretical and experimental research to introduce an innovative thermo-physical model for MF-EDM. The model computes the energy flow and temperature distribution within workpieces, tool electrodes, and discharge channels under both single-spark and continuous-spark conditions. Zhang et al. [112] introduced MF-EDM for the processing of high volume fraction SiCp/Al materials to improve its sustainable machining performance, including productivity and the most detrimental aerosol emissions to operators. The study investigated its effects on the TWR. The results showed that for a SiCp/Al material with a volume fraction of 65%, the average optimal solution reduced the TWR and aerosol emissions by around 5.7% and 10%, respectively, while the MRR increased by 5.5%. Figure 11c depicts the optimal Pareto surface for a 65% volume fraction. Namboodiri et al. [113] discovered that near-dry EDM holds promise as a technique for enhancing the TWR and machining performance, offering advantages over dry and wet EDM. Joudivand Sarand et al. [57] developed an extensive numerical model for tool wear using finite element modeling and reverse heat conduction techniques. This approach accounts for the independent and interactive effects of thermal and electrical parameters, modeling the contributing factors. Both experimental and numerical results demonstrated the significant impacts of parameters like the thermal diffusion coefficient of the tool electrode, the pulse current, and the pulse duration on tool wear. Nadda and Nirala [114] developed an analytical model for micro-EDM based on electrothermal theory and conducted finite element simulations of the Gaussian heat flux distribution during a single discharge in micro-EDM. They introduced a tool wear compensation technique based on the thermal model. When combined with the current pulse discrimination system, this approach may produce improved results. Figure 12a presents finite element simulation results for a capacitance and voltage of 27 nF and 90 V. Allen and Chen [115] utilized a thermal numerical model to simulate material removal in fine micro-EDM on molybdenum during a single-spark discharge. The model predicted that increasing the pulse duration would result in a decreased TWR, with molybdenum demonstrating significantly higher TWRs under identical machining conditions compared to steel. Figure 12b illustrates the temperature distribution after the heating phase.

4.4. Recast Layer Thickness

The selection of the RLT in EDM requires careful consideration, taking into account specific machining requirements and material characteristics. In practical applications, various factors, including machining efficiency, surface quality, precision, electrode wear, and thermal effects, must be considered to achieve optimal machining results. Shabgard et al. [116] created an innovative mathematical model for the plasma channel radius and incorporated it into finite element modeling. They examined the impact of ultrasonic vibration on the RLT of the tool electrode under varying pulse currents and durations. A CHARMILLES ROBOFORM 200 EDM with an iso-pulse generator was used for the experiments and, in order to apply ultrasonic vibrations to the tool electrodes, a HD 2200 Bandelin ultrasonic vibration generator was used. The results showed that the numerical simulation of the RLT had a maximum error of 6.1% when compared to experimental data. The application of ultrasonic vibration reduced the RLT produced on the machined surface for all pulse currents and durations. Additionally, Shabgard et al. [61] introduced a finite element model to investigate the influence of applied magnetic fields on the pit size and the RLT during the EDM process. The results demonstrated good agreement between the numerical RLT and experimental data, with a maximum error of 8.8%. Tan and Yeo [117] developed a numerical model to describe the process of powder-mixed fine micro-EDM. They employed a finite element analysis along with a multi-discharge-based approach. Verification revealed that the simulated RLT exhibited a consistent deviation from the measured values, although the overall trend was similar. Shabgard et al. [86] utilized a three-dimensional axisymmetric finite element model to estimate the temperature distribution during the EDM process for AISI H13 tool steel. Both numerical and experimental results revealed that an increase in the pulse duration resulted in a greater white layer thickness, increased heat-affected zone depth, and enhanced surface permeability. Conversely, an increase in pulse current marginally reduced the white layer thickness and heat-affected zone depth but led to coarser surface permeability. Liu and Guo [118] introduced an FEM for predicting and analyzing the mechanisms of the recast layer and heat-affected zone formation in the EDM of ASP 2023 tool steel, as well as the associated phase transformations. The predicted transformations of the white layer (WL) and heat-affected zone (HAZ) closely matched the experimental data, showing good accuracy. Figure 13a shows their predicted subsurface WL and HAZ. Both the solid white layers and heat-affected zones displayed non-uniform structures formed by multiple random discharges. Zhang et al. [119] elaborated on the complex thermal deformation phenomena and their underlying causes during the wire-cutting of thin-walled parts made of Inconel 718. They developed a thermophysical model and, by examining the surface characteristics of the deformed samples, discovered that the alterations in the RLT were fundamentally in line with the variations in thermal deformation. Figure 13b illustrates the relationship between the RLT and thermal deformation under these processing parameters.

4.5. Summary

In this section, our primary focus is on exploring recent advancements in the modeling of hybrid machining techniques within the context of EDM, with the goal of enhancing the MRR, SR, TWR, and RLT. Researchers have found that hybrid EDM significantly improves machining performance, however, the machining principles are complex and difficult to model, so the models are mostly simplified. Challenges related to debris removal and machining non-conductive materials have persisted throughout the EDM process. To address these challenges, we have proposed various FEM models for hybrid machining techniques, encompassing models that incorporate magnetic field assistance, ultrasonic vibration assistance, and powder mixing. In summary, these hybrid machining technologies hold the potential to substantially enhance the processing efficiency and surface quality of EDM. Additionally, we present relevant simulation results, including the potential for hybrid machining to more than double the MRR and reduce Ra by over 20%. Table 3 offers a comparative overview of the major existing FEM models for the hybrid machining in EDM. Presently, the integration of hybrid machining techniques with traditional EDM shows significant potential for enhancing machining performance. However, modeling in this context still encounters certain challenges and necessitates further development, such as combining it with deep learning [120].

5. Outlooks

(1) In single-spark finite element modeling, a distinction is made between two categories: those that utilize Gaussian heat sources and those that do not. This differentiation aims to offer a comprehensive analysis of how single-spark FEM models predict the four major machining performance indicators: the MRR, SR, TWR, and RLT. FEM models that employ Gaussian heat sources show more precise predictions of machining performance metrics. Future FEM models are anticipated to incorporate higher-precision Gaussian heat sources. Currently, single-spark models frequently assume the electric discharge to be in a plasma state, thereby overlooking the impact of the non-plasma state. Moreover, these models often neglect the influence of the microstructure on the electrode and workpiece surfaces during the EDM process. Future modeling efforts will explore the effects of the non-plasma state on the EDM process in greater depth and enable the models to consider the influence of the microstructure on the electrode and workpiece surfaces. Furthermore, considering that real EDM processes often involve continuous sequences of multiple pulse discharges, future research should concentrate on developing multi-spark models based on FEM models. In the current modeling framework, the four performance indicators—MRR, SR, TWR, and RLT—may display conflicting behaviors. Future modeling should consider the following aspects to simultaneously predict these four performance indicators and provide optimization strategies that take into account their interactions, thus saving both time and resources.
(2) Multi-spark FEM models in EDM, when compared to single-spark models, provide enhanced precision in capturing the stochastic nature of the EDM process and the effects of overlapping multiple discharges. Existing research suggests that multi-spark models demonstrate considerably smaller errors in predicting critical machining parameters compared to single-spark models, aligning more closely with real-world machining results. With the continuous advancement of computational technology, the growing adoption of Gaussian heat source distribution enables multi-spark models to effectively simulate intricate three-dimensional surface morphologies. In the future, these multi-spark models can be integrated with hot technologies like deep learning and artificial intelligence to develop intelligent models capable of accurately predicting the machining process. Furthermore, it is essential to expand the application of multi-spark models to novel materials such as ceramics and composite materials. Future directions for multi-spark models include dynamic adaptive simulations and the modeling of the process–performance relationship. Combining multi-spark models with optimization algorithms, online monitoring, and other technologies enables the closed-loop control and optimization of the EDM process. Additionally, the development of multi-spark models for machining intricate shapes and their integration into digital twin platforms can result in fully digitized and intelligent processes. Multi-spark models represent a critical developmental trend in numerical simulations of EDM.
(3) Various finite element models have been developed in research on hybrid EDM processes, encompassing models for ultrasonic vibrations, magnetic fields, auxiliary electrodes, and powder integration. Typically, these models are simplified for hybrid machining simulations. One future research direction is to develop hybrid models that integrate finite element methods and flow field simulations for a more precise simulation of hybrid EDM processes. Furthermore, a thorough investigation of the distinctions between the discharge states of magnetic and non-magnetic materials is necessary. In magnetic field-assisted machining, an effective discharge waveform sampling system is also required to monitor variations in the discharge ratio. Hybrid EDM encompasses multiple techniques, including magnetic fields, ultrasonic vibration, powder mixing, chemical etching, and laser ablation, which are fully utilized to address the limitations of the EDM process. These processes present further opportunities and potential while also promoting energy conservation and enhanced surface integrity. In the future, there is a need for the continued development of finite element modeling for emerging hybrid EDM technologies to facilitate efficient, high-quality, environmentally friendly, safe, and sustainable manufacturing. Given the inherent high hardness and brittleness of advanced ceramics, conventional machining techniques pose a risk of adversely affecting their surface. As a result, advanced ceramics are frequently machined using EDM. As the utilization of innovative materials, including advanced ceramics, continues to rise, there is a burgeoning demand for improved finite element modeling studies. This is imperative for effectively addressing the diverse requirements of EDM’s various applications.

Author Contributions

Conceptualization, G.Z. and G.L.; validation, W.X. and Y.Z.; writing—original draft preparation L.L. and S.S.; writing—review and editing Y.W., Y.X. and H.W.; supervision, L.L.; funding acquisition, G.Z. and G.L. All authors have read and agreed to the published version of the manuscript.

Funding

This work was supported by the Guangdong Basic and Applied Basic Research Foundation (No. 2022A1515140066) and by the Guangdong Provincial Key Laboratory of Manufacturing Equipment Digitization (No. 2023B1212060012). In addition, this work was also supported by the National Natural Science Foundation of China (No. 52105536).

Conflicts of Interest

The authors declare no conflict of interest.

References

  1. Tilghman, B.C. Cutting Metal by Electricity. U.S. Patent 416,873, 10 December 1889. [Google Scholar]
  2. Strobel, K. Electric Arc Cutting Machine. U.S. Patent 2007225, 7 September 1936. [Google Scholar]
  3. Ho, K.H.; Newman, S.T. State of the Art Electrical Discharge Machining (EDM). Int. J. Mach. Tools Manuf. 2003, 43, 1287–1300. [Google Scholar] [CrossRef]
  4. Das, S.; Klotz, M.; Klocke, F. EDM Simulation: Finite Element-Based Calculation of Deformation, Microstructure and Residual Stresses. J. Mater. Process. Technol. 2003, 142, 434–451. [Google Scholar] [CrossRef]
  5. Mahajan, A.; Devgan, S.; Kalyanasundaram, D. Electrical Discharge Machining- a Futuristic Technique for Surface Engineering of Biomedical Alloys: A Concise Review. Surf. Topogr. Metrol. Prop. 2022, 10, 043001. [Google Scholar] [CrossRef]
  6. Lu, Y.; Sun, P.; Yang, X.; Guo, X.; Li, X.; Ming, W. Review of Research Progress in Nontraditional Machining of Ultrahigh-Temperature Ceramic Matrix Composites. Coatings 2023, 13, 187. [Google Scholar] [CrossRef]
  7. Liu, K.; Lauwers, B.; Reynaerts, D. Process Capabilities of Micro-EDM and Its Applications. Int. J. Adv. Manuf. Technol. 2010, 47, 11–19. [Google Scholar] [CrossRef]
  8. Kumar, D.; Porwal, R.K. Recent Advances in Machining of Composite Materials by Electrical Discharge Machine. Key Eng. Mater. 2023, 965, 3–20. [Google Scholar] [CrossRef]
  9. Pandey, A.K.; Anas, M. Sustainability and Recent Trends in Micro-Electric Discharge Machining (μ-EDM): A State-of-the-Art Review. Mater. Today Proc. 2022, 57, 2049–2055. [Google Scholar] [CrossRef]
  10. Die Sinking and Wire Cutting Edm Market Size, Trends and Growth Opportunity, by Service, by Type, by Hole Size, by Price Range by Application, by Industry Vertical, by Region and Forecast to 2030. Available online: https://www.researchandmarkets.com/reports/5783625/global-die-sinking-wire-cutting-edm-market-size (accessed on 4 May 2023).
  11. Ming, W.; Xie, Z.; Ma, J.; Du, J.; Zhang, G.; Cao, C.; Zhang, Y. Critical Review on Sustainable Techniques in Electrical Discharge Machining. J. Manuf. Process. 2021, 72, 375–399. [Google Scholar] [CrossRef]
  12. Guo, X.; Tan, L.; Xie, Z.; Zhang, L.; Zhang, G.; Ming, W. Simulation and Experimentation of Renewable Dielectric Gap Flow Fields in EDM. Int. J. Adv. Manuf. Technol. 2023, 170. [Google Scholar] [CrossRef]
  13. Ming, W.; Zhang, S.; Zhang, G.; Du, J.; Ma, J.; He, W.; Cao, C.; Liu, K. Progress in Modeling of Electrical Discharge Machining Process. Int. J. Heat Mass Transf. 2022, 187, 122563. [Google Scholar] [CrossRef]
  14. Joshi, S.N.; Pande, S.S. Development of an Intelligent Process Model for EDM. Int. J. Adv. Manuf. Technol. 2009, 45, 300–317. [Google Scholar] [CrossRef]
  15. Descoeudres, A.; Hollenstein, C.; Waelder, G.; Demellayer, R.; Perez, R. Time- and Spatially-Resolved Characterization of Electrical Discharge Machining Plasma. Plasma Sources Sci. Technol. 2008, 17, 024008. [Google Scholar] [CrossRef]
  16. He, W.; Wang, D.; Ming, W.; Ma, J.; Liu, K.; Du, J. Research Progress on Cutting Machining Simulation Technology of Metallic Glasses. Int. J. Adv. Manuf. Technol. 2022, 122, 1167–1193. [Google Scholar] [CrossRef]
  17. Unses, E.; Cogun, C. Improvement of Electric Discharge Machining (EDM) Performance of Ti6Al4V Alloy with Added Graphite Powder to Dielectric. Stroj. Vestn.-J. Mech. Eng. 2015, 61, 409–418. [Google Scholar] [CrossRef]
  18. Yu, Z.; Li, D.; Yang, J.; Zeng, Z.; Yang, X.; Li, J. Fabrication of Micro Punching Mold for Micro Complex Shape Part by Micro EDM. Int. J. Adv. Manuf. Technol. 2019, 100, 743–749. [Google Scholar] [CrossRef]
  19. Bindya Devi, M.; Kumar Birru, A.; Kumar Bannaravuri, P. The Recent Trends of EDM Applications and Its Relevance in the Machining of Aluminium MMCs: A Comprehensive Review. Mater. Today Proc. 2021, 47, 6870–6873. [Google Scholar] [CrossRef]
  20. Chekuri, R.B.R.; Eshwar, D.; Kotteda, T.K.; Srikanth Varma, R.S. Experimental and Thermal Investigation on Die-Sinking EDM Using FEM and Multi-Objective Optimization Using WOA-CS. Sustain. Energy Technol. Assess. 2022, 50, 101860. [Google Scholar] [CrossRef]
  21. Yue, X.; Yang, X. Molecular Dynamics Simulation of Machining Properties of Polycrystalline Copper in Electrical Discharge Machining. Proc. Inst. Mech. Eng. Part B J. Eng. Manuf. 2019, 233, 371–380. [Google Scholar] [CrossRef]
  22. Zhang, W. Research on the Influence of the Discharge Breakdown Process on the Crater Formation during EDM. Multidiscip. Model. Mater. Struct. 2021, 17, 841–860. [Google Scholar] [CrossRef]
  23. Chen, Z.; Hu, S.; Zhang, S.; Zhang, Q.; Zhang, Z.; Ming, W. Simulation and Experimental Study on the Precision Molding of Irregular Vehicle Glass Components. Micromachines 2023, 14, 1974. [Google Scholar] [CrossRef]
  24. Ming, W.; Zhang, Z.; Wang, S.; Huang, H.; Zhang, Y.; Zhang, Y.; Shen, D. Investigating the Energy Distribution of Workpiece and Optimizing Process Parameters during the EDM of Al6061, Inconel718, and SKD11. Int. J. Adv. Manuf. Technol. 2017, 92, 4039–4056. [Google Scholar] [CrossRef]
  25. Singh, H. Experimental Study of Distribution of Energy during EDM Process for Utilization in Thermal Models. Int. J. Heat Mass Transf. 2012, 55, 5053–5064. [Google Scholar] [CrossRef]
  26. Zhang, Y.; Liu, Y.; Shen, Y.; Li, Z.; Ji, R.; Cai, B. A Novel Method of Determining Energy Distribution and Plasma Diameter of EDM. Int. J. Heat Mass Transf. 2014, 75, 425–432. [Google Scholar] [CrossRef]
  27. Li, Q.; Yang, X. Study on Arc Plasma Movement and Its Effect on Crater Morphology during Single-Pulse Discharge in EDM. Int. J. Adv. Manuf. Technol. 2020, 106, 5033–5047. [Google Scholar] [CrossRef]
  28. Ghiculescu, D.; Marinescu, N.I.; Nanu, S. Modelling Aspects of Removal Mechanism at Ultrasonic Aided Electrodischarge Machining. Int. J. Mater. Form. 2009, 2, 685–688. [Google Scholar] [CrossRef]
  29. Khatri, B.C.; Rathod, P.; Valaki, J.B. Ultrasonic Vibration–Assisted Electric Discharge Machining: A Research Review. Proc. Inst. Mech. Eng. Part B J. Eng. Manuf. 2016, 230, 319–330. [Google Scholar] [CrossRef]
  30. Mansoor, S.M.; Raj, S.O.N.; Pal, V.K.; Roy, S. Finite Element Analysis of Magnetic Field Assisted Wire Electric Discharge Machine. IOP Conf. Ser. Mater. Sci. Eng. 2018, 402, 012051. [Google Scholar] [CrossRef]
  31. Ming, W.; Zhang, Z.; Wang, S.; Zhang, Y.; Shen, F.; Zhang, G. Comparative Study of Energy Efficiency and Environmental Impact in Magnetic Field Assisted and Conventional Electrical Discharge Machining. J. Clean. Prod. 2019, 214, 12–28. [Google Scholar] [CrossRef]
  32. Jithin, S.; Raut, A.; Bhandarkar, U.V.; Joshi, S.S. FE Modeling for Single Spark in EDM Considering Plasma Flushing Efficiency. Procedia Manuf. 2018, 26, 617–628. [Google Scholar] [CrossRef]
  33. Chen, Y.; Hu, S.; Li, A.; Cao, Y.; Zhao, Y.; Ming, W. Parameters Optimization of Electrical Discharge Machining Process Using Swarm Intelligence: A Review. Metals 2023, 13, 839. [Google Scholar] [CrossRef]
  34. Chao, Z.; Mingbo, Q.; Jing, Y.; Yunxiao, H.; Jiongbo, F. Influence of Electrode Temperature on Electric Erosion Pit Morphology during Cool Electrode EDM. Int. J. Adv. Manuf. Technol. 2017, 93, 2173–2181. [Google Scholar] [CrossRef]
  35. Tariq Jilani, S.; Pandey, P.C. Analysis and Modelling of Edm Parameters. Precis. Eng. 1982, 4, 215–221. [Google Scholar] [CrossRef]
  36. Tariq Jilani, S.; Pandey, P.C. An Analysis of Surface Erosion in Electrical Discharge Machining. Wear 1983, 84, 275–284. [Google Scholar] [CrossRef]
  37. DiBitonto, D.D.; Eubank, P.T.; Patel, M.R.; Barrufet, M.A. Theoretical Models of the Electrical Discharge Machining Process. I. A Simple Cathode Erosion Model. J. Appl. Phys. 1989, 66, 4095–4103. [Google Scholar] [CrossRef]
  38. Patel, M.R.; Barrufet, M.A.; Eubank, P.T.; DiBitonto, D.D. Theoretical Models of the Electrical Discharge Machining Process. II. The Anode Erosion Model. J. Appl. Phys. 1989, 66, 4104–4111. [Google Scholar] [CrossRef]
  39. Salonitis, K.; Stournaras, A.; Stavropoulos, P.; Chryssolouris, G. Thermal Modeling of the Material Removal Rate and Surface Roughness for Die-Sinking EDM. Int. J. Adv. Manuf. Technol. 2009, 40, 316–323. [Google Scholar] [CrossRef]
  40. Eubank, P.T.; Patel, M.R.; Barrufet, M.A.; Bozkurt, B. Theoretical Models of the Electrical Discharge Machining Process. III. The Variable Mass, Cylindrical Plasma Model. J. Appl. Phys. 1993, 73, 7900–7909. [Google Scholar] [CrossRef]
  41. Joshi, S.N.; Pande, S.S. Thermo-Physical Modeling of Die-Sinking EDM Process. J. Manuf. Process. 2010, 12, 45–56. [Google Scholar] [CrossRef]
  42. Ming, W.; Zhang, G.; Li, H.; Guo, J.; Zhang, Z.; Huang, Y.; Chen, Z. A Hybrid Process Model for EDM Based on Finite-Element Method and Gaussian Process Regression. Int. J. Adv. Manuf. Technol. 2014, 74, 1197–1211. [Google Scholar] [CrossRef]
  43. Yeo, S.H.; Kurnia, W.; Tan, P.C. Electro-Thermal Modelling of Anode and Cathode in Micro-EDM. J. Phys.-Appl. Phys. 2007, 40, 2513–2521. [Google Scholar] [CrossRef]
  44. Kansal, H.K.; Singh, S.; Kumar, P. Numerical Simulation of Powder Mixed Electric Discharge Machining (PMEDM) Using Finite Element Method. Math. Comput. Model. 2008, 47, 1217–1237. [Google Scholar] [CrossRef]
  45. Singh, M.; Sharma, S.; Ramkumar, J. Numerical Simulation of Melt-Pool Hydrodynamics in μ-EDM Process. Procedia CIRP 2020, 95, 226–231. [Google Scholar] [CrossRef]
  46. Wang, Z.L.; Xie, B.C.; Wang, Y.K.; Zhao, W.S. Numerical Simulation of Cathode Erosion in EDM Process. Adv. Mater. Res. 2012, 462, 109–115. [Google Scholar] [CrossRef]
  47. Kuriachen, B.; Varghese, A.; Somashekhar, K.P.; Panda, S.; Mathew, J. Three-Dimensional Numerical Simulation of Microelectric Discharge Machining of Ti6Al4V. Int. J. Adv. Manuf. Technol. 2015, 79, 147–160. [Google Scholar] [CrossRef]
  48. Gadelmawla, E.S.; Koura, M.M.; Maksoud, T.M.A.; Elewa, I.M.; Soliman, H.H. Roughness Parameters. J. Mater. Process. Technol. 2002, 123, 133–145. [Google Scholar] [CrossRef]
  49. Marafona, J.; Chousal, J.A.G. A Finite Element Model of EDM Based on the Joule Effect. Int. J. Mach. Tools Manuf. 2006, 46, 595–602. [Google Scholar] [CrossRef]
  50. Wandra, R. Finite Element Analysis of Powder Mixed Electric Discharge Machining on Ti-Alloy. Mater. Today Proc. 2022, 50, 593–599. [Google Scholar] [CrossRef]
  51. Chen, Z.; Xie, J.; Zhu, X. Experimental Study on Surface Physical Behaviour and Integrity of Polycrystalline Diamond (PCD) in Micron-Scale Abrasive Flow Assisted Impulse-Discharge Machining. Int. J. Refract. Met. Hard Mater. 2023, 116, 106330. [Google Scholar] [CrossRef]
  52. Algodi, S.J.; Clare, A.T.; Brown, P.D. Modelling of Single Spark Interactions during Electrical Discharge Coating. J. Mater. Process. Technol. 2018, 252, 760–772. [Google Scholar] [CrossRef]
  53. Assarzadeh, S.; Ghoreishi, M. Prediction of Root Mean Square Surface Roughness in Low Discharge Energy Die-Sinking EDM Process Considering the Effects of Successive Discharges and Plasma Flushing Efficiency. J. Manuf. Process. 2017, 30, 502–515. [Google Scholar] [CrossRef]
  54. Philip, J.T.; Mathew, J.; Kuriachen, B. Numerical Simulation of the Effect of Crater Morphology for the Prediction of Surface Roughness on Electrical Discharge Textured Ti6Al4V. J. Braz. Soc. Mech. Sci. Eng. 2020, 42, 248. [Google Scholar] [CrossRef]
  55. George, J.; Mathew, J.; Manu, R. Determination of Crater Morphology and 3D Surface Roughness in Wire Electrical Discharge Turning of Inconel 825. Arab. J. Sci. Eng. 2020, 45, 5109–5127. [Google Scholar] [CrossRef]
  56. Li, Z.; Liu, Y.; Cao, B.; Li, W. Modeling of Material Removal Morphology and Prediction of Surface Roughness Based on WEDM Successive Discharges. Int. J. Adv. Manuf. Technol. 2022, 120, 2015–2029. [Google Scholar] [CrossRef]
  57. Joudivand Sarand, M.; Shabgard, M.; Jodari Saghaie, M.; Joudivand Sarand, L. Tool Wear Estimating Model Considering Modeling Improvement Factors in Electrical Discharge Machining Process Based on Physical Properties of Tool Electrodes. Proc. Inst. Mech. Eng. Part B J. Eng. Manuf. 2017, 231, 850–866. [Google Scholar] [CrossRef]
  58. Papazoglou, E.L.; Karmiris-Obratański, P.; Leszczyńska-Madej, B.; Markopoulos, A.P. A Study on Electrical Discharge Machining of Titanium Grade2 with Experimental and Theoretical Analysis. Sci. Rep. 2021, 11, 8971. [Google Scholar] [CrossRef] [PubMed]
  59. Vignesh, M.; Ramanujam, R. Numerical Modelling and Experimental Validation of Crater Formation in WEDM Hybrid Turning of Ti6Al4V Alloy. Proc. Inst. Mech. Eng. Part E J. Process Mech. Eng. 2021, 235, 392–404. [Google Scholar] [CrossRef]
  60. Pandey, P.C.; Jilani, S.T. Plasma Channel Growth and the Resolidified Layer in Edm. Precis. Eng. 1986, 8, 104–110. [Google Scholar] [CrossRef]
  61. Shabgard, M.R.; Gholipoor, A.; Mohammadpourfard, M. Investigating the Effects of External Magnetic Field on Machining Characteristics of Electrical Discharge Machining Process, Numerically and Experimentally. Int. J. Adv. Manuf. Technol. 2019, 102, 55–65. [Google Scholar] [CrossRef]
  62. George, J.; Philip, J.T.; Mathew, J.; Manu, R. Prediction and Analysis of Material Removal Rate and White Layer Thickness during Wire Electrical Discharge Turning (WEDT) Process. CIRP J. Manuf. Sci. Technol. 2022, 39, 210–222. [Google Scholar] [CrossRef]
  63. Zhang, G.; Huang, H.; Zhang, Z.; Zhang, Y. Study on the Effect of Three Dimensional Wire Vibration on WEDM Based on a Novel Thermophysical Model. Int. J. Adv. Manuf. Technol. 2019, 100, 2089–2101. [Google Scholar] [CrossRef]
  64. Gholipoor, A.; Shabgard, M.R.; Mohammadpourfard, M. A Novel Approach to Plasma Channel Radius Determination and Numerical Modeling of Electrical Discharge Machining Process. J. Braz. Soc. Mech. Sci. Eng. 2020, 42, 185. [Google Scholar] [CrossRef]
  65. Shahane, S.; Pande, S.S. Development of a Thermo-Physical Model for Multi-Spark Wire EDM Process. Procedia Manuf. 2016, 5, 205–219. [Google Scholar] [CrossRef]
  66. Banerjee, S.; Prasad, B. Numerical Evaluation of Transient Thermal Loads on a WEDM Wire Electrode under Spatially Random Multiple Discharge Conditions with and without Clustering of Sparks. Int. J. Adv. Manuf. Technol. 2010, 48, 571–580. [Google Scholar] [CrossRef]
  67. Erdem, O.; Cogun, C.; Uslan, I.; Erbas, M. Thermo-Fluid Multi-Physics Modeling and Experimental Verification of Volumetric Workpiece Material Removal by a Discharge Pulse in Electric Discharge Machining Process. J. Phys. D Appl. Phys. 2020, 53, 395501. [Google Scholar] [CrossRef]
  68. Hinduja, S.; Kunieda, M. Modelling of ECM and EDM Processes. CIRP Ann. 2013, 62, 775–797. [Google Scholar] [CrossRef]
  69. Izquierdo, B.; Sánchez, J.A.; Plaza, S.; Pombo, I.; Ortega, N. A Numerical Model of the EDM Process Considering the Effect of Multiple Discharges. Int. J. Mach. Tools Manuf. 2009, 49, 220–229. [Google Scholar] [CrossRef]
  70. Philip, J.T.; Kuriachen, B.; Mathew, J. Numerical Modelling and Simulation of Single and Multi-spark Impacts in Electrical Discharge Machining. In Advances in Simulation, Product Design and Development: Proceedings of AIMTDR 2018; Springer: Singapore, 2019; pp. 479–488. [Google Scholar]
  71. Saikiran, H.; Kaushal, I.V.; Chandra, M.A. Experimental and numerical analysis of metal removal rate and surface finish on orvar supreme. In Proceedings of the 38th IRF International Conference, Chennai, India, 20 March 2016. [Google Scholar]
  72. Almacinha, J.A.; Lopes, A.M.; Rosa, P.; Marafona, J.D. How Hydrogen Dielectric Strength Forces the Work Voltage in the Electric Discharge Machining. Micromachines 2018, 9, 240. [Google Scholar] [CrossRef] [PubMed]
  73. Razeghiyadaki, A.; Molardi, C.; Talamona, D.; Perveen, A. Modeling of Material Removal Rate and Surface Roughness Generated during Electro-Discharge Machining. Machines 2019, 7, 47. [Google Scholar] [CrossRef]
  74. Yildiz, Y. Prediction of White Layer Thickness and Material Removal Rate in Electrical Discharge Machining by Thermal Analyses. J. Manuf. Process. 2016, 23, 47–53. [Google Scholar] [CrossRef]
  75. Kurnia, W.; Tan, P.C.; Yeo, S.H.; Tan, Q.P. Surface Roughness Model for Micro Electrical Discharge Machining. Proc. Inst. Mech. Eng. Part B J. Eng. Manuf. 2009, 223, 279–287. [Google Scholar] [CrossRef]
  76. Jithin, S.; Raut, A.; Bhandarkar, U.V.; Joshi, S.S. Finite Element Model for Topography Prediction of Electrical Discharge Textured Surfaces Considering Multi-Discharge Phenomenon. Int. J. Mech. Sci. 2020, 177, 105604. [Google Scholar] [CrossRef]
  77. Abed, F.N.; Ramesh, V.; Fadhil Jwaid, M.; Agarwal, N.; Koundal, D.; Mohamed Ibrahim, A. Enhancement Modelling Based on Electrical Discharge Machining Successive Discharges. Adv. Mater. Sci. Eng. 2022, 2022, e8017375. [Google Scholar] [CrossRef]
  78. Jamunkar, T.; Sundaram, M. Prediction of Surface Roughness on Electrical Discharge Machined Surfaces. Manuf. Lett. 2022, 33, 143–152. [Google Scholar] [CrossRef]
  79. Jithin, S.; Bhandarkar, U.V.; Joshi, S.S. Multi-Spark Model for Predicting Surface Roughness of Electrical Discharge Textured Surfaces. Int. J. Adv. Manuf. Technol. 2020, 106, 3741–3758. [Google Scholar] [CrossRef]
  80. Puertas, I.; Luis, C.J.; Álvarez, L. Analysis of the Influence of EDM Parameters on Surface Quality, MRR and EW of WC–Co. J. Mater. Process. Technol. 2004, 153–154, 1026–1032. [Google Scholar] [CrossRef]
  81. Kim, D.; Chen, X.; Allen, P. Micro-Electro Discharge Drilling Characteristics on Molybdenum Aperture Fabrication. Int. J. Mach. Mach. Mater. 2010, 7, 161–175. [Google Scholar] [CrossRef]
  82. Barenji, R.V.; Pourasl, H.H.; Khojastehnezhad, V.M. Electrical Discharge Machining of the AISI D6 Tool Steel: Prediction and Modeling of the Material Removal Rate and Tool Wear Ratio. Precis. Eng. 2016, 45, 435–444. [Google Scholar] [CrossRef]
  83. Bellotti, M.; Wu, M.; Qian, J.; Reynaerts, D. Tool Wear and Material Removal Predictions in Micro-EDM Drilling: Advantages of Data-Driven Approaches. Appl. Sci. 2020, 10, 6357. [Google Scholar] [CrossRef]
  84. Ramasawmy, H.; Blunt, L.; Rajurkar, K.P. Investigation of the Relationship between the White Layer Thickness and 3D Surface Texture Parameters in the Die Sinking EDM Process. Precis. Eng. 2005, 29, 479–490. [Google Scholar] [CrossRef]
  85. Tan, P.C.; Yeo, S.H. Modeling of Recast Layer in Micro-Electrical Discharge Machining. J. Manuf. Sci. Eng. 2010, 132, 031001. [Google Scholar] [CrossRef]
  86. Shabgard, M.; Oliaei, S.N.B.; Seyedzavvar, M.; Najadebrahimi, A. Experimental Investigation and 3D Finite Element Prediction of the White Layer Thickness, Heat Affected Zone, and Surface Roughness in EDM Process. J. Mech. Sci. Technol. 2011, 25, 3173–3183. [Google Scholar] [CrossRef]
  87. Yadav, K.; Pradhan, S.K. Analysis of Recast Layer Thickness and Martensitic Layer Thickness in Wire Electrical Discharge Machining. Mater. Today Proc. 2021, 46, 10799–10805. [Google Scholar] [CrossRef]
  88. Rajurkar, K.P.; Pandit, S.M. Quantitative Expressions for Some Aspects of Surface Integrity of Electro Discharge Machined Components. J. Eng. Ind. 1984, 106, 171–177. [Google Scholar] [CrossRef]
  89. Cao, M.R.; Yang, S.Q.; Li, W.H.; Yang, S.C. Chip-Ejection Mechanism and Experimental Study of Water Dispersant Dielectric Fluid on Small-Hole EDM. Adv. Mater. Res. 2010, 97–101, 4111–4115. [Google Scholar] [CrossRef]
  90. Zhang, Z.; Zhang, Y.; Ming, W.; Zhang, Y.; Cao, C.; Zhang, G. A Review on Magnetic Field Assisted Electrical Discharge Machining. J. Manuf. Process. 2021, 64, 694–722. [Google Scholar] [CrossRef]
  91. Zhang, Z.; Wei, S.; Wang, P.; Qiu, W.; Zhang, G. Progress in Applications of Laser Induced Cavitation on Surface Processing. Opt. Laser Technol. 2024, 170, 110212. [Google Scholar] [CrossRef]
  92. Ming, W.; Jia, H.; Zhang, H.; Zhang, Z.; Liu, K.; Du, J.; Shen, F.; Zhang, G. A Comprehensive Review of Electric Discharge Machining of Advanced Ceramics. Ceram. Int. 2020, 46, 21813–21838. [Google Scholar] [CrossRef]
  93. Jatti, V.S.; Khedkar, N.K.; Jatti, A.V.; Jatti, V.S. Finite Element Simulation of Electric Discharge Machining Process during Machining of NiTi, NiCu and BeCu Alloys. Mater. Today Proc. 2023. [Google Scholar] [CrossRef]
  94. Shen, D.; Ming, W.; Ren, X.; Xie, Z.; Liu, X. Progress in Non-Traditional Processing for Fabricating Superhydrophobic Surfaces. Micromachines 2021, 12, 1003. [Google Scholar] [CrossRef]
  95. Bonny, K.; De Baets, P.; Vleugels, J.; Salehi, A.; Van der Biest, O.; Lauwers, B.; Liu, W. Influence of Secondary Electro-Conductive Phases on the Electrical Discharge Machinability and Frictional Behavior of ZrO2-Based Ceramic Composites. J. Mater. Process. Technol. 2008, 208, 423–430. [Google Scholar] [CrossRef]
  96. Clijsters, S.; Liu, K.; Reynaerts, D.; Lauwers, B. EDM Technology and Strategy Development for the Manufacturing of Complex Parts in SiSiC. J. Mater. Process. Technol. 2010, 210, 631–641. [Google Scholar] [CrossRef]
  97. Gupta, A.; Joshi, S.S. Modelling Effect of Magnetic Field on Material Removal in Dry Electrical Discharge Machining. Plasma Sci. Technol. 2017, 19, 025505. [Google Scholar] [CrossRef]
  98. Beravala, H.; Pandey, P.M. Modelling of Material Removal Rate in the Magnetic Field and Air-Assisted Electrical Discharge Machining. Proc. Inst. Mech. Eng. Part C J. Mech. Eng. Sci. 2020, 234, 1286–1297. [Google Scholar] [CrossRef]
  99. Shabgard, M.R.; Sadizadeh, B.; Amini, K.; Pourziaie, H. Comparative Study and Mathematical Modeling of Machining Parameters in Ultrasonic-Assisted EDM of AISI H13 Tool Steel by the Application of Workpiece Vibration. Adv. Mater. Res. 2011, 154–155, 1604–1613. [Google Scholar] [CrossRef]
  100. Zhang, Z.; Huang, H.; Ming, W.; Xu, Z.; Huang, Y.; Zhang, G. Study on Machining Characteristics of WEDM with Ultrasonic Vibration and Magnetic Field Assisted Techniques. J. Mater. Process. Technol. 2016, 234, 342–352. [Google Scholar] [CrossRef]
  101. Praneetpongrung, C.; Fukuzawa, Y.; Nagasawa, S.; Yamashita, K. Effects of the Edm Combined Ultrasonic Vibration on the Machining Properties of Si3N4. Mater. Trans. 2010, 51, 2113–2120. [Google Scholar] [CrossRef]
  102. Lin, Y.-C.; Lee, H.-S. Machining Characteristics of Magnetic Force-Assisted EDM. Int. J. Mach. Tools Manuf. 2008, 48, 1179–1186. [Google Scholar] [CrossRef]
  103. Ming, W.; Shen, F.; Zhang, G.; Liu, G.; Du, J.; Chen, Z. Green Machining: A Framework for Optimization of Cutting Parameters to Minimize Energy Consumption and Exhaust Emissions during Electrical Discharge Machining of Al 6061 and SKD 11. J. Clean. Prod. 2021, 285, 124889. [Google Scholar] [CrossRef]
  104. Ma, J.; Yin, C.; Li, X.; Han, X.; Ming, W.; Chen, S.; Cao, Y.; Liu, K. Optimization of EDM Process Parameters Based on Variable-Fidelity Surrogate Model. Int. J. Adv. Manuf. Technol. 2022, 122, 2031–2041. [Google Scholar] [CrossRef]
  105. Ming, W.; Xie, Z.; Cao, C.; Liu, M.; Zhang, F.; Yang, Y.; Zhang, S.; Sun, P.; Guo, X. Research on EDM Performance of Renewable Dielectrics under Different Electrodes for Machining SKD11. Crystals 2022, 12, 291. [Google Scholar] [CrossRef]
  106. Ming, W.; Shen, F.; Zhang, Z.; Huang, H.; Du, J.; Wu, J. A Comparative Investigation on Magnetic Field–Assisted EDM of Magnetic and Non-Magnetic Materials. Int. J. Adv. Manuf. Technol. 2020, 109, 1103–1116. [Google Scholar] [CrossRef]
  107. Wang, Y.; Liu, Z.; Shi, J.; Dong, Y.; Yang, S.; Zhang, X.; Lin, B. Analysis of Material Removal and Surface Generation Mechanism of Ultrasonic Vibration–Assisted EDM. Int. J. Adv. Manuf. Technol. 2020, 110, 177–189. [Google Scholar] [CrossRef]
  108. Pupaza, C.; Ghiculescu, D.; Opran, C.G. A Model Regarding Material Removal Using FEM at Ultrasonic Aided EDM of Metal Matrix Composites. Appl. Mech. Mater. 2015, 760, 557–562. [Google Scholar] [CrossRef]
  109. Tang, L.; Ji, Y.; Ren, L.; Zhai, K.G.; Huang, T.Q.; Fan, Q.M.; Zhang, J.J.; Liu, J. Thermo-Electrical Coupling Simulation of Powder Mixed EDM SiC/Al Functionally Graded Materials. Int. J. Adv. Manuf. Technol. 2019, 105, 2615–2628. [Google Scholar] [CrossRef]
  110. Du, J.; Tian, B.; Duan, L.; Ming, W.; Liu, K.; He, W. Traditional and Non-Traditional Machining Technology of Metallic Glass. Int. J. Adv. Manuf. Technol. 2022, 120, 2879–2902. [Google Scholar] [CrossRef]
  111. Chen, Y.; Guo, X.; Zhang, G.; Cao, Y.; Shen, D.; Li, X.; Zhang, S.; Ming, W. Development of a Hybrid Intelligent Process Model for Micro-Electro Discharge Machining Using the TTM-MDS and Gaussian Process Regression. Micromachines 2022, 13, 845. [Google Scholar] [CrossRef] [PubMed]
  112. Zhang, Z.; Zhang, Y.; Lin, L.; Wu, J.; Yu, H.; Pan, X.; Li, G.; Wu, J.; Xue, T. Study on Productivity and Aerosol Emissions of Magnetic Field-Assisted EDM Process of SiCp/Al Composite with High Volume Fractions. J. Clean. Prod. 2021, 292, 126018. [Google Scholar] [CrossRef]
  113. Namboodiri, V.N.J.; Pazhamannil, R.V.; Govindan, P. Finite Element Based Numerical Modelling of Near-Dry EDM with Glycerin-Air Dielectric Mixture. IOP Conf. Ser. Mater. Sci. Eng. 2022, 1248, 012019. [Google Scholar] [CrossRef]
  114. Nadda, R.; Nirala, C.K. Thermal Modeling of Single Discharge in Prospect of Tool Wear Compensation in μEDM. Int. J. Adv. Manuf. Technol. 2020, 107, 4573–4595. [Google Scholar] [CrossRef]
  115. Allen, P.; Chen, X. Process Simulation of Micro Electro-Discharge Machining on Molybdenum. J. Mater. Process. Technol. 2007, 186, 346–355. [Google Scholar] [CrossRef]
  116. Shabgard, M.R.; Gholipoor, A.; Mohammadpourfard, M. Numerical and Experimental Study of the Effects of Ultrasonic Vibrations of Tool on Machining Characteristics of EDM Process. Int. J. Adv. Manuf. Technol. 2018, 96, 2657–2669. [Google Scholar] [CrossRef]
  117. Tan, P.C.; Yeo, S.H. Simulation of Surface Integrity for Nanopowder-Mixed Dielectric in Micro Electrical Discharge Machining. Met. Mater. Trans. B 2013, 44, 711–721. [Google Scholar] [CrossRef]
  118. Liu, J.F.; Guo, Y.B. Modeling of White Layer Formation in Electric Discharge Machining (EDM) by Incorporating Massive Random Discharge Characteristics. Procedia CIRP 2016, 42, 697–702. [Google Scholar] [CrossRef]
  119. Zhang, Y.; Guo, S.; Zhang, Z.; Huang, H.; Li, W.; Zhang, G.; Huang, Y. Simulation and Experimental Investigations of Complex Thermal Deformation Behavior of Wire Electrical Discharge Machining of the Thin-Walled Component of Inconel 718. J. Mater. Process. Technol. 2019, 270, 306–322. [Google Scholar] [CrossRef]
  120. Chen, X.; Wu, Y.; He, X.; Ming, W. A Comprehensive Review of Deep Learning-Based PCB Defect Detection. IEEE Access 2023, 11, 139017–139038. [Google Scholar] [CrossRef]
Figure 1. Characteristics and applications of EDM.
Metals 14 00014 g001
Figure 2. Prediction and analysis of MRR in single-spark simulations. (a) Gaussian distribution, reproduced from [44], permission with Elsevier, 2008. (b) Schematic representation of the 2D domain used in numerical simulation, reproduced from [45], permission with Elsevier, 2020. (c) Scanned two-dimensional view of discharge pits, reproduced from [41], permission with Elsevier, 2010. (d) Three-dimensional zoomed-in view of the crater, reproduced from [41], permission with Elsevier, 2010.
Metals 14 00014 g002
Figure 3. Prediction and analysis of SR in single-spark simulations. (a) Surface roughness Rmax trends of AGIE SIT and FEA, reproduced from [49], permission with Elsevier, 2006. (b) Surface roughness model, reproduced from [50], permission with Elsevier, 2022. (c) Surface roughness profile of craters with pulsed discharges, reproduced from [51], permission with Elsevier, 2023. (d) Workpiece temperature distribution results from the single-spark simulation, reproduced from [52], permission with Elsevier, 2018.
Metals 14 00014 g003
Figure 4. Prediction and analysis of TWR in single-spark simulations. (a) Temperature distribution at both cathode and anode, reproduced from [49], permission with Elsevier, 2006. (b) Plot of TWR vs. TWR, reproduced from [58], permission with Springer Nature, 2021.
Metals 14 00014 g004
Figure 5. Prediction and analysis of RLT in single-spark simulations. (a) Comparison of simulated crater depth from a single spark event with experimentally determined electrical discharge layer thicknesses, reproduced from [52], permission with Elsevier, 2018. (b) Variation of predicted and measured WLT concerning discharge energy, reproduced from [62], permission with Elsevier, 2022.
Metals 14 00014 g005
Figure 6. Prediction and analysis of MRR in multi-spark simulations. (a) Validation of single- and multi-spark models, reproduced from [65], permission with Elsevier, 2016. (b) MRR results of the models, reproduced from [74], permission with Elsevier, 2016. (c) Comparison of MRR obtained from the numerical model with experimental values from Almacinha (discharge voltage: 20 V), reproduced from [73], permission with MDPI, 2019. (d) Variation of the volume of material removed per discharge as the operation progresses, reproduced from [69], permission with Elsevier, 2009.
Metals 14 00014 g006
Figure 7. Prediction and analysis of SR in multi-spark simulations. (a) Comparison of SR obtained from a numerical model and experimental values from Salonitis, reproduced from [73], permission with MDPI, 2019. (b) Ra distribution of the experimental and simulated surfaces of Ti6Al4V under a parameter combination of 10 A, 20 µs, and 50 V, reproduced from [76], permission with Elsevier, 2020. (c) Comparison of Ra values of the simulation and experiment, reproduced from [77], permission with Hindawi, 2022. (d) Ra distribution for 100 V–0.5 A trial, reproduced from [78], permission with Elsevier, 2022.
Metals 14 00014 g007
Figure 8. Prediction and analysis of TWR in multi-spark simulations. (a) Estimated response surface of EW vs. I and ti, reproduced from [80], permission with Elsevier, 2004. (b) Predicted versus actual response plot for TWR, reproduced from [82], permission with Elsevier, 2016.
Metals 14 00014 g008
Figure 9. Prediction and analysis of RLT in multi-spark simulations. (a) WLT results of the models, reproduced from [74], permission with Elsevier, 2016. (b) Comparison of RLTs of D2 steel obtained from ANSYS, reproduced from [87], permission with Elsevier, 2021.
Metals 14 00014 g009
Figure 11. Prediction and analysis of SR in hybrid machining simulations. (a) Comparison of Ra between EDM and MF-EDM, reproduced from [31], permission with Elsevier, 2019. (b) Simulated surface topography of SS 304 at a 10 A, 50 µs, and 50 V parameter combination, reproduced from [76], permission with Elsevier, 2020.
Metals 14 00014 g011
Figure 12. Prediction and analysis of TWR in hybrid machining simulations. (a) Optimal Pareto surface for 65% volume fraction SiCp/Al, reproduced from [112], permission with Elsevier, 2021. (b) Temperature (K) distribution after a heat flux (power = 30 W, pulse duration = 2 s), reproduced from [115], permission with Elsevier, 2007.
Metals 14 00014 g012
Figure 13. Prediction and analysis of RLT in hybrid machining simulations. (a) Prediction of solid WL and HAZ in the subsurface, reproduced from [118], permission with Elsevier, 2016. (b) The relationship between RLT and thermal deformation under different pulse-on times (water pressure: 7 (0.1 MPa); wire speed: 0.09 m/s; pulse current: 2 A), reproduced from [119], permission with Elsevier, 2019.
Metals 14 00014 g013
Table 1. Comparison of FEM models using different heat sources to predict machining performance.
Heat Source typePurposesAuthors, YearFindingsRemarks
Non-Gaussian heat sourceMRRTariq Jilan and Pandey [35], 1982As the diameter of the heat source increased, the pulse power density decreased and the MRR decreased.The removal of metal in EDM is due not only to melting but also to evaporation, thus greatly reducing the amount of heat available for conduction.
Tariq Jilan and Pandey [36], 1982From the point of view of relative electrode wear, the optimum pulse shape for pulse durations of 50 and 100 µs was an initial current of about 50% of its value at the end of the pulse duration.The effects of evaporation and re-solidification can be incorporated into the EDM model.
Dibitonto et al. [37], 1989In the confirmed experiments, the predicted Rmax matched the experimental values at low discharge energies (<100 mJ), while the predicted MRR, at high discharge energies (≥100 mJ), was close to the experimental values.Finite element modeling at high discharge energies should be further investigated.
Salonitis et al. [39],
2009
The average deviation between the experimental average MRR and the theoretical predictions of the model was about 8.2%.These deviations are due to neglecting the formation of the recast layer and assuming that the idling time is insignificant compared to the discharge time.
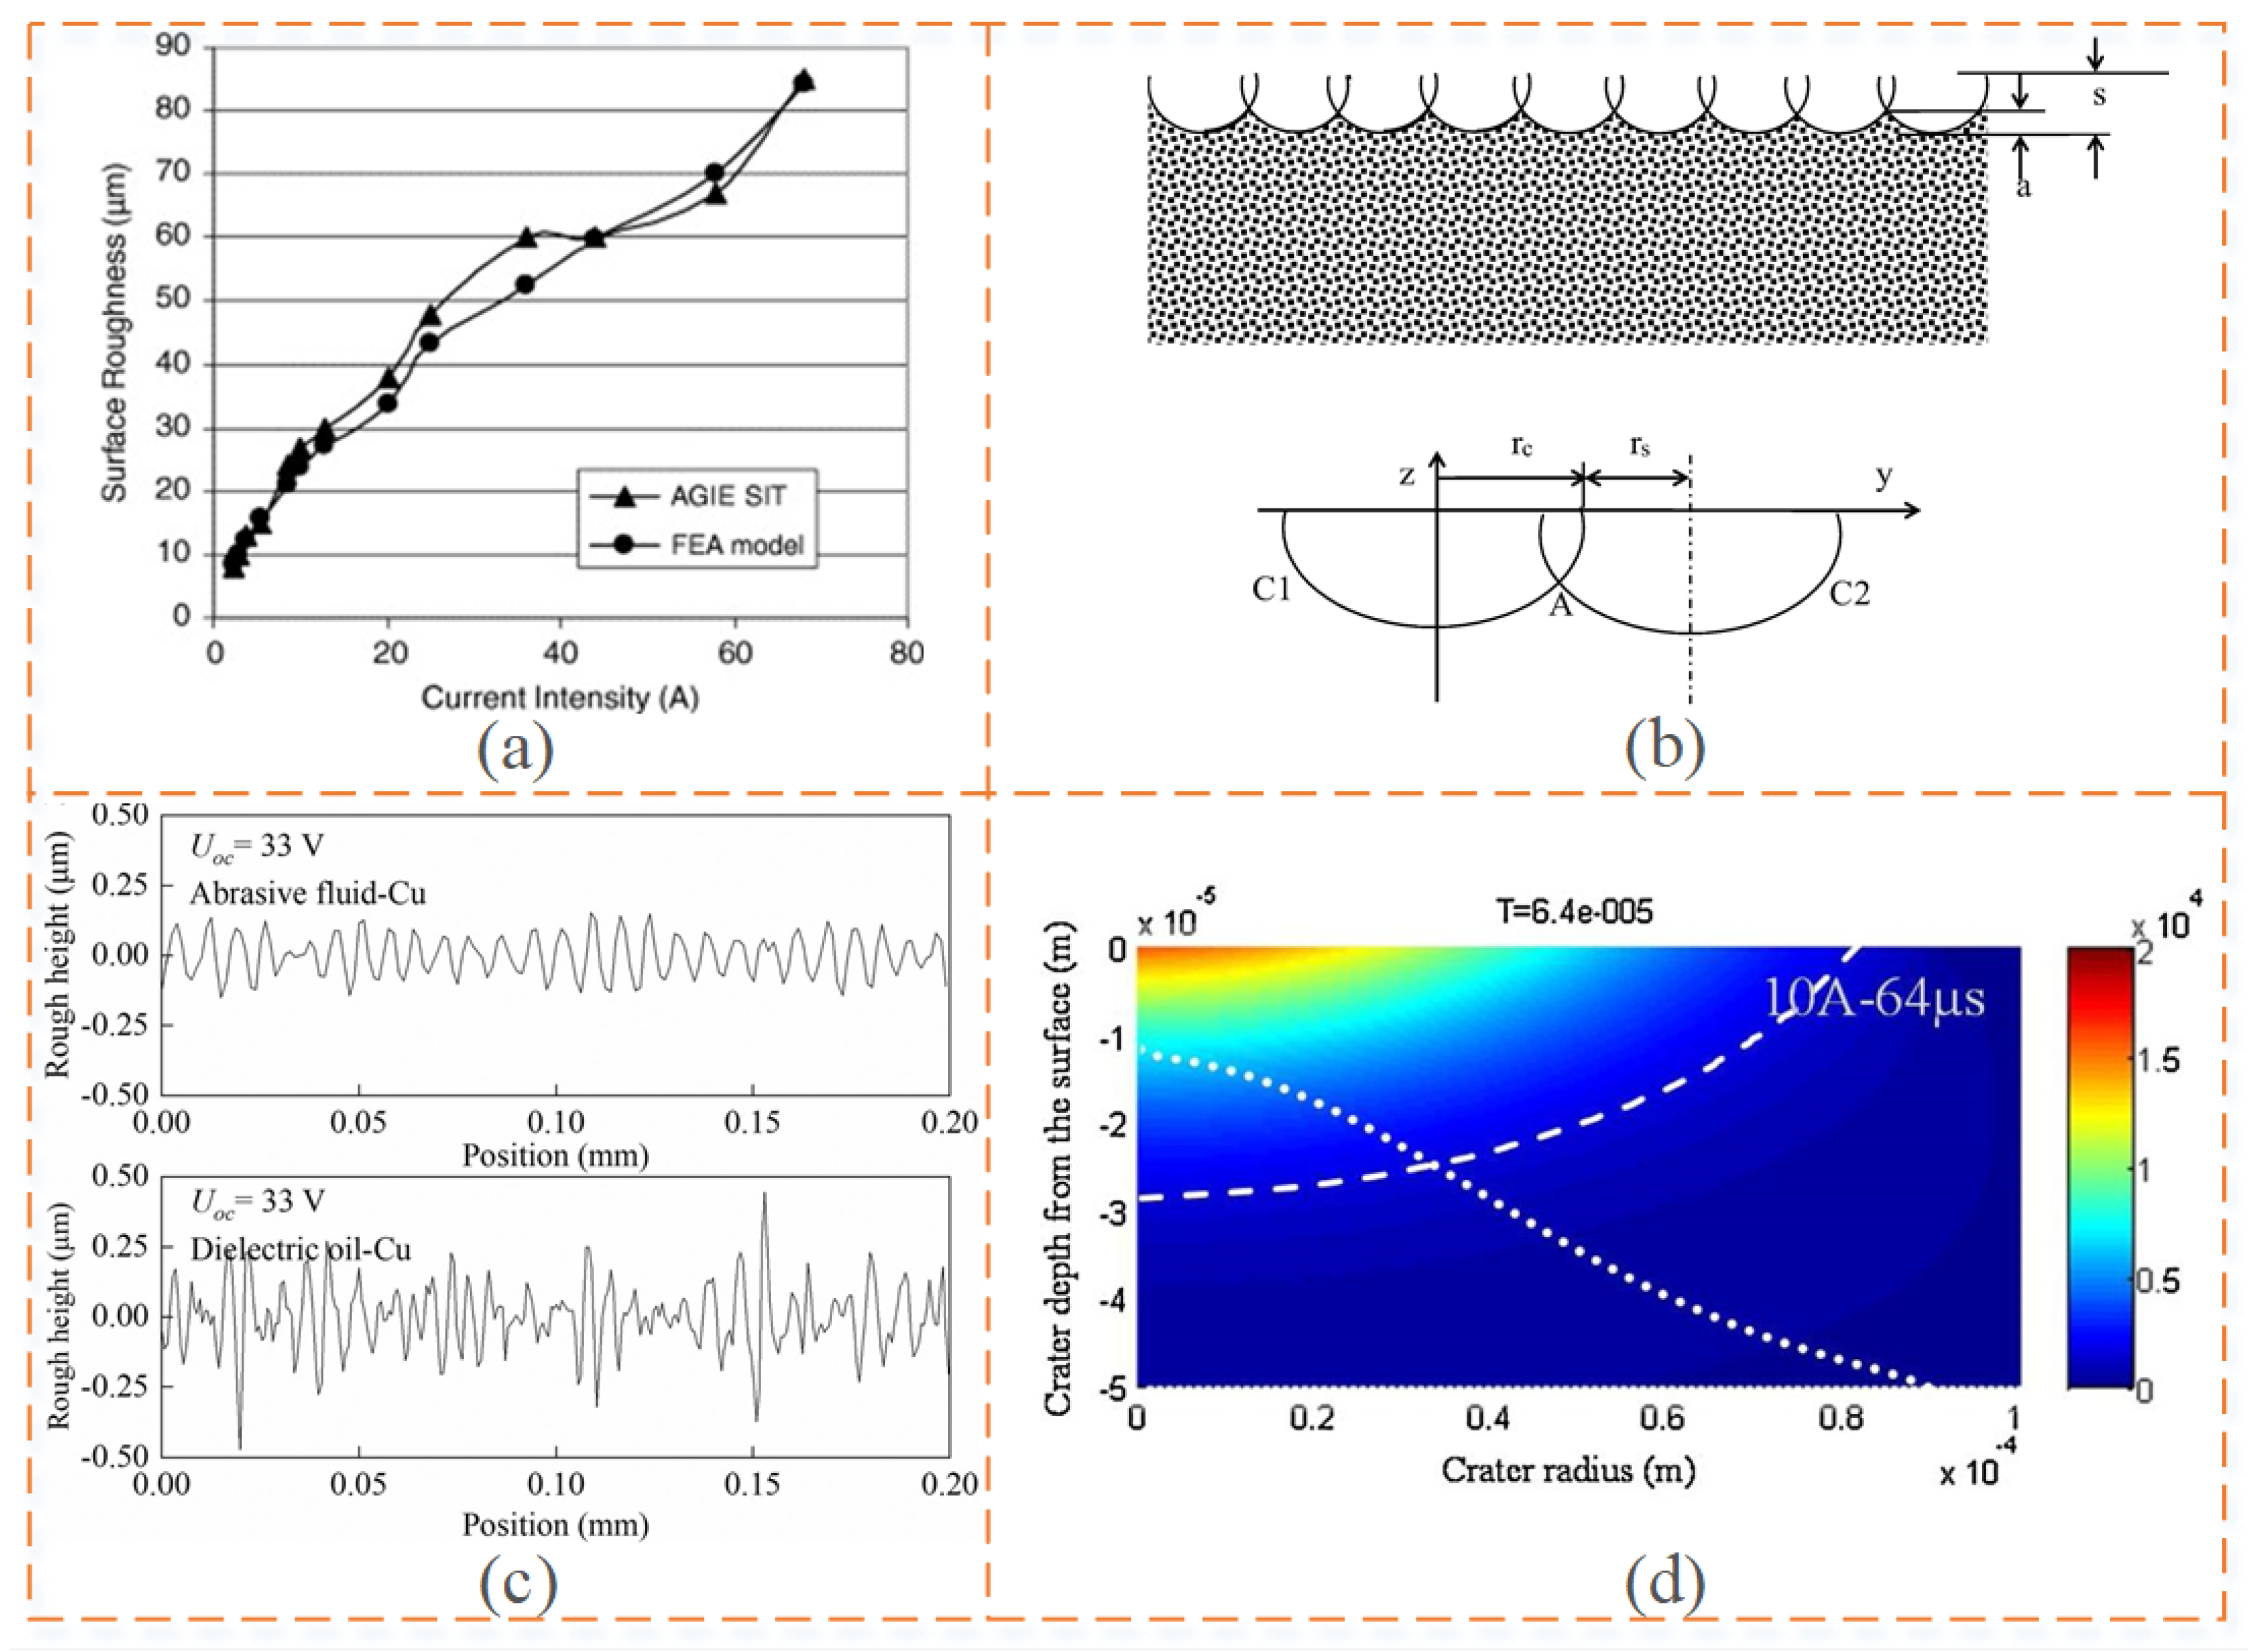
RaMarafona et al. [49],
2006
The predicted SR agrees well with the experimental results.Two-dimensional axisymmetric finite elements have simpler formulations than three-dimensional finite elements.
Salonitis et al. [39],
2009
The average deviation between the experimental average SR and the theoretical prediction of the model was about 6.1%.The error may arise because the formation of the recast layer is enhanced when dealing with larger peak currents.
RLTPandey and Jilani. [60], 1986The heat source model can calculate the thickness of the heat-affected zone caused by a single spark more accurately, and there was a good correlation between the predicted and experimental values.This heat source model can more accurately calculate the thickness of the heat-affected zone caused by single sparks.
Shabgard et al. [61], 2019The maximum error between the RLT obtained by the numerical and experimental methods was 8.8%.The application of an external magnetic field during EDM has a positive effect on increasing the PFE and reducing the RLT.
Gaussian heat sourceMRREubank et al. [40],
1993
An anode model, a cathode model, and a cylindrical plasma model were developed using a Gaussian heat source.Gaussian heat sources can more accurately simulate the heat distribution during machining than disc heat sources.
Joshi et al. [14], 2009The optimal network architecture 4–8–12–4 has a prediction error of 1.53% for the MRR.The ANN-based process model can be used to select optimum process conditions to improve EDM’s process productivity and finishing capability.
Joshi and Pande [41], 2010 The results show that the trends of the simulation analysis are consistent with the experimental results.This thermophysical model can be used to perform a wide range of parametric studies.
Singh, H. [25], 2012For different machining parameters the results of the MRR match very well.It is possible to study the effect of different material properties and machining parameters on the proportion of energy transferred to the workpiece.
Wang et al. [46],
2012
The temperature distribution at the cathode discharge point during a single discharge in the EDM process was predicted.The mechanism of material removal during EDM is better explained.
Ming et al. [42],
2014
The validation experiments show that the mean error of the MRR is 14.75%.Through the GPR model, it is found that the responses of the EDM process can be accurately predicted for the chosen process conditions.
Kuriachen et al. [47], 2015The model calculations were in good agreement with the experimental results.Combining different spark radii with the effects of capacitance and voltage, plasma pressure, and the enthalpy of the material results in a better simulation model.
Singh et al. [45],
2020
The prediction errors for the diameter and depth of the discharge crater were 12% and 13%, respectively.Material removal is mainly evaporation and melt discharge caused by recoil pressure, which determines the size of the discharge crater.
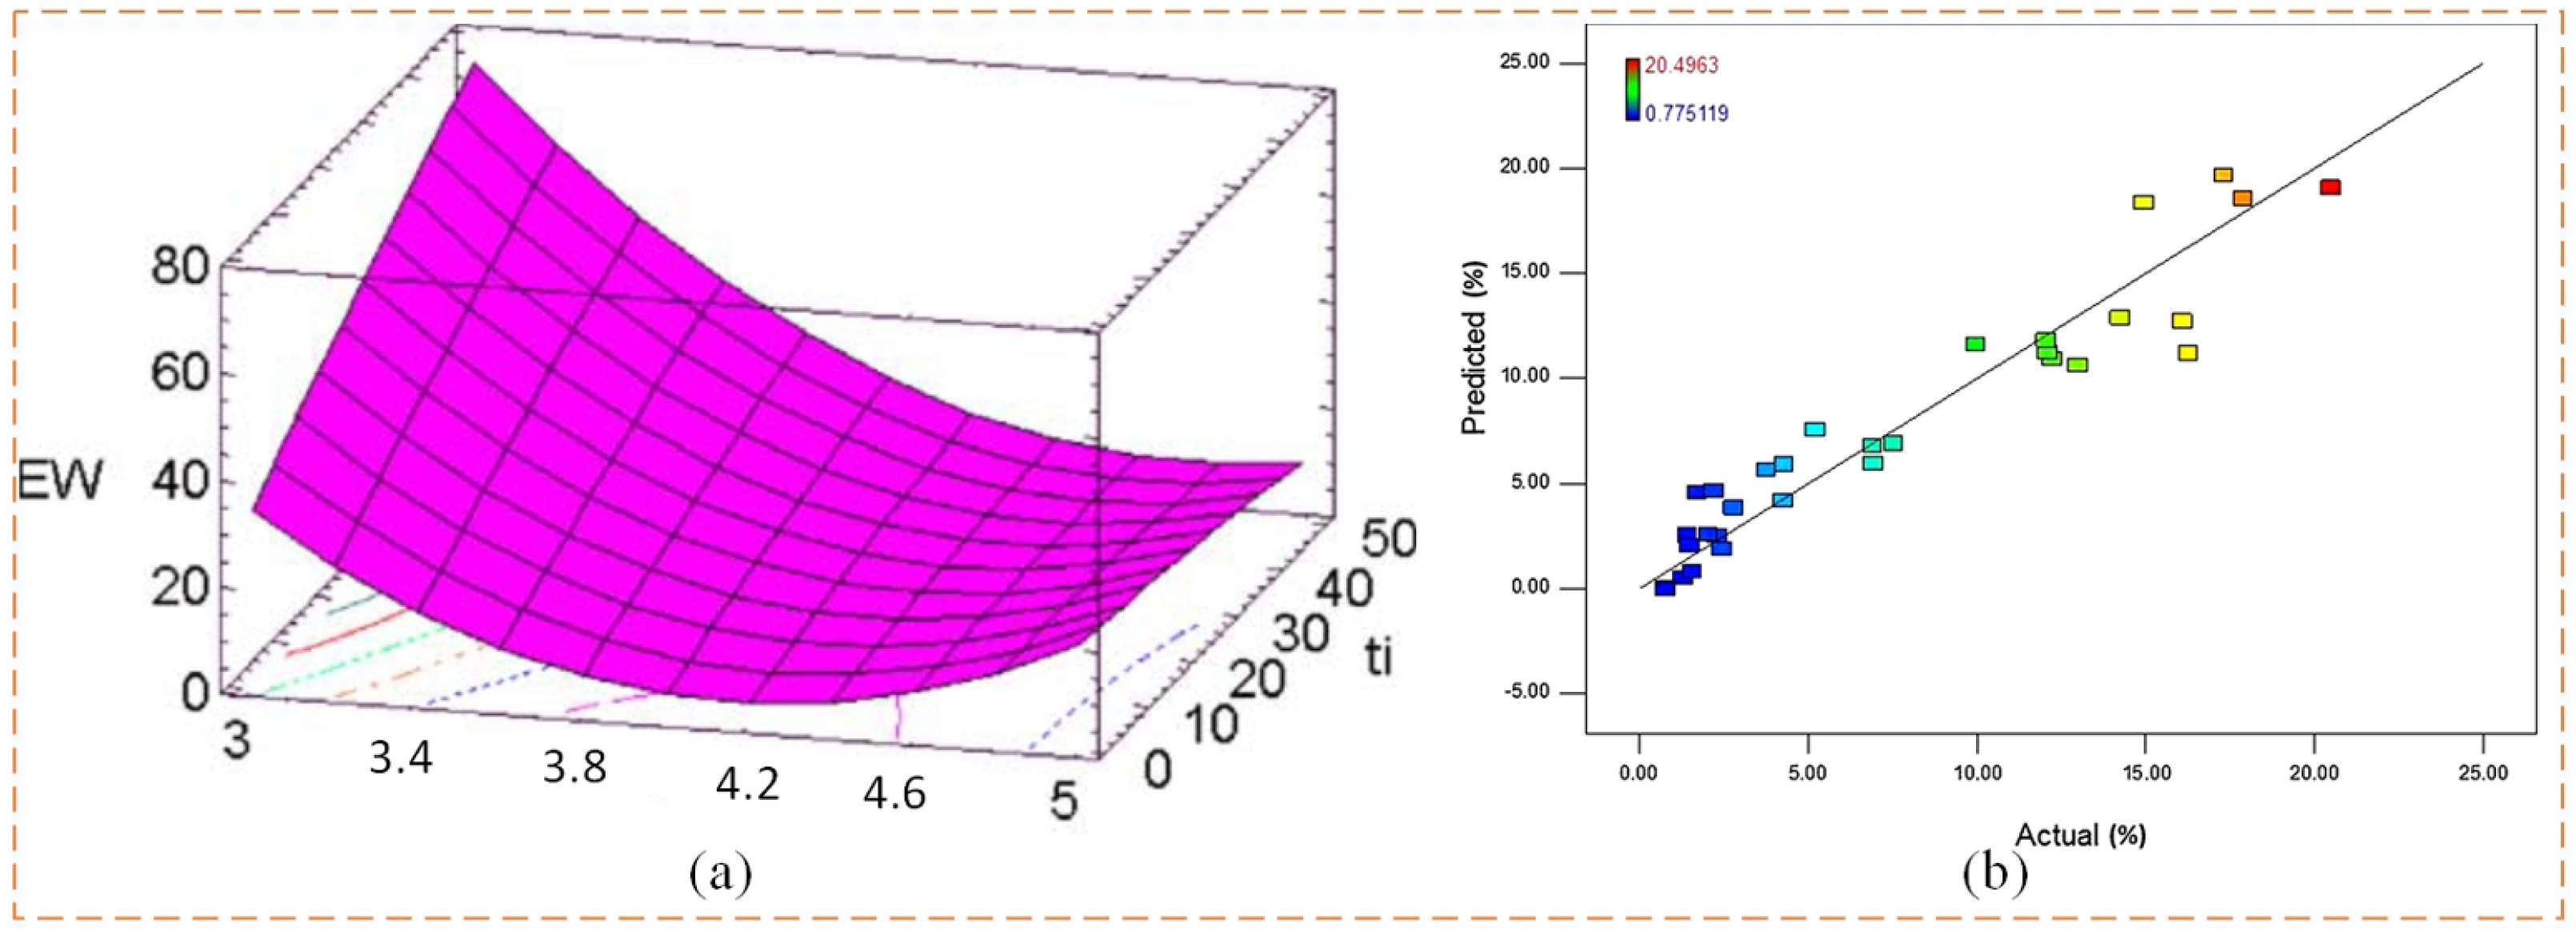
RaMing et al. [42],
2014
The mean error of Ra was 20.74%.This model can be used to select optimal process conditions to improve EDM performance.
Philip et al. [54],
2020
The model employed a Gaussian heat source, and the observed minimum-to-maximum error between the predicted Ra and the actual roughness Ra values ranges from about 8 to 25%.The formation of radially enlarged craters is the main cause of highly rough surfaces.
George et al. [55],
2020
The average absolute error of the forecast was 10.05%.This study allows for the online monitoring of the surface quality of difficult-to-machine materials.
Ming et al. [13], 2022The predicted Rmax error was found to be lower at low discharge energies (<100 mJ) and higher at high discharge energies (≥100 mJ).The accuracy of the predictions needs to be further improved, especially for EDM processes.
Li et al. [56], 2022The error in the prediction of the SR was 8.26% for the continuous discharge material removal model of wire-cutting EDM.This study contributes to a better understanding of the principles of the wire-cutting process and the formation of single-spark discharge craters.
TWRMarafona et al. [49], 2006The TWR results are fairly consistent with the values the researchers found for the AGIE SIT table itself.Two-dimensional axisymmetric finite elements have simpler formulations than three-dimensional finite elements and can reduce CPU time with very similar results.
Joshi and Pande [14], 2009The prediction accuracy of this model artificial neural network’s optimal network architecture, 4–8–12–4, for the TWR was 17.34%.Artificial neural network-based process modeling can be used to select optimal process conditions to improve the productivity and finishing capabilities of EDM machining.
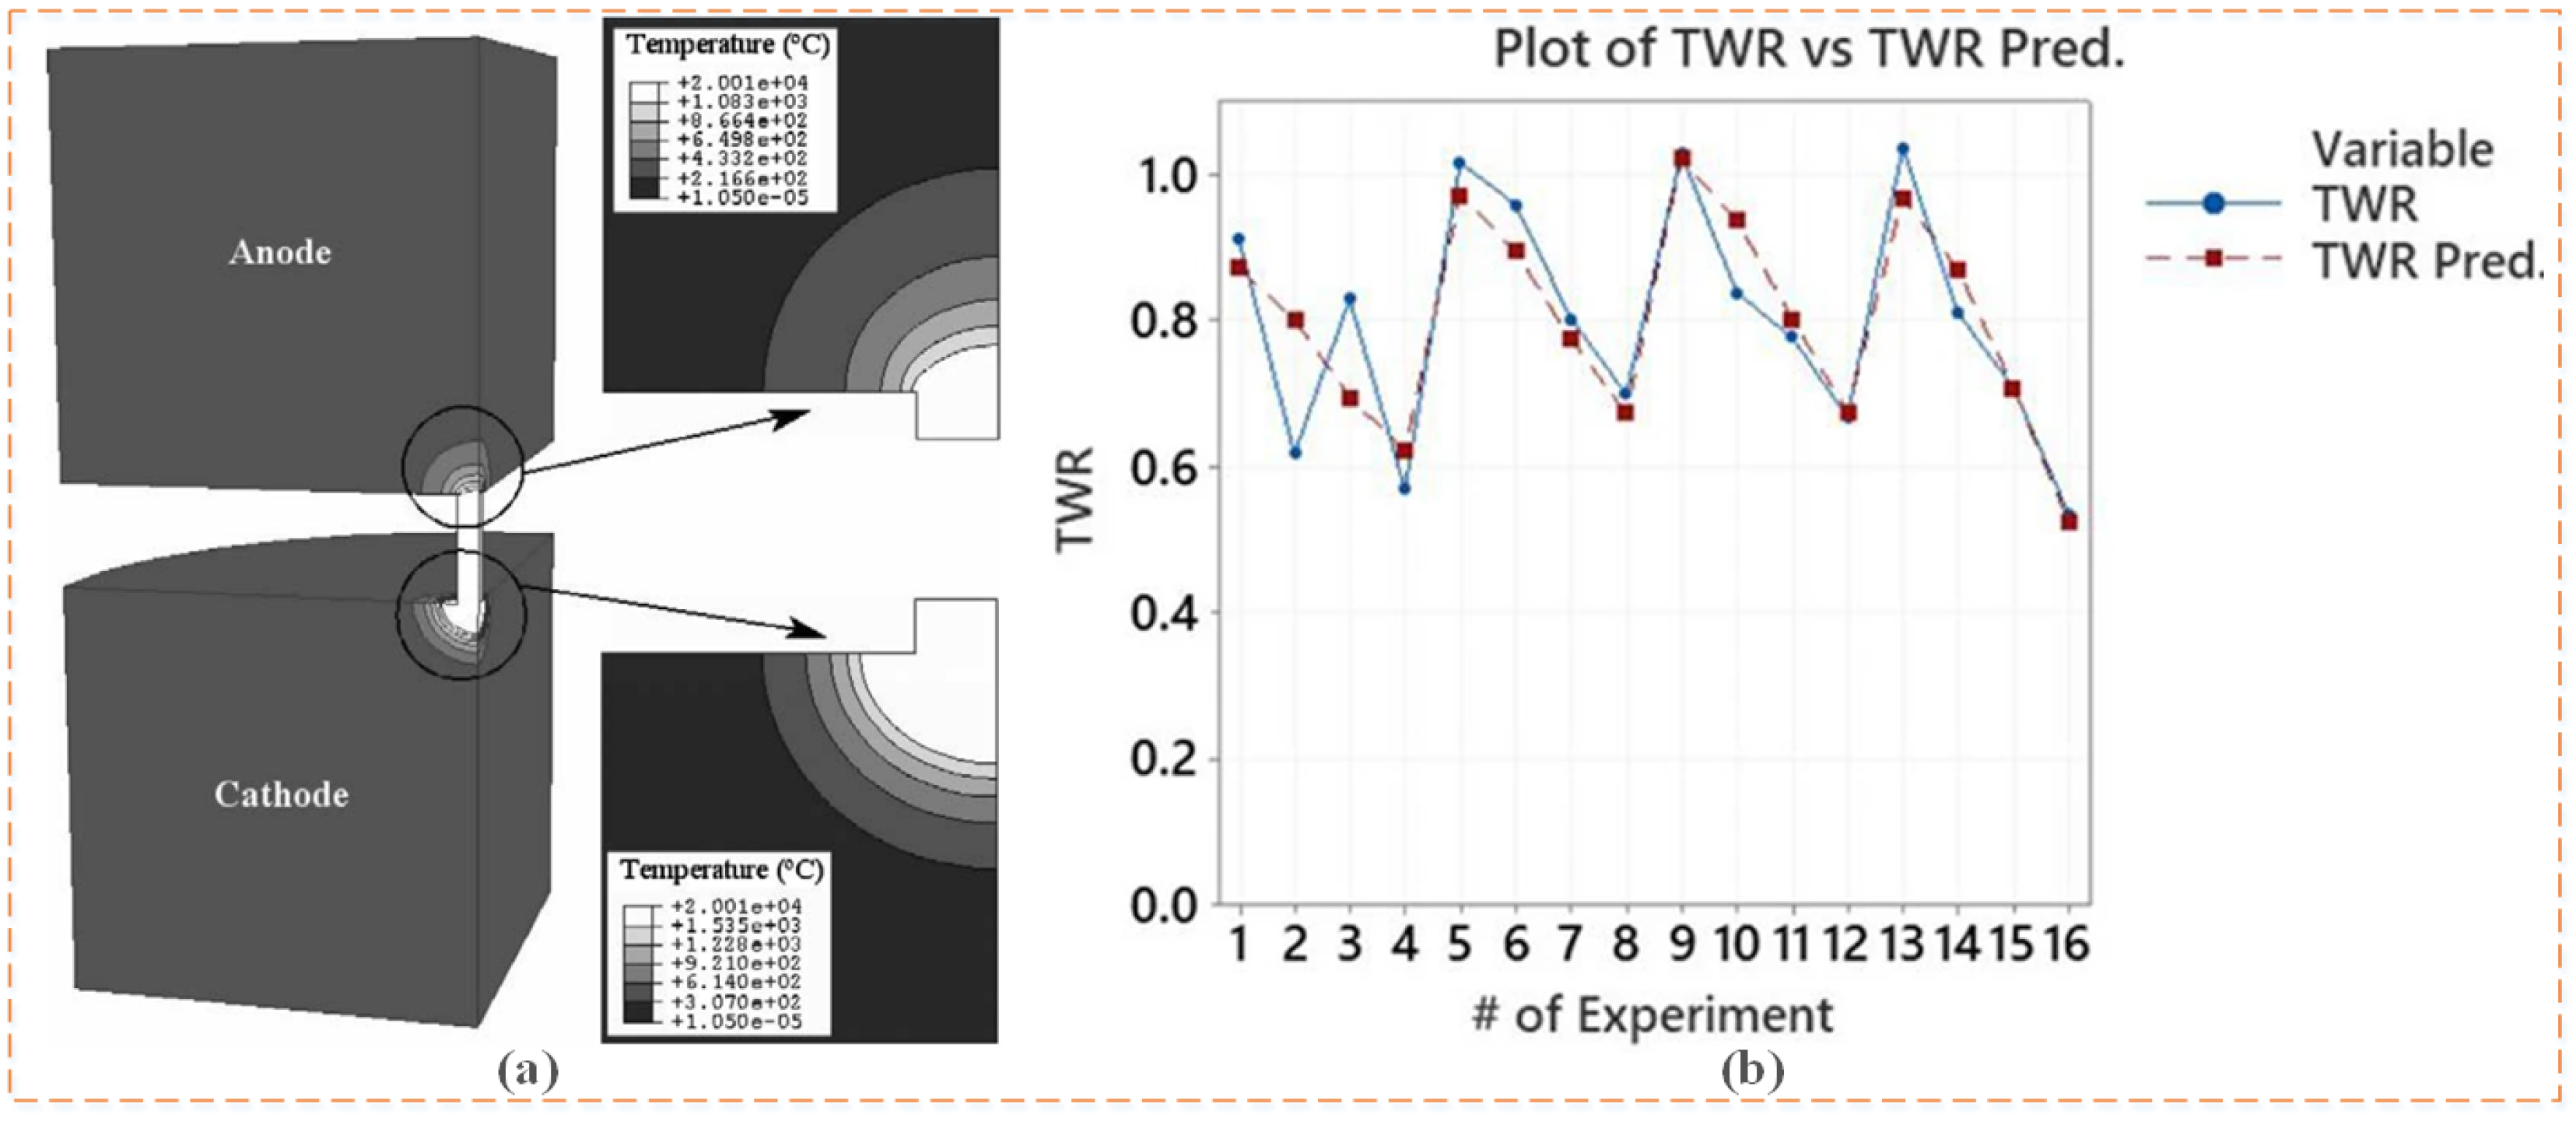
Joudivand Sarand et al. [57], 2017The average error in predicting tool wear was 4.83%.This study considers the direct and interactive effects of thermal, electrical, and physical variables on the EDM process, with accurate predictions.
Papazoglou et al. [58], 2021The TWR was mainly dependent on the pulse-on time, and an increase in pulse duration led to a decrease in that ratio.Optimal processing schedules can be achieved on a case-by-case basis using recommended MRR, TWR, and average white layer thickness correlations.
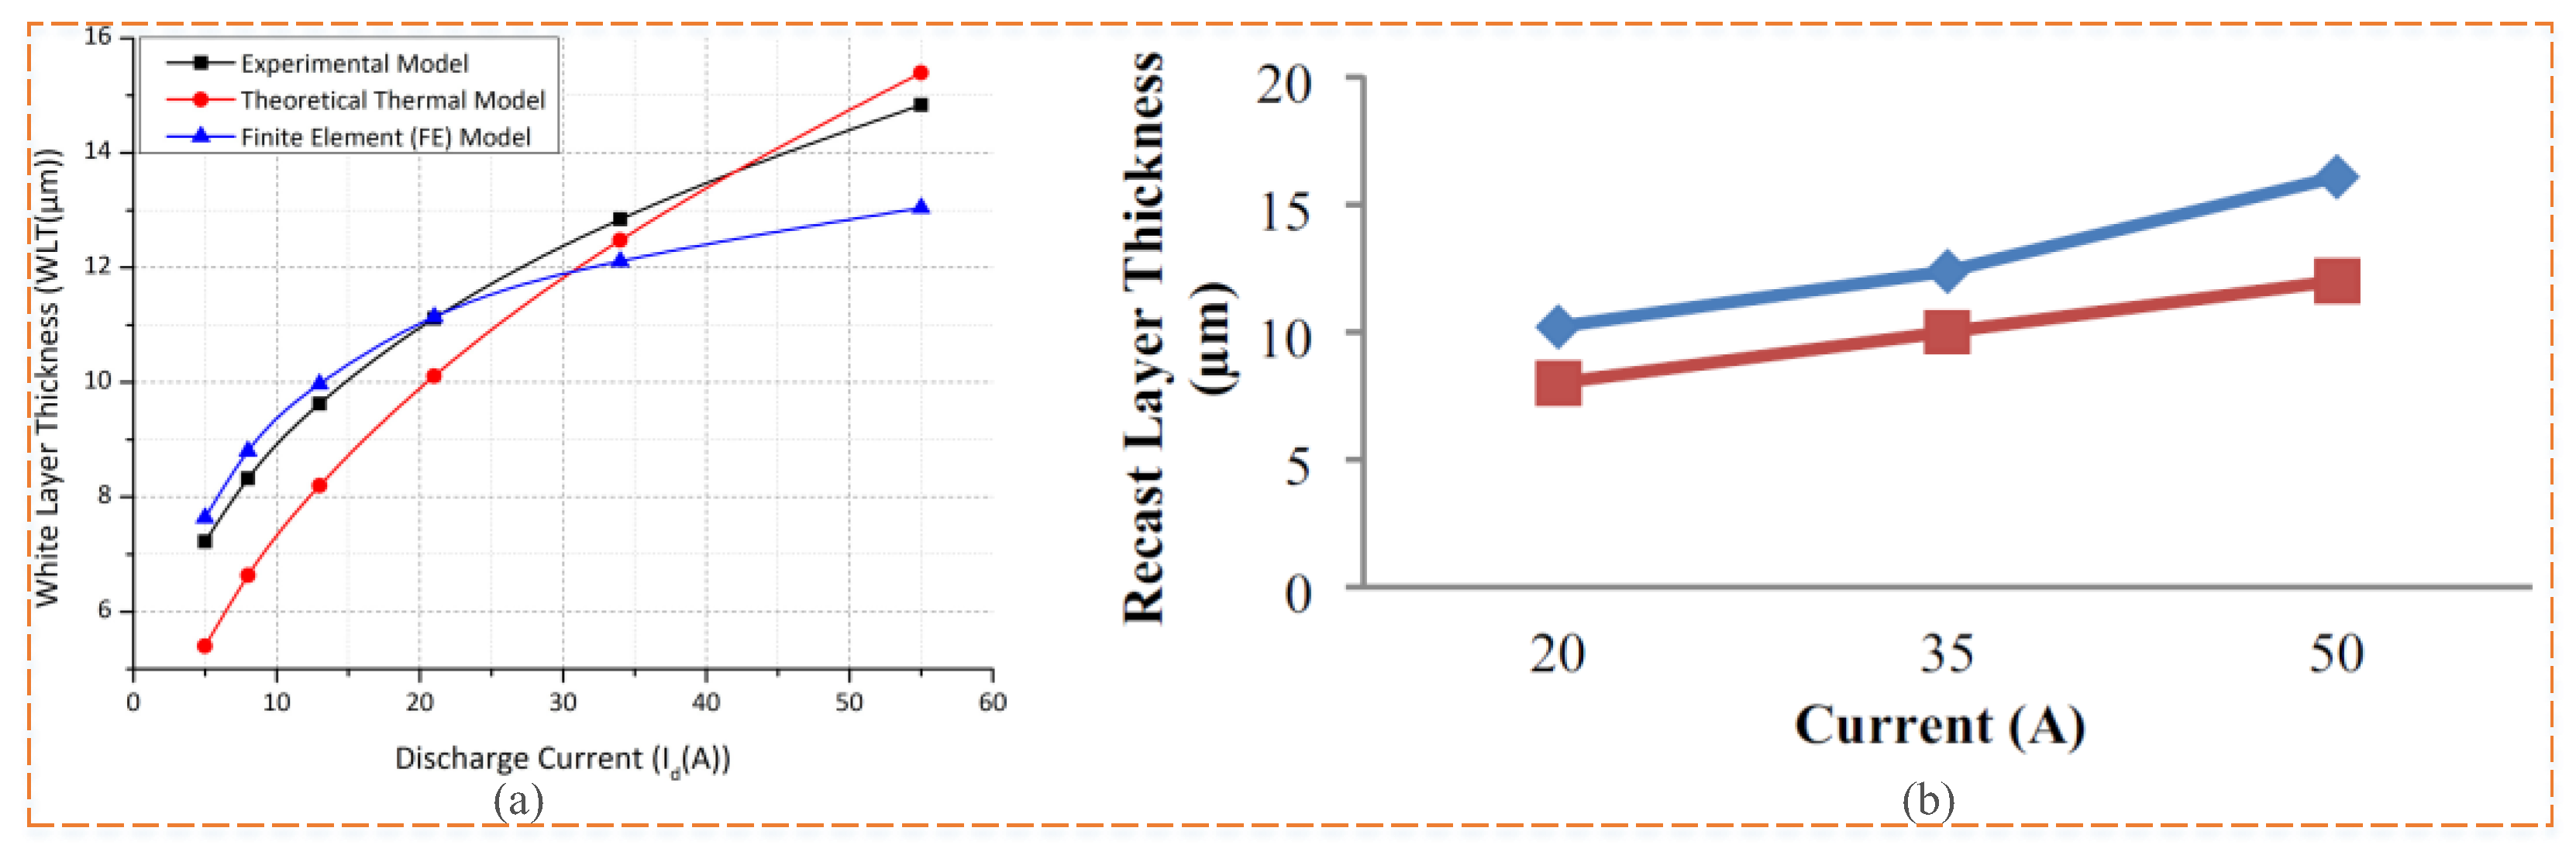
RLTJoudivand Sarand et al. [57], 2017The average error in the estimation of the RLT was 3.96%.Pulse current, pulse on-time, and the thermal diffusion coefficient have a significant effect on the thickness of the recast layer.
Zhang et al. [63],
2019
Upon comparison with the experimental results, the relative error of the RLT was found to be less than 20%.Controlling wire vibration helps improve EDM’s wire-cutting performance.
Gholipoo-r et al. [64], 2020The increase in pulse duration decreased the PFE and increased the thickness of the recast layer.Above a certain value of pulse current, the increase in the PFE is counterbalanced by the depth of thermal penetration and the volume of molten material, and the RLT decreases.
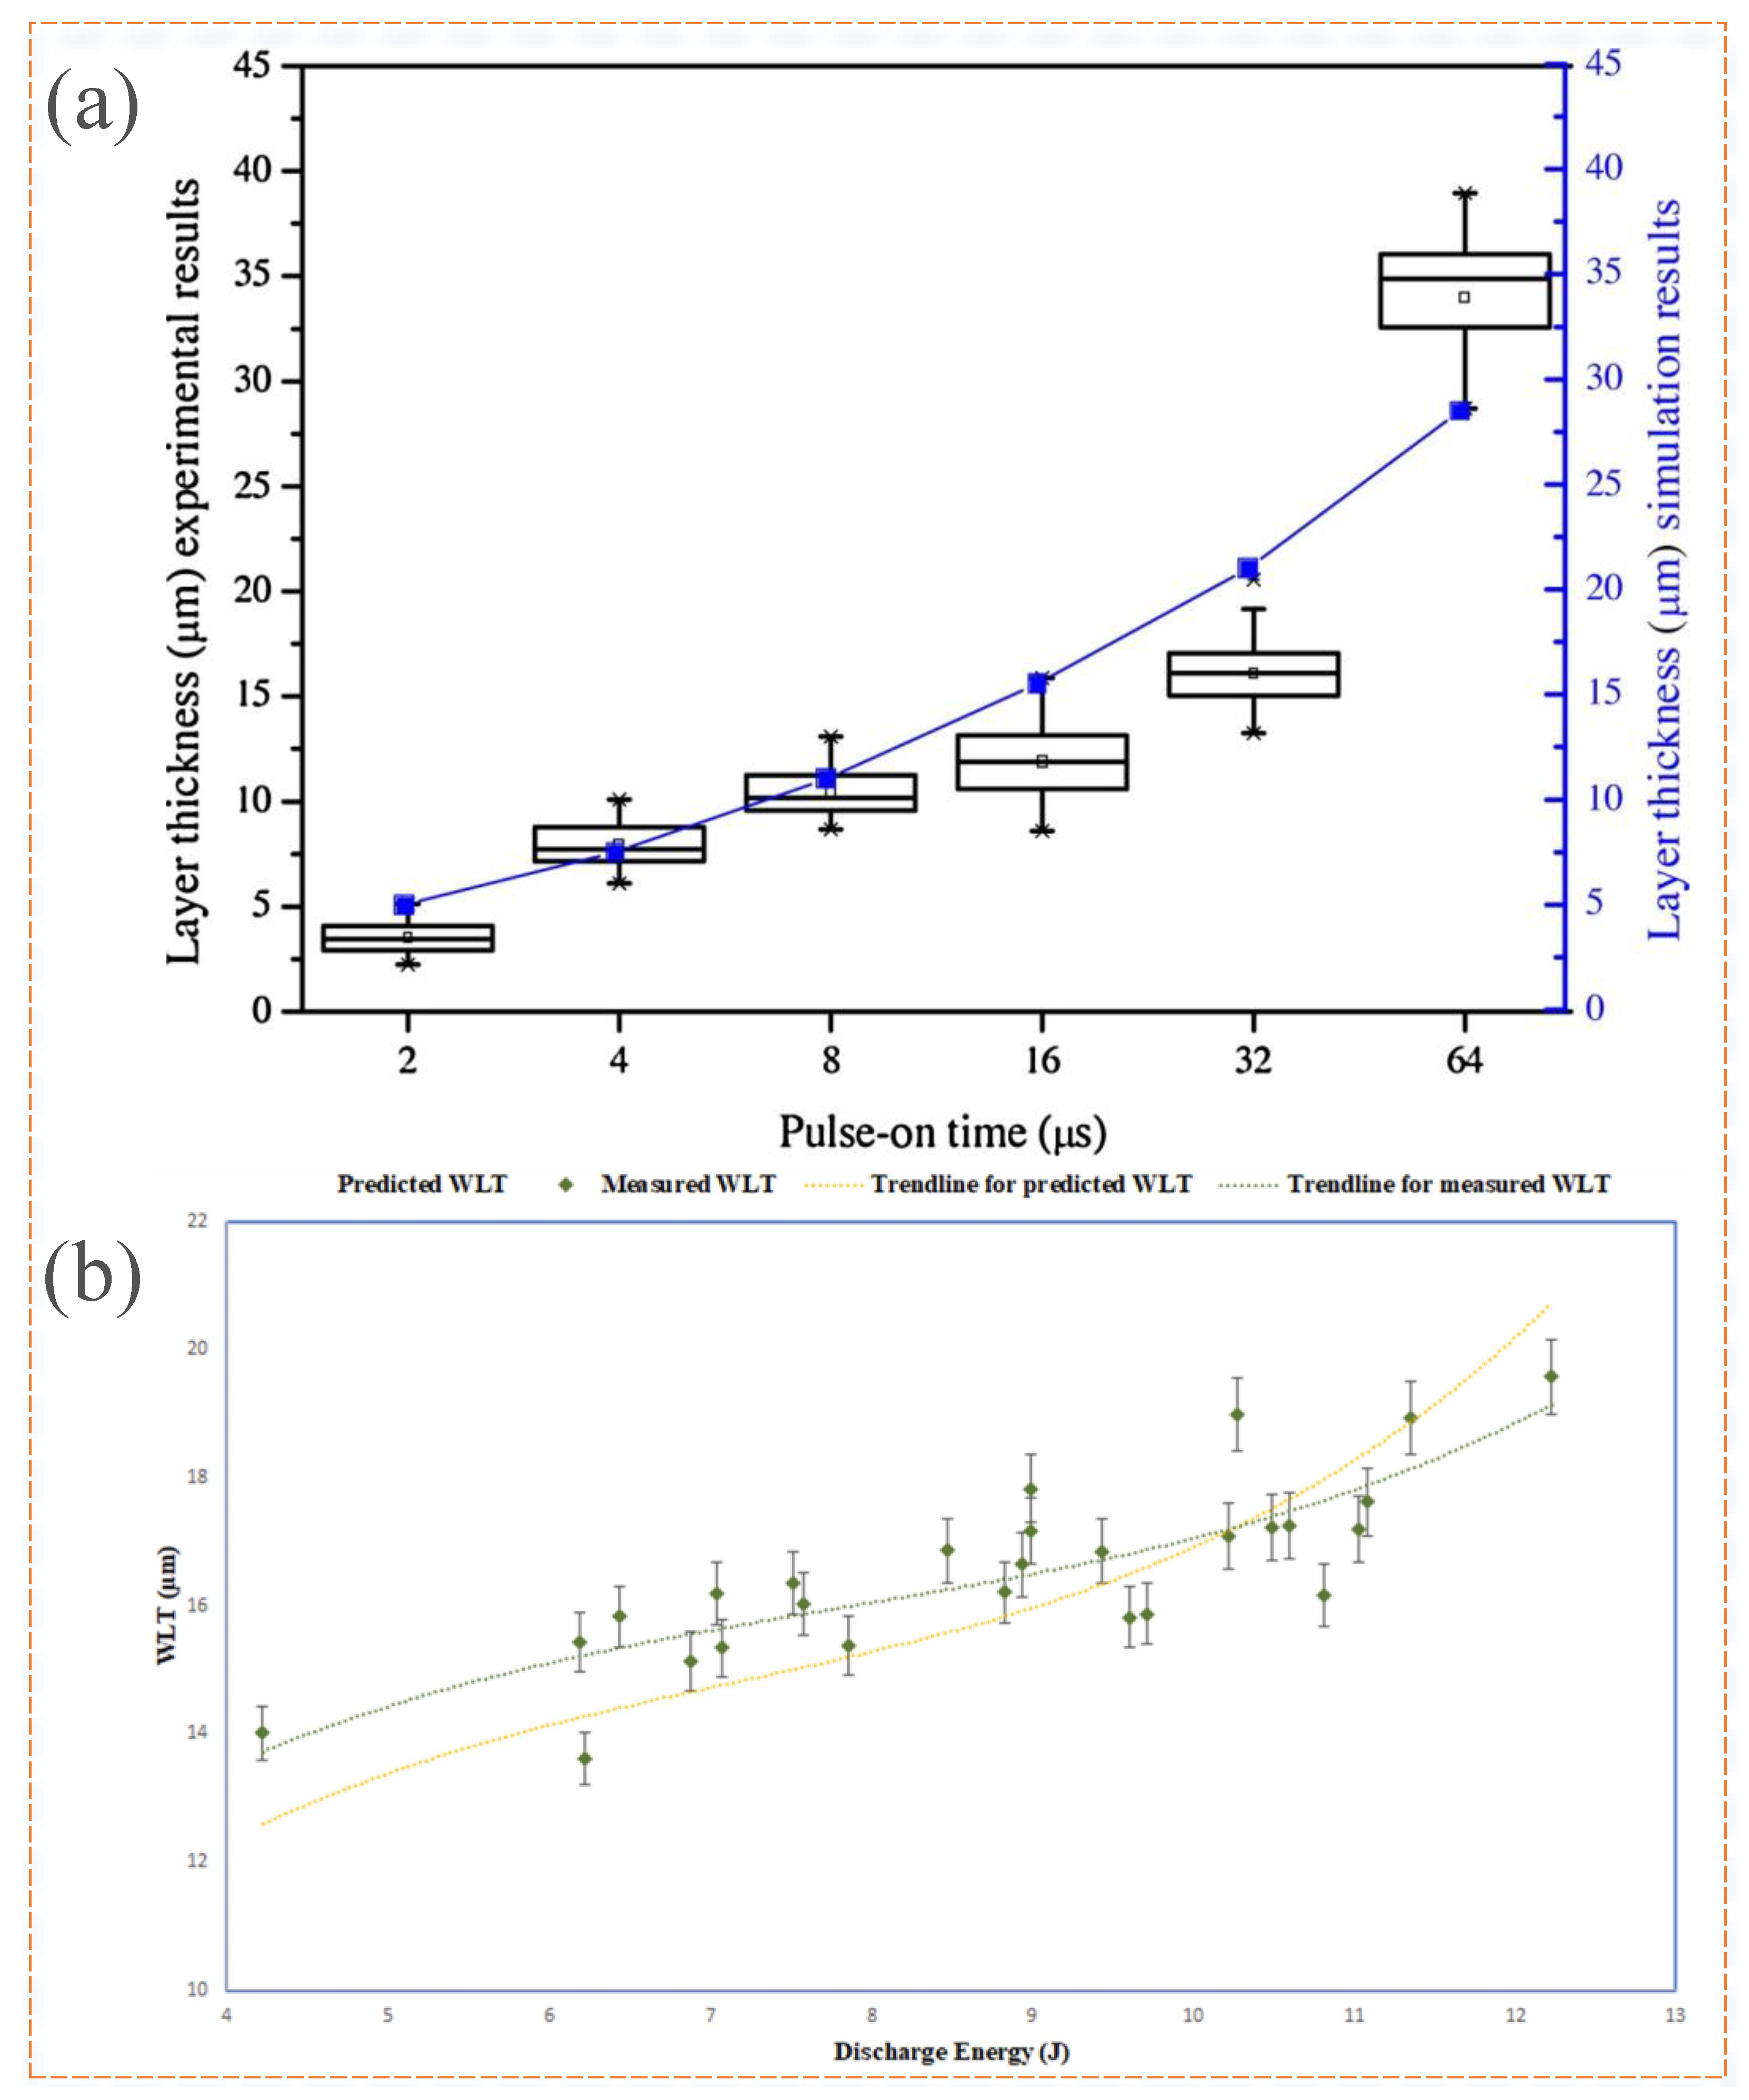
George et al. [62],
2022
The model predicted the RLT better, with an average absolute error of 5.12%.The RLT tends to increase with increasing discharge energy.
Table 2. Comparison of existing major multi-spark simulations by FEM models for the process of EDM.
PurposesAuthors, YearFindingsRemarks
MRRIzquierdo et al. [69], 2009The finite difference method was used and the MRR prediction error was less than 3%.The inverse discrimination method can be used to estimate the discharge characteristics for a particular operation.
Yakup Yildiz [74], 2016The average error in predicting the MRR using the FEM was 3.34%.The effect of additional parameters on the measurement of the properties of different types of materials can be studied in the same way.
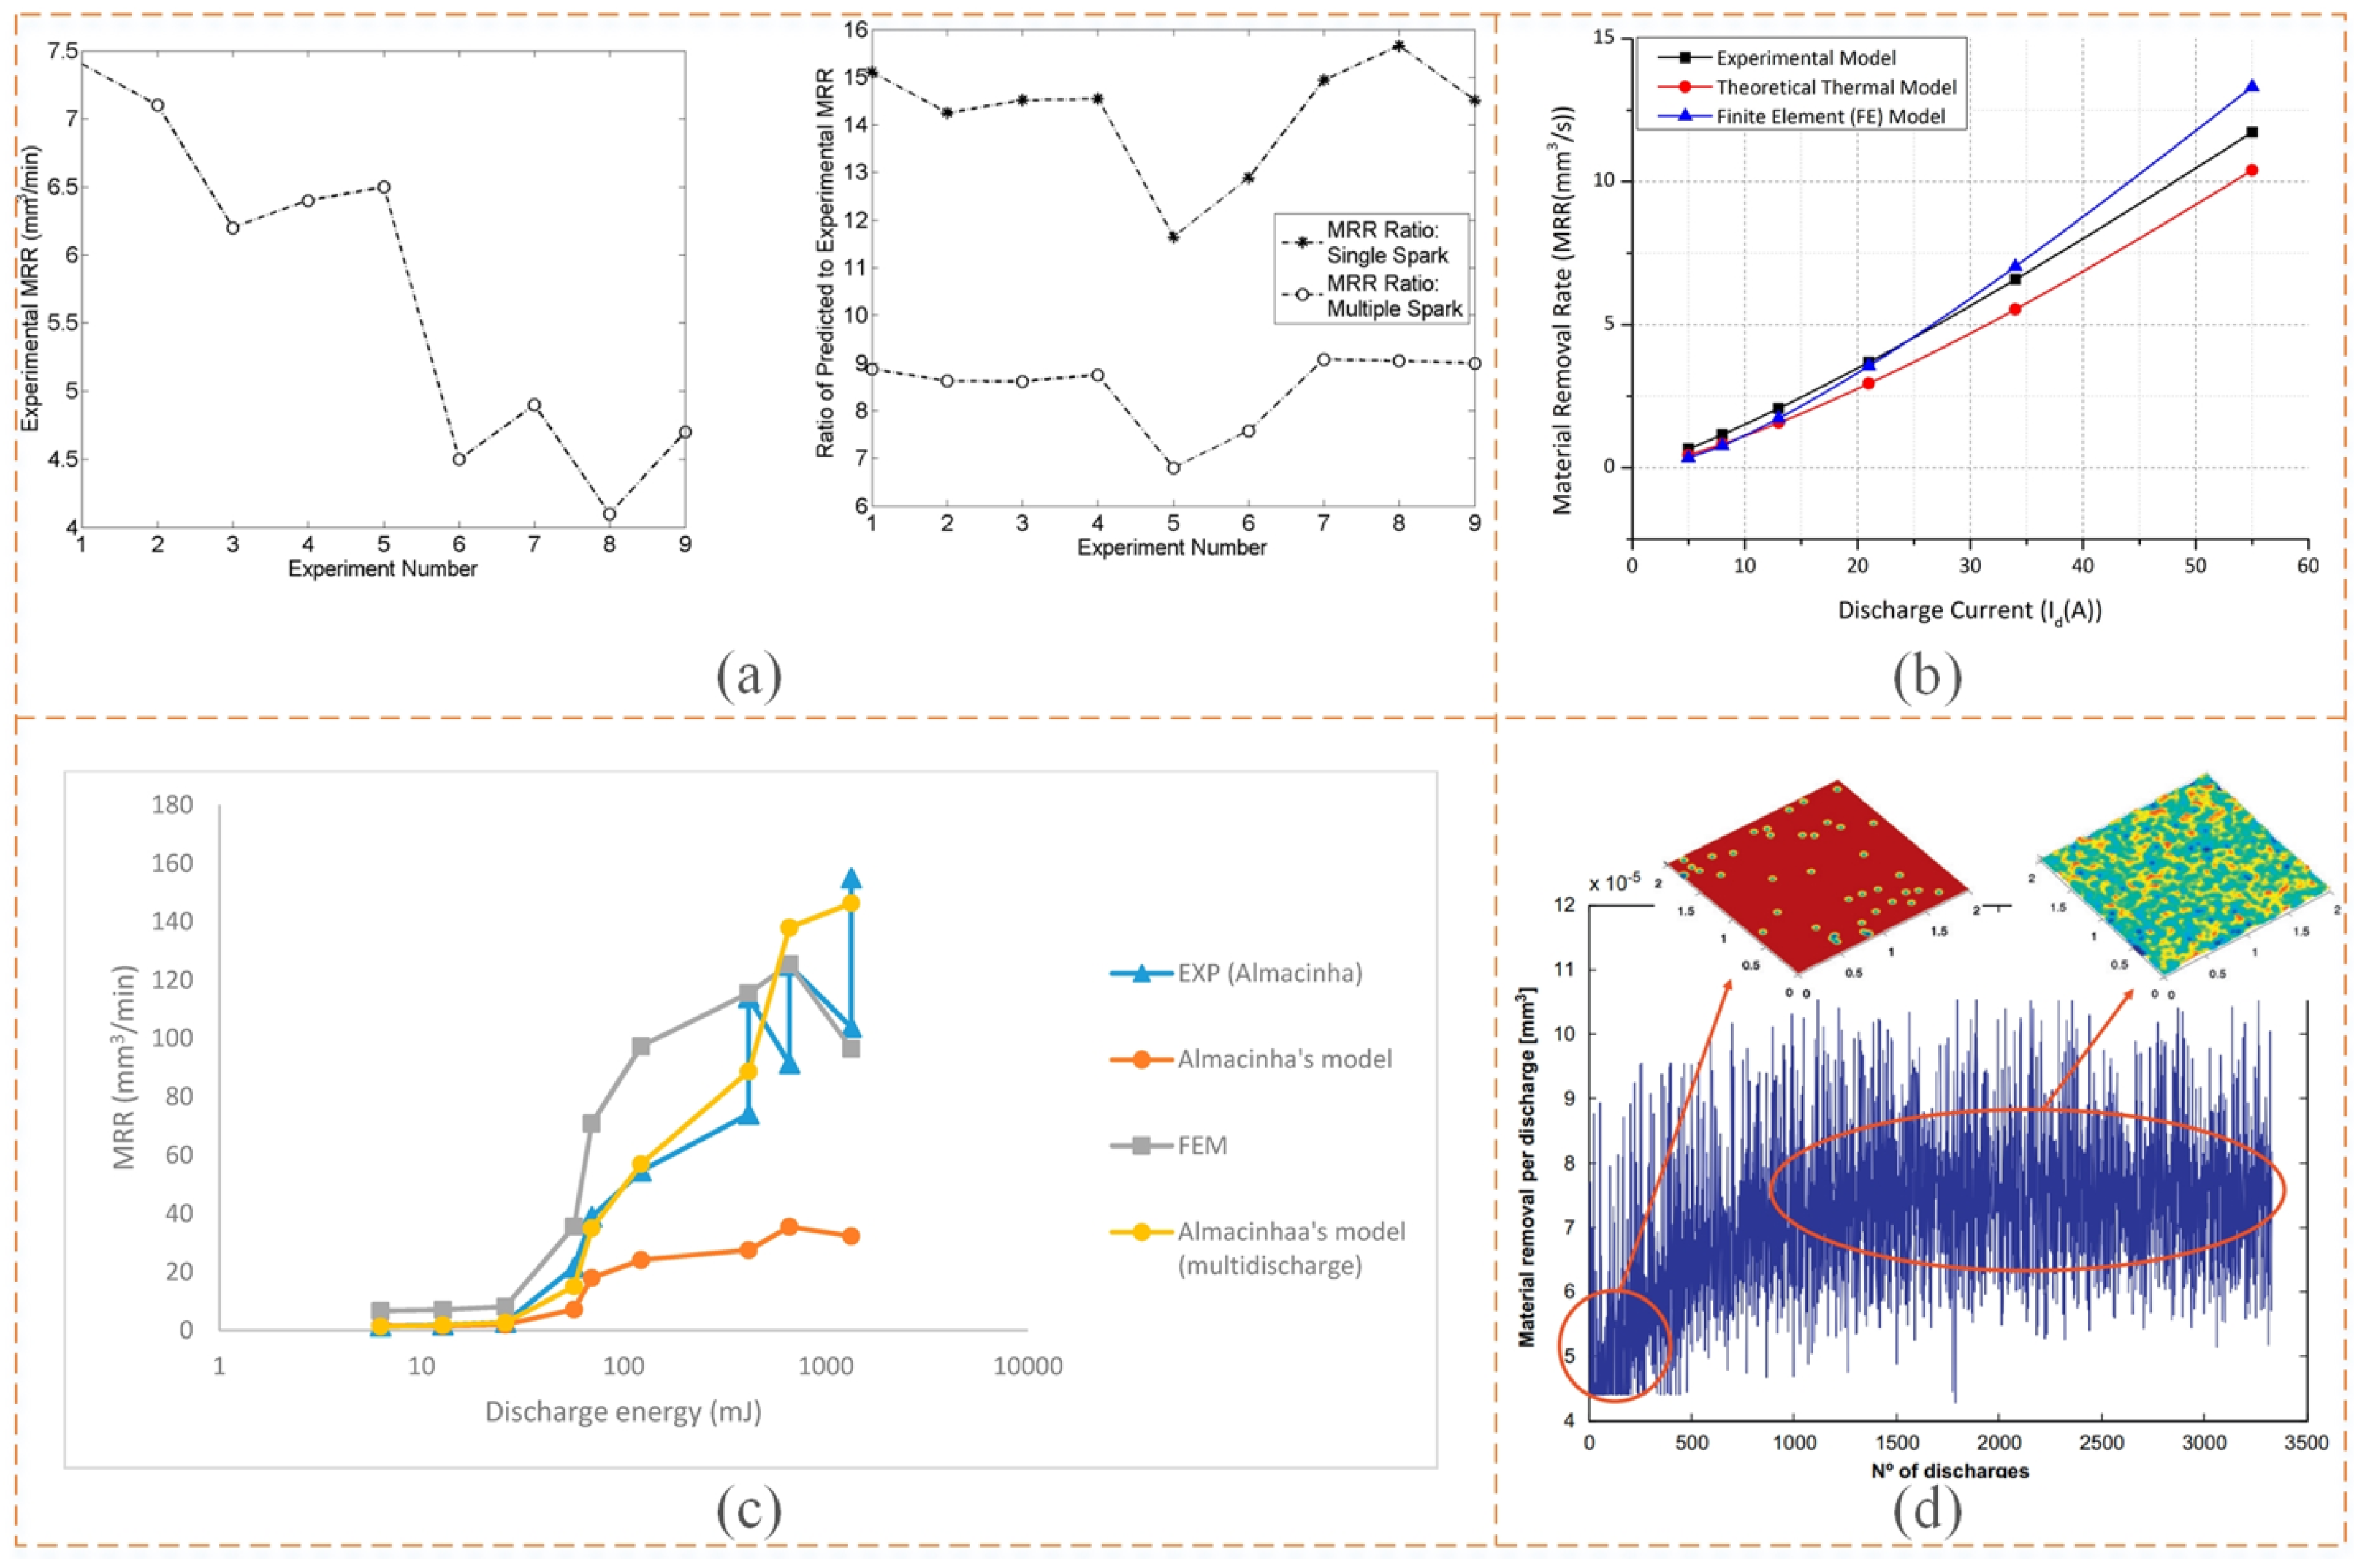
Shahane and Pande [65], 2016The results predicted by the multi-spark model were closer to the experimental values by about 50%.The multi-spark model can be further used for extensive parametric studies, which can be used to predict the MRR by varying the input process parameters.
H.SAIKIRAN et al. [71], 2016An axisymmetric model was used for the MRR modeling of the Orvar Supreme H-13 EDM process, and the MRR was calculated by counting the number of pulses in multi-discharge machining. The experimental results were in good agreement with the analytical results.This model can be used to obtain the residual stress distribution, and to enhance the thermal stress distribution of the particle rupture phenomenon.
Razeghiyadaki et al. [73], 2019Compared to the standard finite element model, the finite element model considering transient evaporation showed a 1.5% better agreement with the experimental values.Consideration can be given to the study of EDM in non-conductive ceramic materials.
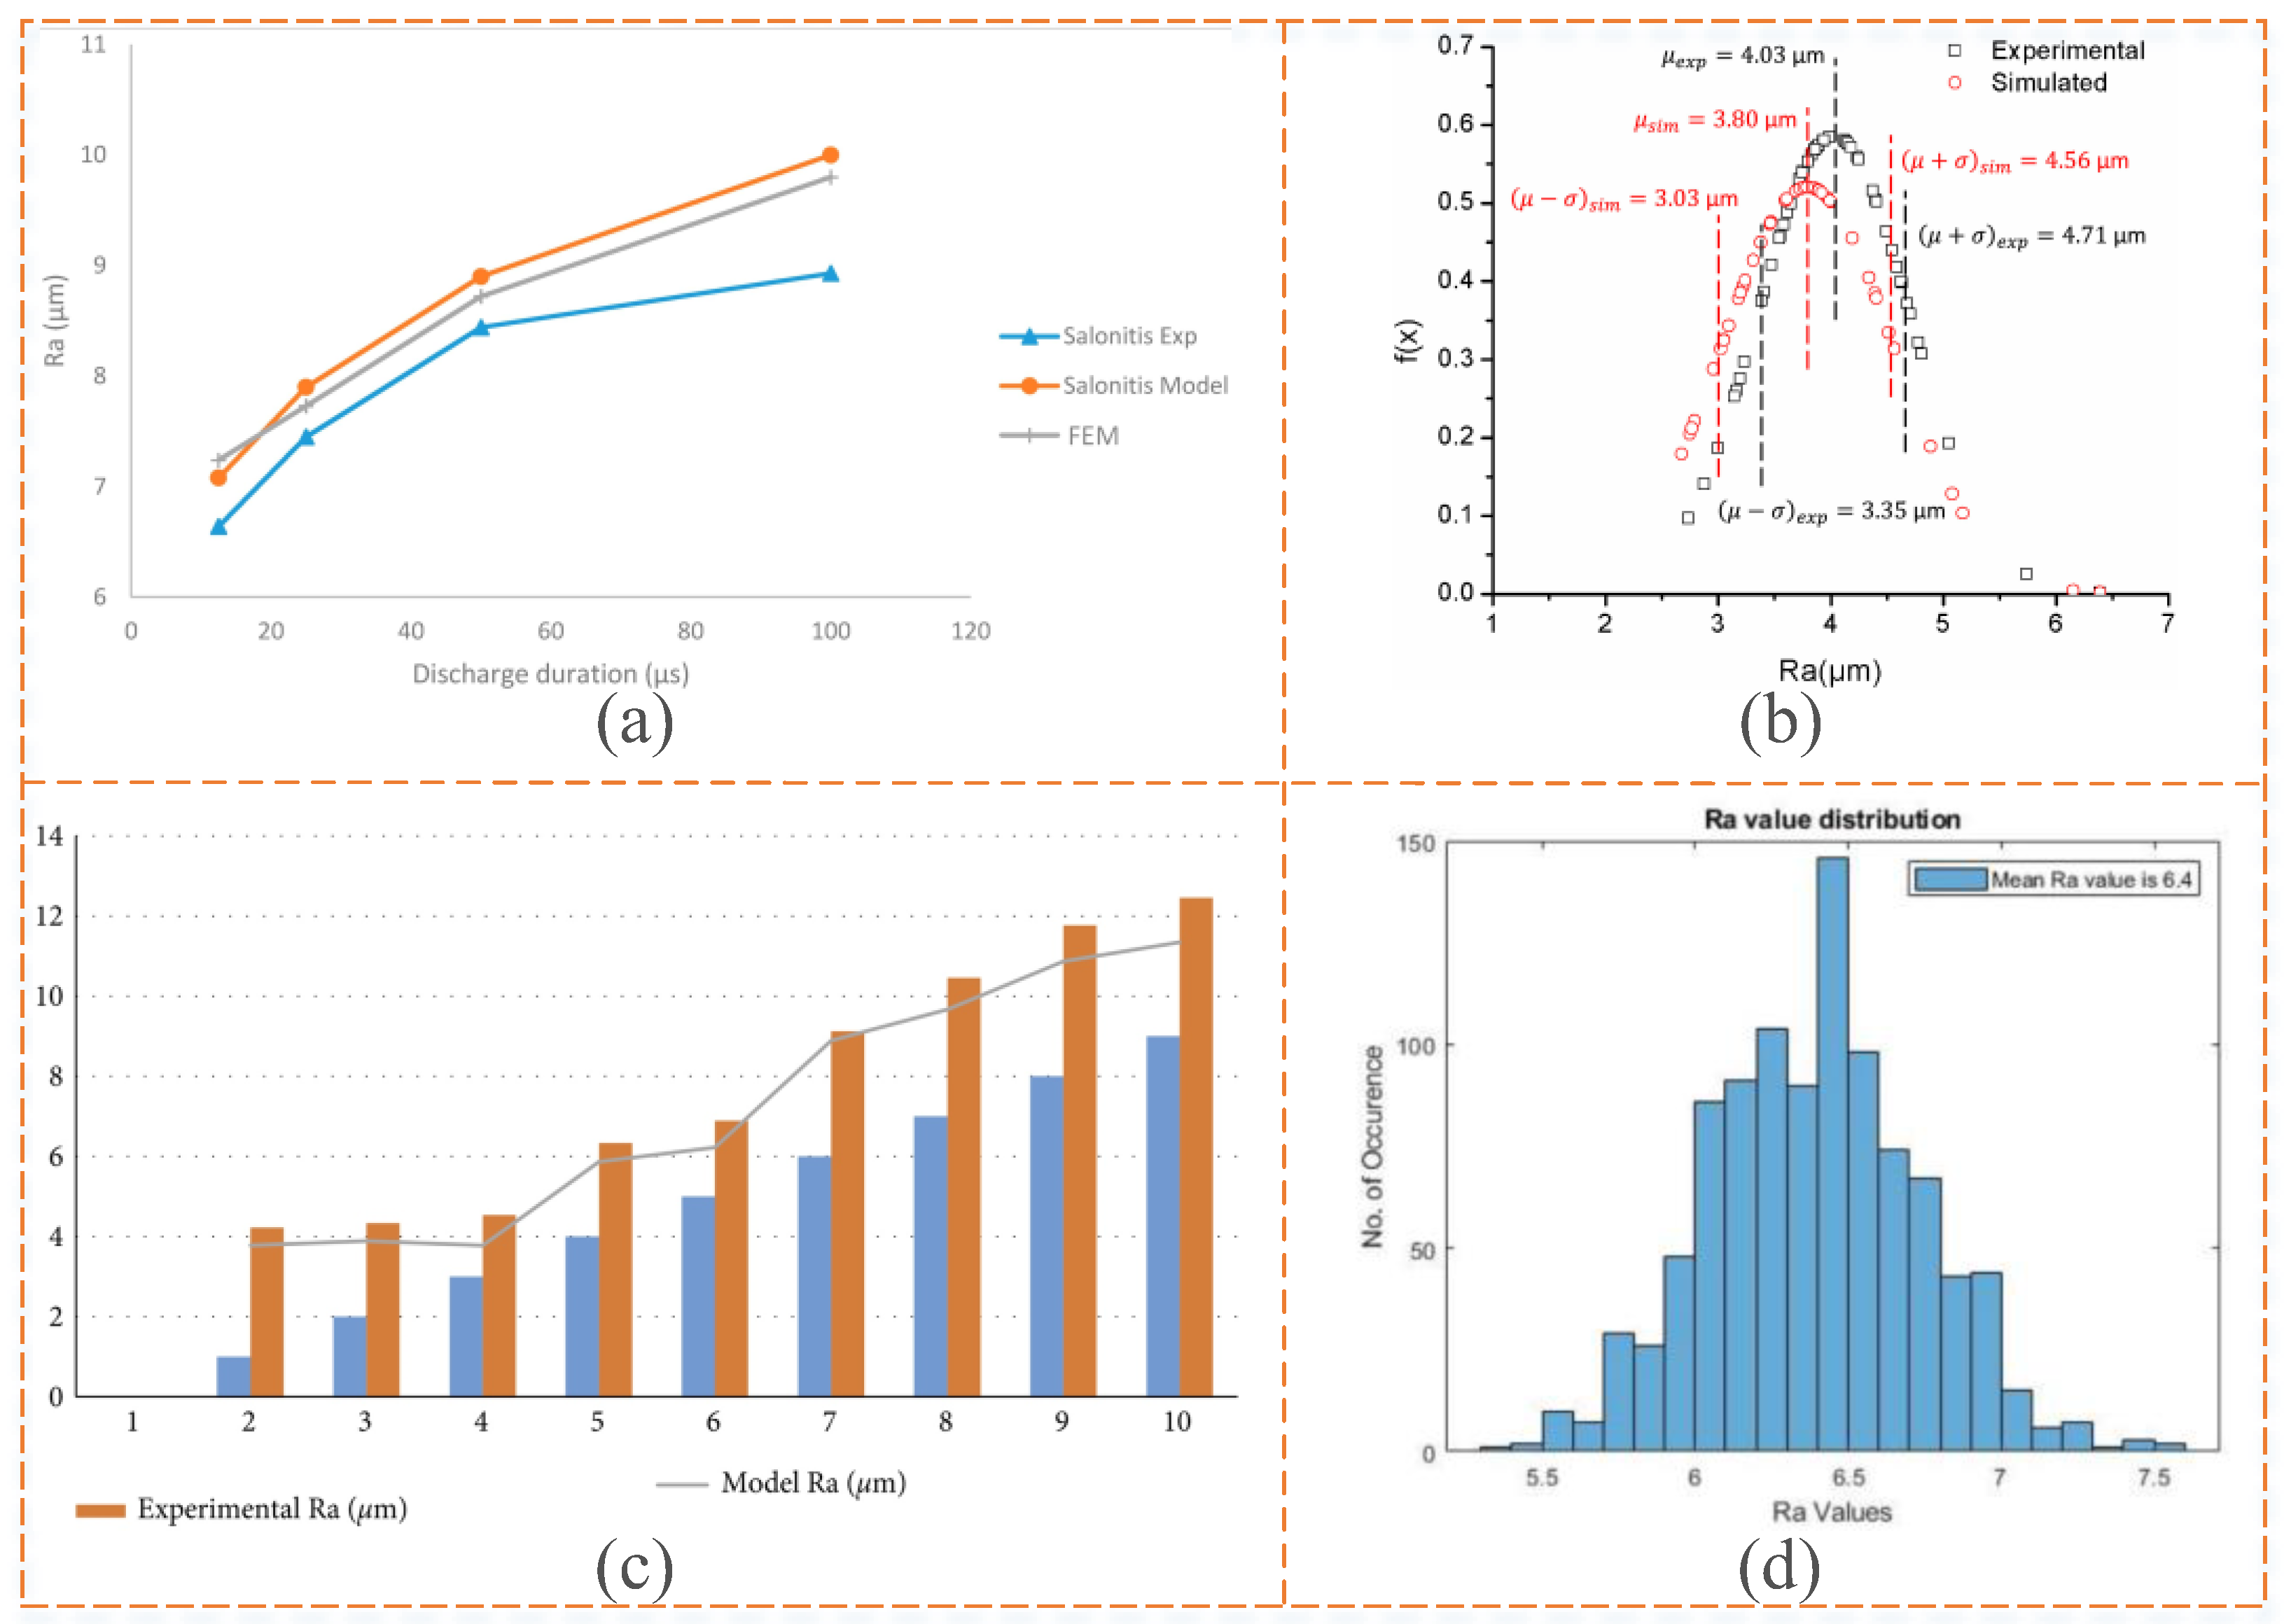
RaKurnia et al. [75], 2009The theoretical results produced by the model had an average error of 6.5% in Ra when compared to the respective experimental results.This surface roughness prediction model can be applied to other workpiece materials.
Izquierdo et al. [69], 2009A numerical model of the EDM process considering the effect of multiple discharges was developed with an SR prediction error of less than 6%.It is possible to generate surfaces comparable to those obtained by the actual EDM process and, after adjusting the model parameters, the predicted results are in good agreement with the measured results.
Jithin et al. [76], 2020The results show that the predicted values are in good agreement with the measured values and the prediction error is between 6~17.5%.This model takes into account the expansion of the discharge column at the critical time and the dependence of the spark radius on the discharge power and discharge duration.
Jithin et al. [79], 2020A multi-spark discharge model was developed to reduce the average prediction error of Ra to 11.5%.In each simulation of the multi-spark model, the position, size, and shape of the individual peaks and valleys of the sparks vary due to their random distribution.
Jamunkar and Sundaram [78], 2022The model gives a normal distribution of SR values for any given EDM process parameter. The maximum deviation between the predicted and measured values is 0.76 µm.Finite element analysis and online EDM monitoring techniques were used to create a simulated EDM surface.
TWRPuertas et al. [80],
2004
To be able to obtain low electrode wear values, an intensity factor value close to the electrode’s center value (i.e., I = 4), or slightly higher, should be used, along with a low pulse duration value, for the operating interval under consideration.The relationship between the TWR, SR, MRR, and design factors was investigated.
Kim et al. [81], 2010The relative TWR increased significantly when the pulse duration was greater than 2 µs, and the combination of large voltages and large pulse durations produced significant tool wear.Tool wear is the main cause of chip formation.
Reza Vatankhah Barenji et al. [82], 2016The TWR was minimized when the pulse-on time, pulse current, and input voltage were 40 µs, 14 A, and 150 V, respectively.Increasing the pulse current increases the TWR. The higher the input voltage, the lower the TWR.
Bellotti et al. [83], 2020By using process monitoring data as inputs to the regression model, the errors in predicting the TWR were reduced by approximately 85%.Expanding the dataset with higher aspect ratio holes could be considered in the future to investigate the applicability of data-driven regression modeling to a wider range of industrial applications of the MEMS process.
RLTTan and Yeo [85], 2010The model has a peak discharge current of 1.45 A, a pulse on-time of 166 ns to 606 ns, and a predicted thickness of the recast layer ranging between 1.0 µm and 1.82 µm.The model developed using the multiple discharge method is suitable for the estimation of the RLT in microfabricated EDM.
Shabgard et al. [86], 2011An axisymmetric 3D finite element model was developed and the average deviation between its predicted and actual values was 9.65%.The increase in pulse current resulted in a slight decrease in the thickness of the recast layer and the depth of the heat-affected zone, but with a rougher surface.
Yakup Yildiz [74], 2016The average error in predicting the thickness of the recast layer via the FEM was 1.98%.This study conveniently relates the discharge current to white layer thickness and the MRR in EDM machining.
Yadav and Pradhan [87], 2021Numerical simulations predicted a value of 10.2 µm for the thickness of the recast layer, which is in good agreement with previous experimental results.This method can be used for the RLT prediction for different materials and boundary conditions.
Table 3. Comparison of existing major hybrid machining simulations using FEM models for the process of EDM.
PurposesAuthors, YearFindingsRemarks
MRRH.K. Kansal et al. [44], 2008In theory and experiment, the MRR values obtained by PMEDM were always higher than those of conventional EDM.This model can be used to predict the evolution of temperatures, stresses, strains, and cracks that may occur on the surface of a PMEDM-machined workpiece.
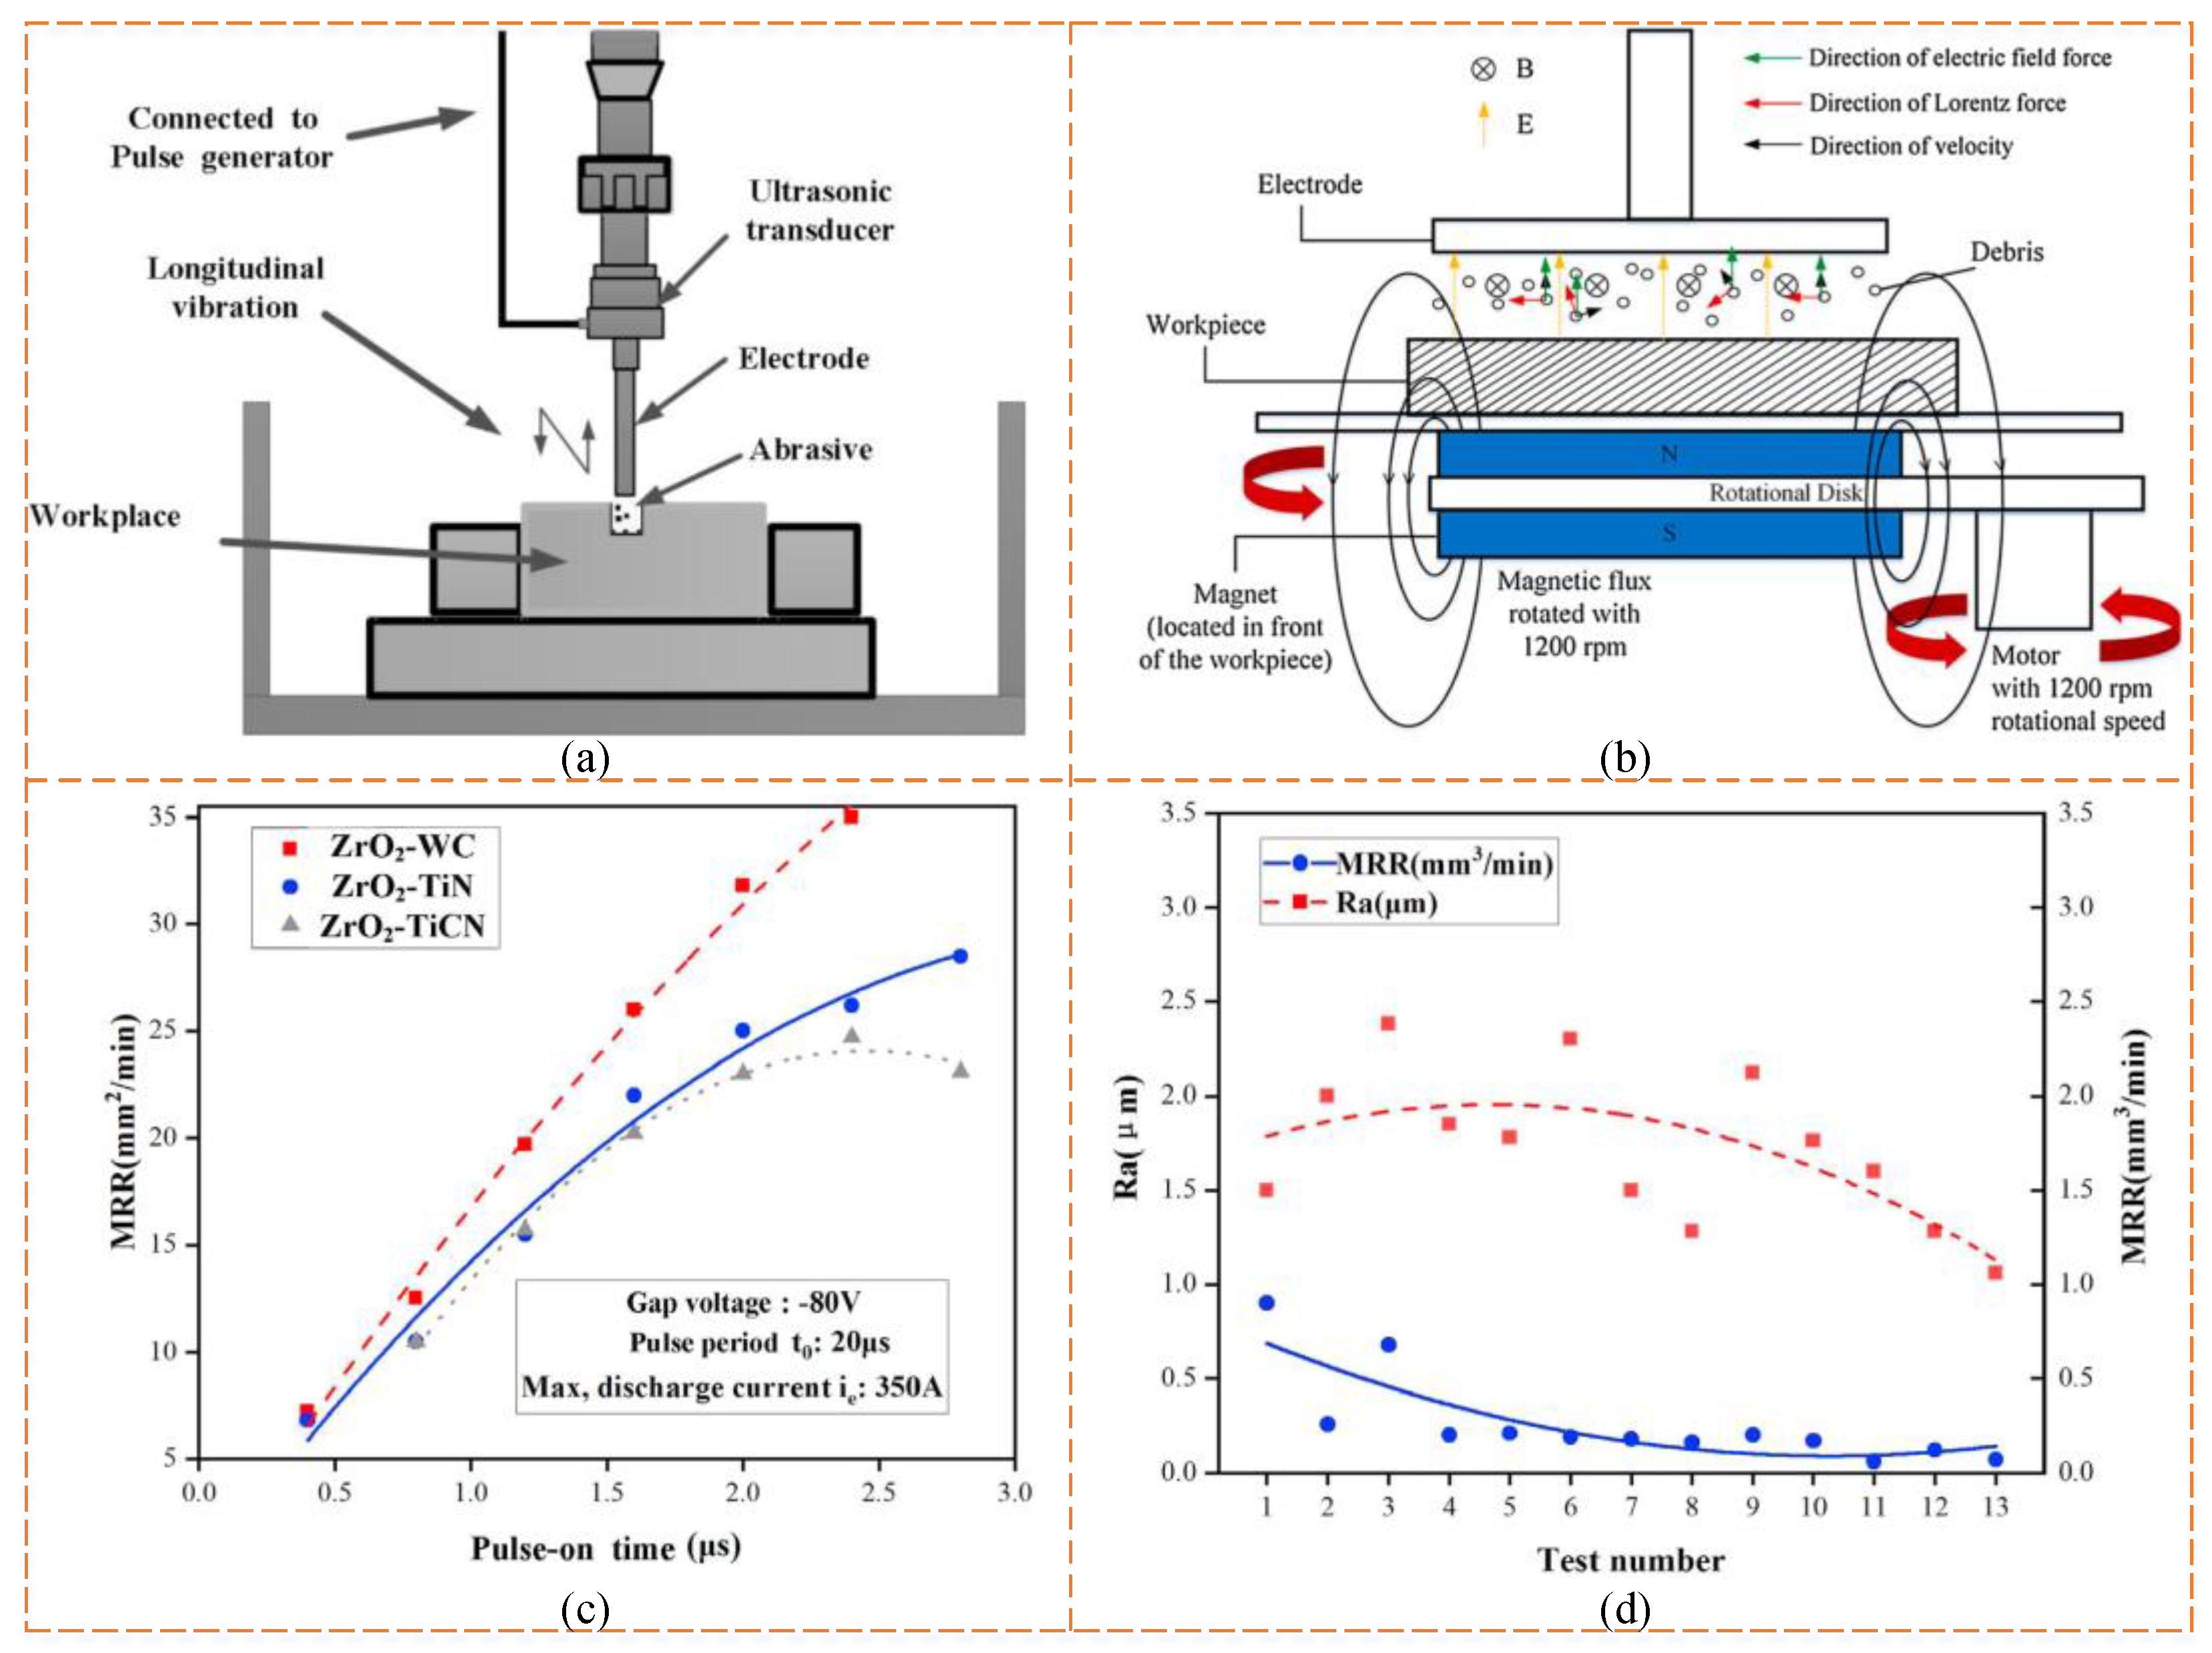
Shabgard et al. [99], 2011The application of ultrasonic vibration to the workpiece had a significant effect on the MRR of the finishing method, increasing it three-fold.The ultrasonic vibration of the workpiece changes the pressure in the gap, resulting in better flushing and improved machining stability.
Zhang et al. [100], 2016The hybrid technology of USV-MF-assisted EDM wire-cutting still offers significant advantages in balancing machining efficiency and surface quality.The hybrid EDM-WEDM process has enormous advantages and application potential in the field of practical machining and manufacturing.
Gupta and Joshi [97],At moderate energy levels, the error in the predicted value of the mean diameter of the single-spark discharge crater was 10%, while the error in the mean depth was 9%.This model neglects the effect of the self-magnetic field.
Beravala and Pandey [98], 2020The model developed predicts an MRR error of less than 10%.The prediction error of this model is mainly caused by the assumed conditions and uncontrollable experimental errors.
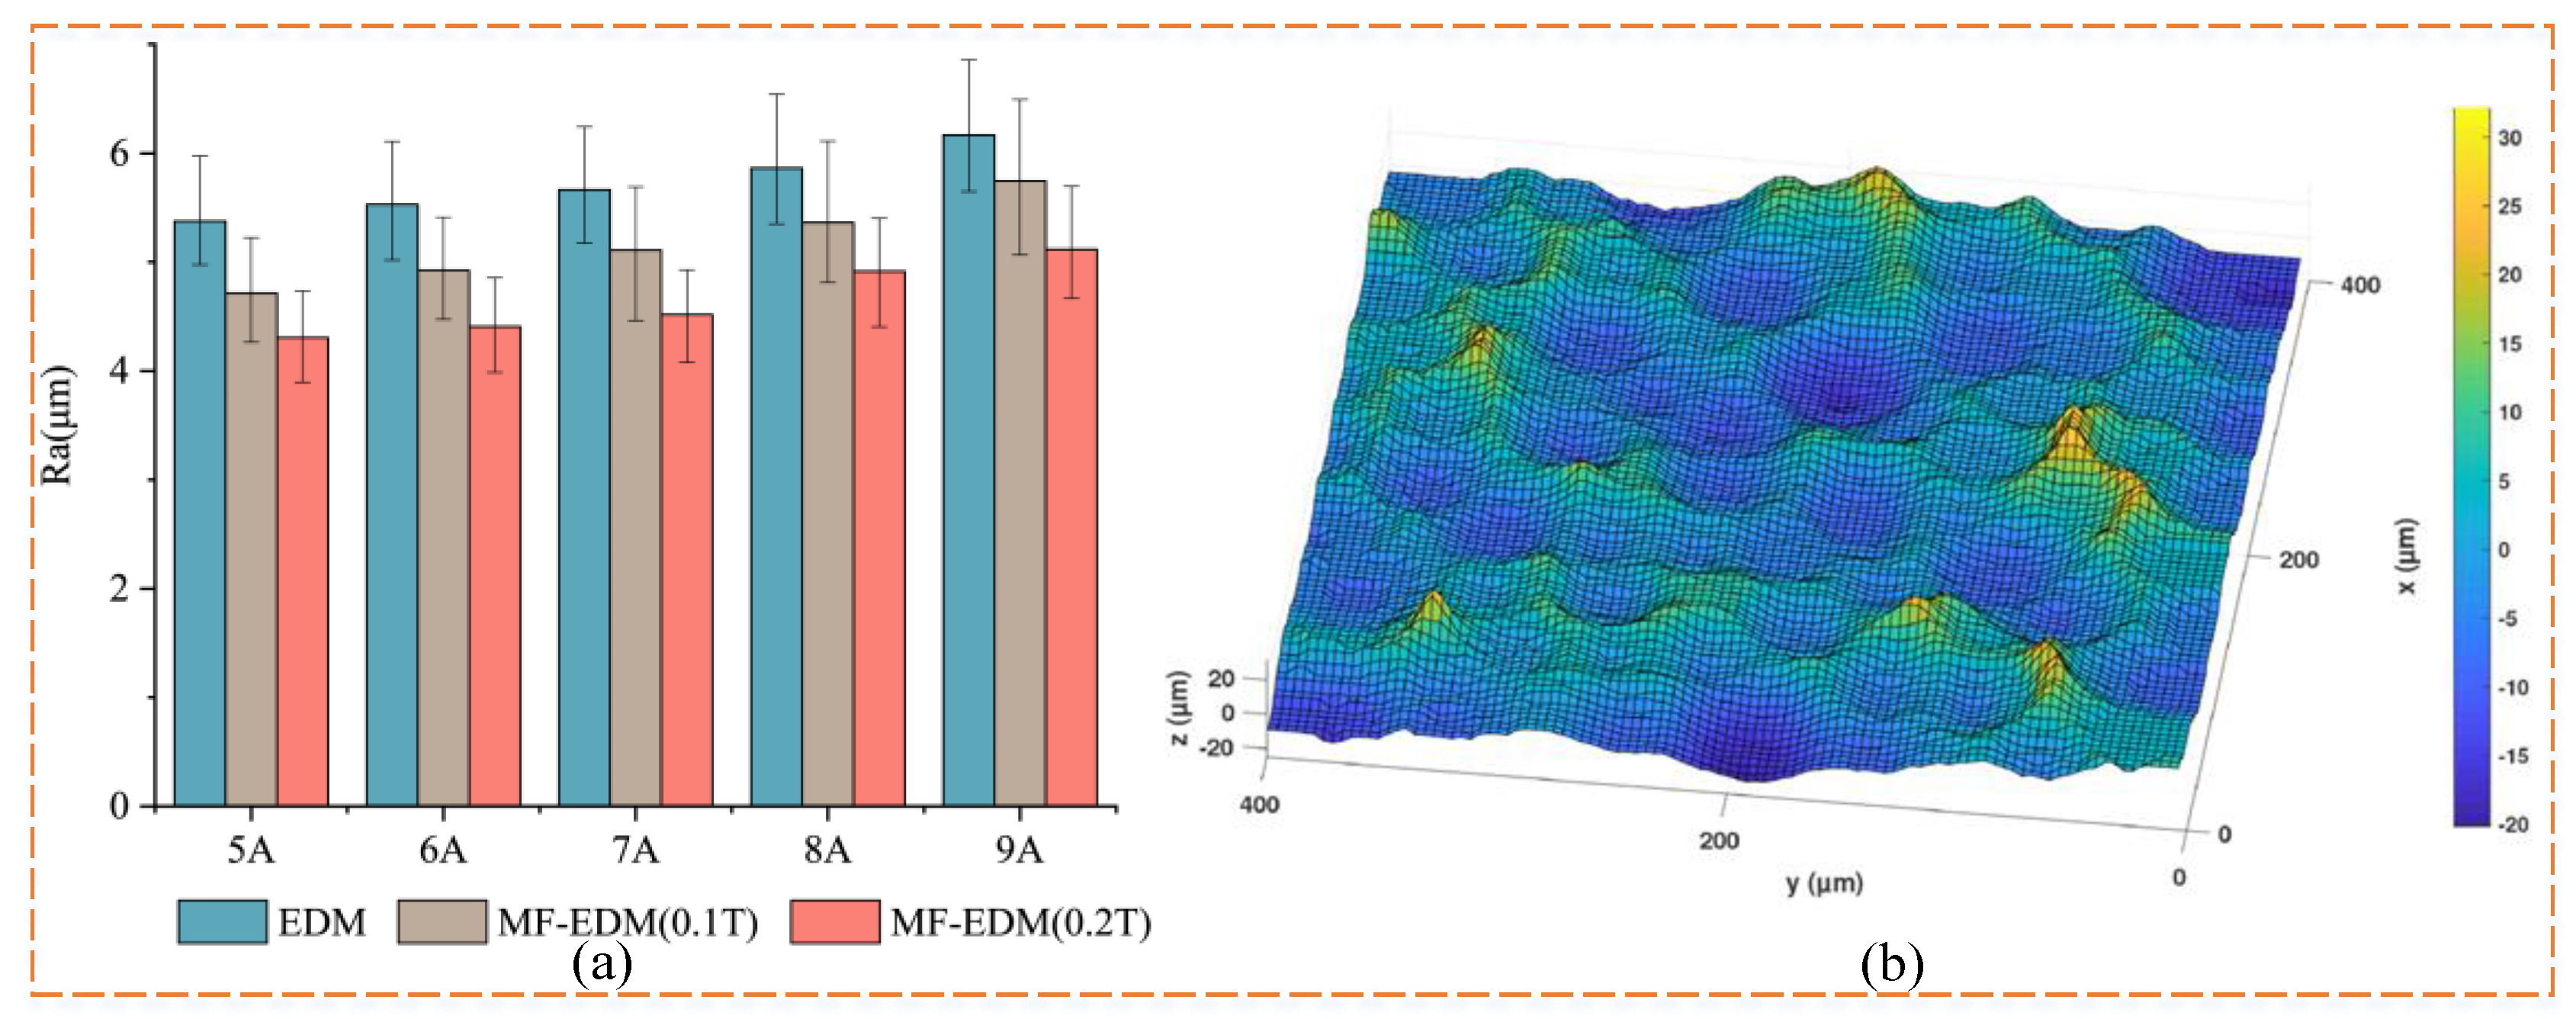
RaMing et al. [31], 2009Simulation and experimental studies showed that the machining performance of MF-EDM was significantly better than that of EDM, especially in terms of surface integrity and discharge stability.MF-EDM offers greater potential and advantages than conventional methods in improving machinability and surface quality.
Ming et al. [106], 2020When machining the SKD11 material, the SR increased when the servo voltage was increased excessively. However, when machining the Ti6Al4V material, when the servo voltage was 71V, the SR was satisfactory.The energy efficiency of magnetic materials was significantly improved compared to that of non-magnetic materials.
Ghiculescu et al. [28], 2009Cumulative micro-jet flow almost eliminated the material melted by discharge, resulting in a 500% increase in the machining rate. SR was improved by up to 50%.Future research will focus on synchronizing EDM and US generators and improving the flexibility of EDM+US technology.
Pupaza et al. [108], 2015A lower SR can be obtained by using lower values of pulse time and longer values of pause time.Low pulse time values and high pause time values can be used to increase the machining rate.
Wang et al. [107], 2020Ultrasonic vibration caused more adjacent melting pits to overlap, resulting in a smaller area of carbon buildup and a smoother surface, and the introduction of ultrasound reduced the SR by 15.8–29.1%.Crater depth and surface residual height decrease with increasing ultrasonic amplitude.
Tang et al. [109], 2019Compared with conventional EDM, PMEDM’s machining efficiency increased by 16.34% and SR decreased by 29.42%.This research provides a new way to improve efficiency in high-performance material processing and related fields.
TWRMing et al. [31], 2009Used to calculate the energy flow and temperature distribution of the workpiece, tool electrode, and discharge channel under single/continuous-spark conditions with good predictions.The application of magnetic field-assisted technology in EDM also reduces the negative impact on the health of the operator.
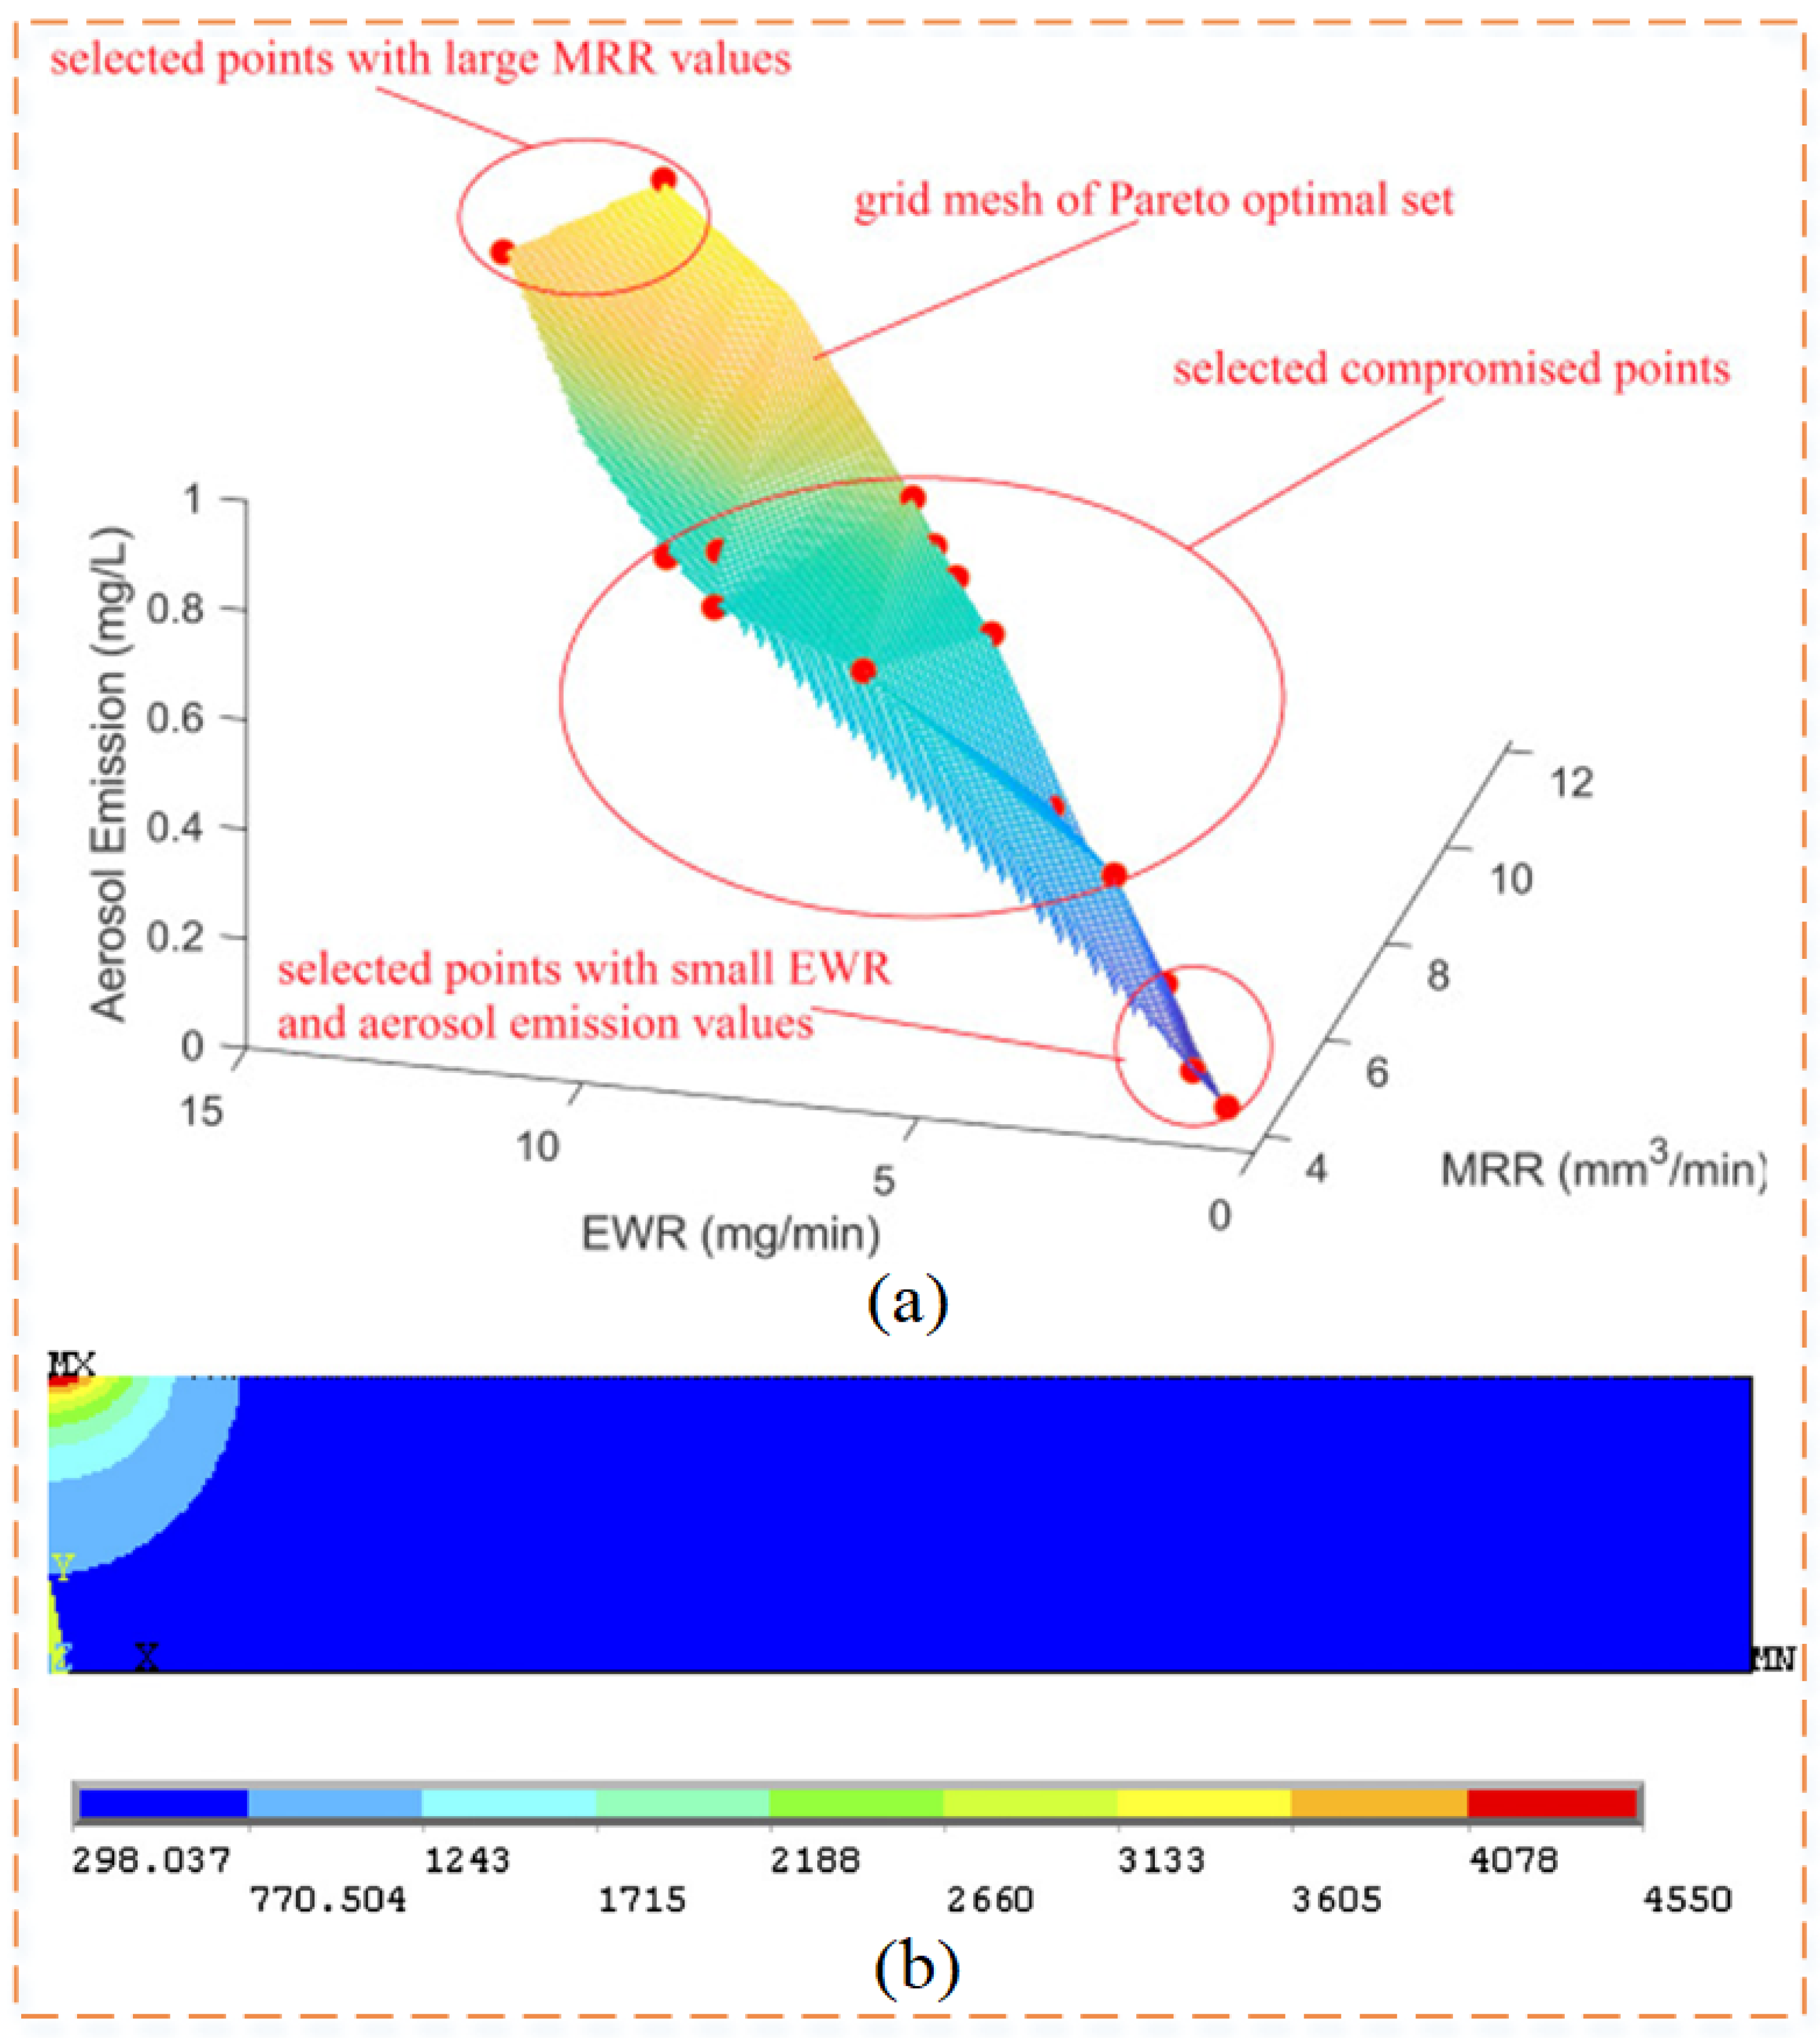
Zhang et al. [112], 2021For 65% SiCp/Al, the average best solution for EWR and aerosol emissions was reduced by about 5.7% and 10%, respectively, while MRR increased by 5.5%.MF-EDM outperforms conventional EDM in terms of energy efficiency and environmental impact.
Joudivand
Sarand et al. [57], 2017
Parameters such as the heat diffusion coefficient of the tool electrode, the pulse current, and the pulse duration had a significant effect on the degree of tool wear.The strong dependence of this model improvement factor on the thermo-physical variables of the EDM process dramatically alters the numerical methods for accurately predicting the amount of tool wear.
Nadda and Nirala [114], 2020A finite element simulation of the Gaussian heat flow density distribution of a single discharge micro-EDM was performed, and a thermal modeling-based tool wear compensation technique was proposed.This research can be used to establish a real-time tool wear monitoring and compensation system based on thermal modeling.
Allen and Chen [115], 2007The model estimated that the TWR decreased with increased pulse duration and was much higher for molybdenum than for steel under the same machining conditions.Tensile residual stresses remaining on the workpiece may superimpose after several spark cycles, leading to surface damage such as microcracks.
RLTShabgard et al. [116], 2018At all pulse currents and durations, ultrasonic vibration reduces the thickness of the recast layers produced on machined surfaces.This study simulates the US-EDM process from an electrothermal perspective.
Shabgard et al. [61], 2019The numerical results of the RLT were in good agreement with the experimental results, with a maximum error of 8.8%.Applying a magnetic field near the EDM gap increases the PFE while reducing the height of the RLT generated in all pulse currents and pulse-on time.
Tan and Yeo [117], 2013To validate the model, the simulated R max and RLT values were compared with their corresponding measured values. The trends of the simulated and measured results are approximately the same.The process model takes into account the effect of powder particles on the plasma channel size and the proportion of heat flux distributed to the workpiece.
Shabgard et al. [86], 2011The increase in pulse current resulted in a slight decrease in the white layer thickness and heat-affected zone depth.Each increase in discharge duration results in more heat being distributed into the workpiece, so more of the underlying material is exposed to high temperatures.
Liu and Guo [118], 2016The predicted WL and HAZ transformations of martensite match the experimental data with reasonable accuracy.This provides us with the ability to predict macro-scale cumulative thermal damage during EDM processes.
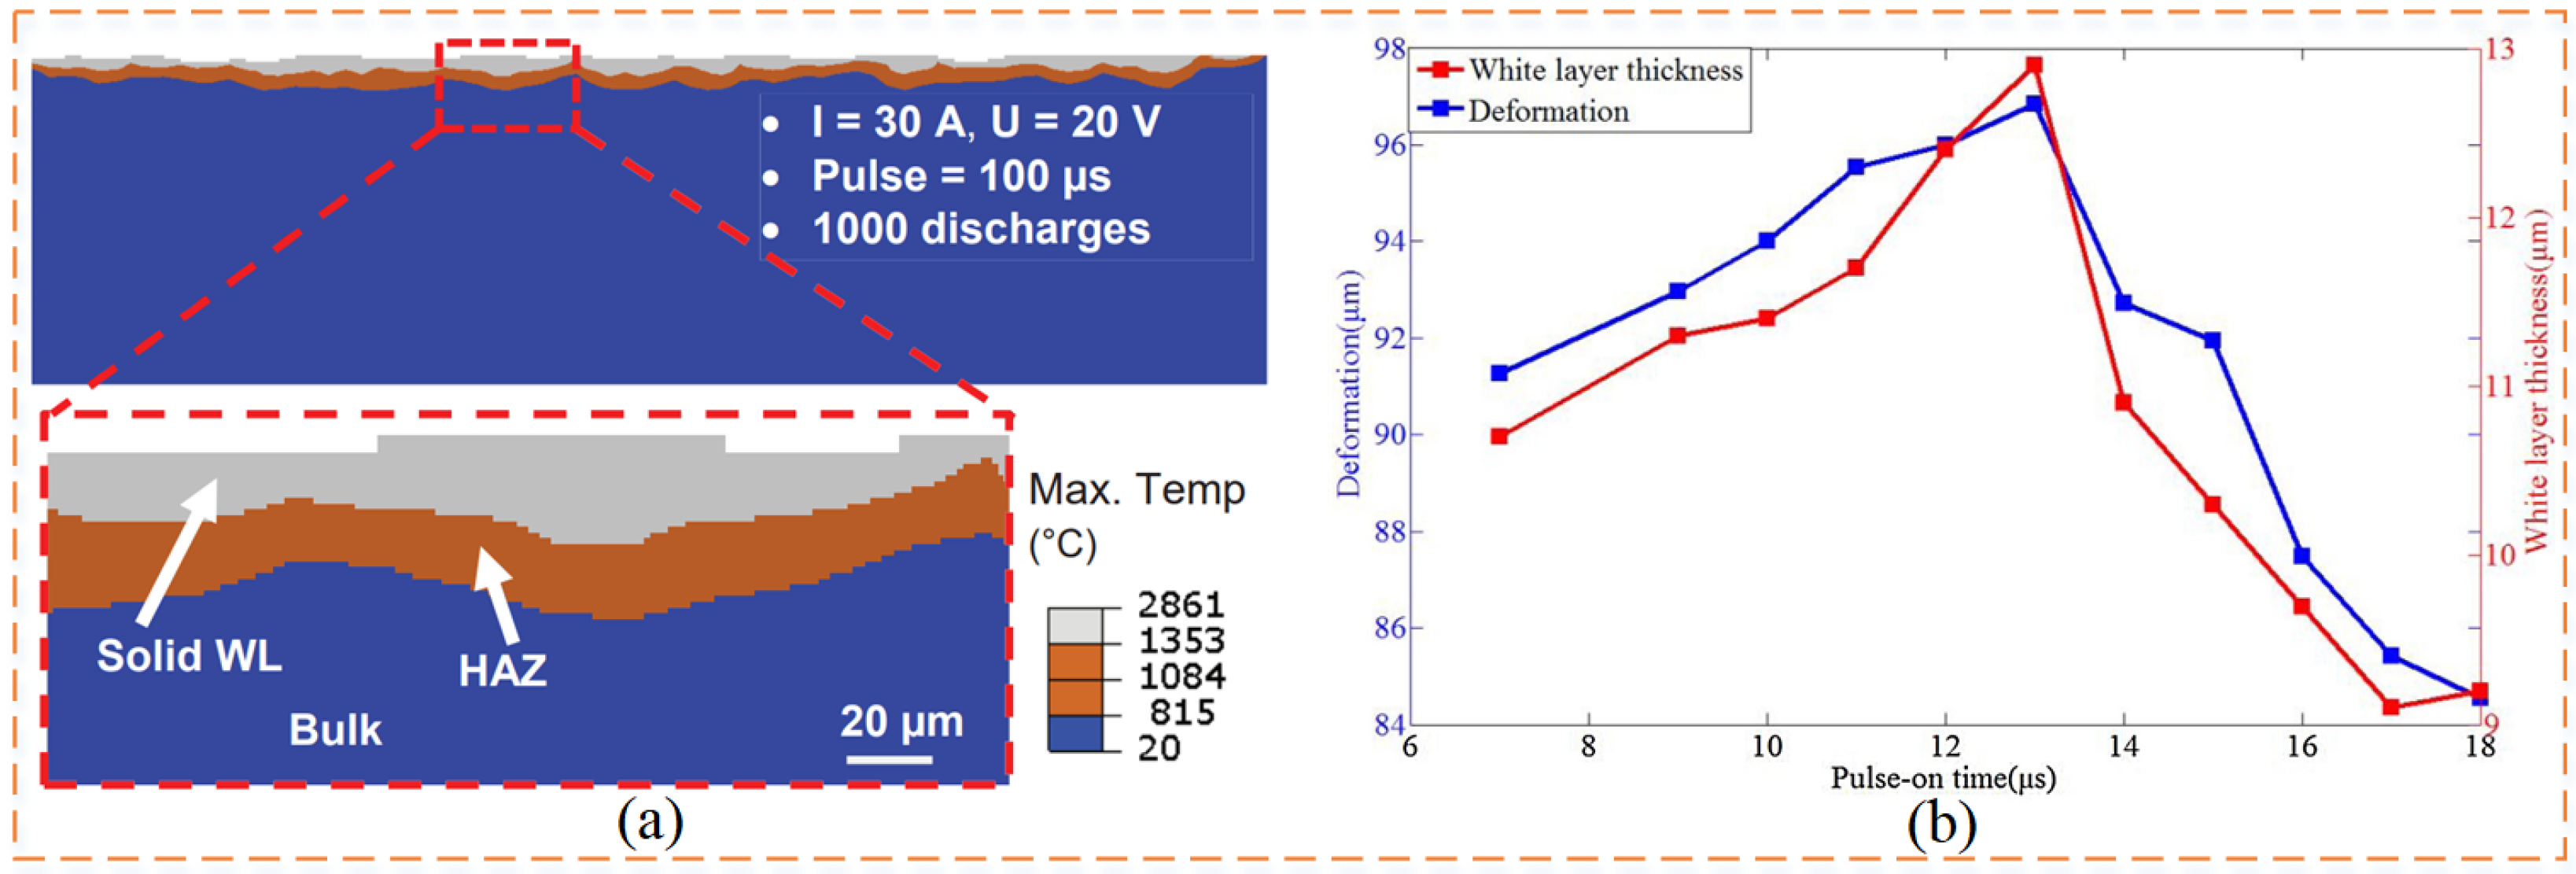
Zhang et al. [119], 2019A thermophysical model was established, and by studying the surface characteristics of the deformed specimens, the changes in the thickness of the recast layer were consistent with the changes in their thermal deformation.The change in the thickness of the recast layer almost corresponds to the change in its thermal deformation.
Disclaimer/Publisher’s Note: The statements, opinions and data contained in all publications are solely those of the individual author(s) and contributor(s) and not of MDPI and/or the editor(s). MDPI and/or the editor(s) disclaim responsibility for any injury to people or property resulting from any ideas, methods, instructions or products referred to in the content.

