Article

Analysis of the Mechanical and Microstructural Fluctuations of High-Strength Steels and Their Effect on Bending Angle

Department of Mechanical and Industrial Production, Mondragon Unibertsitatea, Loramendi 4, Mondragon, 20500 Gipuzkoa, Spain
*
Author to whom correspondence should be addressed.
Metals 2023, 13(9), 1603; https://doi.org/10.3390/met13091603
Submission received: 21 August 2023 / Revised: 10 September 2023 / Accepted: 13 September 2023 / Published: 15 September 2023
(This article belongs to the Special Issue Design, Processing and Characterisation of Metallic Materials)

Abstract

:
The quality and complexity demands of manufactured parts in sectors such as automotive and aeronautics lead to narrower process windows. This affects the repeatability and stability of the process, where material properties and process variations have a major impact. In bending processes, the bending angle is affected by variability in mechanical and microstructural properties, especially in high-strength materials. To address this, mechanical and microstructural characterization is crucial. This study conducted mechanical and microstructural characterization on five high-strength steels from different suppliers: three DP980 and two CP980. These materials are currently used by an industrial company in the automotive sector to manufacture a real product by means of U-bending, where a real issue of variability exists. Tensile tests were performed to quantify mechanical fluctuations. Microstructural analysis was also performed to determine the grain size and volume fractions of martensite and ferrite in the case of DP980, and ferrite, bainite, and retained austenite in the case of CP980. The largest variations were found for the hardening exponent, mean grain size, and elongation. To analyze their variability in an industrial process, U-bending tests were carried out using the five materials and the bending angle after the springback was measured. A total of 250 pieces were bent for the different materials and press strokes. Variations up to 1.25° in bending angle were found between the five batches for the same press stroke. A quantitative correlation analysis was performed to estimate the influence of the different parameters on the bending angle, where sheet thickness and tensile strength were shown to be two of the most influential parameters. Knowing this influence based on the variability of the properties, a control approach can be developed to reduce defects.

1. Introduction

Nowadays, the reduction in CO2 emissions in the automotive industry is leading to higher demands for lightweight car body design. For this reason, the use of high-strength steel materials has increased significantly during the last decades in both deep drawing and draw-bending operations. Advanced high-strength steels (AHSS) are especially suitable for structural components in modern car body manufacturing [1]. This is due to their outstanding features such as high-strength, high energy absorption capacity, and good fatigue strength. Door beams, cross members, panel reinforcements, and B-pillars are cases in point, principally subjected to tensile loads. Furthermore, the need to improve fuel efficiency, leading to environmental protection and energy saving [1,2,3] has promoted the development and optimization of these steels. Figure 1 shows the elongation versus tensile strength for different classes of high-strength steels and advanced high-strength steels. Using mechanisms such as grain refinement, precipitation strengthening increases the strength of steels while decreasing formability. The first-generation AHSS have higher work-hardening rates and formability.
Generally, DP steels consist of about 75–85% of ferrite matrix (body centered cubic (BCC)) with a mixture of martensite (body centered tetragonal (BCT)), with a low tetragonality), and lower quantities of other phases such as retained austenite and bainite [5,6]. The ferritic phase is soft and generally continuous, providing excellent ductility. The fraction of martensitic second phase (hard phase) rises with the increase in desired steel strength [7]. The desired steel strength increases with the increase in the fraction of martensitic second phase (hard phase) [8]. The small quantity of retained austenite does not significantly change the specific properties of this steel [9]. CP steels have a microstructure that often contains ferrite and bainite with small amounts of pearlite, martensite, and retained austenite [5]. Extreme grain refinement is created by retarded recrystallization or precipitation of microalloying elements such as Ti or Cb [10].
DP steels have high ductility and work hardening rates in the first stages of plastic deformation, as well as maintaining an exceptional combination of formability and strength [11,12]. However, the current AHSS have a low planar anisotropy, which limits deep drawability. Furthermore, at the beginning, hardening can be very high, but this stabilizes with increasing strains, more than, for example, in mild steels. The stretchability of these steels is also considered a disadvantage [13]. CP steels have a higher minimum yield strength in comparison with DP steels for same strength level. They have a high work hardening capability at a low strain [5,14,15,16].
Several studies have been conducted on variability in the microstructural and mechanical properties of different types of materials in various manufacturing applications [17,18,19]. Djavanroodi et al. [18] experimentally analyzed the fluctuations in the mechanical properties and weight of reinforcing steel, highlighting the need to use variability analysis methodologies to evaluate material variability based on production data. Bright et al. [19] analyzed the variability of the mechanical properties of a high-strength low-alloy (HLSA) steel, examining the chemistry of the rolling and cast conditions of the steel. They found that steel exhibited more variability in yield strength than ultimate tensile strength, and the amount of niobium was what most influenced the mechanical properties due to its grain refining and strengthening properties. Harsch et al. [20] tested the same material (stainless steel 1.4301) from different suppliers to analyze the fluctuations in material properties, as these often lead to robustness problems in manufacturing processes. To increase the process quality, they measured the yield locus, yield curve, and forming limit curve of the materials, finding significant disparity between suppliers.
These variations in material properties must be considered, as these fluctuations can be crucial in the manufacturing process. Because of this, their effect on the quality features of the process must be known. For this, sensitivity analyses are a powerful tool. For example, Wiebenga et al. [21] performed a Pareto analysis to determine the influence of several variables in roll forming. Furthermore, the sensitivity of the springback behavior in relation to the material properties has been considered in the literature. Kwei et al. [22] analyzed the effect of the punch radius, material strength, and sheet thickness on the springback angle in V-bending, and found that the springback ratio increased as the normal anisotropy increased or as the thickness ratio and strain-hardening exponent decreased.
The variability in mechanical properties between different batches of the same material, as well as between batches from different providers, is an important factor to consider. This variability could affect quality requirements within a given production run of material.
Considering this, the primary focus of this study is to examine the differences in mechanical, microstructural, and formability characteristics between cold-rolled DP980 and CP980 high-strength steels. These two types of materials are employed when producing an identical automotive component, specifically a seat rail component, by a well-known TIER1 company. Consequently, investigating the variation in bend angles post-springback across various material batches is crucial for the company’s comprehension of the origin of this discrepancy. It also paves the way for suggesting an enhanced feedback control system to integrate into the press system, ultimately resulting in a more robust manufacturing process. To this end, the following tests were carried out:
  • Chemical composition analysis to identify and quantify the elemental composition of each batch.
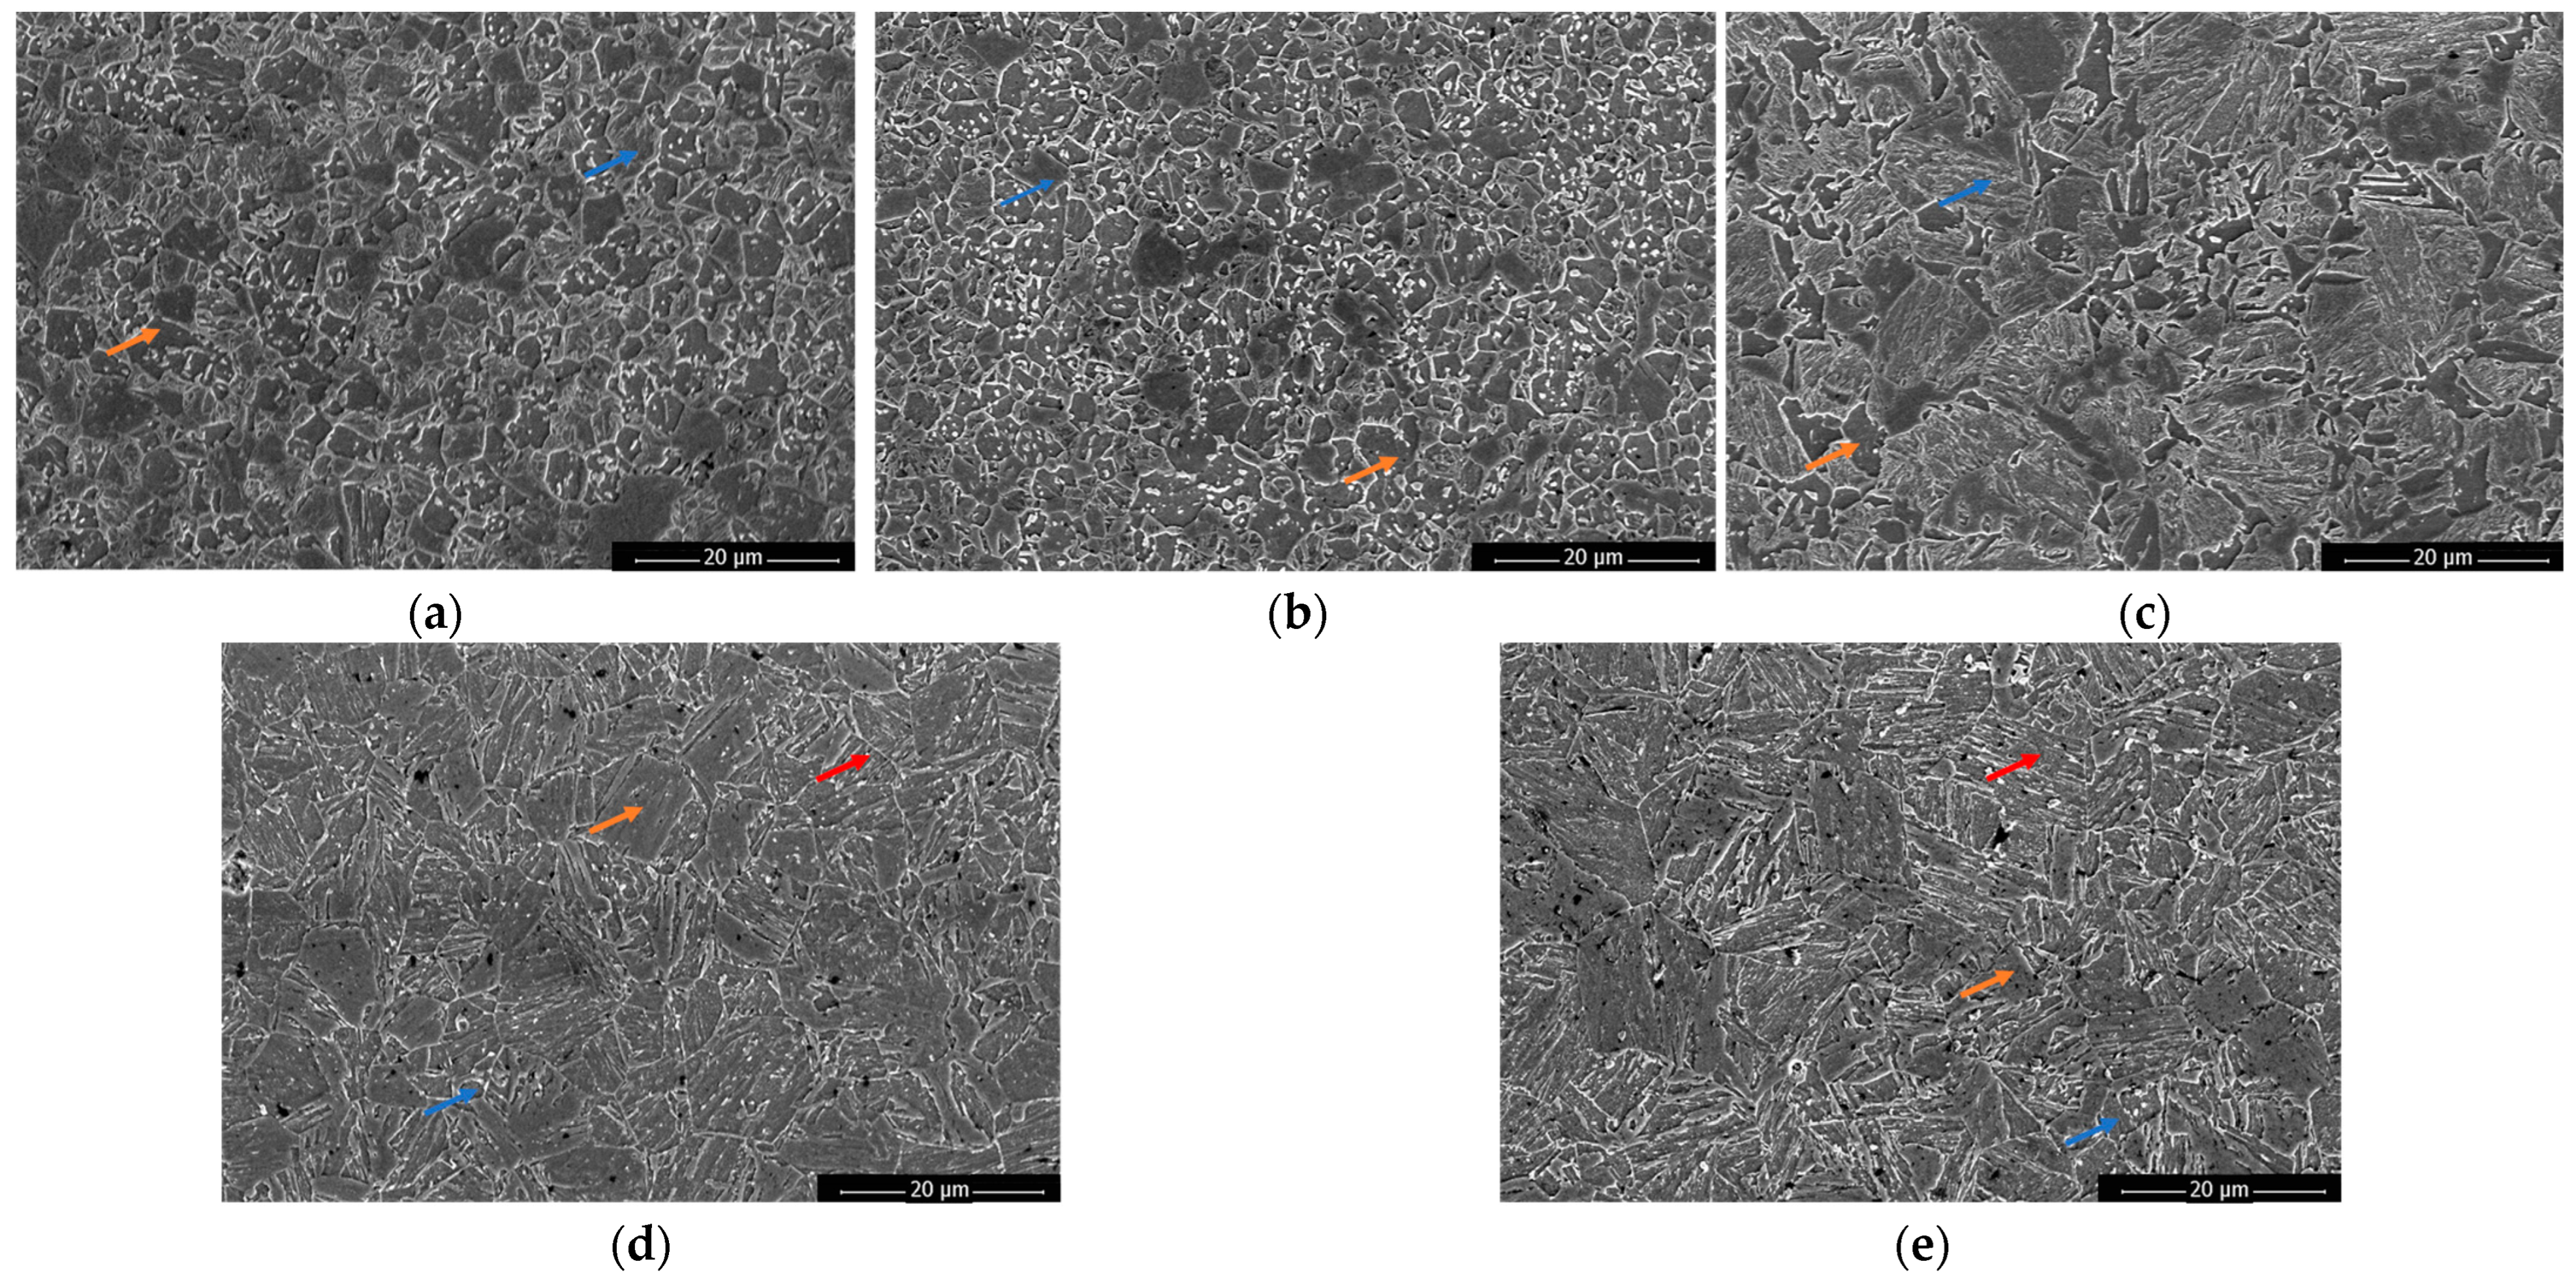
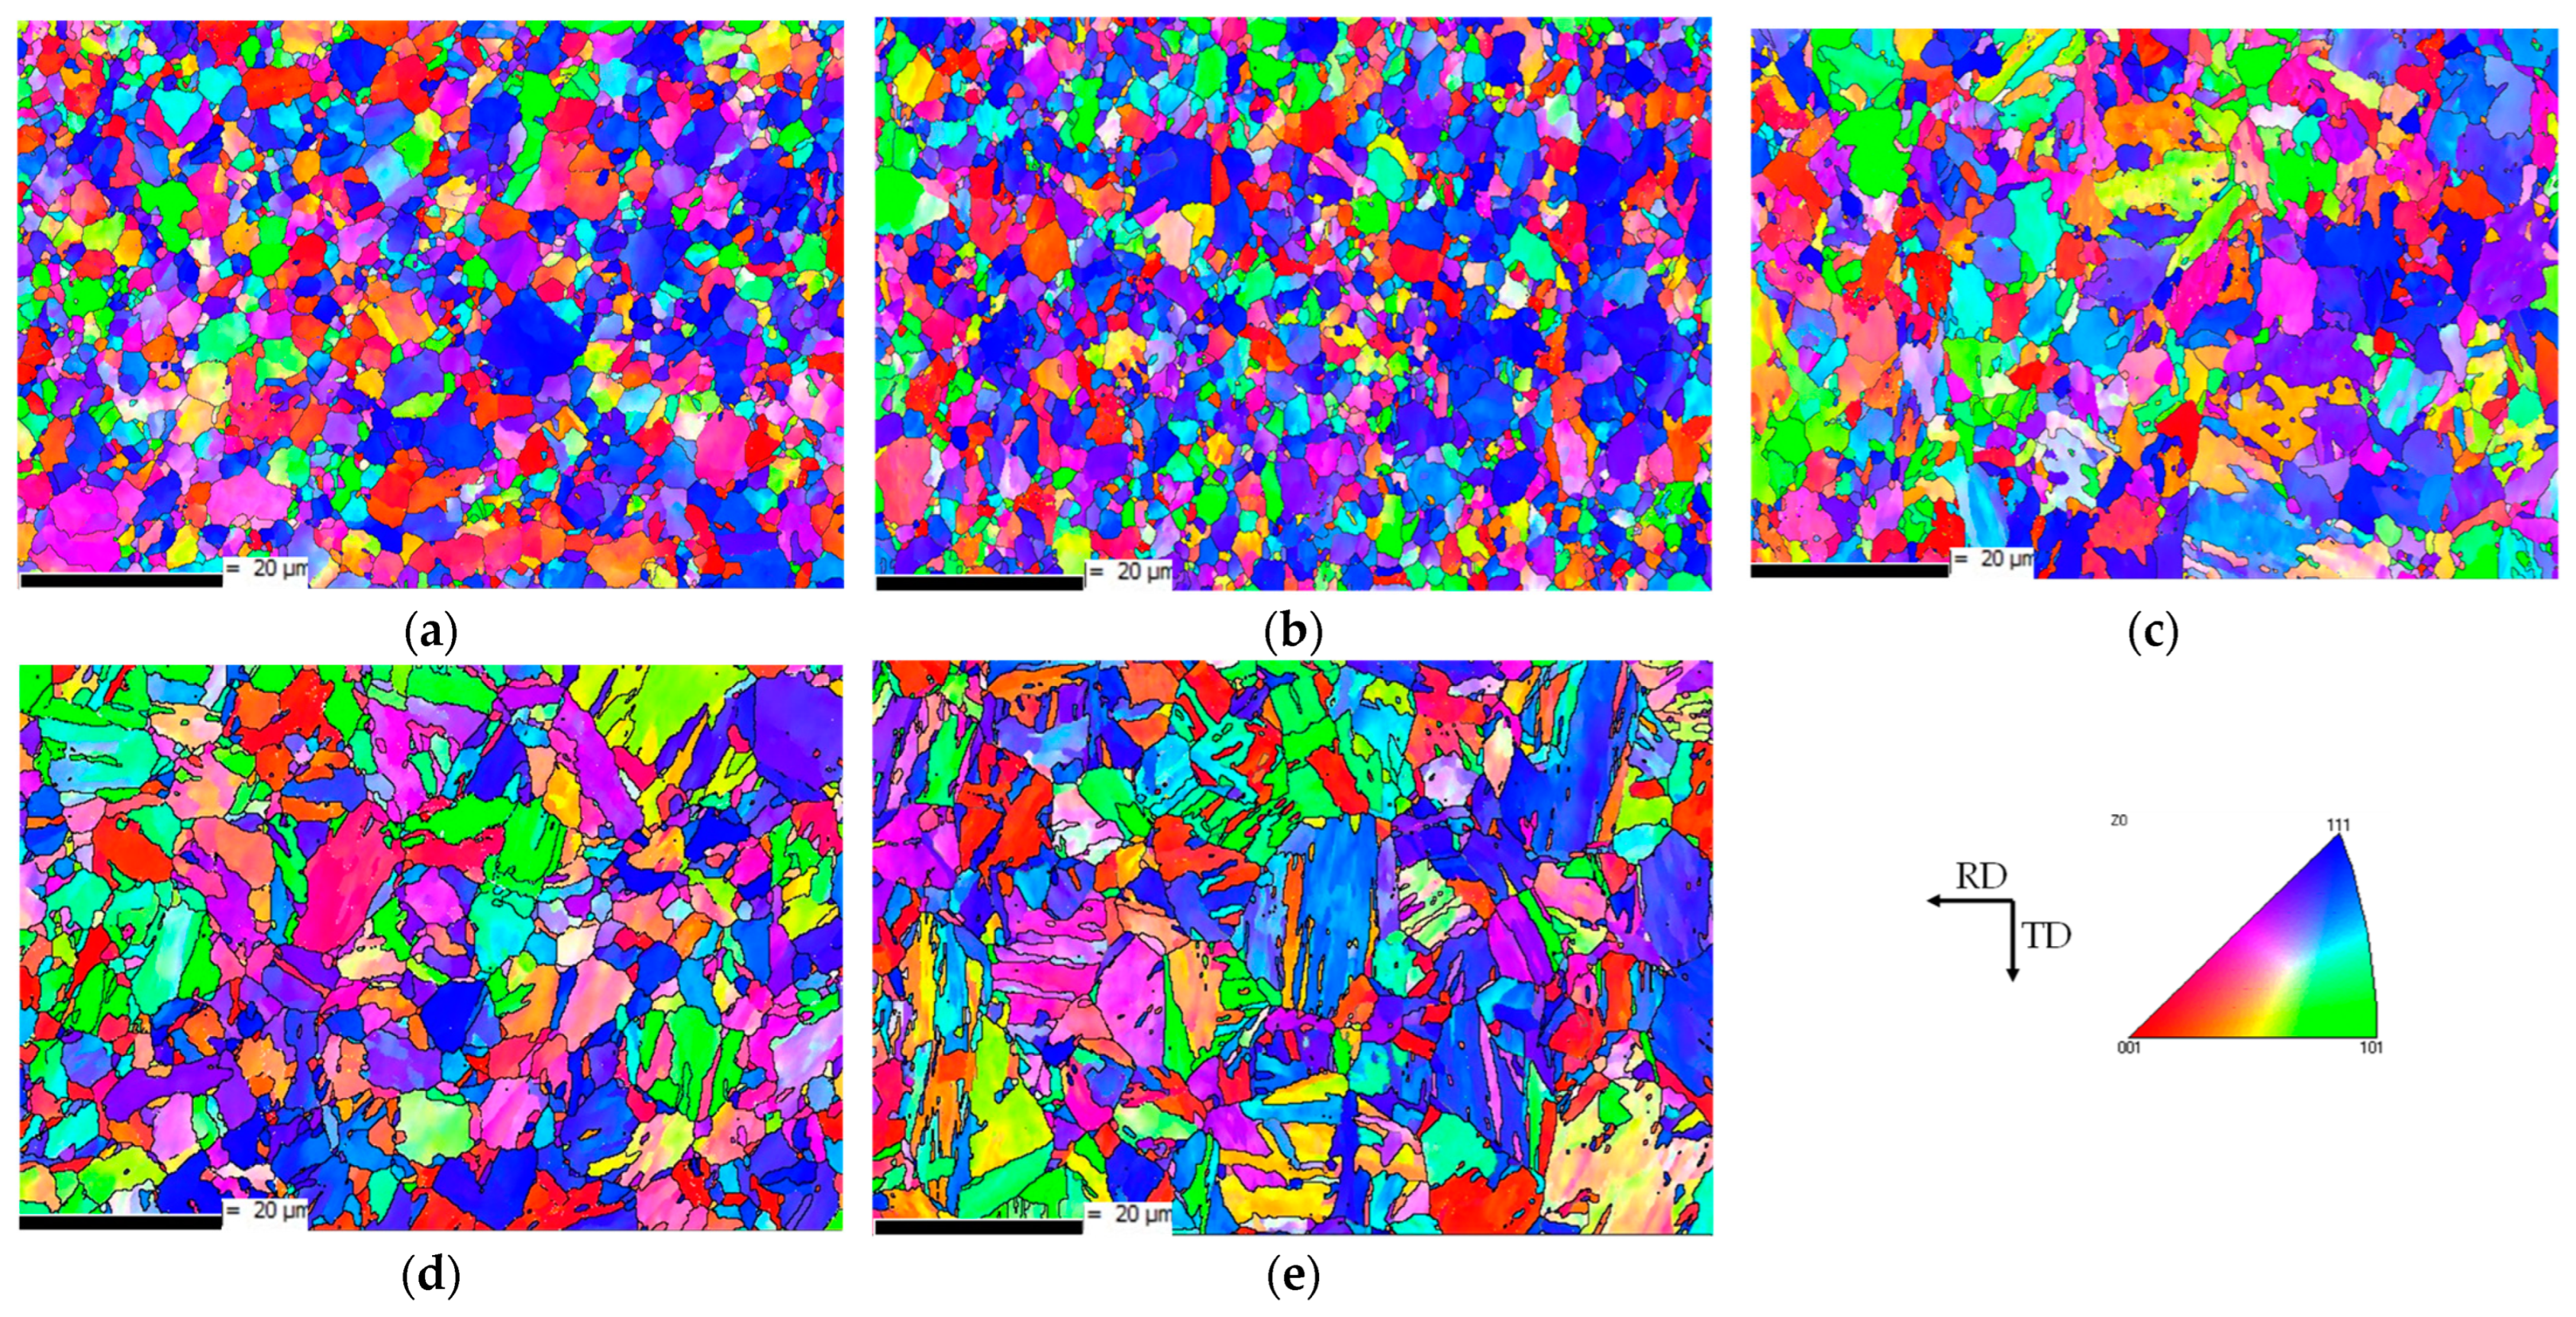
  • Microstructural analysis using scanning electron microscopy (SEM) for an in-depth characterization and electron backscatter diffraction (EBSD) analysis to identify the recrystallization state and grain misorientations.
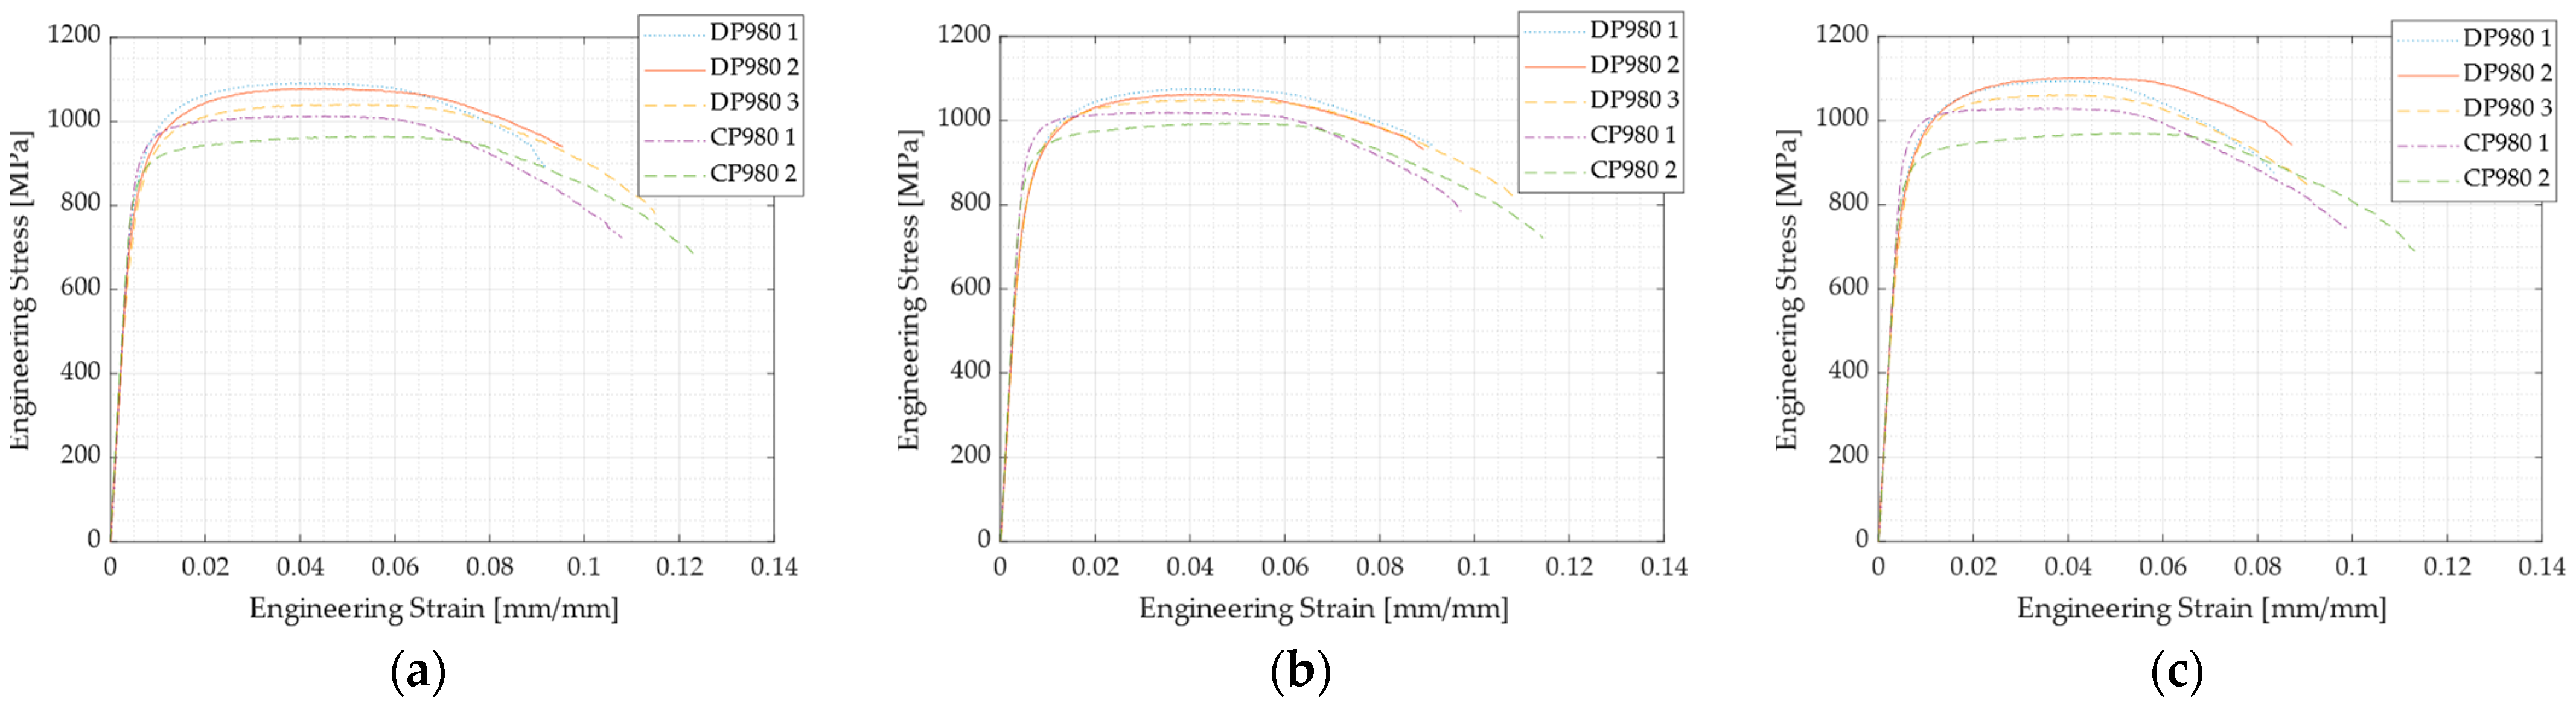
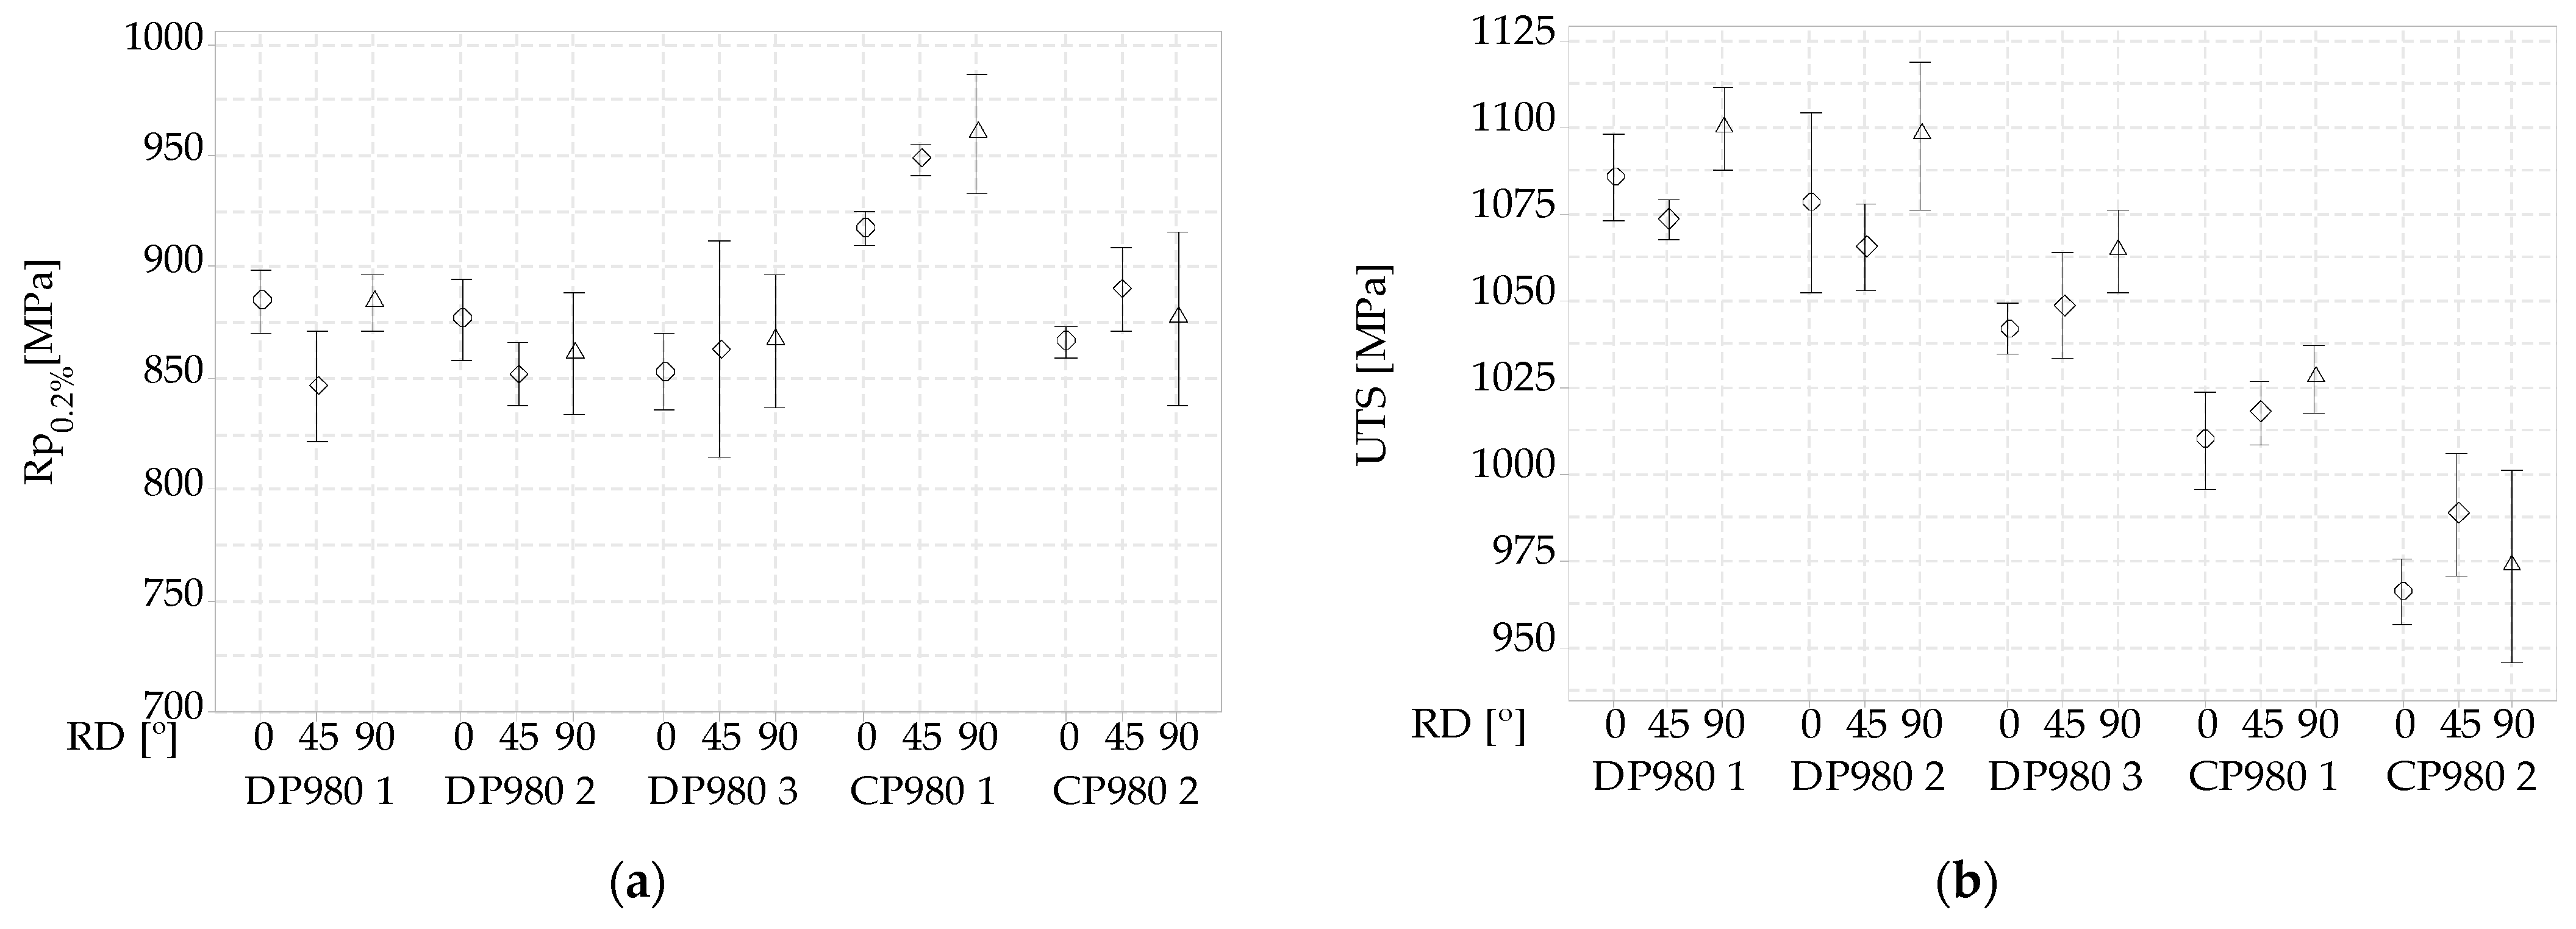
  • Tensile tests to determine the mechanical properties of each batch.
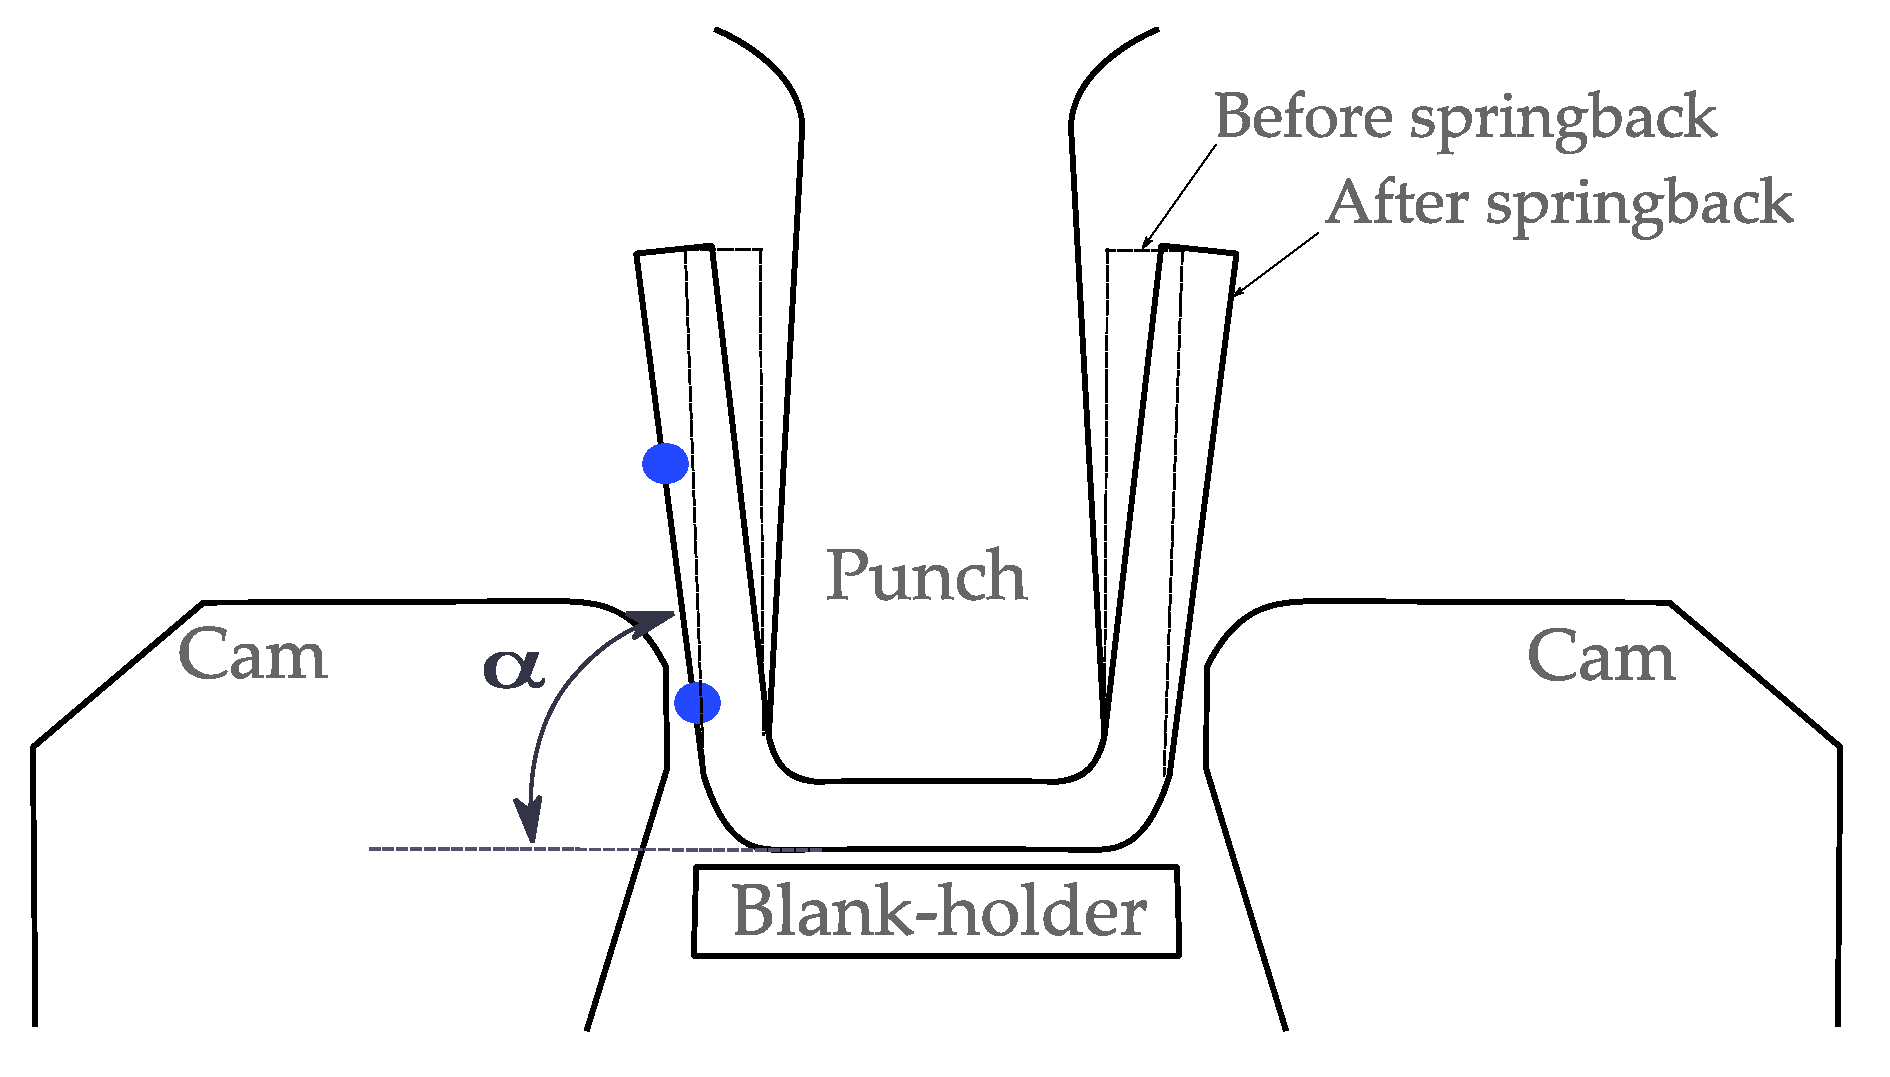
  • U-bending tests in a press demonstrator. The bend angle after the springback was measured, and Pearson correlation coefficients were obtained using correlation analysis. Thus, positive and negative effects of the initial material properties’ variability and press specifications on the bend angle after springback were calculated

2. Materials and Methods

2.1. Materials

In this work, two different high-strength steel types with a nominal thickness of 1.5 mm were analyzed: three dual-phase DP980 steel from two different suppliers and two complex-phase CP980 steel from another (Table 1). The samples were cold-rolled and skin-passed to maintain the thickness of the strip. It must be noted that, although CP and DP are different materials, they are all used in an industrial process to manufacture the same component. Table 1 presents the examined materials, along with their corresponding specifications.

2.2. Chemical Composition Analysis

The chemical composition of both DP980 and CP980 was measured using inductively coupled plasma optical emission spectrometric analysis. Measurements were carried out based on UNE EN 10351:2012 [23].

2.3. Microstructural Properties of DP980 and CP980

Specimens free of deformations were taken from the DP980 and CP980 sheets from each supplier. The same procedure was followed for all samples: (i) they were mounted in an epoxy resin, (ii) ground down with SiC paper, (iii) degreased with alkaline cleaner and rinsed in tap water followed by denoised water, (iv) polished with diamond paste of 3 and 1 µm, and (v) polished 4 h in a vibratory polisher with a 0.05 µm alumina suspension.
Microstructures were measured using an optical microscope Leica DMi8. With this method, the steel phase colors could be observed only when etched, which is why the scanning electron microscope was used to differentiate the phases by means of a topographic contrast with secondary electrons.
In this work, the inverse pole figure (IPF) tool was used by means of electron back scatter diffraction (EBSD) analysis to determine the grain misorientations and, in this way, to observe the microstructural variability in the different specimens. To perform the EBSD analysis, the specimens were automatically polished with colloidal silica for 30 s. Subsequently, they were cleaned with distilled water, wetted in ethanol and dried in warm air. After that, they were polished for 4 h in a vibratory polisher with a 0.05 µm alumina suspension.
It is important to take into account the limitation of the EBSD software in distinguishing between ferrite (bcc) and martensite (bct) phases in dual-phase steel, as the crystalline structure of their microconstituents is similar. For this reason, it was decided not to force the software to index martensite. Therefore, the points not indexed were the sum of the possible martensite and the very deformed ferrite. The martensite and ferrite percentages were determined using scanning electron microscopy (SEM). For the SEM inspections, the specimens were etched with 2% Nital solution for 15 s, given that Nital preferentially etches ferrite and outlines the grain boundaries, leaving martensite undissolved.
The digital images from the SEM inspections were used to calculate the volume fraction of martensite, which appeared in relief with respect to the ferritic matrix, as well as the ferrite phases. Metallographic analysis was performed using ImageJ and MATLAB. ImageJ was used to color the martensite areas in white. In MATLAB, using the RGB scale, the pixels of the image were classified according to their corresponding number on the scale, and the martensite area was calculated.
The analyses were developed in a field emission gun scanning electron microscope (FEG-SEM) FEI NOVA NANOSEM 450 equipped with energy-dispersive spectroscopy (EDS) facilities. The scans were carried out using a step size of 0.125 µm, 2500×. The EBSD crude data were post-processed with Tango software, using Oxford Instruments, and the grain size and grain misorientations were calculated. The size of each grain was calculated by converting the area of the grain into the equivalent circle diameter (see Equation (1)):
i = S i 4 π ,
where i and S i are the equivalent circle diameter ad grain surface of the i-th grain, respectively. The arithmetic average grain size was calculated according to Equation (2):
A = 1 N i = 1 N i
where N is the number of grains.
Apart from the arithmetic average, the weighted average grain size was also calculated according to Equation (3):
W = i = 1 N S i S t · i
where S t indicates the total area measured.
By calculating both averages, it is possible to know in which samples there is a higher number of ultrafine grains and/or carbides, i.e., in the samples where both means have different values. For the correlation analysis, the arithmetic average grain size was used.

2.4. Mechanical Properties of Both DP980 and CP980

In accordance with ISO 6892-1:2019 standard for tensile testing on metallic materials [24], tensile tests were performed in a 50 kN Instron/Zwick 3369 testing machine equipped with an extensometer Zwick-Roell makroXtens II with a calibration distance of 25 mm, so that the displacement could measure the precise strain. The tests were carried out at room temperature and the test speed was 1.5 mm/min.
The samples were cut out in three directions: (1) test in the rolling direction (RD, 0°), (2) test in the diagonal direction (DD, 45°), and (3) test in the transversal direction (TD, 90°). In accordance with ASTM E8/E8M, the specimens were machined in a dog-bone configuration [25].
Tensile tests were performed on three specimens for each rolling direction and per supplier. Different mechanical properties were obtained: 0.2% offset yield strength (Rp0.2%), ultimate tensile strength (UTS) or tensile strength, elongation (A), hardening exponent (n) and Lankford coefficients (r). To obtain n, the range of deformation selected was from 2% to 4%, and it was calculated following Hollomon’s law [26]. To obtain the strains in the specimen, a deformation analysis was carried out using image digital correlation (DIC). The DIC-based system employed to develop the required measurements in this work was GOM Aramis 5M [27].

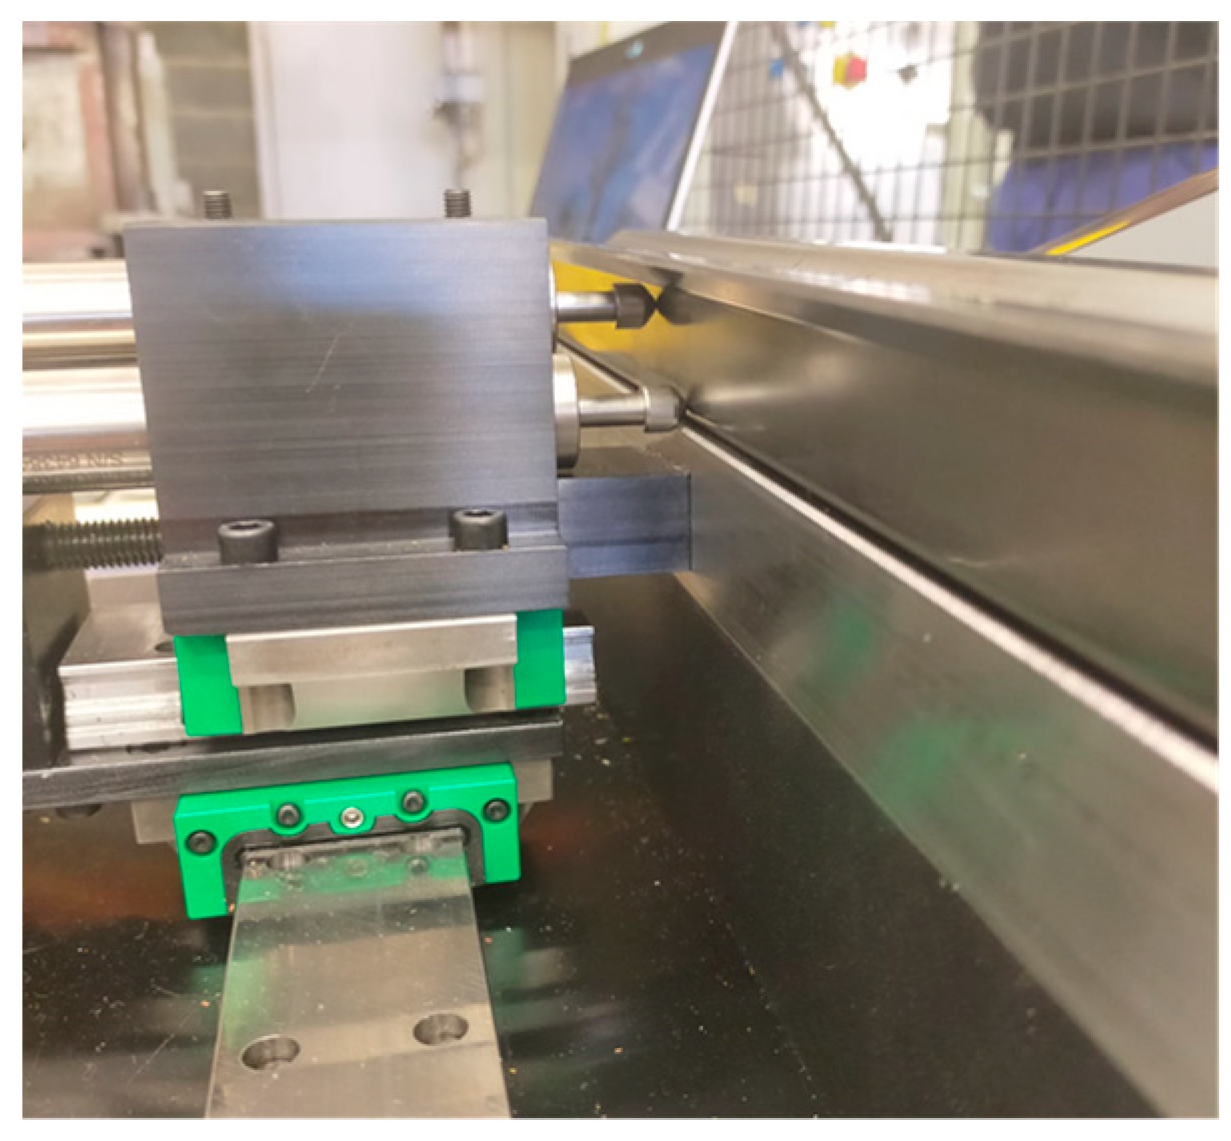
2.5. Experimental Tests in U-Bending Demonstrator in the Servomechanical Press

After mechanical and microstructural analysis, several tests in the laboratory servo-mechanical press of 400 ton were performed to characterize the variability of materials regarding the bend angle after the springback. As the focus of this study was the variation in the bend angle after the springback and not the springback itself, the steel sheets were used as received for the characterization, without treatment or coating modifications. Figure 2 illustrates the U-bending process scheme, where α is the bend angle after the springback. The measurements were performed after bending of the part.
To measure the experimental bending angle, a measuring tool was developed (Figure 3). It consisted of two linear variable differential transformers (LVDTs) placed in the upper test rig. LVDTs measured in the upper and lower zones of the part. The piece was placed by means of pins and magnets to ensure its correct measurement.
To characterize the variability of the process, the procedure was as follows: 10 repetitions with the five materials for five different strokes were performed, for a total of 250 parts. The press velocity was the same for all parts. The bending angle, real stroke and sheet thickness were measured in each test.

2.6. Correlation Analysis Procedure

Once materials were characterized and experimental U-bending tests were performed, a correlation analysis was performed to obtain the Pearson coefficients. This allowed for the determination of the influence of different variables in the outcome of a process. With this analysis, effects of different mechanical and microstructural properties on the bend angle after the springback for the five different materials were obtained.

3. Results

3.1. Chemical Composition Measurements

The chemical composition analysis of both DP980 and CP980 is shown in Table 2.

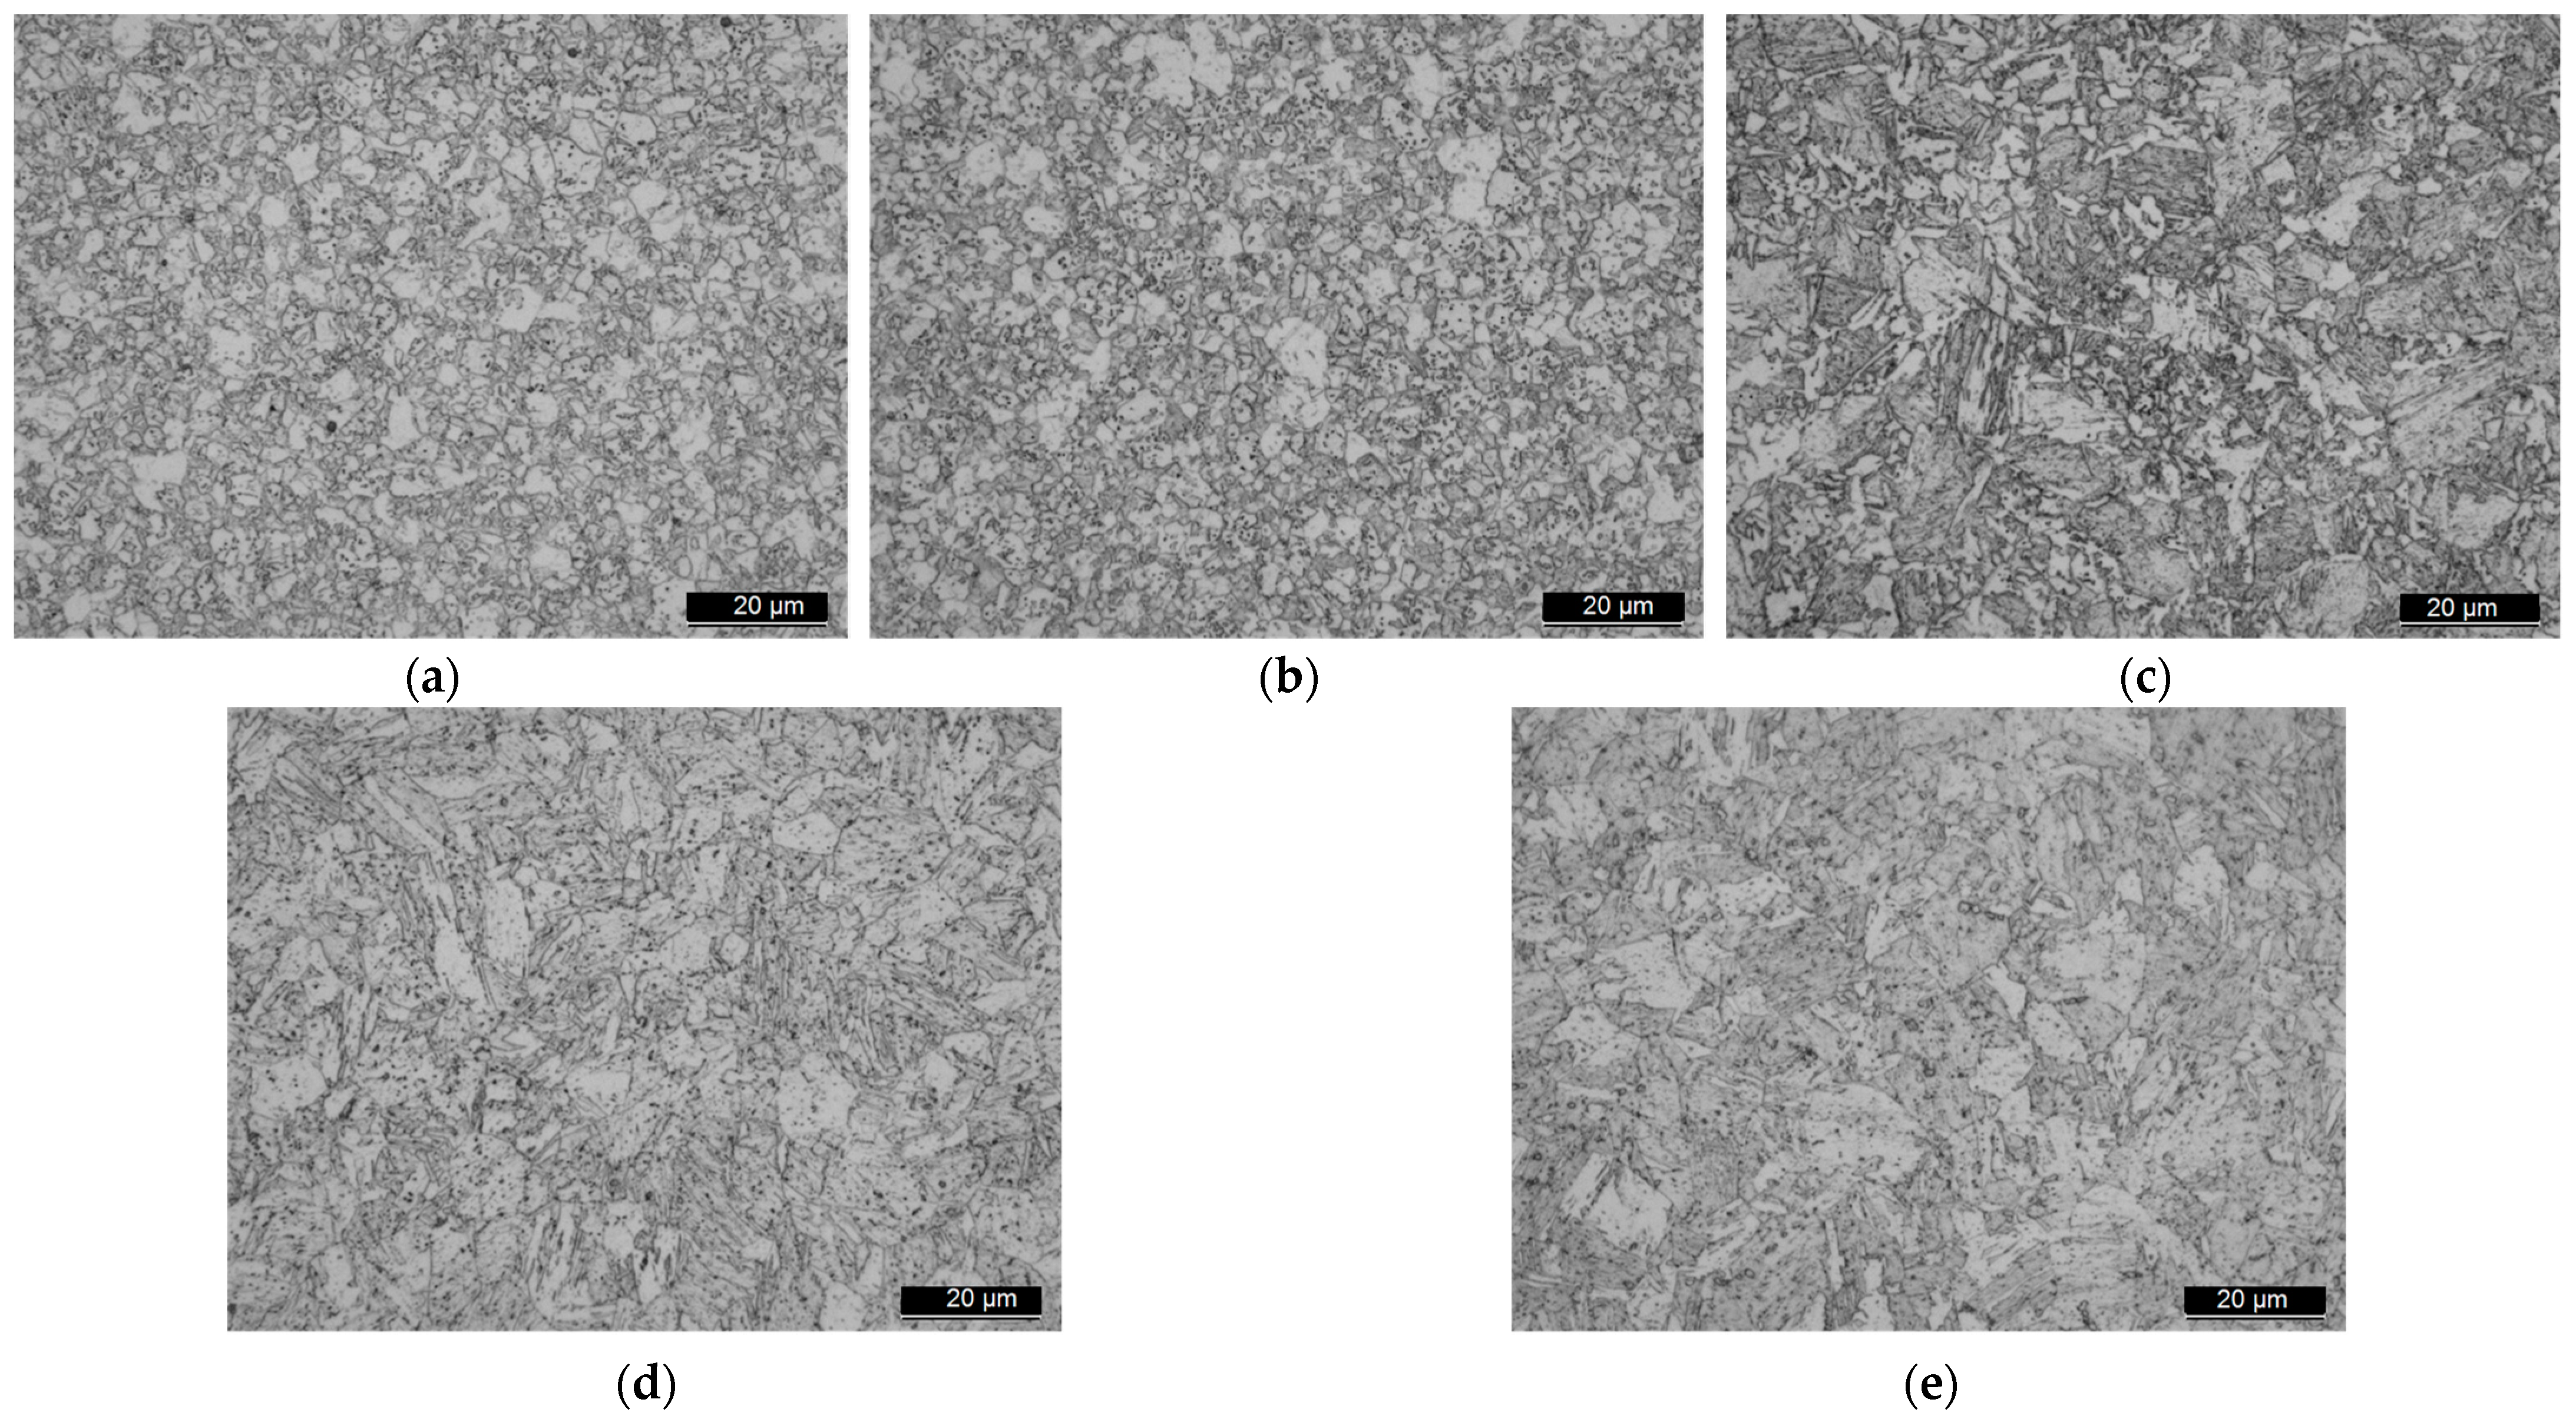
3.2. Microstructural Properties of DP980 and CP980

The corresponding micrographs for the alloys are shown in Figure 4. The identification of individual phases was carried out based on a comparison with the available literature [28,29,30]. The morphological distribution of constituent phases was similar to those reported for both conventional DP and CP steels [31,32,33]. Figure 4a,b clearly shows that the microstructure of the DP980 steel was comprised of randomly distributed hardened island-shaped martensite inclusions (bright contrast) and a soft ferrite matrix (dark contrast) with a granular distribution. DP980 1 (Figure 4a) and DP980 2 (Figure 4b) showed a more granular distribution, while DP980 3, CP980 1, and CP980 2 (Figure 4c–e) had a banded distribution. DP980 3 (Figure 4c) consisted of annealed martensite in a soft ferrite matrix. The grain size and distribution for the hard martensite phase were very different, when comparing Figure 4a,b with Figure 4c. The CP980 materials, i.e., CP980 1 and CP980 2 (Figure 4d,e), presented a bainitic structure with martensite regions in a ferrite matrix, with a banded distribution. Carbides could be observed in the different high-strength steels distributed along the specimens.
To perform an identification of the phase percentages of both CP980 and DP980 microstructures, SEM images were obtained (Figure 5). The phase composition was evaluated through image analysis and the martensite phase percentage was obtained for the DP980 materials. For the CP980 materials, the bainite and martensite regions were identified based on the literature [29,32], and the approximate percentage of these phases is presented in Table 3. For the CP980 specimens, no differentiation was found between the percentages of bainite and martensite. The martensite content was higher in specimens DP980 3 and DP980 2 (Figure 5b,c), with 66.5 and 63.3% vol.% of martensite phase, respectively. The amount of retained austenite in DP steels and its possible effect on the increase in elongation were not analyzed in this study.
In Table 3, some results can be highlighted. According to this estimation, CP980 2 had higher bainite and lower martensite content than CP980 1, while in DP980 1 and DP980 2 similar ferrite and martensite content was found. DP980 3 is composed of annealed martensite and ferrite (Figure 5c). Here differences between material providers can be observed, specially between DP980 1and DP980 2 with DP980 3. A total variability of 9.40% and 5.64% between DP980 and CP980 specimens was found, respectively.
EBSD enables the study of crystallographic orientations based on the Kikuchi diffraction patterns from the surface of the specimens [34]. Figure 6 presents EBSD image quality maps for each material, where ferrite is indexed as the main phase. The difference in colors represents the difference in the grain misorientations. Figure 6 illustrates that there is no preference of grain orientation; the different colorings shown reflect the randomness of the crystallographic orientations of the grains in the material.
Grain size is another fundamental parameter when characterizing a material. In this work, the arithmetic and weighted average grain size were calculated to compare suppliers and to establish a relationship between the grain size and strength of each material. Table 4 depicts the arithmetic and weighted average, where the maximum and minimum grain size of each material were determined by EBSD analysis. The arithmetic average grain size was similar for all of the materials, ranging between 1.34 and 1.92 µm, while the weighted average grain size ranged from 3.04 to 6.37 µm. The maximum grain size observed for CP980 1 and DP980 3 was 17.02 and 15.70 µm, respectively. The percentage of grains with a size higher than 2 µm was calculated. The following percentages were found, from highest to lowest, DP980 2, CP980 1, CP980 2, DP980 3 and DP980 1, with 35.68%, 33.64%, 29.57%, 25.3%, and 23.26%, respectively.

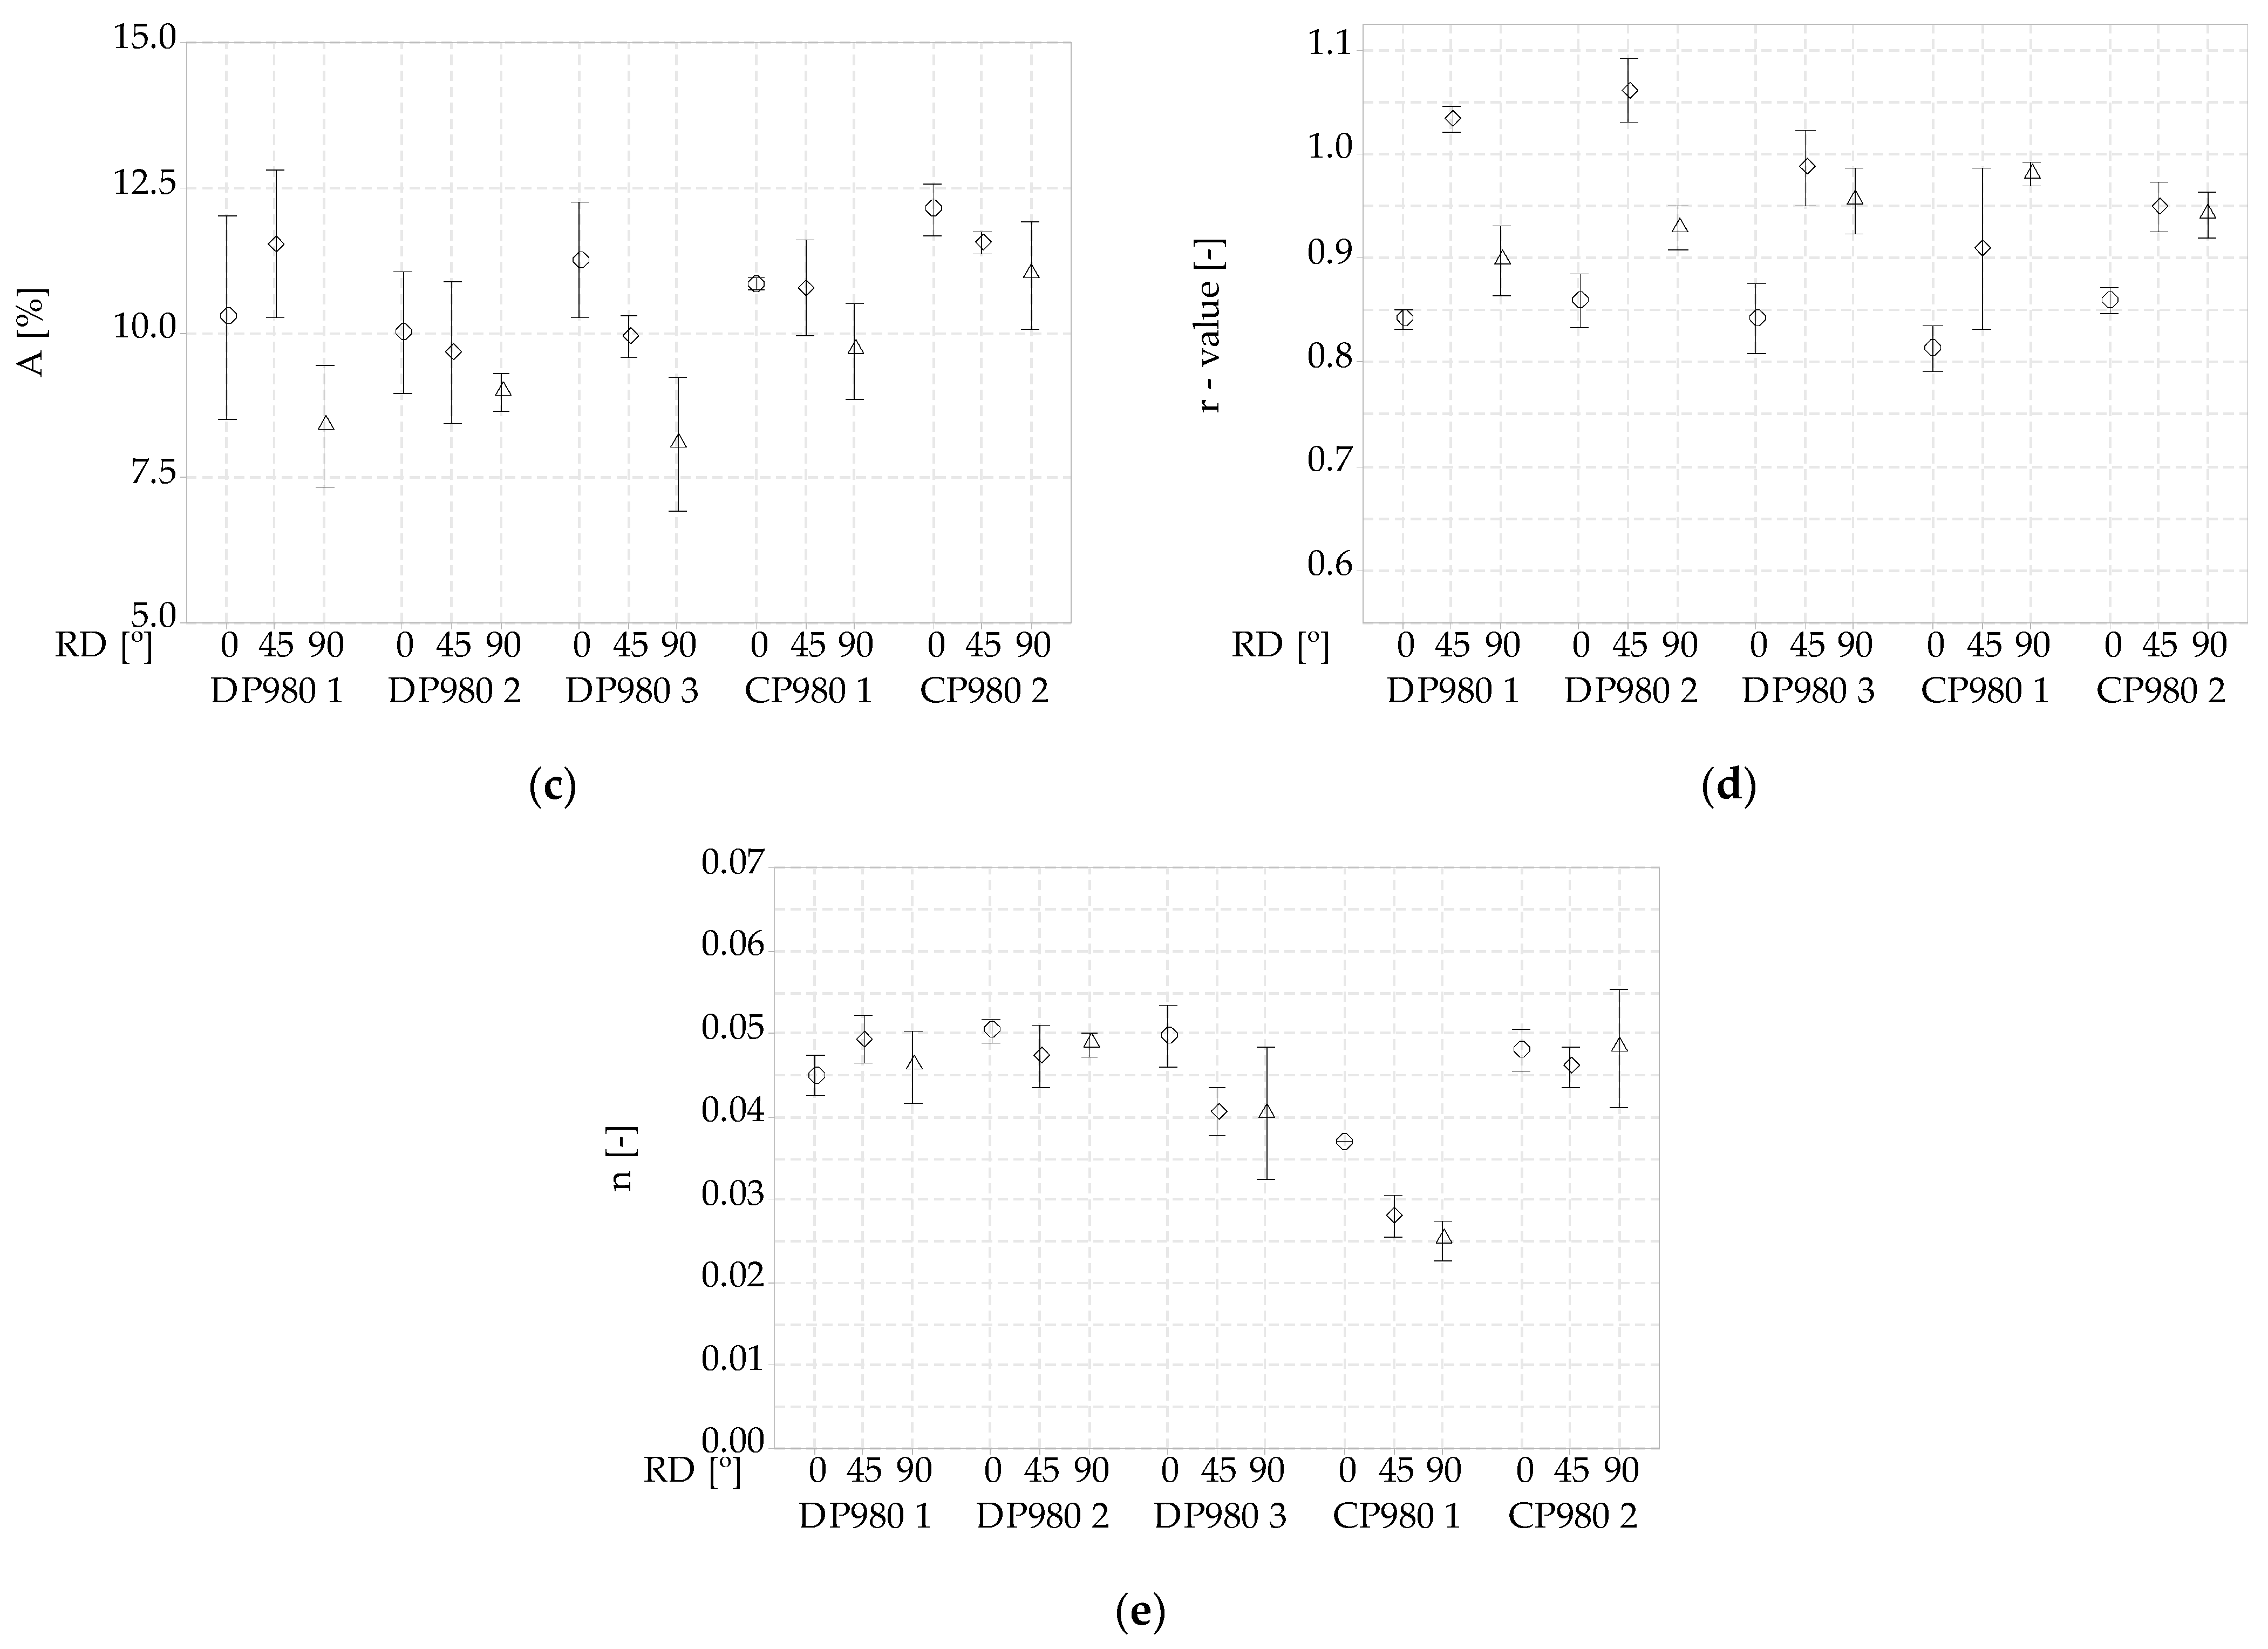
3.3. Mechanical Properties of Both DP980 and CP980

The representative engineering stress−strain curves of all of the studied materials are shown in Figure 7. The main averaged mechanical properties for each rolling direction are shown in Figure 8. The highest yield strengths were found for CP980 1 with 916.8 MPa (Figure 8a) for 0° and 959.4 MPa for 90°, and the lowest for DP980 3 with 852.2 MPa for 0°. Differences in UTS (Figure 8b) of 119.3 MPa were found between all of the materials tested in 0°, where the DP980 1 material presented the highest UTS with 1085.7 MPa and the CP980 2 material presented the lowest UTS with 966.4 MPa. A difference of 43.8 MPa was found among the DP980 materials at 0°, while the CP980 steels exhibited a difference of 43.3 MPa in the same rolling direction.
The greatest elongations were found for the CP980 2 material for all rolling directions (Figure 8c). For 0°, the DP980 3 material presented the second largest elongation, followed by the CP980 1 material. For 45° and 90°, CP980 2 presented the second largest elongations. DP980 3 had higher elongations compared with the DP980 1 and DP980 2 materials in all of the rolling directions, except for 45° in DP980 2 (Figure 8c). This may be due to the variability in the tensile tests. Differences in the plastic region for all materials were observed in both strain hardening and necking regions.
In relation to hardening, remarkable differences were found. CP980 1 reported the lowest hardening exponent (n) values for all rolling directions (Figure 8d), of 0.037, 0.028, and 0.025, respectively. Between the DP980 steels, similar values were obtained. A maximum difference of 0.007 was found, ranging from 0.044 (DP980 1) to 0.051 (DP980 2). CP steel curves showed a plateau in the plastic region (Figure 7), with the strain hardening exponent being larger in the CP980 2 material than CP980 1. Concerning anisotropy, values between 0.8 and 1.1 were found (Figure 8d). No significant changes were observed in function of each material.

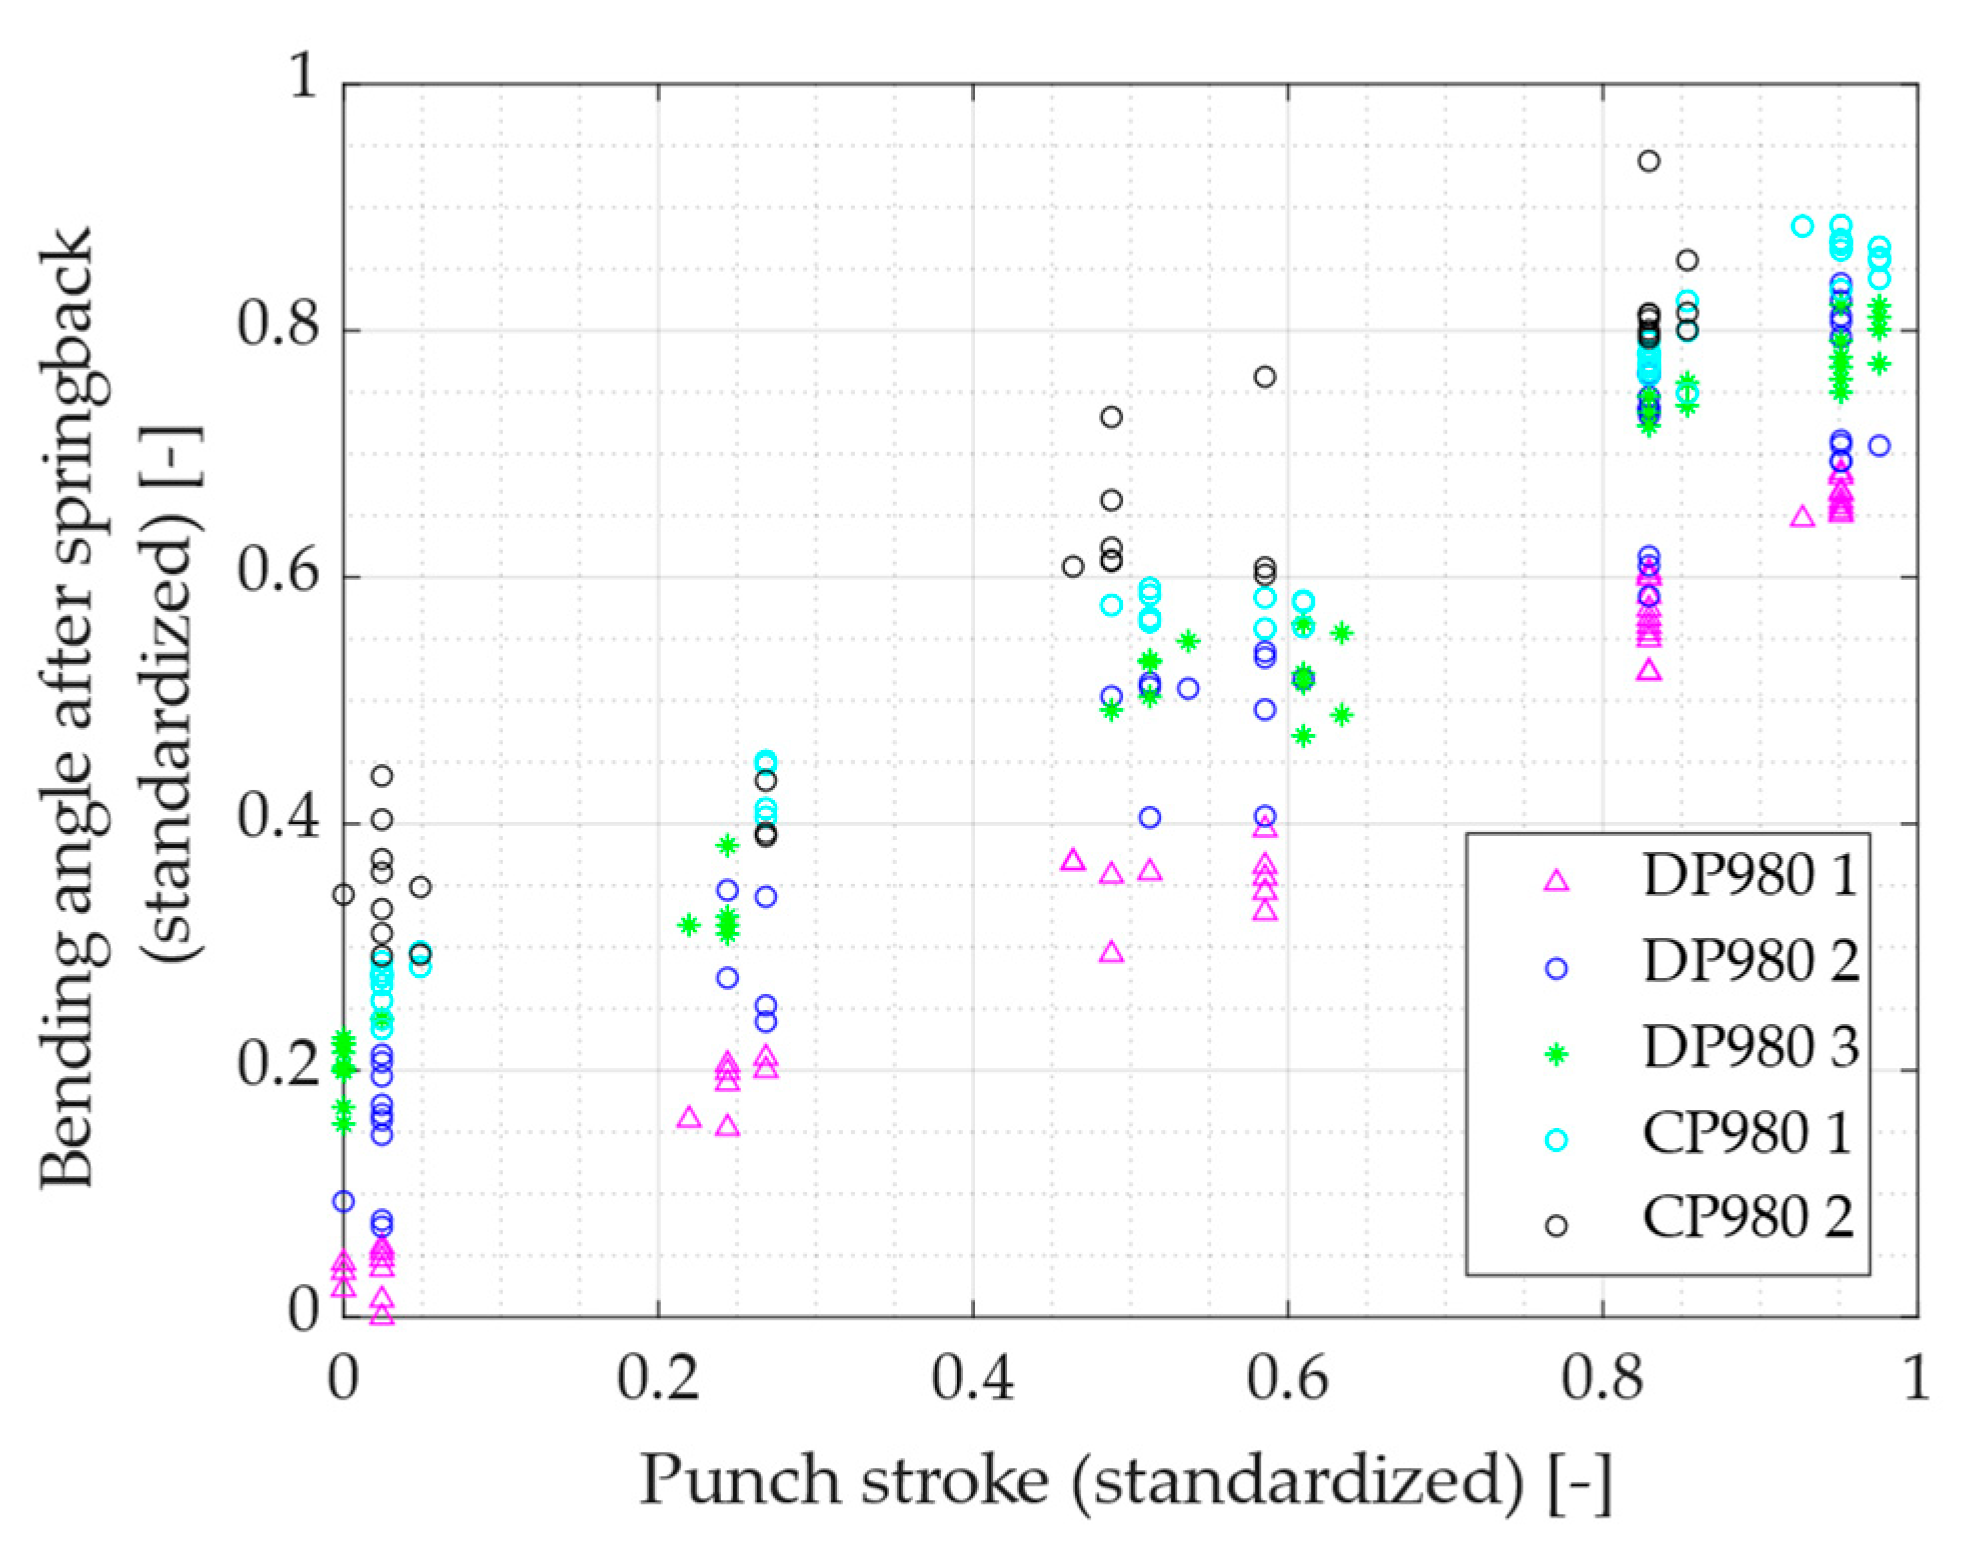
3.4. U-Bending Experimental Tests

After the mechanical and microstructural characterization, U-bending tests were conducted in both the DP980 and CP980 steel grades. The bending angle after the springback was measured for the 250 parts tested, and each sheet thickness was measured in-line. Table 5 shows the average sheet thickness measured in-line for each CP980 and DP980 analyzed, and Figure 9 shows the bending angle after the springback vs. the press stroke for each part tested, respectively, in standardized values.
For the five nominal press strokes, slight variations were found, both in the real stroke and in the bend angle obtained between materials and in the same material. For the same press stroke, in the same conditions, maximum angle variations of 1.25° were observed considering the five different high-strength steels. The real stroke was measured for each test. It can be seen that for the material with the lowest UTS (CP980 2) the highest bending angles were obtained, while the hardest material (DP980 1) had the lowest bending angles after the springback. Table 6 shows the maximum bending angle variability of each material. The variability of each material was calculated for the five nominal strokes, and the maximum of each material is presented. Each variability has been calculated as the difference between the maximum and the minimum bending angle for each stroke group.
For all of the materials, a high tensile strength resulted in a smaller bending angle, and high sheet thickness positively influenced the major bend angles.

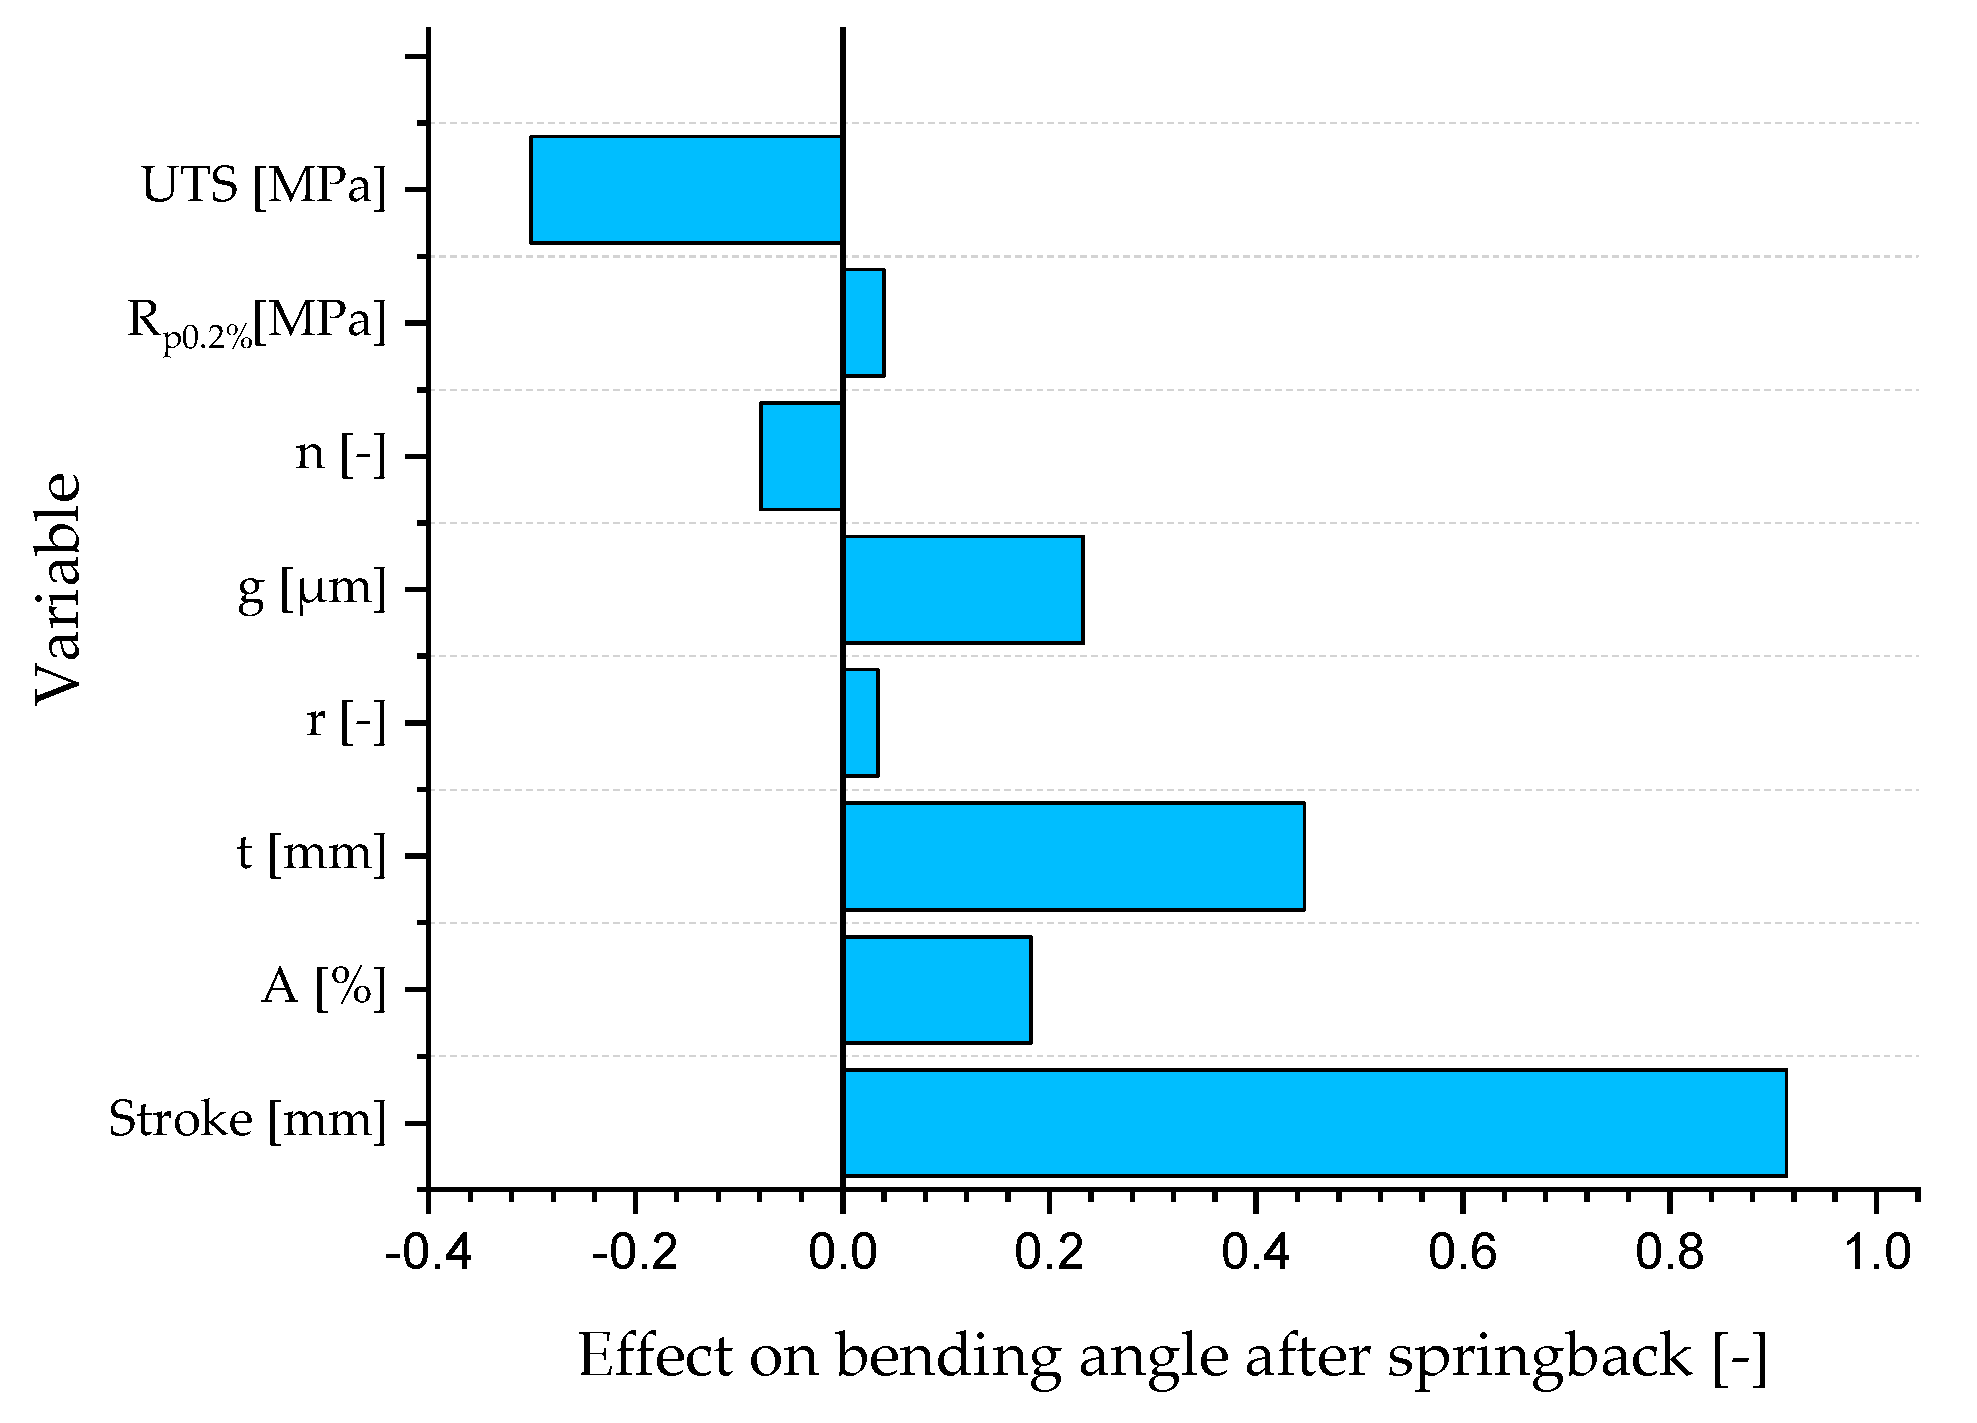
3.5. Correlation Analysis

After the U-bending tests were performed, Pearson correlation coefficients were calculated to analyze the influence of different inputs in the U-bending angle after the springback. This value ranged from −1 to 1 [35]. A value of +1 was the result of a perfect positive relation between the two variables, while a value of −1 represented a negative relation. Positive correlations indicate that as the bending angle increased, the variable analyzed also increased; while negative correlations indicate that bending angle decreased when the variable analyzed increased. Zero indicated no correlation. In this work, the inputs that were considered were, apart from press stroke, as follows: sheet thickness (t), tensile strength (UTS), 0.2% offset yield strength (Rp0.2%), grain size (g), elongation (A), anisotropy (r), and strain hardening exponent (n). The results of this analysis are shown in Figure 10.
In this work, the bending angle after the springback was highly influenced by the press stroke; t, followed by UTS, were also the most influential parameters. It was found that increasing t increased the bending angle, while increasing UTS decreased the bending angle. On the other hand, apart from t, the other variables whose increase implied an increase in the bending angle were as follows: g, A, and r. The Pearson correlation coefficients obtained for Rp0.2%, r, and n were around 0.1 or lower. These are low values; therefore, they had a very weak linear relationship.

4. Discussion

The current results suggest that the composition and processed conditions for these high-strength steels may play an important role in the U-bending angle after the springback behavior. The microstructural composition and the percentage of the phases depend on several factors: cooling and heating rates, intercritical annealing and temperatures, annealing times, and tempering temperature and process, among others [36,37,38,39,40]. Step annealing produced a fibrous (fine, needle-like) ferrite-plus-martensite structure (for DP steels), such as those found in DP980 3 (Figure 4c and Figure 5c), while intercritical annealing produced an equiaxed ferrite−martensite microstructure [41], such as those found in DP980 1 and DP980 2 (Figure 5a,b). With an inadequate annealing time, austenite formation cannot completely occur [36]. In this case, there is apparently no austenite in the DP980 microstructures (DP980 1 and DP980 2, Figure 5a,b), except in the case of DP980 3 (Figure 5c), in which it is hard to differentiate martensite from retained austenite. With slow heating rates, austenite keeps randomly distributed in the ferritic matrix during the intercritical annealing. Instead, with high heating rates an inadequate recrystallisation of ferrite occurs, resulting in banded austenite regions. For a given composition, minor variations in cooling rates may lead to large changes in the microstructure. DP980 3 seemed to show this microstructure type. Moreover, the tempering process resulted in increased elongation at the cost of decreasing the tensile strength [36].
Intercritical temperature can be also responsible of the needled or blocked ferrite martensite microstructure [42]. The presence of fine particle carbides, especially in DP980 1 and DP980 2 (Figure 5a,b), could be due to the low intercritical temperatures [42]. The balance of yield strength and uniform elongation could be improved by the dispersion of carbide particles [43]. The fine particle carbides present in the materials analyzed (Figure 5a–e) could contribute to an improvement in such mechanical properties. Small variations in the carbon concentration of martensite may lead to a large change in the tensile strength [44].
It is important to note that the percentage of the phases depends, apart from the factors cited above, on the carbon content [36]. Table 2 shows the chemical composition of each material. DP980 3 had the highest carbon content and DP980 1 had the lowest. Niobium has strengthening and grain refining properties [20]. Among DP980 materials, the Niobium (Nb) content was practically the same for DP980 1 and DP980 2 (same provider, different batches), while for DP980 3 there was no Nb content. As for the CP980 materials, they had the same Nb content (same provider, different batches). Regarding Mn content, it increases steel hardenability and reduces ductility [45,46]. This was correlated with this study for both the DP and CP steels; as the Mn quantity (Table 2) increased, the hardenability (Figure 7) increased and ductility decreased.
Annealed martensite is almost as hard and strong as martensite, but much more ductile. It is hard because the cementite interfaces lock dislocations (act as barriers) in a plastic deformation. The soft ferrite phase in DP steels is replaced by hard and less deformable bainite in CP steels [32]. Martensite’s strength strongly depends on its carbon content [47,48]. Increasing the carbon content in martensite increases the tensile strength [49]. Between DP980 1 and DP980 2, for a high carbon content, higher tensile strengths were found, except for DP980 3 (Figure 8b and Table 2). This could be due to differences in treatments applied between these materials, as the SEM images (Figure 5) showed differences between the microstructures regarding the fibrous martensite present in DP980 3. Zhang et al. [50] related fibrous martensite to a high carbon content, and DP980 3 presented the highest carbon content (Table 2).
The mean grain size varied from 1.34 µm (DP980 2) to 1.92 µm (CP980 1) (Table 4). Although the latest material presented the largest mean grain size, the largest grain sizes (max. 19.68 µm) were found for CP980 2, which agreed with the fact that CP980 1 had larger UTS and Rp0.2% than CP980 2 (Figure 8a,b). The grain shape also plays a key role in the mechanical properties [51]. Long intercritical annealing times can cause abnormal grain growth, which decreases the tensile strength. Although the mean grain size was lower in DP980 2 than in DP980 1, the latter material had a higher UTS. This could be due to the grain morphology, as in Figure 4, a more equiaxial structure in DP980 1 than in DP980 2 can be observed.
Ramazani et al. [52] observed that DP steels with equiaxed microstructures (as DP980 1 and DP980 2, Figure 4a,b and Figure 5a,b) showed higher strength and work hardening compared with banded microstructures (as DP980 3, Figure 4c and Figure 5c). In relation to the more banded distribution in DP980 3 and CP980 1, a possible explanation is that at low quenching temperatures, the time was too short to allow for the diffusion of long-range carbon, which is normally evidenced by banding. Furthermore, at high quenching temperatures, the ferrite appeared equiaxial, whereas at low quenching temperatures, the plate morphology predominated [53]. In Section 3.3, it was found that the respective material properties were quite different. This could be due to the distribution and shape of the martensite islands, especially in DP980 3 (Figure 5c). In DP980 3, the martensite islands were rather bigger and the grain size of the martensite was not similar to the ferrite grain size. The martensite annealing in DP980 3 provided it a greater ductility and a slight decrease in hardness and mechanical strength (4.03% lower UTS with respect to DP980 1). Regarding grain misorientations, the EBSD quality maps (Figure 6) showed the randomness of the crystallographic orientations of the grains in the material. This was also reflected in the Lankford coefficients obtained (Figure 8d).
Regarding CP steels, the two CP980 materials analyzed had a similar phase content (Table 3 and Figure 5d,e), differing in by 5.6%, but there were differences in mechanical properties. The presence of a higher bainite content in CP980 2 resulted in this material having a higher work hardening rate (Figure 8e), as well as the lowest tensile strength (Figure 8b). Grain size may be the responsible of having higher yield in CP980 1 than in CP980 2, as CP980 1 had an average grain size of 1.92 µm, 4.91% higher than CP980 2. The observations made in Figure 5 were in agreement with the stress−strain curves of Figure 7, where the CP alloy showed the highest yield point. Although the bainite phase was less deformable than the ferrite phase [32], in this case CP980 2, had the largest elongation, a 29.75% higher than DP980 1 elongation (Figure 8c). Furthermore, although the average grain size obtained for CP980 2 was slightly higher than for CP980 1, its tensile strength was 4.46% lower.
Generally, CP steel had a low UTS (1009.68 MPa and 966.36 MPa) and a relatively high yielding point (916.79 MPa in case of CP980 1) in comparison with DP steels (Figure 8a,b). This is in line with previous studies on these two families of steel [32]. CP980 2 presented lower Rp0.2% and higher work hardening rates than CP980 1. This is agreement with the ferrite content of both materials (30.88% for CP980 1 and 25.25% for CP980 2). The soft ferrite phase decreased the yield point, but allowed for a higher work hardening rate. This was true for CP980 1 and CP980 2. Table 7 and Figure 11 show the percentages of variation obtained for each rolling direction. The variability between the different DP980 and CP980 different batches was calculated for UTS, Rp0.2%, r, A and n. Overall, the greatest variations were found for A and n. Variations up to 108.33% were found in n at 90° for CP980 steel. Regarding UTS, Rp0.2%, and r, no variations of more than 13.95% were found.
According to the grain size, Figure 12 depicts the arithmetic average grain size of each material versus different mechanical properties for UTS, A, and n. It is known that for major grain sizes, UTS decreases [54]. In this work, the trend was the same, although for DP980 2 (1.34 µm) and CP980 1 (1.92 µm), lower and higher UTS than expected were found, respectively. As observed in Figure 11, in this work, major grain sizes had lower strain hardening exponents and higher elongations. According to Calcagnotto et al. [54], elongation was slightly affected. Grain shape may be one of the factors for a higher UTS for higher grain sizes. The same applies for the strain hardening exponent.
Regarding the variability in the bending angle, among all of the groups of strokes, a maximum angle variability between all DPs of 0.71° was found. Between batches, a maximum variability of 0.65° was found (DP980 1 and DP980 2). The batch with the greatest variability among the DP980 steels was DP980 2, with a maximum variation of 0.48° (Table 6). In the correlation analysis (see Figure 10), it was observed that, after press stroke, sheet thickness and UTS were the variables that most affect the final bending angle. The bending angle after the springback increased as the UTS decreased and as the thickness of the part increased. This implies that, in addition to other factors, even slight variations of 43.77 MPa in UTS and 0.03 mm in sheet thickness could result in a significant variation of up to 0.71° in the bending angle of DP980 steels. As for CP980 steels, a maximum angle variability of 0.55° was found between CP980 1 and CP980 2. Slight deviations in UTS of 43.32 MPa and sheet thickness of 0.02 mm could result in a significant maximum variation of 0.55° in the bending angle.

5. Conclusions

In the present study, the mechanical and microstructural characterization on five high-strength steels from different suppliers has been conducted. These steels are currently used by an industrial company to manufacture a real product by U-bending, where variability is an issue. Experimental tests were performed using the U-bending demonstrator to characterize this variability, and also to determine the correlation between the initial mechanical properties and the bend angle after springback. A notable variability between materials in bend angle after springback was observed in the U-bending tests. Therefore, the main conclusions of the work performed are the following:
  • Variations of up to 1.25° in bending angle were observed between the five batches for the same press stroke. The variability in the properties of the three DP980 steels analyzed involved variations of up to 0.71° in the bending angle for the same stroke. Between batches from the same provider, variations up to 0.65° were observed.
  • The variability in the properties of the two CP980 steels analyzed (same provider, different batches) involved variations of up to 0.55° in the bending angle for the same stroke.
  • The use of correlation analysis allowed for knowing the most influential variables of the process in order to predict the bending angle in anticipation of material and thickness changes. The most influential variables on the final bending angle in the U-bending process were, apart from the press stroke, the sheet thickness and the mechanical strength. The least influential variables were the anisotropy and strain hardening exponent.
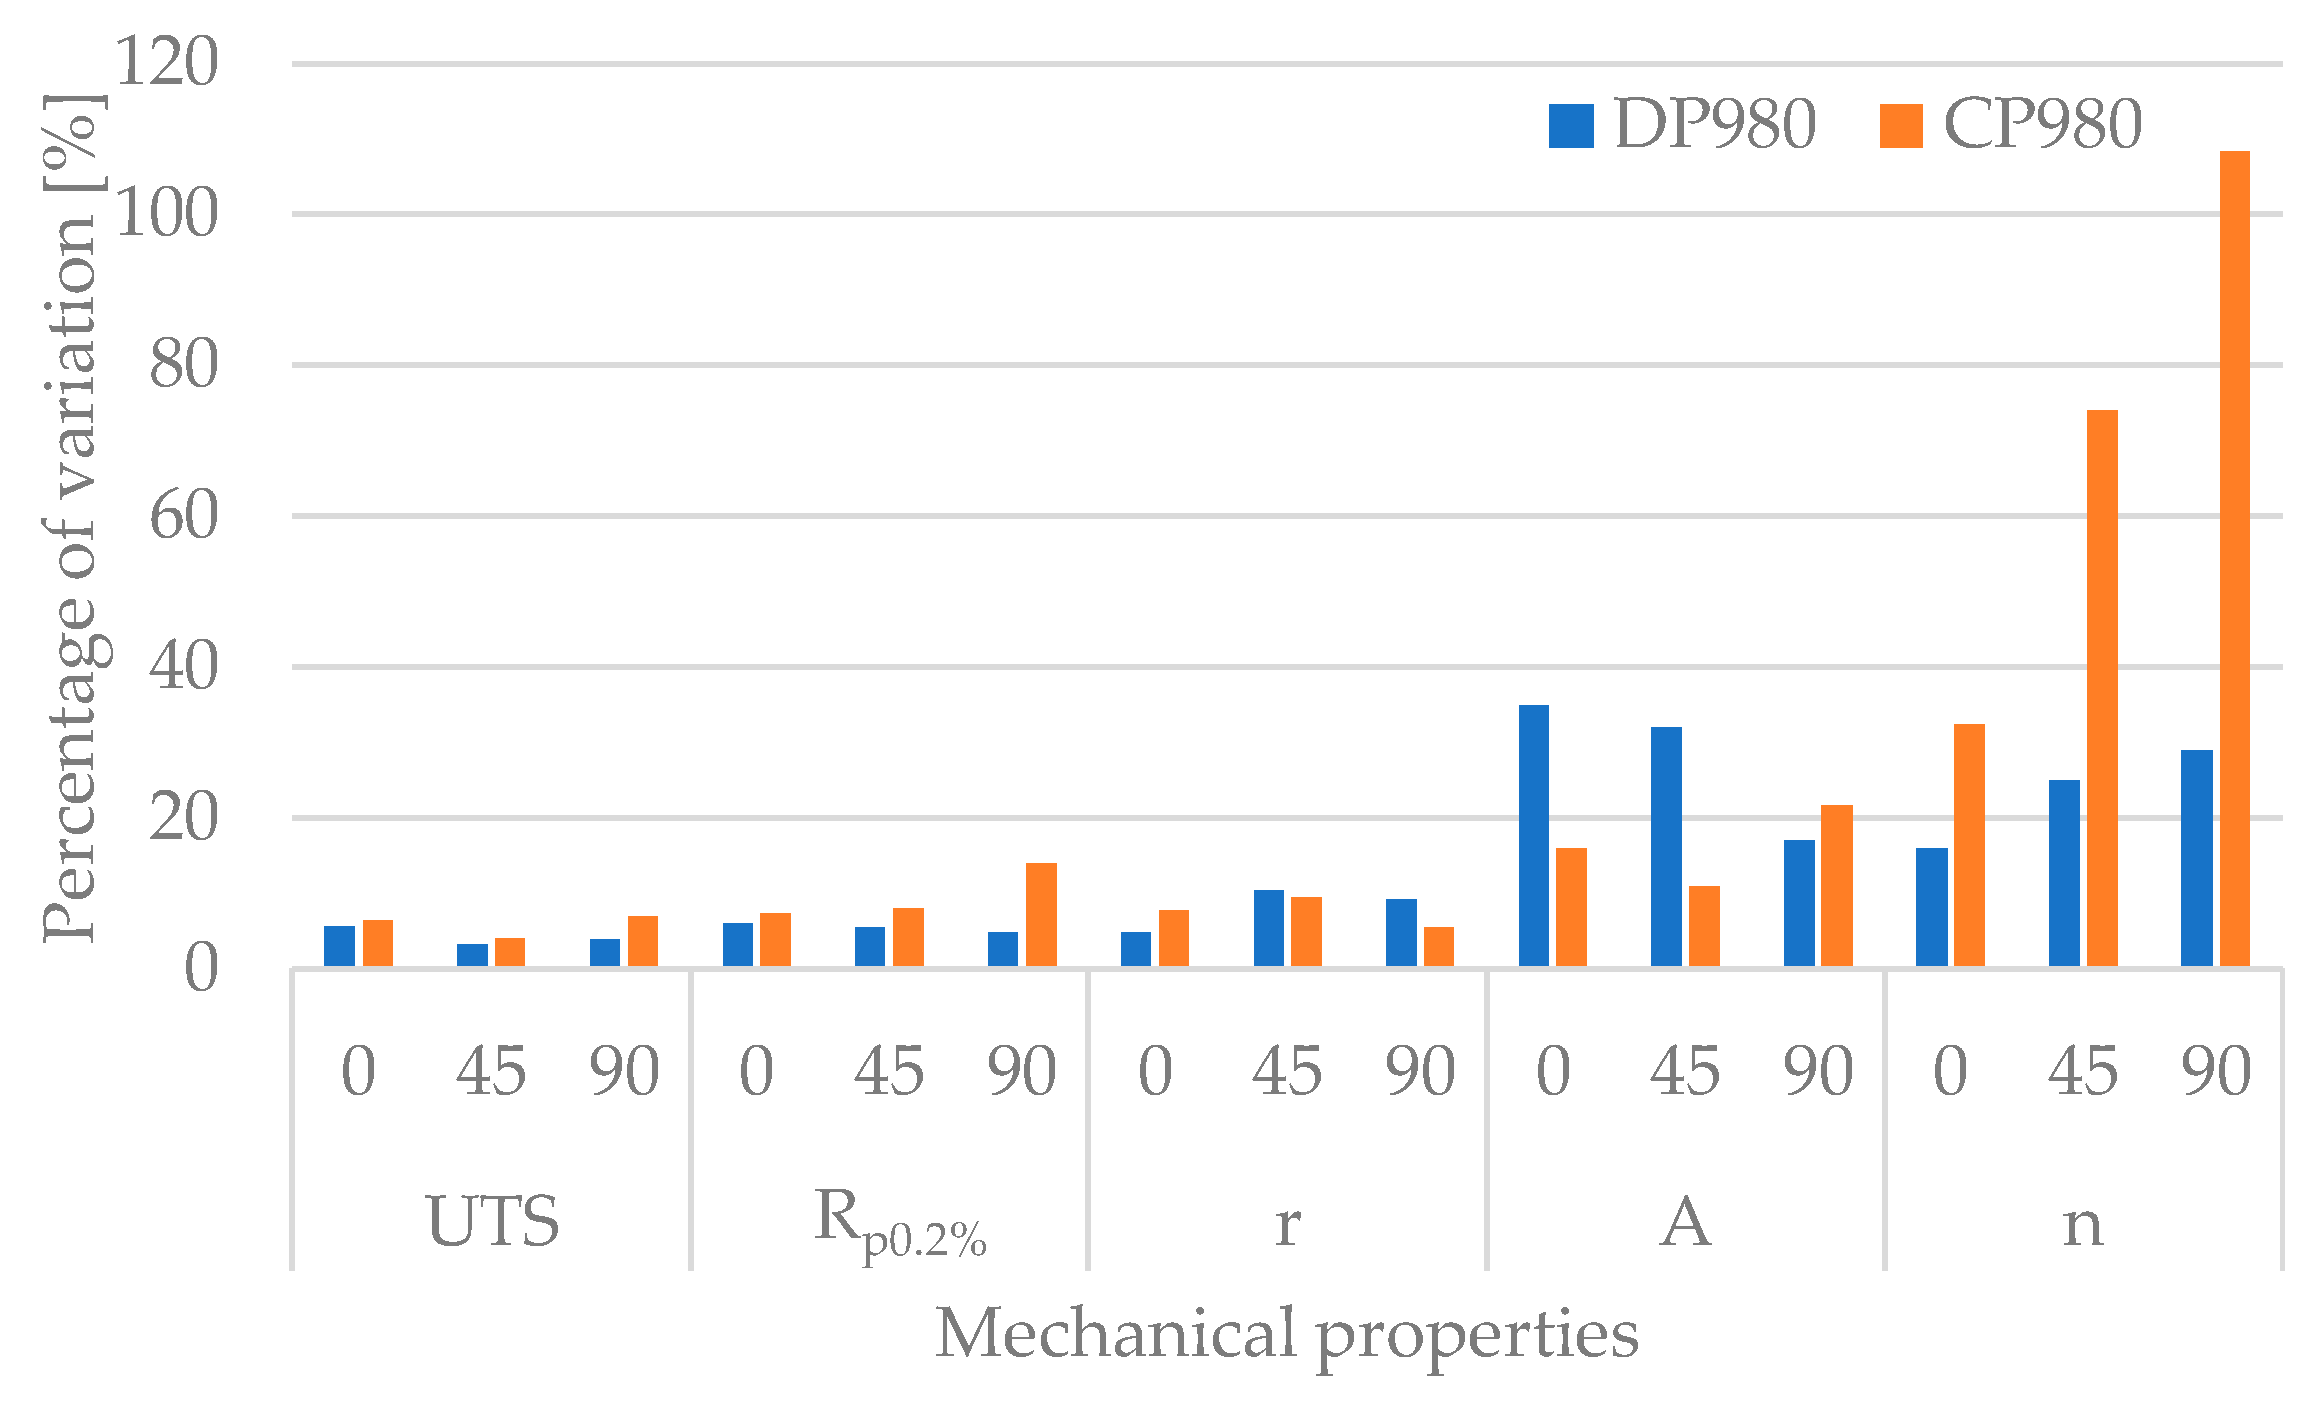
  • Maximum variations in mechanical properties were found for the elongation and strain hardening exponents. For n, a maximum difference of 108.33% was found between batches in CPs. As for A, a maximum variation of 34.92% was found for 0° between DPs. As for grain size, a maximum difference of 43.28% was found between all of the materials.
  • Maximum variations of 9.4% in phase content were observed in DP980 steels, while CP980 steels exhibited variations of 5.6%. The presence of bainite in CP980 2 gave this material a higher work hardening rate and the lowest tensile strength.
These results suggest that a control of the bending angle based on sheet thickness and tensile strength measurements by adjusting the press stroke could be an appropriate strategy.

Author Contributions

Conceptualization, L.M., J.T. and L.G.; methodology, L.M., J.T. and L.G.; software, L.M., J.T. and L.G.; validation, L.M., J.T. and L.G.; formal analysis, L.M., J.T. and L.G.; investigation, L.M., J.T. and L.G.; resources, L.M., J.T. and L.G.; data curation, L.M.; writing—original draft preparation, L.M., J.T. and L.G.; writing—review and editing, L.M., J.T. and L.G.; visualization, L.M., J.T. and L.G.; supervision, L.M., J.T. and L.G.; project administration, L.M., J.T. and L.G.; funding acquisition, L.G. All authors have read and agreed to the published version of the manuscript.

Funding

This research was funded by the European FLATBEND project, Research for Coal and Steel program, call number RFCS-2017 and proposal number 800730.

Data Availability Statement

Not applicable.

Acknowledgments

The authors want to acknowledge Ainhara Garay, Xabier Gomez, and Julen Agirre for the help with the micrographs and grain size calculations.

Conflicts of Interest

The authors declare no conflict of interest.

References

  1. Meng, Q.; Li, J.; Zheng, H. High-efficiency fast-heating annealing of a cold-rolled dual-phase steel. Mater. Des. 2014, 58, 194–197. [Google Scholar] [CrossRef]
  2. Cui, X.; Zhang, H.; Wang, S.; Zhang, L.; Ko, J. Design of lightweight multi-material automotive bodies using new material performance indices of thin-walled beams for the material selection with crashworthiness consideration. Mater. Des. 2011, 32, 815–821. [Google Scholar] [CrossRef]
  3. Mayyas, A.; Shen, Q.; Mayyas, A.; Abdelhamid, M.; Shan, D.; Qattawi, A.; Omar, M. Using Quality Function Deployment and Analytical Hierarchy Process for material selection of Body-In-White. Mater. Des. 2011, 32, 2771–2782. [Google Scholar] [CrossRef]
  4. Rudskoi, A.I.; Parshin, S.G. Advanced Trends in Metallurgy and Weldability of High-Strength Cold-Resistant and Cryogenic Steels. Metals 2021, 11, 1891. [Google Scholar] [CrossRef]
  5. Hilditch, T.B.; de Souza, T.; Hodgson, P. Properties and Automotive Applications of Advanced High-Strength Steels (AHSS); Elsevier: Amsterdam, The Netherlands, 2015. [Google Scholar] [CrossRef]
  6. Rashid, M.S. Dual-phase steels. Ann. Rev. Mater. Sci. 1981, 11, 245–266. [Google Scholar] [CrossRef]
  7. Mirzadeh, H.; Alibeyki, M.; Najafi, M. Unraveling the Initial Microstructure Effects on Mechanical Properties and Work-Hardening Capacity of Dual-Phase Steel. Met. Mater. Trans. A Phys. Metall. Mater. Sci. 2017, 48, 4565–4573. [Google Scholar] [CrossRef]
  8. Sun, S.; Pugh, M. Properties of thermomechanically processed dual-phase steels containing fibrous martensite. Mater. Sci. Eng. A 2002, 335, 298–308. [Google Scholar] [CrossRef]
  9. Barbé, L.; Verbeken, K. Microstructural Characterization of Dual Phase Steels by Means of Electron Microscopy. Mater. Process. Texture Ceram. Transations 2009, 200, 405–411. [Google Scholar] [CrossRef]
  10. Wu, X. Advanced High-Strength Steel Tailor Welded Blanks (AHSS-TWBs); Tailor Welded Blanks for Advanced Manufacturing; Wayne State University: Detroit, MI, USA, 2011; pp. 118–163. [Google Scholar] [CrossRef]
  11. Wu-Rong, W.; Chang-Wei, H.; Zhong-Hua, Z.; Xi-Cheng, W. The limit drawing ratio and formability prediction of advanced high strength dual-phase steels. Mater. Des. 2011, 32, 3320–3327. [Google Scholar] [CrossRef]
  12. Chu, S.; Mao, B.; Hu, G. Microstructure Control and Strengthening Mechanism of High Strength Cold Rolled Dual Phase Steels for Automobile Applications. Acta Metall. Sin. 2022, 58, 551–566. [Google Scholar]
  13. Atzema, E.H. Formability of Auto Components; Elsevier: Amsterdam, The Netherlands, 2017. [Google Scholar] [CrossRef]
  14. Horvath, C. Advanced steels for lightweight automotive structures. LTD 2021. [Google Scholar] [CrossRef]
  15. ArcelorMittal. Complex Phase and Multi-Phase Steels Data Sheet. Available online: https://sanorthamericaprod.blob.core.windows.net (accessed on 21 December 2022).
  16. Pérez, I.; Arribas, M.; Aranguren, I.; Rana, R.; Lahaije, C.; De Caro, D. Processing of new dual-phase (DP) and complex-phase (CP) steels for automotive applications by tailored hot forming routes. AIP Conf. Proc. 2019, 2113, 170008. [Google Scholar] [CrossRef]
  17. Harsch, D.; Heingärtner, J.; Renkci, Y.; Hora, P. Influence of scattering material properties on the robustness of deep drawing processes. In Proceedings of the 10th Forming Technology Forum, January 2018, Enschede, The Netherlands, 12–13 October 2017. [Google Scholar]
  18. Djavanroodi, F.; Salman, A. Variability of Mechanical Properties and Weight for Reinforcing Bar Produced in Saudi Arabia. IOP Conf. Ser. Mater. Sci. Eng. 2017, 230, 012002. [Google Scholar] [CrossRef]
  19. Bright, G.W.; Kennedy, J.; Robinson, F.; Evans, M.; Whittaker, M.; Sullivan, J.; Gao, Y. Variability in the mechanical properties and processing conditions of a High Strength Low Alloy steel. Procedia Eng. 2011, 10, 106–111. [Google Scholar] [CrossRef]
  20. Harsch, D.; Fischer, P.; Berisha, B.; Heingärtner, J.; Renkci, Y.; Hora, P. Considering fluctuations of material properties, stainless steel 1.4301, on manufacturability of kitchen sinks. IOP Conf. Ser. Mater. Sci. Eng. 2018, 418, 012113. [Google Scholar] [CrossRef]
  21. Wiebenga, J.H.; Weiss, M.; Rolfe, B.; van den Boogaard, A.H. Product defect compensation by robust optimization of a cold roll forming process. J. Mater. Process. Technol. 2013, 213, 978–986. [Google Scholar] [CrossRef]
  22. Leu, D.-K.; Zhuang, Z.-W. Springback prediction of the vee bending process for high-strength steel sheets. J. Mech. Sci. Technol. 2016, 30, 1077–1084. [Google Scholar] [CrossRef]
  23. UNE-EN 10351; Chemical Analysis of Ferrous Materials. Inductively Coupled Plasma Optical Emission Spectrometric Analysis of Unalloyed and Low Alloyed Steels. AENOR: Madrid, Spain, 2020.
  24. UNE-EN ISO 6892-1; Materiales Metálicos Ensayo de Tracción Parte 1: Método de Ensayo A Temperatura Ambiente. AENOR: Madrid, Spain, 2020.
  25. ASTM E8/E8M-16a; Standard Test Methods for Tension Testing of Metallic Materials. ASTM: West Conshohocken, PA, USA, 2020.
  26. Hollomon, J.H. Tensile deformation. Trans. Metall. Soc. AIME 1945, 162, 268–290. [Google Scholar]
  27. GOM. ARAMIS [www document]. 2020. Available online: https://www.gom.com/en/products/3d-testing (accessed on 9 February 2021).
  28. Ruiz-Andres, M.; Conde, A.; de Damborenea, J.; Garcia, I. Microstructural and Micromechanical Effects of Cold Roll-forming on High Strength Dual Phase Steels. Mater. Res. 2015, 18, 843–852. [Google Scholar] [CrossRef]
  29. Chang, Y.; Haase, C.; Szeliga, D.; Madej, L.; Hangen, U.; Pietrzyk, M.; Bleck, W. Compositional heterogeneity in multiphase steels: Characterization and influence on local properties. Mater. Sci. Eng. A 2021, 827, 142078. [Google Scholar] [CrossRef]
  30. Commitee, A.H. Metallography and Microstructures. In ASM Handbook; ASM International: Materials Park, OH, USA, 1992; Volume 9. [Google Scholar]
  31. Saai, A.; Hopperstad, O.; Granbom, Y.; Lademo, O.-G. Influence of Volume Fraction and Distribution of Martensite Phase on the Strain Localization in Dual Phase Steels. Procedia Mater. Sci. 2014, 3, 900–905. [Google Scholar] [CrossRef]
  32. Efthymiadis, P.; Hazra, S.; Clough, A.; Lakshmi, R.; Alamoudi, A.; Dashwood, R.; Shollock, B. Revealing the mechanical and microstructural performance of multiphase steels during tensile, forming and flanging operations. Mater. Sci. Eng. A 2017, 701, 174–186. [Google Scholar] [CrossRef]
  33. Alharbi, K.; Ghadbeigi, H.; Efthymiadis, P.; Zanganeh, M.; Celotto, S.; Dashwood, R.; Pinna, C. Damage in dual phase steel DP1000 investigated using digital image correlation and microstructure simulation. Model. Simul. Mater. Sci. Eng. 2015, 23, 8. [Google Scholar] [CrossRef]
  34. Randle, V. Electron backscatter diffraction: Strategies for reliable data acquisition and processing. Mater. Charact. 2009, 60, 913–922. [Google Scholar] [CrossRef]
  35. Rousseau, R. CHAPTER 4–Statistics. In Becoming Metric-Wise; Rousseau, R., Egghe, L., Guns, R., Eds.; Elsevier: Amsterdam, The Netherlands, 2018. [Google Scholar]
  36. Kalhor, A.; Taheri, A.K.; Mirzadeh, H.; Uthaisangsuk, V. Processing, microstructure adjustments, and mechanical properties of dual phase steels: A review. Mater. Sci. Technol. 2021, 37, 561–591. [Google Scholar] [CrossRef]
  37. Mishnev, R.; Borisova, Y.; Kniaziuk, T.; Gaidar, S.; Kaibyshev, R. Quench and Tempered Embrittlement of Ultra-High-Strength Steels with Transition Carbides. Metals 2023, 13, 1399. [Google Scholar] [CrossRef]
  38. Mao, J.; Chen, K.; Chen, S. Microstructure and mechanical properties of the 6 wt% Mn-Doped martensitic steel strengthened by Cu/NiAl nanoparticles. Materials 2023, 16, 241. [Google Scholar] [CrossRef]
  39. Zurutuza, I.; Isasti, N.; Detemple, E.; Schwinn, V.; Mohrbacher, H.; Uranga, P. Toughness Property Control by Nb and Mo Additions in High-Strength Quenched and Tempered Boron Steels. Metals 2021, 11, 95. [Google Scholar] [CrossRef]
  40. Salas-Reyes, A.E.; Altamirano-Guerrero, G.; Deaquino, R.; Salinas, A.; Lara-Rodriguez, G.; Figueroa, I.A.; González-Parra, J.R.; Mintz, B. The Hot Ductility, Microstructures, Mechanical Properties and Corrosion Resistance in an Advanced Boron-Containing Complex Phase Steel Heat-Treated Using the Quenching and Partitioning (Q&P) Process. Metals 2023, 13, 257. [Google Scholar] [CrossRef]
  41. Bayram, A.; Uǧuz, A.; Ula, M. Effects of Microstructure and Notches on the Mechanical Properties of Dual-Phase Steels. Mater. Charact. 1999, 43, 259–269. [Google Scholar] [CrossRef]
  42. Bag, A.; Ray, K.K.; Dwarakadasa, E.S. Influence of martensite content and morphology on tensile and impact properties of high-martensite dual-phase steels. Metall. Mater. Trans. A Phys. Metall. Mater. Sci. 1999, 30, 1193–1202. [Google Scholar] [CrossRef]
  43. Ohmori, A.; Torizuka, S.; Nagai, K. Strain-hardening due to Dispersed Cementite for Low Carbon Ultrafine-grained Steels. ISIJ Int. 2004, 44, 1063–1071. [Google Scholar] [CrossRef]
  44. de la Concepción, V.L.; Lorusso, H.N.; Svoboda, H.G. Effect of Carbon Content on Microstructure and Mechanical Properties of Dual Phase Steels. Procedia Mater. Sci. 2015, 8, 1047–1056. [Google Scholar] [CrossRef]
  45. Gürol, U.; Kurnaz, S.C. Effect of carbon and manganese content on the microstructure and mechanical properties of high manganese austenitic steel. J. Min. Metall. Sect. B Met. 2020, 56, 171–182. [Google Scholar] [CrossRef]
  46. Kaar, S.; Krizan, D.; Schneider, R.; Béal, C.; Sommitsch, C. Effect of Manganese on the Structure-Properties Relationship of Cold Rolled AHSS Treated by a Quenching and Partitioning Process. Metals 2019, 9, 1122. [Google Scholar] [CrossRef]
  47. Matsuda, H.; Mizuno, R.; Funakawa, Y.; Seto, K.; Matsuoka, S.; Tanaka, Y. Effects of auto-tempering behaviour of martensite on mechanical properties of ultra high strength steel sheets. J. Alloys Compd. 2013, 577, S661–S667. [Google Scholar] [CrossRef]
  48. Hasegawa, K.; Kawamura, K.; Urabe, T.; Hosoya, Y. Effects of Microstructure on Stretch-flange-formability of 980 MPa Grade Cold-rolled Ultra High Strength Steel Sheets. ISIJ Int. 2004, 44, 603–609. [Google Scholar] [CrossRef]
  49. Bleck, W.; Papaefthymiou, S.; Frehn, A. Microstructure and Tensile Properties in Dual Phase and Trip Steels. Steel Res. Int. 2004, 75, 704–710. [Google Scholar] [CrossRef]
  50. Zhang, J.; Di, H.; Deng, Y.; Misra, R. Effect of martensite morphology and volume fraction on strain hardening and fracture behavior of martensite–ferrite dual phase steel. Mater. Sci. Eng. A 2015, 627, 230–240. [Google Scholar] [CrossRef]
  51. Song, R.; Ponge, D.; Raabe, D.; Speer, J.; Matlock, D. Overview of processing, microstructure and mechanical properties of ultrafine grained bcc steels. Mater. Sci. Eng. A 2006, 441, 1–17. [Google Scholar] [CrossRef]
  52. Ramazani, A.; Mukherjee, K.; Prahl, U.; Bleck, W. Modelling the effect of microstructural banding on the flow curve behaviour of dual-phase (DP) steels. Comput. Mater. Sci. 2012, 52, 46–54. [Google Scholar] [CrossRef]
  53. Adachi, Y.; Wakita, M.; Beladi, H.; Hodgson, P.D. The formation of ultrafine ferrite through static transformation in low carbon steels. Acta Mater. 2007, 55, 4925–4934. [Google Scholar] [CrossRef]
  54. Calcagnotto, M.; Ponge, D.; Raabe, D. Effect of grain refinement to 1μm on strength and toughness of dual-phase steels. Mater. Sci. Eng. A 2010, 527, 7832–7840. [Google Scholar] [CrossRef]
Figure 1. Elongation versus tensile strength for different classes of sheet steel (adapted from Ref. [4]).
Metals 13 01603 g001
Figure 2. Scheme of the U-bending demonstrator combining punch stroke with cam displacement. α is the bend angle after the springback. Note that bigger α means a lower springback of the product.
Metals 13 01603 g002
Figure 3. Measuring system set-up. The system measures the final part resulting from the U-bending process.
Metals 13 01603 g003
Figure 4. Details of the microstructure of each material: (a) DP980 1, (b) DP980 2, (c) DP980 3, (d) CP980 1, and (e) CP980 2.
Metals 13 01603 g004
Figure 5. Details of the microstructures obtained using an SEM microscope: (a) DP980 1, (b) DP980 2, (c) DP980 3, (d) CP980 1, and (e) CP980 2. Red arrows represent bainite, orange arrows represent martensite, and blue arrows represent ferrite.
Metals 13 01603 g005
Figure 6. IPF maps of the analyzed DP980 and CP980: (a) DP980 1, (b) DP980 2, (c) DP980 3, (d) CP980 1, and (e) CP980 2.
Metals 13 01603 g006
Figure 7. Engineering stress–plastic strain curves of DP980 and CP980: (a) rolling direction of 0°, (b) rolling direction of 45°, and (c) rolling direction of 90°.
Metals 13 01603 g007
Figure 8. Mechanical properties of the materials analyzed for each rolling direction: (a) 0.2% offset yield strength Rp 0.2%, (b) UTS, (c) elongation (A); (d) Lankford coefficients (r), and (e) strain hardening exponent (n).
Metals 13 01603 g008aMetals 13 01603 g008b
Figure 9. Bend angle after the springback [°] vs. press stroke [mm] in standardized values for all of the parts tested.
Metals 13 01603 g009
Figure 10. Pearson correlation coefficients for each variable regarding the final bending angle.
Metals 13 01603 g010
Figure 11. Percentage of variation [%] f each mechanical property measured for each rolling direction. Values are obtained for both DP980 and CP980 batches received.
Metals 13 01603 g011
Figure 12. Mean grain size vs. tensile strength (UTS), elongation (A), and hardening coefficient (n) for each material.
Metals 13 01603 g012
Table 1. Materials selected for the study.
MaterialSpecifications
DP980 1Supplier No. 1
Batch 1
Annealed, skin-passed
DP980 2Supplier No. 1
Batch 2
Annealed, skin-passed
DP980 3Supplier No. 2
Batch 3
Annealed, skin-passed
CP980 1Supplier No. 3
Batch 4
Annealed
CP980 2Supplier No. 3
Batch 5
Annealed
Table 2. Chemical composition of each investigated high-strength steel (in wt.%).
MaterialCSiMnPSCrNiB (ppm)Cu MoNNbTiVSol-Al
DP980 10.06850.2022.5250.0180.0010.9650.014240.0170.025-0.050.02050.0040.032
DP980 20.07180.1062.4690.01020.00130.9470.015260.0230.023-0.0510.02190.0040.034
DP980 30.1500.2011.890.0190.003-----0.053---0.032
CP980 10.0980.342.220.01300.124-0.0025(%)-0.001-0.0020.00240.0050.0046
CP980 20.10200.352.180.0100.11800.0021(%)0.0080.001-0.0020.00240.0050.0046
Table 3. Volumetric fraction of ferrite (Vα) and martensite and bainite (VM/B) phases in each material.
MaterialDP980 1DP980 2DP980 3CP980 1CP980 2
Ferrite fraction Vα [%]42.936.733.530.925.2
Martensite and bainite fraction VM/B [%]57.163.366.569.174.8
Table 4. Grain size of each specimen analyzed.
MaterialDP980 1DP980 2DP980 3CP980 1CP980 2
Arithmetic average grain size   ( A ) [µm]1.491.341.621.921.83
Weighted average grain size   ( W ) [µm]3.343.045.375.606.37
Max. grain size [µm]9.439.8015.7014.5519.68
Min. grain size [µm]0.450.450.450.280.45
Table 5. Average sheet thickness of the 250 specimens analyzed.
MaterialDP980 1DP980 2DP980 3CP980 1CP980 2
Sheet thickness [mm]1.461.491.491.501.49
Table 6. Maximum variability in the bending angle after the springback for the five materials analyzed.
MaterialDP980 1DP980 2DP980 3CP980 1CP980 2
Variability in bending angle after springback [°]0.270.480.240.200.43
Table 7. Percentage of variation [%] for each mechanical property measured for each rolling direction. Values obtained for both DP980 and CP980 batches received. Percentages are calculated with respect to the minimum value.
UTS [MPa]Rp0.2% [MPa]r [-]A [%]n [-]
RD [°]DPs [%]CPs [%]DPs [%]CPs [%]DPs [%]CPs [%]DPs [%]CPs [%]DPs [%]CPs [%]
05.556.405.997.324.847.7234.9215.9615.9132.43
453.214.045.537.9410.379.5132.0610.9025.0074.07
903.906.894.8413.959.165.4717.0321.6128.95108.33
Disclaimer/Publisher’s Note: The statements, opinions and data contained in all publications are solely those of the individual author(s) and contributor(s) and not of MDPI and/or the editor(s). MDPI and/or the editor(s) disclaim responsibility for any injury to people or property resulting from any ideas, methods, instructions or products referred to in the content.

