Article

Determination of Interaction Parameters between Mn and Al and the Influence of Mn on Al2O3 Inclusions Formation in High Mn and Al Content Fe-Mn-Al-O Melts at 1873 K

1
Department of Physical Chemistry of Metallurgy, School of Metallurgical and Ecological Engineering, University of Science and Technology Beijing, Beijing 100083, China
2
Safety and Environmental Engineering Technology Institute, Sinosteel Group, Maanshan 243071, China
3
Materials Technology Research Institute, HBIS Group, Shijiazhuang 050023, China
*
Authors to whom correspondence should be addressed.
Metals 2023, 13(8), 1500; https://doi.org/10.3390/met13081500
Submission received: 21 July 2023 / Revised: 14 August 2023 / Accepted: 17 August 2023 / Published: 21 August 2023
(This article belongs to the Special Issue Process and Numerical Simulation of Oxygen Steelmaking)

Abstract

:
For the purpose of determining the interaction parameters between Mn and Al, and the influence of Mn on Al2O3 inclusions formation in the Fe-Mn-Al-O melts with high Mn and Al contents, three groups of Fe-Mn-Al-O melts with the initial Al content of 3, 5, and 7 mass% and different Mn contents were equilibrated with pure solid Al2O3 in an Al2O3 crucible at 1873 K and Ar-H2 atmosphere. Then, the interaction parameters between Mn and Al were deduced using the WIPF (Wagner’s Interaction Parameter Formalism) and the R-K polynomial (Redlich-Kister type polynomial), respectively. From the WIPF, the first- and second-order interaction parameters, e Al Mn and r Al Mn , were determined to be 0.0292 and −0.00016, respectively. From the R-K polynomial, the binary interaction parameters, Ω Mn - Al 0 and Ω Mn - Al 1 , were determined to be 73,439 J/mol and −34,919 J/mol, respectively. The applicability of the WIPF to high Mn and Al content Fe-Mn-Al-O melts was investigated by comparing the Al activity calculated by the WIPF and the R-K polynomial using the obtained data. The results showed that WIPF can be used in high Mn and Al content melts in the current concentration range. Further from the iso-activity contours of Al, the activity of Al increases with increasing Al or Mn content. Finally, the thermodynamic calculations show that the addition of Mn decreases the equilibrium O content at the same Al content, making the formation of Al2O3 inclusions easier.

1. Introduction

Advanced High Strength Steels (AHSS) [1,2,3,4] have been developed vigorously due to their excellent performance [5,6]. As one of the most promising steels of AHSS, the Twinning Induced Plasticity (TWIP) steel with high Mn and Al steels has attracted a lot of attention. However, the large amounts of Mn (15–20 mass%) and Al (≥1 mass%) added into the liquid steels cause great challenges to the steelmaking and casting processes [7,8]. Thus, apart from the study on the performance of AHSS [9,10,11], considerable attention has been paid to the fundamental research of the smelting process [12,13,14,15,16,17], such as the Al deoxidation equilibrium and the formation of Al2O3 inclusions, which have significant impacts on real production. As such, the thermodynamic properties of high Mn and Al liquid steels are crucial, and an accurate thermodynamic database about the Fe-Mn-Al-O system is desired [18].
However, the study of interaction parameters between Mn and Al with high contents has rarely been reported. In the existing studies, the first-order interaction parameter between Mn and Al, e Al Mn , was determined as −0.04 by Mikhailov [19] under low Mn and Al contents ([mass% Mn] ≤ 0.7, [mass% Al] ≤ 0.05). Clearly, these data cannot fully satisfy the description for liquid steel with high Mn and Al contents due to the low concentration range involved in the study and the absence of a second-order interaction parameter. The results obtained by Pak [14], by studying the Fe-Mn-Al-N system, showed that the first- and second-order interaction parameters between Mn and Al are both 0 ([mass% Mn] ≤ 22, [mass% Al] ≤ 1.8, 1823–1873 K). Evidently, there is an obvious difference between these two studies in the value of e Al Mn . In addition, although this result was obtained from a wider concentration range, the applicability of molten steel with a higher Al content is still unknown. Hence, the interaction parameters between Mn and Al of the Fe-Mn-Al-O system with high Mn and Al contents are worth studying.
In Pak’s study, WIPF (Wagner’s Interaction Parameter Formalism) was used to fit the parameters. Nevertheless, the applicability of WIPF to high-concentration iron-based melts has been controversial because it is thermodynamically inconsistent at finite concentrations, which will lead to significant errors at high concentrations [20,21,22]. Thus, several thermodynamic models were developed to apply to high-concentration systems. Among these models, the Redlich-Kister Type Polynomial (R-K polynomial) [23,24,25,26,27] has been widely used to express the excess Gibbs energy change of mixing. The R-K polynomial is suitable for high-concentration systems and is easier to expand Darken’s quadratic formalism to multi-component alloy systems, while it was converted from the quadratic formalism. As such, it is worth using the R-K polynomial to analyze Fe-Mn-Al-O melts with high Mn/Al contents. Additionally, the discrepancies in the results between the R-K polynomial and WIPF should also be evaluated to clarify the application concentration range of WIPF in the Fe-Mn-Al-O system.
The aim of this study is to attain the interaction parameters between Mn and Al over wide content ranges. A series of Fe-Mn-Al-O melts were equilibrated with pure solid Al2O3 at 1873 K (1600 °C) under an Ar-H2 mixture atmosphere, and the CaO-Al2O3-CaF2 flux was adopted to avoid Mn volatilization and to remove the Al2O3 inclusions. The WIPF and R-K polynomial were used to calculate the parameters. Moreover, the applicability of WIPF to Fe-Mn-Al-O systems with high Mn/Al contents was evaluated by comparing the Al activity calculated by these two models. Additionally, the iso-activity contours of Al were calculated to clarify the influence of the Mn content on Al activity. The impact of Mn on the Al-O equilibrium and the formation of Al2O3 inclusions were also evaluated.

2. Experimental

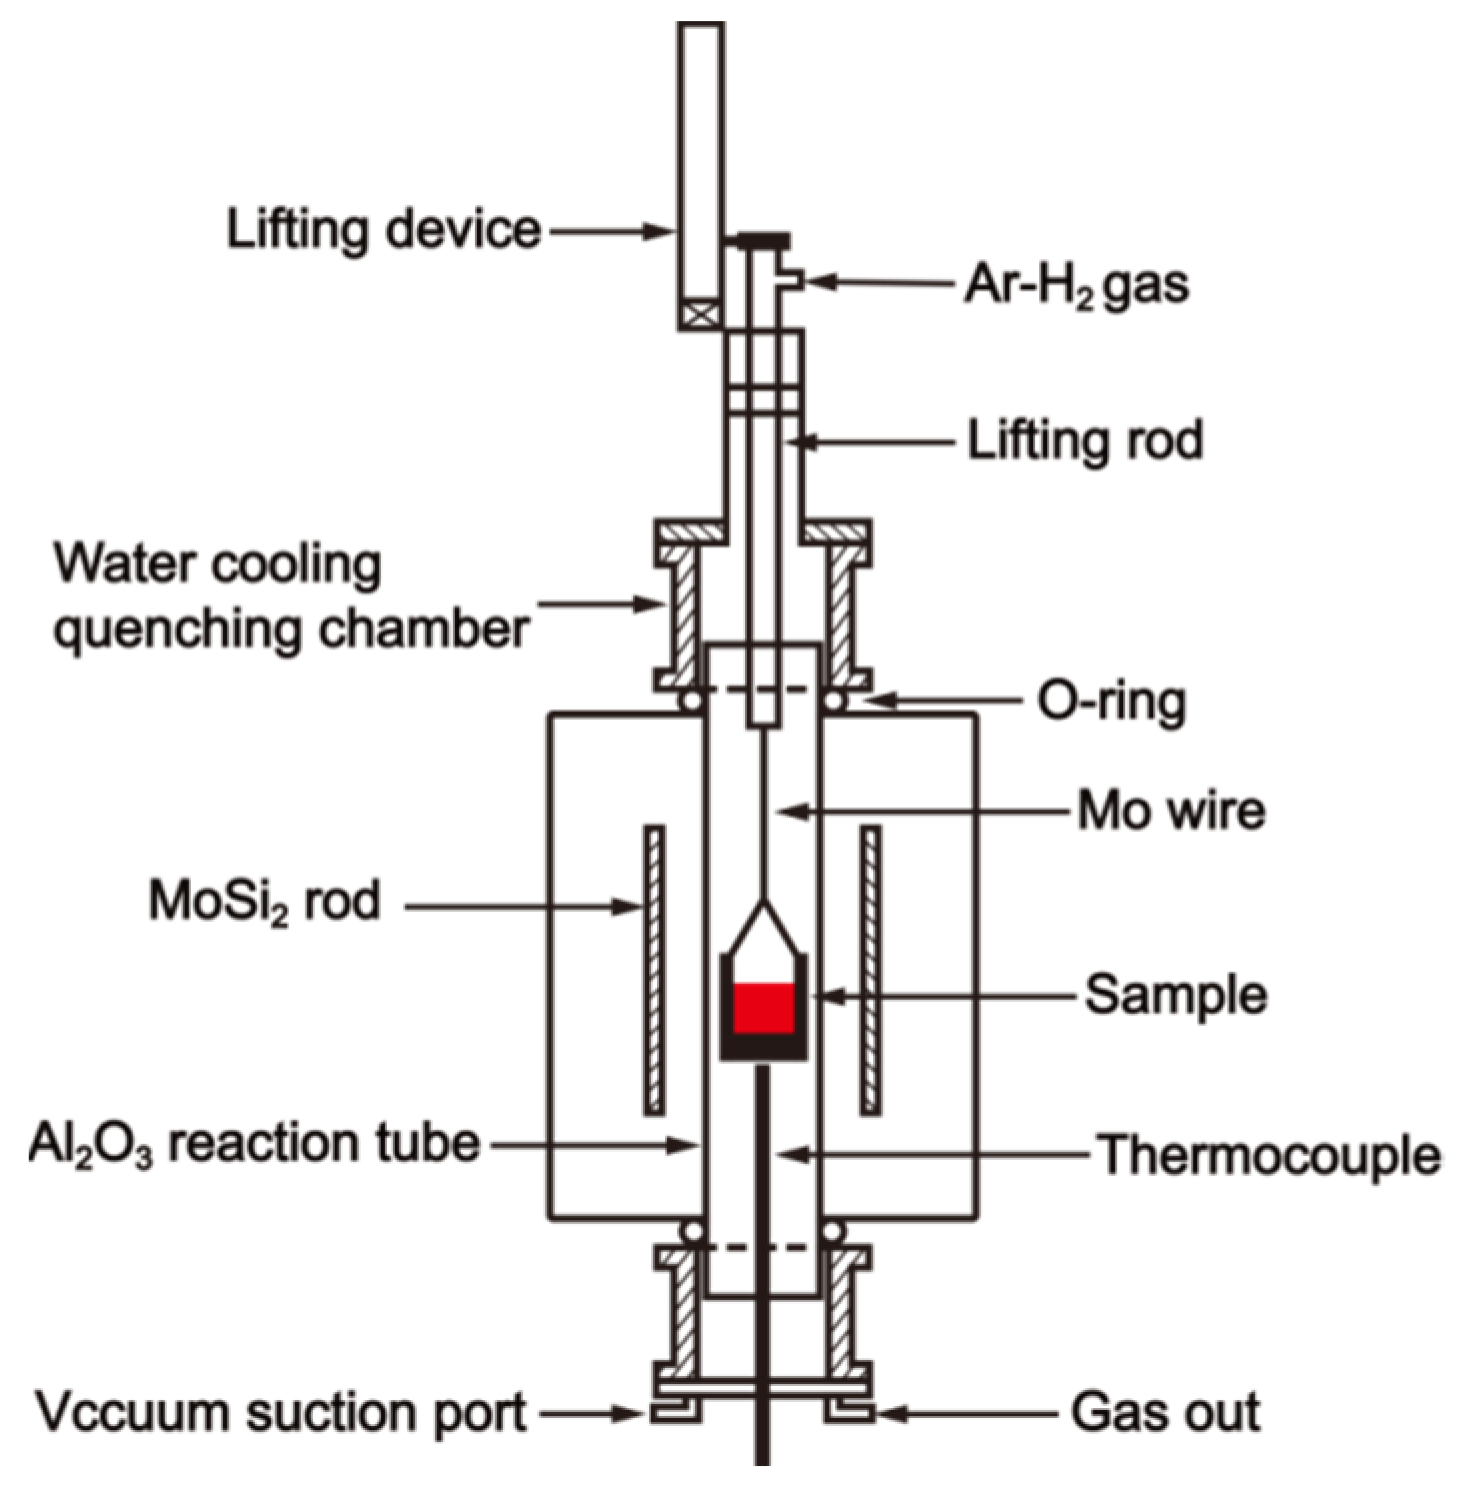
2.1. Materials and Experimental Apparatus

The raw materials used in this experiment were the same as those used in previous studies [28]. Additionally, the purity of the Mn powder was more than 99.99%.
All experiments were carried out in a resistance furnace as shown in Figure 1. The resistance furnace was heated by MoSi2. A W-Re5/26 thermocouple was used to monitor the temperature of the samples, which was placed at the bottom of the graphite crucible. A B thermocouple (Pt-6 pct Rh/Pt-30 pct Rh) was used to measure the temperature of the furnace, and a PID controller was used to control the temperature of the furnace with an accuracy of ±1 K. An Al2O3 tube, well sealed by Viton O-rings, was used as the reaction chamber. To ensure rapid cooling of the samples, a quenching chamber was assembled in the upper part of the Al2O3 tube. Al2O3 crucibles were used and put into graphite crucibles to reduce the partial pressure of oxygen. The crucible was suspended by a Mo wire. The Mo wire was connected to a lifting device equipped on the top of the furnace, which was used to lift the crucible from the temperature-even zone to the quenching chamber within 2 s after the equilibrium reaction. The Ar-H2 gas mixture was well mixed in a gas tank before flowing into the furnace. The total gas flow rate was 200 mL/min, and it was controlled by mass flow meters.

2.2. Experimental Procedures

Three groups of melts with the initial Al contents of 3, 5, and 7 mass% and different Mn contents were equilibrated at 1873 K (1600 °C). The main procedures of the experiment are as follows:
(a)
An Al2O3 crucible was placed in a graphite crucible. 12 g of a Fe, Mn, and Al powder mixture were placed in an Al2O3 crucible. 4 g of flux composed of 35 mass% CaO, 60 mass% Al2O3 and 5 mass% CaF2 were placed on top of the metal powder mixture.
(b)
The furnace was heated up to 1873 K (1600 °C) with a heating rate of 2 K/min. The Ar-H2 gas mixture, with a volume ratio of 9:1, was kept at 200 mL/min throughout the entire experimental process.
(c)
The crucible was moved from the water-cooled chamber to the temperature-even zone.
(d)
After 2 h, the sample was lifted into the water-cooled quenching chamber for about 1.5 s by the lifting device mainly consisted of a high-speed motor, and then quenched with high-flow rate argon gas for 10 min. Subsequently, the metal phase was carefully separated, and the surface of the metal was ground off by 2 mm.
(e)
The metal compositions were determined using Inductively Couple Plasma-Atomic Emission Spectrometry (ICP-AES, Optima5300dv, PerkinElmer, Waltham, MA, USA). The morphology and composition of inclusions inside the samples were observed using the scanning electron microscope with an energy-dispersive spectrometer (SEM-EDS, ULTRA 55, Oberkochen, Germany). The O content in the melt was detected by inert gas fusion infrared absorption spectroscopy. Flux composition was determined by an X-ray fluorescence analyzer (XRF-1800, Shimadzu Corporation, Kyoto, Japan).

2.3. Experimental Design

When studying the thermodynamic properties of the Fe-Mn-Al-O system with a high Mn content, the volatilization of Mn will seriously affect the accuracy of the experiment. A flux, therefore, is needed to prevent the volatilization of Mn. Peak added CaO flux on the top of Fe-Al-O and Fe-Mn-Al-O melts to remove Al2O3 inclusions and eliminate the influence of inclusions on the determination of O content when studying Al deoxidation equilibria [5,29]. It was found that the flux composed of about CaO (38 mass%)-Al2O3 (62 mass%) would not deteriorate equilibria in Fe-Mn-Al-O melts saturated with pure Al2O3 ( a Al 2 O 3 = 1 ). Additionally, it was already verified that the Fe-Al-O melt is equilibrated with the dispersed Al2O3 inclusions in the melt rather than the Al2O3 in the top slag [30,31,32]. This is because the melt/inclusion interface is much larger than the melt/slag interface, and the mass transfer controlling reaction equilibria are therefore considered much faster for the small inclusions than at the slag–metal interface [32]. According to these, a flux composed of CaO (30 mass%)-Al2O3 (65 mass%)-CaF2 (5 mass%) was used in the present study not only to remove inclusions, but also to prevent manganese volatilization. A small amount of CaF2 was added to increase the fluidity, and it was proved that the present flux will also not deteriorate equilibria between the melt saturated with pure solid Al2O3 ( a Al 2 O 3 = 1 ) [28].
To verify that the inside of the melt is saturated with pure solid Al2O3 by this method, a series of preliminary experiments with different Mn and Al contents were carried out. The SEM images of the samples are shown in Figure 2.
It can be seen from Figure 2a that the cleanliness of the metal is good, and inclusions are rarely observed, demonstrating that the flux plays a good role in removing inclusions and ensuring the accuracy of determination on dissolved O content. Meanwhile, there are still some inclusions smaller than 5 μm in the metals, as shown in Figure 2b, which were determined to be Al2O3 inclusions. Thus, it can be deduced that the melt was saturated with pure solid Al2O3 and equilibrated with pure solid Al2O3 ( a Al 2 O 3 = 1 ), which agreed with Peak’s results [5,29]. Additionally, no volatilization of Mn was found after 2 h. This method can therefore be used to study the interaction parameters in the Fe-Mn-Al-O system.
On the other hand, it will contaminate the equipment when using inert gas fusion infrared absorption spectroscopy to determine the O content in high Mn content molten steel since Mn is easy to volatilize, causing large errors in the measurement results. Hence, the Sn bath was used to measure the O content in the Fe-Mn-O system with high Mn contents [33]. However, in the preliminary determination, the O contents in Sn capsules were not exactly the same, and the difference was about ±3 ppm. It was found that when the contents of Mn or Al are similar and the Al content is in the concentration range of 1–10 mass%, the O contents are very low and the content difference is very small [5,33]. The difference value is even less than the detection error (±3 ppm). Correspondingly, the O content measurement by the Sn bath may cause a 10–50% error, which will cause a large error in the regression results of the thermodynamic models.
As such, owing to the Mn contents being similar and the Al contents being almost the same of the two adjoining experiments in each group in the present study, the O contents of the adjoining experiments should be considered the same in the model analysis process, according to the above analysis. Only the O contents in melts with Mn contents less than 3 mass% in the three groups were detected to evaluate the difference in O content between two adjoining experiments in each group.

3. Results and Discussion

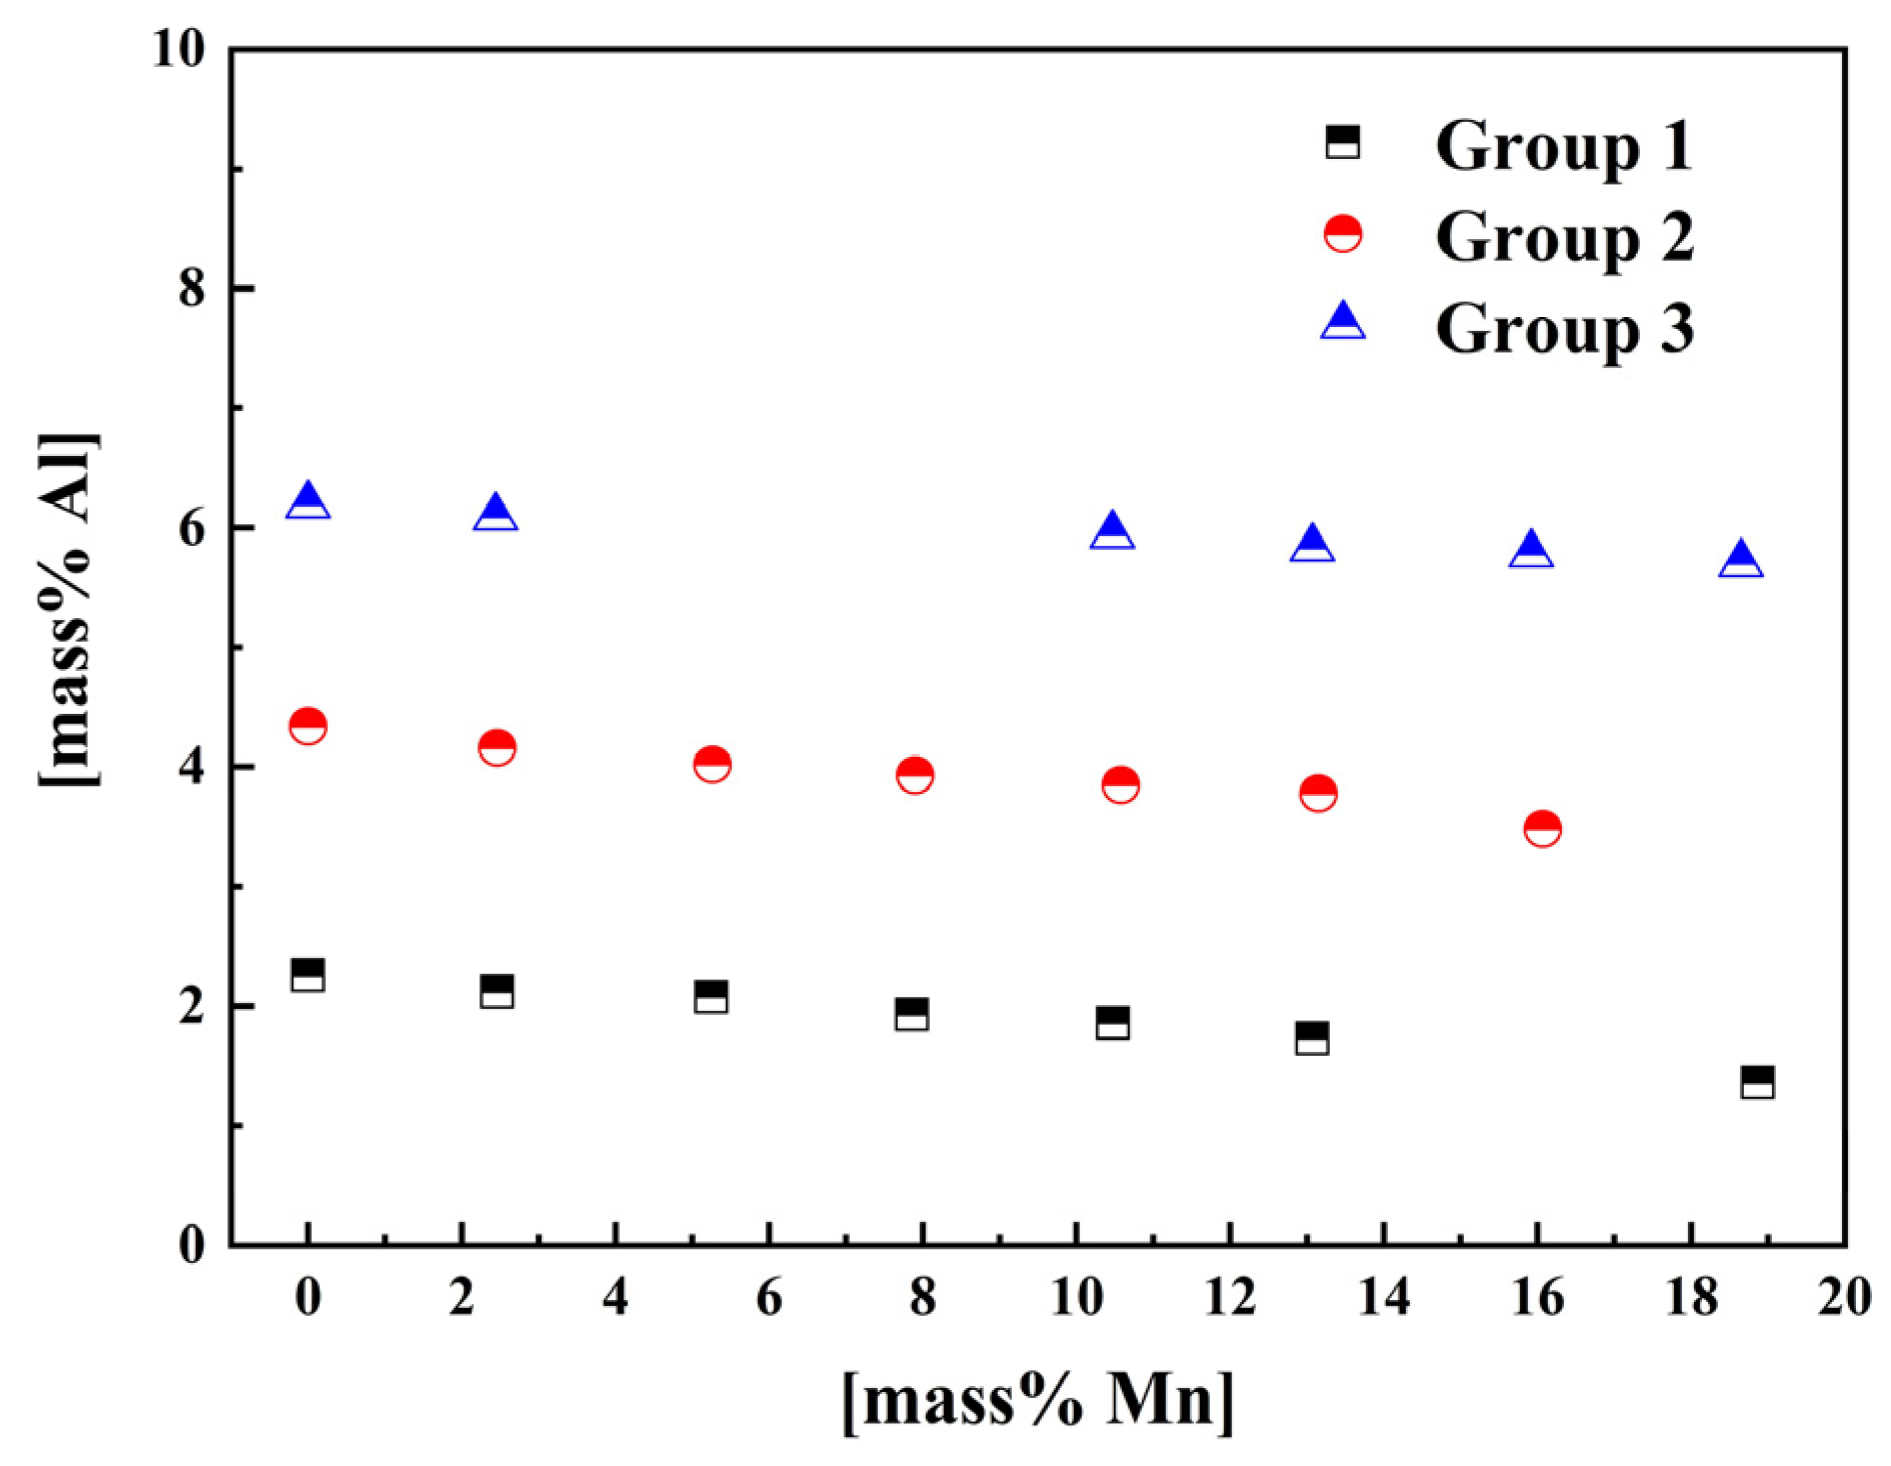
3.1. Experimental Results

The experimental results are shown in Table 1, which show that the flux composition changed little before and after equilibrium, and the flux composition of each group was very close. It should be noted that each experiment was repeated multiple times. The difference between the measurement results of Mn and Al with the same initial content of the melt after equilibrium is within 10%. Additionally, Figure 3 shows the influence of Mn content in melt on Al content in the Al2O3 saturated Fe-Mn-Al-O melts. It can be clearly seen from the figure that the Al content decreases with the increase in Mn content in Fe-Mn-Al-O melts in the same group. This result indicates that although the Al content does not change significantly with the increase in Mn content, the interaction parameters between Mn and Al cannot be neglected.
In addition, it can be inferred from Table 1 that the O contents in the samples are very low, and the O contents of two adjoining experiments in each group are almost the same. As such, it can be confirmed that the O contents of two adjoining experiments in each group should be very similar, and this conclusion provides a basis for subsequent model analysis. Furthermore, XRF was used to detect the composition of slag, which is used to evaluate the composition and difference of slag after equilibrium. The detection error may be the main reason for the inconsistency between the detection amount and the added amount of slag. Then, the very close detection results of all groups of slag also indicate that the equilibrium of the present study is established within the metal melt, rather than between slag and metal, as the compositions of slag are almost the same under different metal contents.

3.2. WIPF Analysis

The expression of the [Al] and [O] reaction in molten steel is as follows. The [Al] and [O] represent the dissolved Al and O in the melt.
2 [ Al ] + 3 [ O ] = Al 2 O 3 ( s )
The equilibrium constant K of Equation (1) can be written as follows:
ln K   = ln a Al 2 O 3 2 ln a [ Al ] 3 ln a [ O ]
where a Al 2 O 3 , a [ Al ] , and a [ O ] are the activities of Al2O3, Al, and O in the melts, respectively. At a certain temperature, the value of K can be regarded as a constant. The activity of Al2O3, a Al 2 O 3 , is unity. Correspondingly, the following relation can be obtained:
log [ mass % Al ] n + log f Al , n + 1 . 5 log [ mass % O ] n + 1 . 5 log f O , n = log [ mass % Al ] n + 1 + log f Al , n + 1 + 1 . 5 log [ mass % O ] n + 1 + 1 . 5 log f O , n + 1 log [ mass % Al ] n + log f Al , n + 1 . 5 log f O , n = log [ mass % Al ] n + 1 + log f Al , n + 1 + 1 . 5 log f O , n + 1
where n represents the experiment number in each group. [ mass % X ] is the mass fraction of the components. f Al and f O are the activity coefficient of Al and O, respectively. The expressions for log f Al and log f O can be expressed as Equation (4), shown as follows:
log f Al = e Al Al [ mass % Al ] + e Al Mn [ mass % Mn ] + e Al O [ mass % O ] + r Al Al [ mass % Al ] 2 + r Al Mn [ mass % Mn ] 2 + r Al O [ mass % O ] 2 log f O = e O Al [ mass % Al ] + e O Mn [ mass % Mn ] + e O O [ mass % O ] + r O Al [ mass % Al ] 2 + r O Mn [ mass % Mn ] 2 + r O O [ mass % O ] 2
where e i j and r i j are the first- and second-order interaction parameters, respectively. Substituting Equation (4) into Equation (3), Equation (5) can be obtained as follows:
e Al Al [ mass % Al ] n + 1 [ mass % Al ] n + e Al Mn ( [ mass % Mn ] n + 1 [ mass % Mn ] n ) + e Al O ( [ mass % O ] n + 1 [ mass % O ] n ) + r Al Al [ mass % Al ] n + 1 2 [ mass % Al ] n 2 + r Al Mn [ mass % Mn ] n + 1 2 [ mass % Mn ] n 2 + r Al O [ mass % O ] n + 1 2 [ mass % O ] n 2 = log [ mass % Al ] n / [ mass % Al ] n + 1 + 1 . 5 e O Al [ mass % Al ] n [ mass % Al ] n + 1 + 1 . 5 e O Mn ( [ mass % Mn ] n [ mass % Mn ] n + 1 ) + 1 . 5 e O O ( [ mass % O ] n [ mass % O ] n + 1 ) + 1 . 5 r O Al [ mass % Al ] n 2 [ mass % Al ] n + 1 2 + 1 . 5 r O Mn [ mass % Mn ] n 2 [ mass % Mn ] n + 1 2 + 1 . 5 r O O [ mass % O ] n 2 [ mass % O ] n + 1 2
According to the previous analysis, the difference in O content between the two adjacent experiments in each group should be very small. Accordingly, Equation (5) can be further simplified, as shown as follows:
( [ mass % Mn ] n + 1 [ mass % Mn ] n ) [ mass % Mn ] n + 1 2 [ mass % Mn ] n 2 e Al Mn + r Al Mn = log [ mass % Al ] n / [ mass % Al ] n + 1 e Al Al [ mass % Al ] n + 1 [ mass % Al ] n r Al Al [ mass % Al ] n + 1 2 [ mass % Al ] n 2 + 1 . 5 e O Al [ mass % Al ] n [ mass % Al ] n + 1 + 1 . 5 e O Mn ( [ mass % Mn ] n [ mass % Mn ] n + 1 ) + 1 . 5 r O Al [ mass % Al ] n 2 [ mass % Al ] n + 1 2 + 1 . 5 r O Mn [ mass % Mn ] n 2 [ mass % Mn ] n + 1 2 / [ mass % Mn ] n + 1 2 [ mass % Mn ] n 2
By defining the right side of Equation (6) as y Mn - Al and the coefficient term of e Al Mn as x Mn - Al , Equation (6) can be simplified to Equation (7). And the slope and intercept of the regression line are the e Al Mn and r Al Mn , respectively.
y Mn - Al = x Mn - Al e Al Mn + r Al Mn
According to Equation (6), by subtracting the two adjacent sets of data in the experiments, the interaction parameters between Mn and Al can be calculated using the method of linear fit. The parameters required for fitting in WIPF are shown in Table 2.
The linear fitting results are shown in Figure 4. The interaction parameters between Mn and Al, e Al Mn and r Al Mn are determined to be 0.0292 and −0.00016, respectively. The coefficient of determination R squared was evaluated to be 0.995.
To verify the accuracy of the fitting results, the comparison between the calculation results and the experimental results of log [ mass % Al ] n log [ mass % Al ] n + 1 is shown in Figure 5. As can be seen from the figure, the experimental results are in good agreement with the calculation results. This result indicates that the interaction parameters between Mn and Al cannot be ignored, and the parameters obtained in this study are more suitable for liquid steel with high Mn and Al contents.
Conclusively, compared with using Sn bath to measure all O contents accompanied by a significant error for fitting, assuming the relationship that the O contents in two adjacent experiments in each group are the same is more conducive to obtain accurate fitting results.

3.3. R-K Polynomial Analysis

The selection of the standard state is the same as the existing study [28]. When the O content of the adjacent two experiments of each group is the same, the following relationship can be obtained:
ln X Al , n + ln γ Al , n + 1 . 5 ln γ O , n = ln X Al , n + 1 + ln γ Al , n + 1 + 1 . 5 ln γ O , n + 1
where X i and γ i are the mole fraction and activity coefficient of the components in the Al2O3 saturated Fe-Mn-Al-O melts. The γ O can be approximately written as follows:
ln γ O = ln γ O 0 + ε O Al X Al + ε O Mn X Mn + ρ O Al X Al 2 + ρ O Mn X Mn 2
where ε i j and ρ i j are the first- and second-order interaction parameters. These parameters are calculated from the e i j , as shown in Table 3 by the relationship derived by Lupis [38].
The excess free energy change in the Fe-Mn-Al-O system, Δ G ex , can be expressed as a R-K polynomial using the first- and second-order interaction parameters, shown in Equation (10).
Δ G ex = X Fe X Mn Ω Fe Mn 0 + X Fe X Mn Ω Fe Mn 1                               + X Fe X Al Ω Fe Al 0 + X Fe X Al Ω Fe Al 1                               + X Fe X O Ω Fe O 0 + X Fe X O Ω Fe O 1                               + X Mn X Al Ω Mn - Al 0 + X Mn X Al Ω Mn Al 1                               + X Mn X O Ω Mn O 0 + X Mn X O Ω Mn O 1                               + X Al X O Ω Al O 0 + X Al X O Ω Al O 1
where Ω i j 0 and Ω i j 1 are the binary interaction parameters between component i and j. The partial molar excess free-energy changes in Al can be written as follows:
Δ G ¯ Al ex = R T ln γ Al                       = Δ G ¯ ex + Δ G ¯ ex X Al X Mn Δ G ¯ ex X Mn X O Δ G ¯ ex X O X Al Δ G ¯ ex X Al X Fe Δ G ¯ ex X Fe                       = X Fe X Mn Ω Fe Mn 0 2 X Fe X Mn X Fe X Mn Ω Fe Mn 1                                 + X Fe 1 X Al Ω Fe Al 0 + X Fe X Fe 2 X Al 2 X Fe X Al + 2 X Al 2 Ω Fe Al 0                                 X Fe X O Ω Fe O 0 2 X Fe X O X Fe X O Ω Fe O 1                                 + X Mn 1 X Al Ω Mn Al 0 + X Mn X Mn 2 X Al 2 X Al X Mn + 2 X Al 2 Ω Mn Al 1                                 X Mn X O Ω Mn O 0 2 X Mn X O X Mn X O Ω Mn O 1                                 + X O 1 X Al Ω Al O 0 + X O 2 X Al X O 2 X Al 2 + 2 X Al X O Ω Al O 1
Since the items containing X O is expected to be much smaller than other items, they were ignored in this study. Thus, Equation (11) can be written as follows:
R T ln γ Al = X Fe X Mn Ω Fe Mn 0 2 X Fe X Mn X Fe X Mn Ω Fe Mn 1                                               + X Fe 1 X Al Ω Fe Al 0 + X Fe X Fe 2 X Al 2 X Fe X Al + 2 X Al 2 Ω Fe Al 1                                               + X Mn 1 X Al Ω Mn Al 0 + X Mn X Mn 2 X Al 2 X Al X Mn + 2 X Al 2 Ω Mn Al 1
Substituting Equations (9) and (12) into Equation (8), Equation (13) can be obtained as follows:
R T ln X Al , n / X Al , n + 1 + 1 . 5 R T ln γ O , n / γ O , n + 1 = X Fe , n + 1 X Mn , n + 1 + X Fe , n X Mn , n Ω Fe Mn 0 2 X Fe , n + 1 X Mn , n + 1 X Fe , n + 1 X Mn , n + 1 2 X Fe , n X Mn , n X Fe , n X Mn , n Ω Fe Mn 1 + X Fe , n + 1 1 X Al , n + 1   X Fe , n 1 X Al , n Ω Fe Al 0 + X Fe , n + 1 X Fe , n + 1 2 X Al , n + 1 2 X Fe , n + 1 X Al , n + 1 + 2 X Al , n + 1 2 X Fe , n X Fe , n 2 X Al , n 2 X Fe , n X Al , n + 2 X Al , n 2 Ω Fe Al 1 + X Mn , n + 1 1 X Al , n + 1 X Mn , n 1 X Al , n Ω Mn Al 0 + X Mn , n + 1 X Mn , n + 1 2 X Al , n + 1 2 X Al , n + 1 X Mn , n + 1 + 2 X Al , n + 1 2 X Mn , n X Mn , n 2 X Al , n 2 X Al , n X Mn , n + 2 X Al , n 2   Ω Mn Al 1
In Equation (13), the binary interaction parameters between Fe and Al have been reported [39], as shown in Table 3. However, the binary interaction parameters between Fe-Mn have not been reported yet, and they have been treated as an ideal solution [40]. Since the Fe-Mn melts is a mature system, the activity data obtained by Factsage was used to calculate the binary interaction parameters between Fe and Mn. The excess free energy change in the Fe-Mn system, Δ G Fe - Mn ex , can be expressed as a R-K polynomial using the binary interaction parameters shown as Equation (14).
Δ G Fe - Mn ex = X Fe X Mn Ω Fe Mn 0 + X Fe X Mn Ω Fe Mn 1
The partial molar excess free-energy changes in Mn in the Fe-Mn melt can be written as follows:
Δ G Mn ex = R T ln γ Mn                           = Δ G Fe - Mn ex + Δ G Fe - Mn ex X Mn X Mn Δ G Fe - Mn ex X Mn X Fe Δ G Fe - Mn ex X Fe                           = X Fe 1 X Mn Ω Fe Mn 0 + X Fe 2 1 2 X Mn Ω Fe Mn 1
where γ Mn is the activity coefficient of Mn. Simplifying Equation (15), and Equation (16) can be obtained as follows:
R T ln γ Mn / X Fe 2 = Ω Fe Mn 0 + 1 2 X Mn Ω Fe Mn 1
Defining the left side and the coefficient of Ω Fe Mn 1 in Equation (16) as Y Fe - Mn and X Fe - Mn , respectively. The binary interaction parameters between Fe and Mn can be obtained by the intercept and slope of the linear fitting curve of Equation (16). The results are shown in Figure 6.
As can be seen from Figure 6, the fitting result is good. The binary interaction parameters between Fe and Mn, Ω Fe Mn 0 and Ω Fe Mn 1 , are −4876 J/mol and 3148 J/mol, respectively. These two values are small, which also indicates that the Fe-Mn system is approximate to the ideal solution.
After obtaining the binary interaction parameters between Fe-Mn, Equation (13) can be written as follows:
R T ln X Al , n / X Al , n + 1 + 1 . 5 R T ln γ O , n / γ O , n + 1 X Fe , n + 1 1 X Al , n + 1 X Fe , n 1 X Al , n Ω Fe Al 0 X Fe , n + 1 X Fe , n + 1 2 X Al , n + 1 2 X Fe , n + 1 X Al , n + 1 + 2 X Al , n + 1 2 X Fe , n X Fe , n 2 X Al , n 2 X Fe , n X Al , n + 2 X Al , n 2 Ω Fe Al 1 + X Fe , n + 1 X Mn , n + 1 + X Fe , n X Mn , n Ω Fe Mn 0 2 X Fe , n + 1 X Mn , n + 1 X Fe , n + 1 X Mn , n + 1 2 X Fe , n X Mn , n X Fe , n X Mn , n Ω Fe Mn 1 / X Mn , n + 1 X Mn , n + 1 2 X Al , n + 1 2 X Al , n + 1 X Mn , n + 1 + 2 X Al , n + 1 2 X Mn , n X Mn , n 2 X Al , n 2 X Al , n X Mn , n + 2 X Al , n 2 = X Mn , n + 1 1 X Al , n + 1 X Mn , n 1 X Al , n / X Mn , n + 1 X Mn , n + 1 2 X Al , n + 1 2 X Al , n + 1 X Mn , n + 1 + 2 X Al , n + 1 2 X Mn , n X Mn , n 2 X Al , n 2 X Al , n X Mn , n + 2 X Al , n 2 Ω Mn Al 0 + Ω Mn Al 1
Defining the left side and the coefficient of 0 Ω Mn - Al in Equation (17) as Y Mn - Al and X Mn - Al , respectively. The parameters utilized for fitting in the present study are shown in Table 3. The binary interaction parameters between Mn and Al can be obtained by the intercept and slope of the linear fitting curve of Equation (17). The results are shown in Figure 7.
It can be obtained from Figure 7 that the binary interaction parameters between Al and Mn, and Ω Mn Al 0 and Ω Mn Al 1 , are 73,439 J/mol and −34,919 J/mol, respectively. To verify the accuracy of the fitting results, the comparison between the calculation results and the experimental results of ln X Al , n / X Al , n + 1 + 1 . 5 ln γ O , n / γ O , n + 1 is shown in Figure 8. As can be seen from the figure, the experimental results are in good agreement with the calculation results.

3.4. The Applicability of the WIPF Model

The Al activity calculated using the WIPF (standard state of 1% concentration) can be converted to the Al activity with pure substance as the standard state (R-K polynomial) using the relationship shown as Equation (18). Then, the comparison of the Al activities calculated by the R-K polynomial and WIPF using the experiment data can be obtained, as shown in Figure 9. It should be noted that the negative values in Figure 9 do not have actual meaning, they are aimed to present data points closer to 0 more clearly.
a R - K ,   Al a WIPF ,   Al = γ Al 0 M Fe M Fe + 99 M Al
It can be seen from Figure 9 that the difference between the Al activities obtained by the two models is very small. This result demonstrates that WIPF with second-order interaction parameters can be well applied to Fe-Mn-Al-O melts with the Mn and Al concentration range involved in the present. It should also be noted that the difference in the third group is mainly due to the increase in Al content. It indicates that if the Al content further increased, the difference between the calculation results of the WIPF and the R-K polynomial will increase, making the WIPF unable to accurately predict the thermodynamic properties of high Al melts.

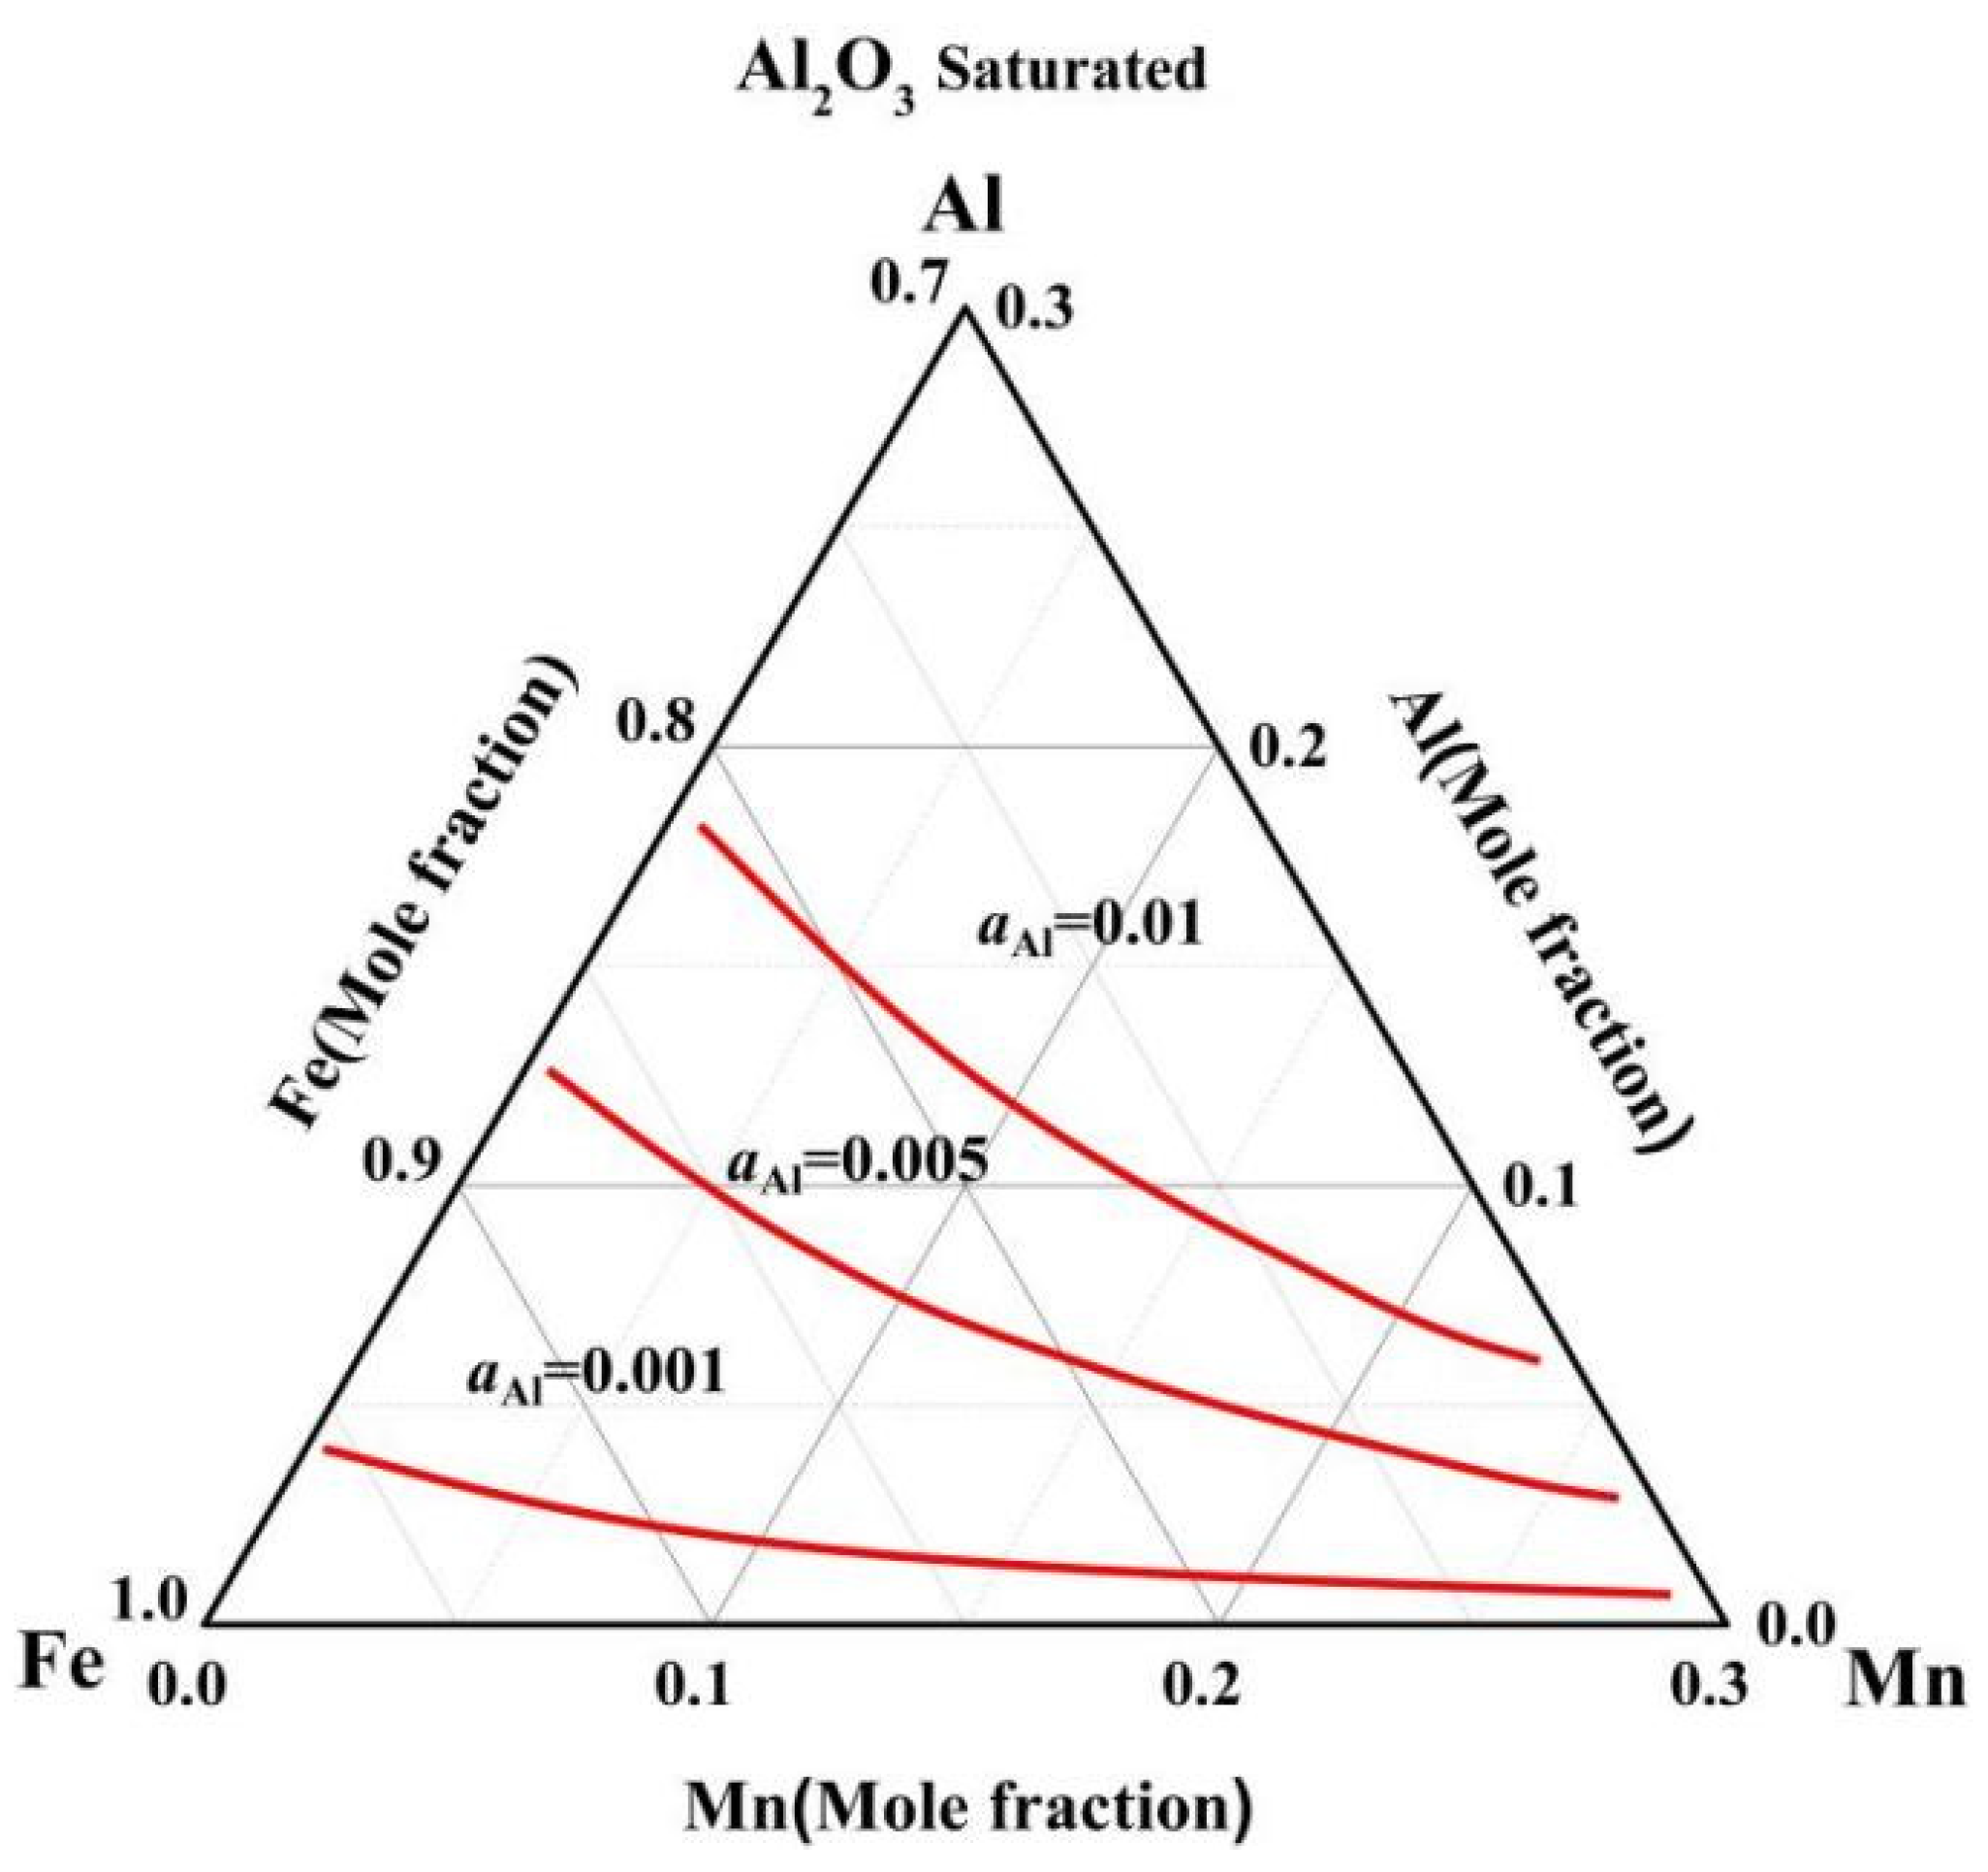
3.5. The Influence of Mn Content on Al Activity and Formation of Al2O3 Inclusion

Adopting the R-K polynomial and its parameters obtained in this study, the iso-activity contours of Al were calculated as shown in Figure 10. It can be seen from the figure that the activities of Al increase with increasing Al content. Additionally, the activity coefficients of Al with different contents are less than unity, which indicates that Al in the Fe-Mn-Al-O system shows a negative deviation from the ideal solution. Moreover, it can also be deduced from Figure 10 that the Al activity is affected by the Fe/Mn molar ratio of the melts, and it decreases with the increasing of the Fe/Mn molar ratio. Accordingly, the Al activity increases with the increase in Mn content. Thus, an increase in Mn content will promote the reaction of Equation (1).
In order to further evaluate the influence of the Mn addition on the formation of Al2O3 inclusions, the Al-O equilibrium behavior in Fe-Mn-Al-O melts at different Mn contents was studied. Substituting Equation (4) into Equation (2), the Al-O equilibrium curve can be calculated using the WIPF and the interaction parameters obtained in the present study, as shown in Figure 11. The coordinate axes represent the content of Al and O, respectively, and are expressed in exponential form. The value of K has been obtained in previous study [28]. It can be seen from the figure that with the increase in Mn content, the equilibrium O content at the same Al content was reduced. Correspondingly, the Al2O3 saturation region was expanded. This result indicates that when smelting high Mn and Al content steel, stricter control of O content in steel is needed to reduce the generation of Al2O3 inclusion.

4. Conclusions

In the present study, the interaction parameters between Mn and Al in Fe-Mn-Al-O melts with high Mn and Al content at 1873 K (1600 °C) were accurately determined. The Fe-Mn-Al-O melts, protected by a CaO (30 wt pct)-Al2O3 (65 wt pct)-CaF2 (5 wt pct) flux, were equilibrated with pure solid Al2O3 at 1873 K (1600 °C) for 2 h in an Ar-H2 gas mixture atmosphere. The conclusions obtained are as follows:
(1)
The first- and second-order interaction parameters between Al and Mn, e Al Mn and r Al Mn , were determined to be 0.0292 and −0.00016, respectively, calculated by the WIPF.
(2)
The binary interaction parameters between Al and Mn, Ω Mn Al 0 , and Ω Mn Al 1 were determined to be 73,439 J/mol and −34,919 J/mol, respectively, calculated by the R-K polynomial.
(3)
The WIPF and R-K polynomial show good agreement on the calculation of component activity in Fe-Mn-Al-O melts, indicating WIPF with second-order interaction parameters can be well applied to the Fe-Mn-Al-O melts with a high Mn and Al concentration range involved in the present study.
The iso-activity contours of Al show that the Al activity increases with increasing Al or Mn content. And the addition of Mn will make the formation of Al2O3 inclusions easier.

Author Contributions

Formal analysis: X.L. and D.W.; investigation, J.Z., X.L., D.W. and H.L.; data curation: D.W. and H.L.; project administration: J.Z. and B.Y.; writing—original draft: J.Z. and B.Y.; writing—review and editing: J.Z. and B.Y.; funding acquisition: J.Z., D.W. and H.L. All authors have read and agreed to the published version of the manuscript.

Funding

The authors gratefully acknowledge the financial support of this research by the National Natural Science Foundation of China (Grant Nos. 52104293 and 52174274), the National Key Research and Development Project (Grant No. 2022YFF0903702), and the Major Special Science and Technology Project of Anhui Province (Grant No. 202003a07020001).

Data Availability Statement

No new data were created or analyzed in this study. Data sharing is not applicable to this article.

Conflicts of Interest

The authors declare no conflict of interest.

References

  1. Kaar, S.; Steineder, K.; Schneider, R.; Krizan, D.; Sommitsch, C. New Ms-formula for exact microstructural prediction of modern 3rd generation AHSS chemistries. Scripta. Mater. 2021, 200, 113923. [Google Scholar] [CrossRef]
  2. Ebner, S.; Suppan, C.; Stark, A.; Schnitzer, R.; Hofer, C. Austenite decomposition and carbon partitioning during quenching and partitioning heat treatments studied via in-situ X-ray diffraction. Mater. Design. 2019, 178, 107862. [Google Scholar] [CrossRef]
  3. Tang, D.; Pistorius, P.C. Isotope Exchange Measurements of the Interfacial Reaction Rate Constant of Nitrogen on Fe-Mn alloys and an Advanced High-Strength Steel. Metall. Mater. Trans. B 2021, 52, 51–58. [Google Scholar] [CrossRef]
  4. Alba, M.N.M.; Karasev, A.; Jnsson, P.G.; Dogan, N. Characterization of inclusions in 3rd generation advanced high-strength steels. Metall. Mater. Trans. B 2019, 50, 1674–1685. [Google Scholar] [CrossRef]
  5. Paek, M.K.; Chatterjee, S.; Pak, J.J.; Jung, I.H. Aluminum Deoxidation Equilibria in Liquid Iron: Part III-Experiments and Thermodynamic Modeling of the Fe-Mn-Al-O System. Met. Mater. Trans. B 2016, 47, 2837–2847. [Google Scholar] [CrossRef]
  6. Cho, J.W.; Yoo, S.; Park, M.S.; Park, J.K.; Moon, K.H. Improvement of castability and surface quality of continuously cast TWIP slabs by molten mold flux feeding technology. Metall. Mater. Trans. B 2017, 48, 187–196. [Google Scholar] [CrossRef]
  7. Kim, M.-S.; Lee, S.-W.; Cho, J.-W.; Park, M.-S.; Lee, H.-G.; Kang, Y.-B. A reaction between high Mn-high Al steel and CaO-SiO2-type molten mold flux: Part I. Composition evolution in molten mold flux. Metall. Mater. Trans. B 2013, 44, 299–308. [Google Scholar] [CrossRef]
  8. Kang, Y.-B.; Kim, M.-S.; Lee, S.-W.; Cho, J.-W.; Park, M.-S.; Lee, H.-G. A reaction between high Mn-high Al steel and CaO-SiO2-type molten mold flux: Part II. Reaction mechanism, interface morphology, and Al2O3 accumulation in molten mold flux. Metall. Mater. Trans. B 2013, 44, 309–316. [Google Scholar] [CrossRef]
  9. Aydin, H.; Essadiqi, E.; Jung, I.H.; Yue, S. Development of 3rd generation AHSS with medium Mn content alloying compositions. Mater. Sci. Eng. A 2013, 564, 501–508. [Google Scholar] [CrossRef]
  10. Lai, Z.H.; Sun, Y.H.; Lin, Y.T.; Tu, J.F.; Yen, H.W. Mechanism of twinning induced plasticity in austenitic lightweight steel driven by compositional complexity. Acta Mater. 2021, 210, 116814. [Google Scholar] [CrossRef]
  11. Zhang, C.; Zhi, H.; Antonov, S.; Lin, C.; Su, Y. Hydrogen-enhanced densified twinning (HEDT) in a twinning-induced plasticity (TWIP) steel. Scr. Mater. 2021, 190, 108–112. [Google Scholar] [CrossRef]
  12. Paek, M.K.; Jang, J.M.; Do, K.H.; Pak, J.J. Thermodynamics of nitrogen in Fe-Mn-Al-Si-C alloy melts. Metall. Mater. Trans. B 2016, 47, 1243–1262. [Google Scholar] [CrossRef]
  13. Jang, J.M.; Seo, S.H.; Kim, Y.D.; An, H.J.; Pak, J.J. Effect of carbon on nitrogen solubility and AlN formation in high Al alloyed liquid steels. ISIJ Int. 2014, 54, 1578–1583. [Google Scholar] [CrossRef]
  14. Paek, M.K.; Jang, J.M.; Jiang, M.; Pak, J.J. Thermodynamics of AlN formation in high manganese-aluminum alloyed liquid steels. ISIJ Int. 2013, 53, 973–978. [Google Scholar] [CrossRef]
  15. Paek, M.K.; Jang, J.M.; Kang, H.J.; Pak, J.J. Reassessment of AlN (s) = Al+N Equilibration in Liquid Iron. ISIJ Int. 2013, 53, 535–537. [Google Scholar] [CrossRef]
  16. Spooner, S.; Assis, A.N.; Warnett, J.; Fruehan, R.; Williams, M.A.; Sridhar, S. Investigation into the Cause of Spontaneous Emulsification of a Free Steel Droplet. Validation of the Chemical Exchange Pathway. Metall. Mater. Trans. B 2016, 47, 2123–2132. [Google Scholar] [CrossRef]
  17. Vedani, M.; Dellasega, D.; Mannuccii, A. Characterization of grain-boundary precipitates after hot-ductility tests of microalloyed steels. ISIJ Int. 2009, 49, 446–452. [Google Scholar] [CrossRef]
  18. Kim, M.S.; Kang, Y.B. Development of thermodynamic database for high Mn-high Al steels: Phase equilibria in the Fe-Mn-Al-C system by experiment and thermodynamic modeling. Calphad 2015, 51, 89–103. [Google Scholar] [CrossRef]
  19. Mikhailov, G.G.; Tyurin, A.G. Deoxidation and desulfurization of steels by calcium, manganese and aluminum. Izv. Akad. Nauk. SSSR Met. 1984, 4, 10. [Google Scholar]
  20. Sukiennik, M.Z.; Olesinski, R.W. On the relationship between interaction coefficients. Metall. Mater. Trans. B 1984, 15, 677–680. [Google Scholar] [CrossRef]
  21. Pelton, A.D.; Bale, C.W. A modified interaction parameter formalism for non-dilute solutions. Metall. Mater. Trans. A 1986, 17, 1211–1215. [Google Scholar] [CrossRef]
  22. Bale, C.W.; Pelton, A.D. The unified interaction parameter formalism: Thermodynamic consistency and applications. Metall. Mater. Trans. A 1990, 21, 1997–2002. [Google Scholar] [CrossRef]
  23. Miki, T.; Hino, M. Numerical Analysis on Si Deoxidation of Molten Fe, Ni, Fe-Ni, Fe-Cr, Fe-Cr-Ni, Ni-Cu and Ni-Co Alloys by Quadratic Formalism. ISIJ Int. 2005, 45, 1848–1855. [Google Scholar] [CrossRef]
  24. Hillert, M.; Staffanson, L.I. The regular solution model for stoichiometric phases and ionic melts. Acta Chem. Scand 1970, 24, 3618–3626. [Google Scholar] [CrossRef]
  25. Saunders, N.; Miodownik, A.P. CALPHAD (Calculation of Phase Diagrams). A Comprehensive Guide; Oxford: Pergamon, Turkey, 1988. [Google Scholar]
  26. Yonemoto, L.M.; Miki, T.; Hino, M. Deoxidation Equilibrium of Molten Fe-Ni Alloy Expressed by Quadratic Formalism and Redlich-Kister Type Polynomial. ISIJ Int. 2008, 48, 755–759. [Google Scholar] [CrossRef]
  27. Miki, T.; Hino, M. Numerical Analysis on Si deoxidation of molten Fe-Ni and Ni-Co alloys by quadratic formalism. ISIJ Int. 2004, 44, 1800–1809. [Google Scholar] [CrossRef]
  28. Zhang, J.; Han, L.H.; Yan, B.J. Reassessment of Aluminum-Oxygen Equilibrium in High Al Molten Steel during Aluminum Deoxidation process at 1873 K. Met. Mater. Trans. B 2022, 53, 2512–2522. [Google Scholar] [CrossRef]
  29. Paek, M.-K.; Jang, J.-M.; Kang, Y.-B.; Pak, J.-J. Aluminum deoxidation equilibria in liquid iron: Part I. Experimental. Met. Mater. Trans. B 2015, 46, 1826–1836. [Google Scholar] [CrossRef]
  30. Suito, H.; Inoue, H.; Inoue, R. Aluminium-oxygen equilibrium between CaO-Al2O3 melts and liquid iron. ISIJ Int. 1991, 31, 1381–1388. [Google Scholar] [CrossRef]
  31. Rohde, L.E.; Choudhury, A.; Wahlster, M. New investigations into the aluminium-oxygen equilibrium in iron melts. Arch. Eisenhüttenwes. 1971, 42, 165–174. [Google Scholar] [CrossRef]
  32. Dimitrov, S.; Weyl, A.; Janke, D. Control of the aluminium-oxygen reaction in pure iron melts. Steel Res. 1995, 66, 3–7. [Google Scholar] [CrossRef]
  33. Takahashi, K.; Hino, M. Equilibrium between Dissolved Mn and O in Molten High-Manganese Steel. High Temp. Mater. Process.-Isr. 2009, 19, 1–10. [Google Scholar] [CrossRef]
  34. Fruehan, R.J. Activities in Liquid Fe-AI-O and Fe-Ti-O Alloys. Met. Trans. 1970, 1, 3403–3410. [Google Scholar] [CrossRef]
  35. Choudary, U.V.; Belton, G.R. Activities in carbon-saturated Fe-Al alloys and the stability of Al4C3 at 1873 K. Met. Mater. Trans. B 1977, 8, 531–534. [Google Scholar] [CrossRef]
  36. Sigworth, G.K.; Elliott, J.F. The thermodynamics of liquid dilute iron alloys. Met. Sci. 1974, 8, 298–310. [Google Scholar] [CrossRef]
  37. Kang, Y.J.; Thunman, M.; Sichen, D.; Morohoshi, T.; Mizukami, K.; Morita, K. Aluminum deoxidation equilibrium of molten iron-aluminum alloy with wide aluminum composition range at 1873 K. ISIJ Int. 2009, 49, 1483–1489. [Google Scholar] [CrossRef]
  38. Lupis, C.H.P.; Elliott, J.F. Generalized Interaction Coefficients Part II: Free Energy Terms and the Quasi-Chemical Theory. Acta Mater. 1966, 14, 1019–1032. [Google Scholar] [CrossRef]
  39. Fukaya, H.; Kajikawa, K.; Malfliet, A.; Blanpain, B.; Guo, M.X. Aluminum Deoxidation Equilibrium of Fe-Ni Alloy at 1773 K and 1873 K. Met. Mater. Trans. B 2018, 49, 2389–2399. [Google Scholar] [CrossRef]
  40. Kim, M.S.; Kang, Y.B. Thermodynamic modeling of the Fe-Mn-C and the Fe-Mn-Al systems using the Modified Quasichemical Model for liquid phase. J. Phase Equilib. Diffus. 2015, 36, 453–470. [Google Scholar] [CrossRef]
Figure 1. Schematic diagram of the experimental apparatus.
Metals 13 01500 g001
Figure 2. SEM images of the samples. (a) morphology of the sample; (b) typical Al2O3 inclusion.
Metals 13 01500 g002
Figure 3. Influence of Mn content in melt on Al content in the Al2O3 saturated Fe-Mn-Al-O melts.
Metals 13 01500 g003
Figure 4. The linear fitting results of e Al Mn and r Al Mn via WIPF.
Metals 13 01500 g004
Figure 5. Comparison of the calculated results and the experimental results of log [ mass % Al ] n log [ mass % Al ] n + 1 via WIPF.
Metals 13 01500 g005
Figure 6. Fitting results of the binary interaction parameters between Fe and Mn.
Metals 13 01500 g006
Figure 7. Fitting results of the binary interaction parameters between Al and Mn.
Metals 13 01500 g007
Figure 8. Comparison of the calculated results and the experimental results of ln X Al , n / X Al , n + 1 + 1 . 5 ln γ O , n / γ O , n + 1 using the R-K polynomial.
Metals 13 01500 g008
Figure 9. Comparison of the Al activities calculated by R-K polynomial and WIPF using the experiments data.
Metals 13 01500 g009
Figure 10. Activities and iso-activity contours of Al in Al2O3 saturated Fe-Mn-Al-O melts at 1873 K (1600 °C) calculated by the R-K polynomial.
Metals 13 01500 g010
Figure 11. The influence of Mn content on Al-O equilibrium in Fe-Mn-Al-O melts.
Metals 13 01500 g011
Table 1. Composition of the Al2O3 saturated Fe-Mn-Al-O melt and flux after equilibrium.
No.Chemical Compositions of the Flux after Equilibrium, Mass%Initial Mn Content, Mass%Mn, Mass%Al, Mass%O, Mass%
Al2O3CaOCaF2
1-159.1138.212.68002.420.0011
1-2---32.462.120.0010
1-3---65.252.08-
1-459.2037.513.2897.861.93-
1-5---1210.481.86-
1-6---1513.071.73-
1-759.3038.382.322118.651.36-
2-159.8038.152.05004.340.0012
2-2---32.464.160.0012
2-3---65.264.02
2-459.6337.722.6597.93.93-
2-5---1210.583.85-
2-6---1513.153.78-
2-759.8237.762.421816.073.48-
3-159.9637.222.82006.190.0017
3-2---32.446.090.0016
3-3---1210.475.94-
3-458.8038.342.861513.075.83-
3-5---1815.925.78-
3-659.3637.962.682118.655.7-
Table 2. Parameters utilized in WIPF.
ParametersValueRef.
γ Al o 0.021[34,35]
e O Mn −0.021[36]
r O Mn 0[36]
e Al Al 0.045[36]
e O Al −0.231[37]
r O Al 0.026[37]
r Al Al −0.001[37]
Table 3. Parameters utilized in the R-K polynomial.
ParametersValueRef.
γ O o 0.0105[23]
ε O Al −25.1Calculated
ρ O Al 125.88Calculated
ε O Mn −3.55Calculated
ρ O Mn 0Calculated
Ω Fe Al 0 −71,780 J/mol[39]
Ω Fe Al 1 11,539 J/mol[39]
Disclaimer/Publisher’s Note: The statements, opinions and data contained in all publications are solely those of the individual author(s) and contributor(s) and not of MDPI and/or the editor(s). MDPI and/or the editor(s) disclaim responsibility for any injury to people or property resulting from any ideas, methods, instructions or products referred to in the content.

