Article

Effect of Preheating on the Mechanical Workability Improvement of High-Strength Electrical Steels during Tandem Cold Rolling

by
František Kováč
1,*,
Ivan Petryshynets
1,
Róbert Kočiško
2,
Patrik Petroušek
2 and
Ladislav Falat
1
1
Institute of Materials Research, Slovak Academy of Sciences, Watsonova 47, 04001 Kosice, Slovakia
2
Department of Plastic Deformation and Simulation Processes, Institute of Materials and Quality Engineering, Faculty of Materials, Metallurgy and Recycling, Technical University of Kosice, Vysokoskolska 4, 04200 Kosice, Slovakia
*
Author to whom correspondence should be addressed.
Metals 2023, 13(8), 1415; https://doi.org/10.3390/met13081415
Submission received: 30 June 2023 / Revised: 29 July 2023 / Accepted: 3 August 2023 / Published: 8 August 2023
(This article belongs to the Special Issue Rolling Process of Metallic Materials)

Abstract

:
Cold-rolled silicon steel strip products are widely used as the main soft magnetic components in cores of electrical motors, generators, and transformers. In the case of rotating electrical machines, the so-called non-oriented electro-technical steels are normally applied. They are characterized by a similar behaviour to the induced magnetic field found in all sheet plane directions. The kind of soft magnetic alloys that defined herein not only possess an isotropy of electromagnetic properties, but also high mechanical strength; such alloys are called high-strength electro-technical (HSET) steels. These commercially produced HSET steels contain a high silicon content in the range of 3–4 wt.%. However, if the silicon content exceeds 3%, the machinability of Fe–Si alloys is dramatically reduced and they become much more brittle as a consequence. According to this, regular hot band brittle damage occurs during cold deformation at a high-speed tandem rolling mill. In accordance with these reasons, the production of thin high-strength silicon steel grades using the traditional methods of cold rolling deformation is extremely problematic and it is characterised by a high degree of steel sheet mechanical damage. In this scientific work, the effect of preheating hot-rolled strips on their mechanical workability improvement during tandem cold rolling was investigated. The results of this study indicate that the cold rolling of hot bands at elevated temperatures increases their resistance to brittle failure and mechanical plasticity. Moreover, the mathematical simulation clearly demonstrates that residual stress is distributed relatively homogeneously across the thickness of samples, which were cold rolled at 100 °C in contrast to the same ones deformed at room temperature.

1. Introduction

Electrical steels are one of the industrially produced soft magnetic materials widely used for more than a hundred years as the main components of the iron core of electrical motors, generators, and different types of transformers. Depending on the type of application, the electro-technical steels are usually divided into grain-oriented (GO) and non-oriented (NO) electro-technical steel sheets. GO steels are characterised by strong so-called Goss-type texture {110}<001> to provide their excellent magnetic properties in the rolling direction (RD) [1]. NO electrical steels exhibit same electromagnetic properties in the plane of the sheet and are usually used in electrical rotating machines [2,3].
According to the last International Energy Agency report [4], it was estimated that electric motor-driven systems make up about 50% of the global electricity consumption; therefore, improvements in the efficiency of electric motors by even 1% can have a huge impact on the energy used today [5]. Since non-oriented electrical steels are the main basic components of electrical motors and generators, improving their magnetic properties can reduce energy consumption in the modern industrial world [6]. In the last decade, there has been a strong demand for energy-saving electric vehicles in an effort to protect the global environment. In this case, hybrid electrical and fully electric vehicles need high-speed and highly effective electrical drive devices, which could be used in starting and accelerating these electrical cars [7]. This means that electrical cars’ traction motors should demonstrate a high torque and high magnetic flux density circulated in their rotors and stators. In order to achieve the high rotational speed and acceleration of the traction electrical motor rotor during high-speed driving, low magnetic losses in the high-frequency range and high mechanical properties such as yield strength and tensile strength are required for electrical sheet steels [8]. The kind of NO electro-technical steels characterised by a high magnetic flux density but also an excellent mechanical strength—which increases their resistance to fatigue fracture caused by compressive and tensile stresses occurring in the rotor segments under the influence of centrifugal forces—is called high-strength electro-technical (HSET) steels [9].
It is well-known that the magnetic properties of non-oriented electrical steels are improved when the content of silicon increases. According to Almeida et al., the content of the silicon in HSET steels is in the range of 3% to 4.5 wt.% [10]. Previous research has indicated the positive impact of silicon on the magnetic properties of NO electrical steel sheets. It has been demonstrated that the high value of silicon content provides improvement in AC core losses, which are presented by hysteresis and eddy current losses [11,12]. Hawezy investigated the differential impact of silicon content on the physical properties of electrical steels, showing that when silicon content is higher than 3 wt.%, the brittleness of the steel is increased and the cold deformability is significantly impaired, making the processing of the material extremely difficult and costly [5]. It is important to note that non-oriented electrical steels are the most produced soft magnetic alloys today in the world. There is a large volume of published works that have investigated the effect of microstructure texture and chemical composition on the magnetic behaviour of non-oriented electrical steels and describes the typical manufacturing processing for these materials, including main routes such as continuous casting, hot rolling, cold rolling, and final annealing [13,14].
The cold rolling process in industrial conditions is carried out by means of the high-speed tandem rolling mill (TRM) or single-stand reversing rolling mill (RRM). The reversing cold rolling mill is mainly used for the final cold rolling process of a high-grade NO steel hot band with a high silicon content for an extreme reduction in thickness of up to 0.25 mm without additional annealing. Several studies investigating the hot and cold rolling of electro-technical sheets have reported that RRM has indicated a series of shortcomings in the form of static coil winders, intended for the hot band before and after rolling, which are found in head and tail ends and require enormous effort to stretch and maintain the rolled strips in an optimally tensioned state, thus decreasing productivity. Also, one of the main inconveniences of reverse rolling mills is the time-consuming replacement of the rolled coil from the final to starting position, which must be carried out several times during the cold rolling of the hot band in order to reduce its thickness on the requested final value [15,16].
In comparison with RRM, the TRM has a lot of benefits, such as the highest production rates (over 1.2 million t/a); flexible manufacture; strong tolerances for the shape, thickness, and surface quality of the strip; an effective and quick reduction in sheet thickness; the elimination of inconvenience related to strip threading and exchange; minimum costs for operation and maintenance; and low downtimes [17]. The largest drawback of high-speed TPM for HSET steels with a high silicon content is the demanding process required to carry out thickness reduction to obtain extremely thin sheets. Thus, an unexpected fracturing of the deformed hot band with a high silicon content during the tandem cold rolling process is always a significant issue for the continuous and synchronised industrial processed procedure of different kinds of steels. As already mentioned, improving the magnetic properties of electrical steels is most easily achieved by increasing the Si content in combination with decreasing their thickness. However, the high level of silicon remarkably increases the hardness and strength of steel sheets, as a result of which, their plasticity decreases and the deformability deteriorates during cold rolling [18,19].
Our previous work [20] focused on the investigation of the primary reasons for the brittle failure which occurs in a high-speed tandem rolling mill during the cold rolling of electro-technical steel with high silicon content. The obtained results have clearly shown that the rupturing of the hot bands is related to the highly inhomogeneous distribution of size, shape, and the crystallographic orientation of grains in the microstructural matrix. This distribution was observed through the thickness of the hot band.
The subject of our present work is to investigate the estimation of the effect of preheating hot-rolled strips of HSET steels on their mechanical workability improvement during tandem cold rolling. Our approach is based on previous research works that examined the effects of: unconventional reverse cold rolling technology on the texture evolution of extremely thin steel sheets with 2.8 wt.% silicon [21], cross-rolling deformation on the increase in workability and improvement of the crystallographic texture of high Fe–Si alloys [22], or an innovative warm rolling process on the deformability of high-strength NO electrical steels [23]. The presented previous studies have shown that the cold rolling process was realised only on the single-roll rolling mill, which, in comparison with 5-stand rolling mills, is characterised by a very long deformation treatment time of the hot band. This paper takes into account our recent work [20], where it was concluded that avoiding the studied failure of a high-strength silicon steel might be possible by improving the homogeneity of the distribution of mechanical strains through their cross-section during tandem cold rolling. One approach to perform this is by cold rolling at elevated temperatures.

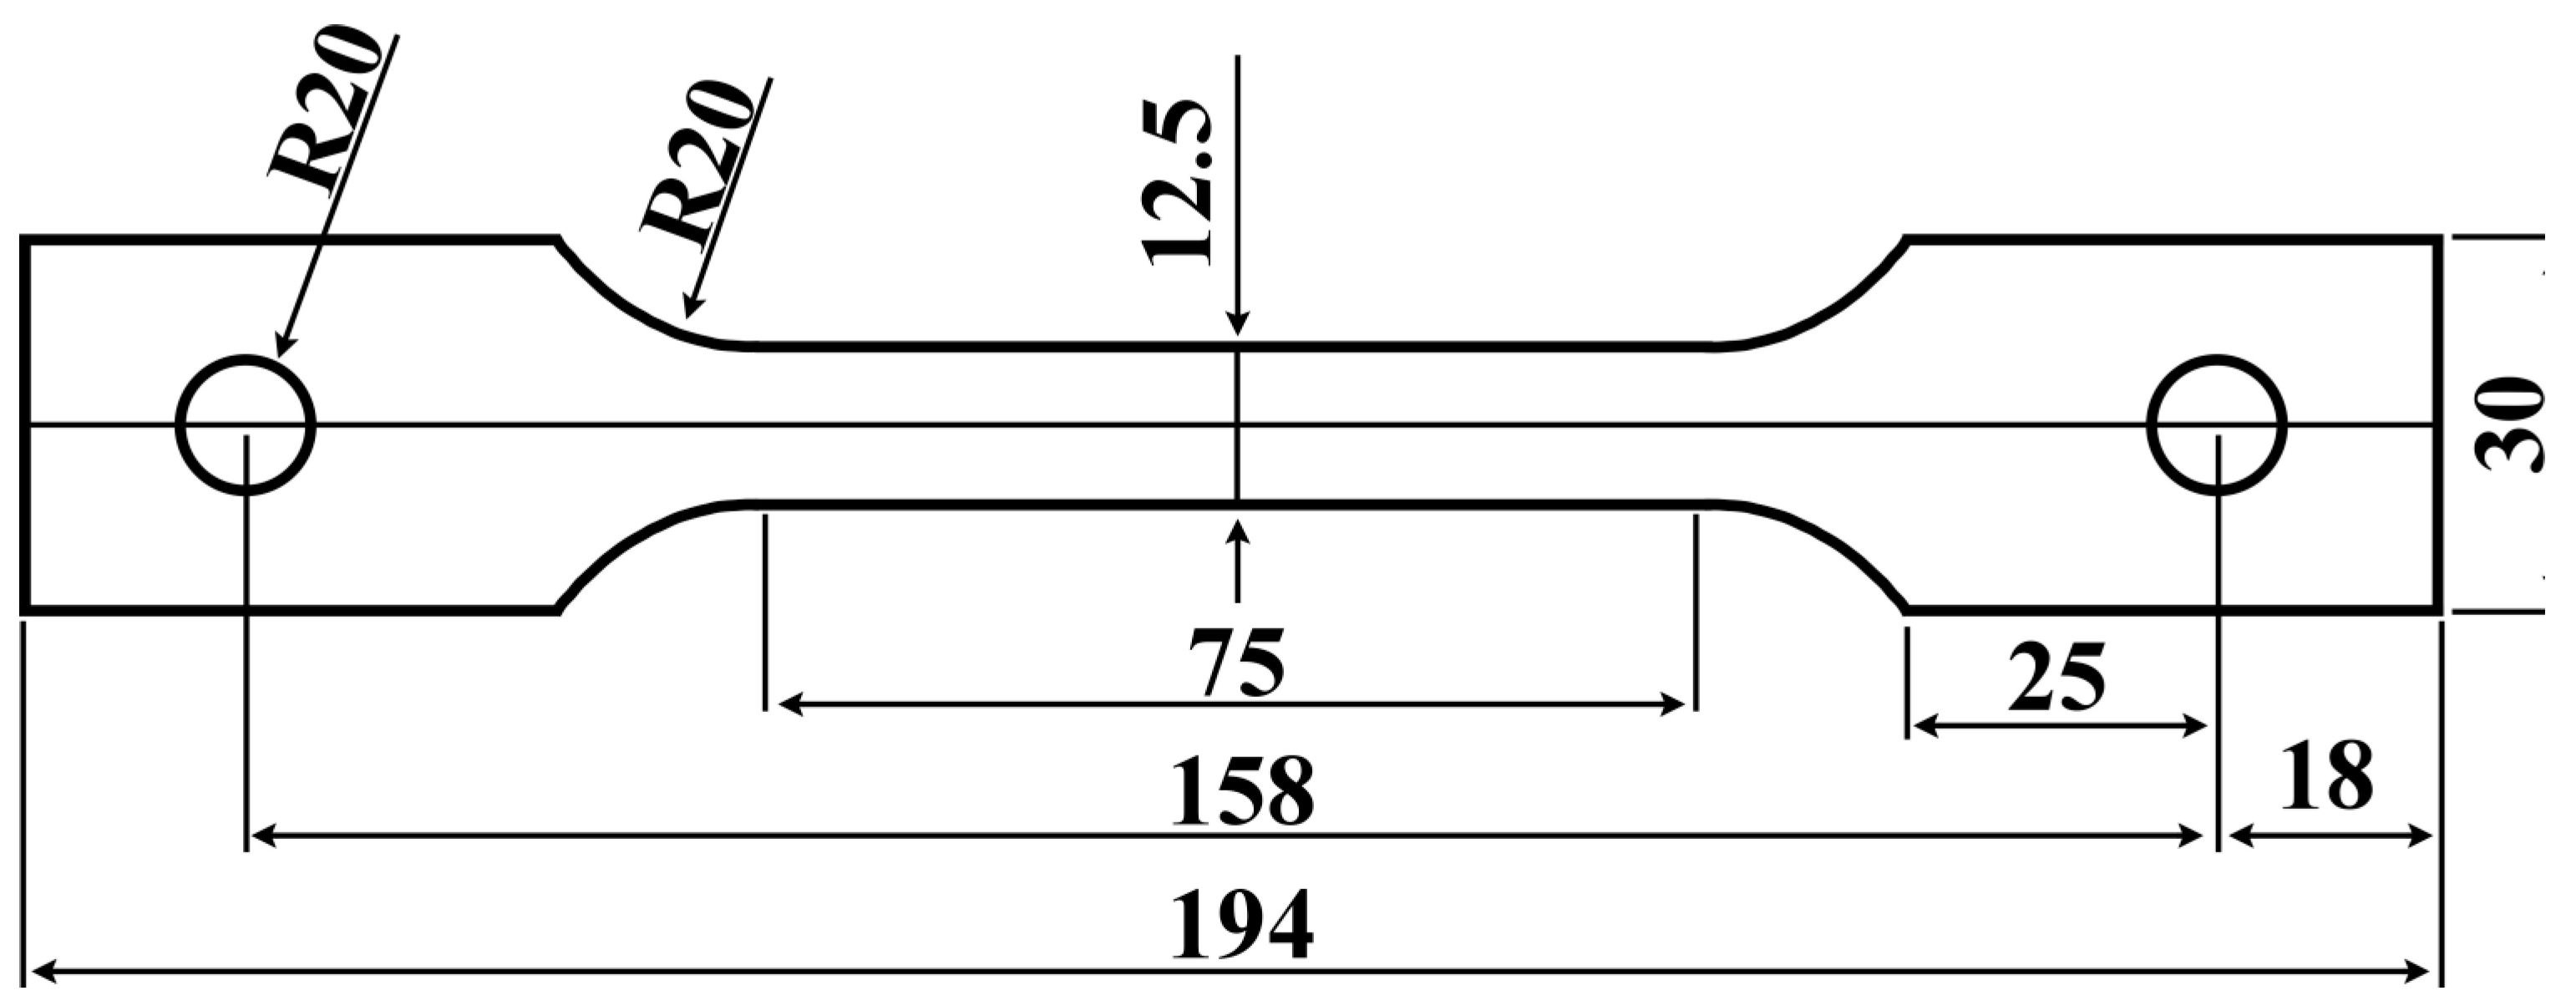
2. Materials and Methods

The experimental high-strength silicon samples investigated in this scientific work was provided by a steel producer in the form of hot bands with a thickness of 1.8 mm. The obtained Fe–Si alloy was melted in a vacuum furnace and produced as grade M250-50A characterised by excellent magnetic properties. Table 1 presents the chemical compositions of experimental samples provided by the spark optical emission spectrometry method.
Moreover, according to previously published work [20], the experimental samples were also cut from the edge in the vicinity of brittle damage of the same hot strip. It is important to note the rupture of the cold rolled strip that occurred between the first and second work roll of a typical 5-stand TRM. The mean thickness of the selected samples in the part determined for the stress–strain test was 1.38 mm.
The common mechanical properties of the investigated hot band samples were examined using a tensile test at three different temperatures. The experimental plan was implemented under the scheme shown in Figure 1. In order to use the obtained results from tensile testing the investigated samples for mathematical modelling, the following parameters were determined from the measured values:
ReH; Rp0.2 (MPa)—Upper and conventional yield strengths;
Rm (MPa)—Ultimate strength;
A5 (MPa)—Total elongation;
Σtrue (Mpa)—True stress;
φtrue (-)—True (logarithmic) strain;
φ ˙ (s−1)—Strain rate;
K (-)—Material constant;
n (-)—Strain hardening exponent.
The stress–strain characteristic was measured on short flat strips presented in Figure 2. For each heat deformation condition shown in the diagram in Figure 1, three samples in the rolling direction (RD) were tested. The measured part of the specimen was designed in accordance with STN EN ISO 6892-1 [24]. The tensile test was performed using the universal testing machine Tinius Olsen H300KU with a special working chamber, which allows for the testing of samples at elevated temperatures. The detection of the determined temperatures was carried out by the thermos vision camera FLIR SC 620. The temperature distribution of the tested samples at 60 °C and 100 °C are presented in Figure 3.
Next, hot band samples were subjected to various degrees of deformations at room temperature in the range from 7% to 72%. These cold-rolled samples were used for the determination of their mechanical properties depending on the reduction degree. Cold rolling of the investigated samples in the form of the narrow strips with planar dimensions 300 mm × 30 mm (the longest side was parallel to the rolling direction) was carried out by means of laboratory cold rolling mill with a roll diameter of 210 mm.
The laboratory-deformed hot band samples were subjected to the measurement of the limit strains until failure was reached in order to determine the critical stress–strain conditions for a plastic fracture for individual strains via cold rolling. From the measured values, the Cockcroft–Latham (CL) criterion can be determined. Cockcroft–Latham (CL) plastic fracture criterion is the most widely used formability criterion in engineering applications, mainly for bulk-forming operations. Cockcroft and Latham fracture criterion is based on a critical value of the tensile strain energy per unit of volume. The normalised version of Cockcroft–Latham (nCL) is given in [25,26].
C = 0 ε e f ¯ σ 1 σ ¯ . d ε ¯
where C is the calibration constant, σ 1 is the maximum tensile principal stress, σ ¯ is the effective stress according to the von Mises, ε e f ¯ is the effective strain at the fracture and ε ¯   is the increment of effective strain.
The geometry of specimens used in these measurements is shown in Figure 4. As seen in Figure 4c, these tested samples have a specific form with a highlighted middle part, which is covered by a layer of white colour with small black dots. The coating on the samples allows us to detect via video extensometer the change in the distance between the different black dots during the mechanical tensile test and then mathematically calculate the CL parameter for the tested sample.
All samples for the mechanical testing of experimental hot bands were prepared by electrical discharge machining using a spark erosion device with commercial title EIR-EMO 2N (Emotek s.r.o., Nové Mesto nad Váhom, Slovakia).
A Tinius Olsen video extensometer was applied to record the course of deformation during the diametrical compression (DC) test. A digital image correlation system implemented in the GOM Correlate software (version Hotfix 5) was used to measure the displacement and monitor the deformation of the samples. The tensile test was carried out as two-dimensional modes using a commercial finite element metal-forming code from DEFORM-TM software under laboratory test conditions.
Microstructural and distribution of local mechanical stresses through the cross-section of different cold-rolled selected investigated strips were carried out by employing scanning electron microscope (SEM) JEOL JSM-7000F (Jeol Ltd., Tokyo, Japan) equipped with electron back-scattered diffraction (EBSD) detector Nordlys-I (HKL technology A/S, Hobro, Denmark). The texture analyses were carried out using EBSD method in the normal direction plane for each sample of 25 mm × 10 mm in size. The recorded EBSD data were processed by the CHANNEL-5, HKL software package (Service pack 7). Mechanical grinding and polishing were performed for the preparation of the metallographic surface of the investigated samples. Measurement of local mechanical stress distribution through the thickness of cold-rolled hot band requires a high-quality surface of the analysed sample. For this reason, the surface was prepared by silicon carbide grind papers with a grid in the range from 180 to 4000. The final polishing was carried out by colloidal silica suspension with grain size 0.04 µm.

3. Results and Discussion

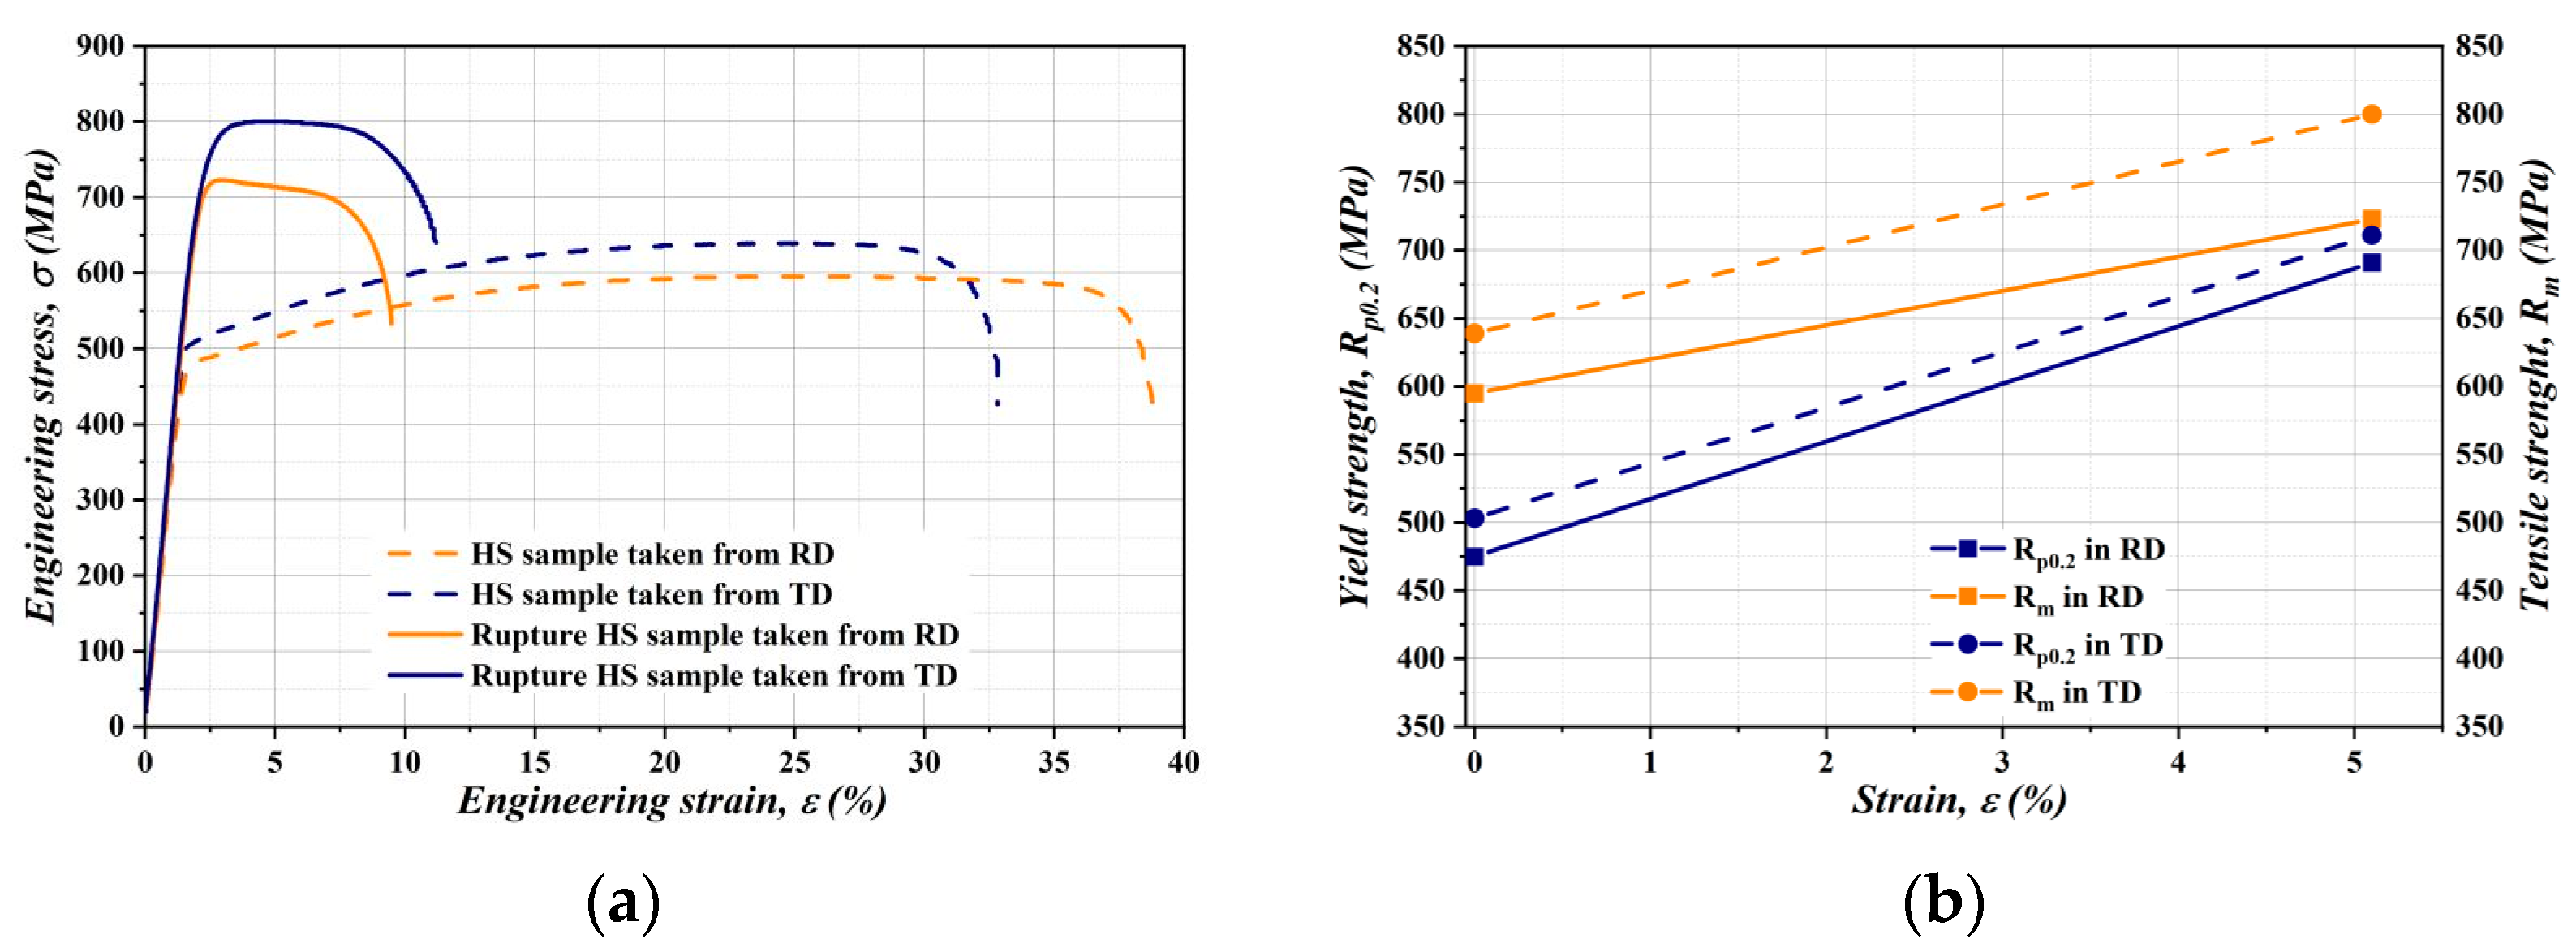
3.1. Investigation of Mechanical Properties of the Ruptured Strip

It is convenient to bear in mind, before the investigation of the deformation mechanisms in hot bands during the tandem cold rolling, that previous research in the field of mechanical behaviour and fracture of engineering materials [27] has indicated that the steel mechanical behaviour is partly affected by the deformation temperature in the process of its rolling. Because of this, Fe–Si alloys may indicate two types of behaviour with respect to it, referred to as low-temperature treatment—cold work—and high-temperature treatment—hot work. The main difference is that during the hot work process, the plastic deformations in the treated sheet are achieved by time-dependent thermally activated processes such as diffusion and viscous flow, whereas at low temperatures, deformation mechanisms are induced by different kinds of factors that are independent of time. The difference between the various behaviours of steels during the treatment at high and low temperatures is exhibited very clearly in the tension stress–strain curve. It is important to state that stress–strain curves obtained during the mechanical test present the main mechanical parameters such as steel reduction in the elastic modulus, yield strength, and ultimate tensile strength, depending on their strengthening mechanisms. In order to investigate the mechanical properties of high-strength electrical steels during the tandem cold rolling, the prepared experimental samples were subjected to stress–strain tests depending on the temperature and the strain rate.
The stress–strain analysis of the investigated silicon steel was performed on specimens prepared according to the scheme presented in Figure 2. A mechanical test was carried out on the two types of samples. One group of samples was prepared from the hot strip before the cold-rolling process. Other kinds of samples were taken from a part of the same band near the rupture line, which formed after its brittle failure during the rolling in the 5-stand CRM. The tested samples were taken from the investigated band sheet in the rolling (RD) and transverse directions (TD). Figure 5a indicates tensile stress–strain diagrams of tested samples obtained at room temperature. The mechanical parameters of the tested samples are summarised in Table 2.
It can be clearly seen that the two types of investigated hot strip (HS) samples are characterised by the completely different behaviours of plotted stress–strain curves. Here, the HS samples in the received state and a sample taken from a ruptured band are represented by dashed lines and solid lines, respectively. A comparison of the obtained results shows that the HS samples are characterised by the lowest value of yield strength and tensile strength than the same samples prepared from the failed hot band. On the other hand, the uniform plastic elongation of HS samples is about 25% and that of the ruptured HS sample is about 5%.
It should be noted that Rm and Rp0.2 are much higher for both types of samples prepared from the transference direction. In the case of the rupture sample, this tendency is more visible than in referenced hot band strips. Moreover, it is clearly visible that before the rupture, the experimental HS samples were defined by the highest value of elongation, namely in the rolling direction, but after the rupture, the elongation in this direction showed the lowest value. Based on all previous experimental results, it can be concluded that hot strips after the first deformation at 5-stand CRM are extremely hardening. The comparison of yield strength and tensile strength for the tested sample in RD and TD at a maximum strain of 5.1% is presented in Figure 5b. This diagram shows a pronounced directional anisotropy of the strengthening properties of the hot strip (without cold deformation). The Rp0.2 value in the TD is approx. 150 MPa higher than in the RD; likewise, the Rm value in the transverse direction is approx. 140 MPa higher than in the longitudinal direction. After the rupture, in the rolling direction, a serious condition occurs where the yield strength of Rp0.2 value in the transverse direction reaches the ultimate strength Rm value in the rolling direction. This condition may, under certain cold rolling circumstances (e.g., high differential inter-stand tensions), result in the nucleation of cracks at the strip edge.

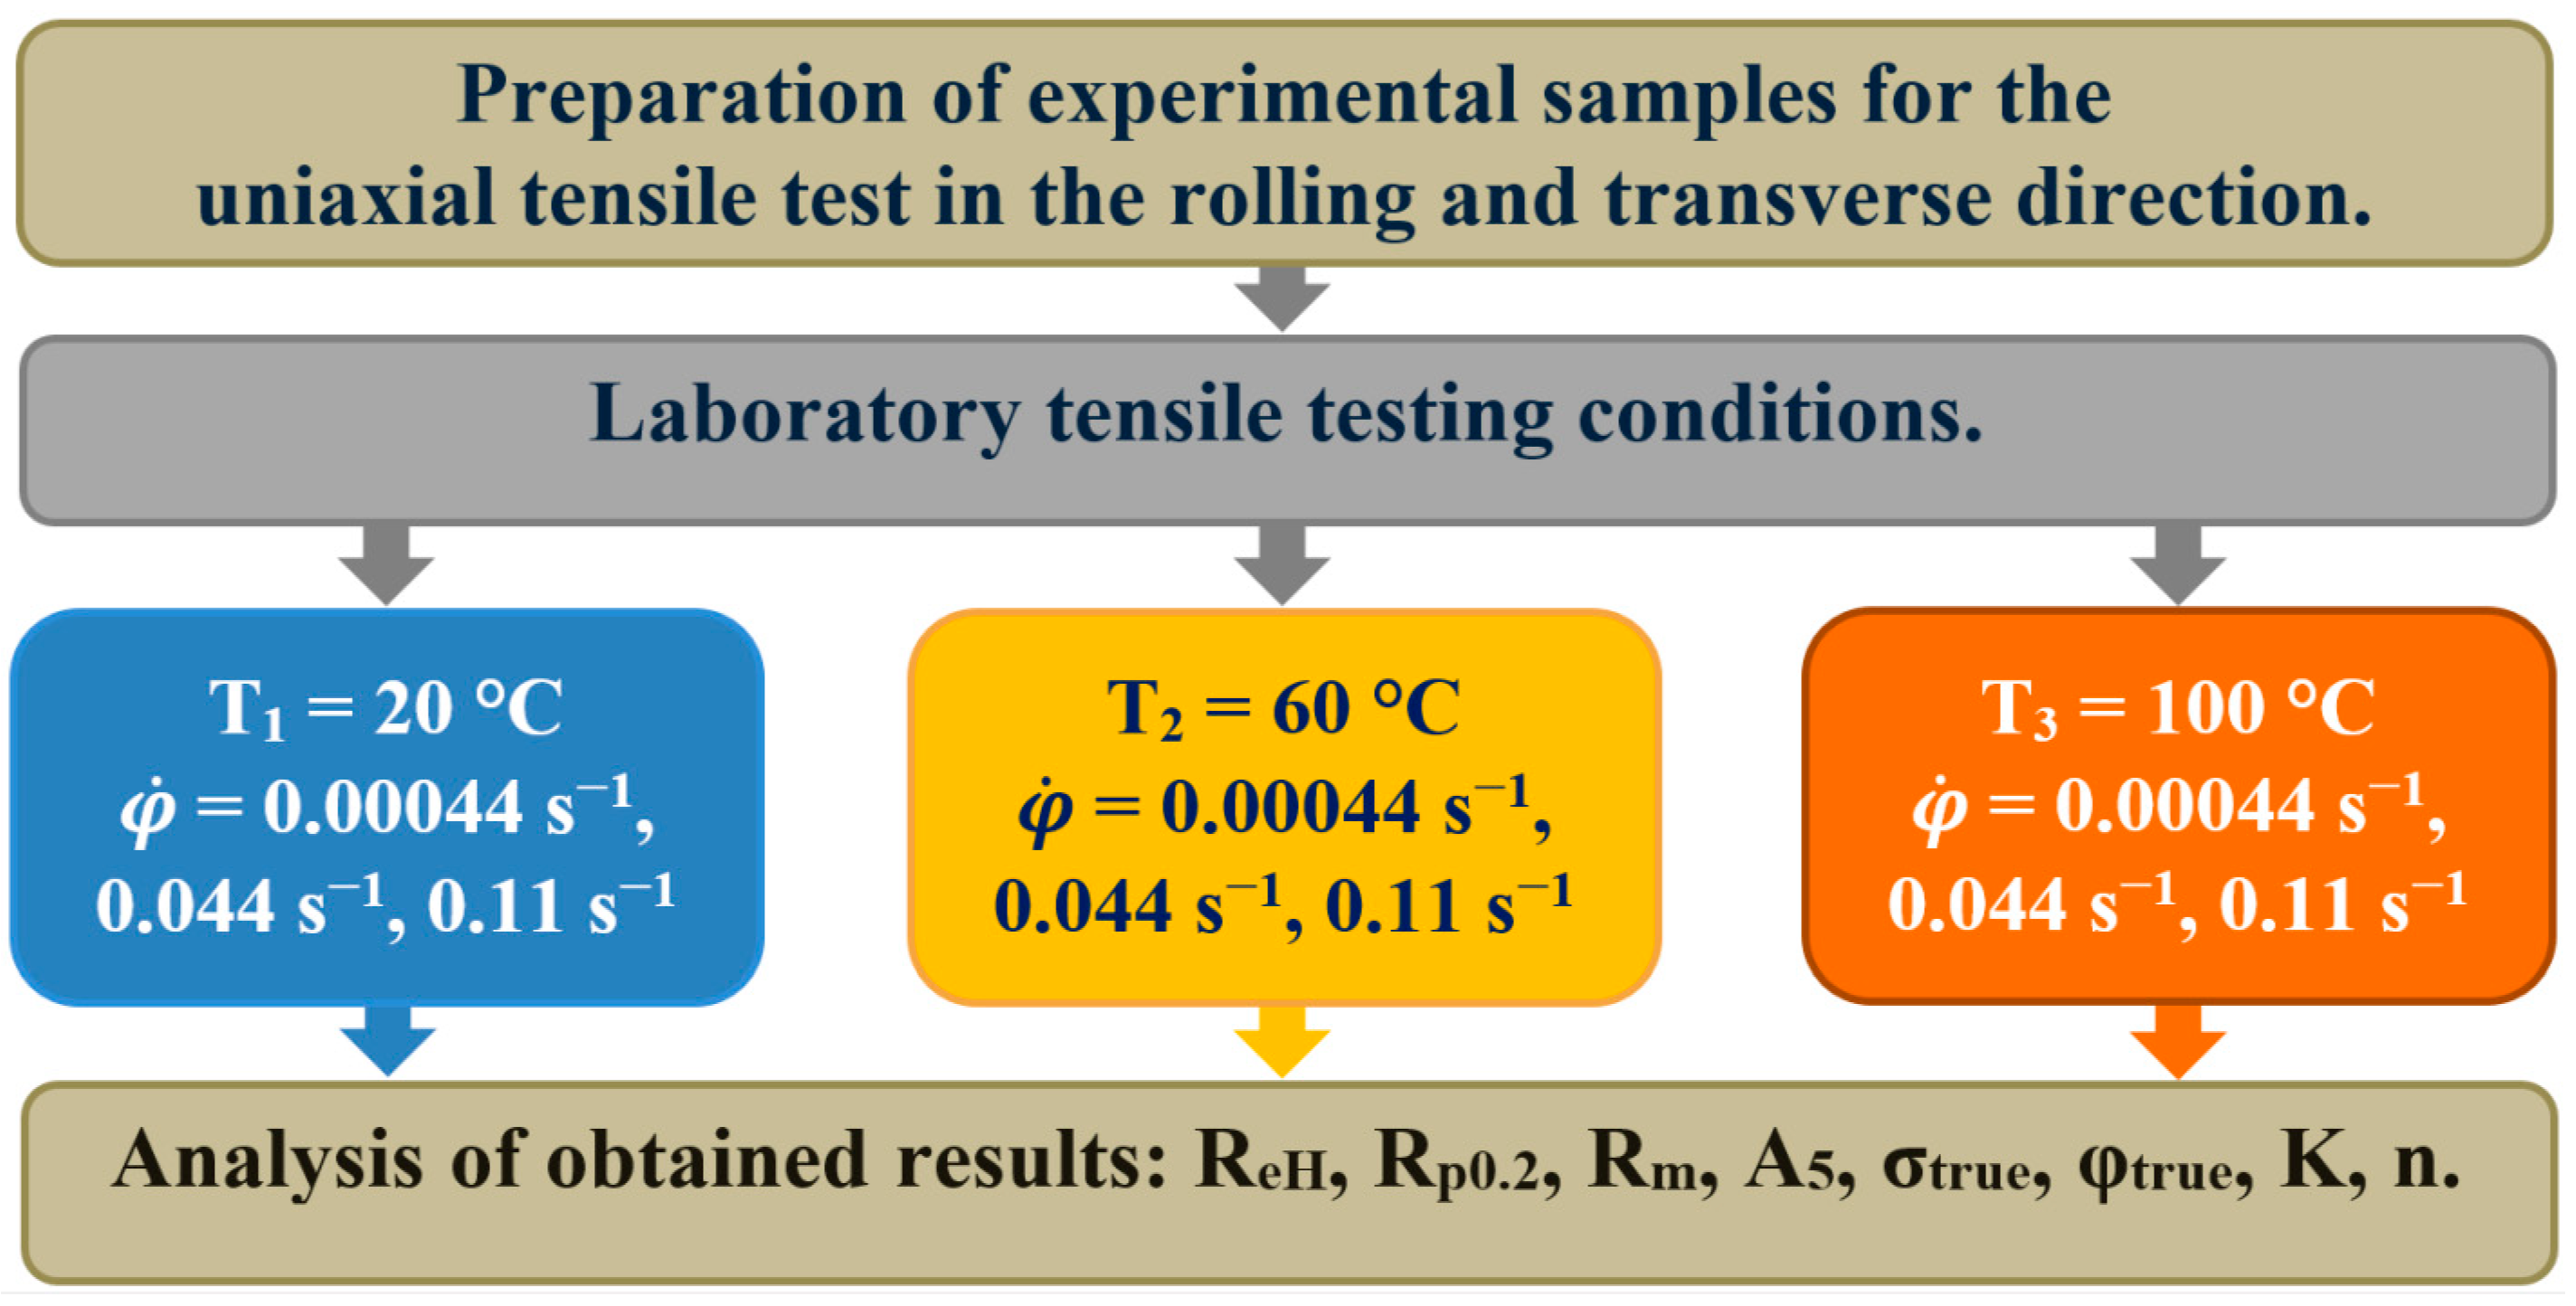
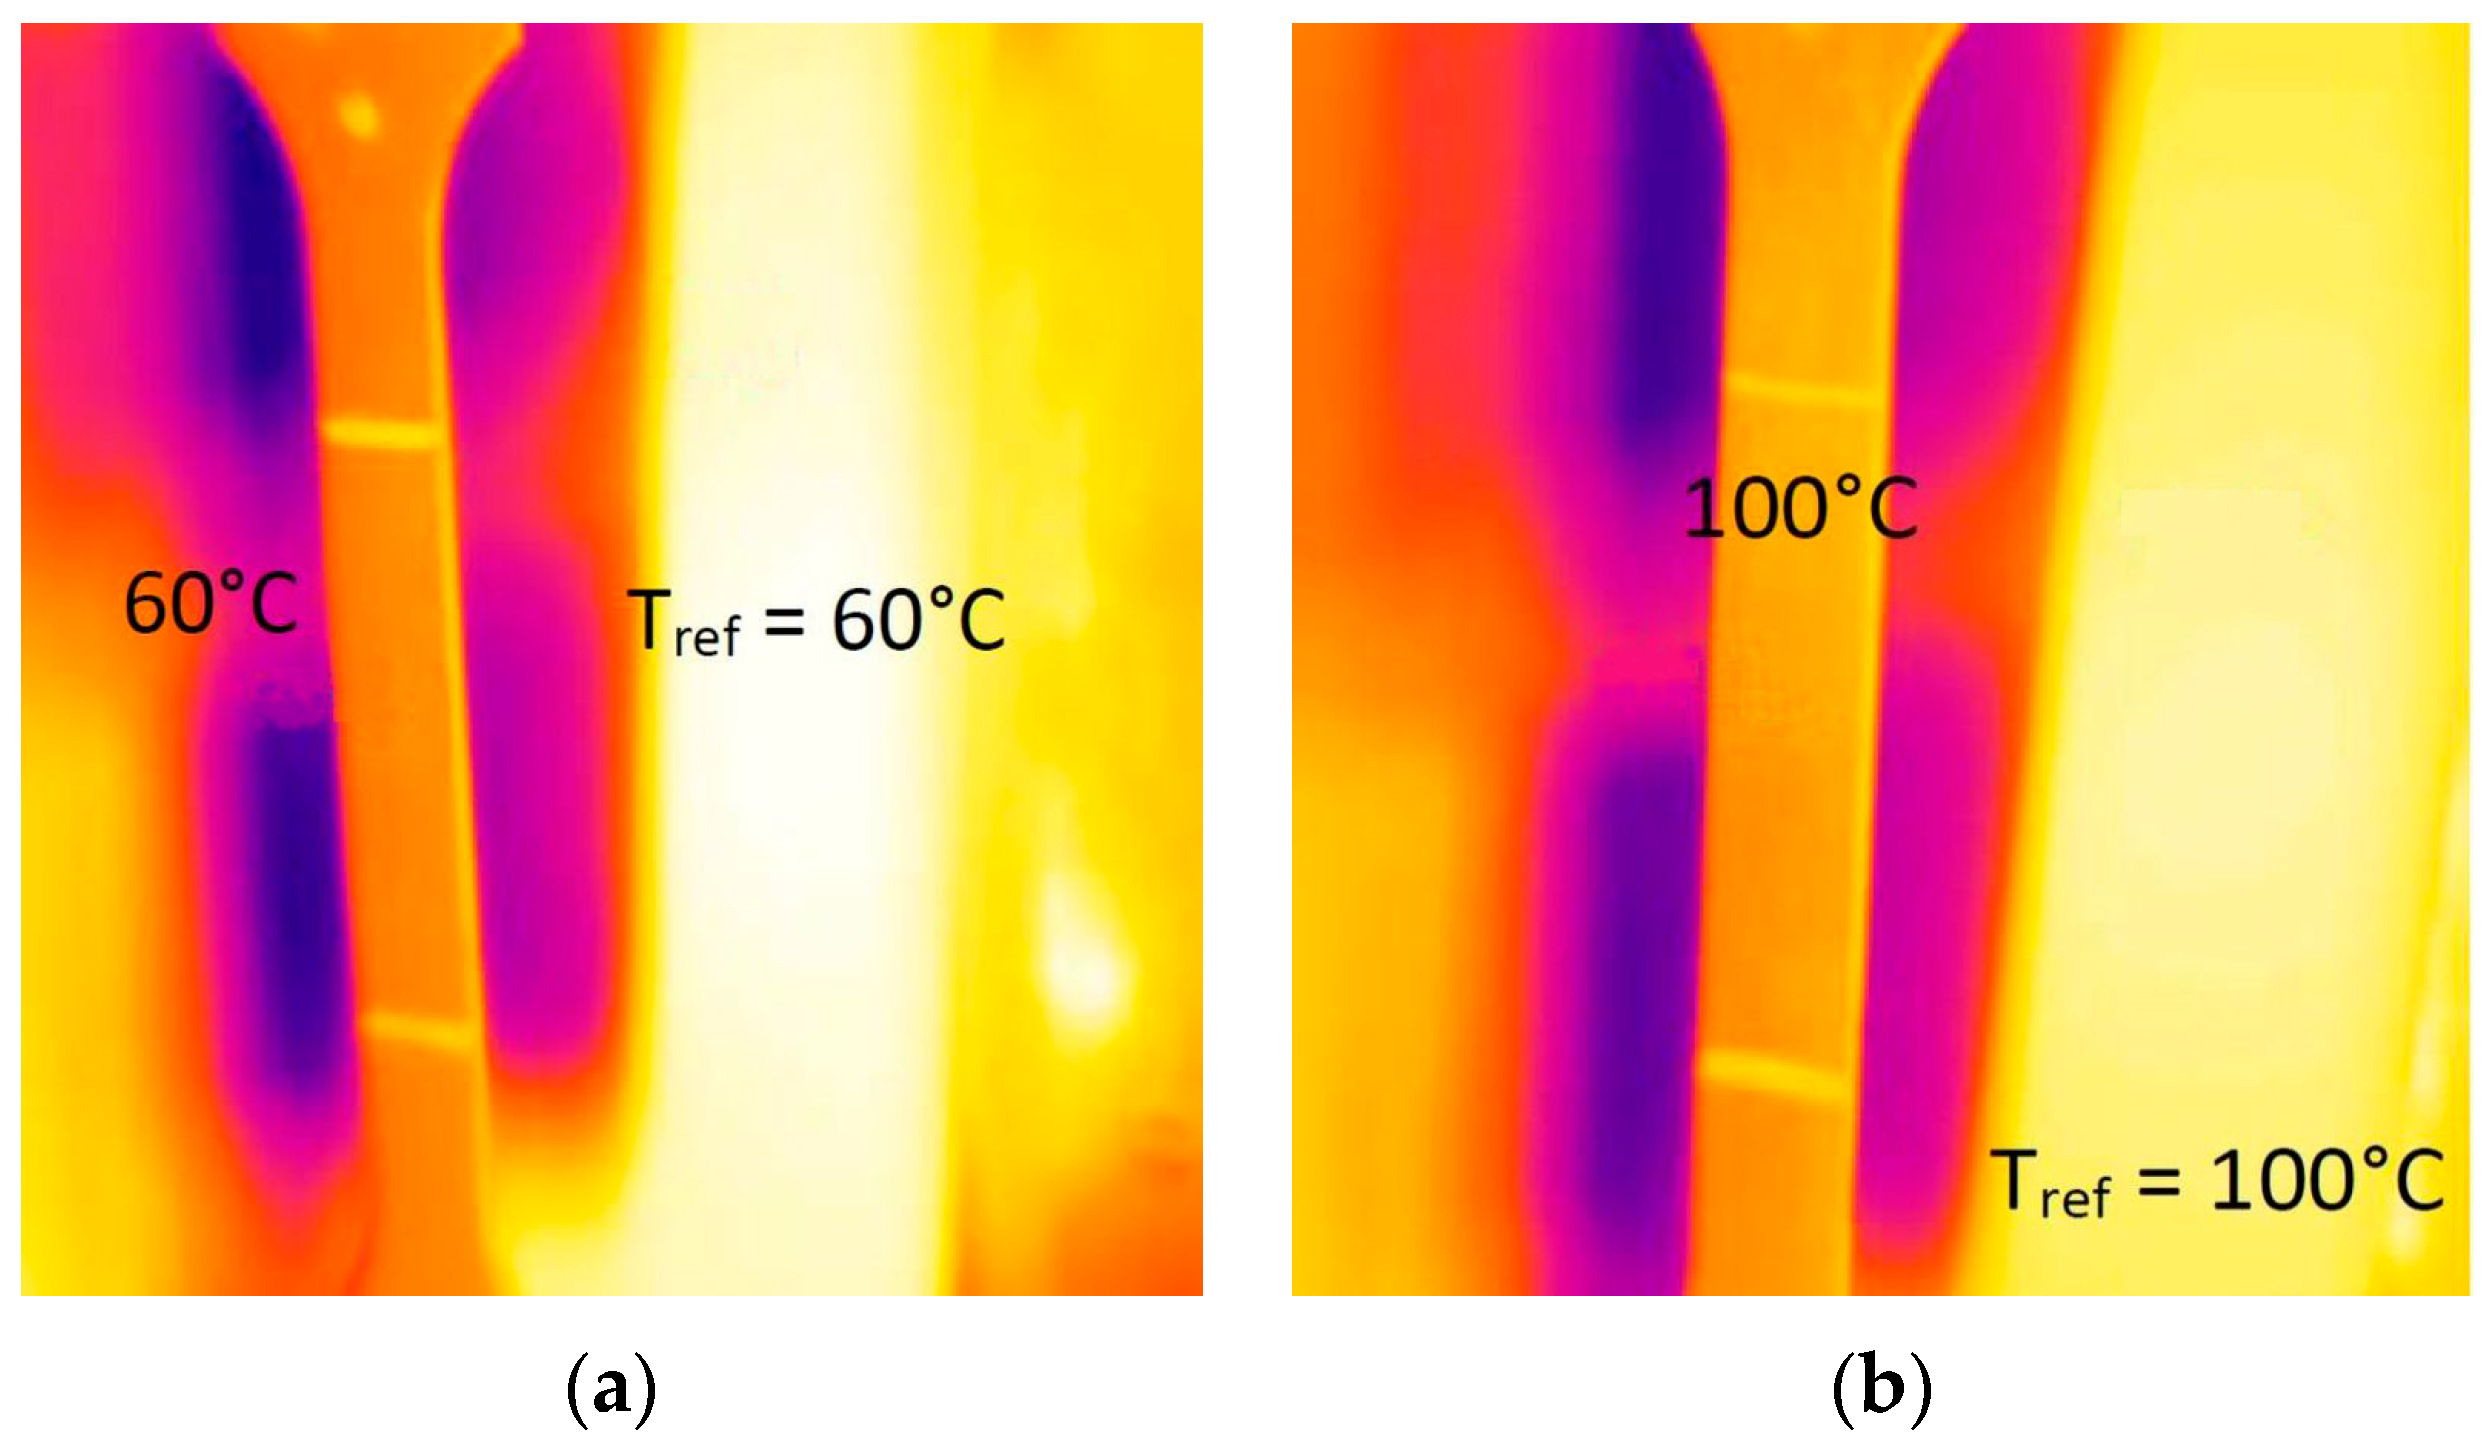
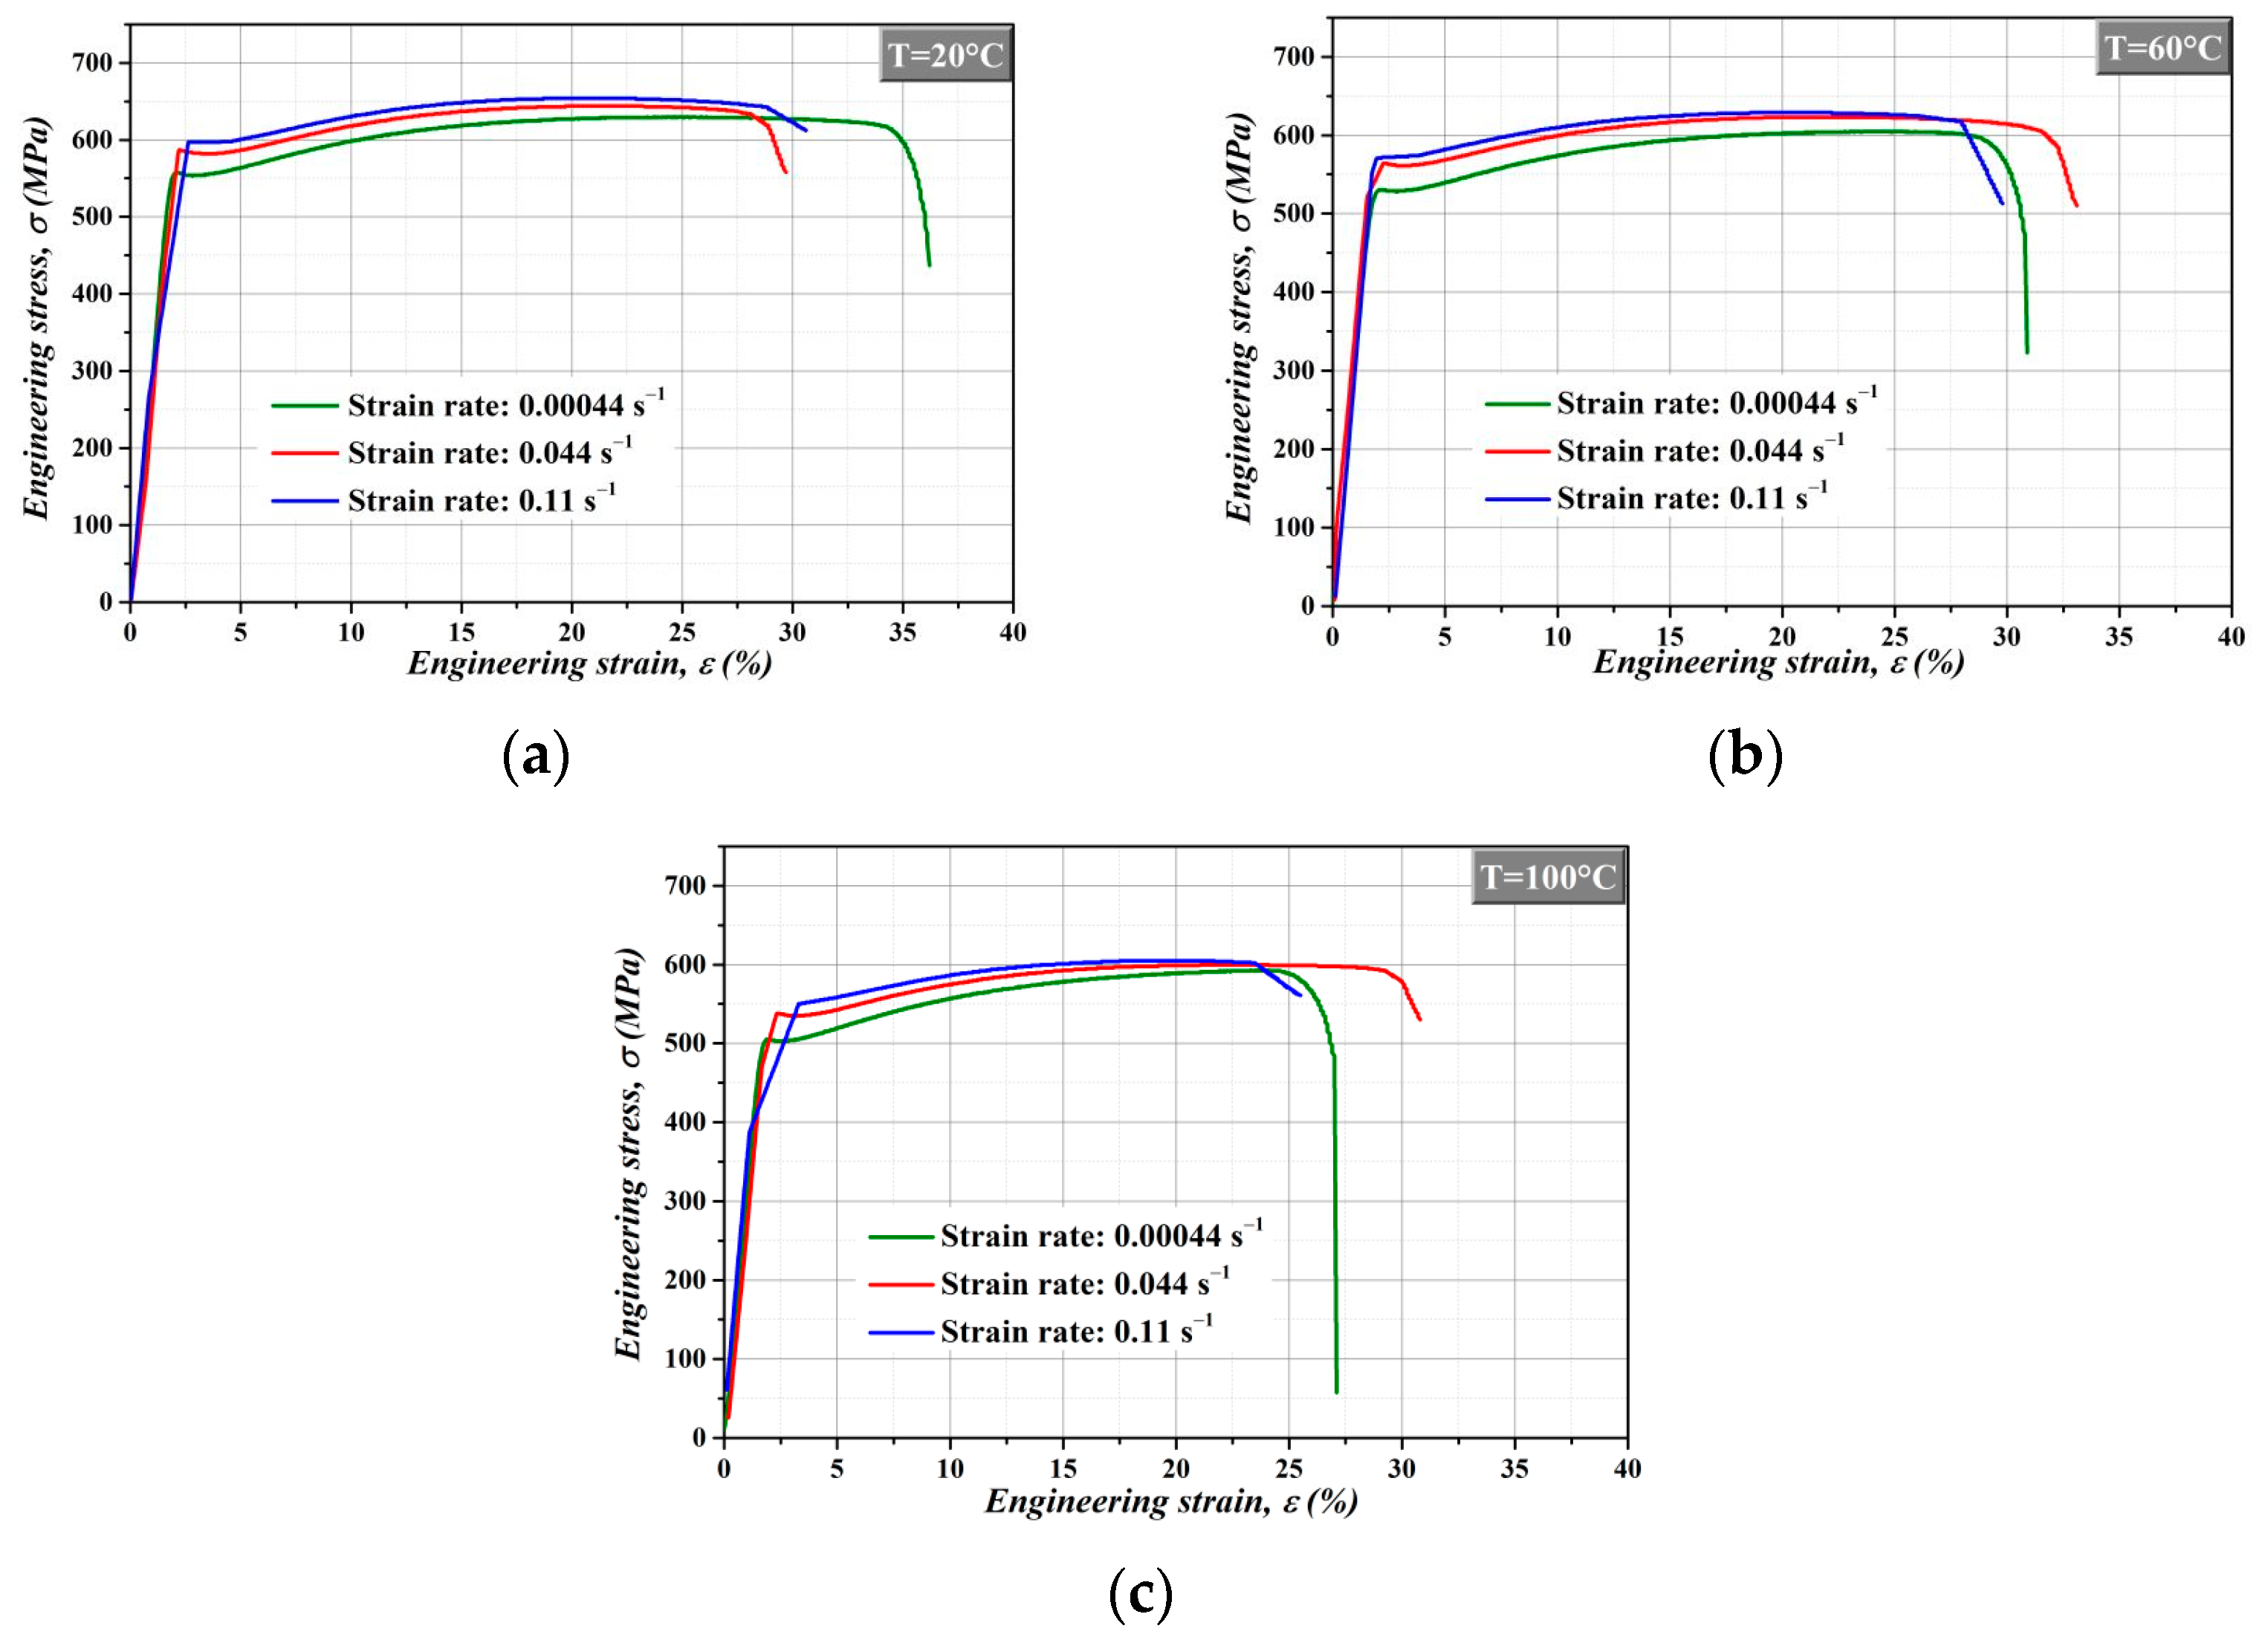
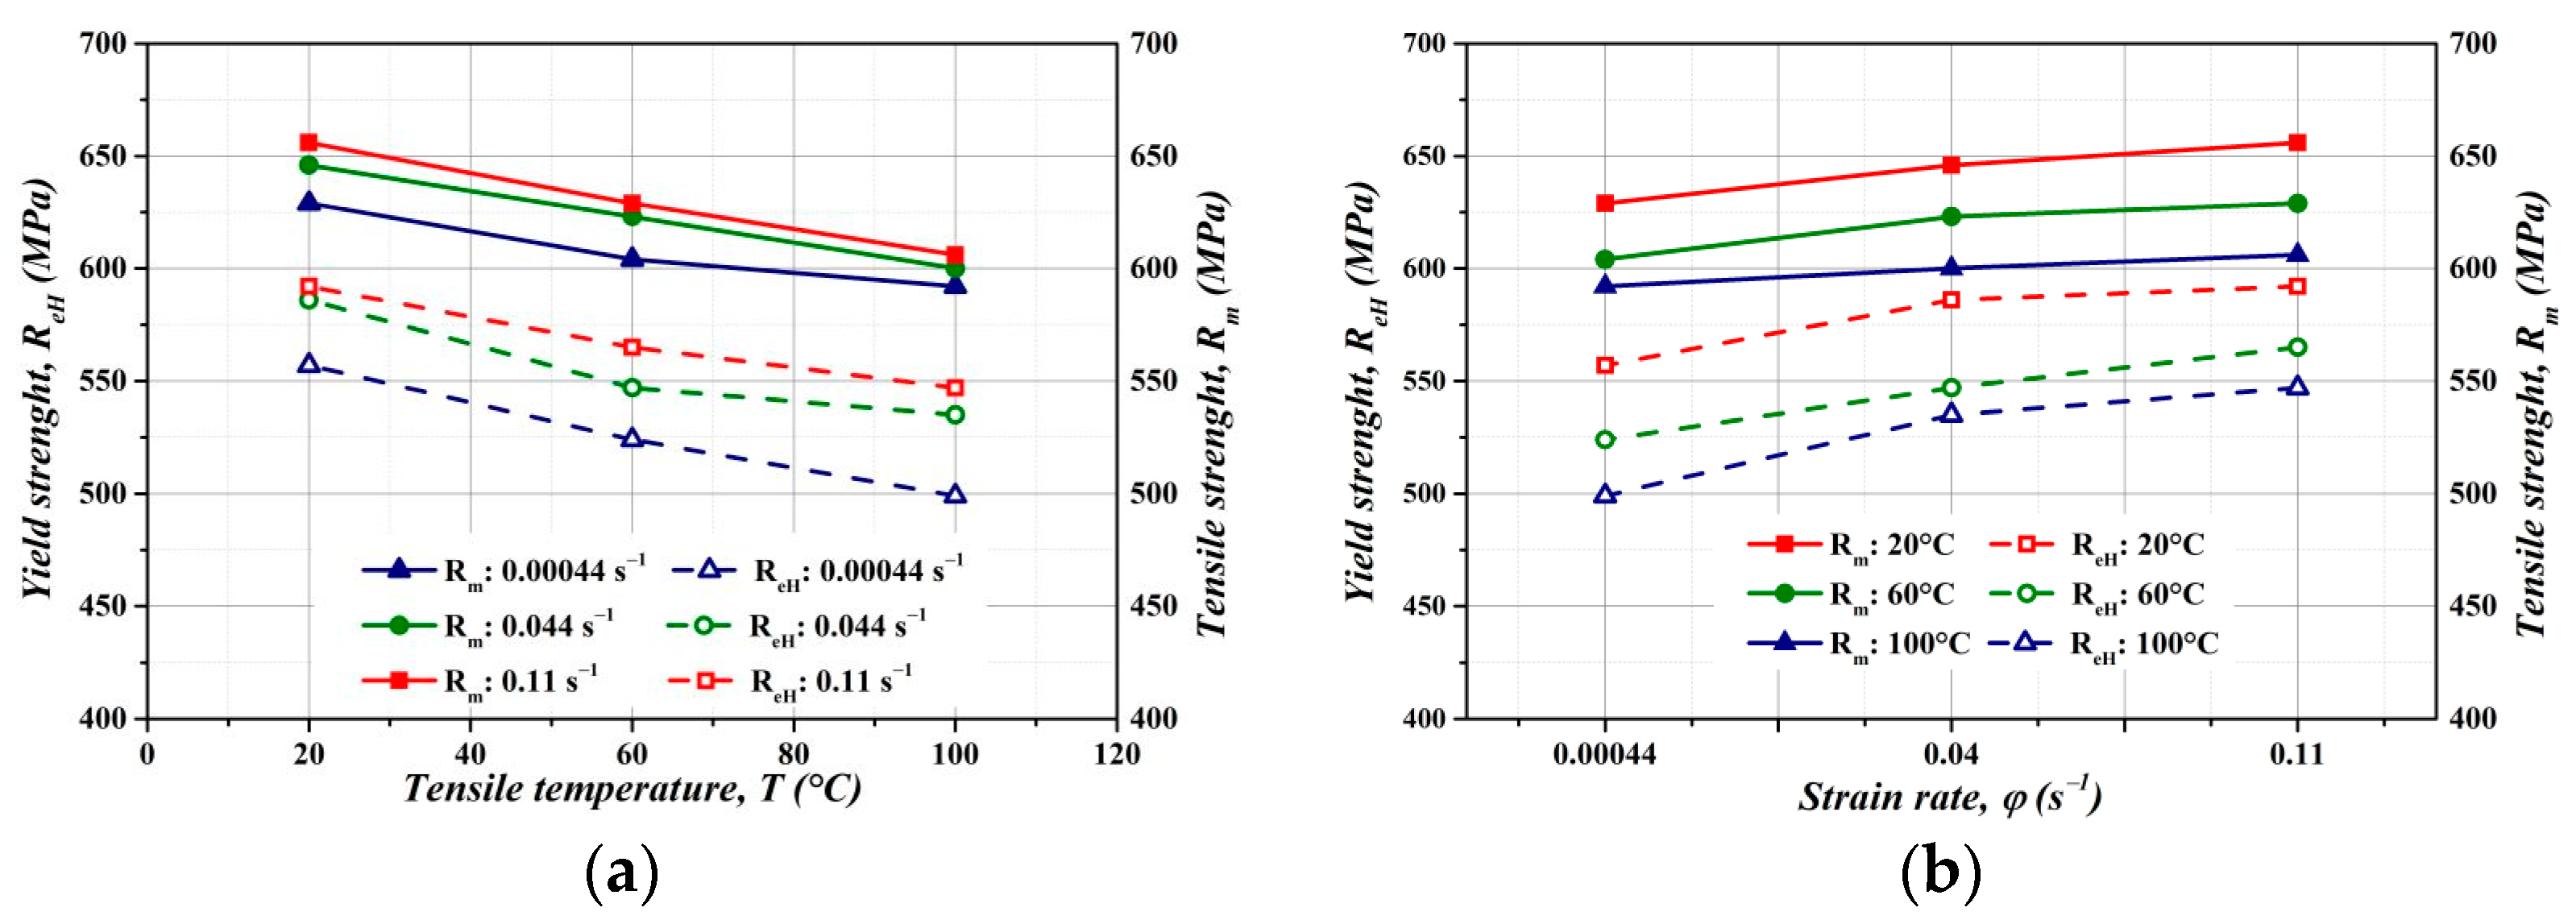
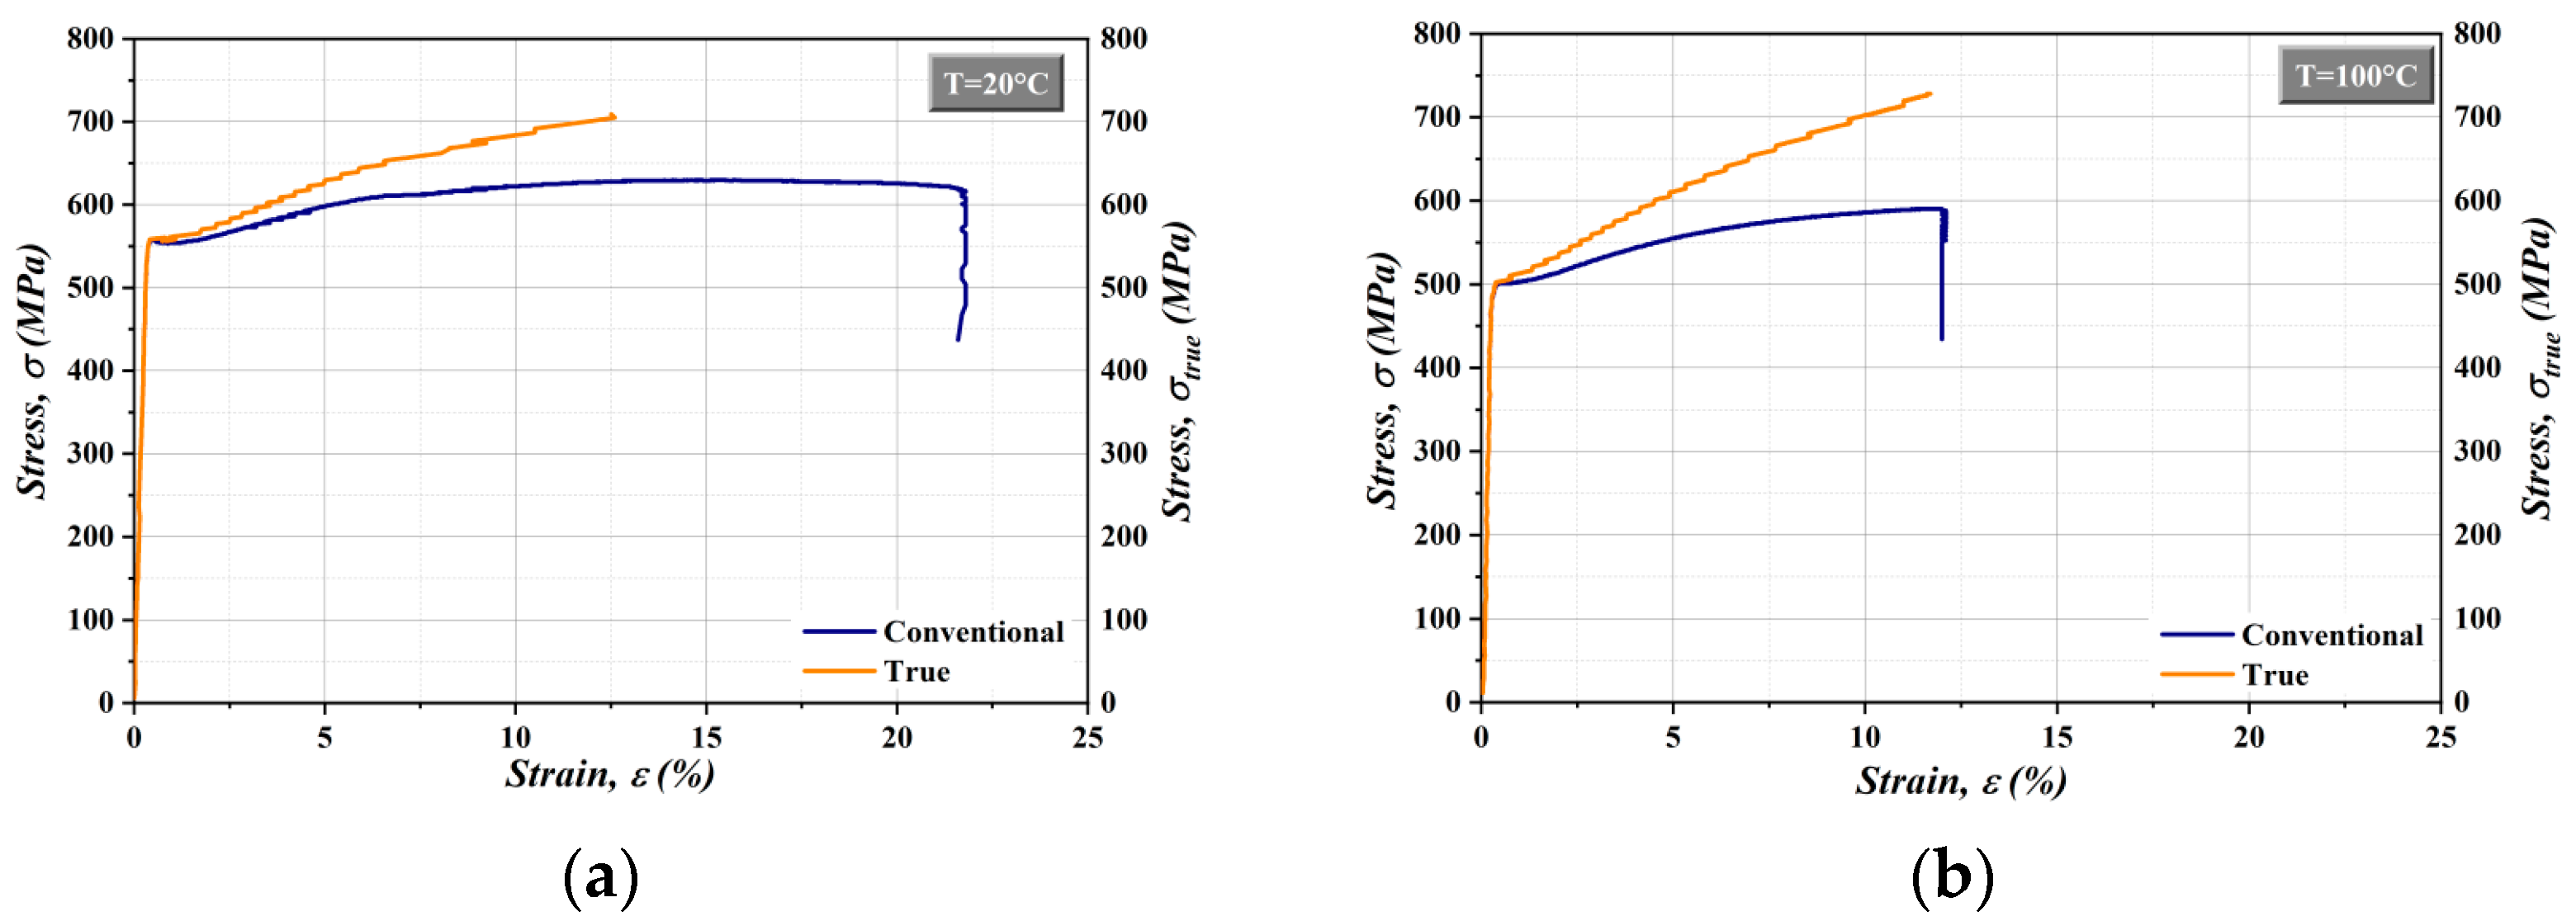
3.2. The Influence of Conditions of Uniaxial Tensile Tests on the Mechanical Properties of Hot Band

As previously mentioned, the investigated Fe–Si steel has the drawback of becoming brittle as the silicon content increases above 3 wt.%, and this feature makes them difficult to cold roll using 5-stand CRM. The influence of temperature and strain rate on the stress–strain characteristics, flow stress, elongation, and mechanical properties are very important to understand the strengthening process of hot bands during the cold rolling process. In this part of our scientific work, the uniaxial tensile tests were performed at three different temperature and strain rates of HS samples. Figure 6 shows the engineering stress and strain rates as a function of engineering strain at room and elevated temperatures. It was observed that the stress–strain curve significantly depends on tensile temperatures and applied strain rates.
The average value of upper yield strengths and ultimate strength measured at different temperatures and strain rates is presented in Table 3.
The tested material can be characterised as a material having a high yield strength, where the ReH-to-Rm ratio decreases with an increasing strain rate. Table 3 shows the average ReH and Rm values determined at different temperatures and strain rates and their patterns are shown in Figure 7. The ReH and Rm slightly increase with an increasing strain rate, while they decrease with an increasing temperature. The results presented in Figure 7 were obtained from the stress–strain diagrams shown in Figure 6.
The investigation of mechanical properties of hot band samples depending on the thermo-deformation conditions play an important role in improving their workability and straining behaviour during cold rolling. The yield strength tested at the higher tensile temperature decreased from a maximum of 592 MPa at 20 °C, 0.011 s−1 to a minimum at 499 MPa at 100 °C and 0.00044 s−1. A similar character of the changes was observed for tensile strength. It was found that the dependence of the yield strength on the strain rate has an increasing tendency for all investigated strain rates. Generally, graphical dependences show that the strength properties decreased with increasing tensile temperatures, while the opposite character of the changes describing the strength properties on the strain rates was observed. Experimental work has shown that a higher tensile temperature and declining strain rate can lead to the softening of material based on an increased dislocation motion, because diffusion ability grows with a increasing tensile temperature and declining strain rate. The following reduction in dislocation density inside the grain boundaries leads to a decrease in yield strength. The mechanism of plastic deformation in the bcc crystallographic system occurs in principle via a dislocation motion. The flow stress is an external parameter on which the dislocation motion depends. The flow stress depends on thermal and isothermal parameters [28]. The thermal parameter is described by temperature changes and the thermal parameter depends on the strain rate. The thermal parameter of the flow stress characterises the resistance to the motion of point defects and dislocations related to the microstructural changes [29].

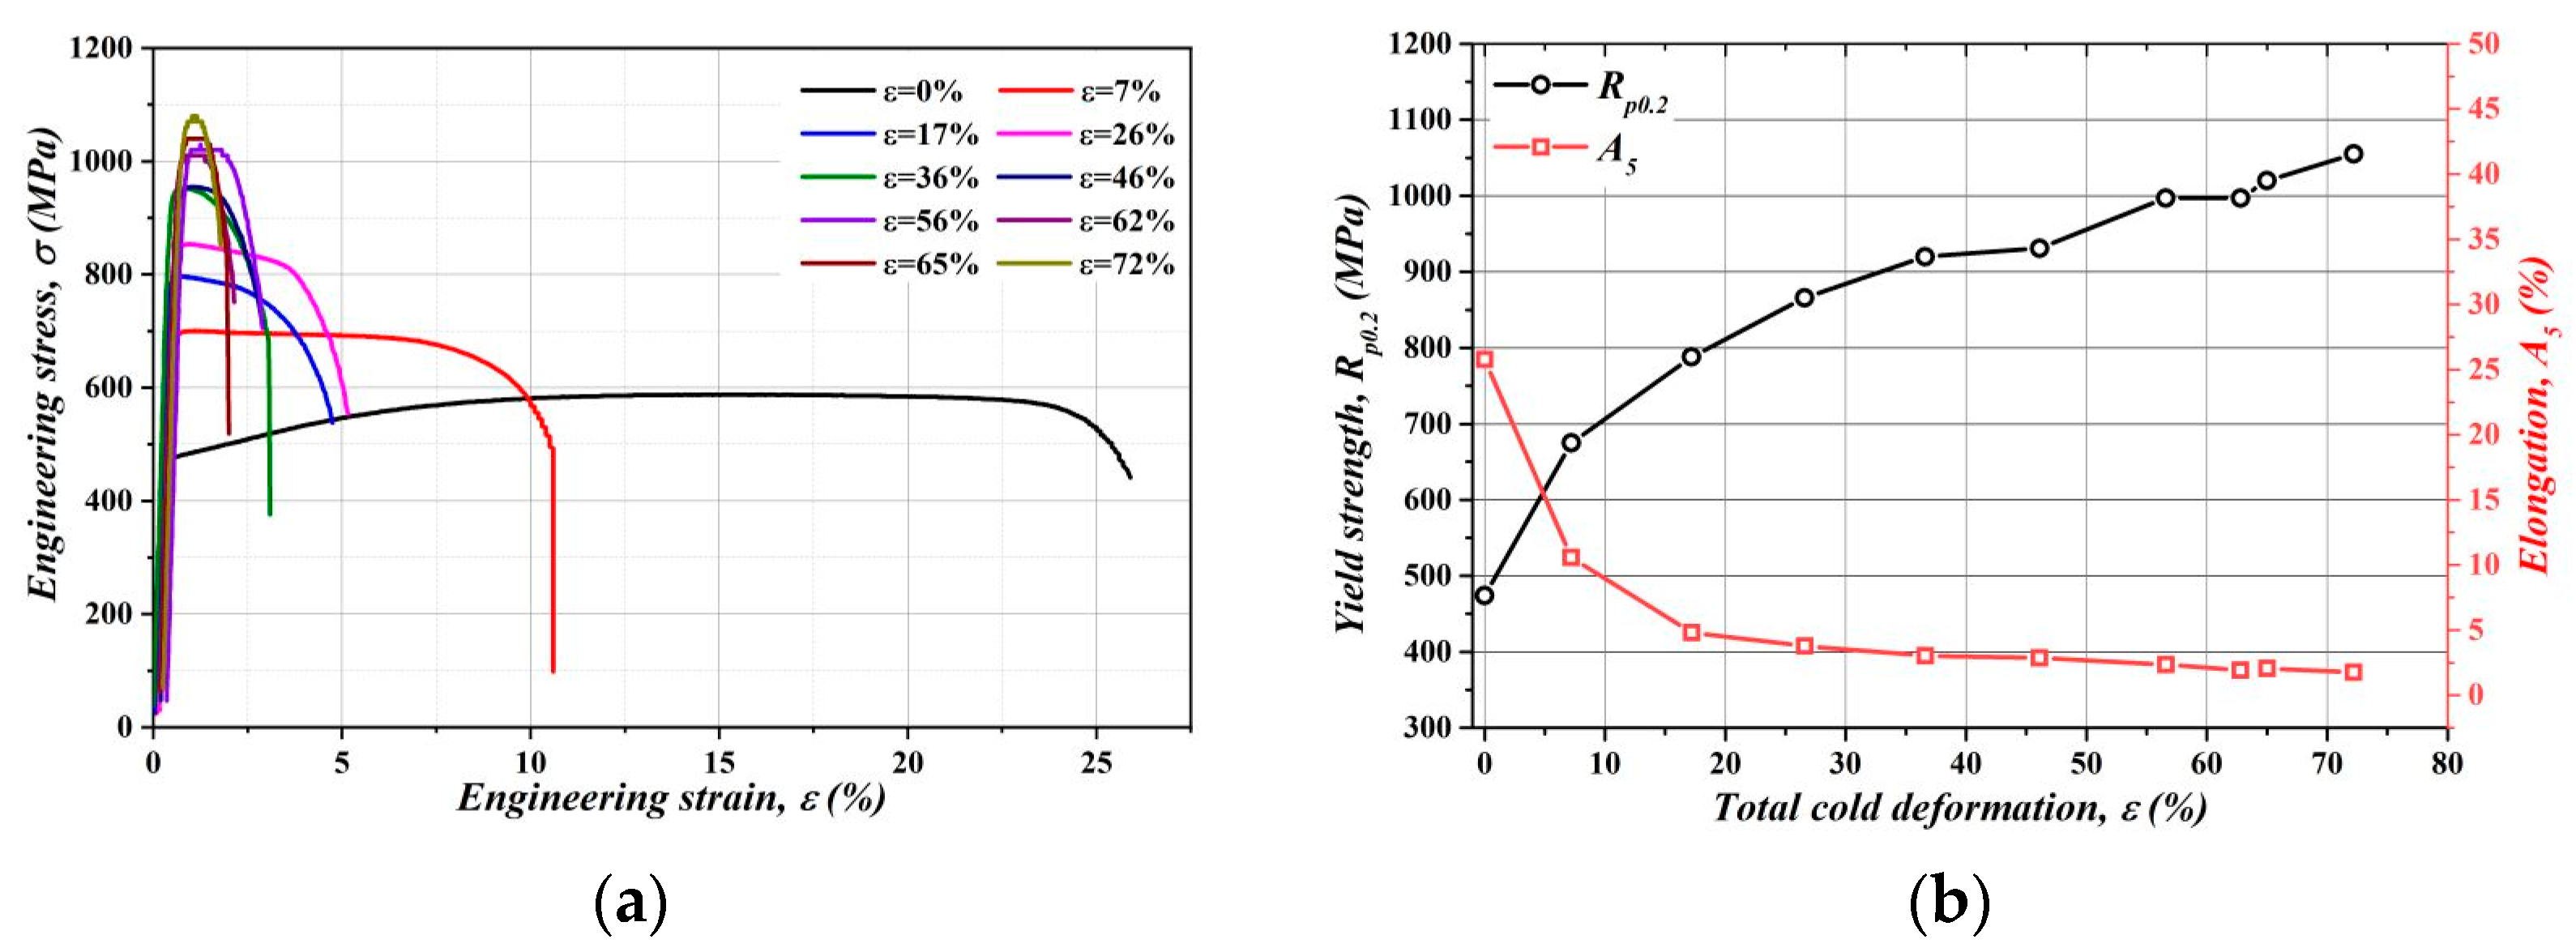
3.3. The Effect of Laboratory Cold Rolling Deformations on the Mechanical Properties of Hot Bands

A change of the stress–strain characteristics of the hot strip depending on the strain degree by cold rolling was focused on the supplementation and verification of the stress–strain characteristics obtained in the previous parts of this scientific work. Investigated hot strips with a thickness of 1.8 mm were rolled at the experimental rolling stand DUO 210 with nine passes to the final thickness of 0.5 mm. After each pass, three short flat specimens were made according to the scheme shown in Figure 2. The strain rate was 0.02 s−1 (i.e., 6 mm/min). Figure 8a compares the tensile–strain diagrams obtained after material processing by cold rolling with various deformations applied through the cross-section. It can be seen from the data that strength increases and plasticity decreases depending on the growth of cold deformation, as is plotted in Figure 8b.
The dependence of strain rate under the cold rolling on the various value of the resulting deformation is shown in Figure 9a. It is apparent from this chart that the strain rate caused by cold rolling increases with an increase in the resulting deformation. To obtain the stress–strain curve, σtrue—φtrue, presented in Figure 9b, the conventional yield strength was used (as the beginning of plastic strain) depending on the logarithmic strain for individual strains. The blue points are the mean values of Rp0.2 through which the second-order polynomial function is plotted, whose parameters are shown in the graph. The coefficients of the Hollomon equation, whose pattern is shown in yellow in Figure 9b, were calculated using a linear regression for processing the measured data (Figure 9c). The calculated equation is σ = 1029.26 × φ0.1261.
From the graphs above, we can see that the growth of strength properties and plastic properties are strongly dependent on the total cold rolling deformation. By the total cold rolling deformation, ε = 73% is possible to reach the maximum value of the yield strength up to the level of Rp0.2 = 1066 MPa. On the other hand, this total cold thickness deformation strongly reduced the elongation up to level A5 = 2%. While the strength properties rise rapidly with the cold rolling deformation, the elongation declines rapidly. The described changes in strength and plastic properties depend on the work hardening of the material resulting from the cold deformation, depending on the increase in the lattice defects, mainly formed by the dislocations density rising.

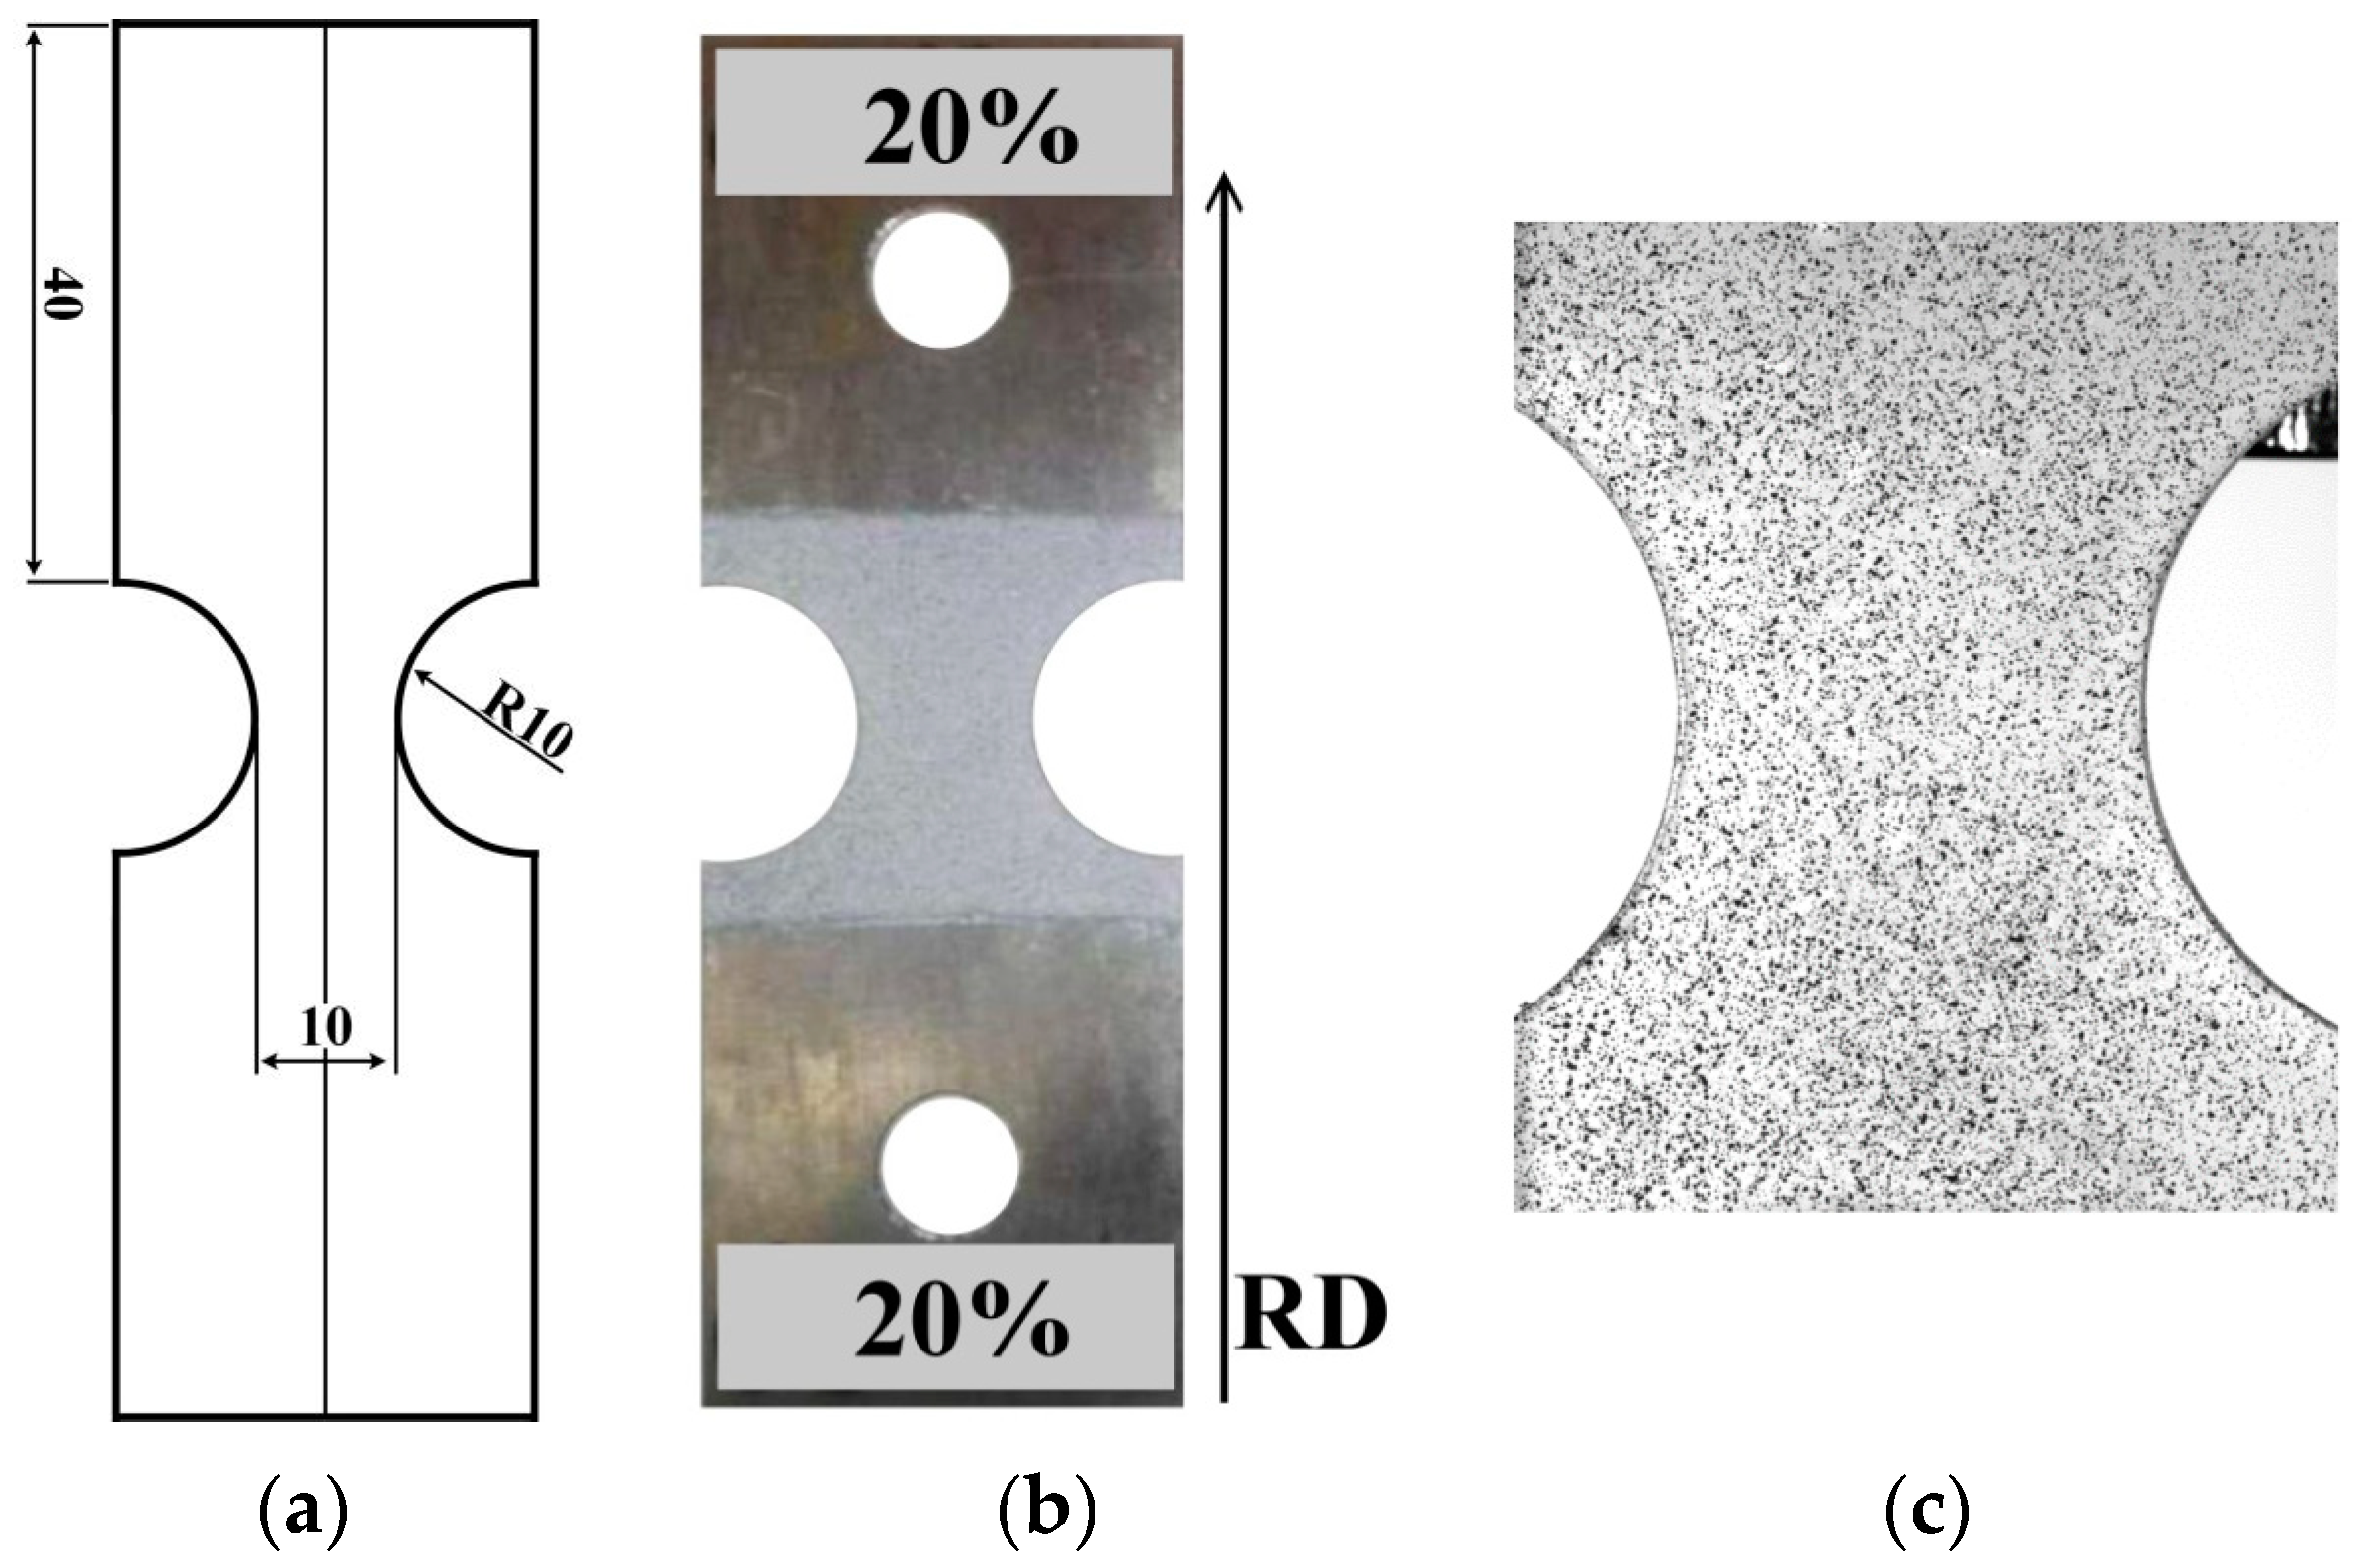
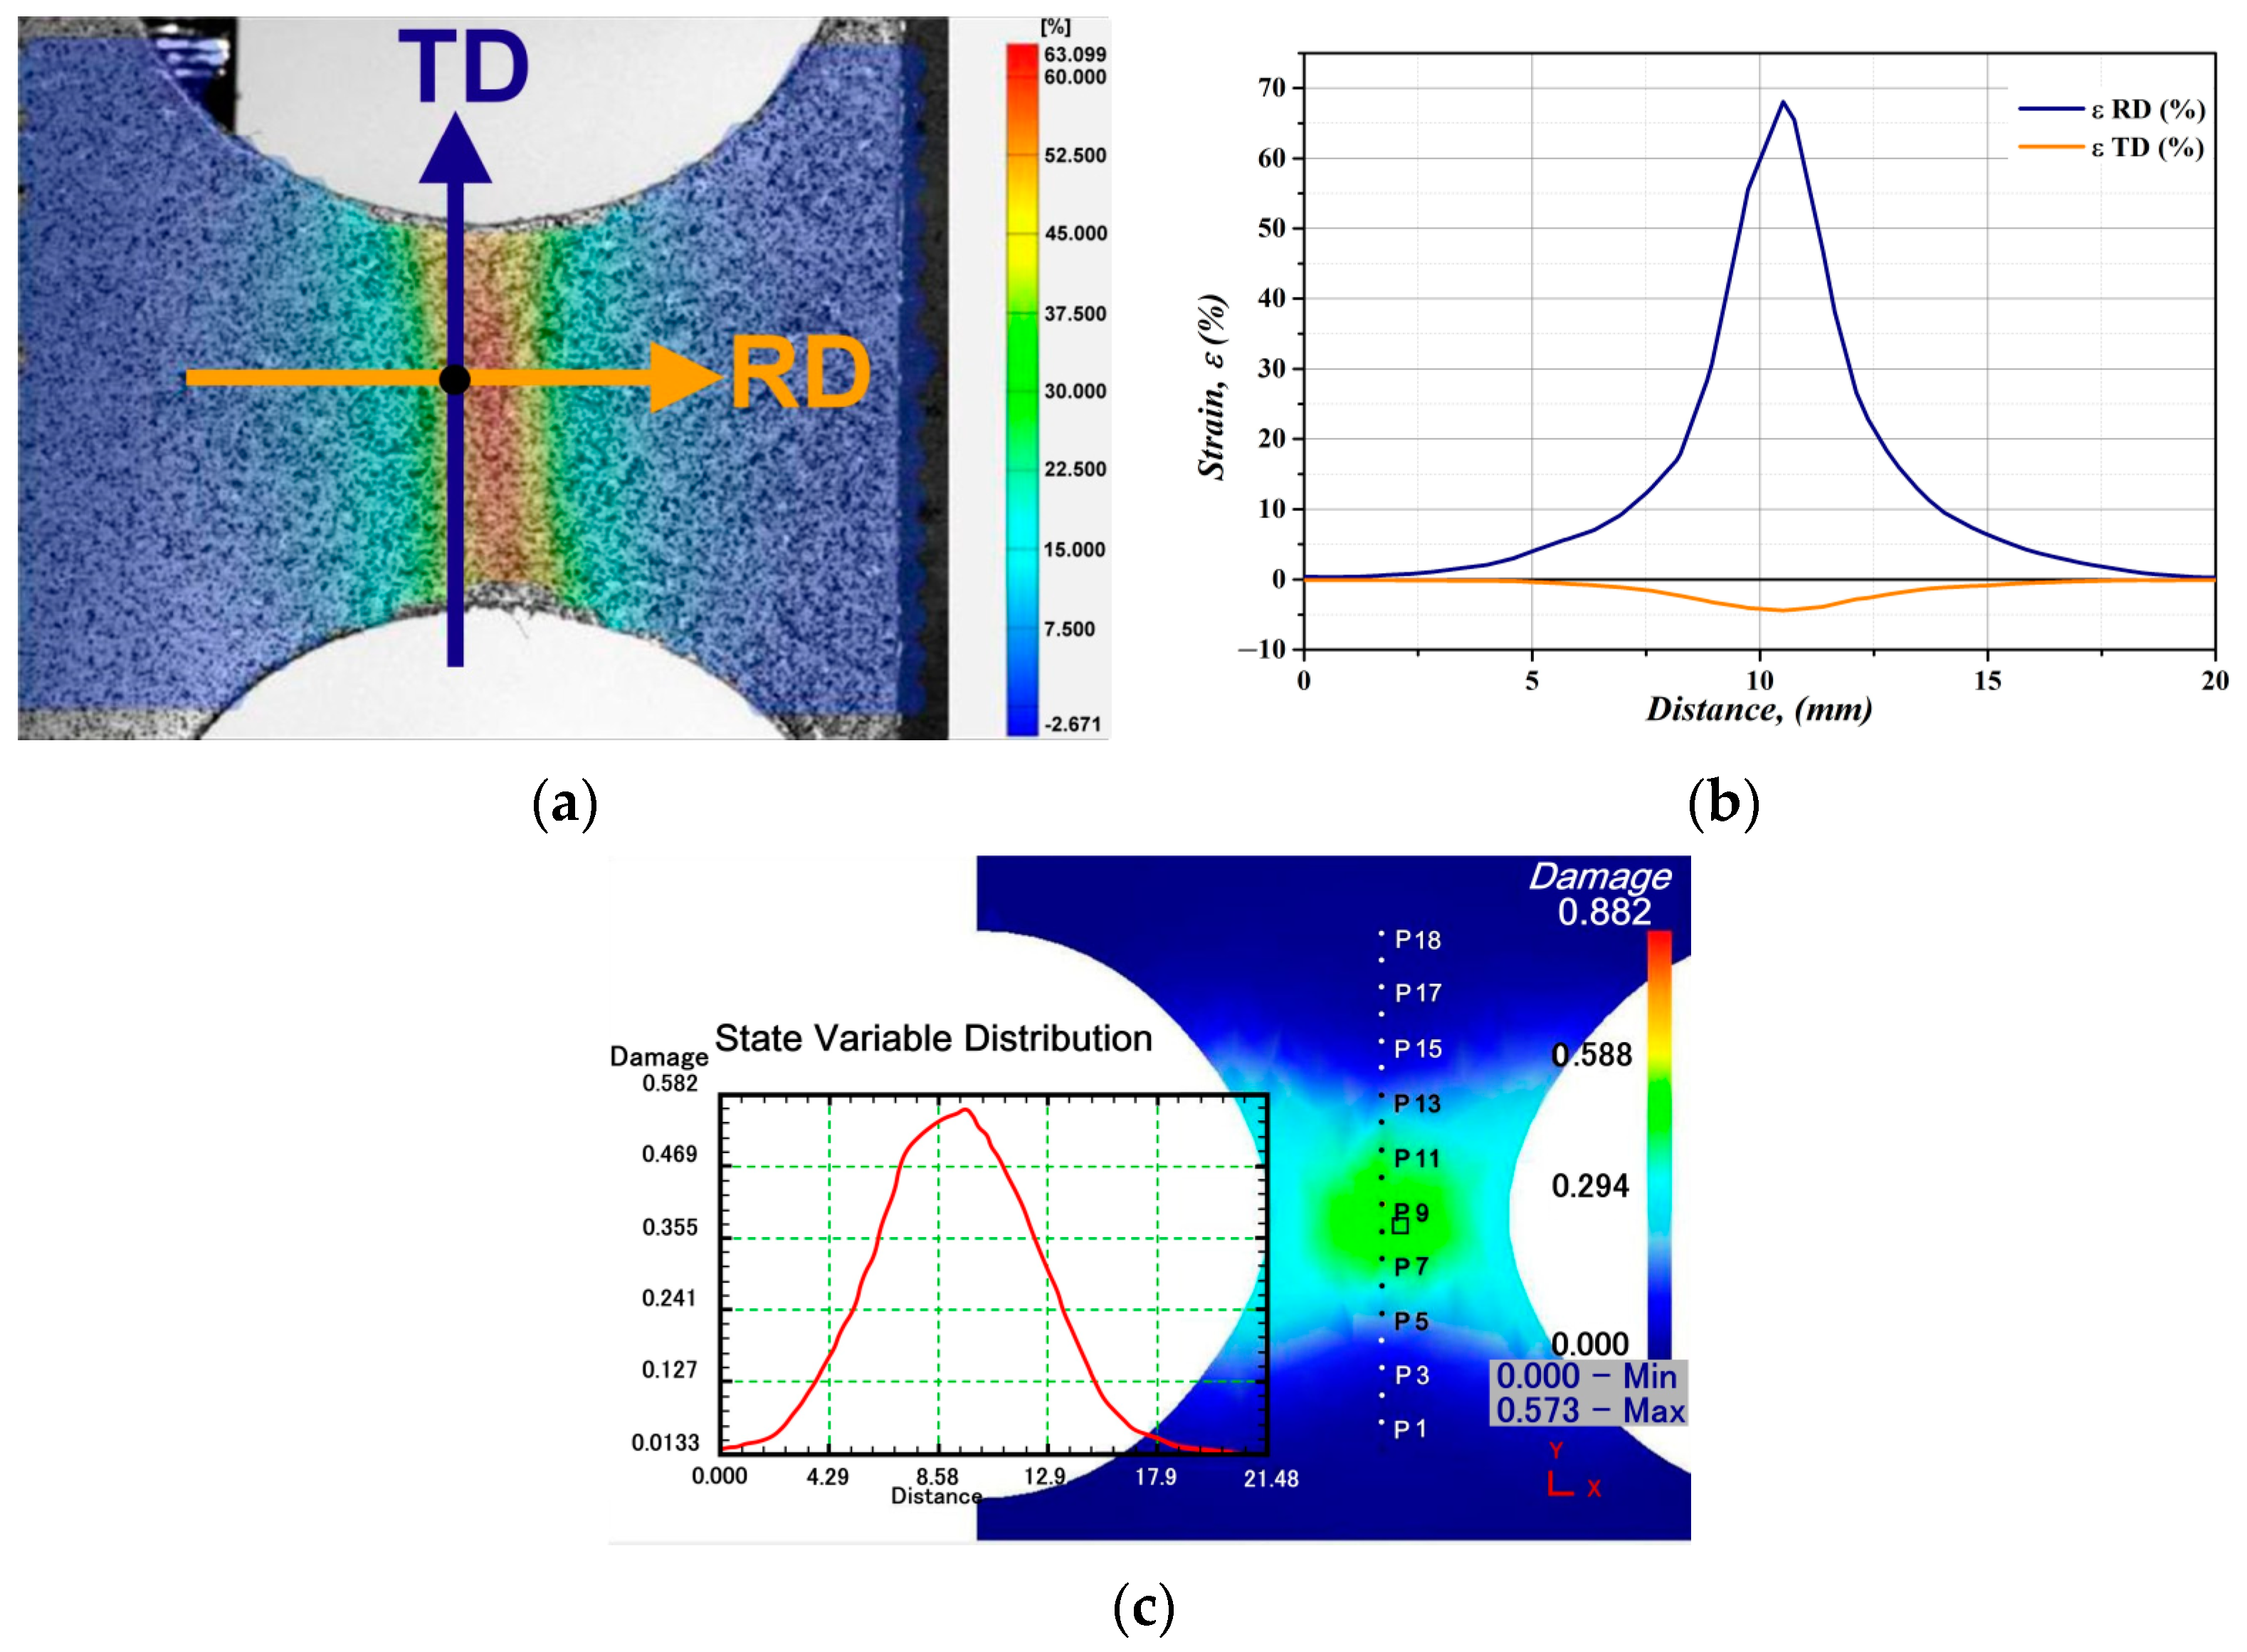
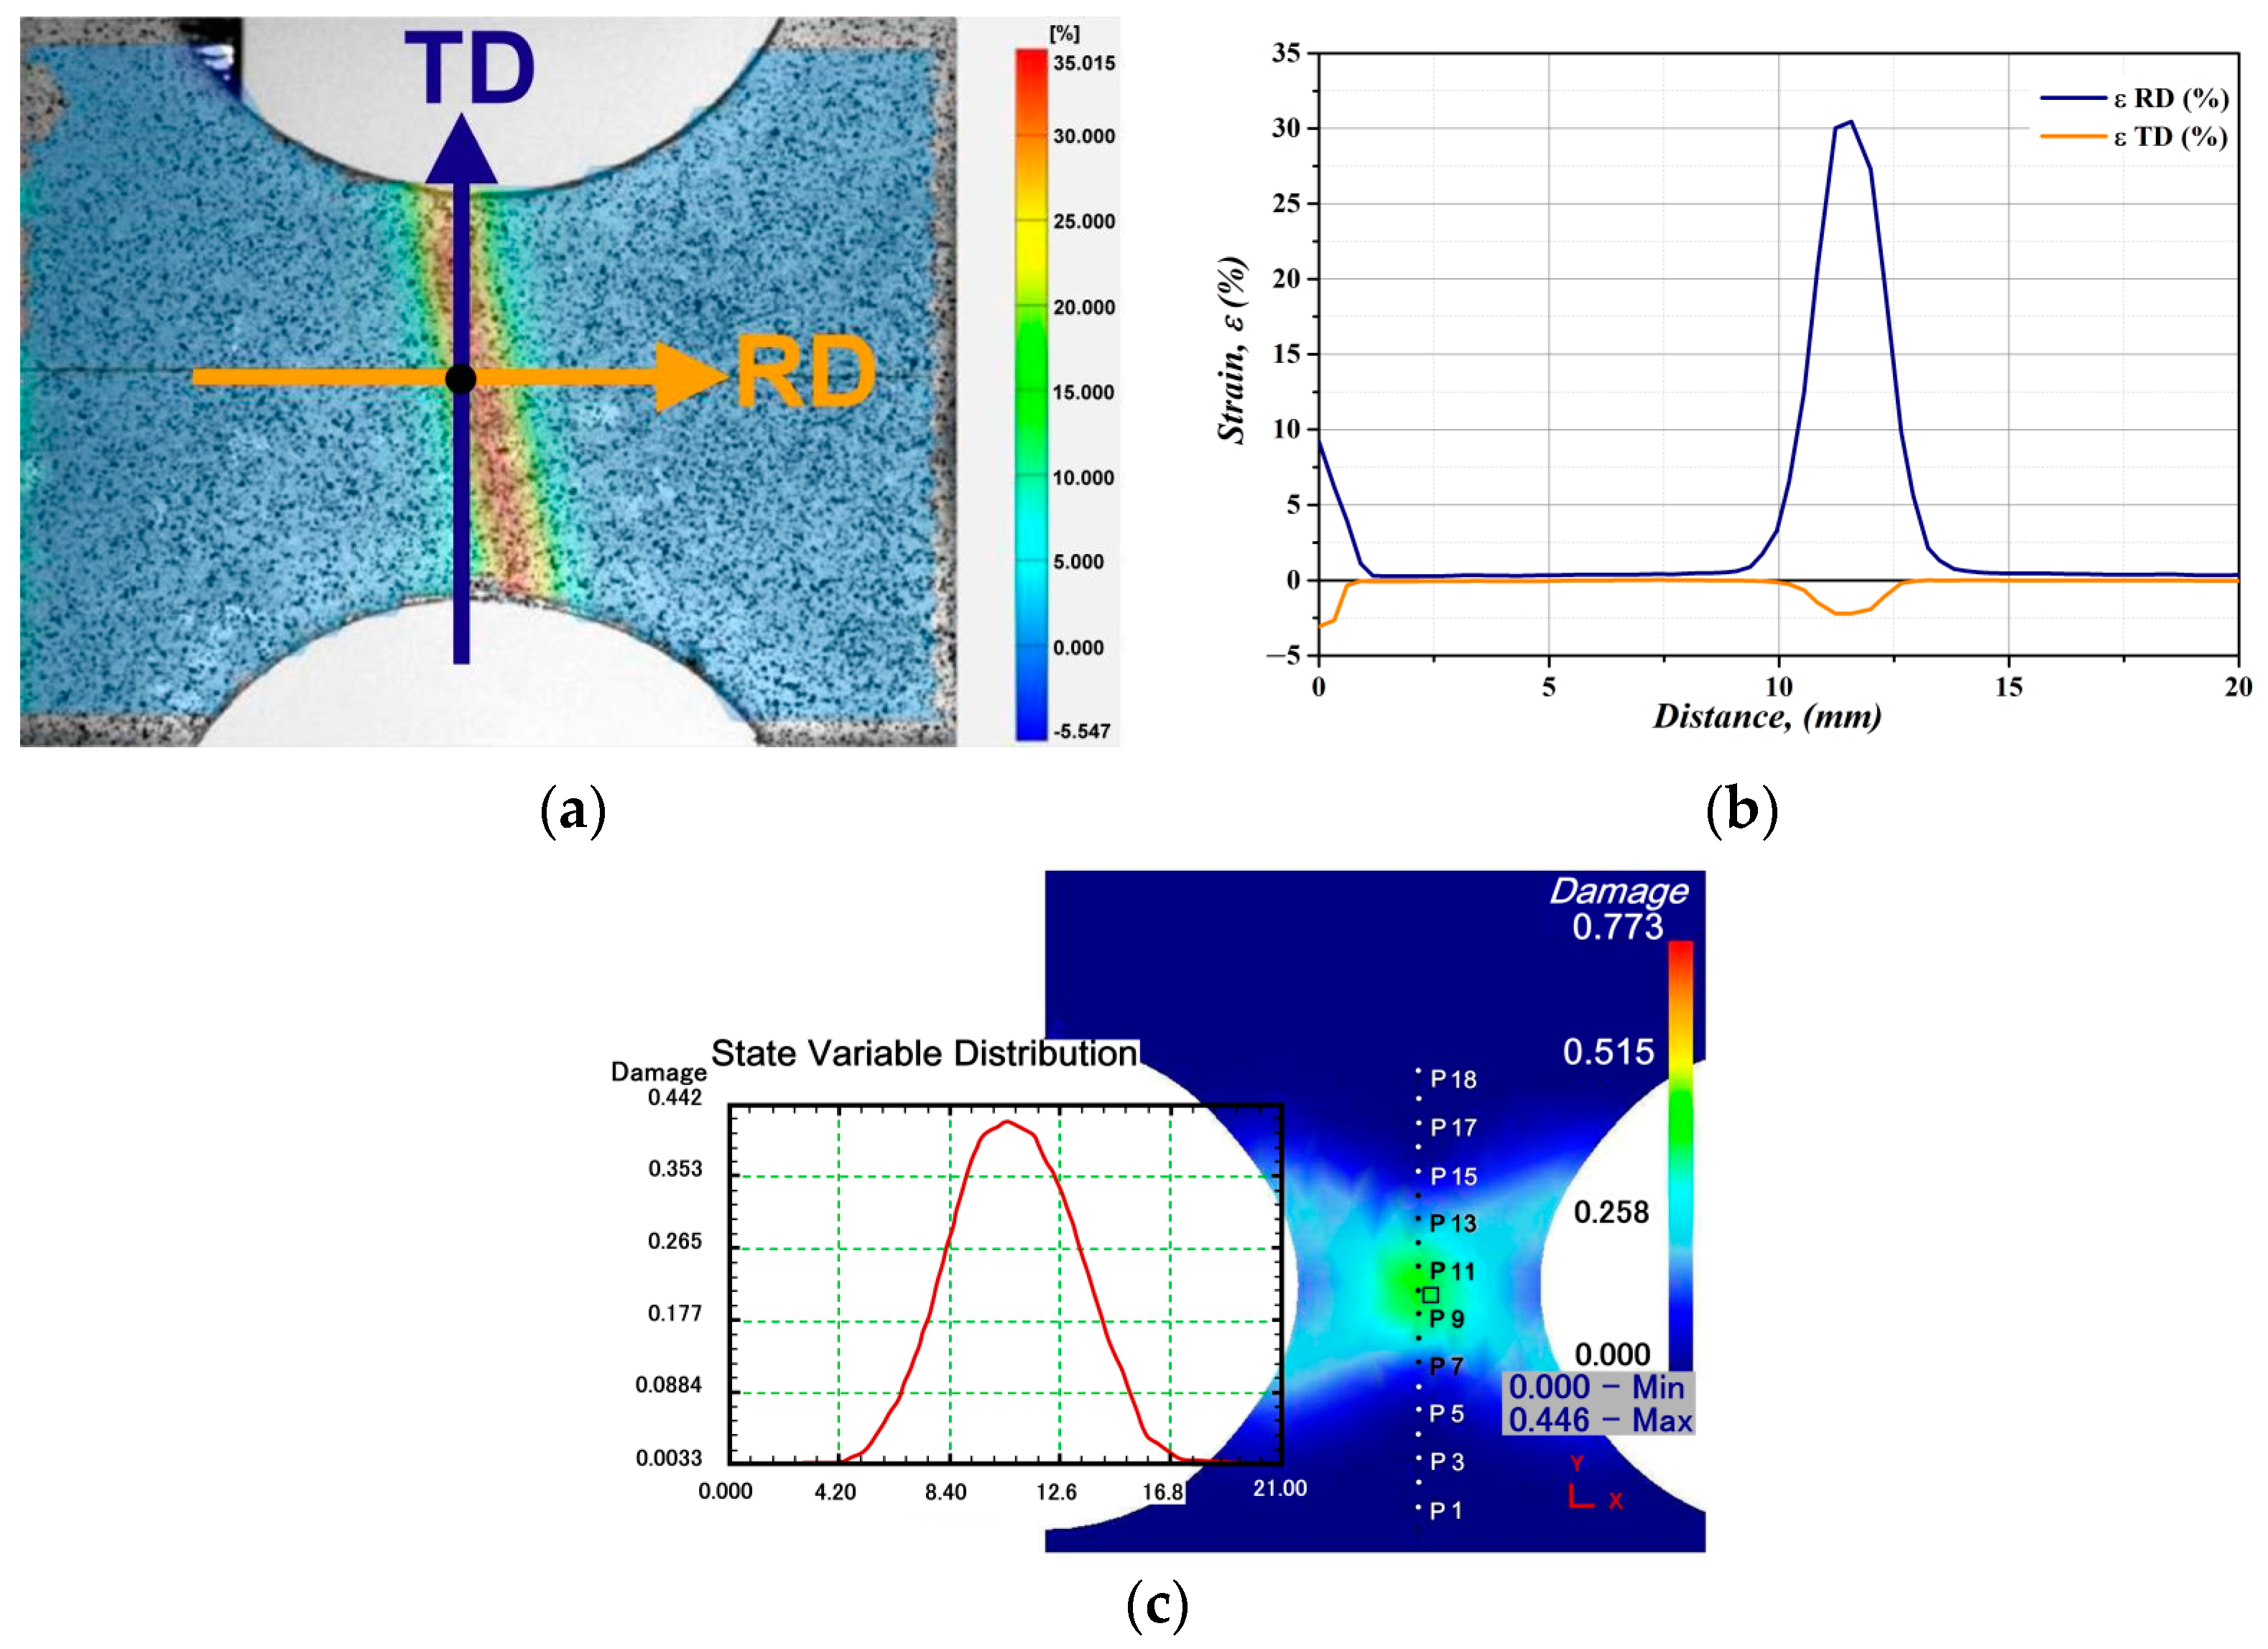
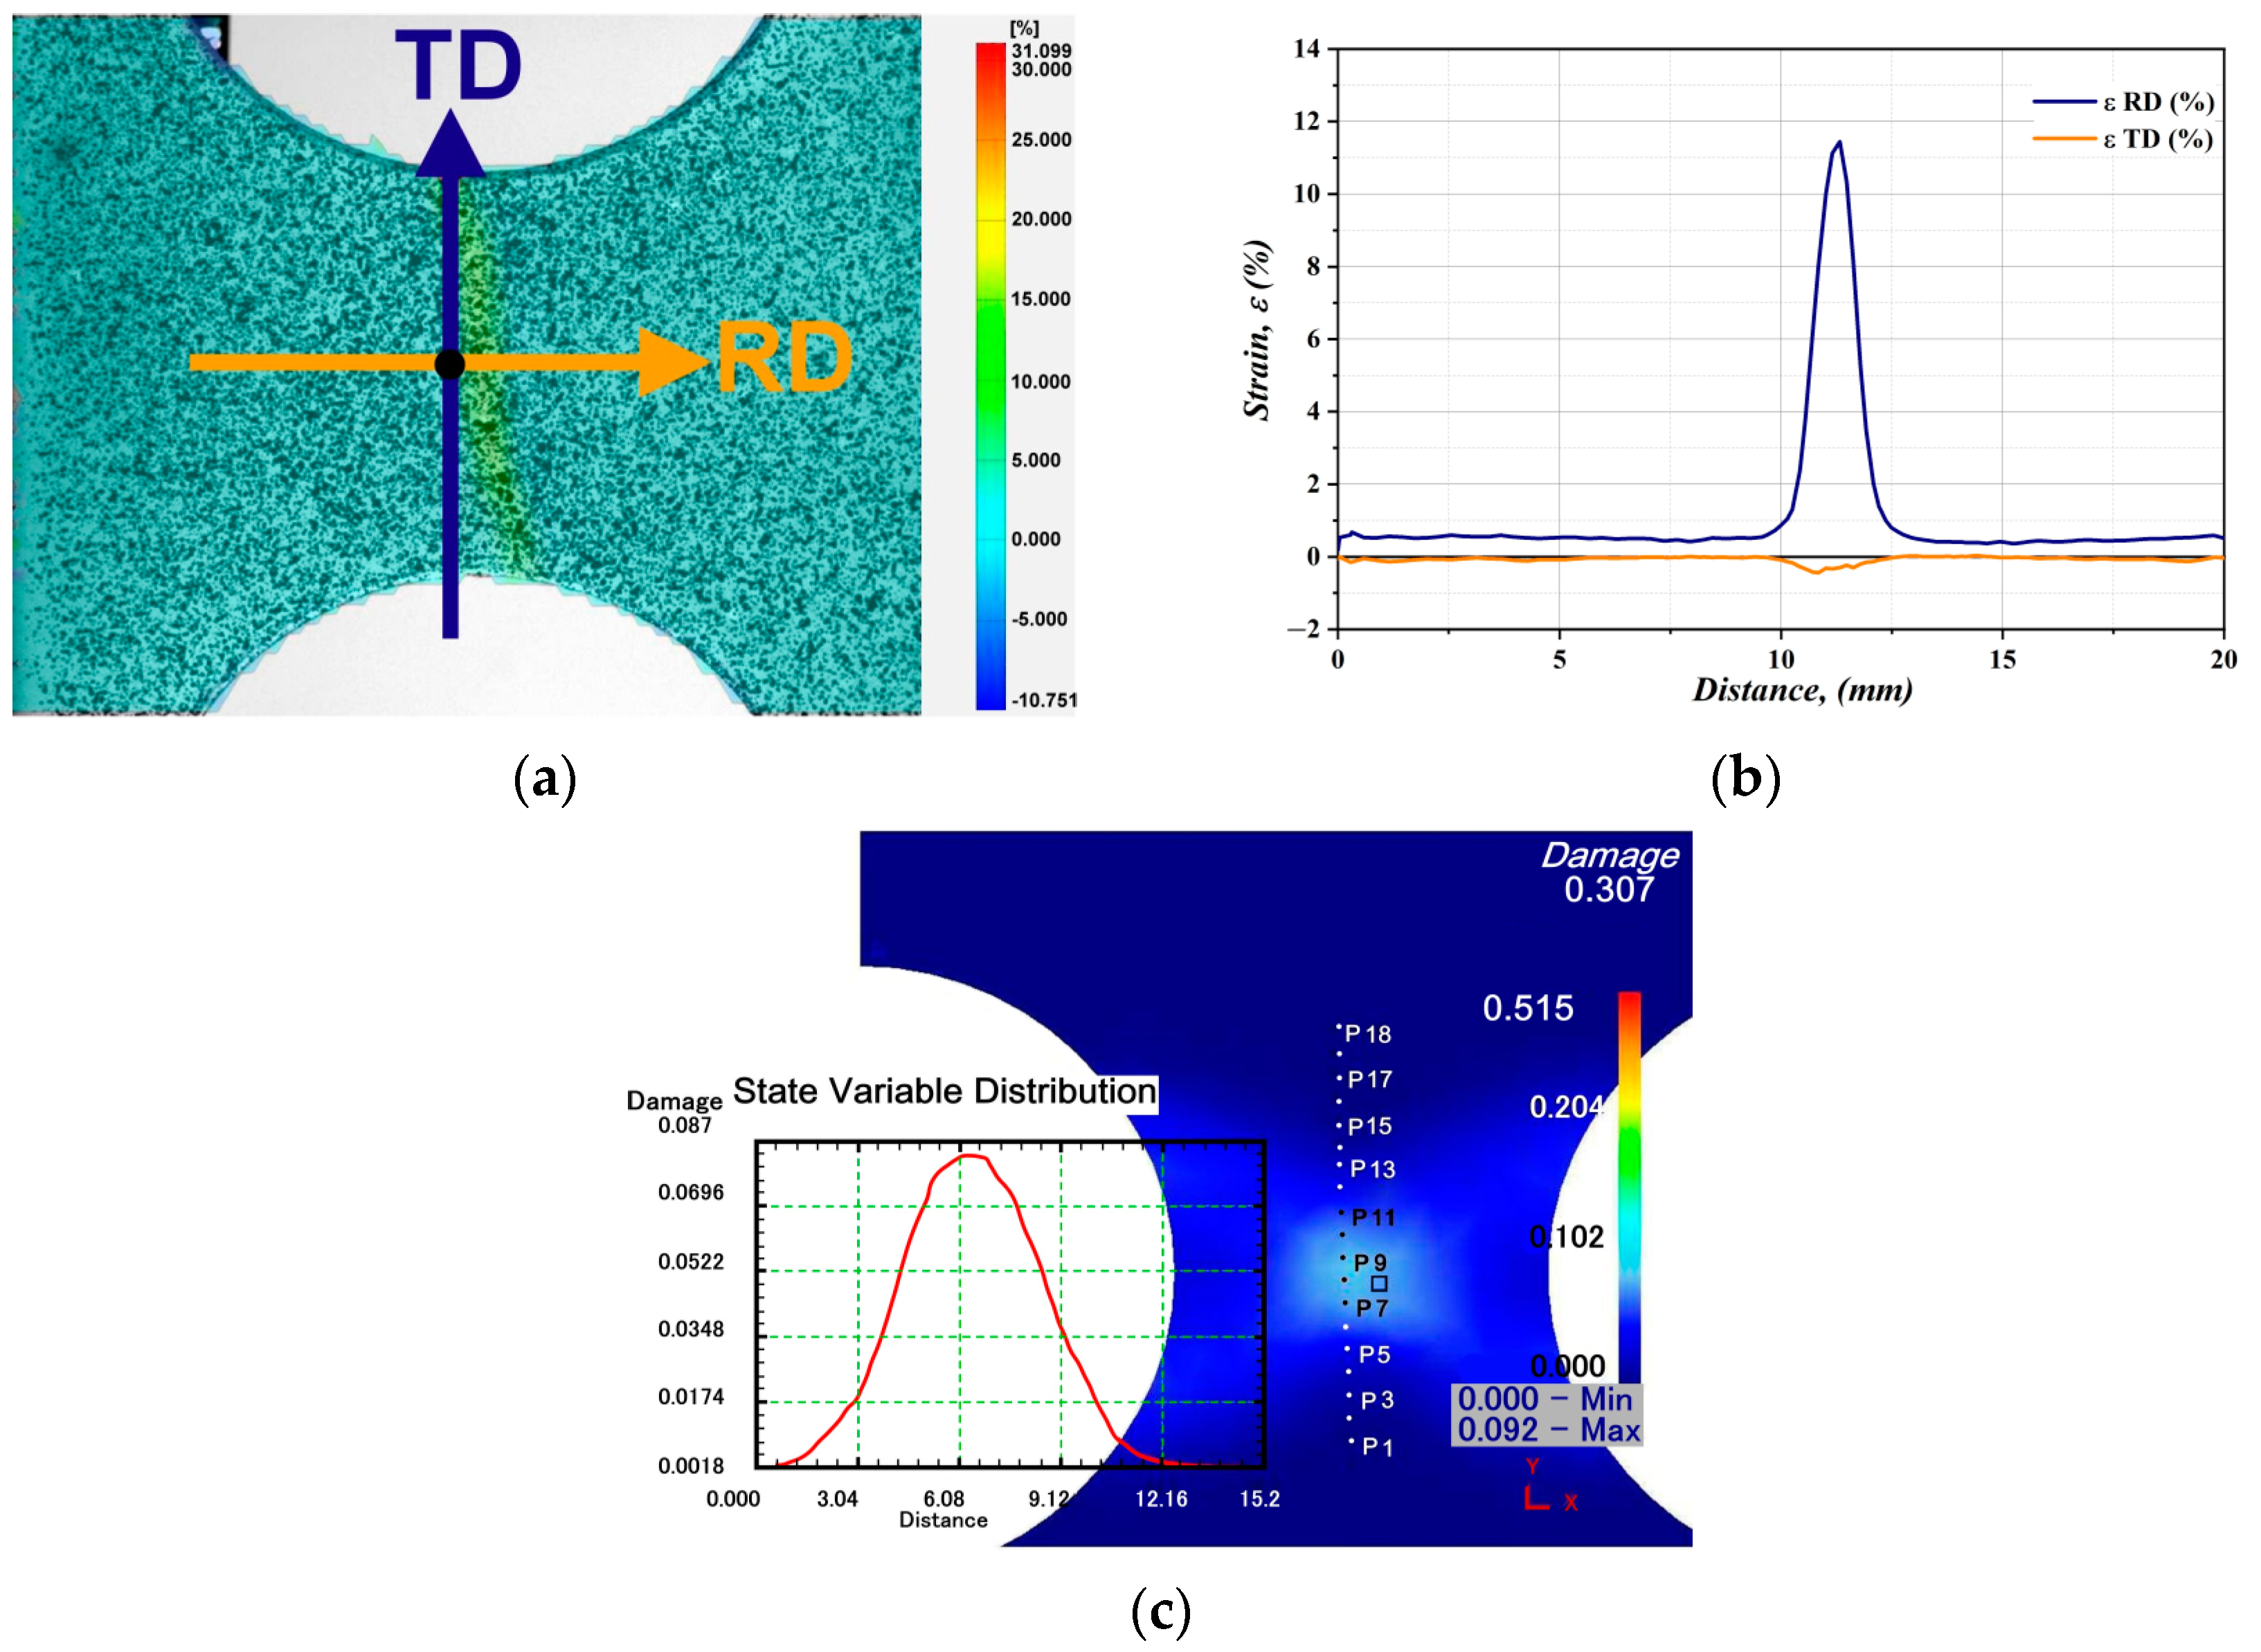
3.4. Measuring the Limit Strains Up to Failure on Specimens with Various Strain Degrees

The workability of high-strength electrical steel hot bands may be determined as the ability of sheets to obtain a particular deformation degree under the influence of strain–stress processes without the formation of significant defects in the crystal lattice, which can cause their failure. The mechanical processing ability of the hot strip is one of the most important parameters that must be considered in the preparation of the cold rolling process under 5-stand CRM. In general, the productivity of the cold deformation processes is strongly limited by ductile fracture. For this reason, an important role in the production of high-strength electrical steels is the prediction of ductile fracture or brittle during cold rolling reduction. Mathematical equations based on the relationship between stress and strain describing ductile fractures are called the workability criterion or Cockcroft and Latham (CL) fracture criterion [30,31]. CL fracture criterion represents the damage value at maximum principle stress of deformed materials and is normally calculated by mathematical means and uses several constants to express the amount of ductile damage, which can be determined from the results of stress–strain tests. This parameter provides useful information about the workability limits of materials subjected to extreme mechanical strains.
In order to determine the critical stress–strain conditions for a plastic fracture for individual strains via rolling, the limit strains were measured on cold-rolled laboratory specimens prepared according to the geometrical scheme in Figure 4a. These experimental measurements allow us to determine the Cockcroft–Latham criterion (CL). To measure strain maps, a video extensometer was used, with a stochastic spraying of points on the specimen surface (see Figure 4b). The CL criterion has been modified through normalising the maximum principle tensile stress during uniaxial loading by the effective stress. This was defined as an nCL criterion [30].
The tensile test diagrams of specimens for the determination of the nCL criterion are shown in Figure 10a. The strain degrees, the mean Rp0.2, and Rm values are presented in the form of graphs shown in Figure 10b. Among the measured data, the strain and strength values in the fracture area are the most important; from them, the fracture criterion can be numerically calculated. To determine the nCL criterion, a reverse method using FEM simulations was used.
In FEM simulations, tensile tests of nCL specimens were simulated, which took into account the geometry, the stress–strain characteristics obtained in the previous part of the results, and the boundary conditions of the test. These were compared, and the normalised nCL criterion values were measured immediately before the appearance of the fracture. To determine the exact place of appearance of the fracture, the video-extensometer analysis of strain maps was used. For the individual strain degrees, Figure 11, Figure 12 and Figure 13 show the strain maps directly before the specimen fracture was obtained from laboratory measurements and the distribution of the nCL criterion in the specimen simulated using FEM modelling. The resulting relationship between the nCL criterion change and the strain degree is shown in Figure 14. The relationship shows that the nCL criterion rapidly decreases with an increasing strain degree.
The FEM simulation was carried out under plane strain conditions, where the sample for tensile test was defined as a rigid plastic object. The equivalent stress σEq is defined in terms of three principal stresses. Assuming that the material is isotropic, the equivalent stress is given by the von Mises equation:
σ   ¯ = 1 2 σ 1 σ 2 2 + σ 2 σ 3 2 + σ 3 σ 1 2
where σ   ¯ is the equivalent stress; σ1, σ2, and σ3 are principal stresses.
Flow stress data (the true stress–strain curve) for simulation were obtained on the basis of data from the tensile tests conducted on the investigated material. From a tensile test, flow stress data can be obtained only for relatively very small uniform strains, and usually the true strain does not exceed the value of 0.3. To obtain flow stress data with a higher range of strains, the flow stress data were approximated from several tensile tests of the material after cold rolling in the deformation range from 7% to 72%, as shown in Figure 9b.
The finite-element mesh of the body of the simulated sample had more than 2000 elements with a size of 0.5 mm; their total number depended on automatic meshing. Tensile loading of the sample was provided using the boundary condition of the movement, which corresponds to the strain rates of 0.00044−0.11 s−1 used in the laboratory testing. The nCL criterion was determined from the FEM simulation at the crack initiation location, which was identified in detail using DIC measurements during laboratory testing. The nCL damage factor at the sample damage location was determined from the stress–strain analyses of the FEM simulation.

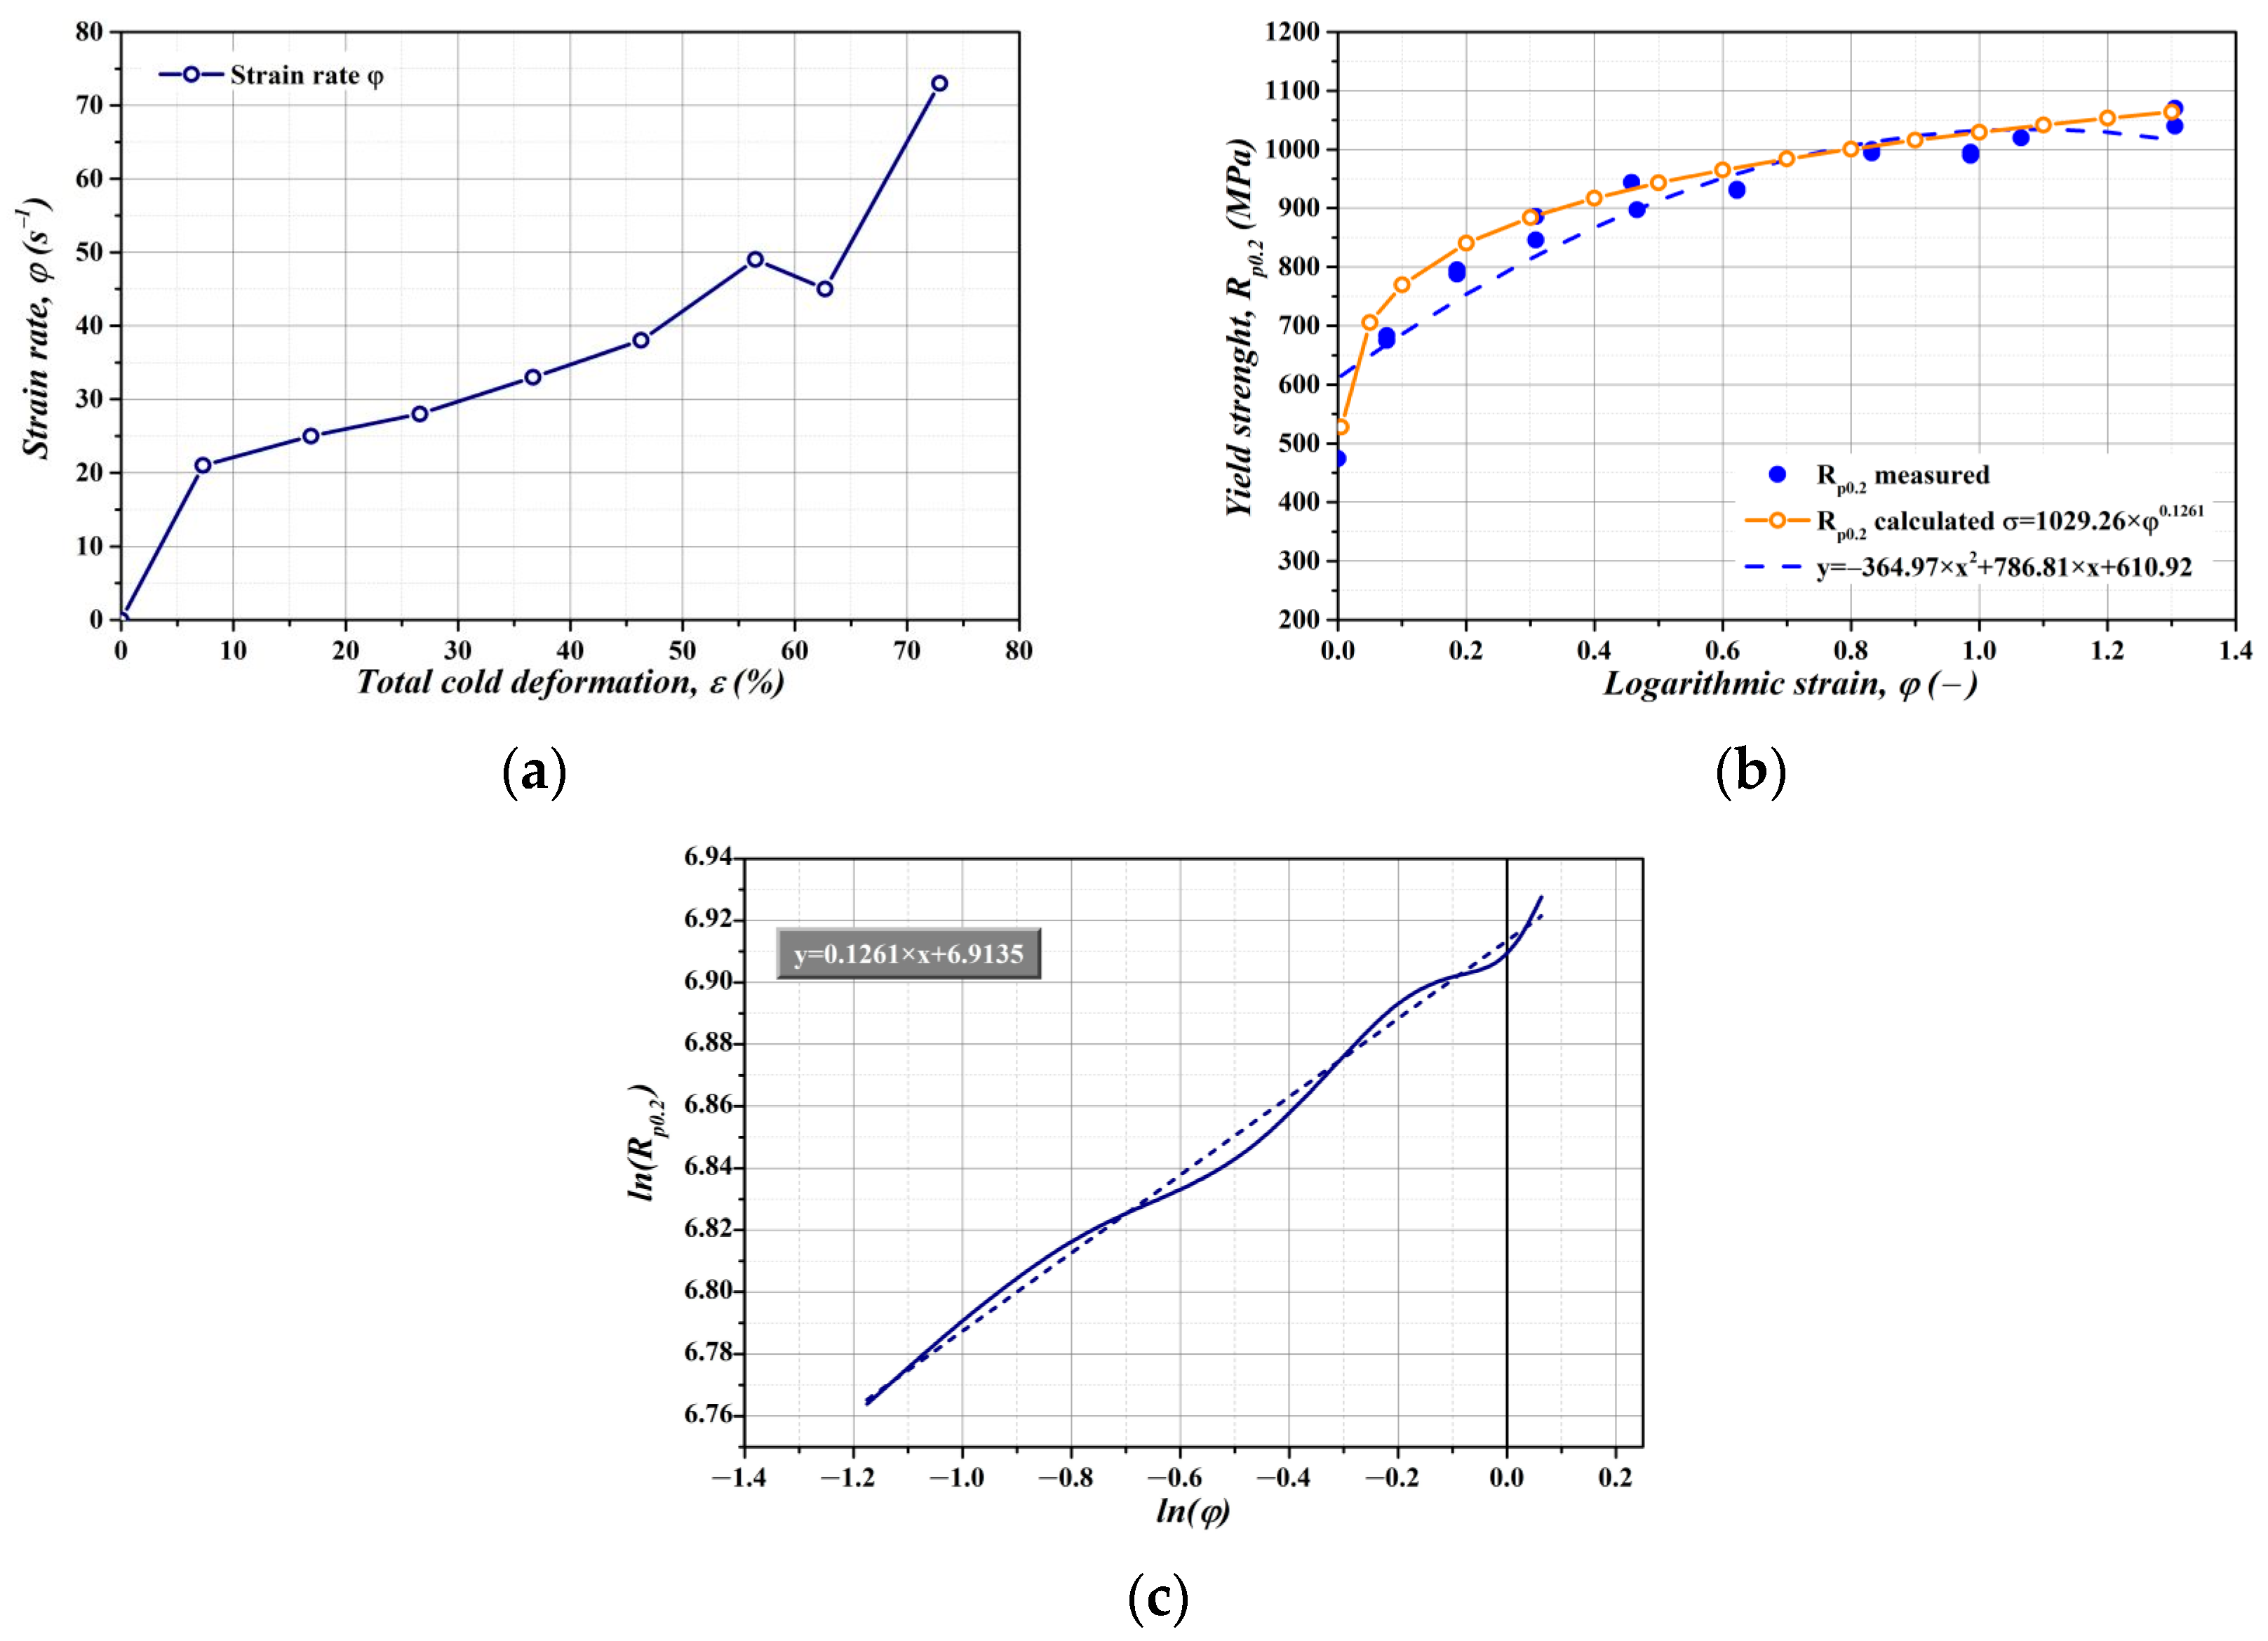
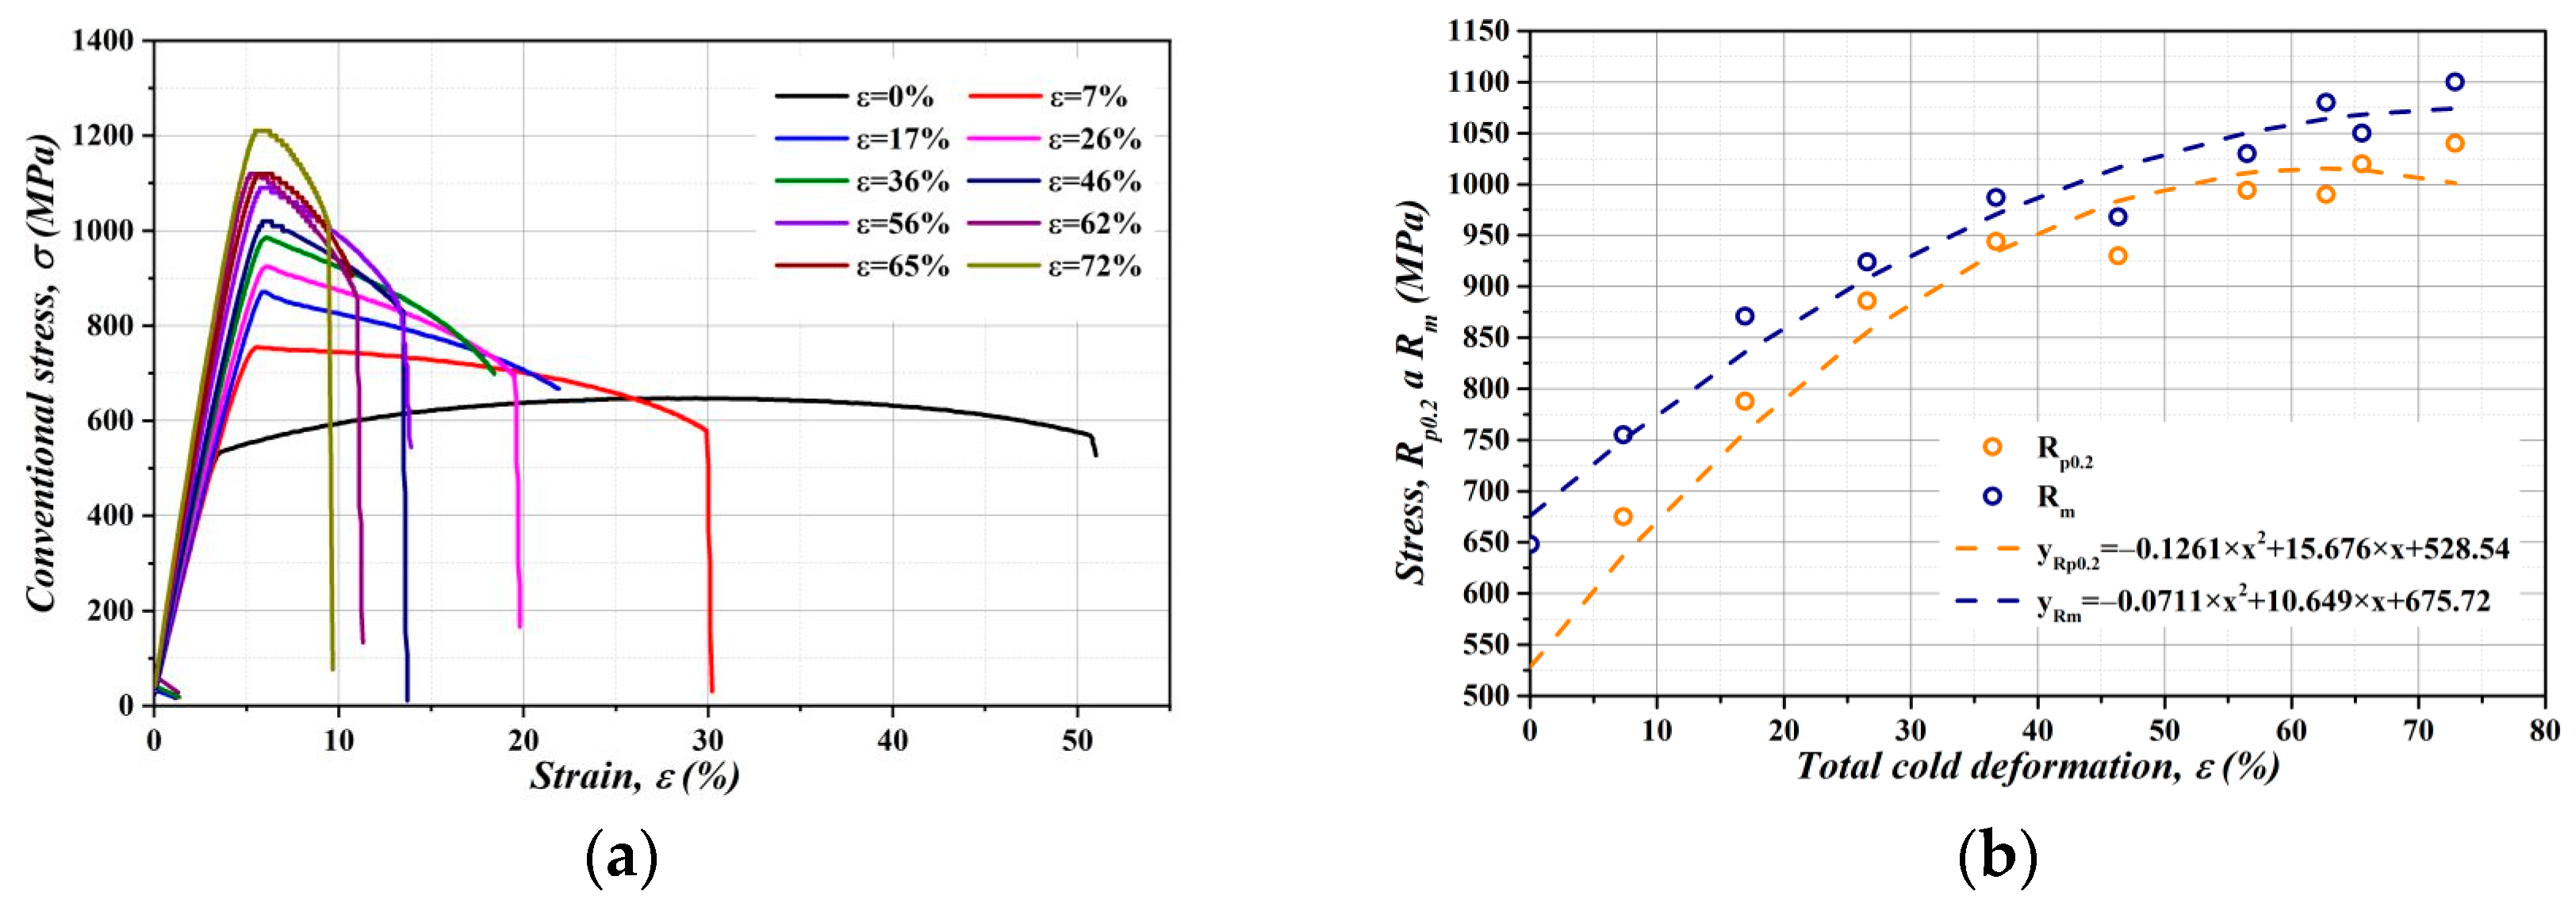
3.5. Analysis of the Stress–Strain Characteristics of Hot Strip Depending on the Strain Degree under Cold Rolling

Electron backscatter diffraction (EBSD) is a powerful technique for the characterisation of microstructure using measurements in an orientation space and allows for the ease to obtain grain-specific diffraction information from the surface of polycrystalline materials. The EBSD method is one of the most practical ways of investigating the internal structure of materials on the microscopic scale, which influences its properties and behaviour. The microstructures analysis enables the identification and characterisation of grain distribution and its size, the investigation of the different phases or compounds in the material, and the analysis of the mechanical stresses between and within grains induced by an applied external deformation. The EBSD data acquisition uses a combination of quantitative and qualitative approaches to measure local grain misorientation. The maps are generated on the base of the measured EBSD data and show the average misorientation either around grain boundaries or inside the grains, called the Kernel average misorientation (KAM). Commonly, KAM is higher in grains with damaged crystallographic lattice with a higher dislocation density, which can be caused by plastic deformations [32]. The definition demonstrates that KAM analysis allows us to deduce the dislocation density value, the localised deformation, and local lattice distortions, and may indicate the stored strain energy in the grain. The crystallographic orientation of the ferritic grains’ lattice is an important parameter influencing the plasticity and workability of hot bands during the final cold rolling deformation. In order to define the microstructure and substructure evolution of the investigated hot band after the different cold rolling reductions were performed in laboratory conditions, specific EBSD analyses were performed.
Figure 15 compares the evolution of plastic mechanical strains induced by cold rolling through the cross-section of investigated hot band samples with the bimodal morphology of the microstructure. It can be seen from the data that the presented results well-demonstrates the correlation between the accumulated mechanical stresses and the evolution of the microstructural matrix caused by an increase in the value of cold rolling reduction. What is interesting in this kind of analysis is that the small-orientation disorders of the ferritic crystal lattice within each grain and vicinity of grain boundary highlight the regions of significant plastic mechanical stress. From the charts, presented in the upper right corner of each coloured map, it can be seen that the value of local misorientation is mostly in the range from 0 to 5°. The surface fraction distribution of local misorientations on the presented microstructure displays the degree of applied external deformation. Here, Figure 15a–g present the deformed microstructure of experimental samples obtained after cold deformation via rolling with relative thickness reductions of 7%, 17%, 26%, 36%, 46%, 56%, and 65%, respectively. The pier-coloured charts show that the misorientation angles are allocated irregularly throughout the cross-section of the deformed microstructural states. The presented results differ from each other through the distribution of the intensity value of mechanical stress and significantly increases with the increase in compression value caused by cold-rolled deformation. As one can see, in the subsurface region located between the hot band surface and the very elongated deformed grains, it is possible to detect the higher intensity of the grain structures with a misorientation angle of about 5°. In the case of samples with 56% and 66% of deformation, the high intensity of BCC lattice defect was detected homogenously through the whole cross-section region. On the other hand, the misorientation angle in the range of 2–4° was measured mostly for the samples with applied deformation up to 46%. The recrystallised uniaxial grains characterised by a low intensity of structural heterogeneities are presented in the middle part of these samples.
A comparison of the obtained results presented in Figure 15 successfully demonstrated that the uniaxial grain subsurface matrix absorbed the overwhelming majority of plastic mechanical stresses, namely in the samples subjected to the cold rolling deformation in the range from 7% to 46%. On the other hand, as can be seen, the samples subjected to a much higher intensity of applied deformation are characterised by the homogenous distribution of the failure of the crystal lattice and it is possible to conclude that they do not depend on the form and size of the microstructure’s grains.
It is well-known that the local misorientation value presented in the form of KAM maps represents the dislocation density degree. It is important to note that a higher intensity of mechanical deformations was generated mostly in the vicinity of the grain boundaries where the irregular grain structures were also observed. Furthermore, the measured EBSD data clearly show that the accumulated dislocations induce the plastic mechanical strains mostly distributed in the fine, elongated grain structures, which were observed in all experimental samples subjected to various cold-rolled deformations. The results obtained on the cold-rolled samples illustrate the comparable distribution of plastic mechanical strains to the findings in our previous scientific work [20]. It can be clearly seen that two zones of plastic mechanical strains are arranged through the cross-section of the cold-rolled samples. A high intensity of the dislocation density was detected in the vicinity of the irregular grain boundaries, which belong to the subsurface grain structures as well as inside the elongated deformed grains. In the case of the samples subjected to cold deformation with a maximum thickness reduction of up to 50% in the central part of the sample thickness, it appeared that the lowest value of plastic deformation was mostly detected on the boundaries of uniaxial grains. A comparison of measured data presented in Figure 15 showed that it is possible to conclude that the bimodal microstructure of the hot bands after cold rolling with various reductions in the thickness is characterised by a clearly expressed mechanical plastic strain gradient. Taking into account the fact that the hot bands during the cold rolling via 5-stand CRM reduced from 2.2 mm to 0.5 mm, it is possible to note that the presented gradient of mechanical stresses will be only increased after the deformation of each roll. The performed measurements of the local mechanical stress (KAM maps) demonstrate that in the vicinity, the elongated grain boundaries slow down the motion of dislocations, which can be related to the dislocation pile-up effects. This behaviour is known to be especially pronounced in the case of the body-centred cubic (bcc) crystal structure, and it is related to the so-called deformation crystallographic orientation in combination with coarse longitudinal grains [33,34]. The results of this study show that the cold-rolled hot band has various levels of strengthening properties in the different layers across the cross-section. This fact could be responsible for the brittle damage of the hot band during the cold rolling process.

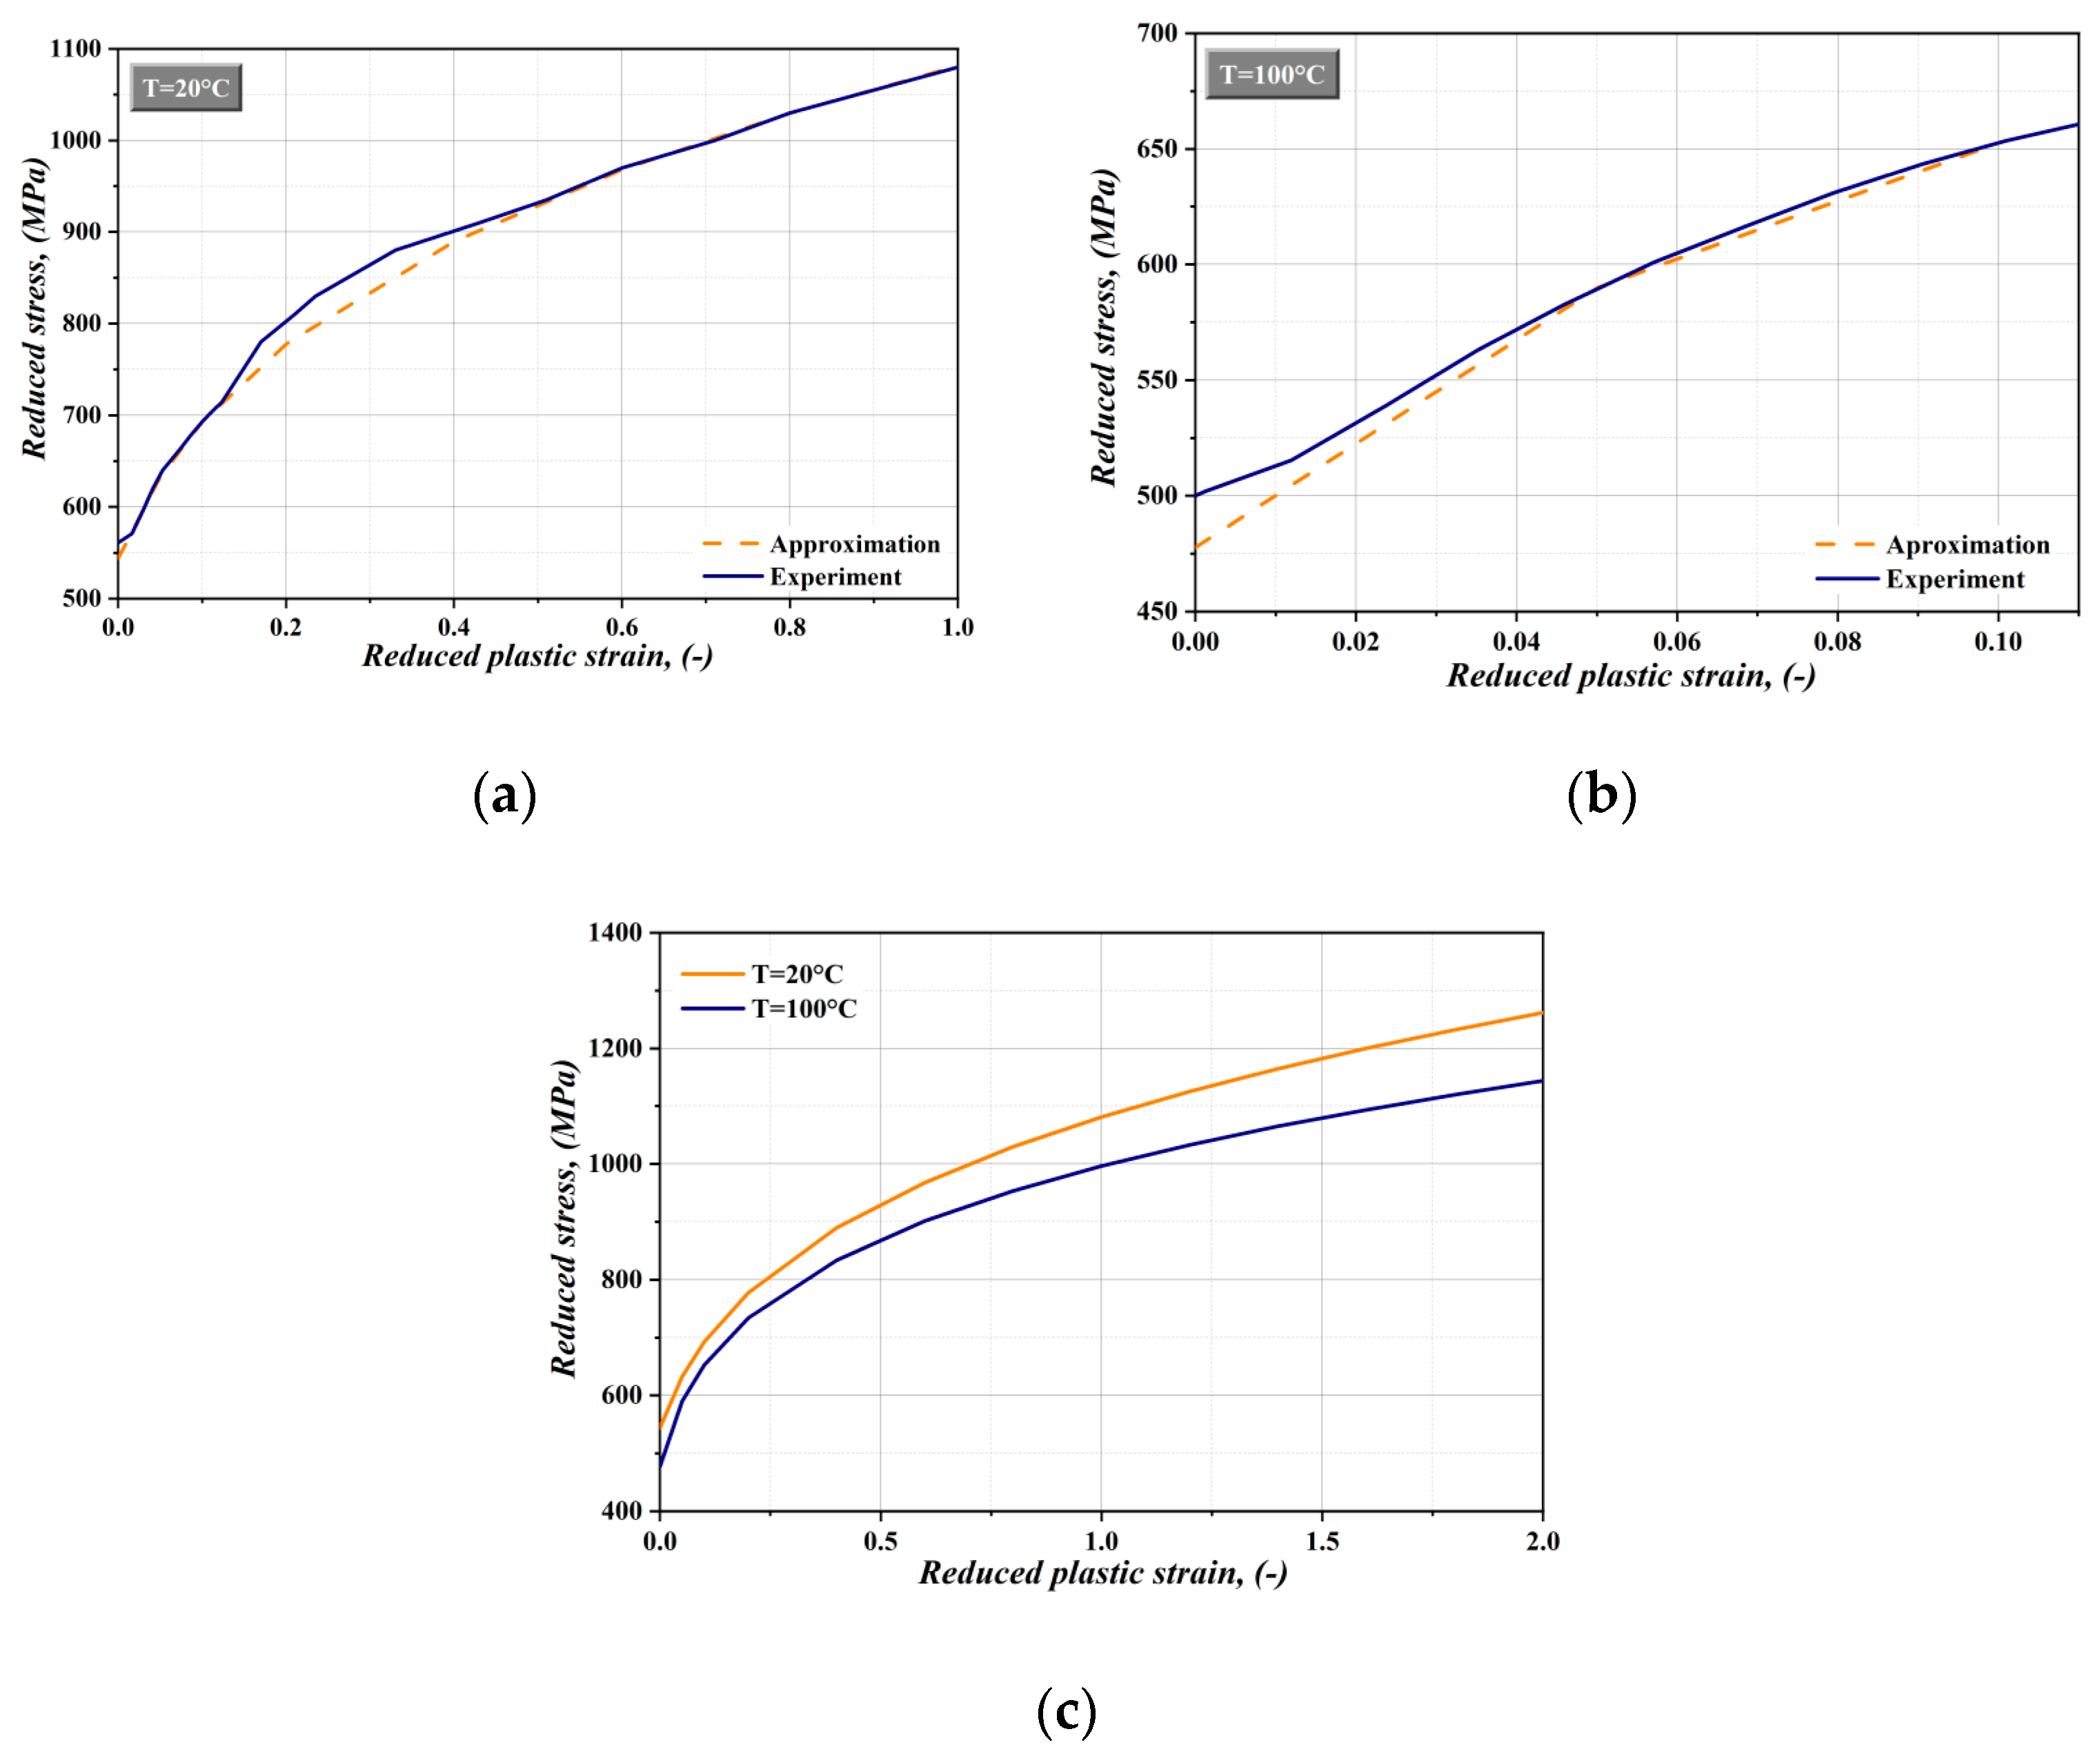
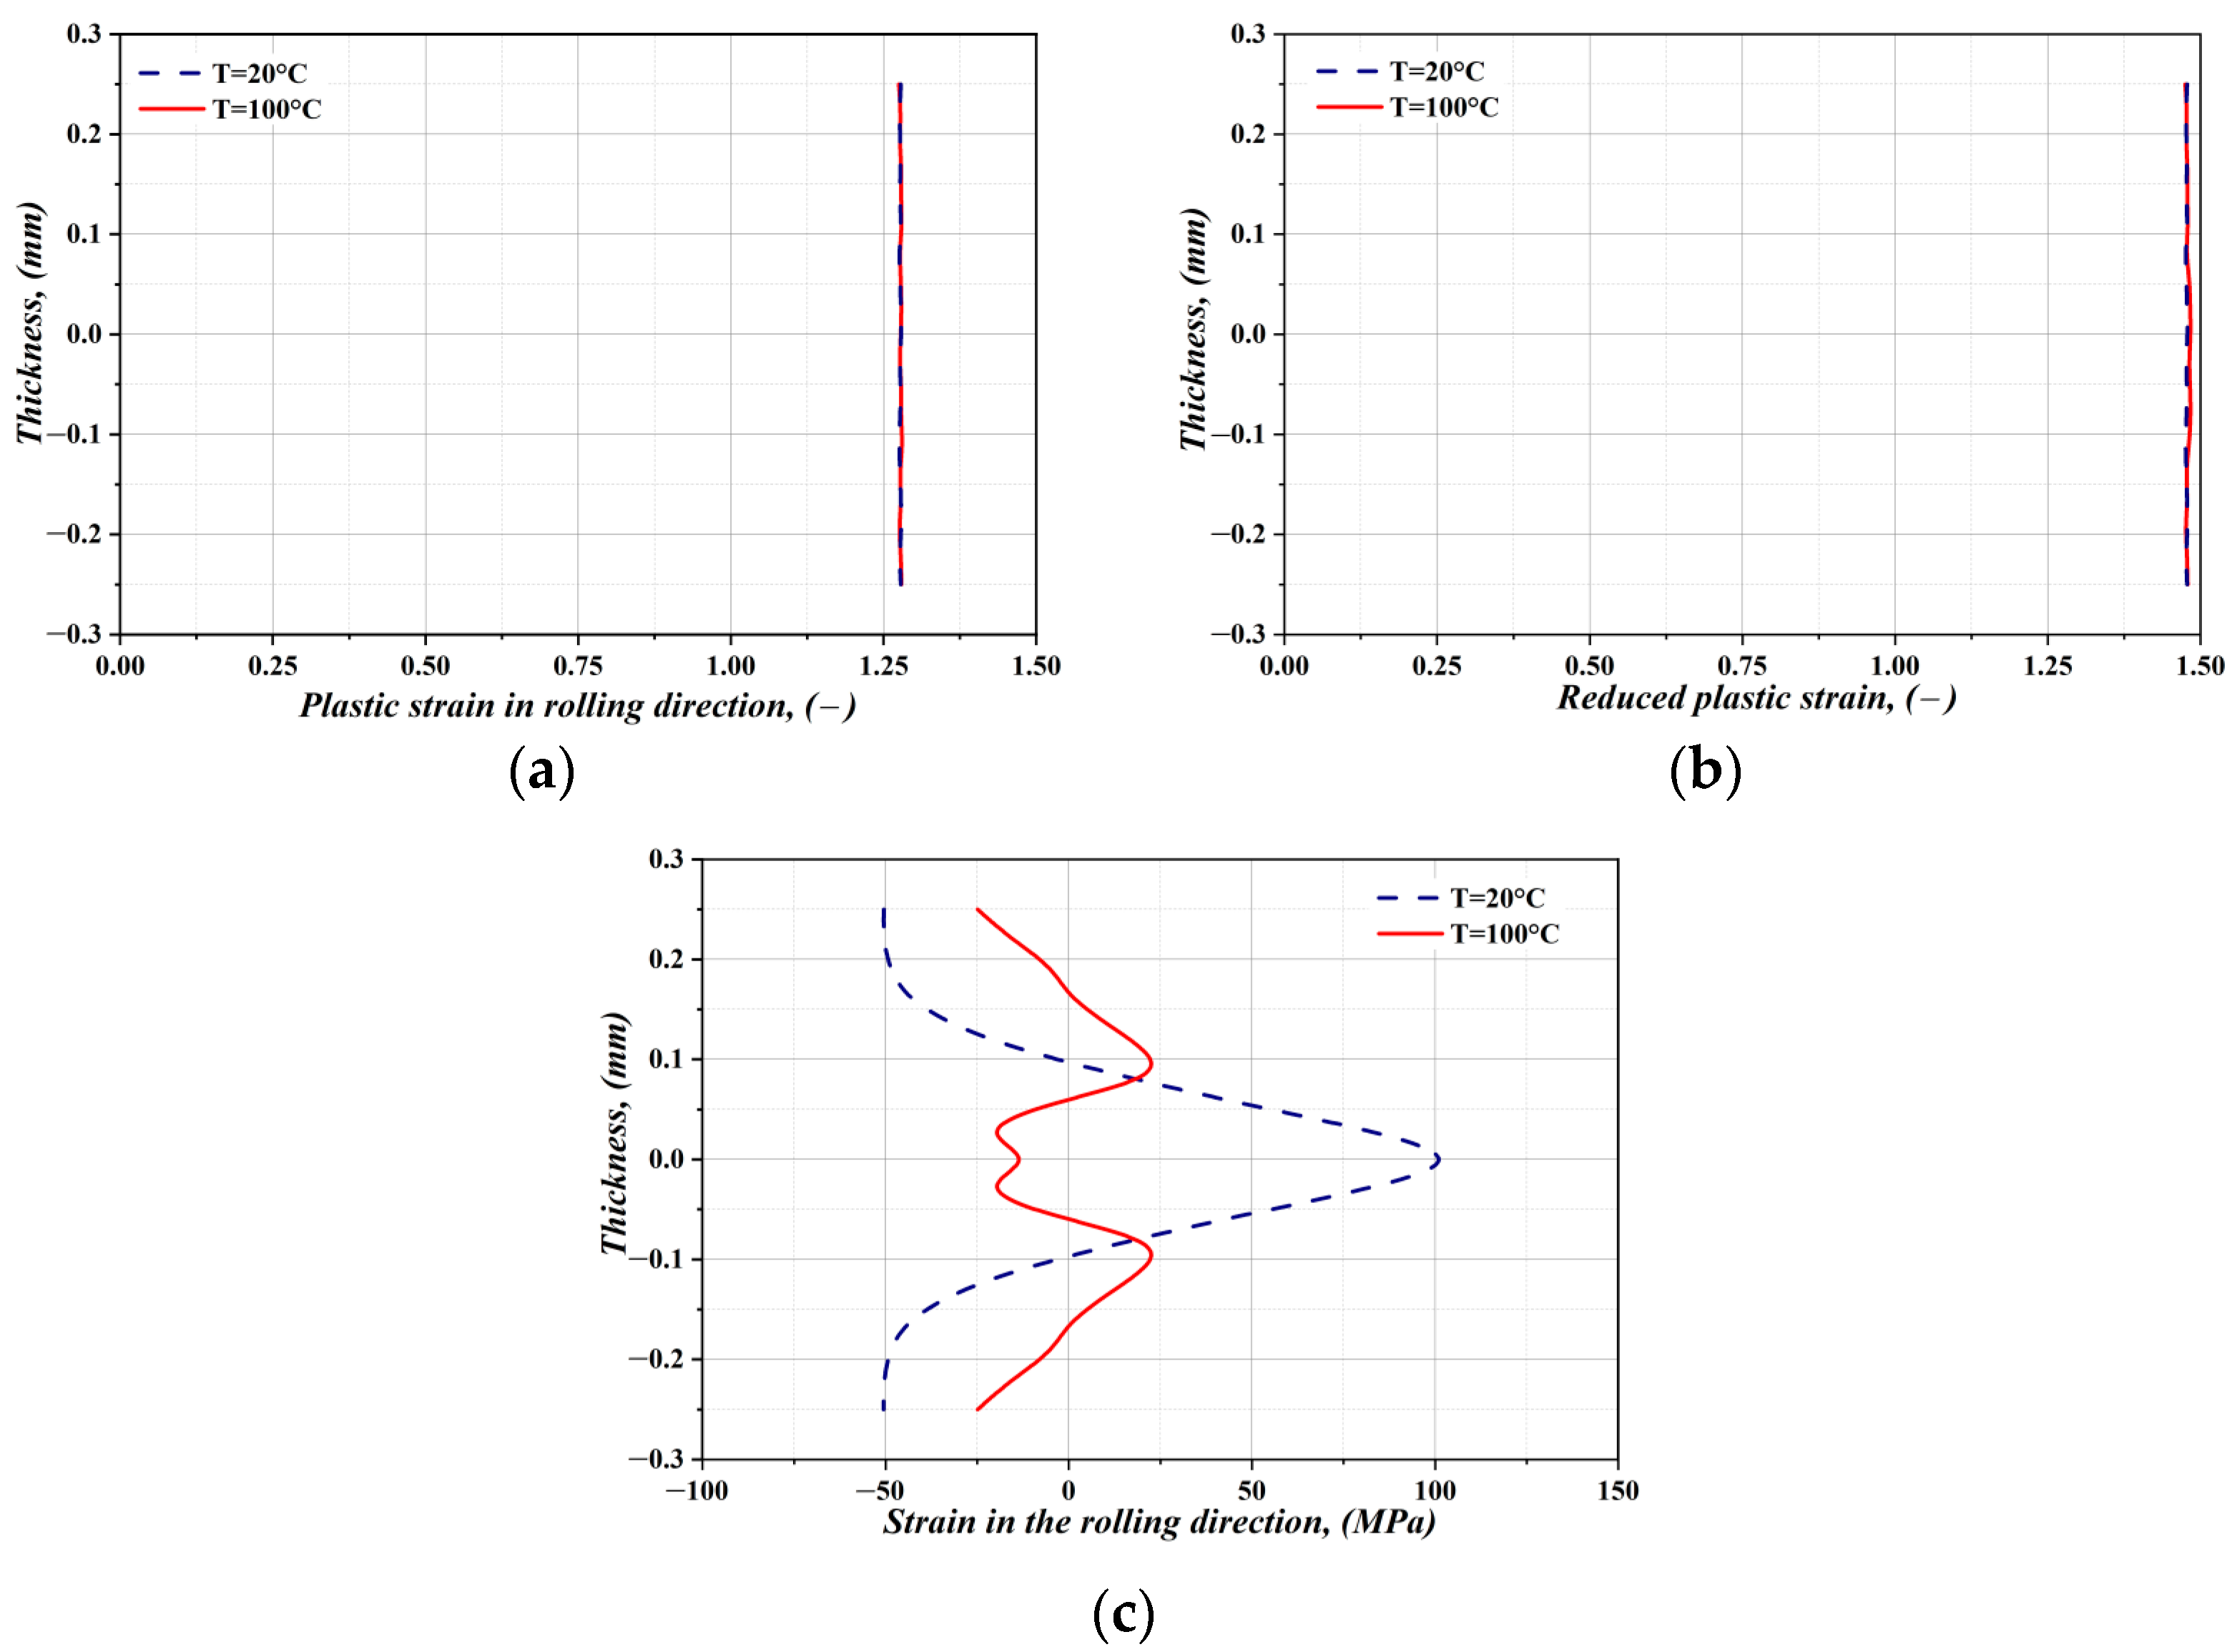
3.6. Mathematical Modelling of Plastic Deformations in the Hot Band Induced by Cold Rolling at Investigated Temperatures

Cold rolling is a deformation process in which the thickness of a steel sheet is decreased by passing it between two same quickly rotating rolls. It is important to note that a deformed rolled metal elongates but does not spread in considerable measure.
The aim of the simulation was to analyse the distribution of plastic strain, strain rates, and stress in the course of the passes of material through the five rolling stands at the 5-stand CRM. In addition, the rolling forces at the individual stands as well as residual stress were analysed, while the temperature effect was taken into account.
The rolling parameters are shown in Table 4, the roll radius was 250 mm for all the stands. A planar model was created for the initial strip thickness of 1.8 mm, using symmetry along the horizontal axis. The considered stress state corresponded to the state of the plane strain of strip with a width of 1015 mm. The state of plane stress in the immediate vicinity of the strip edges was neglected.
The rolls were considered to be ideally rigid, rotating at a constant angular speed. The strip was given an initial speed corresponding to the circumferential speed of the first roll. Subsequently, the pass of the monitored section of the strip through all the five rolling stands was gradually simulated. The considered friction coefficient was 0.05 for all the stands.
The material model was specified according to tensile tests in combination of various strain speeds and temperatures according to the results presented in Figure 6, Figure 7 and Figure 8. Combinations are formed by the strain rates of 0.00044 s−1 and 0.11 s−1 and the test temperatures of 20 °C and 100 °C.
The static curve at room temperature contains the most data for extrapolation into the area of large plastic deformations. The measurement carried out at 20 °C with a low strain rate (see Figure 5a) was used for the basic model of the material for our mathematical calculations. In order to separately quantify the effect of elevated temperature, calculations were subsequently carried out according to the green solid curve in Figure 6a–c quasistatic curve generated from the data of the stress–strain test at 100 °C and low strain rate. In the following text, these calculations are differentiated from each other as results obtained at low or high temperature.
Since the tensile tests at a higher deformation rate do not correspond to the actual rolling speeds, they were not directly used in the calculation. An inverse procedure is used to independently assess the influence of the deformation rate by comparing the results of rolling forces actually measured and calculated from a model based on a static tensile curve, as will be described below. The material was considered to be homogeneous, isotropic, and with isotropic strengthening, since information on possible anisotropy is not available and the load in the plastic region is mainly monotonic in nature.
The results of tensile tests were converted from the conventional values to true values after determining the modulus of elasticity and are presented in Figure 16.
The true strain was converted into reduced strain corresponding to the uniaxial stress state up to the ultimate strength. The obtained curves were then approximated using the least square method—using Swift’s formula [35].
σ ¯ = K   ( ε 0 + ε ¯ p ) n
where σ ¯ is the reduced stress, K is the hardening coefficient, ε0 is the reference strain, ε ¯ p is the reduced plastic strain, and n is the hardening exponent. The curve for 20 °C was advantageously extended thanks to information provided during tensile tests after various cold rolling degrees. The approximation results are shown in Table 5 and Figure 17a,b. Swift’s formula was then used for extrapolation up to high strains, which were achieved during rolling and are shown in Figure 17a.
The most useful results for the extrapolation of data to the large plastic strain area are contained in the static curve at 20 °C, see Figure 17. Here, the results of tensile tests of specimens rolled at various reductions were included. This curve became the basic material model for subsequent calculations. In order to quantify the effect of the increased temperature, 100 °C, extrapolation calculations were subsequently also made for 100 °C, as can be seen in Figure 17. The material was considered to be homogeneous, isotropic, and with isotropic hardening.
Table 6 shows a comparison of the reaction (vertical) forces on the rolls obtained from the operational experiment and from the calculations for static hardening curves at 100 °C and 20 °C. Based on these results, we can conclude that the effect of temperature on force parameters in the considered range is in units of percent, up to 10%. It corresponds to the difference of static stress curves for these temperatures and to the difference of reduced stresses obtained; see Figure 11.
Compared to the static model at 20 °C, the forces measured in the operational experiment at real strain rates (up to 300 s−1) are 10–20% higher. It can be assumed that the material stress–strain curve at such high rates will also be increased by the indicated 10–20% when compared to the static curve.
The following figures show the resulting distribution of plastic deformations along the sheet thickness at the end of the rolling process. Figure 18a shows the patterns of the longitudinal component of plastic strain in the rolling direction. The patterns of a reduced plastic strain across the thickness is presented in Figure 18b. As can be seen, the effect of temperature is negligible, and for both temperatures, the plastic strains are virtually the same, distributed uniformly across the thickness. Similarly, the resulting strain will be independent of the rolling speed. The rolling speed, however, will influence the energy-force parameters—the values of stress, rolling forces, and the required power input of the rolling mill.
Figure 18a shows the patterns of residual stress in the rolling direction across the thickness of the material after the rolling process. At the process temperature of 20 °C, a compressive stress of up to 50 MPa prevails in the subsurface area, while a tensile stress of up to 100 MPa prevails in the central area. At the process temperature of 100 °C, there is a significant difference in the distribution of residual stress. Residual stress is distributed relatively homogeneously across the thickness, with only moderate local maxima. By comparing the two patterns, the positive effect of the temperature increase on the elimination of residual stress is obvious.

4. Conclusions

This paper dealt with the investigation of the effect of preheating hot-rolled strips’ high-strength electro-technical steels on their mechanical workability and straining behaviour improvement during tandem cold rolling. Based on the experimental conditions, the obtained results, and their analyses, the following conclusions can be drawn:
  • This scientific work has found that the strength properties of the investigated HSET steels’ hot bands are declining with rising testing temperature, and the dependence on the testing strain rate shows the opposite character.
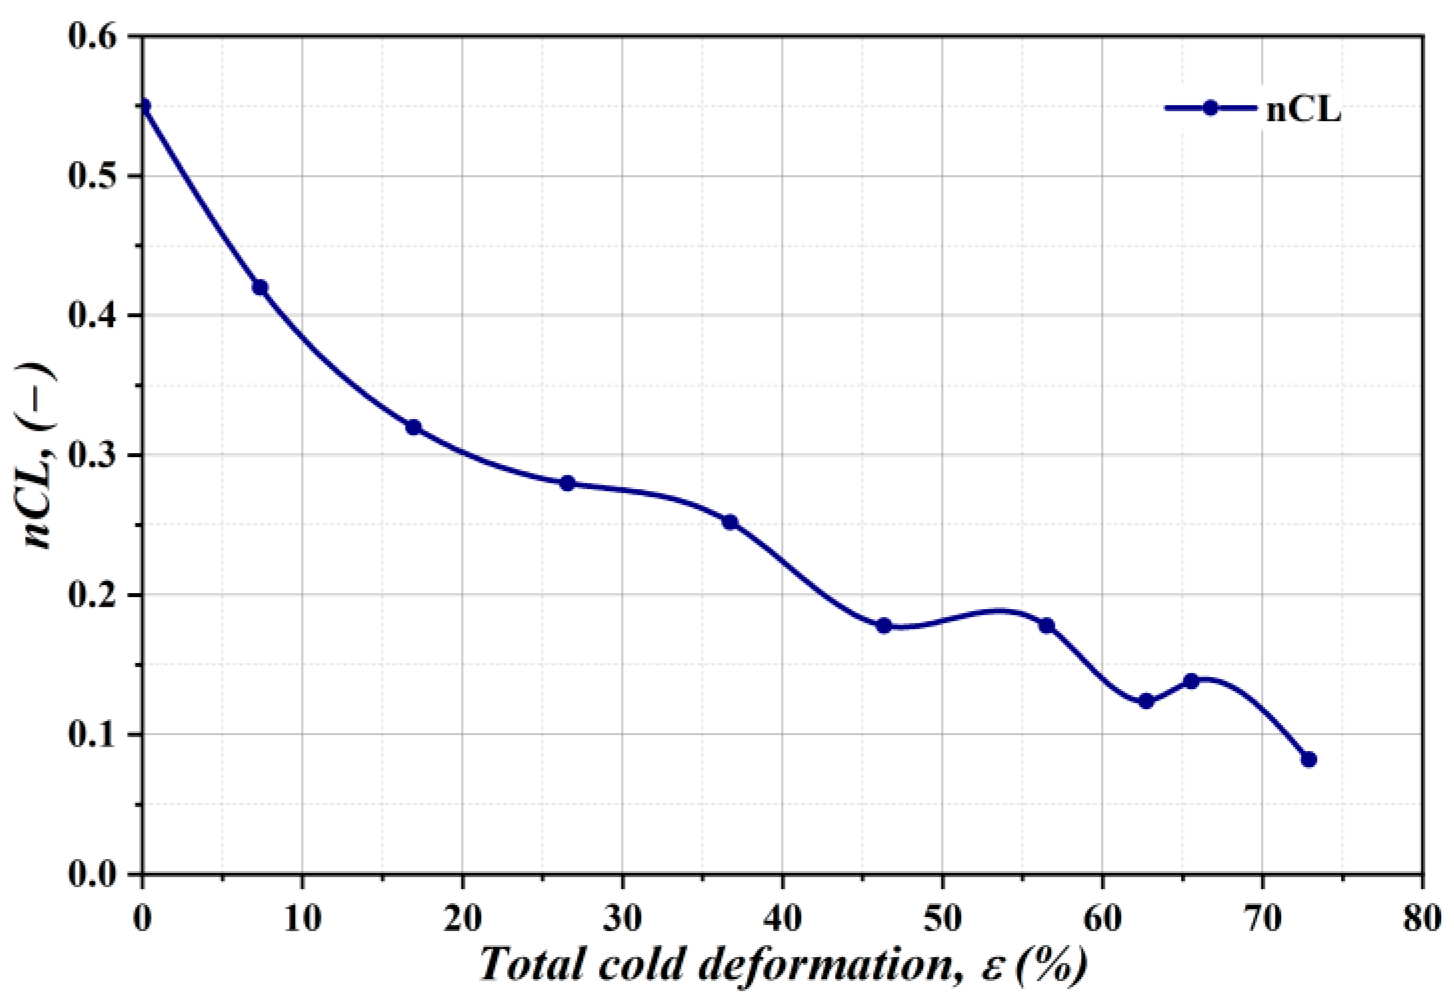
  • Total cold rolling deformations have a strong effect on the rising of strength properties, but on the other hand, reduce the plastic properties of the tested material. The maximal level of the yield strength was achieved at the value Rp0.2 = 1066 MPa, at which the elongation declined to the minimal value A5 = 2%.
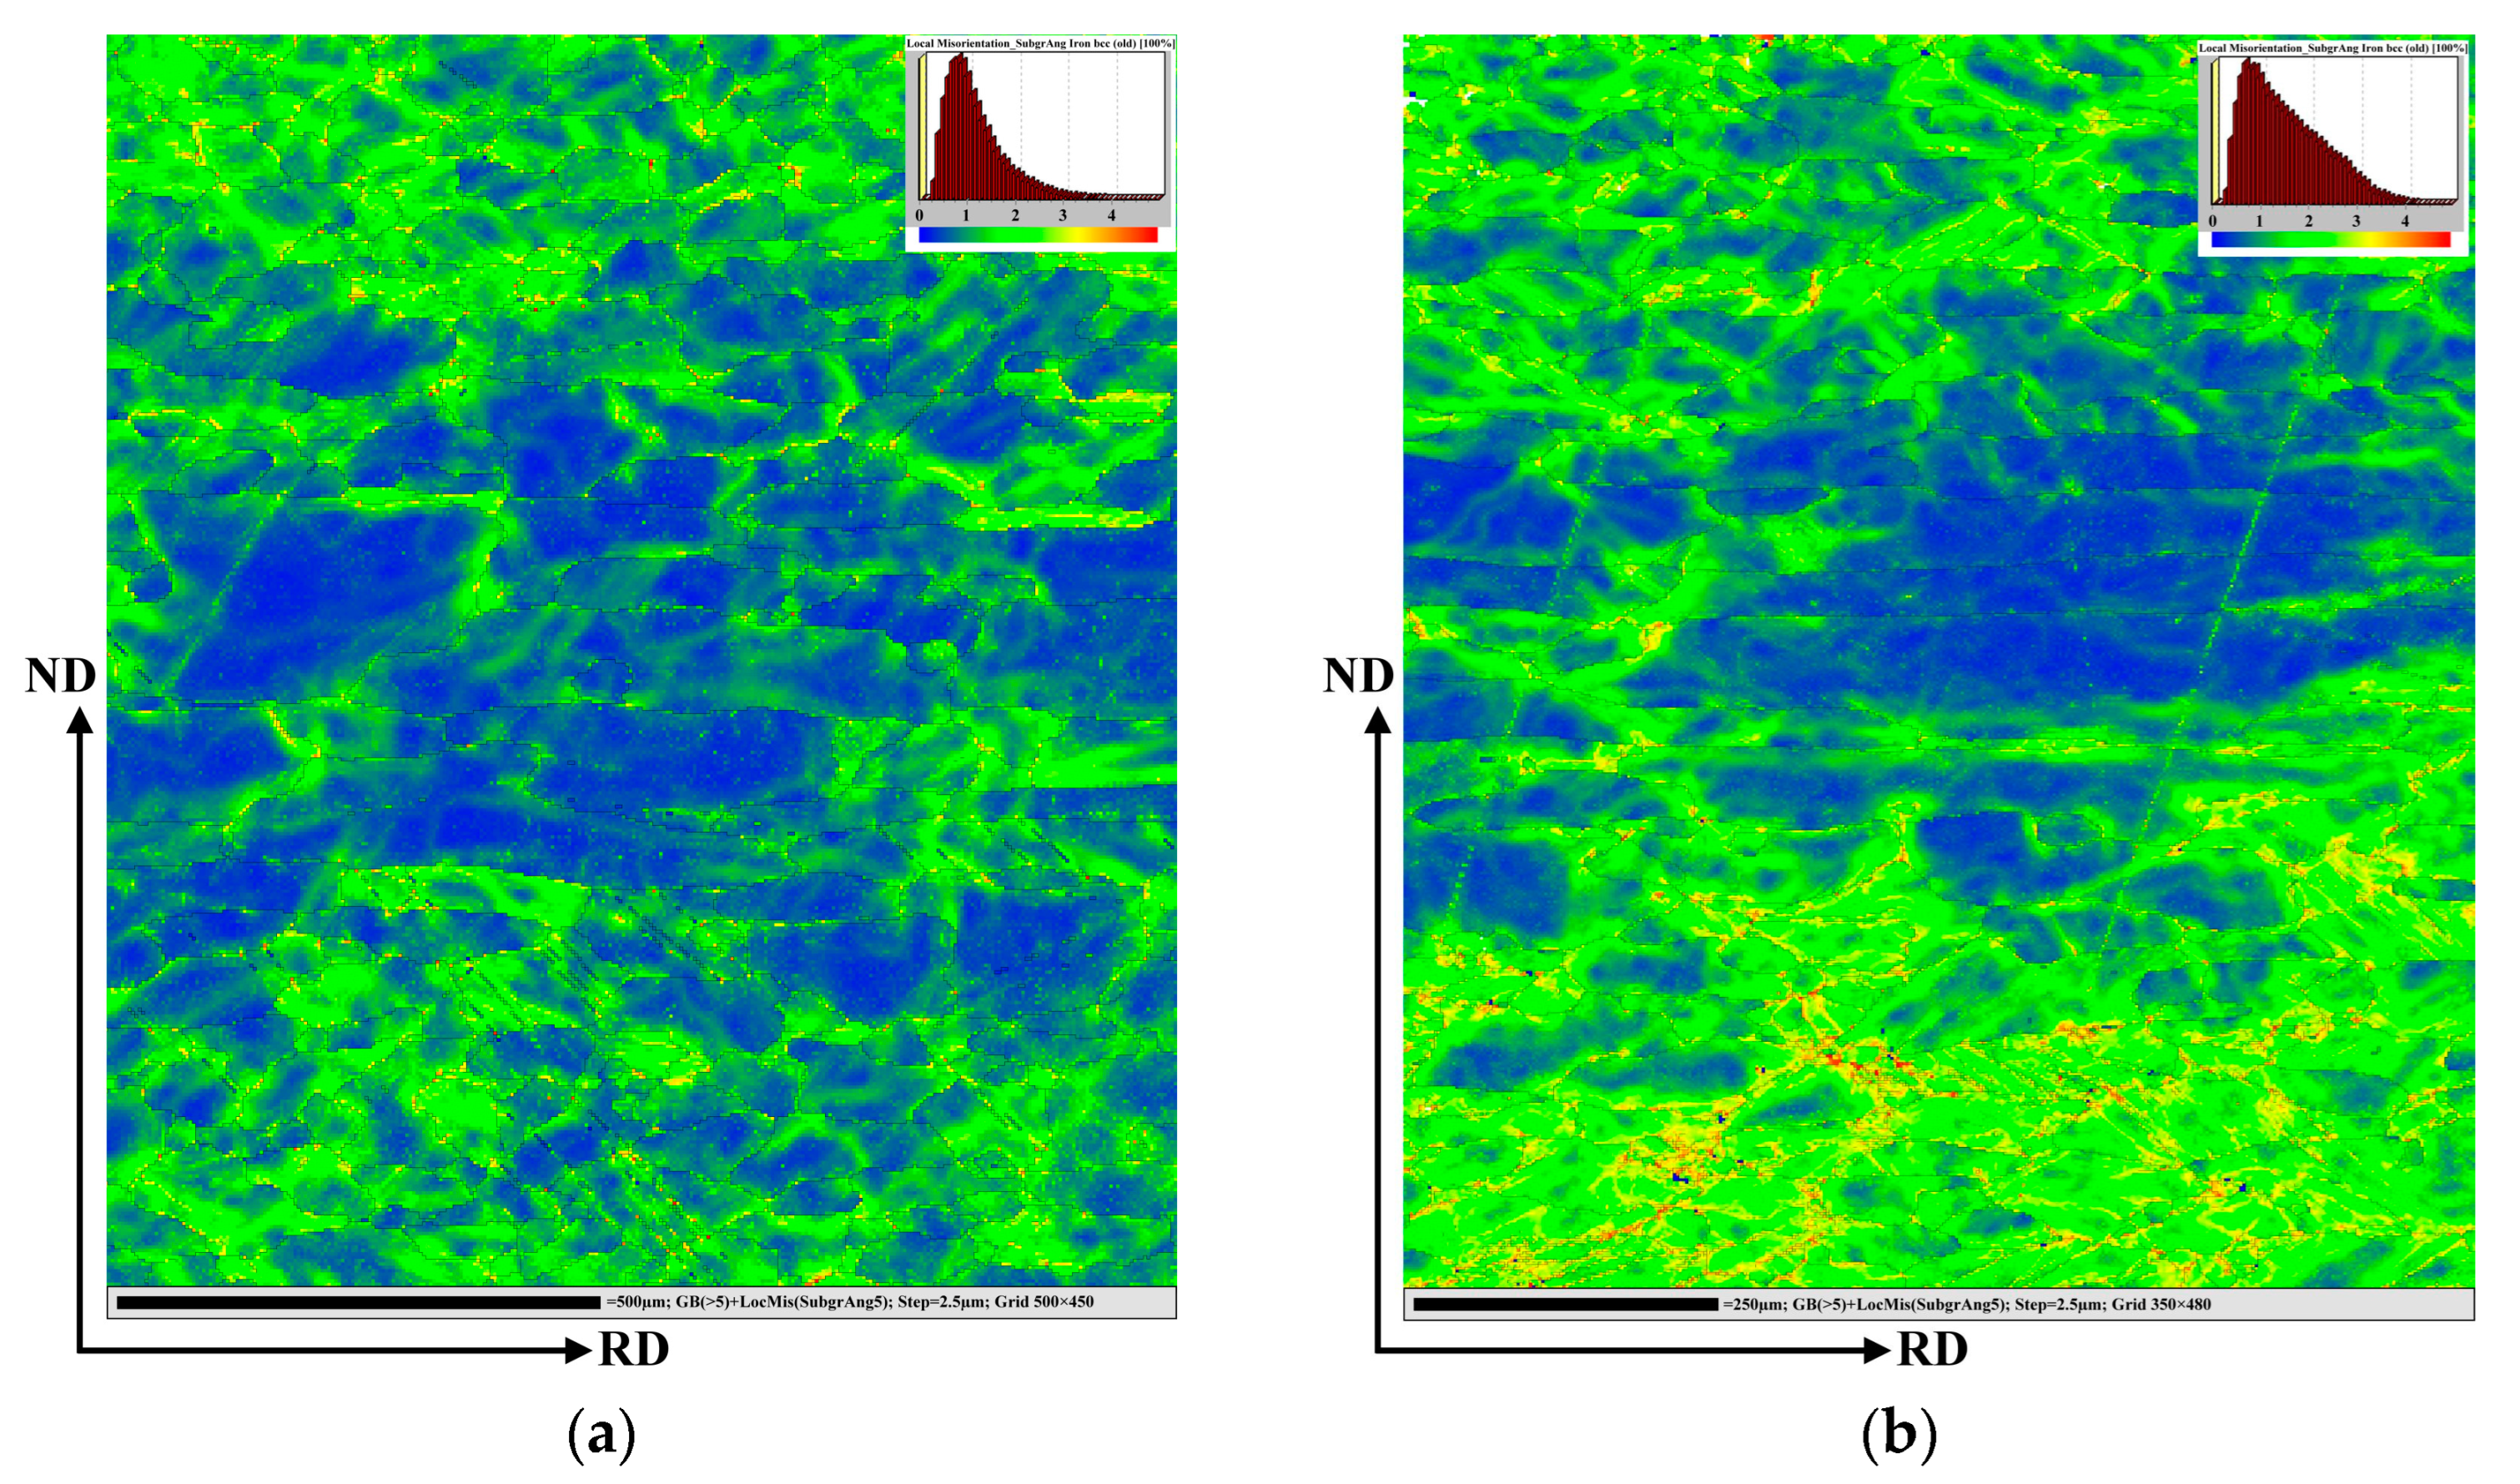
  • The analysis of change in the stress–strain characteristics of the hot strip depending on the strain degree by cold rolling clearly shows that an increase in the value of cold rolling deformation leads to the generation of cracks inside the hot band.
  • The results of mathematical simulation indicate that at the process temperature of 20 °C, the compressive stress is characterised by an inhomogeneous distribution with a maximum value in the central area of the hot band. At the process temperature of 100 °C, there is a significant difference in the distribution of residual stress. Residual stress is distributed relatively homogeneously across the thickness, with only moderate local maxima. By comparing the two patterns, the positive effect of the temperature increase on the elimination of residual stress is obvious.

Author Contributions

Conceptualisation, F.K., R.K. and I.P.; methodology, F.K.; software, I.P. and P.P.; validation, I.P., F.K. and P.P.; formal analysis, I.P., F.K. and R.K.; investigation, I.P.; resources, I.P. and F.K.; data curation, I.P., P.P. and R.K.; writing—original draft preparation, F.K., L.F. and I.P.; writing—review and editing, F.K., L.F. and I.P.; visualisation, I.P.; supervision, F.K.; project administration, I.P.; funding acquisition, I.P. All authors have read and agreed to the published version of the manuscript.

Funding

This research was funded by Slovak Research and Development Agency within project APVV-21-0418 and by the Slovak Grant Agency (VEGA) under grant No. 2/0106/21.

Data Availability Statement

Not applicable.

Acknowledgments

This work was carried out within the research projects supported by “Slovak Research and Development Agency” under the contract No. APVV-21-0418 and partly by “the Slovak Grant Agency (VEGA)” under the projects VEGA 2/0106/21. The work was also realised within the frame of the projects APVV-18-0207. Also, we would like to express our sincere gratitude to our advisors, Jindřich Petruška and František Šebek, from the Institute of Solid Mechanics, Mechatronics and Biomechanics, Faculty of Mechanical Engineering BUT (Brno, Czech Republic), for their invaluable support in the field of mathematical modelling.

Conflicts of Interest

The authors declare no conflict of interest.

References

  1. Ivo, R.F.; Rodrigues, D.A.; Bezerra, G.M.; Freitas, F.N.C.; Abreu, H.F.; Filho, P.R. Non-grain oriented electrical steel photomicrograph classification using transfer learning. J. Mater. Res. Technol. 2020, 9, 8580–8591. [Google Scholar] [CrossRef]
  2. Zhang, Z.; Hamzehbahmani, H.; Gaskell, P.H. A new hysteresis simulation method for interpreting the magnetic properties of non-oriented electrical steels. J. Magn. Magn. Mater. 2023, 576, 170763. [Google Scholar] [CrossRef]
  3. Du, Y.; O’Malley, R.; Buchely, M.F. Review of Magnetic Properties and Texture Evolution in Non-Oriented Electrical Steels. Appl. Sci. 2023, 13, 6097. [Google Scholar] [CrossRef]
  4. World Energy Outlook 2022. Available online: https://www.iea.org/reports/world-energy-outlook-2022 (accessed on 1 November 2022).
  5. Hawezy, D. The influence of silicon content on physical properties of non-oriented silicon steel. Mater. Sci. Technol. 2017, 32, 1560–1569. [Google Scholar] [CrossRef]
  6. Xia, C.; Wang, H.; Wu, Y.; Wang, H. Joining of the laminated electrical steels in motor manufacturing: A review. Materials 2020, 13, 4583. [Google Scholar] [CrossRef] [PubMed]
  7. Senda, K.; Uesaka, M.; Yoshizaki, S.; Oda, Y. Electrical steels and their evaluation for automobile motors. World Electr. Veh. J. 2019, 10, 31. [Google Scholar] [CrossRef] [Green Version]
  8. Oda, Y.; Okubo, T.; Takata, M. Recent Development of Non-Oriented Electrical Steel in JFE Steel. JFE Tech. Rep. 2016, 21, 7–13. [Google Scholar]
  9. Zhong, B.; Cheng, Z.; Wendler, M.; Volkova, O.; Liu, J. Optimized rolling processes to balance magnetic and mechanical properties of high-strength non-oriented silicon steels. Mater. Des. 2023, 232, 112096. [Google Scholar] [CrossRef]
  10. Almeida, A.A.; Paolinelli, S.C.; Landgraf, F.J.G. Effect of the silicon content on the hysteresis loss of non-oriented steels. IEEE Trans. Magn. 2019, 55, 2002404. [Google Scholar] [CrossRef]
  11. Lee, S.; Park, J.T.; Kim, S.J. Examination of magnetic properties of nonoriented electrical steels using ring-type specimens. J. Magn. Magn. Mater. 2022, 557, 169471. [Google Scholar] [CrossRef]
  12. Pedrossa, J.S.M.; Paolinelli, S.C.; Cota, A.B. Influence of initial annealing on structure evolution and magnetic properties of 3.4% Si non-oriented steel during final annealing. J. Magn. Magn. Mater. 2015, 393, 146–150. [Google Scholar]
  13. Zu, G.; Xu, Y.; Luo, L.; Han, Y.; Sun, S.; Miao, R.; Zhu, W.; Gao, L.; Ran, X. Effect of rolling temperature on the recrystallization behavior of 4.5 wt.% Si non-oriented electrical steel. J. Mater. Res. Technol. 2022, 17, 365–373. [Google Scholar]
  14. Lee, H.H.; Jung, J.; Yoon, J.I.; Kim, J.K.; Kim, H.S. Modeling the evolution of recrystallization texture for a non-grain oriented electrical steel. Comput. Mater. Sci 2018, 149, 57–64. [Google Scholar] [CrossRef]
  15. Rusnák, J.; Malega, P.; Svetlík, J.; Rudy, V.; Šmajda, N. The research of the rolling speed influence on the mechanism of strip breaks in the steel rolling process. Materials 2020, 13, 3509. [Google Scholar] [CrossRef]
  16. Sandova Robles, J.A.; Salas Zamarripa, A.; Guerrero Mata, M.P.; Cabrera, J. Texture evolution of experimental silicon steel grades. Part I: Hot rolling. J. Magn. Magn. Mater. 2017, 429, 367–371. [Google Scholar]
  17. Pittner, J.; Samaras, N.S.; Simaan, M.A. New Strategy for Optimal Control of Continuous Tandem Cold Metal Rolling. IEEE Trans. Ind. Appl. 2010, 46, 703–711. [Google Scholar] [CrossRef]
  18. Feng, X.; Wang, X.; Sun, J.; Yang, Q. Analysis of tapered work roll shifting technique in 5-stand UCMW tandem cold rolling process. Aust. J. Mech. Eng. 2019, 19, 291–299. [Google Scholar] [CrossRef]
  19. Yanez-Ros, T.; Calvillo, P.R.; Colas, R.; Houbaert, Y. Workability and straining behavior of high silicon steels (3.0–6.3%Si) by hot torsion and RT compression test. Mater. Sci. Forum 2007, 429, 4422–4427. [Google Scholar]
  20. Petryshynets, I.; Kovac, F.; Falat, L. Analysis of the Reasons for the Tearing of Strips of High-Strength Electrical Steels in Tandem Cold Rolling. Materials 2021, 14, 7124. [Google Scholar] [CrossRef]
  21. He, Y.; Hilinski, E.J. Texture and magnetic properties of non-oriented electrical steels processed by an unconventional cold rolling scheme. J. Magn. Magn. Mater. 2016, 405, 337–352. [Google Scholar] [CrossRef]
  22. Hayakawa, Y.; Kurosawa, M. Orientation relationship between primary and secondary recrystallized texture in electrical steel. Acta Mater. 2002, 50, 4527–4534. [Google Scholar] [CrossRef]
  23. Jiaoa, H.T.; Xub, Y.B.; Zhaoa, L.Z.; Misrac, R.D.K.; Tanga, Y.C.; Zhaoa, M.J.; Liua, D.J.; Hua, Y.; Shena, M.X. Microstructural evolution and magnetic properties in strip cast non-oriented silicon steel produced by warm rolling. Mater. Charact. 2019, 156, 109876. [Google Scholar] [CrossRef]
  24. ISO 6892-1:2019; Metallic Materials—Tensile Testing—Part 1: Method of Test at Room Temperature. ISO: Geneva, Switzerland, 2019. Available online: https://www.iso.org/standard/78322.html (accessed on 17 September 2021).
  25. Stebunov, S.; Vlasov, A.; Biba, N. Prediction of fracture in cold forging with modified Cockcroft-Latham criterion. Procedia Manuf. 2018, 15, 519–526. [Google Scholar] [CrossRef]
  26. Poláková, I.; Zemko, M.; Rund, M.; Džugan, J. Použitie softvéru DEFORM na stanovenie parametrov pre dve lomové kritériá podľa DIN 34CrNiMo6. Kovy 2020, 10, 445. [Google Scholar]
  27. González-Velázquez, J.L. Mechanical Behavior and Fracture of Engineering Materials; Springer Nature: Basel, Switzerland, 2020; pp. 86–95. [Google Scholar]
  28. Nemat-Nasser, S.; Guo, W.G. Thermomechanical response of DH-36 structural steel over a wide range of strain rates and temperatures. Mech. Mater. 2003, 35, 1023–1047. [Google Scholar] [CrossRef]
  29. Nemat-Nasser, S.; Guo, W.G.; David, P.K. Thermomechanical response of AL-6XN stainless steel over a wide range of strain rates. J. Mech. Phys. Solids 2001, 49, 1823–1846. [Google Scholar] [CrossRef]
  30. Kvačkaj, T.; Tiža, J.; Bacsó, J.; Kováčová, A.; Kočiško, R.; Pernis, R.; Fedorčáková, M.; Purcz, P. Cockcroft-Latham Ductile Fracture Criteria for Non Ferrous Materials. Mater. Sci. Forum 2014, 782, 373–378. [Google Scholar]
  31. Takuda, H.; Hama, T.; Nishida, K.; Yoshida, T.; Nitta, J. Prediction of Forming Limit in Stretch Flanging by Finite Element Simulation Combined with Ductile Fracture Criterion. Comput. Methods Mater. Sci. 2009, 9, 137–142. [Google Scholar]
  32. Lehto, P. Adaptive domain misorientation approach for the EBSD measurement of deformation induced dislocation sub-structures. Ultramicroscopy 2021, 222, 113203. [Google Scholar] [CrossRef]
  33. Armstromg, R.W. Dislocation pile-ups, strength properties and fracture. Rev. Adv. Mater. Sci. 2017, 48, 1–12. [Google Scholar]
  34. Katiyar, T.; Giessen, E.V. Effective mobility of BCC dislocations in two-dimensional discrete dislocation plasticity. Comput. Mater. Sci. 2021, 187, 110129. [Google Scholar] [CrossRef]
  35. Swift, H.W. Plastic instability under plane stress. J. Mech. Phys. Solids 1952, 1, 1–18. [Google Scholar] [CrossRef]
Figure 1. The scheme presents the laboratory procedure of the preparation of experimental samples, their testing conditions, and the analysis of obtained results.
Metals 13 01415 g001
Figure 2. Dimensions and shape of investigated specimens used for uniaxial mechanical test. Units: mm.
Metals 13 01415 g002
Figure 3. Temperature field around the heated sample: (a) 60 °C and (b) 100 °C.
Metals 13 01415 g003
Figure 4. The geometry of tested samples used for the measurement of CL criteria: scheme with the size parameters of sample (a), prepared experimental sample with 20% of deformation (b), white coating with small black dots (c).
Metals 13 01415 g004
Figure 5. The engineering stress–strain diagrams of investigated samples obtained via static tensile test in the rolling (RD) and transverse directions (TD), with a strain rate of 0.00044 s−1 (a). Comparison of Rp0.2 and Rm in the rolling (RD) and transverse directions (TD) (b).
Metals 13 01415 g005
Figure 6. Engineering stress–strain diagrams of experimental hot band obtained by uniaxial tensile tests at various strain rates and elevated temperatures 20 °C (a), 60 °C (b), and 100 °C (c).
Metals 13 01415 g006
Figure 7. Relationship between the strain rate and the ReH and Rm change (a), influence of temperature on the ReH and Rm change (b).
Metals 13 01415 g007
Figure 8. Tensile test diagrams of cold-rolled specimens (a), dependence of strength and plastic properties to total cold rolling deformation (b).
Metals 13 01415 g008
Figure 9. Strain rate at individual strain degrees by rolling (a), stress–strain curve (σtrue—φtrue) of cold-rolled strip (b), linear regression Rp0.2 of dependence on φ (c) where the solid line represents the logarithmic measured data of stress and deformation, the dashed line represents the linearization of data presented by a solid line.
Metals 13 01415 g009
Figure 10. Tensile test diagrams of cold-rolled specimens (a), dependence of strength and plastic properties to total cold rolling deformation (b).
Metals 13 01415 g010
Figure 11. Graphic analysis of limit strains of hot strip: (a) strain map of fracture; (b) distribution of strain RD and TD in the fracture area; (c) FEM simulation of nCL criterion.
Metals 13 01415 g011
Figure 12. Graphic analysis of limit strains after 26% strain: (a) strain map of fracture; (b) distribution of strain RD and TD in the fracture area; (c) FEM simulation of nCL criterion.
Metals 13 01415 g012
Figure 13. Graphic analysis of limit strains after 73% strain: (a) strain map of fracture; (b) distribution of strain RD and TD in the fracture area; (c) FEM simulation of nCL criterion.
Metals 13 01415 g013
Figure 14. Change of nCL depending on the total cold deformation.
Metals 13 01415 g014
Figure 15. Kernel average misorientation (KAM) maps of the investigated hot band samples’ microstructure obtained after cold deformation via rolling with relative thickness reductions of 7% (a), 17% (b), 26% (c), 36% (d), 46% (e), 56% (f), and 65% (g). The legend (the upper right corner) for angles ranging from 0 to 5° are marked by a rainbow colour and show the higher deforming region.
Metals 13 01415 g015aMetals 13 01415 g015b
Figure 16. The relationships of true stress and true strain values depending on the strain temperature 20 °C (a) and 100 °C (b) for selected experiments.
Metals 13 01415 g016
Figure 17. Approximation using Swift’s formula for the temperatures: 20 °C (a), 100 °C (b). Extrapolation using Swift’s formula (c).
Metals 13 01415 g017
Figure 18. Plastic strain in the rolling direction across the thickness after the rolling process (a). Reduced plastic strain across the thickness after the rolling process (b). Residual stress in the rolling direction across the strip thickness after the rolling process (c).
Metals 13 01415 g018
Table 1. Chemical composition of investigated hot band (wt.%).
SiCMnAlPFeOther Elements
3.210.0060.250.180.04097.95<0.094
Table 2. Mechanical properties of the two types of HS samples obtained by static tensile test at different directions.
Thickness (mm)ε (%)Rp0.2 (MPa)Rm (MPa)
Rolling direction (RD)
Hot strip1.80.0475595
Ruptured strip1.385.1691723
Transverse direction (TD)
Hot strip1.80.0503639
Ruptured strip1.385.1713800
Table 3. Mechanical properties of the experimental HS samples tested at different temperatures and strain rates.
Temperature (°C)2060100
φ ˙ (s−1)0.000440.0440.110.000440.0440.110.000440.0440.11
ReH (MPa)557586592524547565499535547
Rm (MPa)629646656604623629592600606
Table 4. The setting of rolls’ parameters in the 5-stand TRM.
Stand NumberCircumferential Speed (m/min)Angular Speed (rad/s)Rolling Gap (µm)
11399.31373
219112.7996
325016.7788
432021.3620
539526.3500
Table 5. Results of approximation using Swift‘s formula.
Tensile Test ConditionsHardening Coefficient K (MPa)Reference
Strain (-)
Hardening Exponent n (-)
20 °C10680.054420.2317
100 °C9910.027340.2027
Table 6. Reaction forces on rolls.
Stand NumberExperiment (MN)Calculation for 100 °C (MN)Calculation for 20 °C (MN)
112.210.511.0
212.310.511.3
311.87.257.75
411.08.509.25
512.79.009.75
Disclaimer/Publisher’s Note: The statements, opinions and data contained in all publications are solely those of the individual author(s) and contributor(s) and not of MDPI and/or the editor(s). MDPI and/or the editor(s) disclaim responsibility for any injury to people or property resulting from any ideas, methods, instructions or products referred to in the content.

