Article

Characterisation of the Tensile and Metallurgical Properties of Laser Powder Bed Fusion-Produced Ti-6Al-4V ELI in the Duplex Annealed and Dry Electropolished Conditions

by
Duncan William Gibbons
1,*,
William Motsoko Makhetha
1,
Thorsten Hermann Becker
2 and
Andre Francois van der Merwe
1
1
Department of Industrial Engineering, Stellenbosch University, Stellenbosch 7599, South Africa
2
Centre for Materials Engineering, University of Cape Town, Cape Town 7701, South Africa
*
Author to whom correspondence should be addressed.
Metals 2023, 13(8), 1390; https://doi.org/10.3390/met13081390
Submission received: 29 June 2023 / Revised: 24 July 2023 / Accepted: 27 July 2023 / Published: 2 August 2023
(This article belongs to the Special Issue Additive Manufacturing of Titanium Alloys 2022)

Abstract

:
Metal additive manufacturing is becoming a popular manufacturing process in industries requiring geometrically complex components, part consolidation, and reductions in material waste. Metals manufactured via additive manufacturing processes such as laser powder bed fusion typically exhibit process-induced defects, material inhomogeneities, and anisotropy in terms of mechanical properties. Post-processing techniques such as heat treatments and surface finishing have been touted as approaches for improving these materials. Although various post-processing techniques have been proposed, the optimal post-processing route remains an active area of research. This research investigates Ti-6Al-4V ELI produced using laser powder bed fusion and post-processed via different routes. The materials in the stress-relieved and duplex annealed material conditions as well as dry electropolished and machined surface conditions were characterised. The duplex annealed Ti-6Al-4V ELI material showed improvements in ductility but at reduced strength when compared with the material in the stress-relieved condition. The microstructure of the duplex annealed material shows little evidence of process-induced defects and features and consists primarily of elongated and acicular α in a lamellar structure with intergranular β and exhibits uniform microhardness throughout the material. A reduced surface roughness due to surface finishing resulted in an improved reduction in area. This research highlights the effects of post-processing treatments and their ability to improve the properties of laser powder bed fusion-produced Ti-6Al-4V ELI.

1. Introduction

Additive manufacturing (AM) as a metal alloy manufacturing process is becoming increasingly popular in the industry [1]. AM offers benefits including reduced material waste, the ability to manufacture complex geometries, the potential for part consolidation, and the ability to manufacture parts from various metal alloys, amongst others [2]. AM, specifically metal AM, has seen great interest and uptake in industries where low batch production is commonplace and materials are expensive, such as the aerospace, medical, and oil and gas industries. This is largely due to the short lead times, reduced feedstock waste, and component weight reduction that metal AM offers compared to traditional manufacturing processes. However, there remain challenges with regard to repeatability and reliability in an industrial setting and meeting industry specification requirements.
Powder bed fusion AM processes, such as laser powder bed fusion (LPBF), are some of the most popular AM modalities as they offer the ability to produce near-net shape components and the ability to manufacture complex geometries and internal passages with little material waste [2]. The manufacture of titanium alloys through LPBF has been well investigated, specifically the Ti-6Al-4V alloy and its variants [3,4]. This alloy is produced with varying degrees of interstitial gas contents. ASTM grade 5 and grade 23, or extra low interstitial (ELI), are common Ti-6Al-4V grades [5]. Both of these grades are used extensively for aerospace applications, and grade 23 is also used for medical device applications. The Ti-6Al-4V alloy accounts for over 50% of the industrial usage of all titanium alloys [6]. This is mainly due to its high strength-to-density ratio and good fatigue resistance and damage tolerance [7,8]. The lower oxygen content of grade 23 compared to grade 5 results in lower strength but high ductility, fracture resistance, and improved damage-tolerant properties [6,8,9]. Boyer et al. [10] report reductions in ultimate tensile strength ( U T S ) of between 69 MPa and 200 MPa and reductions in yield strength ( Y S ) of between 41 MPa and 344 MPa when reducing the oxygen content from 0.19% to 0.12% for the ELI grade in four different heat treatment conditions. Oxygen pickup during the LPBF process is an important factor to control. Pickup of such interstitials can lead to embrittlement and decreased ductility [11]. Derimow et al. [12] have shown that the oxygen content trends downwards as the build height increases resulting in reduced strength values. The Ti-6Al-4V alloy can also be processed by various mechanical and thermal processes to better achieve specified properties for the application and has a good response to heat treatment [13]. Ti-6Al-4V consists of two allotropic crystal phases,  α , which is a hexagonal close-packed crystal structure and  β , which is a body-centred cubic crystal structure. The size and arrangement of these phases result in a variety of microstructures and properties. The temperature at which this alloy transitions to a fully  β  structure occurs at around 975 °C [9]. During heat treatment, minimal grain growth occurs upon rapid quenching and results in fine grains. Such quenching may result in the  β  phase being decomposed by a martensitic reaction [8]. Quenching from above the  β  transus temperature results in a microstructure of martensite,  α  or  α , with small amounts of  β . Fine grain structure typically results in improved strength, ductility, and resistance to fatigue crack initiation, but reduced fracture toughness and resistance to fatigue crack growth [6]. Slower cooling allows for grain growth and results in coarser grains. Such coarse grain structures typically result in inverse properties when compared with fine grain structures [6].
There are various approaches to heat treating conventionally produced Ti-6Al-4V, some of which include stress relieving (SR), mill annealing, recrystallisation annealing,  β  annealing, solution treatment and ageing (STA), and duplex annealing (DA) strategies [7,8]. Each of these treatments can be performed by varying the holding temperatures and cooling rates to achieve desired material properties. Additionally, hot isostatic pressing (HIP) aims to close internal voids and reduce porosity by applying a heat treatment under pressure. The DA heat treatment is investigated in this research. This treatment is often referred to in the same context as STA and solution treatment and overageing (STOA) [8]. Duplex staged heat treatments involve a first cycle in which the alloy is typically heated high in the  α + β  phase field, i.e., between 910 °C to 970 °C for Ti-6Al-4V, followed by gradual cooling or quenching to room temperature. The material is then reheated for a second cycle, typically to anywhere between 480 °C and 760 °C for Ti-6Al-4V, followed by gradual cooling [8,14]. Rapid cooling from high in the  α + β  phase field results in a metastable needle-like martensite formation [13,15,16]. For STA treatments, the material is reheated to a low temperature in the  α + β  phase field and typically air-cooled thereafter. This ageing treatment transforms martensite into fine  α  grains and aids strengthening [13]. Generally, higher temperatures for the second heat treatment cycle result in lower strength but improved fracture toughness and damage-tolerant properties [17]. An inverse relationship exists between strength and damage-tolerant properties and can be adjusted to suit the application of the material by altering these heat treatment temperatures and cooling strategies.  β  annealing is an example of this inverse relationship, whereby the alloy is heat treated above the  β  transus temperature resulting in improvements to damage tolerance properties but greatly reducing both strength and ductility. However, care shall be taken, as heat treatments and their principles as applied to conventional titanium manufacturing processes do not necessarily apply to titanium alloys manufactured via AM processes [14]. The literature on heat treating LPBF Ti-6Al-4V suggests that high-temperature annealing reduces the undesirable martensitic microstructure typically seen in the as-built condition and improves ductility and certain fatigue and damage tolerance properties [18,19,20,21]. Table 1 reviews the tensile properties of Ti-6Al-4V alloys that experienced high-temperature anneals and similar duplex staged heat treatments. Limited data were found on the specific heat treatment performed in this research for Ti-6Al-4V ELI, which is believed to provide optimal properties to meet material specification requirements such as ASTM F3001 [22]. Conformance to such industry specifications is important as these specifications are used for procurement agreements, as material allowables and to develop design values, and their use aims at reducing production risks while improving safety.
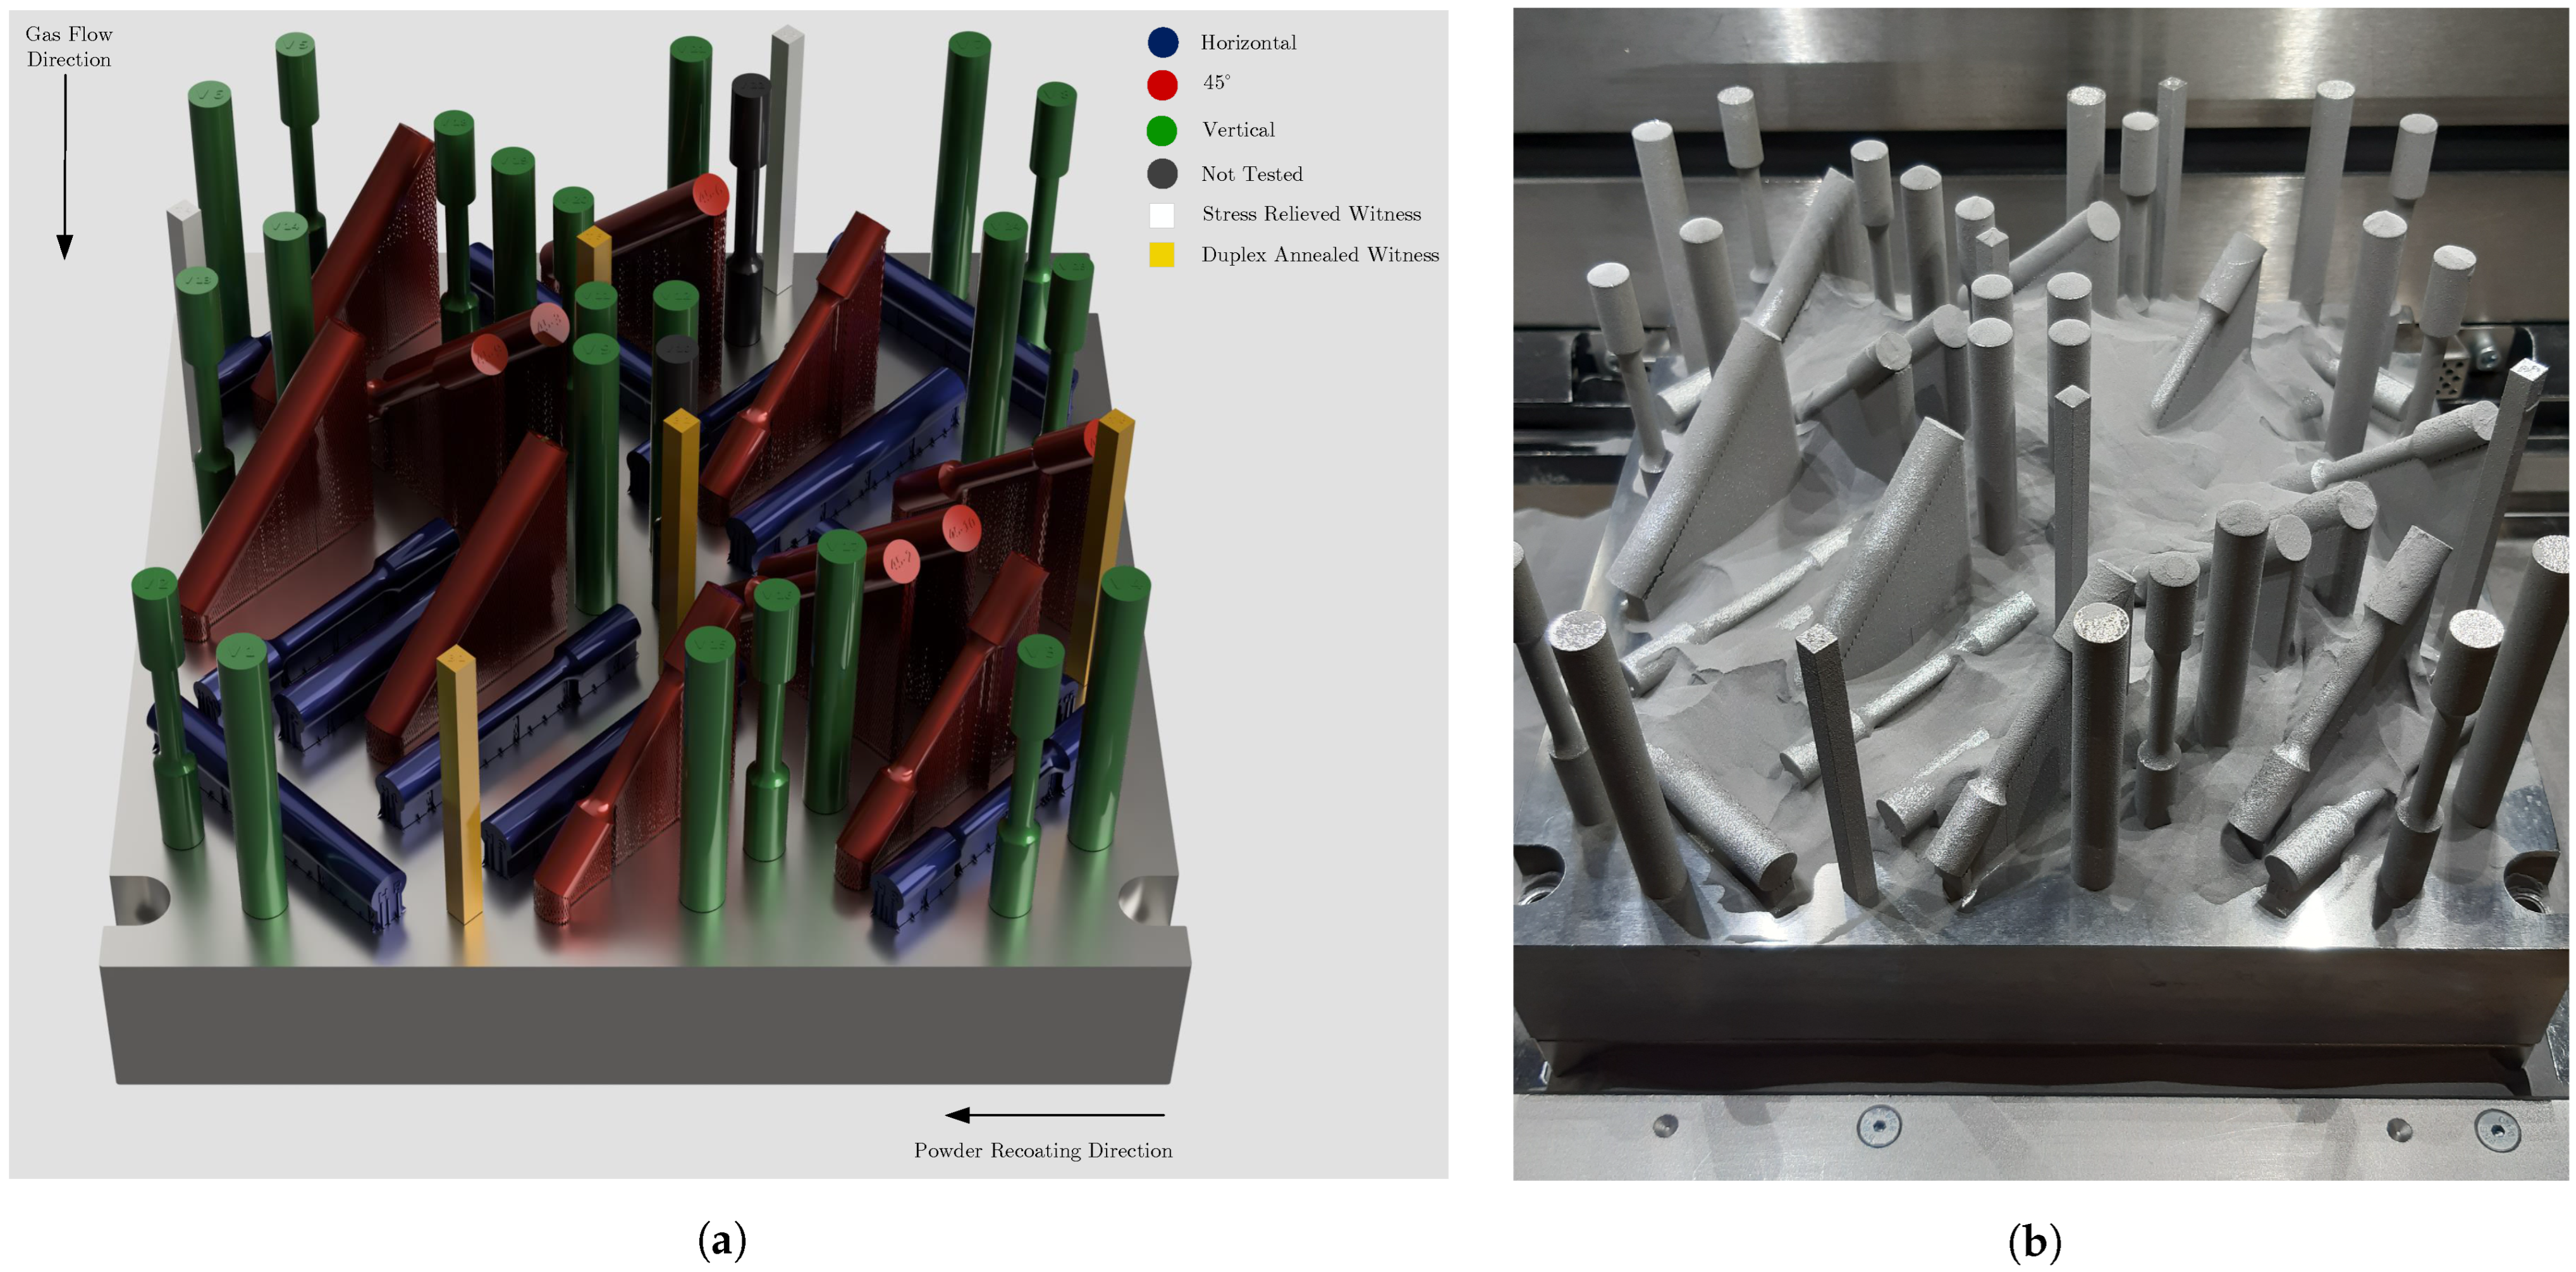
This paper aims to characterise the mechanical and metallurgical properties of Ti-6Al-4V ELI material manufactured via the LPBF AM process. Specifically, the material was manufactured in three build orientations, processed by two different heat treatments and finished by two different surface treatment processes. The capabilities of DA and dry electropolishing are investigated and the resulting mechanical and metallurgical properties are compared against industry specification requirements and the literature. Such comparisons are important to build confidence in both the LPBF process and the produced material and are required for the industrialisation of AM production.

2. Materials and Methods

2.1. Design and Manufacturing

Manufacturing was carried out in a facility certified to ISO 9001 and ISO 13485. It is noted that the surface treatments performed during this investigation do not fall within the scope of these certifications, but internal processes were followed. The build consisted of tensile and metallographic witness specimens. The build was designed to characterise tensile and metallurgical properties in three principal orientations across the build plate. Figure 1 shows the rendering of the build design and the layout on the build plate, Figure 1a, and the resulting as-printed build, Figure 1b. All specimens were designed in Autodesk Fusion 360, meshed with the high-quality setting enabled and exported as .stl files. Each specimen was located and orientated in the build using Materialise Magics 25 and the build file was uploaded directly to the LPBF machine.
Tensile specimens were designed in accordance with ASTM E8 requirements for round tension specimens [26]. Dimensions for small-sized specimen number 3 with a gauge length of 4D were selected with dimensions of  D 0  = 6 mm,  L 0  = 24 mm, and A = 30 mm with grips threaded to M10 × 1.5. The tensile specimens were orientated horizontally, at 45°, and vertically relative to the build plate as seen in Figure 1a. The witness specimens were 6 × 6 mm, spanned the height of the build (86 mm), and were orientated vertically relative to the build plate. All vertically orientated specimens were extruded down to the build plate with solid material. Block-type support structures supported horizontally orientated tensile specimens with solid pins at each end. Tensile specimens orientated at 45° were supported by block-type support structures alone and laid toward the recoater as a pragmatic approach to determine if recoater collisions are a high risk for the set machine parameters and material. All specimens were located 6 mm above the build plate to reduce the risk of contamination by residual gases in the build chamber and to allow for removal by cutting with a bandsaw.

2.1.1. Material Manufacturing

The material used for production was Ti-6Al-4V ELI powder feedstock supplied by EOS Finland. This powder lot was produced via the gas atomisation process and exhibited a particle size distribution (PSD) of D10 = 31  μ m, D50 = 49  μ m, and D90 = 75  μ m. The chemical composition of the powder lot was in accordance with the limits defined by the ASTM F3001 material specification [22]. The powder batch used in production had experienced 23 reuse cycles; a reuse cycle is defined as the process of sieving reclaimed powder, adding virgin powder from the same lot, and mixing to homogenise the batch for reuse. The IPCM-M extra powder processing system was used with a sieve mesh size of 90  μ m.
Specimens were manufactured via the LPBF process using an EOS M290 system. The standard high-performance parameters developed by EOS for Ti-6Al-4V ELI material were used. Table 2 details the key parameters and their designed values. The calculated energy density, E, for the infill scanning was 44.87 J/mm3, which is within the optimal process window for LPBF reported in the literature [27,28]. The oxygen concentration in the build chamber was controlled and remained below 0.1% throughout the printing process.

2.1.2. Thermal Treatments

The full build was SR in accordance with SAE AMS-H-81200 while still attached to the build plate [29]. SR was performed in a vacuum furnace at 650 °C for 3 h, followed by a furnace cooled at a rate of ≈4.85 °C/min (from 650 °C to 480 °C). Thereafter, 10 tensile specimens and 2 witness specimens were cut from the build plate using a bandsaw fitted with a tungsten carbide-tipped blade. A DA heat treatment was performed on the remaining specimens in accordance with SAE AMS-H-81200 [29]. For the first cycle, the specimens were heated to 950 °C and held for 2 h (i.e., just below the  β  transus temperature), followed by quenching by flushing the furnace chamber with cooled argon gas. This resulted in a quenching rate of ≈60 °C/min (from 950 °C to 480 °C). The second annealing cycle was carried out at 750 °C for 2 h, followed by furnace cooling at a rate of ≈6.33 °C/min (from 750 °C to 480 °C). All heat treatments were performed in the same vacuum furnace.

2.1.3. Surface Treatments and Machining

After DA the remaining 36 tensile specimens and 4 witness specimens were cut from the build plate using a bandsaw. Seventeen of these tensile specimens were machined to ASTM E8 size using a lathe and eighteen were abrasive blasted with CW-20 steel shot using a suction blast cabinet and then dry electropolished. The ends of the tensile specimens were machined to M10 × 1.5 size threads. All witness specimens were kept in their as-built surface condition. Dry electropolishing was performed using the DLyte 100H HF with Mix MSA-S medium for titanium alloys. Specimens were processed on the low-speed setting at 35 V for 45 min for roughing and then for 15 min on the medium-speed setting at 25 V for finishing, both using an alternating motion.

2.2. Material Testing and Analysis

2.2.1. Powder and Chemistry

A composite powder sample was taken from 8 locations in the powder dispenser system after the build was complete to represent the powder condition used in the built environment. This powder sample was blended and 2 samples were taken for elemental analysis and 1 sample for PSD analysis, each of 2 g. The remaining sample was used for Hall flow rate ( F R H ) testing in accordance with ASTM B213, analysis of the angle of repose ( A o R ), and apparent density ( A D H ) testing in accordance with ASTM B212 [30,31]. Photographs were taken of the powder piles that accumulated on an upside-down standard density cup after each Hall flow test. These photographs were aligned with the base of the powder pile and analysed in ImageJ to calculate the AoR with guidance from ISO 4324 [32,33]. PSD analysis was performed by laser diffraction in accordance with ISO 13320 using a Micromeritics Saturn DigiSizer 5200 [34]. The powder sample was suspended in isopropyl alcohol and testing was performed at a flow rate of 12 L/min, 60 s for circulating and ultrasonic time, and 60% ultrasonic intensity. The analysis was run 6 times.
Chemical elemental analysis was performed in accordance with ASTM E1409 and ASTM E1447 using a LECO ONH836 elemental analyser [35,36]. Only interstitial oxygen, nitrogen, and hydrogen elements were analysed. The analyser was drift calibrated using a standard Ti-6Al-4V grade 5 sample of the known composition prior to analysis, and the analysis was repeated 3 times for each of the 2 powder samples. Elemental analysis was also performed on 1 sample of the produced material extracted from the bottom of the build envelope and 1 from the top as a quality control measure.

2.2.2. Mechanical Testing and Metrology

Tensile testing was performed using a ZwickRoell Z100 AllRoundLine universal testing machine. The machine was fitted with a 100 kN Xforce P type load cell and a ZwickRoell makroXtens II extensometer was used. Two vertical specimens were tested using an Instron 5982 universal testing machine fitted with a 100 kN 2580 series load cell. Tensile testing was performed at room temperature in accordance with ASTM E8. Specimens were tested under strain control at a strain rate of 0.005 mm/mm/min until yielding, as per ASTM E8 guidance for aerospace testing; after that, a crosshead speed of 0.5 mm/min was applied until fracture [26]. The elongation after fracture ( E l a f ) and reduction in area ( R A ) were calculated by fitting the fractured halves together and measuring the elongated gauge length and the reduced diameter of the necked region using a digital calliper in accordance with ASTM E8 requirements [26]. Therefore, the ductility results are representative of the plastic deformation only. Tensile results were visualised in R Studio 2022. The ggplot2 package was used for plotting tensile data together with the stat_ellipse() function modified from the car package for statistical grouping of data [37]. Statistical ellipses were calculated and plotted for the 90% confidence levels. ANOVA was performed to analyse the tensile data in the DA condition in R Studio using the aov() function. ANOVA was performed to determine statistically significant differences in the means of the strength and ductility data for the different surface conditions and build orientations. The normality and the equality of the variances of the different data were tested prior to performing ANOVA using the ad.test(), shapiro.test(), and leveneTest() functions. Data were plotted using box plots to visually verify variance and identify outliers that fell outside the minimum and maximum regions. These data were excluded from the ANOVA analyses as they do not represent the normal data and may skew the analysis; however, it shall be noted that such outliers may be caused by significant process effects such as rogue defects, test instrument errors, or operator error. Q-Q plots were used to visually verify normal distribution. An alpha value of 0.05 was used for all hypothesis tests. Fractography was performed to analyse the fractured surfaces of the tensile specimens. Fractographic images were acquired at low magnifications using an Olympus SZX 7 stereo microscope and Olympus Stream Essentials software version 2.4.4. The Z stitching function in Olympus Stream Essentials was used to stitch multiple images at different heights and improve the depth of view of the fractographs.
Surface roughness measurements were performed with a MarSurf PS 10 equipped with a PHT 350 probe in accordance with ASTM B946 [38]. The length of each measurement was 4 mm and the probe was operated at 1 mm/s resulting in 8000 points per measurement. The roughness average ( R a ), average maximum roughness profile height ( R z ), and the maximum roughness profile height ( R t ) parameters were measured in accordance with ASME B46.1 [39]. The measurements taken in the as-built condition were taken from the witness specimens printed in the vertical orientation. Each of the four sides of the six witness specimens was measured and averaged, resulting in a sample size (n) of 24. For the dry electropolished and machined specimens, measurements were taken from specimens in the horizontal, 45° and vertical orientations, with 3 measurements taken per specimen measured in the axial direction at 3 locations roughly 120° apart. Seven specimens were randomly selected, resulting in a sample size of 21 for each surface condition.

2.2.3. Metallography and Metallurgy

Metallographic specimens were prepared from the witness specimens per ASTM E3 guidance [40]. These specimens were sectioned using a diamond metal bond blade in the XY and ZX/ZY planes. The sections were hot-mounted in resin and ground using P320 SiC grit paper until plane. The specimens were then polished on an MD Largo polishing pad with 9  μ m suspension. A finishing polish was performed using an MD Chem polishing pad with 0.25  μ m colloidal silica polishing liquid. The surfaces of the metallographic specimens were inspected for defects using an Olympus GX51 inverted metallographic microscope equipped with an SC30 camera. The specimens were then chemically etched using Kroll’s reagent conformant to ASTM E407 etchant number 192 concentrations [41]. Micrograph images were acquired using the Olympus Stream Essentials software version 2.4.4. The digital contrast function in Olympus Stream Essentials was used to improve the visibility of the microstructure of the specimens in the SR condition. The full sample surfaces were inspected for location-dependent inhomogeneities. No alpha case was found near the material surfaces. Grain sizing was performed for samples in the DA condition in accordance with ASTM E112 for elongated grains and microstructures consisting of 2 phases by applying the intercept method [42]. In addition, using ImageJ, quantitative image analysis was performed to calculate the average grain width and length of 20  α  laths per micrograph at random. The colour threshold function in ImageJ was used to calculate the percentage of  α  and  β  phases in each micrograph.
The density of the fractured tensile specimens was tested in accordance with ASTM B311 [43]. Specimens were selected at random from each material condition and build orientation. A Kern ABT 120-5DM analytical balance was used for weighing the specimens both in air and in distilled water of known density. All specimens were cleaned with isopropyl alcohol before testing. The distilled water was degassed by ultrasonic agitation. A fine dental brush was used to remove air bubbles that accumulated on the surfaces of the specimens when submerged in distilled water. The temperature of the distilled water was measured and the density was determined per ASTM B311 [43]. Every third specimen was measured 3 times to verify the precision of the measurements. Relative density was calculated as a percentage of the theoretical density for Ti-6Al-4V of 4.43 g/cm3 [44].
Indentation testing was performed using an EMCO DuraScan 10 to evaluate the microhardness of the produced material in accordance with ASTM E92 and ASTM E384 [45,46]. A Vickers indenter tip with a diagonal length of 50  μ m was used with a test force of 0.5 kgf/mm2. Hardness measurements were taken along the build direction in the Z direction and in the X/Y direction from the build surface to the centre of the sectioned witness specimens. All indentations were spaced at least 2.5 times the diagonal length of the indenter. Three measurements were taken per location and the average and range were calculated. One specimen per condition was used for measurements in the Z direction whereas measurements in the X/Y direction were taken at random build heights.

3. Results

3.1. Powder and Chemistry Results

The averaged weight percentages of oxygen, nitrogen, and hydrogen are presented in Table 3 for the powder feedstock and the produced material. The concentration of the interstitial elements is significantly lower than the ASTM F3001 and SAE AMS4931 requirements for both the feedstock and produced material [22,47].
The results of the laser diffraction analysis are shown in Figure 2b as a percent of cumulative volume. The  D 10 D 50 , and  D 90  values are illustrated and are in line with the PSD values of the production lot indicating that the PSD has not experienced significant drift due to processing and reuse, although there is an increase in the powder fines. The powder particles were largely spherical as seen in Figure 2a.
The  F R H  for the powder was calculated at an average of 29.8 ± 0.3 s/50 g, the average  A o R  was calculated at 33.0° ± 0.8°, and the  A D H  of the powder was calculated at 2.44 ± 0.01 g/cm3. Although there are few specifications for such powder metrics, the  F R H  is within the ranges for titanium alloys as proposed by AP&C and GE Additive [48].  A D H  is within the ranges set by EOS in the certificate of analysis for this powder lot. The AoR is classified as “free flowing” with “good” flowability as defined in the literature [49].

3.2. Surface Roughness Results

The average surface roughness values and their standard deviations are presented in Table 4. As expected, machining shows significant improvements in surface roughness. The surfaces in the abrasive blasted and dry electropolished condition also show an improvement for all three of these parameters when compared to the as-built condition, although not as significant as machining. Furthermore, although improved, the  R z  and  R t  values are still large [50].

3.3. Tensile Strength and Ductility Results

The tensile data are graphically plotted in Figure 3, Figure 4 and Figure 5. Figure 3 plots the  U T S  against the  Y S  for all specimens. The ASTM F3001 and SAE AMS4931 specification minimums are illustrated in each plot for reference [22,47]. It is evident from Figure 3 that the DA condition exhibits lower strength in terms of  U T S  and  Y S  compared to the material in the SR condition. Additionally, the DA condition contains less scatter as the results are more tightly grouped, as illustrated by the smaller statistical ellipses. Figure 4 shows a plot of  U T S  against  E l a f . The DA condition shows significant elongation improvements compared with the SR condition material. The specimens printed in the 45° orientation exhibited the highest  U T S  and lowest elongation on average, whereas specimens printed in the horizontal orientation exhibited the lowest  U T S . A comparison of  U T S  against  R A  is shown in Figure 5. Two outliers were identified and excluded from the statistical ellipses, both vertical specimens. Similar to the elongation data, the 45° orientation exhibited the highest  U T S  on average in the DA condition. These data also contained a higher degree of scatter in terms of  R A . The specimens manufactured in the vertical orientation exhibited the highest  R A  values in the DA condition.
The tensile test matrix and test results are presented in Table 5. Although these data are reported for relatively small sample sizes, there is a correlation between the surface condition and the resulting  R A . Additionally, the machined DA specimens printed horizontally exhibited lower strength when compared with the other orientations and surface treatments. The strength data in Table 5 reaffirm Figure 3, Figure 4 and Figure 5 that there exists a slight degree of anisotropy in terms of  U T S  based on the build orientation of the material. As each of the three orientations utilised different support structures, this is seen as a contributing factor for these differences in  U T S . The results of the ANOVA suggest that there is a statistically significant difference in the  U T S  means of the machined specimens due to the three different build orientations although only between the horizontal and 45° orientated specimens in the dry electropolished condition. There is no significant difference between the  Y S  means for the dry electropolished specimens in either orientation, with only the horizontally printed specimens exhibiting a significant difference due to the surface finish. This discrepancy in strength data between the two surface conditions can be attributed to the slight inaccuracies in cross-sectional area measurements for the rougher dry electropolished specimens. The surface finish did have a statistically significant effect on the  U T S  of the specimens printed vertically and horizontally. For ductility, there is no statistically significant difference between the three build orientations of the machined specimens in terms of  E l a f  or  R A . There is however a statistically significant difference between the three build orientations of the dry electropolished specimens in terms of both  E l a f  and  R A , except for the vertical and horizontal  E l a f  data. This suggests that the surface finish, as well as the build orientation, have significant effects on ductility properties.
The fracture surfaces and necked regions of the specimens in the SR condition were visibly different to those in the DA condition. The SR specimens exhibited less necking and less prominent shear lips, indicative of material with poor ductility. The fracture surfaces of the SR specimens contained deep cleavage facets and splitting whereas the DA specimens exhibited the typical “cup-and-cone”-type ductile fracture [51,52]. Figure 6 presents a representative sample of the fractographs.

3.4. Metallography Results

A representative sample of the micrographs in the SR condition is presented in Figure 7. In the Z, Figure 7a, and XY planes, Figure 7b, the material exhibits a fine needle-shaped, or acicular, structure of  α  indicative of martensite [9,53]. This martensitic structure is the primary microstructure formed during the LPBF process due to fast cooling rates and has been well characterised in the literature [3,16,54]. This fine martensitic structure results in high strength but at a decrease in ductility and damage tolerance properties and, therefore, is not suitable for structural aircraft components [6].
Process-specific features are evident in the microstructure in the SR condition. Long columnar prior  β  grains are visible in Figure 7a. This structure forms in the Z plane and grows in the build direction. The columnar structure is caused by the remelting and resolidification of the powder layers, visible both in the material in the as-built and SR conditions [3]. The micrographs in the XY plane exhibit a chessboard-like appearance, as highlighted by the dashed lines in Figure 7b. These structures are formed by the laser scanning strategy performed during hatching [54]. These structures are square-like due to the angular rotation of subsequent hatches at each layer [55]. Additional process-specific features seen in the micrographs are the presence of small pores as referenced in Figure 7b. These pores are caused by gas entrapped in the material. The size and frequency of the pores found are not of great concern and are less than 10  μ m in diameter. There was a region of small pores grouped, as highlighted by the dashed ellipse in Figure 7b. Such small defects have the potential to coalesce into larger defects in service but typically can be removed by HIP treatment. The microstructures, as well as the meso- and macrostructures, formed by the LPBF process, such as the columnar prior  β  grains, contribute to the anisotropy in material properties. These features support the need for further thermal processing to improve the homogeneity of the material and reduce the anisotropy of the material properties.
The representative sample of micrographs taken in the DA condition is presented in Figure 8. These micrographs show less prominent and process-specific microstructural features compared to the micrographs in Figure 7. This provides evidence that DA improves material homogeneity. Although still fine, the  α  grains and grain boundaries are distinct. The microstructure of the material in both the Z, Figure 8a, and XY planes, Figure 8b, consists of primarily elongated and acicular  α  grains in a lamellar structure in a transformed  β  matrix. Similar results have been reported by Becker et al. [23] and Ter Haar and Becker [20]. The lamellar structure is well dispersed and there is no evidence of continuous  α  networks at prior  β  grain boundaries [47]. The prior  β  grain boundaries are “soft” and  α  can form along these boundaries, providing a location for crack initiation and subsequent propagation along these boundaries [8].
DA of traditionally thermomechanically formed Ti-6Al-4V alloys results in a bimodal or duplex microstructure consisting of lamellar and equiaxed grains. As no mechanical deformation is performed during LPBF, nor are such processes desirable, the formation of equiaxed grains is greatly reduced. The microstructures seen in Figure 8 show fine grains in varying and alternating directions throughout the material and can be described as a fully lamellar structure. Such microstructures exhibit torturous and multifaceted crack paths; as a result, crack initiation is limited, and cracks that do initiate are arrested quickly, retarding the crack growth and improving fracture toughness [8]. Such torturous microstructural crack paths have been demonstrated under cyclic loading for LPBF Ti-6Al-4V grade 23 material in the DA condition by Macallister et al. [56]. These microstructural characteristics are favourable for achieving damage-tolerant properties.
The quantitative metallography results through image analysis are presented in Table 6. The microstructure and grain sizing in the XY and Z planes are homogeneous. The  α  laths have an average aspect ratio ( A R a v e ) of 5.2:1, therefore verifying the elongated grain structure. The orientation of the  α  grains is well dispersed in both planes with both anisotropy indices near 1. The relative accuracy per ASTM E112 was ≤10% [42].

3.5. Metallurgy Results

The density results of the manufactured specimens are presented in Table 7. There was no significant difference in density between the material in the SR condition and the material in the DA condition. Specimens printed at 45° resulted in the highest density. The average density for each of the three orientations and the two different heat treatments conforms to the density reported by EOS for the same material and machine [57].
The Vickers microhardness results are presented in Figure 9 for the  H V 0.5  method. Figure 9a presents the Vickers microhardness for the SR and DA material measured from the printed surface through to the centre of the material. Both conditions exhibited largely uniform material hardness and did not show evidence of  α  case formation near the surface. The DA treatment significantly reduced the average Vickers hardness from 372 ± 5 in the SR condition to an average of 326 ± 6. Wrought Ti-6Al-4V typically has an HV between 320 and 330 in the annealed condition and 390 in the STA condition [58]. Figure 9b presents the Vickers hardness results when measured along the build direction. The SR material exhibits a decreasing trend in Vickers hardness with increasing build height. The material hardness of the DA material is largely uniform along the build direction.

4. Discussion

The results presented in this research highlight the effect of heat treatment, surface finish, and build design on mechanical and metallurgical properties. The DA heat treatment improved material ductility, both in terms of  E l a f  and  R A . These improvements came at the cost of tensile strength. Designers shall consider such trade-offs for their specific application. The DA heat treatment showed reduced variability and scatter in both the microstructural and mechanical properties when compared to the SR condition. Kasperovich et al. [
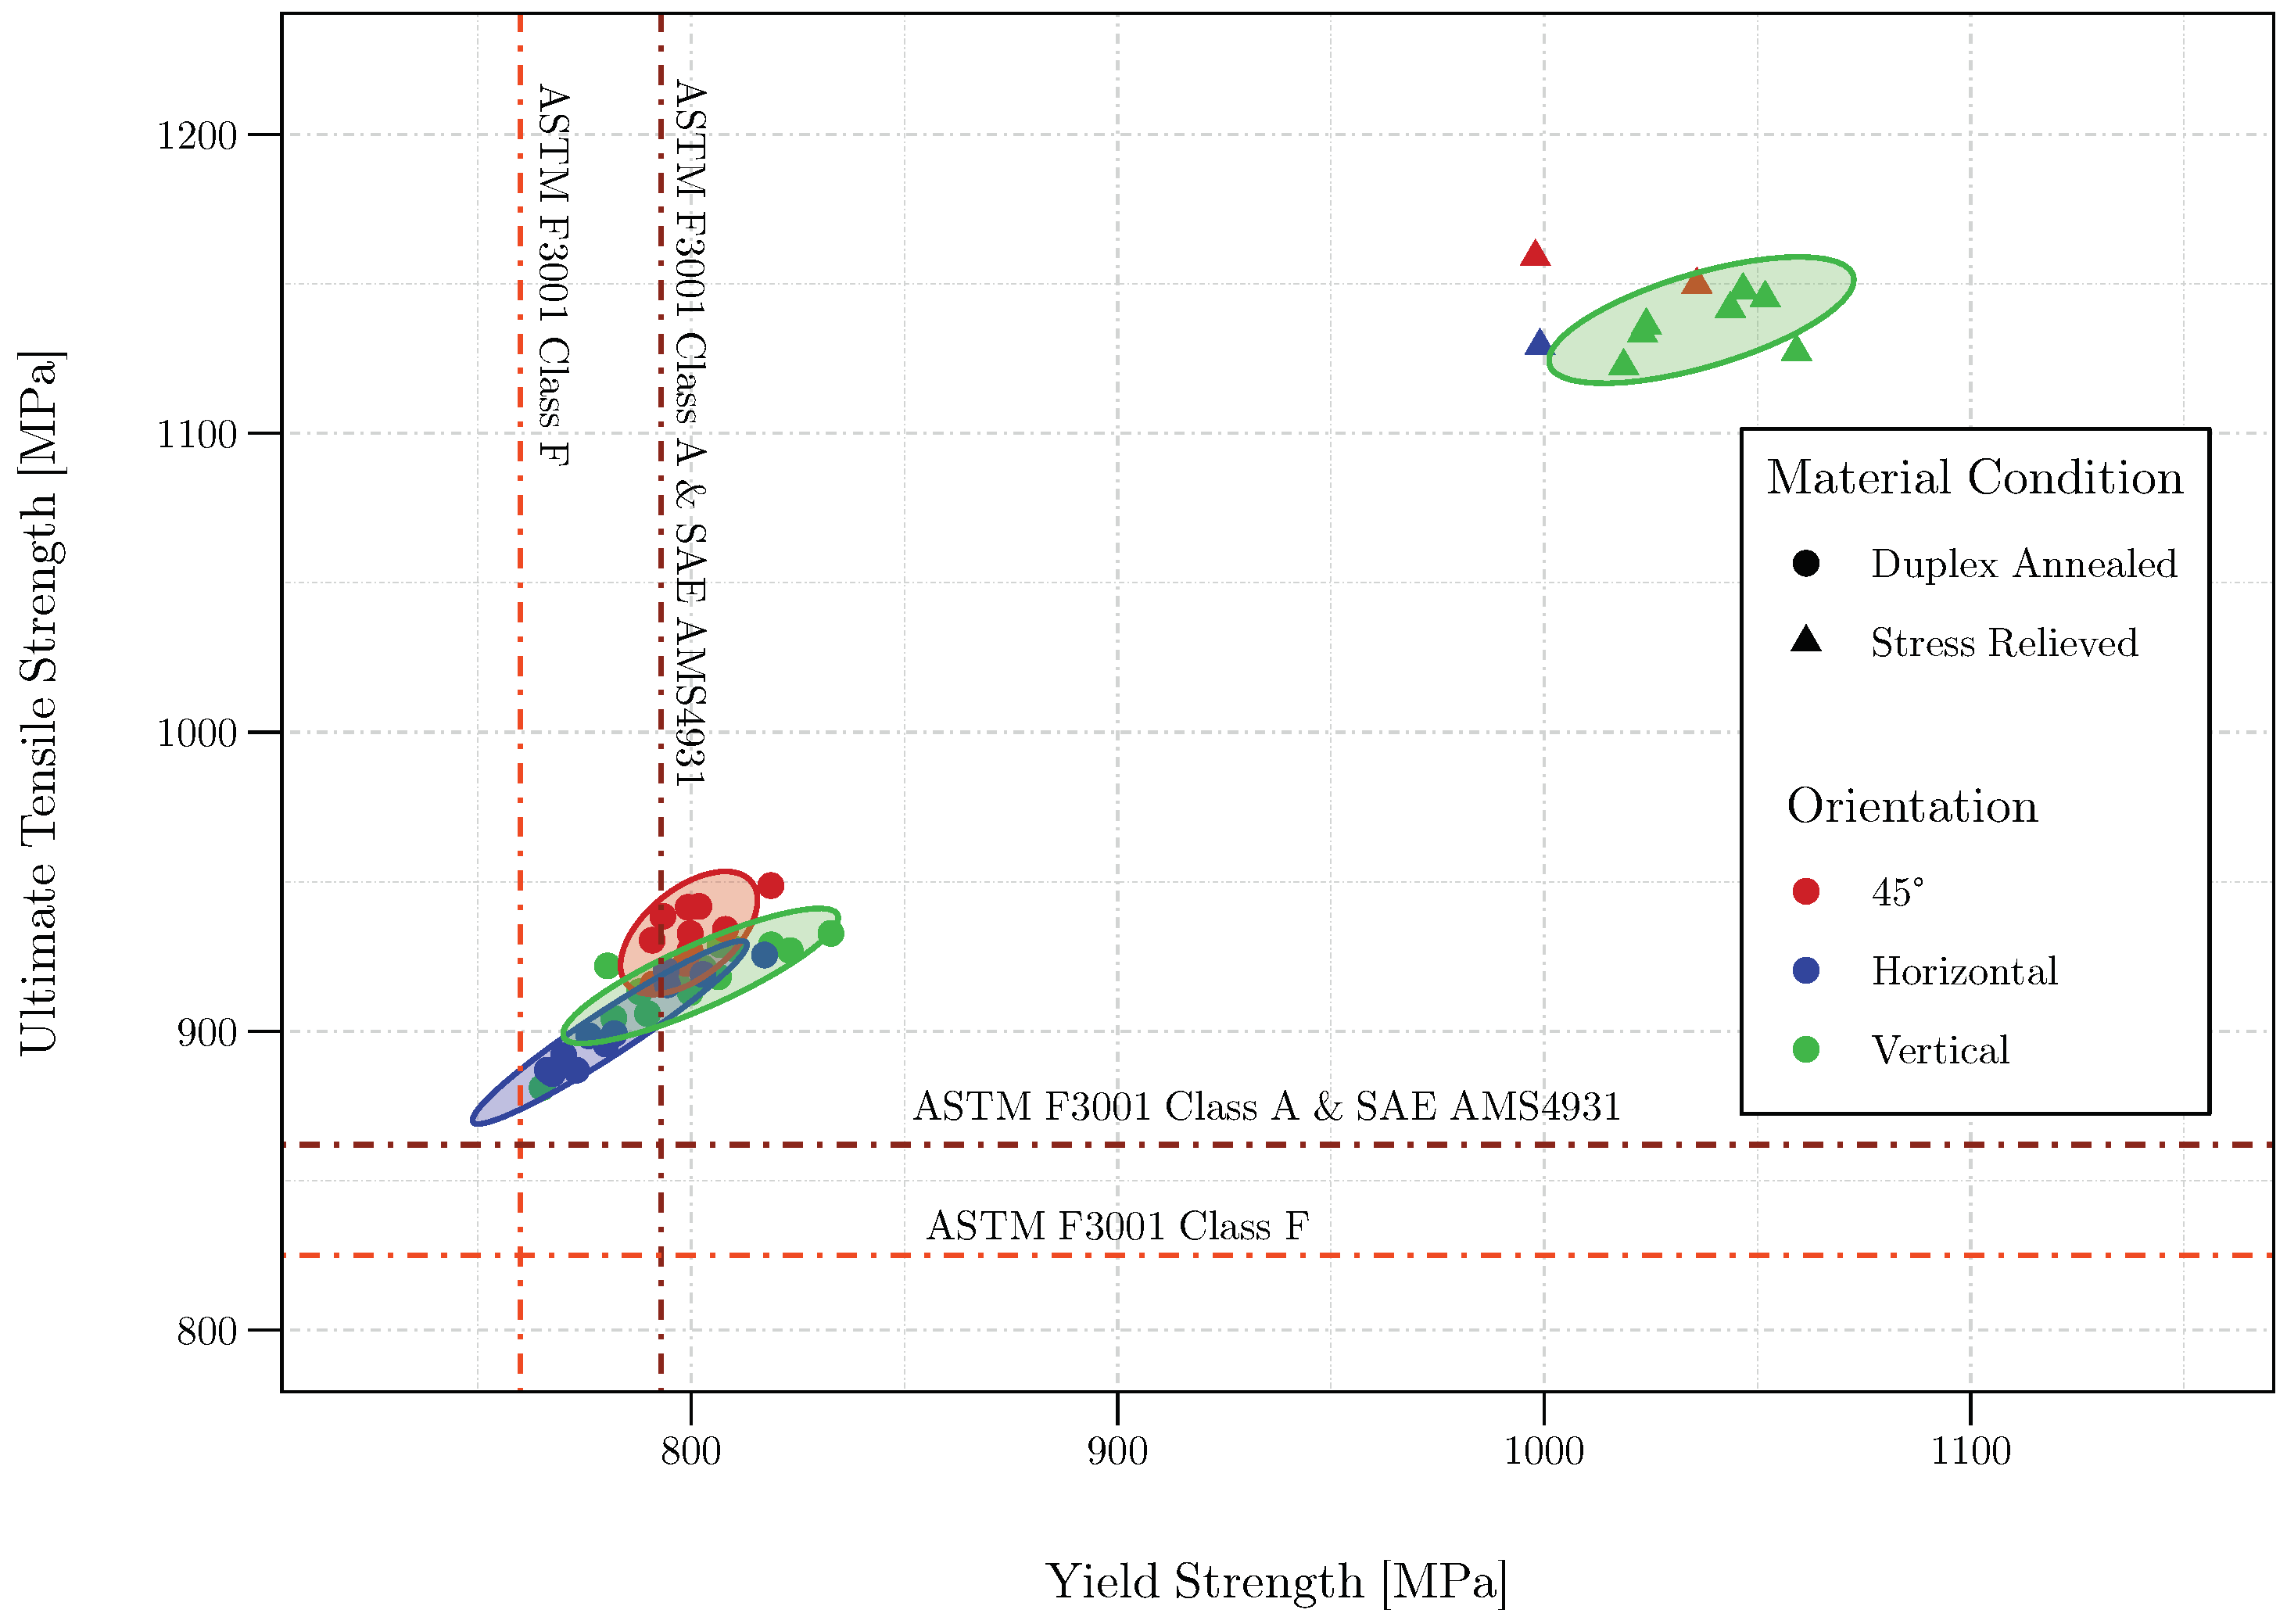
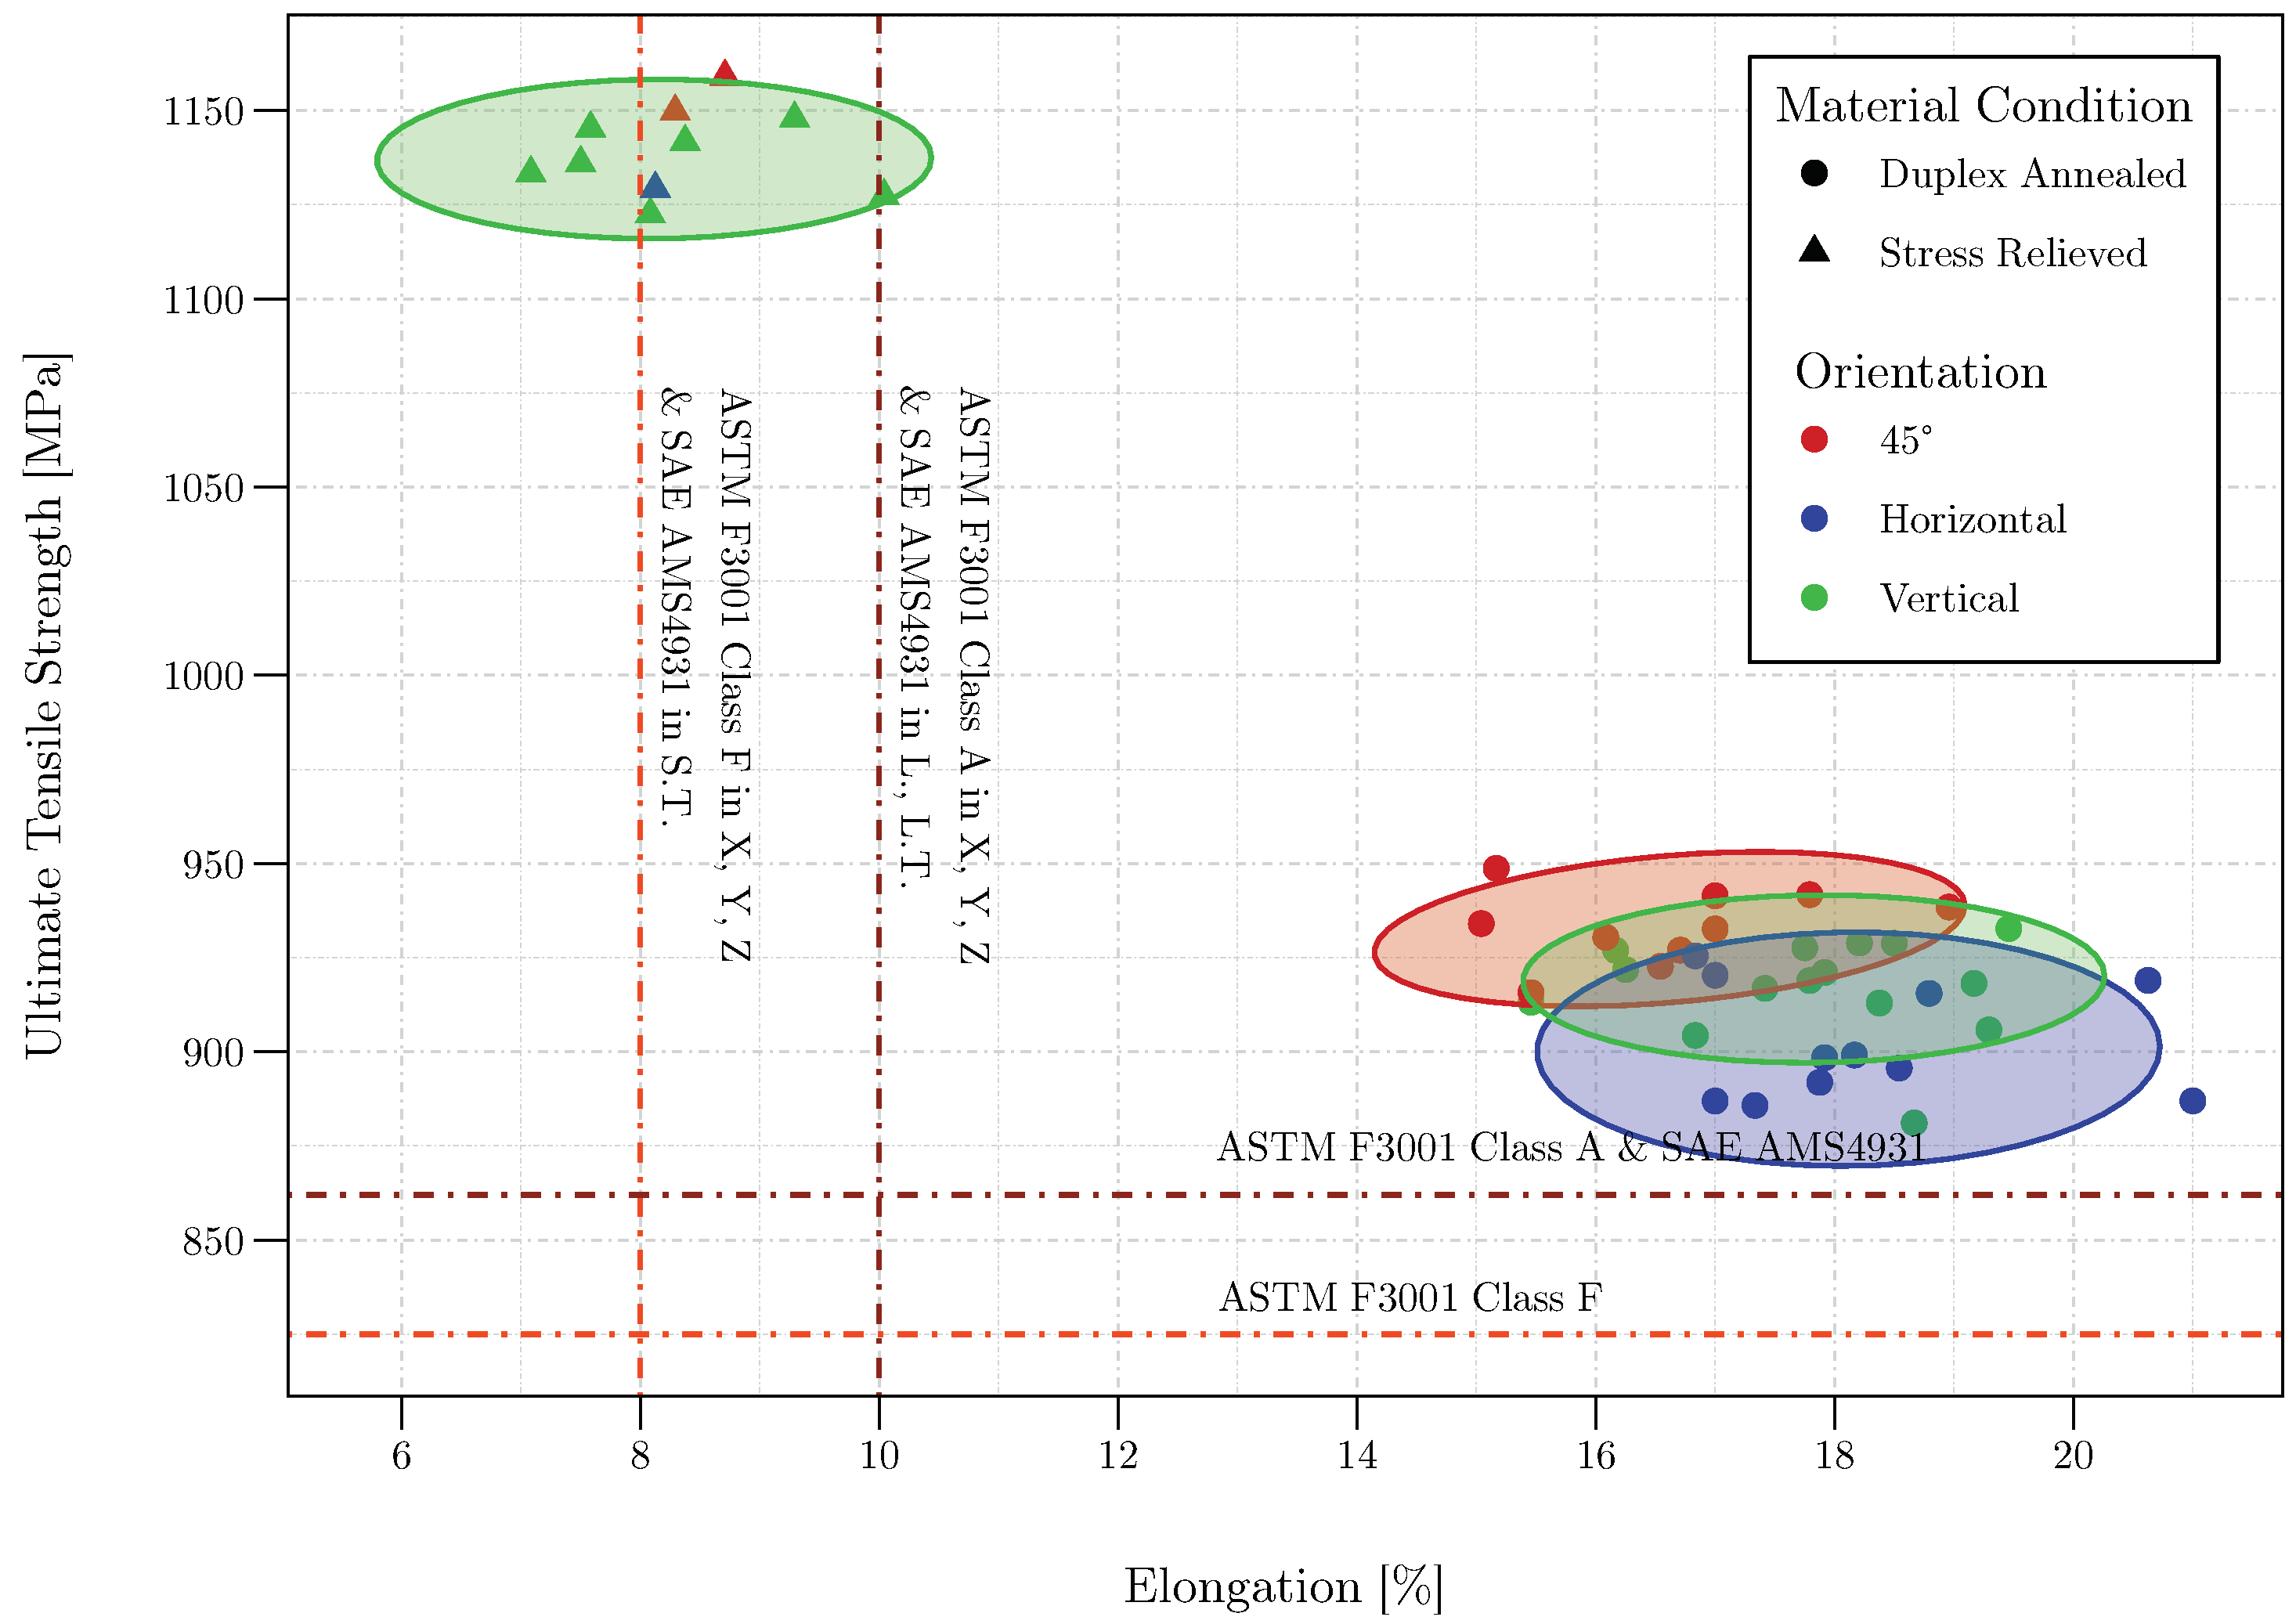
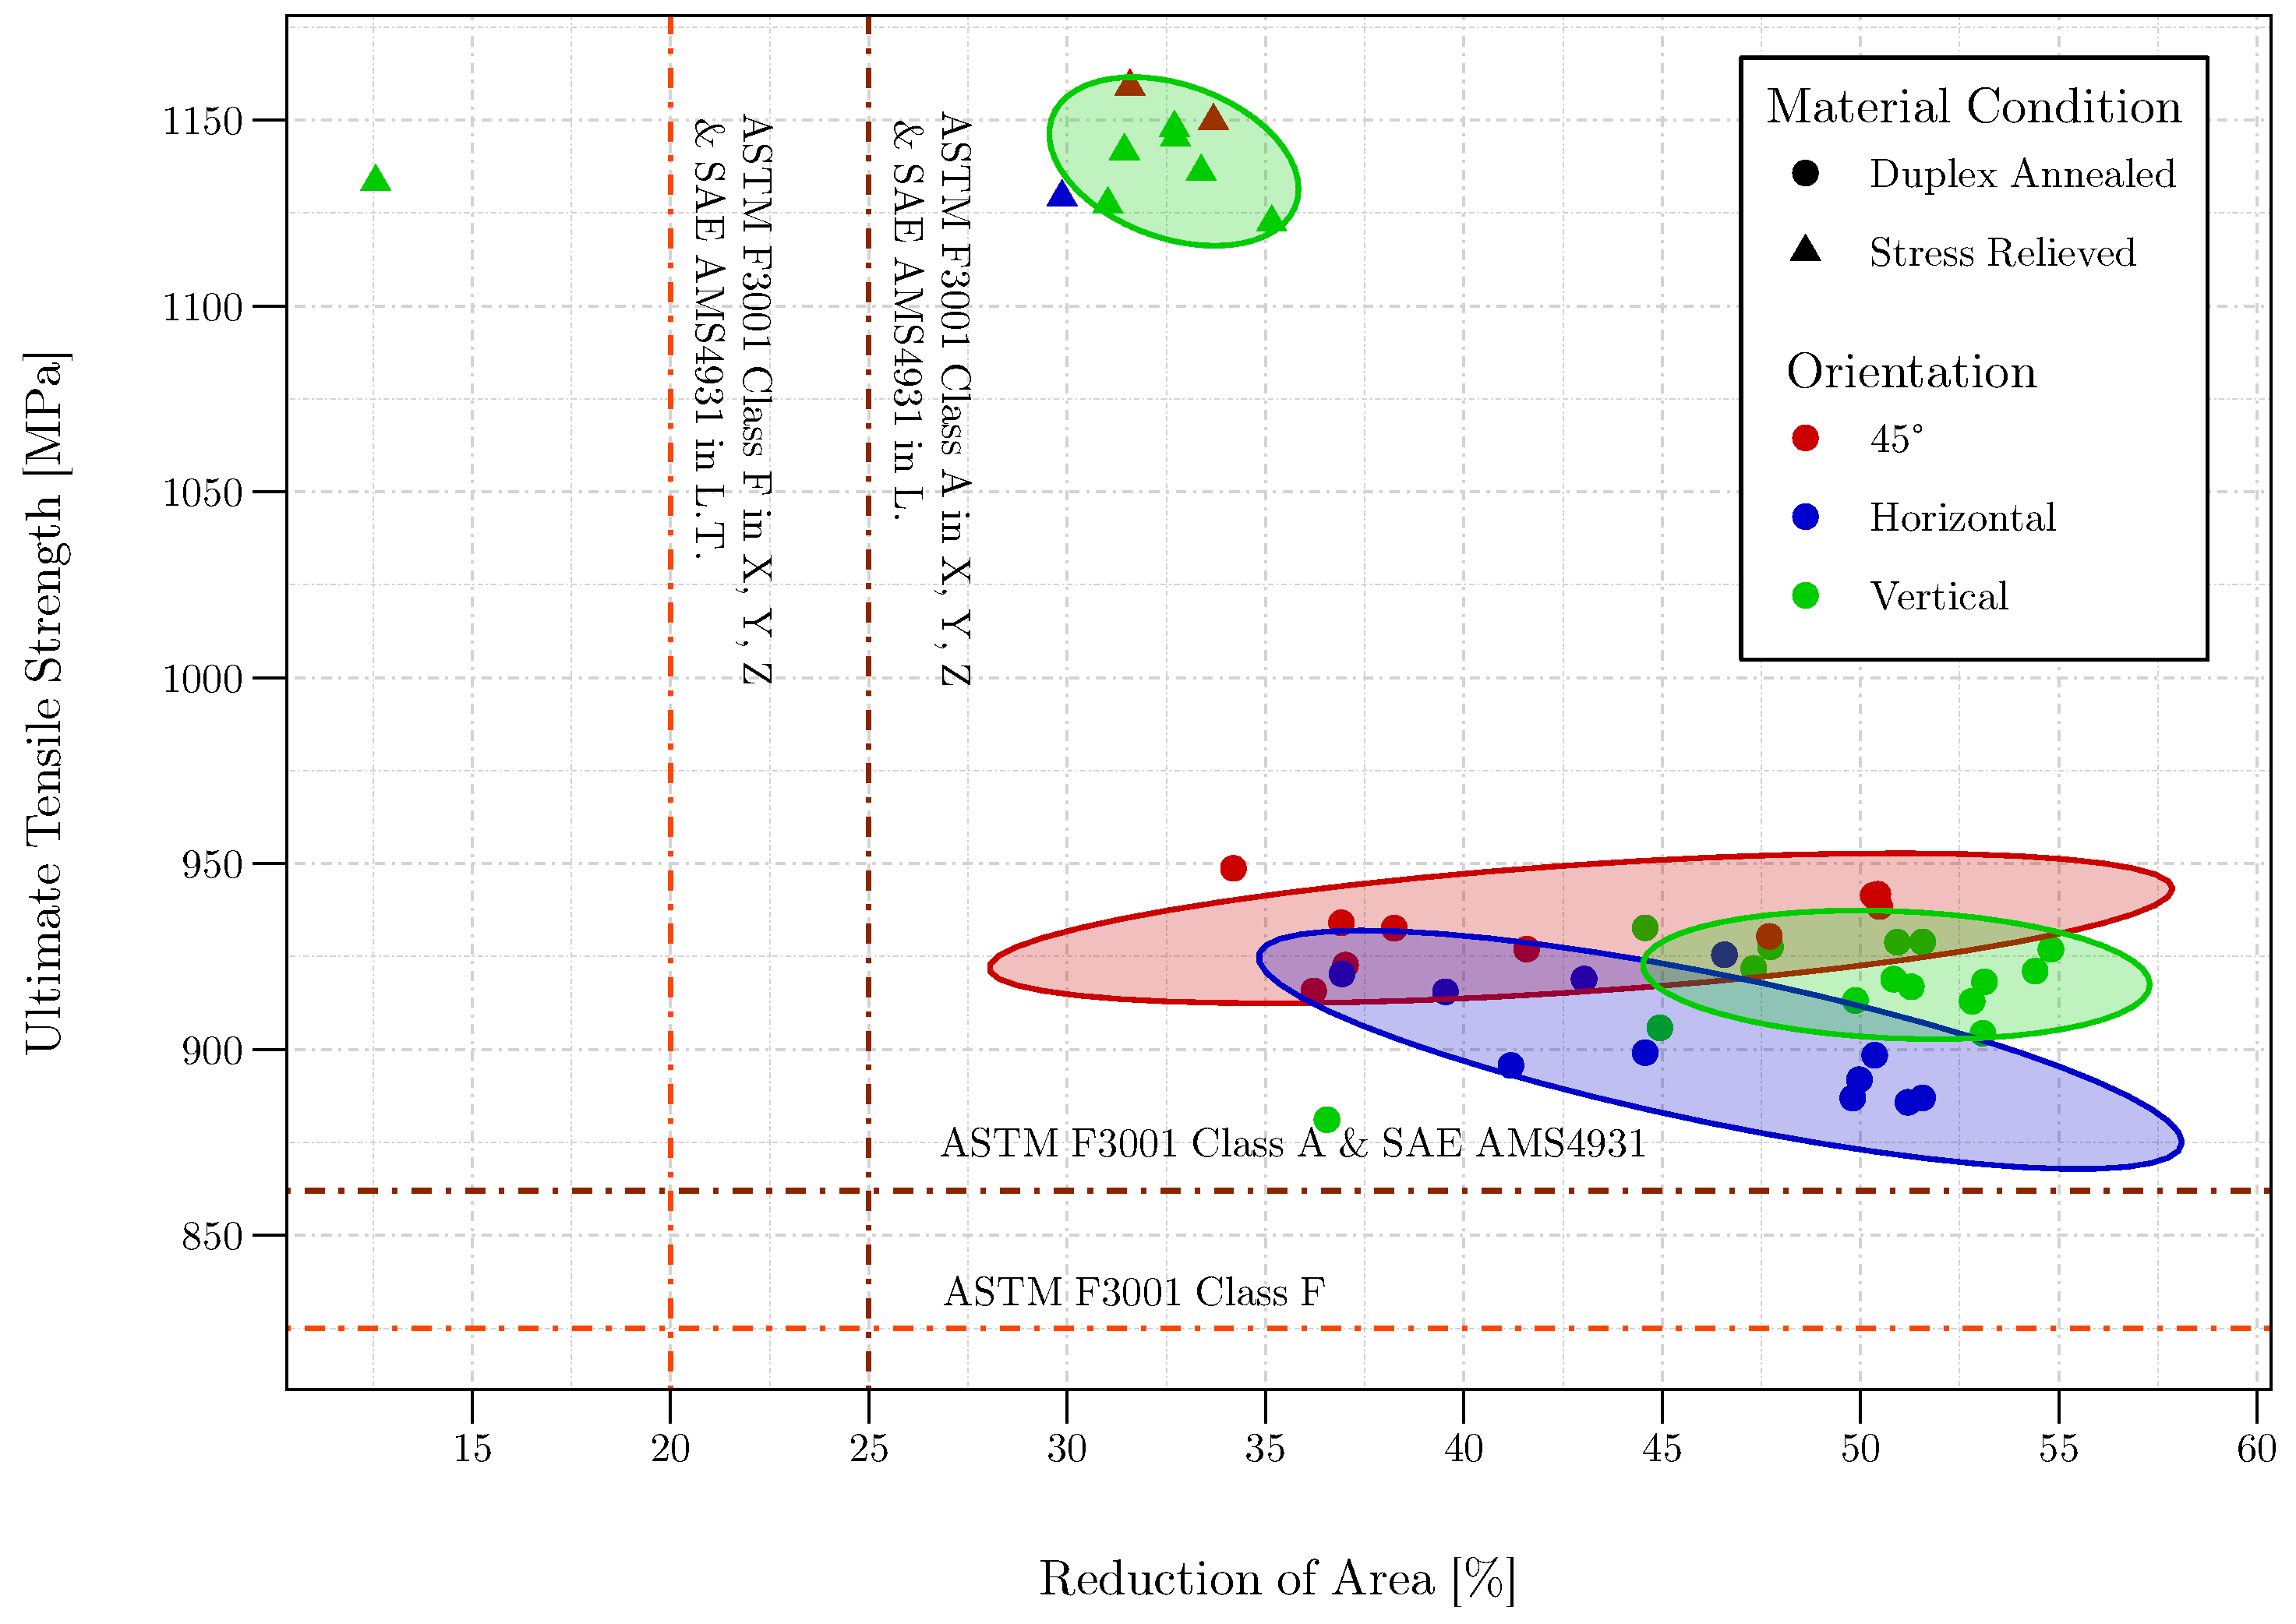
19] showed the drastic improvements HIP has on elongation when comparing two DA cycles, one with HIP and the other without. It is expected that with the addition of a HIP cycle as part of a duplex annealing treatment, the scatter can be further reduced and the ductility further increased. The mechanical properties of the Ti-6Al-4V ELI material in the SR condition conform to the  U T S  and  Y S  requirements of both ASTM F3001 and AMS4931 but do not meet the requirements for elongation or  R A . This highlights that LPBF material in the SR condition alone is insufficient for industrial applications as it is too brittle. The LPBF material in the DA condition conforms to all the requirements of ASTM F3001 for class F material [22]. The material in the DA condition additionally conforms to the requirements of both ASTM F3001 for class A material and SAE AMS4931, except for the  Y S , where some specimens exhibited values below the minimum limits of these specifications [22,47]. It shall be noted that the  Y S  in the DA condition is greater than what is typically seen for both wrought and AM material in the  β  annealed and recrystallisation annealed conditions, and is in line with wrought Ti-6Al-4V ELI in the annealed condition [18,25,58,59]. The DA material in this research exhibits similar strength to that of wrought and DA Ti-6Al-4V ELI, although with significantly improved ductility in terms of both elongation and RA [
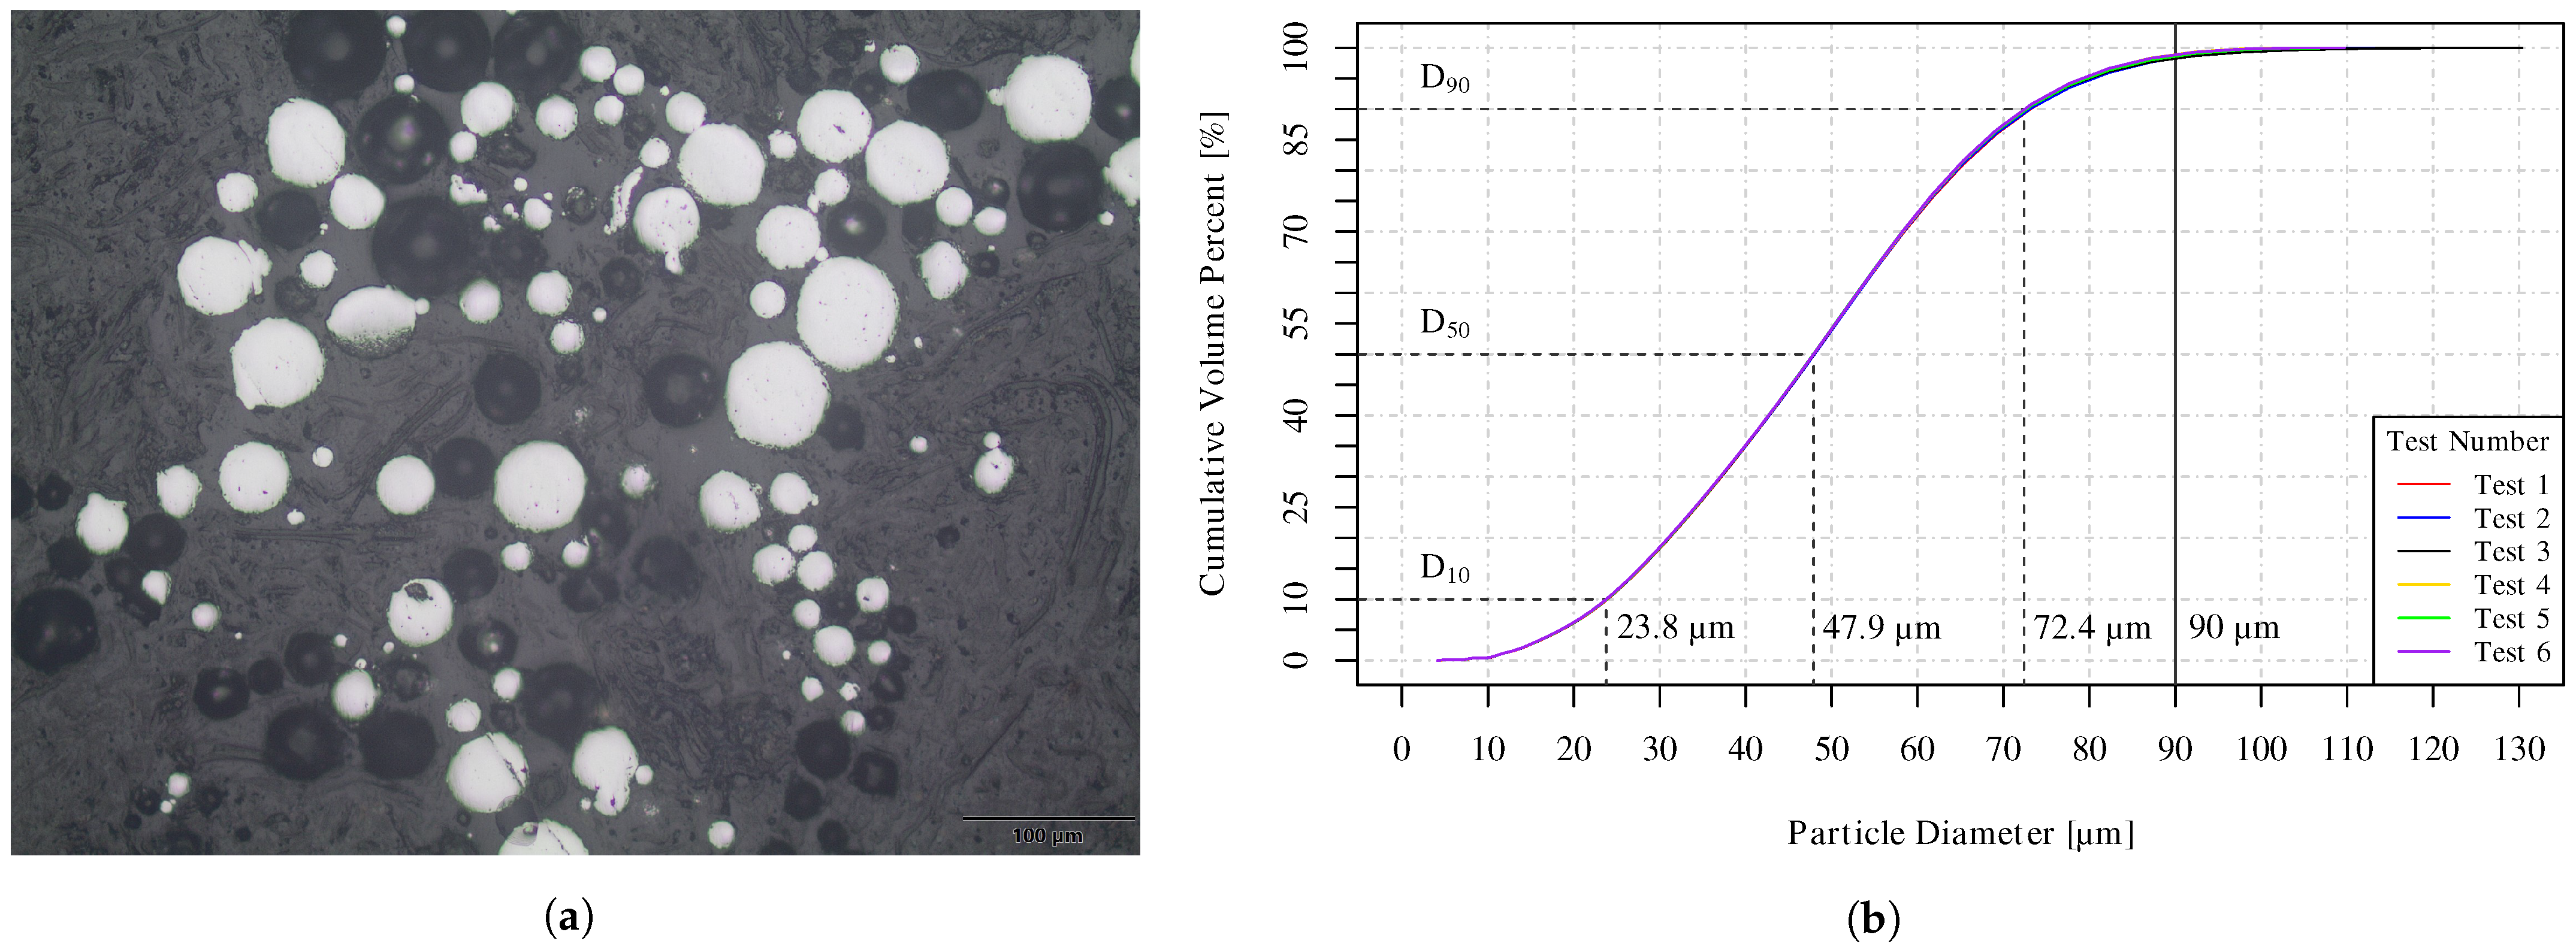
25]. It shall be noted that the oxygen content of the LPBF-produced Ti-6Al-4V ELI material in this research, after 23 powder reuse cycles, contained around 43% less oxygen than the Ti-6Al-4V ELI billet reported by Chesnutt et al. [25] and was around 53% below the material specification maximum limits [22,47]. This low oxygen content of the feedstock material is detrimental to tensile strength, although provides benefits in terms of damage tolerance. It would be beneficial to set lower limits for such interstitial elements in both powder and produced material specifications for AM and for specific applications [
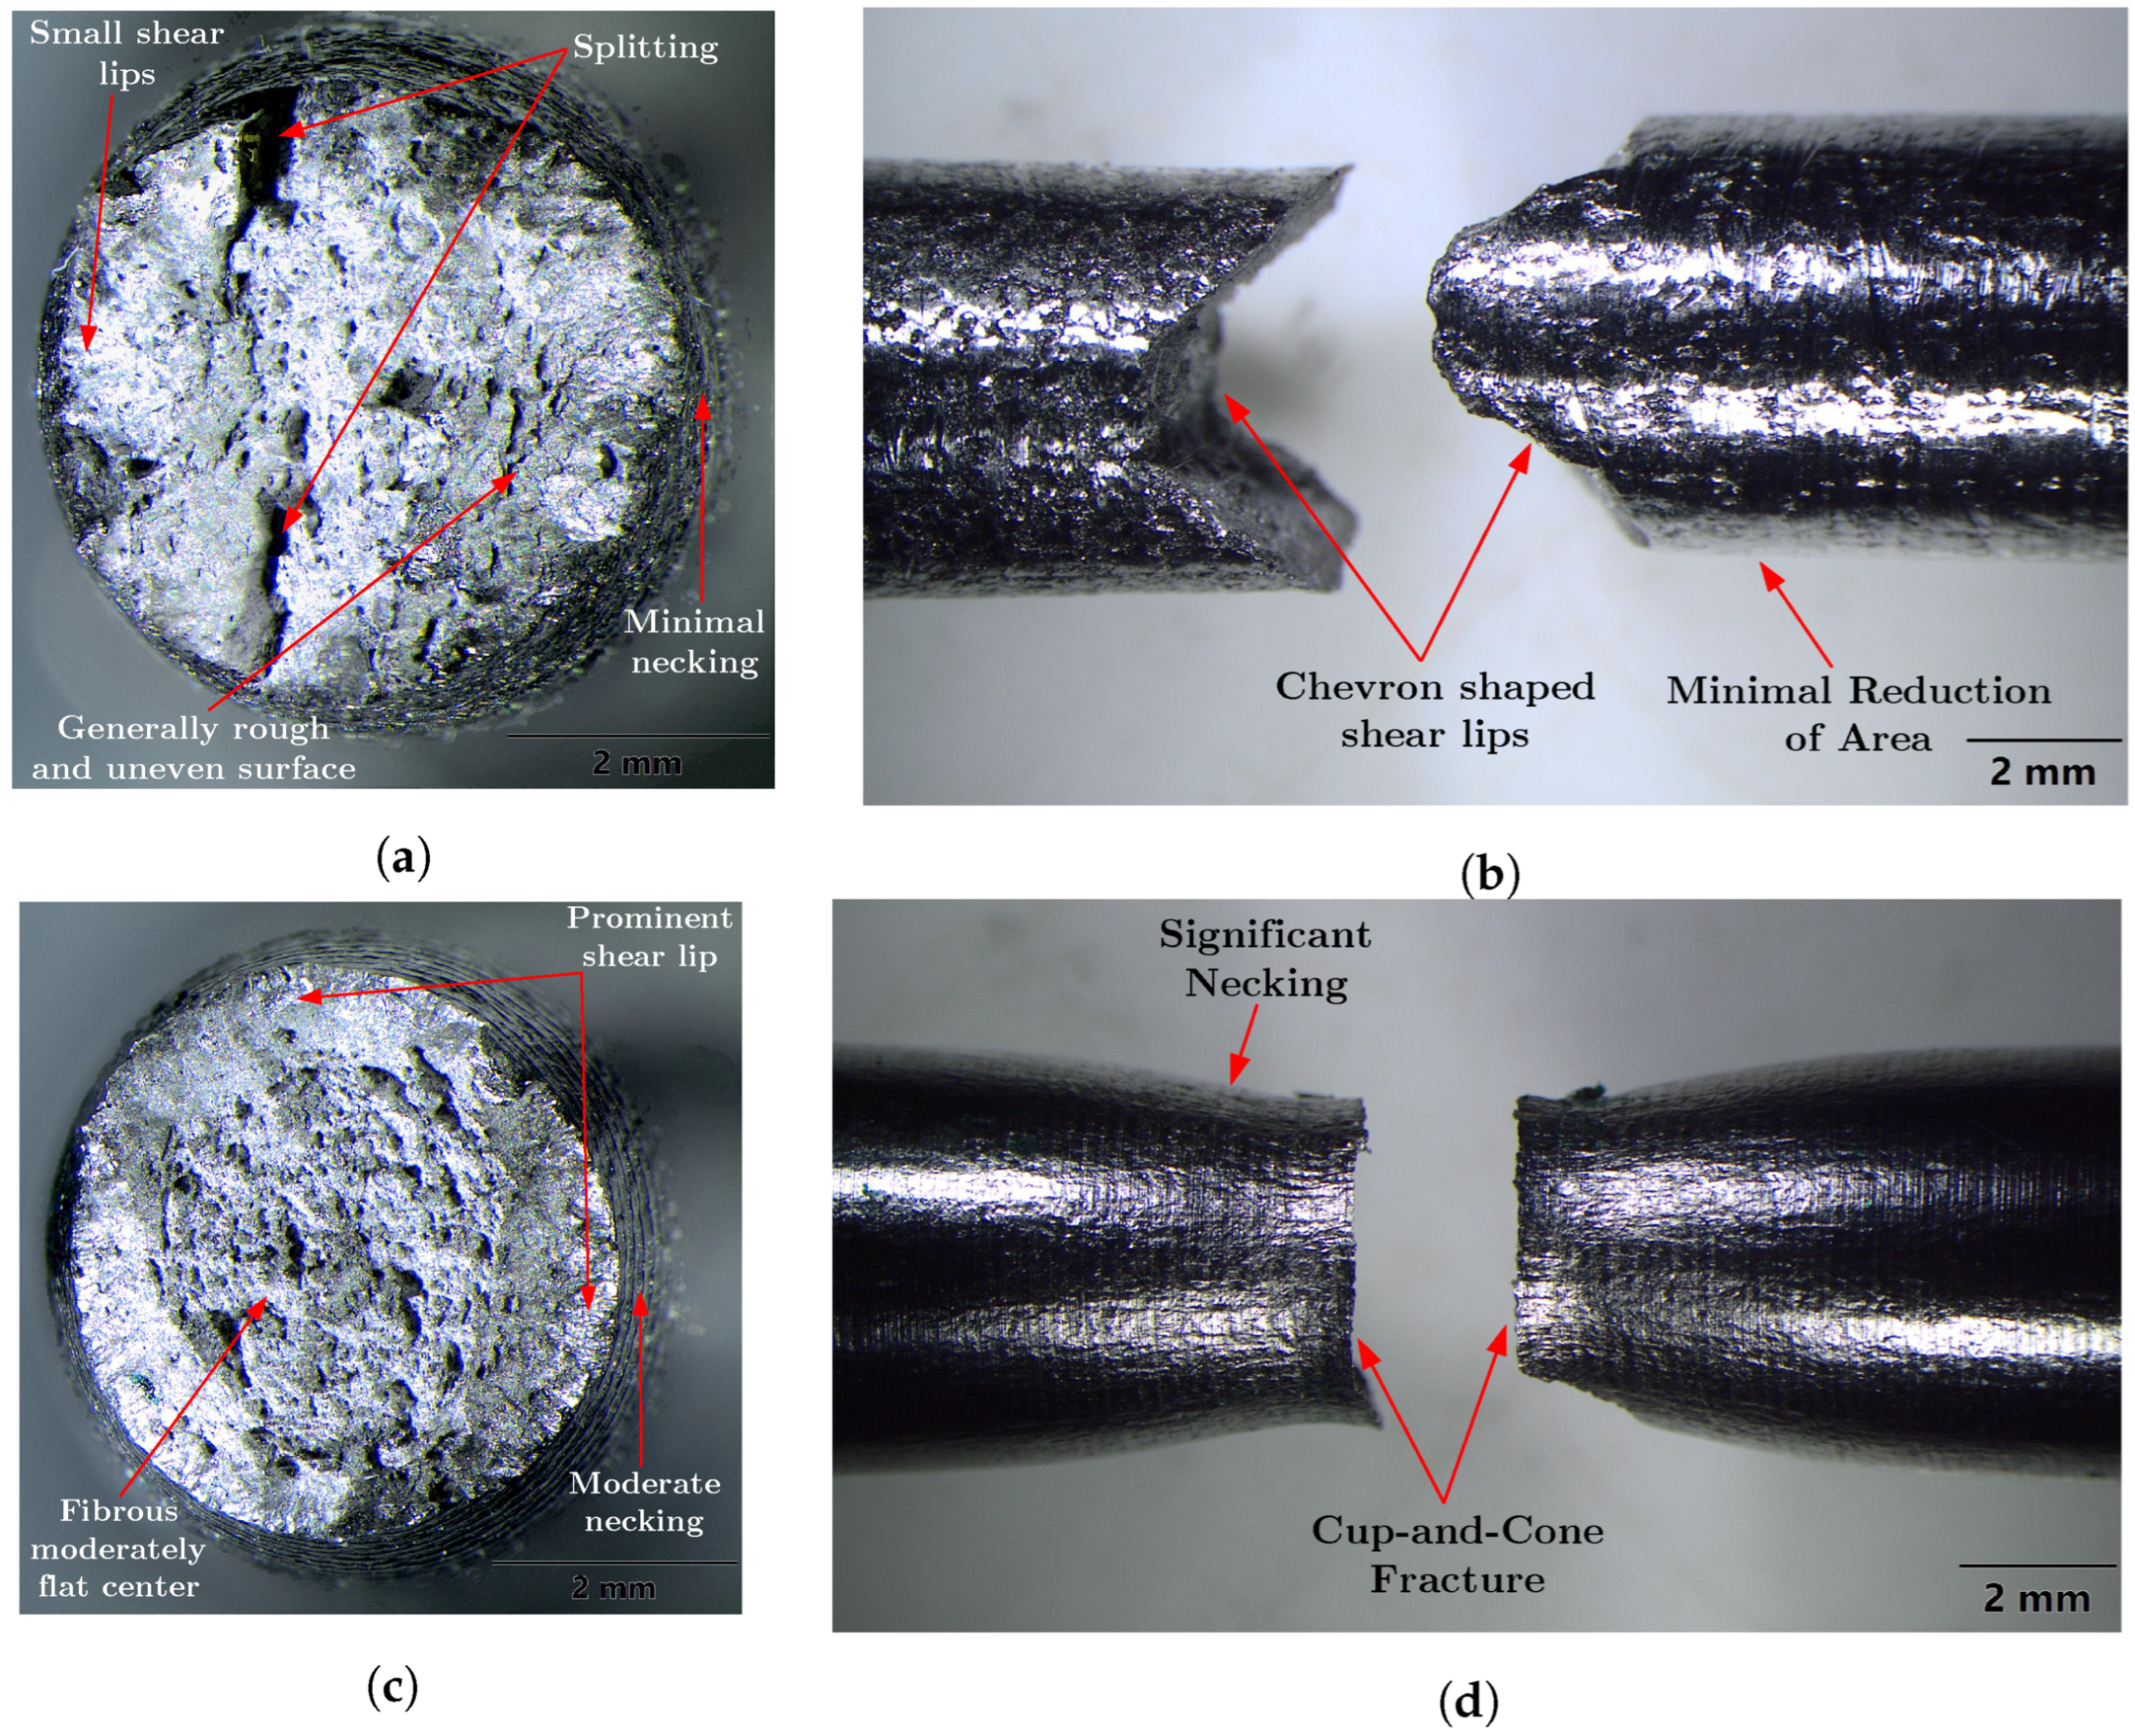
10]. Such minimum limits are especially important when performing heat treatment high in the  α + β  phase field. The tensile fracture surfaces of the material in the DA condition were indicative of ductile material. The tensile fracture surfaces of the SR material presented evidence of reduced ductility and exhibited irregular fracture surfaces. These corroborate the results of the tensile tests for both material conditions.
The literature on LPBF-produced Ti-6Al-4V and other metal AM processes reports high scatter and anisotropy in terms of ductility [60]. DebRoy et al. [60] note that scatter in terms of ductility for metal AM materials tends to be amplified by porosity, residual stresses, and other process-induced defects. Moura et al. [61] note that comparisons with the literature are often challenged by poorly defined specimen dimensions, measurement methods, and particularly the type of elongation measured [62]. Zhang et al. [63] note there is a linear relationship between ductility and fatigue endurance limit, as both these properties are sensitive to porosity. Derimow et al. [12] report no correlation between porosity and  Y S . Therefore, ductility metrics such as elongation and  R A  are seen as good indicators of quality in AM materials [64]. The  E l a f  results achieved due to the DA treatment ranged from 15.1% to 21.0% and the  R A  results ranged from 34.2% to 54.8%. This is comparable to the total elongation at fracture (i.e., due to elastic and plastic deformation) results reported for electron beam powder bed fusion and HIP treated as well as LPBF, HIP, and annealed Ti-6Al-4V [4,19,65,66]. Both the strength and ductility results for the DA material are comparable to that of wrought and annealed Ti-6Al-4V bar stock and the ductility is significantly greater than that of cast Ti-6Al-4V [3,67,68,69]. Such DA heat treatments provide value for applications requiring ductile and tough material. In combination with low interstitial feedstock, DA may provide better all-around mechanical performance than traditional recrystallisation and  β  annealing strategies.
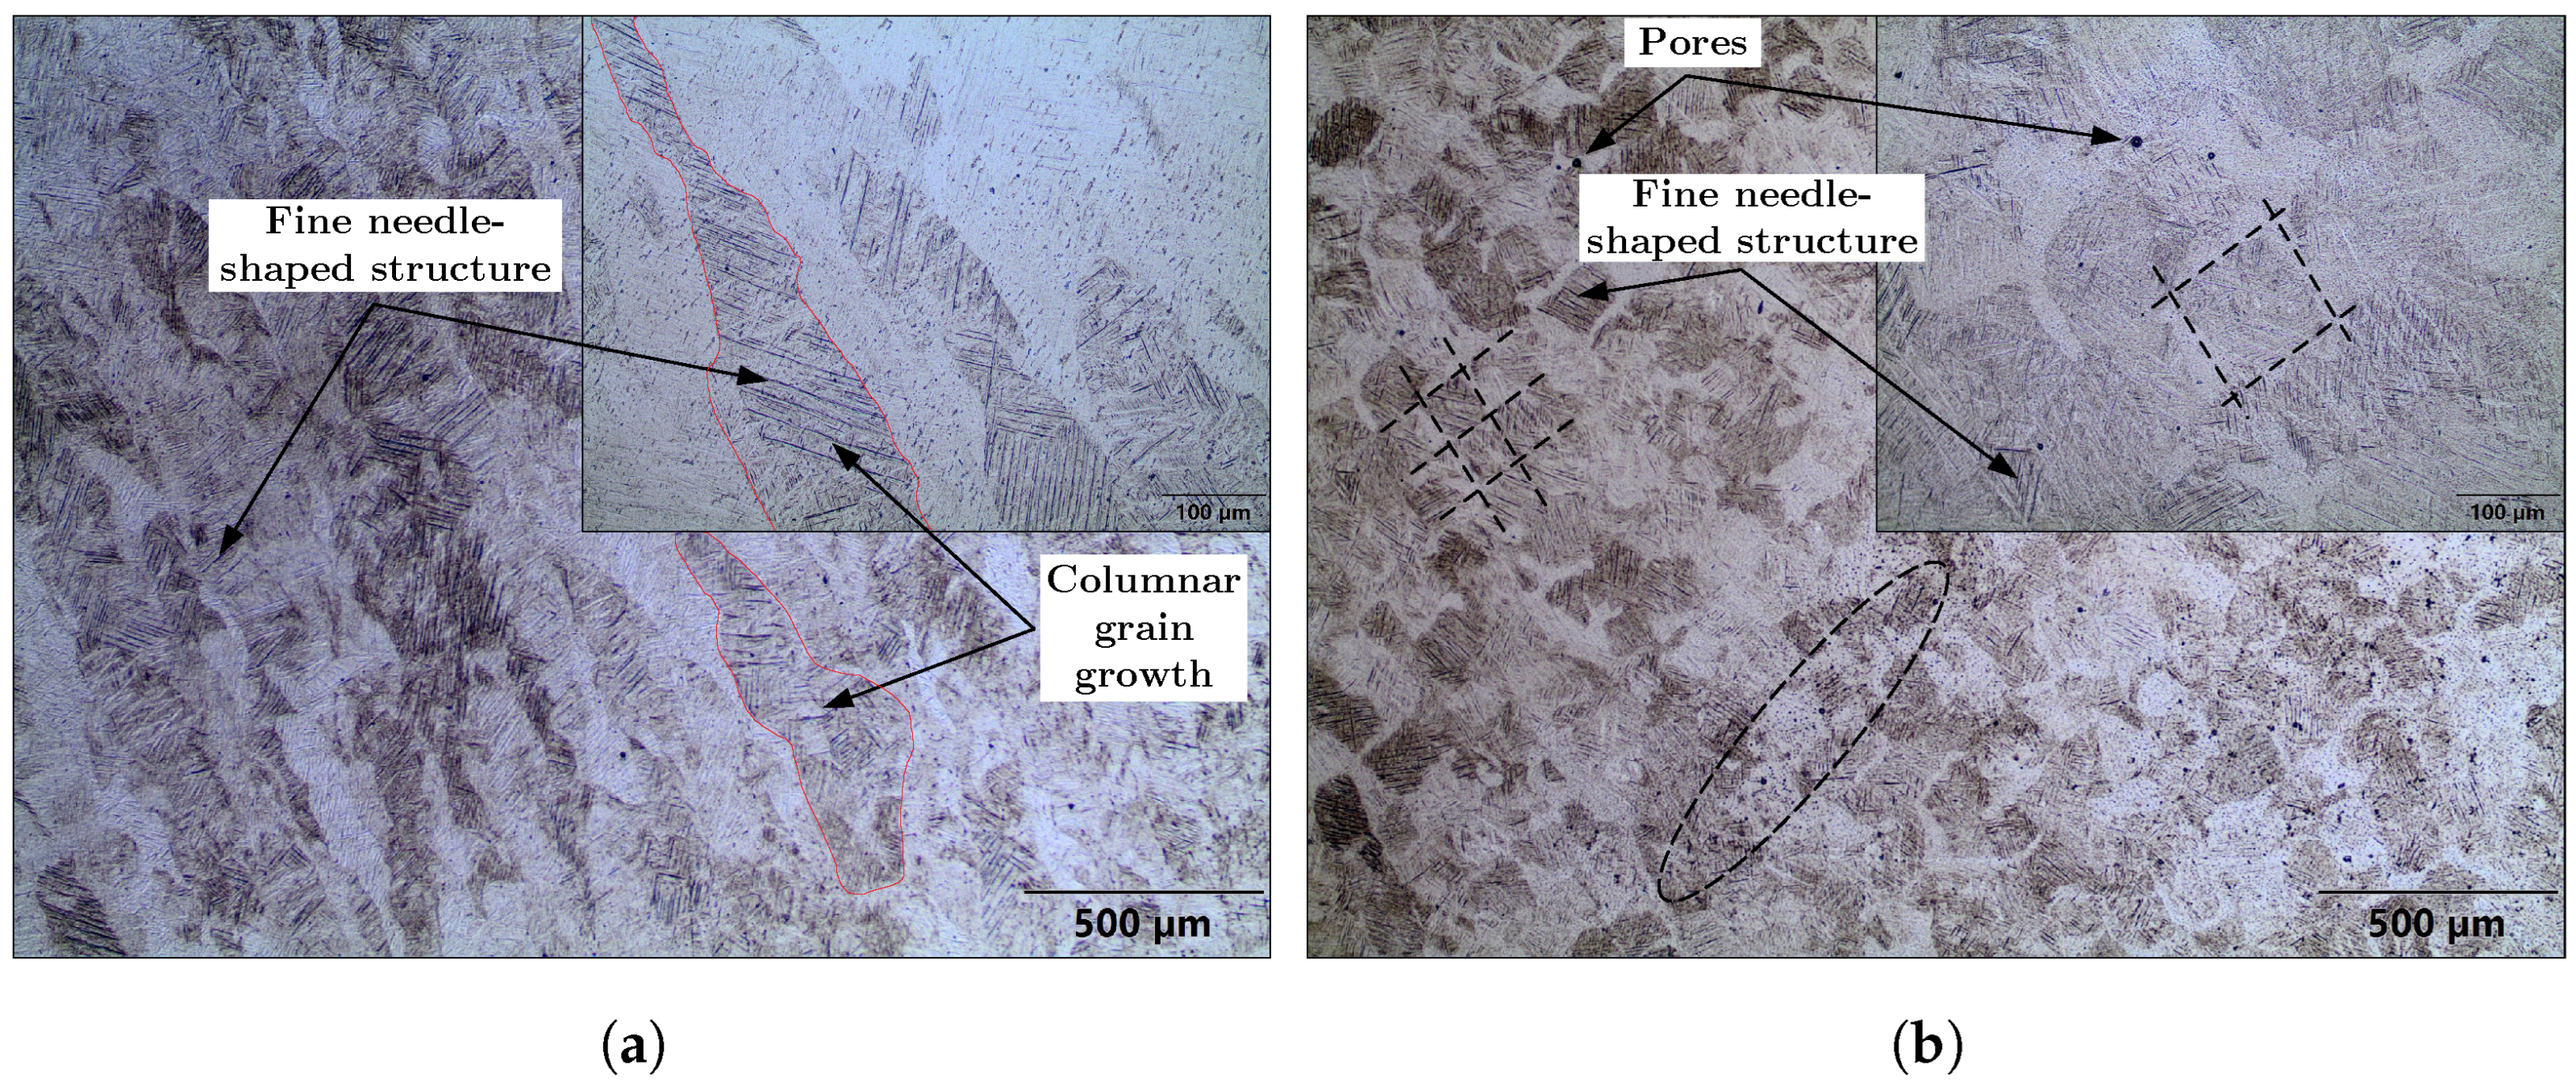
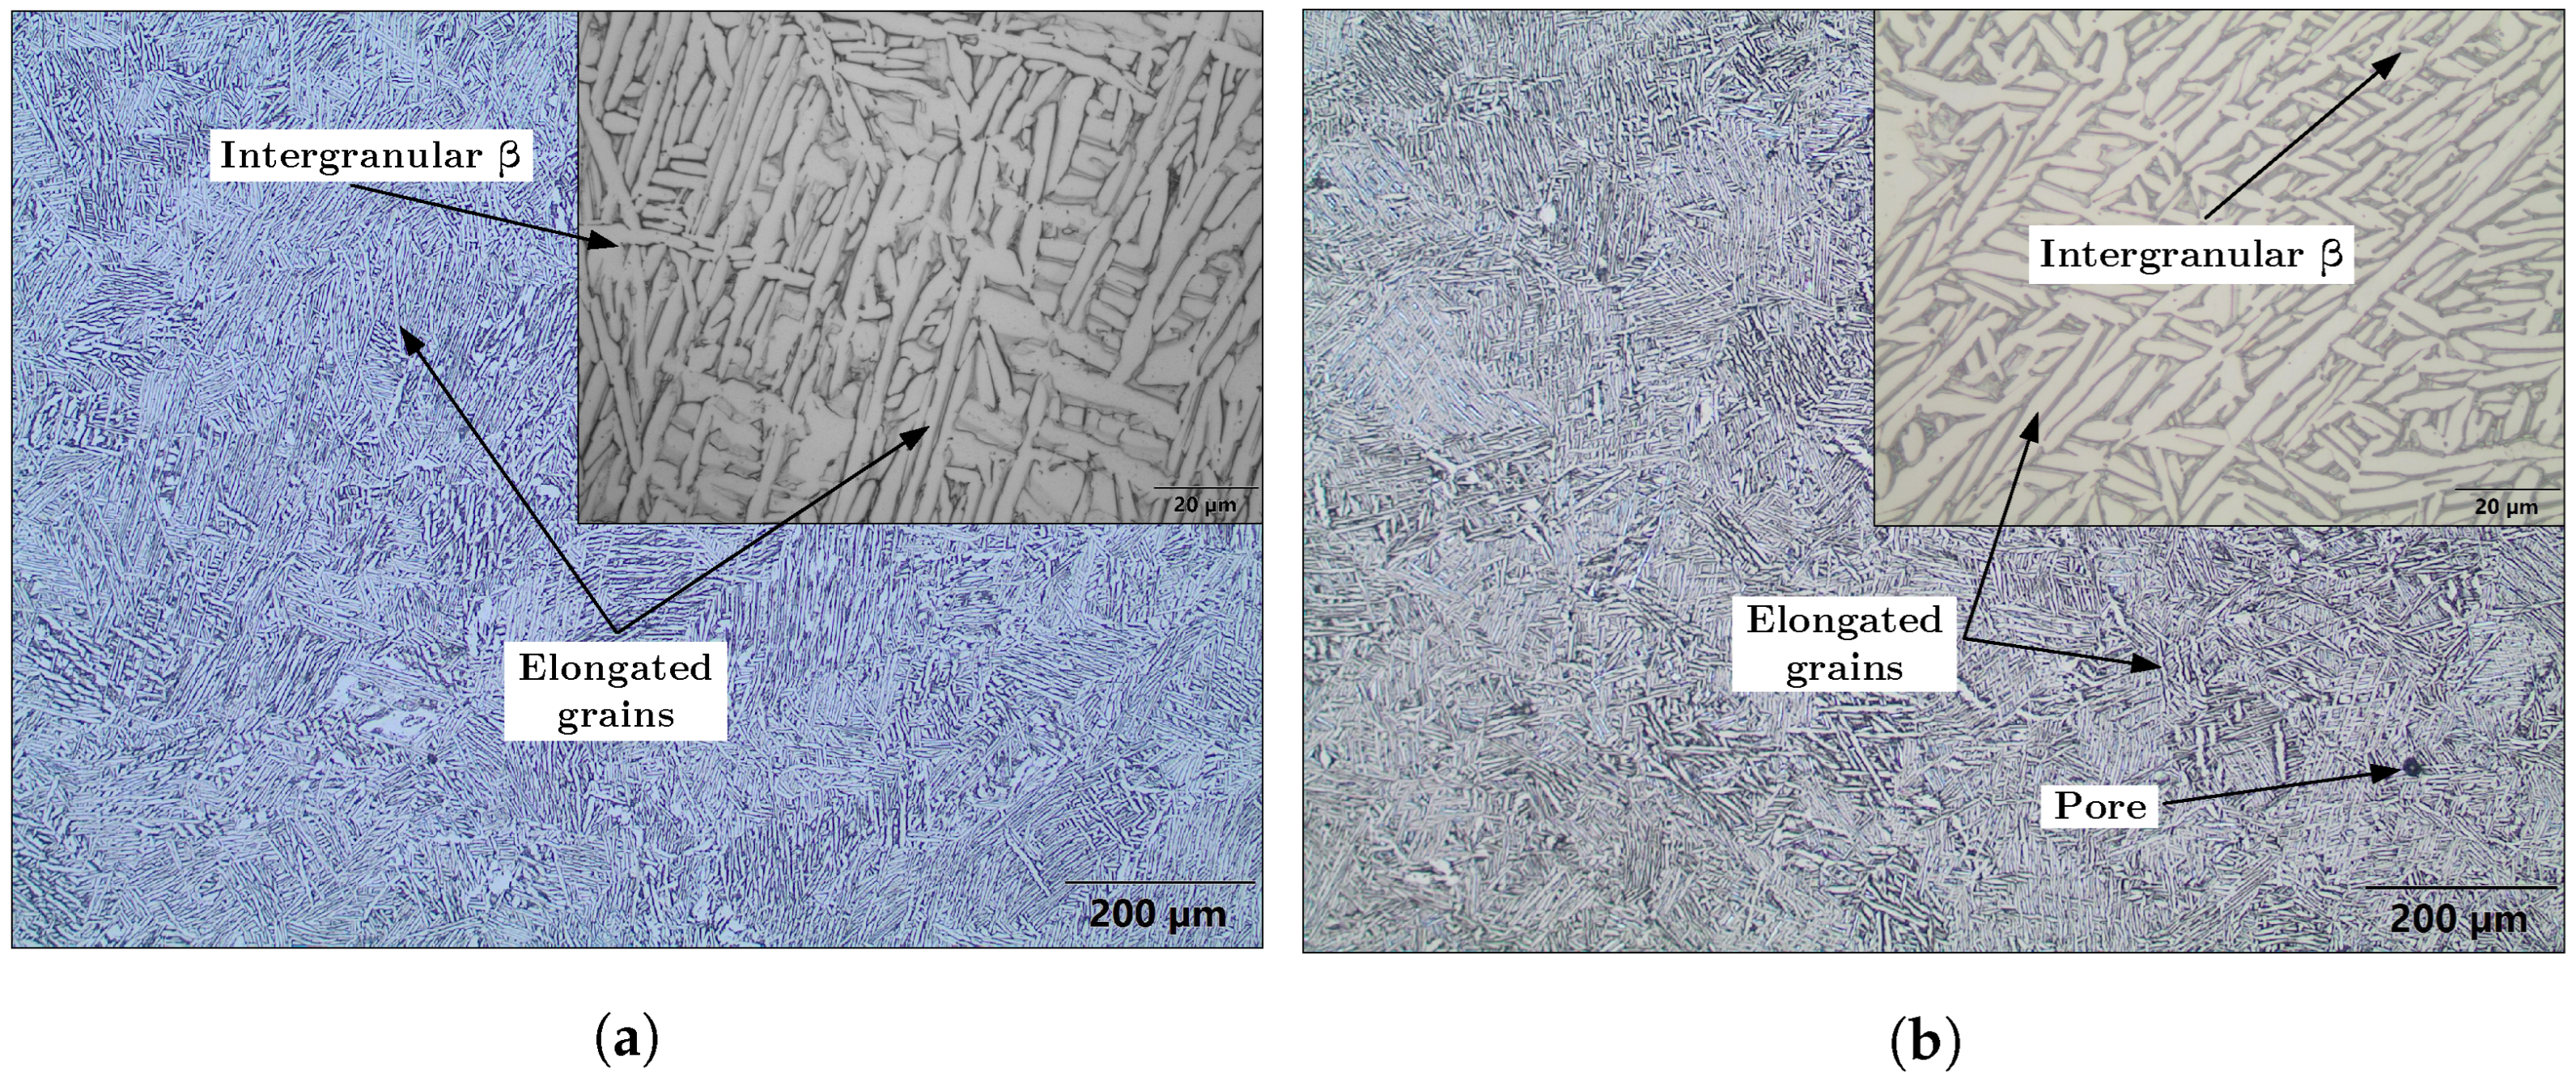
The microstructures of the material in the DA condition show improvements to process-induced microstructural features compared to those in the SR condition and resulted in a more homogeneous macro- and microstructure overall. The presence of anisotropic columnar prior  β  grains is greatly reduced after DA [70]. A lamellar microstructure was achieved by DA with relatively coarse  α  laths and platelets and resulted in an average  α  grain width of 3.35  μ m. These results are similar to those presented in the literature for similar high-temperature sub- β  transus heat treatments. Ter Haar and Becker [20] reported grain widths of 5  μ m and 1  μ m for primary  α  and secondary  α , respectively. Vrancken et al. [16] reported  α  widths of 2.23  μ m after annealing at 940 °C for 2 h and furnace cooling. Such lamellar microstructures result in tortuous paths for crack growth and ductility increases as the lamellar structure becomes more coarse [16]. There was no evidence of continuous  α  at prior  β  grain boundaries in the DA condition [47]. The DA treatment resulted in largely isotropic grain orientations, supported by the  A I  
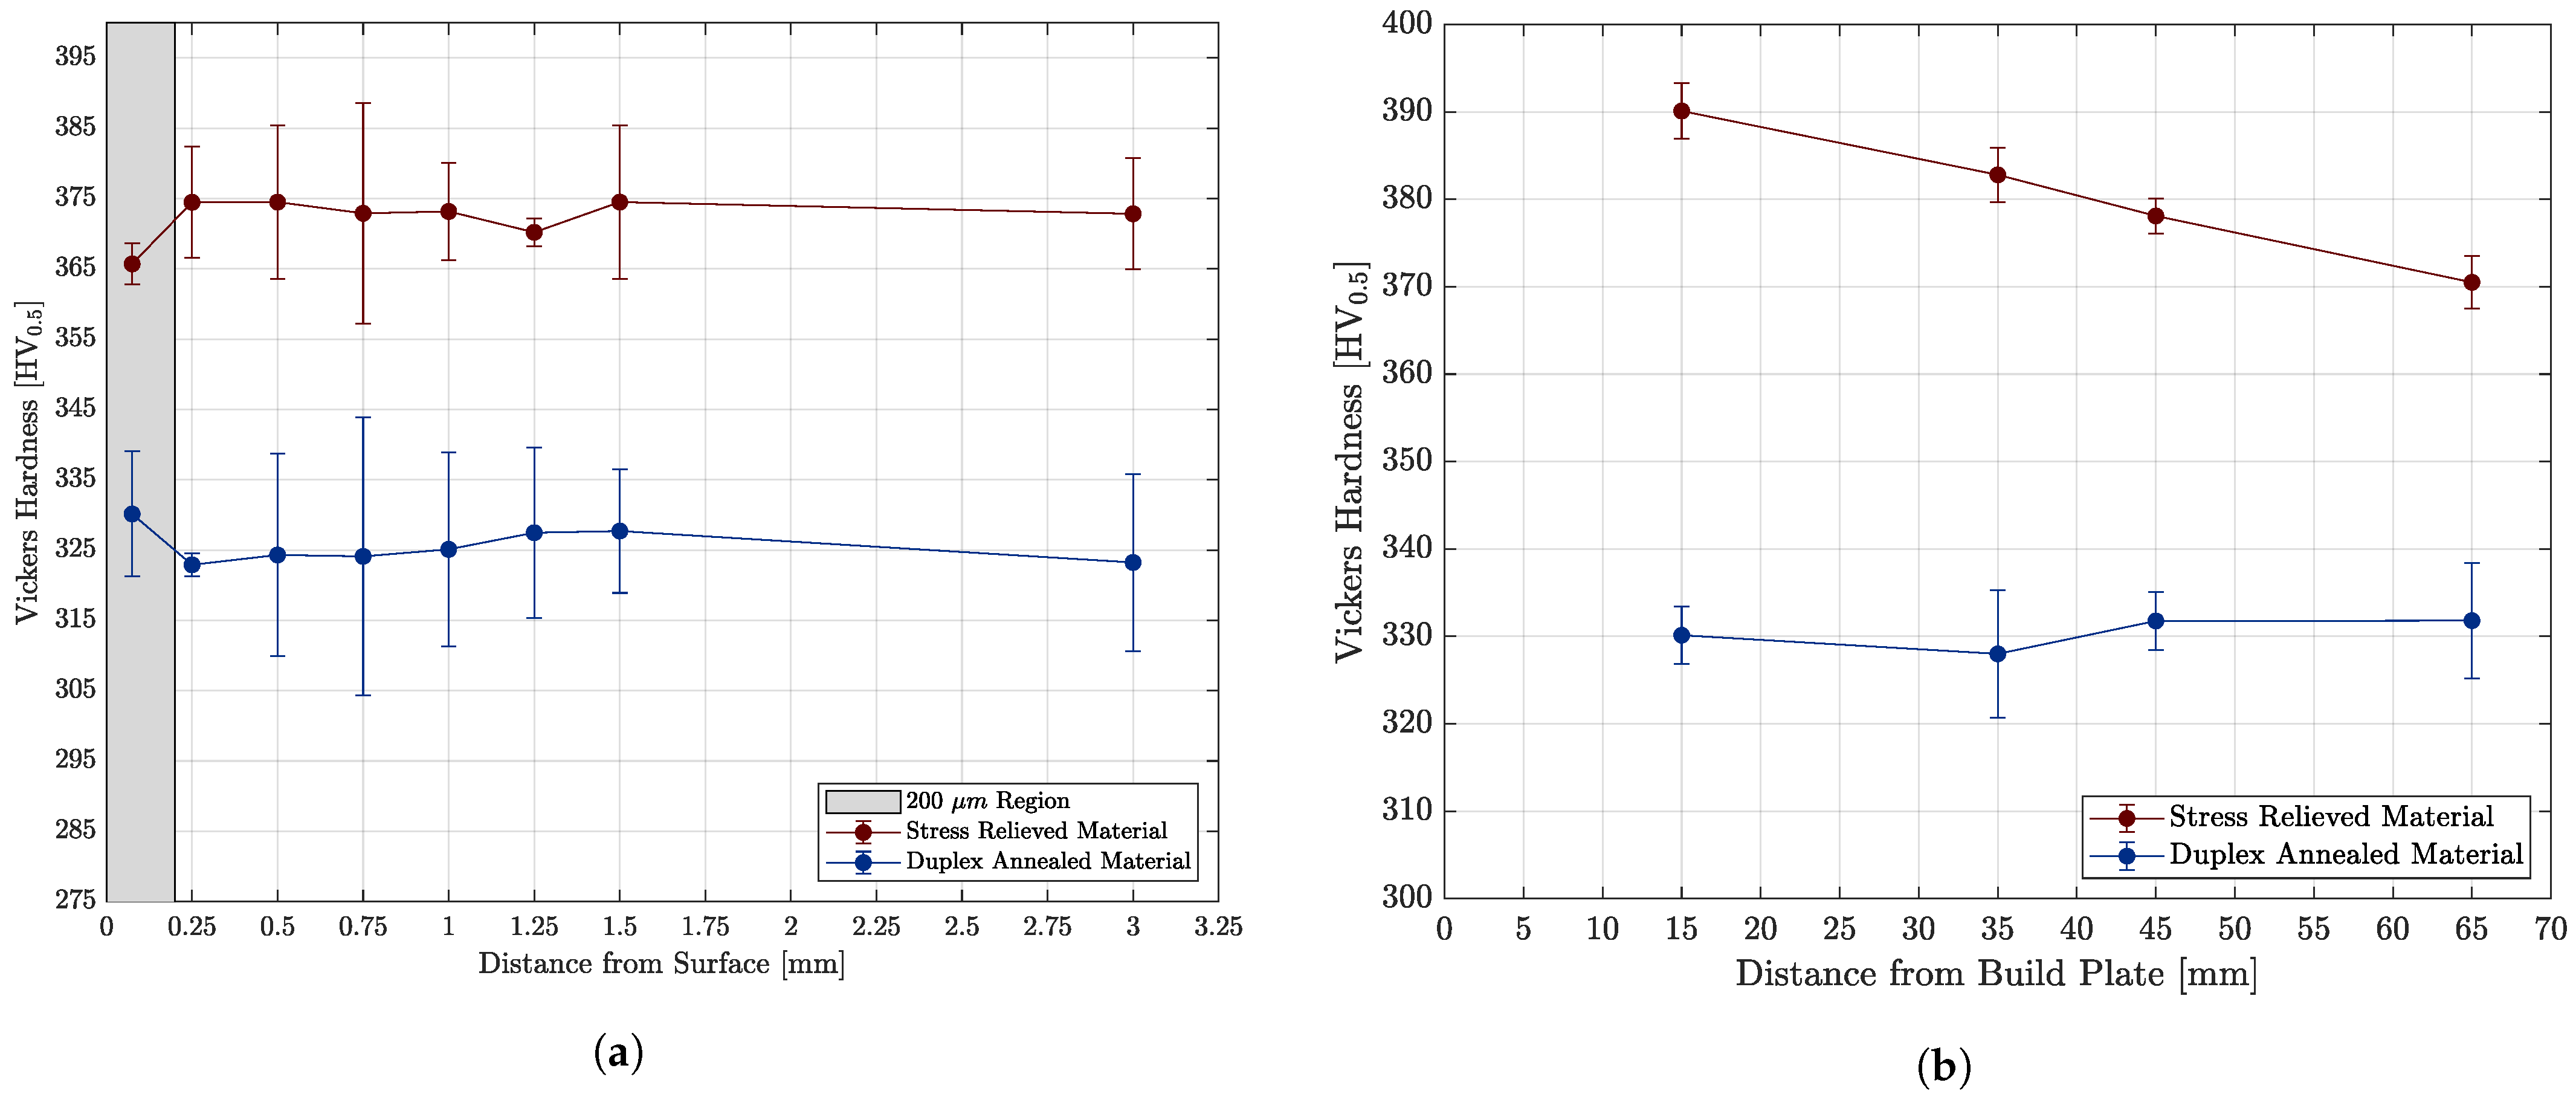
values of around 1. Such microstructures are advantageous for improving isotropy in mechanical properties. The material in the SR condition exhibited high material hardness, comparable to wrought and STA Ti-6Al-4V. Hardness tended to decrease with increasing build height for the SR material. Similar results have been reported in the literature for both Ti-6Al-4V in the mill annealed condition and Inconel 718 in the as-built condition [71,72]. This trend in hardness has been attributed to the higher cooling rates during the beginning of the build [71,72]. The hardness of the DA material was largely uniform throughout and aligns with the more homogenous macro- and microstructure seen in the Z plane. DA reduced material hardness when compared with the SR material, and resulted in hardness in line with wrought and annealed Ti-6Al-4V material [58].
Specimens were printed in three different orientations and with three types of supports. Specimens printed at a 45° angle to the build plate exhibited slightly higher tensile strength, and specimens printed horizontally resulted in the lowest tensile strength. It is often reported in the literature that specimens printed in the vertical orientation exhibit the lowest strength due to the layer-by-layer LPBF manufacturing process, as reviewed by Shanbhag et al. [62]. This was not evident in this investigation, and the vertical specimens provided results comparable to those printed in the other orientations; similar results are reported by EOS, the manufacturer of the LPBF machine, for the same material and print parameters [57]. The vertically orientated specimens did show higher scatter in terms of both strength and ductility. The build orientation and support structures did have a significant effect on ductility for the dry electropolished specimens, although not for the machined specimens. No significant difference was seen in the density results of specimens printed in the three different orientations and at different build heights. The lack of a clear downward trend in strength values in the three orientations indicates that there are factors at play, such as process-induced defects, support structures, and residual stresses, that may have a greater effect on strength than reduced oxygen due to increased build height [12].
Dareh Baghi et al. [73] reported significant improvements in both strength and ductility due to improved surface finish by machining. In this research,  U T S  was affected by the surface finish for both the vertically and horizontally orientated specimens.  Y S  was less affected by surface finish, with only the horizontally orientated specimens showing a significant difference between the  Y S  means for the machined and dry electropolishing specimens. This disparity is attributed to the support structures used to support the gauge sections of the horizontal specimens, which result in a rougher underside compared to the top section. Additionally,  U T S  and ductility are measured in the plastic region and are more affected by the surface condition than  Y S . The scatter in terms of  U T S  and  Y S  was reduced and  R A  values were improved for the machined specimens. This surface inhomogeneity is completely eliminated when machining. The machined material conforms to DIN 65124 for surface roughness, and the dry electropolished material is slightly above the specification limit of  R a ≤ 3.2  μ m [50]. Parameters for the dry electropolishing process should be re-evaluated, or additional polishing processes should be considered to improve these values, especially if the material will experience cyclic loads in service. Increasing the processing times and voltage applied during both the roughing and finishing cycles is expected to improve the surface roughness. Bai et al. [74] report  R a  values ≤ 0.85  μ m and  R z  values ≤ 5  μ m when dry electropolishing 316L stainless steel produced using LPBF for 6 h at 50 V. Future work should investigate processes such as vibratory barrel finishing as a more aggressive material removal process to be applied before dry electropolishing.

5. Conclusions

Laser powder bed fusion-produced Ti-6Al-4V ELI in different heat-treated and surface-prepared conditions was characterised. The powder feedstock used in production was evaluated for conformance against the production lot certificate of analysis and against the literature to verify its quality. The following conclusions are drawn from this research:
  • Duplex annealing results in largely isotropic  α  lath orientations and reduces the process-induced microstructural features. This heat treatment results in a microstructure consisting of primarily elongated and acicular  α  grains in a lamellar structure with intergranular  β . These improvements in the microstructure were highlighted by the improved material hardness in terms of uniformity when compared with the material in the stress-relieved condition.
  • Ductility both in terms of elongation after fracture and reduction in area was greatly improved by duplex annealing. The ductility achieved in this research was greater than that in the comparable literature. Ductility in terms of reduction in area was improved with a reduced surface roughness. The surface finish was found to have a significant effect on the tensile strength properties as well.
  • Tensile strength was reduced by duplex annealing when compared to the material in the stress-relieved condition. Reused powder feedstock was used during this research. The chemistry results showed that the concentration of interstitial elements of such reused powder can be low even after multiple reuses. The low oxygen content of the feedstock powder is a significant contributing factor to the low tensile strength results.
  • Build orientation and support structure strategies have an effect on the mechanical properties, although relatively small in the duplex annealed condition. Such design decisions have a significant effect on the resulting material, particularly in terms of surface finish. Machining reduces the effect of these design decisions on material ductility, and duplex annealing reduces the presence of columnar prior  β  grains in the build direction.
Such post-processing methods are beneficial for improving the material properties of laser powder bed fusion materials in the as-built state. Further research is needed to investigate the effects of such heat and surface treatments on the dynamic mechanical and damage tolerance properties of Ti-6Al-4V produced by laser powder bed fusion.

Author Contributions

Conceptualisation, D.W.G., W.M.M., T.H.B. and A.F.v.d.M.; methodology, D.W.G.; validation, D.W.G.; formal analysis, D.W.G.; investigation, D.W.G. and W.M.M.; data curation & visualisation, D.W.G.; writing—original draft preparation, D.W.G.; writing—review and editing, D.W.G., T.H.B., W.M.M. and A.F.v.d.M.; supervision, T.H.B. and A.F.v.d.M.; project administration, D.W.G.; funding acquisition, T.H.B., A.F.v.d.M. and D.W.G. All authors have read and agreed to the published version of the manuscript.

Funding

The research materials were funded in part by The Collaborative Program in Additive Manufacturing (CPAM) and by the research funds of the Departments of Mechanical and Industrial Engineering at Stellenbosch University. This work is based on the research funded in part by the National Research Foundation (NRF) of South Africa grant number 131356. The APC was funded by the Department of Industrial Engineering at Stellenbosch University.

Institutional Review Board Statement

Not applicable.

Informed Consent Statement

Not applicable.

Data Availability Statement

Process definition and data are available upon request.

Acknowledgments

The authors would like to acknowledge and thank the Centre for Rapid Prototyping and Manufacturing (CRPM) for their assistance with additive manufacturing, D.P. Kouprianoff of the Central University of Technology for his assistance with heat treatment, J.L. Serfontein and Aerosud Aviation for their guidance with process design and assistance with tensile testing, Hanlie Botha of the Department of Process Engineering of Stellenbosch University for conducting laser diffraction tests, and Hertzog Bissett and the technicians at the NECSA Analytical Laboratory in Pelindaba for assistance with organising and performing chemical analyses.

Conflicts of Interest

The authors declare no conflict of interest.

Abbreviations and Symbols

The following abbreviations and symbols are used in this manuscript:
AMAdditive Manufacturing
LPBFLaser Powder Bed Fusion
Ti-6Al-4V ELITitanium-6 Aluminum 4 Vanadium (Extra Low Interstitial) alloy
U T S Ultimate Tensile Strength
Y S Yield Strength
α Alpha, hexagonal close-packed phase
β Beta, body-centred cubic phase
SRStress Relief
STASolution Treat and Age
DADuplex Anneal
HIPHot Isostatic Pressing
STOASolution Treat and Overage
PSDParticle Size Distribution
F R H Hall Flow Rate
A o R Angle of Repose
A D H Apparent Density
E l a f Elongation after Fracture
R A Reduction of Area
R a Roughness average
R z Average maximum roughness profile height
R t Maximum roughness profile height
nSample size
L.Longitudinal
L.T.Long Traverse
S.T.Short Traverse
A R a v e Average aspect ratio
A I Anisotropy index

References

  1. Wohlers Associates. Wohlers Report 2022; Technical Report; ASTM International: West Conshohocken, PA, USA, 2022. [Google Scholar]
  2. Froes, F.; Boyer, R. (Eds.) Additive Manufacturing for the Aerospace Industry; Elsevier: Amsterdam, The Netherlands, 2019; p. 482. [Google Scholar]
  3. Liu, S.; Shin, Y.C. Additive manufacturing of Ti6Al4V alloy: A review. Mater. Des. 2019, 164, 107552. [Google Scholar] [CrossRef]
  4. Lewandowski, J.J.; Seifi, M. Metal Additive Manufacturing: A Review of Mechanical Properties. Annu. Rev. Mater. Res. 2016, 46, 151–186. [Google Scholar] [CrossRef] [Green Version]
  5. ASTM International. Standard Specification for Titanium and Titanium Alloy Strip, Sheet, and Plate (ASTM B265); ASTM International: West Conshohocken, PA, USA, 2020. [Google Scholar] [CrossRef]
  6. Leyens, C.; Peters, M. (Eds.) Titanium and Titanium Alloys; Wiley: Hoboken, NJ, USA, 2003; p. 513. [Google Scholar]
  7. Boyer, R.R. Titanium and Its Alloys: Metallurgy, Heat Treatment and Alloy Characteristics. In Encyclopedia of Aerospace Engineering; Blockley, R., Shyy, R., Eds.; Wiley: Hoboken, NJ, USA, 2010. [Google Scholar] [CrossRef]
  8. Donachie, M.J. Titanium—A Techincal Guide, 2nd ed.; ASM International: West Conshohocken, PA, USA, 2000; p. 381. [Google Scholar]
  9. Lütjering, G.; Williams, J.C. Titanium, 2nd ed.; Springer: Berlin/Heidelberg, Germany, 2007; p. 449. [Google Scholar]
  10. Boyer, R.; Welsch, G.; Collings, E.W. Materials Properties Handbook: Titanium Alloys; ASM International: Materials Park, OH, USA, 1994; p. 1169. [Google Scholar]
  11. Dietrich, K.; Diller, J.; Go, S.D.L.; Bauer, D.; Forêt, P. The influence of oxygen on the chemical composition and mechanical properties of Ti-6Al-4V during laser powder bed fusion (L-PBF). Addit. Manuf. 2020, 32, 100980. [Google Scholar] [CrossRef]
  12. Derimow, N.; Romero, A.; Rubio, A.; Terrazas, C.; Moser, N.; Kafka, O.L.; Benzing, J.T.; Medina, F.; Wicker, R.; Hrabe, N. Assessment of intra-build variations in tensile strength in electron beam powder-bed fusion Ti–6AL–4V part 1: Effects of build height. Mater. Sci. Eng. A 2022, 849, 143354. [Google Scholar] [CrossRef]
  13. Dossett, J.L. Practical Heat Treating—Basic Principles; ASM International: Materials Park, OH, USA, 2020; p. 416. [Google Scholar]
  14. Baker, A.H.; Collins, P.C.; Williams, J.C. New Nomenclatures for Heat Treatments of Additively Manufactured Titanium Alloys. JOM 2017, 69, 1221–1227. [Google Scholar] [CrossRef] [Green Version]
  15. Lütjering, G. Influence of processing on microstructure and mechanical properties of (α + β) titanium alloys. Mater. Sci. Eng. A 1998, 243, 32–45. [Google Scholar] [CrossRef]
  16. Vrancken, B.; Thijs, L.; Kruth, J.P.; Van Humbeeck, J. Heat treatment of Ti6Al4V produced by Selective Laser Melting: Microstructure and mechanical properties. J. Alloys Compd. 2012, 541, 177–185. [Google Scholar] [CrossRef] [Green Version]
  17. Sheehan, K.C.; Starr, K.K.; Seth, B.B. Solution Heat Treatment and Overage Heat Treatment for Titanium Components. U.S. Patent 9103011B2, 11 August 2015. [Google Scholar]
  18. Tarik Hasib, M.; Ostergaard, H.E.; Li, X.; Kruzic, J.J. Fatigue crack growth behavior of laser powder bed fusion additive manufactured Ti-6Al-4V: Roles of post heat treatment and build orientation. Int. J. Fatigue 2021, 142, 105955. [Google Scholar] [CrossRef]
  19. Kasperovich, G.; Hausmann, J. Improvement of fatigue resistance and ductility of TiAl6V4 processed by selective laser melting. J. Mater. Process. Technol. 2015, 220, 202–214. [Google Scholar] [CrossRef]
  20. Ter Haar, G.M.; Becker, T.H. Selective laser melting produced Ti-6Al-4V: Post-process heat treatments to achieve superior tensile properties. Materials 2018, 11, 146. [Google Scholar] [CrossRef] [Green Version]
  21. Kumar, P.; Ramamurty, U. Microstructural optimization through heat treatment for enhancing the fracture toughness and fatigue crack growth resistance of selective laser melted Ti-6Al-4V alloy. Acta Mater. 2019, 169, 45–59. [Google Scholar] [CrossRef]
  22. ASTM International. Standard Specification for Additive Manufacturing Titanium-6 Aluminum-4 Vanadium ELI (Extra Low Interstitial) with Powder Bed Fusion (F3001); ASTM International: West Conshohocken, PA, USA, 2014. [Google Scholar] [CrossRef]
  23. Becker, T.H.; Beck, M.; Scheffer, C. Microstructure and mechanical properties of direct metal laser sintered Ti-6Al-4V. S. Afr. J. Ind. Eng. 2015, 26, 1–10. [Google Scholar] [CrossRef] [Green Version]
  24. Wu, M.W.; Ni, K.; Yen, H.W.; Chen, J.K.; Wang, P.; Tseng, Y.J.; Tsai, M.K.; Wang, S.H.; Lai, P.H.; Ku, M.H. Revealing the intensified preferred orientation and factors dominating the anisotropic mechanical properties of laser powder bed fusion Ti-6Al-4V alloy after heat treatment. J. Alloys Compd. 2023, 949, 169494. [Google Scholar] [CrossRef]
  25. Chesnutt, J.C.; Thompson, A.W.; Williams, J.C. Influence of Metallurgical Factors on the Fatigue Crack Growth Rate in Alpha-Beta Titanium Alloys (AFML-TR-78-68); Technical Report; Rockwell International: Thousand Oaks, CA, USA, 1977. [Google Scholar]
  26. ASTM International. Standard Test Methods for Tension Testing of Metallic Materials (ASTM E8/E8M); ASTM International: West Conshohocken, PA, USA, 2022. [Google Scholar] [CrossRef]
  27. Promoppatum, P.; Onler, R.; Yao, S.C. Numerical and experimental investigations of micro and macro characteristics of direct metal laser sintered Ti-6Al-4V products. J. Mater. Process. Technol. 2017, 240, 262–273. [Google Scholar] [CrossRef]
  28. Gordon, J.V.; Narra, S.P.; Cunningham, R.W.; Liu, H.; Chen, H.; Suter, R.M.; Beuth, J.L.; Rollett, A.D. Defect structure process maps for laser powder bed fusion additive manufacturing. Addit. Manuf. 2020, 36, 101552. [Google Scholar] [CrossRef]
  29. SAE International. Heat Treatment of Titanium and Titanium Alloys (SAE AMS-H-81200D); SAE International: Warrendale, PA, USA, 2014. [Google Scholar]
  30. ASTM International. Standard Test Methods for Flow Rate of Metal Powders Using the Hall Flowmeter Funnel (ASTM B213); ASTM International: West Conshohocken, PA, USA, 2013. [Google Scholar] [CrossRef]
  31. ASTM International. Standard Test Method for Apparent Density of Free-Flowing Metal Powders Using the Hall Flowmeter Funnel (ASTM B212); ASTM International: West Conshohocken, PA, USA, 2013. [Google Scholar]
  32. Schneider, C.A.; Rasband, W.S.; Eliceiri, K.W. NIH Image to ImageJ: 25 years of Image Analysis. Nat. Methods 2012, 9, 671–675. [Google Scholar] [CrossRef] [PubMed]
  33. ISO. Surface Active Agents—Powders and Granules—Measurement of the Angle of Repose (ISO 4324); ISO: Geneva, Switzerland, 1977. [Google Scholar]
  34. ISO. Particle Size Analysis—Laser Diffraction Methods (ISO 13320); ISO: Geneva, Switzerland, 2020. [Google Scholar]
  35. ASTM International. Standard Test Method for Determination of Oxygen and Nitrogen in Titanium and Titanium Alloys by Inert Gas Fusion (ASTM E1409); ASTM International: West Conshohocken, PA, USA, 2021. [Google Scholar] [CrossRef]
  36. ASTM International. Standard Test Method for Determination of Hydrogen in Titanium and Titanium Alloys by Inert Gas Fusion Thermal Conductivity/Infrared Detection Method (ASTM E1447); ASTM International: West Conshohocken, PA, USA, 2016. [Google Scholar] [CrossRef]
  37. Fox, J.; Weisberg, S. An R Companion to Applied Regression, 3rd ed.; Sage: New York, NY, USA, 2018; p. 608. [Google Scholar]
  38. ASTM International. Standard Test Method for Surface Finish of Powder Metallurgy (PM) Products (ASTM B946); ASTM International: West Conshohocken, PA, USA, 2023. [Google Scholar] [CrossRef]
  39. ASME. Surface Texture (Surface Roughness, Waviness, and Lay (ASME B46.1)); ASME: New York, NY, USA, 2019. [Google Scholar]
  40. ASTM International. Standard Guide for Preparation of Metallographic Specimens (ASTM E3); ASTM International: West Conshohocken, PA, USA, 2017. [Google Scholar] [CrossRef]
  41. ASTM International. Standard Practice for Microetching Metals and Alloys (ASTM E407); ASTM International: West Conshohocken, PA, USA, 2007. [Google Scholar] [CrossRef]
  42. ASTM International. Standard Test Methods for Determining Average Grain Size (ASTM E112); ASTM International: West Conshohocken, PA, USA, 2021. [Google Scholar] [CrossRef]
  43. ASTM International. Standard Test Method for Density of Powder Metallurgy (PM) Materials Containing Less than Two Percent Porosity (ASTM B311); ASTM International: West Conshohocken, PA, USA, 2022. [Google Scholar]
  44. Battelle Memorial Institute. Metallic Materials Properties Development and Standardization (MMPDS-14); Technical Report; Battelle Memorial Institute: Columbus, OH, USA, 2019. [Google Scholar]
  45. ASTM International. Standard Test Methods for Vickers Hardness and Knoop Hardness of Metallic Materials (ASTM E92); ASTM International: West Conshohocken, PA, USA, 2017. [Google Scholar] [CrossRef]
  46. ASTM International. Standard Test Method for Microindentation Hardness of Materials (ASTM E384); ASTM International: West Conshohocken, PA, USA, 2017. [Google Scholar] [CrossRef]
  47. SAE International. Titanium Alloy Bars, Forgings, and Rings 6AI-4V Extra Low Interstitial (ELI) Duplex Annealed, Fracture Toughness (SAE AMS4931G); SAE International: Warrendale, PA, USA, 2019. [Google Scholar]
  48. Kroeger, J.; Poirié, T.; Moghimian, P.; Marion, F.; Larouche, F. Flow rate ranges for spherical metallic powders for additive manufacturing. Prog. Addit. Manuf. 2022, 7, 411–418. [Google Scholar] [CrossRef]
  49. McGlinchey, D. Characterisation of Bulk Solids; Blackwell: Oxford, UK, 2004; p. 264. [Google Scholar]
  50. DIN. Aerospace Series—Technical Specifications for Additive Manufacturing of Metallic Materials with the Powder Bed Process (DIN 65124); DIN: Berlin, Germany, 2018. [Google Scholar]
  51. ASM Handbook Committee (Ed.) ASM Handbook Volume 12—Fractography; ASM International: Materials Park, OH, USA, 1992; p. 517. [Google Scholar]
  52. Amine Benzerga, A.; Leblond, J.B. Ductile Fracture by Void Growth to Coalescence. Adv. Appl. Mech. 2010, 44, 169–305. [Google Scholar] [CrossRef]
  53. SAE International. Terminology for Titanium Microstructures (SAE AS1814F); SAE International: Warrendale, PA, USA, 2020. [Google Scholar]
  54. Thijs, L.; Verhaeghe, F.; Craeghs, T.; Humbeeck, J.V.; Kruth, J.P. A study of the microstructural evolution during selective laser melting of Ti-6Al-4V. Acta Mater. 2010, 58, 3303–3312. [Google Scholar] [CrossRef]
  55. Kumar, P.; Prakash, O.; Ramamurty, U. Micro-and meso-structures and their influence on mechanical properties of selectively laser melted Ti-6Al-4V. Acta Mater. 2018, 154, 246–260. [Google Scholar] [CrossRef]
  56. Macallister, N.; Vanmeensel, K.; Becker, T.H. Fatigue crack growth parameters of Laser Powder Bed Fusion produced Ti-6Al-4V. Int. J. Fatigue 2021, 145, 106100. [Google Scholar] [CrossRef]
  57. EOS GmbH. EOS Titanium Ti64 Grade 23 Material Data Sheet; EOS GmbH: Krailling, Germany, 2020. [Google Scholar]
  58. ASM Handbook Committee (Ed.) ASM Handbook Volume 2—Properties and Selection: Nonferrous Alloys and Special-Purpose Materials; ASM International: Materials Park, OH, USA, 1990; p. 1328. [Google Scholar]
  59. Carpenter. Ti-6Al-4V ELI Material Data Sheet; Carpenter: Philadelphia, PA, USA,, 2021. [Google Scholar]
  60. DebRoy, T.; Wei, H.L.; Zuback, J.S.; Mukherjee, T.; Elmer, J.W.; Milewski, J.O.; Beese, A.M.; Wilson-Heid, A.; De, A.; Zhang, W. Additive manufacturing of metallic components—Process, structure and properties. Prog. Mater. Sci. 2018, 92, 112–224. [Google Scholar] [CrossRef]
  61. Moura, L.S.; Vittoria, G.D.; Gabriel, A.H.; Fonseca, E.B.; Gabriel, L.P.; Webster, T.J.; Lopes, É.S. A highly accurate methodology for the prediction and correlation of mechanical properties based on the slimness ratio of additively manufactured tensile test specimens. J. Mater. Sci. 2020, 55, 9578–9596. [Google Scholar] [CrossRef]
  62. Shanbhag, G.; Wheat, E.; Moylan, S.; Vlasea, M. Effect of specimen geometry and orientation on tensile properties of Ti-6Al-4V manufactured by electron beam powder bed fusion. Addit. Manuf. 2021, 48, 102366. [Google Scholar] [CrossRef]
  63. Zhang, M.; Sun, C.N.; Zhang, X.; Goh, P.C.; Wei, J.; Li, H.; Hardacre, D. Elucidating the Relations Between Monotonic and Fatigue Properties of Laser Powder Bed Fusion Stainless Steel 316L. JOM 2018, 70, 390–395. [Google Scholar] [CrossRef]
  64. Zerbst, U.; Bruno, G.; Buffière, J.Y.; Wegener, T.; Niendorf, T.; Wu, T.; Zhang, X.; Kashaev, N.; Meneghetti, G.; Hrabe, N.; et al. Damage tolerant design of additively manufactured metallic components subjected to cyclic loading: State of the art and challenges. Prog. Mater. Sci. 2021, 121, 100786. [Google Scholar] [CrossRef]
  65. Lu, S.L.; Tang, H.P.; Ning, Y.P.; Liu, N.; StJohn, D.H.; Qian, M. Microstructure and Mechanical Properties of Long Ti-6Al-4V Rods Additively Manufactured by Selective Electron Beam Melting Out of a Deep Powder Bed and the Effect of Subsequent Hot Isostatic Pressing. Metall. Mater. Trans. Phys. Metall. Mater. Sci. 2015, 46, 3824–3834. [Google Scholar] [CrossRef]
  66. Etesami, S.A.; Fotovvati, B.; Asadi, E. Heat treatment of Ti-6Al-4V alloy manufactured by laser-based powder-bed fusion: Process, microstructures, and mechanical properties correlations. J. Alloys Compd. 2022, 895, 162618. [Google Scholar] [CrossRef]
  67. Froes, F.H. (Ed.) Titanium—Physical Metallurgy Processing and Application; ASM International: Materials Park, OH, USA, 2015; p. 404. [Google Scholar]
  68. Facchini, L.; Magalini, E.; Robotti, P.; Molinari, A.; Höges, S.; Wissenbach, K. Ductility of a Ti-6Al-4V alloy produced by selective laser melting of prealloyed powders. Rapid Prototyp. J. 2010, 16, 450–459. [Google Scholar] [CrossRef]
  69. Lewis, G.K.; Schlienger, E. Practical considerations and capabilities for laser assisted direct metal deposition. Mater. Des. 2000, 21, 417–423. [Google Scholar] [CrossRef]
  70. Ahn, B. Microstructural Tailoring and Enhancement in Compressive Properties of Additive Manufactured Ti-6Al-4V Alloy through Heat Treatment. Materials 2021, 14, 5524. [Google Scholar] [CrossRef] [PubMed]
  71. Hartunian, P.; Eshraghi, M. Effect of build orientation on the microstructure and mechanical properties of selective laser-melted Ti-6Al-4V Alloy. J. Manuf. Mater. Process. 2018, 2, 69. [Google Scholar] [CrossRef] [Green Version]
  72. Tucho, W.M.; Cuvillier, P.; Sjolyst-Kverneland, A.; Hansen, V. Microstructure and hardness studies of Inconel 718 manufactured by selective laser melting before and after solution heat treatment. Mater. Sci. Eng. A 2017, 689, 220–232. [Google Scholar] [CrossRef]
  73. Dareh Baghi, A.; Nafisi, S.; Hashemi, R.; Ebendorff-Heidepriem, H.; Ghomashchi, R. Experimental realisation of build orientation effects on the mechanical properties of truly as-built Ti-6Al-4V SLM parts. J. Manuf. Process. 2021, 64, 140–152. [Google Scholar] [CrossRef]
  74. Bai, Y.; Zhao, C.; Yang, J.; Fuh, J.Y.H.; Lu, W.F.; Weng, C.; Wang, H. Dry mechanical-electrochemical polishing of selective laser melted 316L stainless steel. Mater. Des. 2020, 193, 108840. [Google Scholar] [CrossRef]
Figure 1. Build layout. (a) As-designed build. (b) As-printed build.
Metals 13 01390 g001
Figure 2. Powder analysis results. (a) Powder particle morphology. (b) PSD by cumulative volume percent.
Metals 13 01390 g002
Figure 3. U T S  vs.  Y S .
Metals 13 01390 g003
Figure 4. U T S  vs.  E l a f .
Metals 13 01390 g004
Figure 5. U T S  vs.  R A .
Metals 13 01390 g005
Figure 6. Tensile fractographs. (a) Fractograph of SR specimen printed in the vertical orientation. (b) Side view of the SR outlier as depicted in Figure 5 with an  R A  of 13.7%. (c) Fractograph of a DA specimen printed in the 45° orientation. (d) Side view of a DA specimen with typical “cup-and-cone” fracture.
Metals 13 01390 g006
Figure 7. (a) Micrographs of material in the SR condition sectioned in the Z plane. (b) Micrographs of material in the SR condition sectioned in the XY plane.
Metals 13 01390 g007
Figure 8. (a) Micrographs of material in the DA condition sectioned in the Z plane. (b) Micrographs of material in the DA condition sectioned in the XY plane.
Metals 13 01390 g008
Figure 9. Vickers microhardness. (a) From material surface to centre. (b) In the build direction.
Metals 13 01390 g009
Table 1. Review of mechanical properties of high-temperature and duplex annealed Ti-6Al-4V.
AlloyProcessFirst CycleSecond CycleUTS [MPa]YS [MPa]Elongation [%]Ref.
Ti-6Al-4V ELI 1LPBF910 °C [8] WQ750 °C [4] FC≈950-≈18[20]
Ti-6Al-4V 2LPBF920 °C [0.5] FC 3700 °C [2] AC≈952≈874≈12[21]
Ti-6Al-4V ELI 4LPBF900 °C [2] AC700 °C [1] AC9889089.5[19]
Ti-6Al-4V ELI 5LPBF900 °C [2] AC 6700 °C [1] AC97388519[19]
Ti-6Al-4V ELILPBF940 °C [1] AC650 °C [2] AC94889913.5[16]
Ti-6Al-4V 7LPBF950 °C [1] AC700 °C [2] AC871-11.5[23]
Ti-6Al-4V ELI 8LPBF950 °C [3] FC-898820-[18]
Ti-6Al-4V 9LPBF950 °C [2] FC-≈940-≈10.5[24]
Ti-6Al-4V ELI 10LPBF1020 °C [0.5] AC-835714-[18]
Ti-6Al-4V- 11955 °C [0.17] AC675 °C [4] AC96591718[8]
Ti-6Al-4VForged870 °C [2] AC705 °C [2] AC91185615[10]
Ti-6Al-4VCast925 °C [4] 12-9178138[10]
Ti-6Al-4V ELI 13Forged955 °C [1] AC705 °C [2] AC89281412[25]
Numbers in [] indicate dwell times in hours. WQ = water quench, AC = air cool, FC = furnace cool. 1 Data read from plot. Elongation at fracture measured from crosshead displacement. Elongation after fracture of ≈14.5. 2 Tensile results averaged for 30  μ m layer thickness and 67° scan rotation data. 3 Cooled to 700 °C. 4 Inferred air cooling was performed based on the cooling rate reported. Non-standard 3D elongation at fracture was reported. 5 Inferred air cooling was performed based on the cooling rate reported. Non-standard 3D elongation at fracture was reported. 6 The first cycle was an HIP cycle at 100 MPa. 7 Different solution anneal temperatures (950 or 960 °C) and cooling methods applied from the second anneal (AC or FC) are reported. 8 HIP cycle at 103 MPa. Data averaged for three orientations. 9 Tensile testing and elongation measurement details not defined. Data read from plot. 10 HIP cycle at 103 MPa. Data averaged for three orientations. 11 Manufacturing method not defined, although properties are for material in the wrought condition. 12 HIP at 103 MPa. The cooling method is not defined. 13 Total elongation at fracture reported.
Table 2. LPBF Parameters.
ApplicationParameterValue
Build PlateMaterialTi-6-Al-4V (ASTM grade 5)
Dimensions252 mm × 252 mm × 44.5 mm
Temperature80 °C
Processing Environment and EquipmentAtmosphereArgon Baseline 5.0 (>99.995%)
Recoater BladeCarbon Fibre Brush
Recoating Speed150 mm/s
Oxygen Concentration<0.1%
Layering and HatchingLayer Thickness40  μ m
Hatch Spacing120  μ m
Hatch PatternStripes with Skywriting
Rotation Angle47°
Infill ScanningInfill Overlap150  μ m
Hatch Offset15  μ m
Laser Power280 W
Scan Speed1300 mm/s
Table 3. Powder and produced material chemistry.
FeedstockProduced Material
ElementAverage [wt.%]Bottom [wt.%]Top [wt.%]ASTM F3001 [wt.%]
Oxygen0.08420.08380.0865≤0.13
Nitrogen0.000812 10.01770.0151≤0.05 2
Hydrogen0.001150.002580.00222≤0.012
1 Instrument calibrated for values ≥ 0.0038 wt.% for nitrogen; the precision of this reading is therefore unreliable. 2 SAE AMS4931 requires a maximum nitrogen content of 0.03 wt.% for produced material.
Table 4. Surface roughness results.
Surface ConditionnRa [μm]Rz [μm]Rt [μm]
As-Built 1219.82 ± 1.1954.5 ± 7.068.6 ± 12.2
Dry Electropolished 2213.34 ± 0.8219.6 ± 4.528.4 ± 8.4
Machined241.19 ± 0.566.65 ± 2.558.86 ± 3.07
1 Measurements only taken in the vertical build orientation. 2 All specimens abrasive blasted prior to dry electropolishing.
Table 5. Tensile test matrix and results.
Material ConditionSurface ConditionOrientationnUTS [MPa]YS [MPa]Elaf [%]RA [%]
Stress RelievedDry ElectropolishedVertical31136 ± 111043 ± 188.81 ± 1.5425.4 ± 11.2
MachinedVertical41136 ± 101035 ± 167.89 ± 0.4233.2 ± 1.55
45°21154 ± 71017 ± 278.5 ± 0.2932.6 ± 1.49
Horizontal111299998.1329.9
Duplex AnnealedDry ElectropolishedVertical7920 ± 18803 ± 2318.3 ± 1.0647.4 ± 5.60
45°6930 ± 11803 ± 1016.0 ± 0.8637.4 ± 2.46
Horizontal6913 ± 12795 ± 1418.3 ± 1.3842.0 ± 3.49
MachinedVertical8915 ± 8798 ± 1317.4 ± 1.2351.5 ± 3.16
45°4938 ± 5796 ± 517.5 ± 1.2249.7 ± 1.36
Horizontal5890 ± 5771 ± 418.2 ± 1.6050.6 ± 0.77
Table 6. Quantitative metallography results for DA material.
AnalysisMetricCalculated Value
Phase Analysis α  phase75.2% ± 2.33
β  phase24.8% ± 2.33
Image Analysis α  grain width3.35  μ m ± 1.08
α  grain length17.3  μ m ± 9.4
  A R a v e 5.2:1
ASTM Grain Sizing α  size5.41  μ m ± 0.94
  A I 10.96 ± 0.42
  A I p 1.05 ± 0.48
G12
1 Anisotropy indices per ASTM E112 [42].
Table 7. Material density results.
OrientationnAverage Density [g/cm3]Relative Density [%]
Vertical64.40 ± 0.0299.4 ± 0.4
45°64.41 ± 0.0099.6 ± 0.1
Horizontal64.41 ± 0.0299.5 ± 0.4
Disclaimer/Publisher’s Note: The statements, opinions and data contained in all publications are solely those of the individual author(s) and contributor(s) and not of MDPI and/or the editor(s). MDPI and/or the editor(s) disclaim responsibility for any injury to people or property resulting from any ideas, methods, instructions or products referred to in the content.

