Article

Automatic Detection of Sorbite Content in High Carbon Steel Wire Rod

1
Jiangsu Product Quality Testing & Inspection Institute, Nanjing 210007, China
2
College of Material Science and Technology, Nanjing University of Aeronautics and Astronautics, Nanjing 211106, China
*
Authors to whom correspondence should be addressed.
Metals 2023, 13(5), 990; https://doi.org/10.3390/met13050990
Submission received: 13 February 2023 / Revised: 30 March 2023 / Accepted: 24 April 2023 / Published: 20 May 2023
(This article belongs to the Topic Microstructure and Properties in Metals and Alloys)

Abstract

:
This paper presents a method for the automatic detection of sorbite content in high-carbon steel wire rods. A semantic segmentation model of sorbite based on DeepLabv3+ is established. The sorbite structure is segmented, and the prediction results are analyzed and counted based on the metallographic images of high-carbon steel wire rods marked manually. For the problem of sample imbalance, the loss function of Dice loss + focal loss is used, and the perturbation processing of training data is added. The results show that this method can realize the automatic statistics of sorbite content. The average pixel prediction accuracy is as high as 94.28%, and the average absolute error is only 4.17%. The composite application of the loss function and the enhancement of the data perturbation significantly improve the prediction accuracy and robust performance of the model. In this method, the detection of sorbite content in a single image only takes 10 s, which is 99% faster than that of 10 min using the manual cut-off method. On the premise of ensuring detection accuracy, the detection efficiency is significantly improved and the labor intensity is reduced.

1. Introduction

High-carbon steel wire rods are the main raw materials for the production of spring steel, prestressed steel strands, steel cords, steel wire ropes, and other products. Their plasticity, strength, and uniformity of structure are crucial for subsequent processing. The delivery status of high carbon steel wire rods is generally hot-rolled, and its microstructure is a sorbite structure. Sorbite is a non-equilibrium pearlite-type structure and a dual-phase mixed structure of sorbite ferrite and cementite. Its difference from pearlite is that a slice of sorbite and cementite in sorbite are thinner and the spacing between slices is smaller. Sorbite and cementite slices can be distinguished by a magnification of more than 600 times under an optical microscope. Due to the small slice spacing and many interphase boundaries, the sorbite structure has enhanced resistance to plastic deformation under the action of an external force, excellent strength, and plasticity, and is the most ideal structure for high-carbon wire rod steel [1]. In addition to sorbite, there are also pearlite, martensite, net cementite, and other structures in the high carbon steel wire rods. The content of sorbite is one of the important indicators to evaluate the performance of high-carbon wire rods. Generally, the content is required to be not less than 80%. The higher, the better.
At present, the standard for sorbite structure testing of high-carbon steel wire rods is the YB/T 169-2014 Metallegrephic Tat Method of Sorbite in High Carbon Steel Wire Rod [2]. Three detection methods are specified in the standard. The first method is the metallographic manual method. According to the stereological quantitative metallography principle, the grid number point method or grid truncation method is adopted, i.e., in a grid with a determined size or area, the sorbite volume fraction is calculated by manually counting the proportion of the grid intersection or grid length occupied by the sorbite structure to the total number of grid intersections or lengths. The second method is standard sample detection with an image analyzer. The standard sample with a determined sorbite content is used for synchronous sample preparation, corrosion, and detection with the sample to be tested to determine the reference grayscale value Gs of the standard reference sample. The sample to be tested is grayed with the same grayscale value Gs, and the sorbite volume fraction is quantitatively measured by the grayscale value. The third method is comparison. The microstructure of the sample to be tested through a metallographic microscope is observed, it is then compared with the standard rating chart of sorbite content, the standard chart with the closest structure to the sample to be tested is determined, and the sorbite volume fraction or sorbite grade of the sample to be tested is estimated. The three detection methods have their own advantages and disadvantages. Methods 1 and 2 produce more accurate detection results but have many detection steps and low efficiency. Method 3 is simple, fast, and efficient, but the error rate is large (the sorbite content of 10% is a grade in the standard chromatogram) and is greatly affected by the inspector. The consistency of the results is low.
At present, the detection of sorbite content is controversial, there are three reasons for this. Firstly, there is a heavy reliance on the individual researcher’s background and experience which both introduce significant bias and potentially error into the process of detecting sorbite content. Secondly, the detection of sorbite content is greatly affected by the level of sample preparation; it is difficult to obtain a perfect microstructure to clearly distinguish the structure details and to determine the size of the region of a certain type of microstructure, due to the poor sample prepared by the polishing process. Corrosion defects can be caused by a number of factors, such as inadequate etching or over etching. Inadequate etching would lead to an incomplete microstructure display, and sorbite is easily misjudged as pearlite. Over etching would lead to the microstructure image showing a sense of relief, forming microstructure artifacts. Thirdly, there is a pearlite-sorbite transitional microstructure (PS) in high-carbon wire rods [3], and its lamellar spacing is between the pearlite and sorbite in high resolution; whether this type of transitional structure is classified as pearlite or sorbite also directly affects the judgment of the results. Therefore, the accurate detection of the sorbite content of high-carbon wire rods has been a problem in the steel industry.
With the rapid development of electronic information technology and artificial intelligence technology, computer vision (CV)—a discipline that studies how to make computers “see” like humans—is widely used in various industries, such as text recognition, and medical diagnosis [4,5]. The computers are objective and fast, and they are supposed to play an important role in the field of detection. In the field of materials, the automatic metallographic analysis of metal materials based on computer vision and machine learning technologies has become the focus of researchers at home and abroad. Chowdhury [6] used pre-trained convolutional neural networks (deep learning algorithms) to extract microstructure features, and used support vector machine, voting, nearest neighbors, and random forest models for classification, and obtained a high classification accuracy. Azimi [7] employed pixel-wise segmentation based on full convolutional neural networks (FCNN), together with the deep learning method to classify and identify the microstructure of mild steel, achieving a 93.94% classification accuracy. Park [8] employed a pixel-wise segmentation method via U-NET architecture built upon FCNN, and employed several techniques ranging from data augmentation, the Amazon computing service, to semantic segmentation. The system achieved a maximum classification accuracy of 98.689% for the pearlite and ferrite phases. Therefore, the automatic detection of the sorbite content based on machine learning is feasible. This paper builds a semantic segmentation model based on the deep learning algorithm and uses the sorbite tissue image calibrated by technical experts as the training data set to segment and analyze the sorbite, thus realizing the automatic detection of the sorbite content of high-carbon steel wire rods.

2. Acquisition and Calibration of Data Set

2.1. Sample Preparation

A hundred metallographic samples were prepared by selecting rolls of 55SiCr, 65Mn, 72A, and SWRH82B hot rolled wire rods with a diameter of 6–12 mm, 25 in each. After cutting, grinding, and polishing, a 4% nitric acid alcohol solution was used for corrosion for 25–35 s (the higher the carbon content is, the longer the corrosion time is). When a clear microstructure was displayed, the ZEISS Axio Observer optical metallographic microscope (Manufactured by Carl Zeiss, Munich, Germany) was used for observation. Twenty-five metallographic photographs were taken randomly from the edge to the center of each metallographic specimen, totaling 2500.

2.2. Image Calibration

The metallographic images were distributed to experts to determine the sorbite region and sorbite content in each image using the grid truncation method. The sorbite area (dark zone) was then labeled using LabelMe software version 5.1.1. Figure 1 shows an example of the sorbite labeling in a single metallographic image. For this study, 2500 valid metallographic images and their labeling files were collected, with an image size of 2048 × 1536.

3. Model and Method

3.1. Network Architecture

In this paper, the residual neural network ResNet [9] was selected as the backbone network for feature extraction, and DeepLabv3+ [10] and U-Net ++[11] were used as semantic segmentation models for the segmentation and statistics of sorbite content.
The network structure of ResNet is based on VGG-19, which is improved, and residual elements are added by a short circuit mechanism. In ResNet-34, it adopts 3 × 3 filters, and its design principle is that: first, in the same output feature map, the number of filters in each layer is the same; second, when the size of the feature map is reduced by half, the number of filters will double to ensure the time complexity of each layer. The network ends with a global average pooling layer and a 1000-dimensional fully connected layer with softmax. The rest of the residual neural network structure is deformed on this basis.
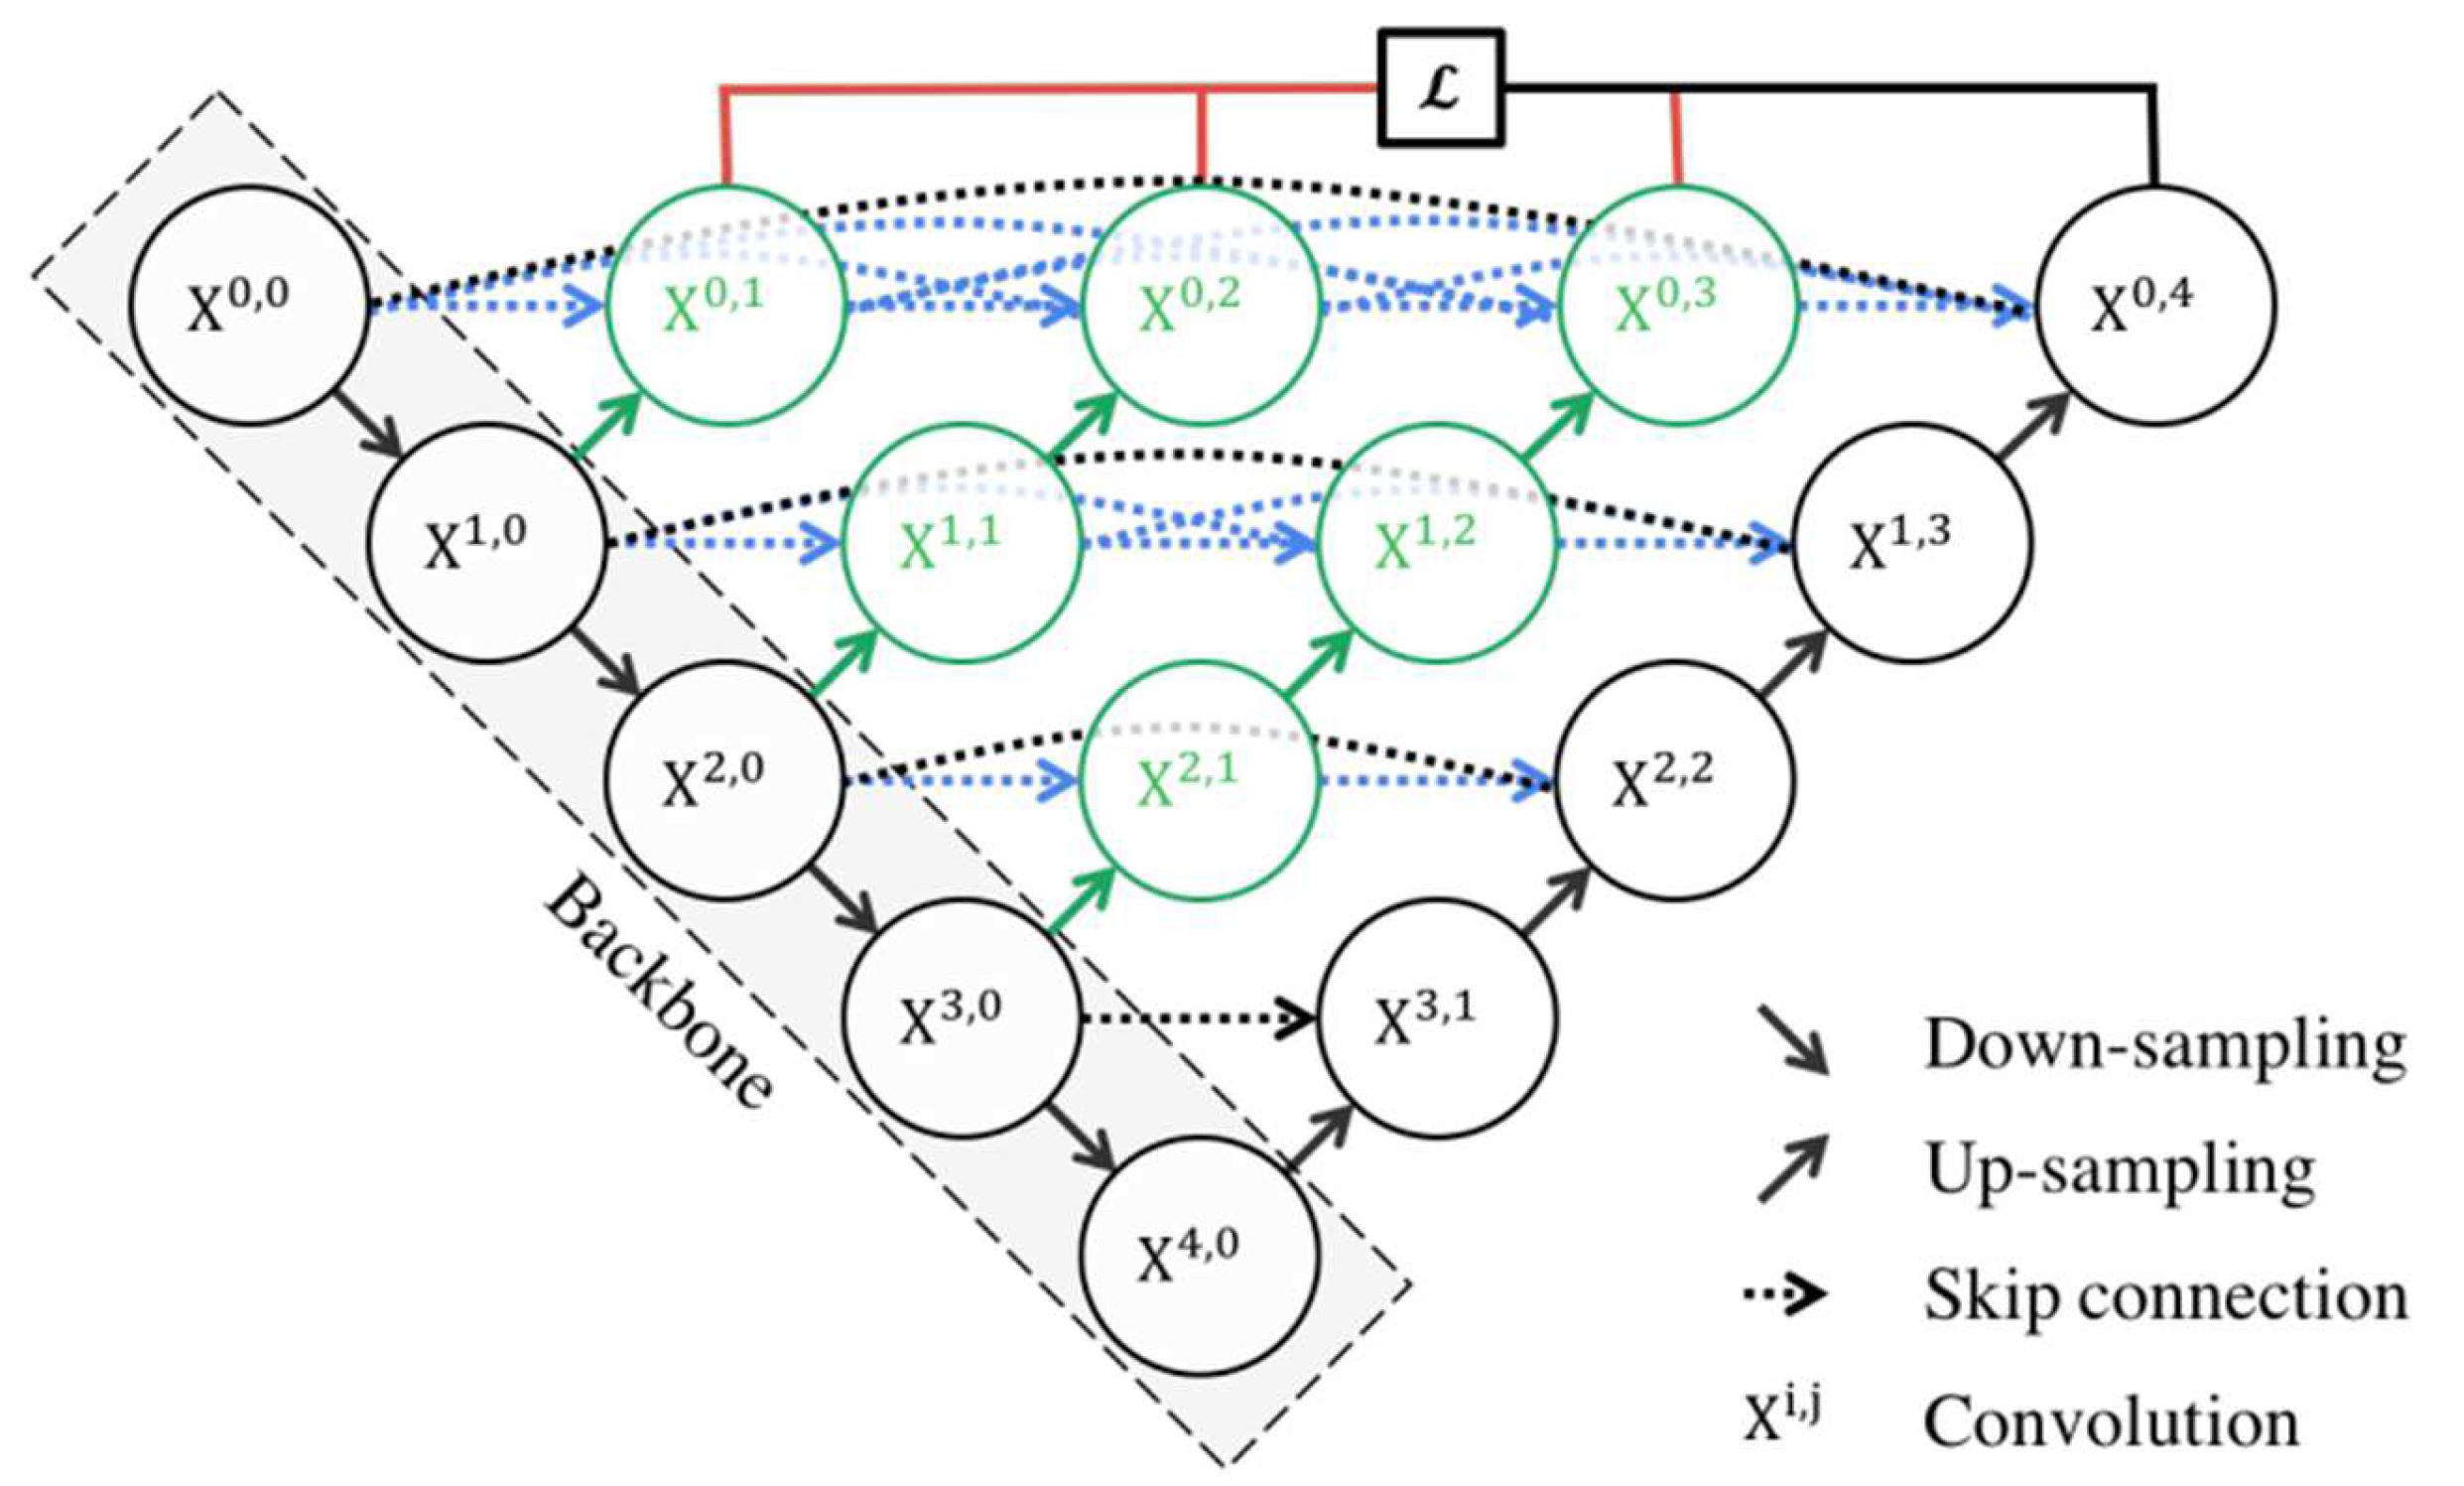
The U-Net++ network structure is shown in Figure 2, which consists of several parts: the convolution unit, down-sampling and up-sampling modules, and skip connection between convolution units. In the U-Net model structure, nodes X0.4 only form a skip connection with nodes X0.0, while in the U-Net++ model structure, nodes X0.4 connect the outputs of four convolution units X0.0, X0.1, X0.2, and X0.3 at the same layer, where each node Xi.j represents one convolution down-sampling or deconvolution up-sampling. The U-Net++ network has a nested structure and dense skip paths, which is conducive to aggregating features with different semantic scales on the decoder subnetwork and has achieved excellent performance levels in other fields [12,13]. In this paper, after grayscale processing, the sorbite was quite different from other tissues, which was intuitively applicable to this problem.
Enter X0.0 from X0.0 on the first layer of the model, and calculate according to the following formula in turn:
x i , j = μ x i 1 , j ,   j = 0 μ x i , k k = 0 j 1 , T x i + 1 , j 1 ,   j > 0
where μ denotes the convolution, [] denotes the feature cascade, T denotes the deconvolution up-sampling, and x i , j denotes the output of the node X i , j , where i denotes the down-sampling layer along the encoder index and j denotes the convolution layer along the skip index dense block.
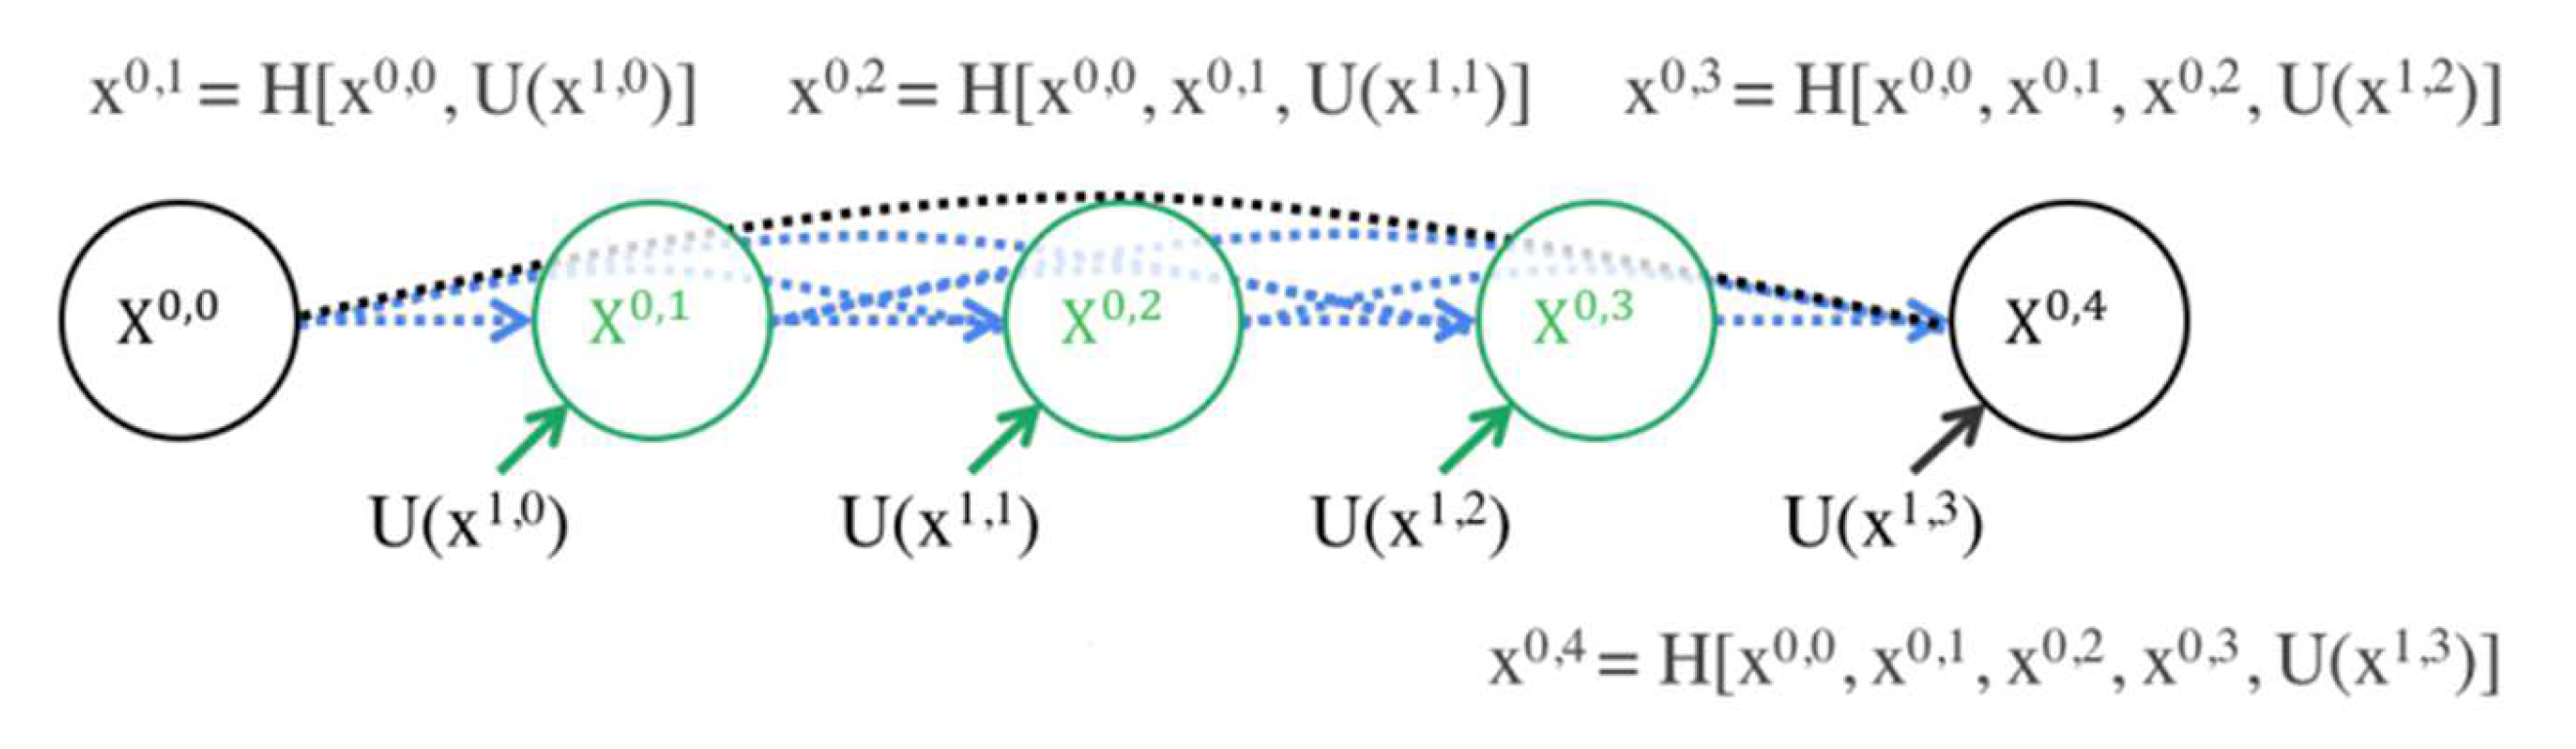
The skip connection can introduce high-resolution information in the image into the result of the up-sampling, thereby ensuring high segmentation accuracy. Taking the first layer of the model as an example, the skip connection results are shown in Figure 3.
The deep supervision process was introduced into the U-Net++ network model. The shallow feature perception of the image can be increased by deconvolutional up-sampling of the results x i , 0 obtained by down-sampling at each level, and then adding the final up-sampling segmentation results x 0 , j corresponding to each level of the training loss calculation process [14]. The split loss function designed accordingly is shown in the following formula:
L o s s = 1 J i = 1 J L j x 0 , j
where L o s s is the total segmentation loss, L j is the loss function used to calculate the segmentation loss of x 0 , j , and J is the number of all nodes except the down-sampling nodes in the first layer of the model.
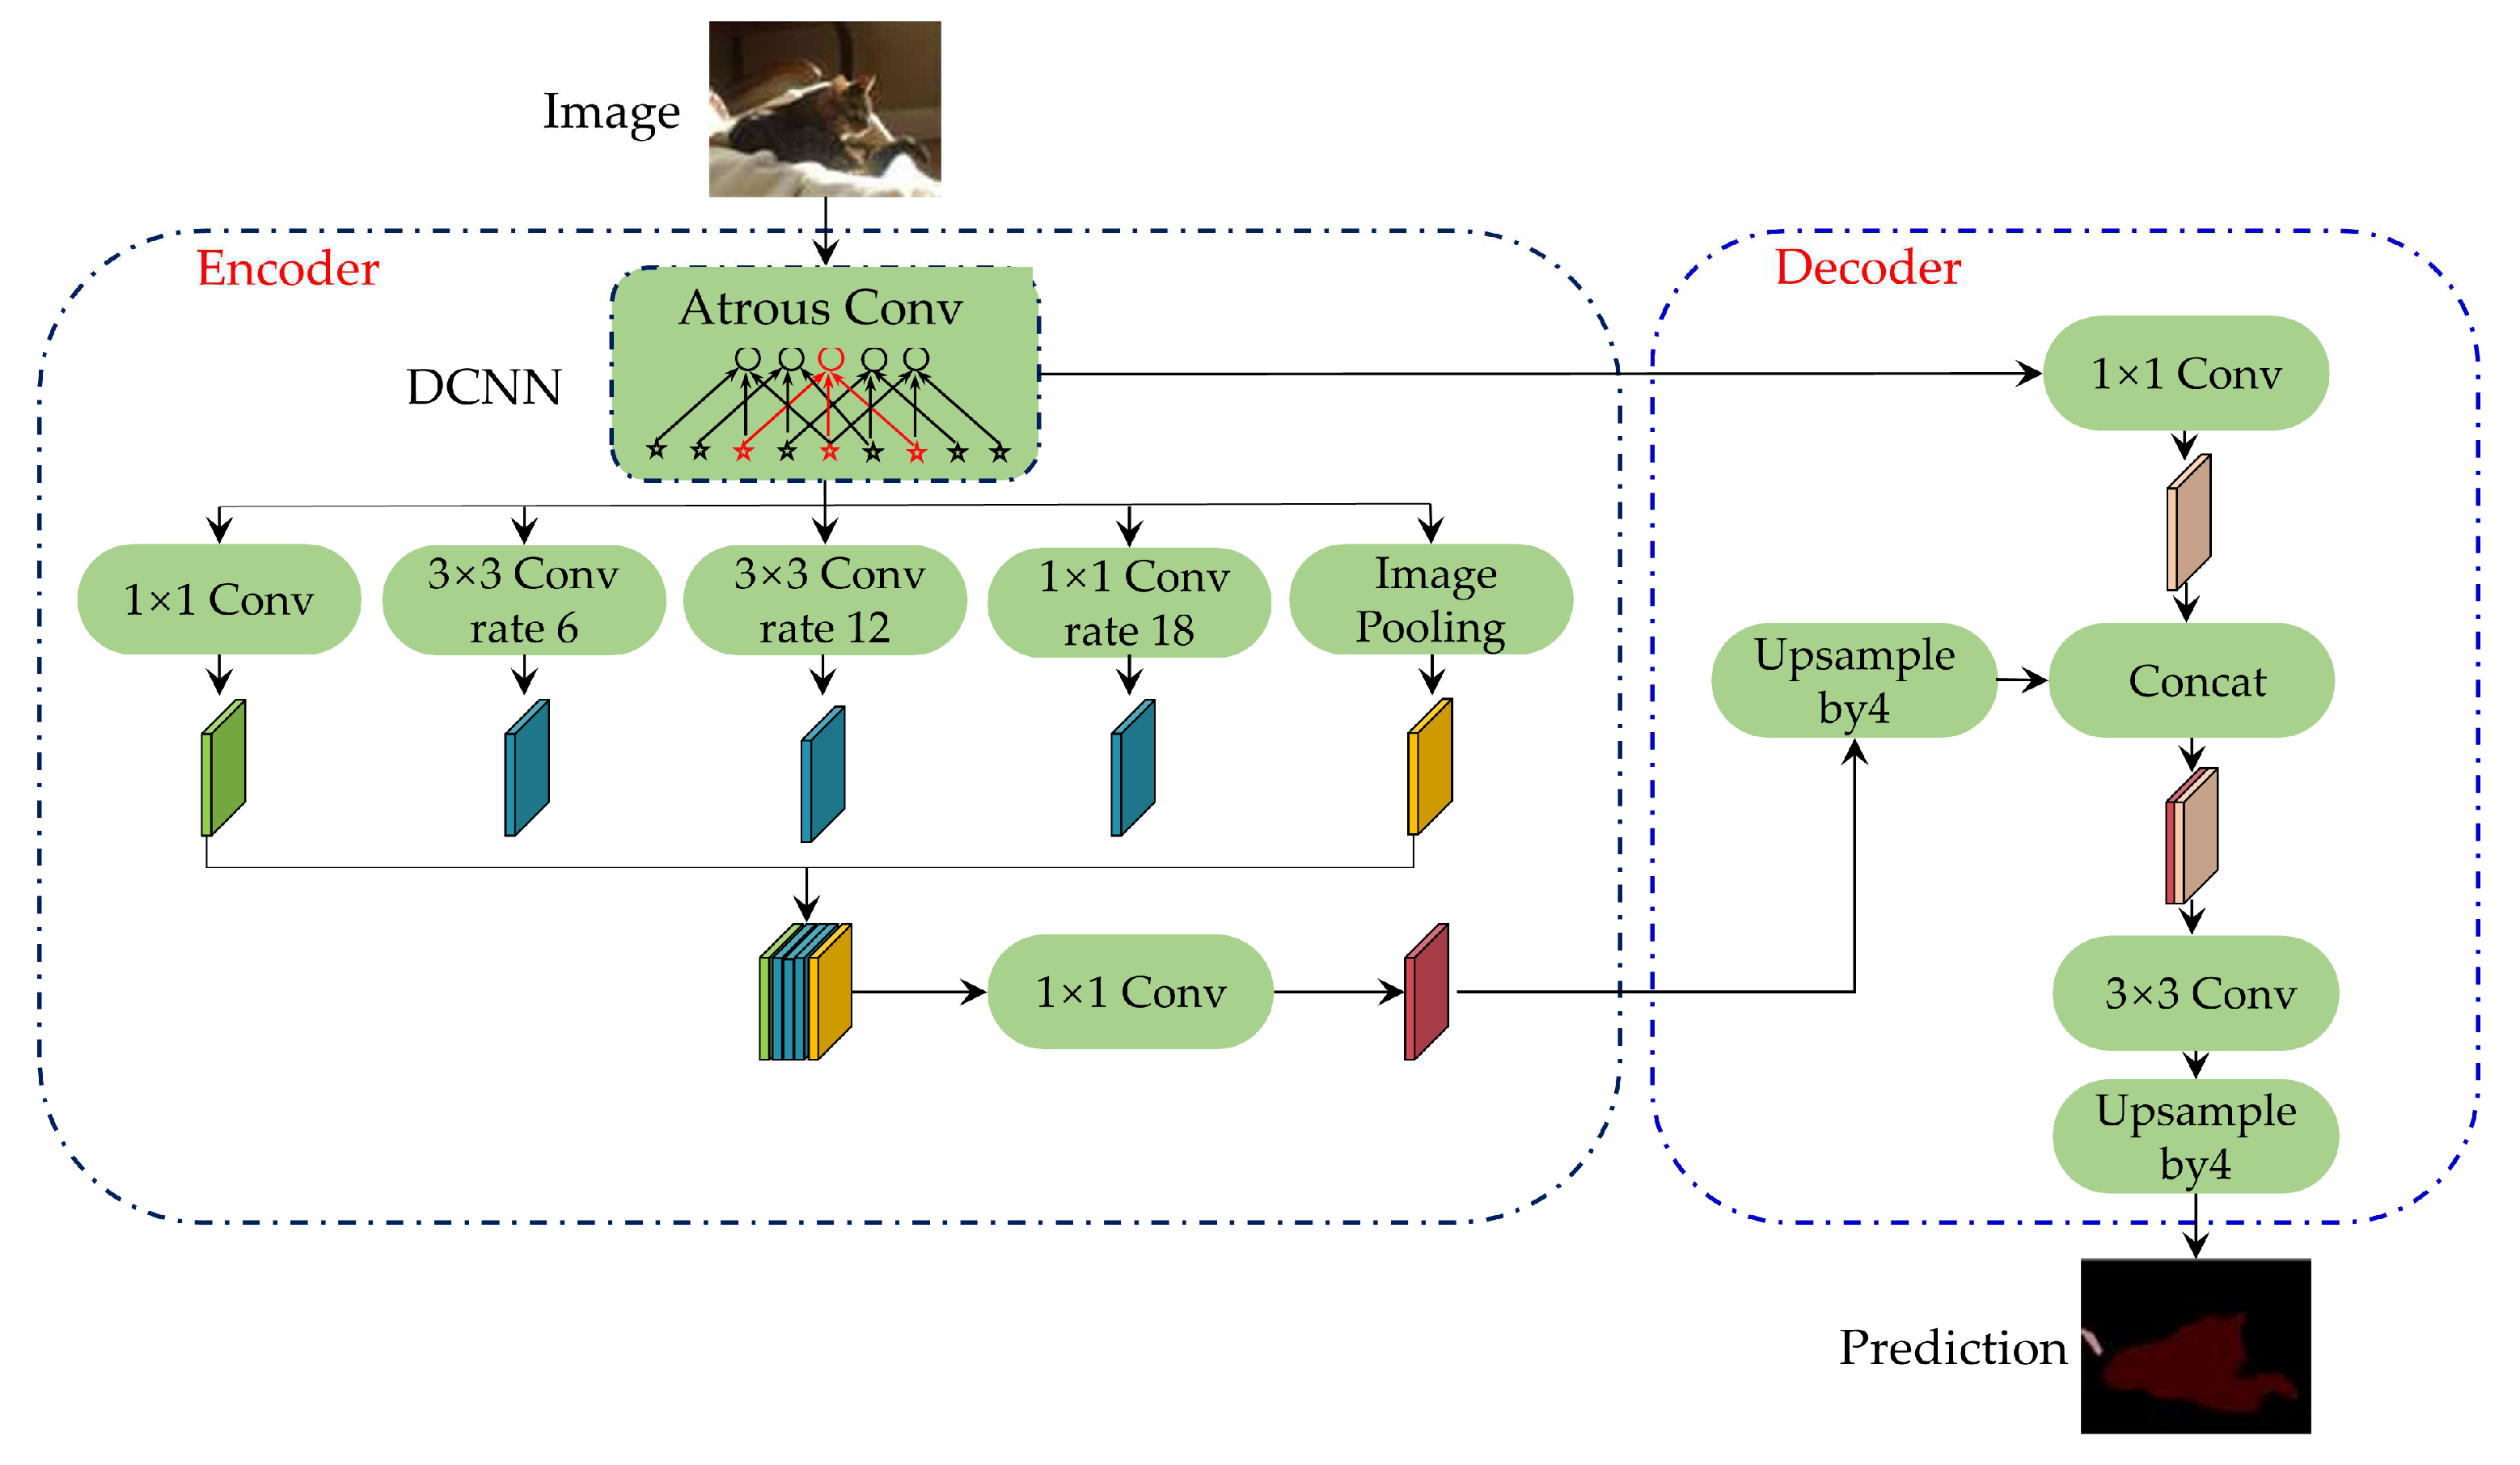
Compared with the U-Net++ network, the DeepLabv3+ network greatly reduces the actual running graphic memory occupancy under the same setting and slightly improves the performance, which is also suitable for this problem. The structure of the DeepLabv3+ network is shown in Figure 4. The network with a codec structure was generated based on the DeepLabv3 network structure, in which DeepLabv3 was used as the encoder part to extract and fuse multi-scale features. A simple structure was added as the decoder to further merge the underlying features with the higher-layer features, improve the accuracy of the segmentation boundary, and obtain more details, forming a new network that merges atrous spatial pyramid pooling (ASPP) [15] and codec structures.
Atrous convolution is the core of the DeepLab series model [10,16,
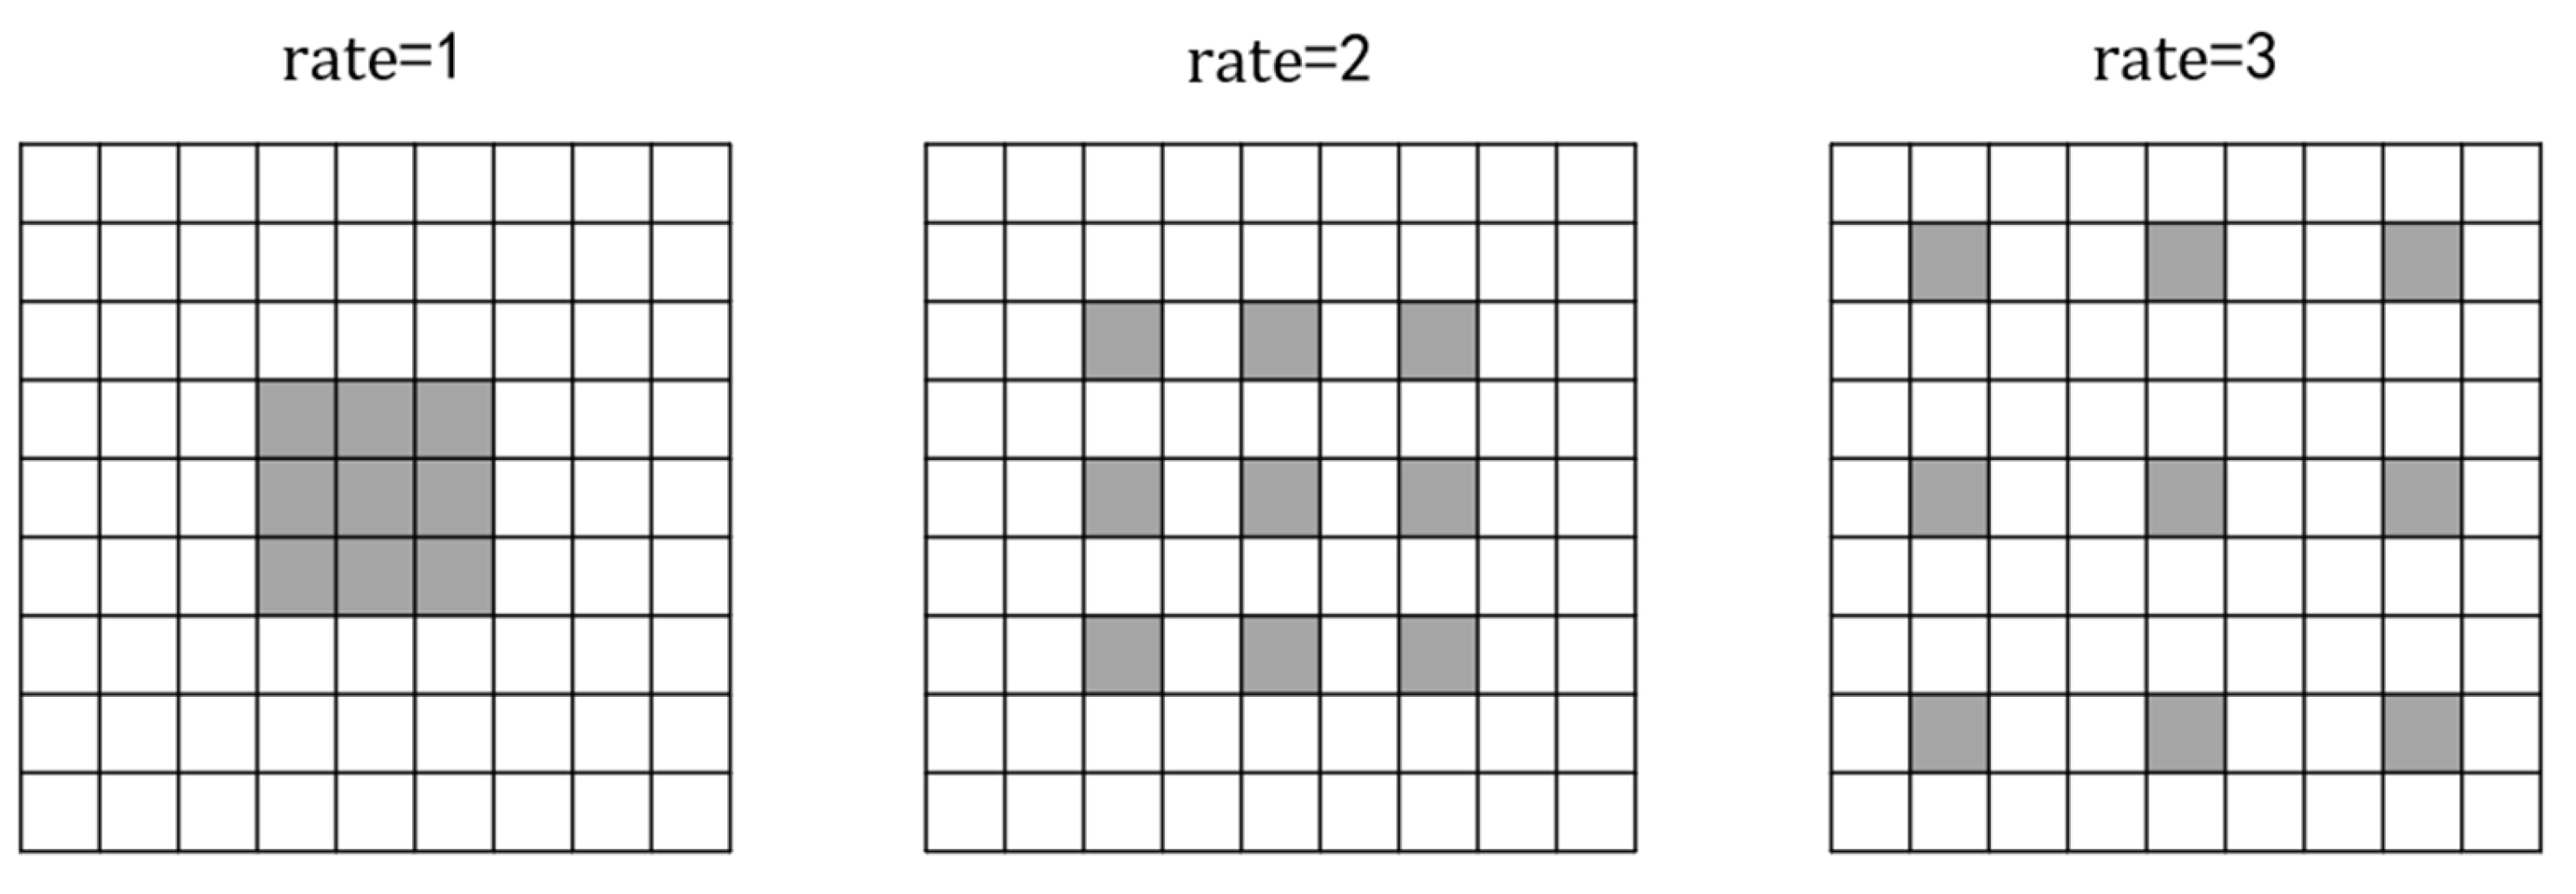
17], which is a convolution method to increase the receptive field and is conducive to extracting multi-scale information. Atrous convolution adds voids based on ordinary convolution, in which a parameter dilation rate is added to control the size of the receptive field. As shown in the Figure 5, taking 3 × 3 convolution as an example, the grey lattice represents the 3 × 3 convolution kernel, and the receptive field after ordinary convolution is 3. When r a t e = 2 , the receptive field after convolution by the atrous convolution module is 5, which is increased by 2 compared with the ordinary convolution receptive field. When r a t e = 3 , the receptive field after convolution by the atrous convolution module is 7, which is increased by 4 compared with the ordinary convolution receptive field. Due to the mesh effect of atrous convolution, some information will be lost in the image after the atrous convolution operation.
For two-dimensional signals, in particular, for each position i on the output feature map y and the convolution filter w , an atrous convolution was applied on the input feature map x , with the following formula:
y i = k x i + r a t e · k w [ k ]
Atrous spatial pyramid pooling (ASPP) uses atrous convolution with different expansion rates to make up for the defects of atrous convolution, captures the context of multiple layers, fuses the obtained results, reduces the probability of information loss, and helps to improve the accuracy of convolutional neural networks.

3.2. Loss Function

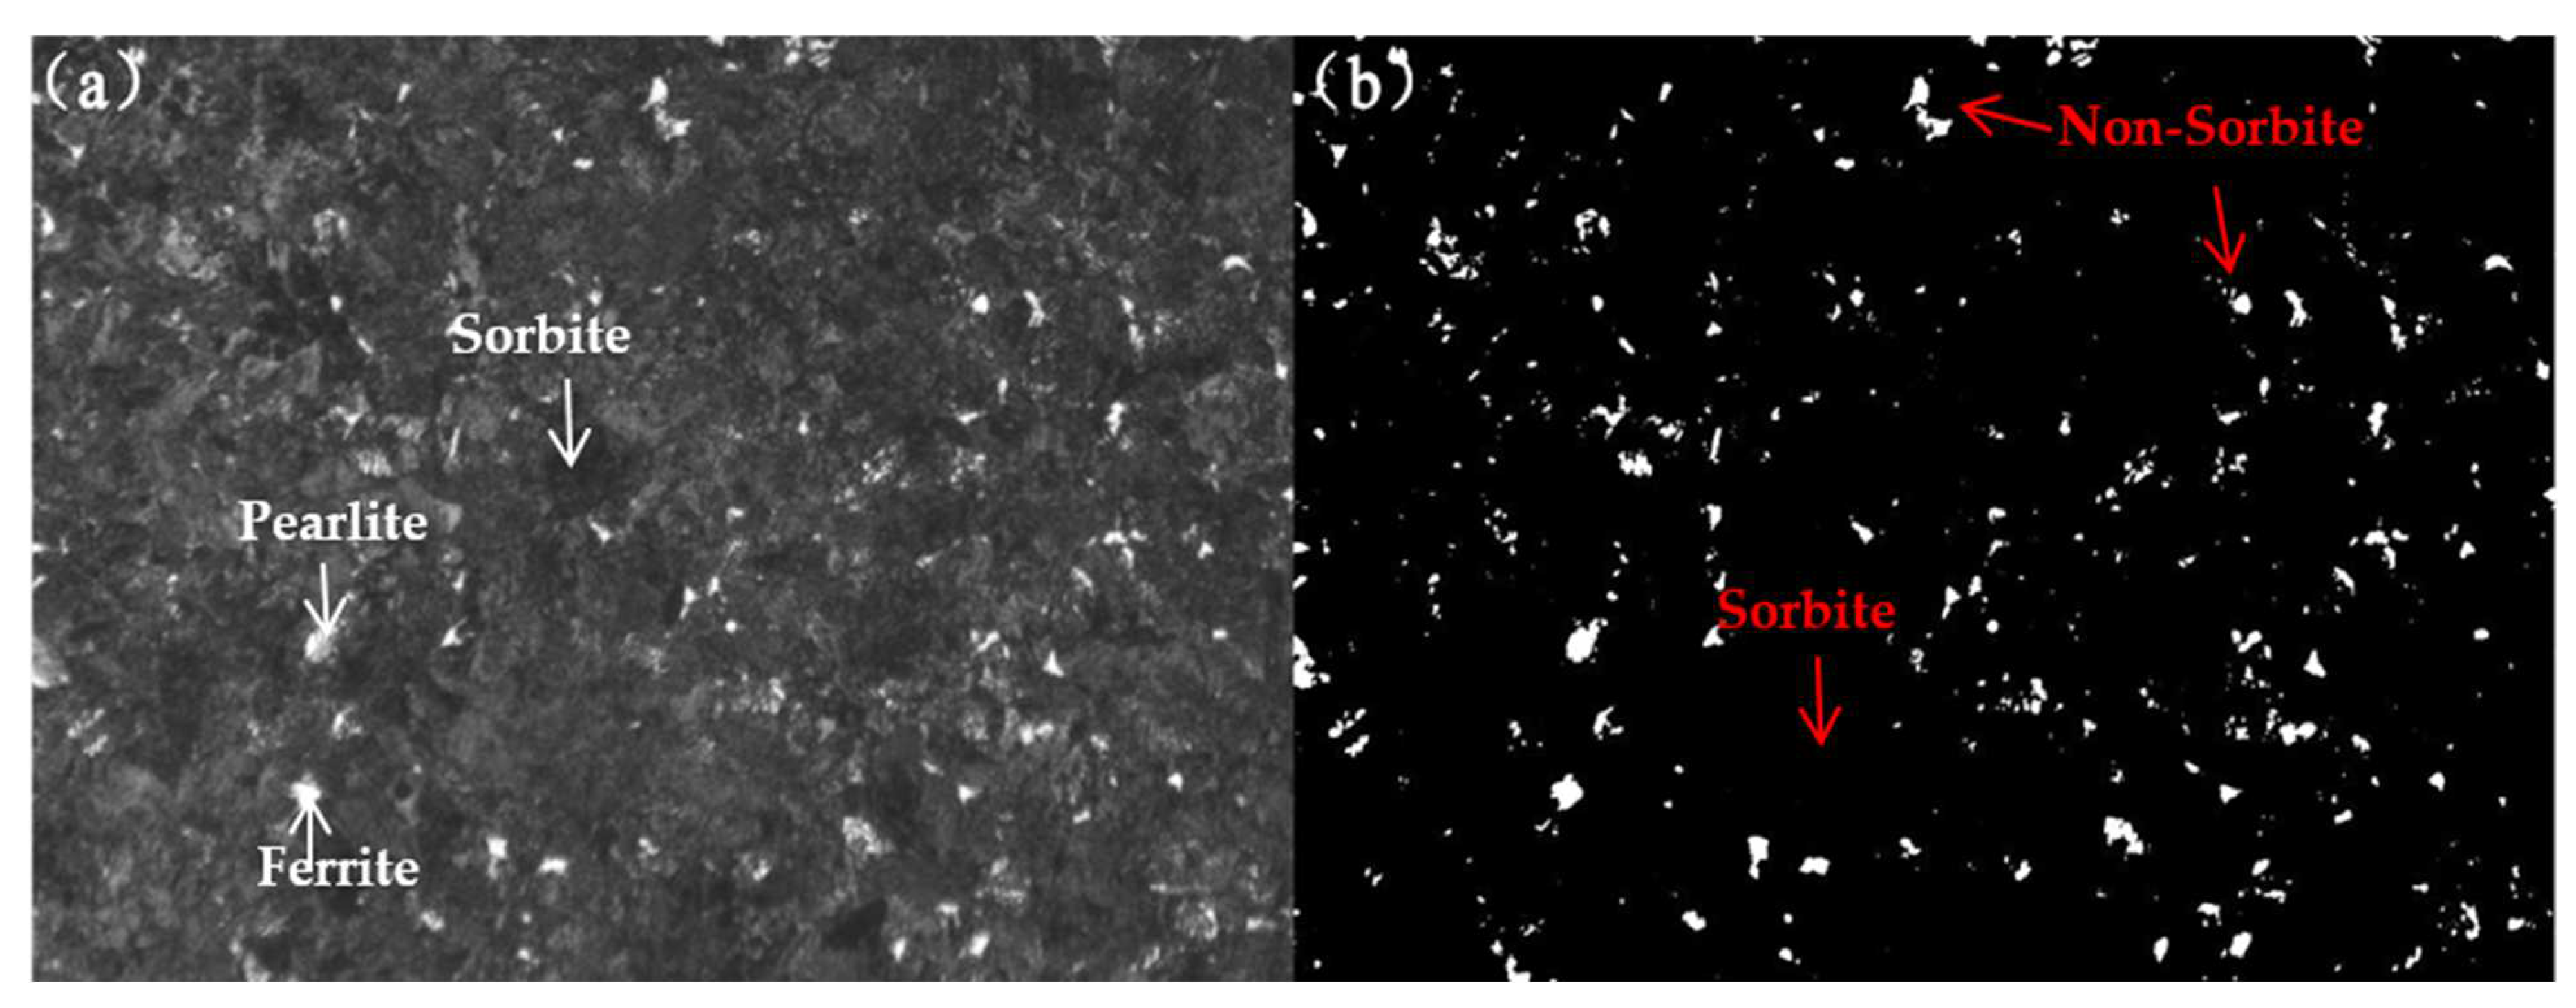
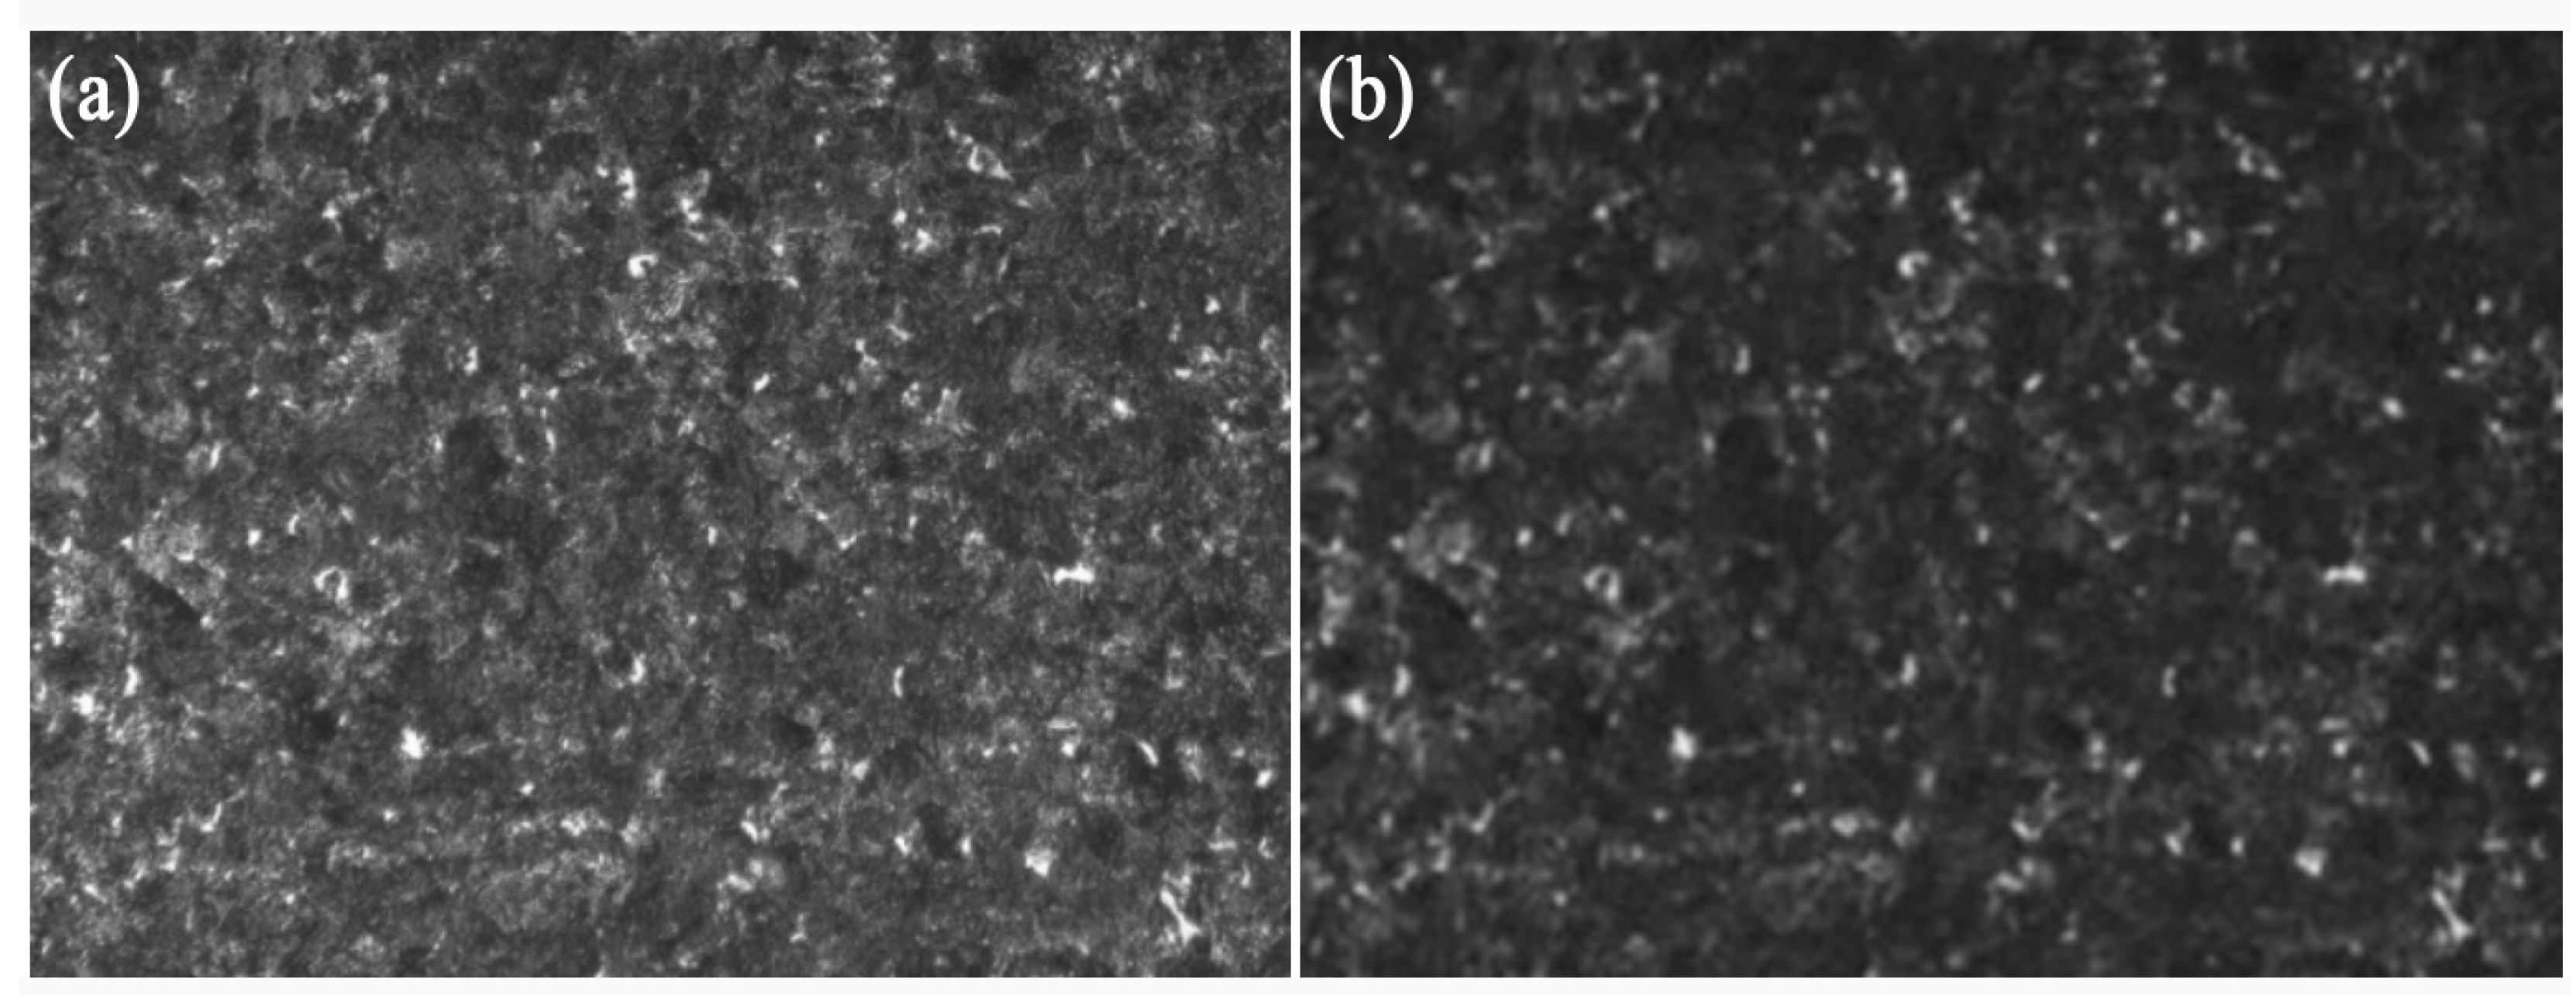
The loss function was used to evaluate the difference between the prediction result of the model and the actual situation. Different loss functions are used in different models. In general, the better the loss function, the more accurate the model predictions. The main microstructure of high-carbon steel is sorbite, the content of which is generally more than 50% and is more than 70% in most samples. Therefore, the proportion of sorbite in the metallographic image is extremely unbalanced with the proportion of the background. In the sample shown in Figure 1, the sorbite content (dark part) was about 97%. For the data set of this paper, the statistics of sample proportions with different sorbite contents are shown in Table 1. Samples with a sorbite content higher than 80% accounted for 56.5% of the total. In general, unbalanced samples can cause training models to focus on predicting pixels as dominant types, while “disregarding” the minority types, which negatively affects the model’s ability to generalize on test data. Therefore, it is necessary to use the appropriate loss function or its combination to deal with the imbalance of the sample. Table 1 shows the proportion of samples with different sorbite contents in the data set.
The detection of sorbite content is essentially a problem of a significant imbalance between positive and negative samples in a binary classification, and a large number of background pixels affect the segmentation accuracy of the model. Therefore, focal loss was selected as the semantic segmentation loss function in this paper. This function was originally proposed by He [18] to solve the model performance problems caused by the imbalance of data classes and the difference in classification difficulty in the image domain. Focal loss adds a parameter γ to the cross-entropy loss function and constructs an adjustment factor ( 1 p x ) γ to solve the problem of the sample imbalance. The calculation formula of the loss function is as follows:
F L p ( x ) = 1 p x γ l o g ( p ( x ) )
where the sample p ( x ) with accurate classification tends to 1, the regulation factor tends to 0; the sample 1 p x with inaccurate classification tends to 1, the regulation factor tends to 1. Compared with the cross-entropy loss function, focal loss does not change for inaccurately classified samples and decreases for accurately classified samples. Overall, it is equal to adding the weight of the sample with inaccurate classification to the loss function, p x . It also reflects the difficulty of classification. The greater the p ( x ) , the higher the confidence of classification, the more easily the representative sample is classified; the smaller the p ( x ) , the lower the confidence of classification, the lower the confidence of classification, and the more difficult it is to classify the representative sample. Therefore, focal loss is equivalent to increasing the weight of difficult samples in the loss function, so that the loss function tends to be difficult samples, which is helpful to improve the accuracy of difficult samples.
In addition, the problem of region size imbalance between the sample foreground and the background of the sorbite image can be handled by the Dice loss [19] function. Dice loss is a region-dependent loss, that is, the loss of the current pixel is not only related to the predicted value of the current pixel, but also related to the value of other pixel points. The specific loss function formula is:
D i c e   L o s s = 1 2 | X Y | X + | Y |
where X represents the target segmented image, Y represents the predicted segmented image, and the intersection form of Dice Loss can be understood as a mask operation. Therefore, regardless of the size of the image, the calculated loss of the fixed-size positive sample area is the same, and the supervision contribution to the network does not change with the size of the image. Dice Loss training tends to tap into foreground areas and thus adapts to the smaller foreground situation in this paper. Training loss, however, is prone to instability, especially against small targets. In addition, gradient saturation occurs in extreme cases. Therefore, considering the sample situation of sorbite content, this paper combines Dice Loss with focal loss.

3.3. Data Augmentation

Due to different sample preparation levels, corrosion depths, shooting equipment, illumination, and other factors, the sorbite metallographic images collected were very different. It was not possible to exhaust all the possibilities and obtain images that were representative enough. Therefore, data enhancement was needed to expand the distribution of data sources and features, improve the size and quality of the training data sets, and solve the problem of limited data. At the same time, data enhancement can also cope with the problem of multi-distributed data scenarios. Data augmentation typically [20] includes flipping, cropping, rotation, zooming, color transformation, noise injection, etc. In this project, considering the characteristics of sorbite, simple flipping, rotation, cropping, zooming, and color transformation could not only enhance the data but may also destroy the label information of the sample to a certain extent, bringing negative effects to the model learning. For this paper, an enhancement method based on noise injection was designed. In the training, a certain amount of data perturbation was added to the initial sample image, and the original pixel labels were not changed incorrectly so that the model could focus more on learning the difference between the sorbite pixel values and background pixel values, rather than just learning the pixel values of the sorbite. In this way, the model was able to ignore irrelevant factors in the training process to a certain extent and make more accurate judgments. The specific perturbation expression is as follows, where X i j represents the pixel value of the ith row and jth column of the sorbite sample (where R = r a n d a , a ):
X i j = X i j + R ,        0 < X i j + R < X t h r e s   and   X i j < X t h r e s X i j + R , X t h r e s < X i j + R < 255   and   X i j > X t h r e s
In the practical application process, let a = 10, and the samples before and after adding the noise injection enhancement mode are shown in Figure 6.

3.4. Training and Evaluation Indexes of the Model

In this paper, preprocessed sorbite images were used as data sets, and each data set was randomly divided into training data sets and test data sets in a 9:1 ratio. Training then took place with each training set in turn, and testing was conducted on the test set of all data sets separately. All models were based on the PyTorch framework, the programming language was Python, and the graphics card was NVIDIA GeForce RTX 3090. The model learning rate used in this paper was 0.0001, the batch size was 4, and the number of iteration rounds was 100.
In this paper, the accuracy of semantic segmentation was evaluated by pixel accuracy (PA), intersection over union (IoU), and mean square error (MSE). For a binary task, the following four situations may occur. TP (true positive) indicates that a sample is predicted to be a positive class with a positive class true label. FN (false negative) indicates that a sample is predicted as a negative class with a positive class true label. FP (false positive) indicates that a sample is predicted as a positive class with a negative class true label. TN (true negative) indicates that a sample is predicted as a negative class with a negative class true label.
Assuming that there are a total of n classes in the test data set, p i i indicating the number of classes predicted as class i in class i data, and p i j indicating the number of classes predicted as class j in class i data, PA is defined as the ratio of the number of correctly classified pixels to the total number of pixels, and the formula is as follows:
P A = i = 1 n p i i i = 1 n j = 1 n p i j
That is, pixel accuracy (PA) represents the percentage of the pixel value predicted correctly to the total pixel value, and the calculation formula is as follows:
P A = T P + T N T P + F P + F N + T N
Mean pixel accuracy (mPA) is averaged by summing the pixel accuracy of each category.
IoU is the most commonly used semantic segmentation evaluation standard, which is the ratio of the intersection of real and predicted labels to their union. IoU can better evaluate the performance of semantic segmentation methods. The calculation formula of IoU is as follows:
I o U = T P T P + F P + F N
The mean intersection over union ratio (MIoU) was averaged over the sum of the intersection over union for each category.
Mean absolute error (MAE) is a measure reflecting the degree of difference between the estimator and the estimated quantity, which was used to characterize the difference between the predicted proportional result and the true proportional result of the model. The MAE reflects the average distance that the predicted value deviates from the true value, that is,
M A E = i = 1 n 1 n f x i y i |

4. Results and Discussion

Researchers have conducted some research and exploration in improving the accuracy of the determination of sorbite content. Wuhan Iron & Steel Group [21] used SEM and OM to observe the microstructure in the same region under different magnifications, and the analysis results indicated that the so-called “pearlite” structure was a kind of etching morphology of the sorbite structure with different orientations on the cross-section of the metallographic sample surface. Zhejiang University of Technology [22] found that the etching condition has a significant influence on the display and identification of sorbite structure, and some of the bright white areas under the optical microscope may be local flat areas of sorbite structure, while some of the “pearlite” may also be local depressions resulting in a “magnified lamellar structure”, so it is unreliable to rely on light region and dark regions to determine the sorbite content. Liuzhou Steel Group [23] used digital image storage technology for the accurate detection of sorbite content. All these studies were carried out based on the traditional grayscale image, pearloid slice spacing, etc. The problem of fluctuations in the detection process and the need for manual intervention are still not well resolved. Therefore, the automatic detection of the sorbite content based on artificial intelligence is a focus of current research. Luo [1] established a library of high-carbon wire rod sorbite material for neural network learning, and successfully realized the intelligent identification of sorbite by using artificial intelligence and deep learning technology.
In this paper, DeepLabv3+ and U-Net++ semantic segmentation models were used, respectively. ResNet34 was used as the backbone network for training and verification, and the prediction of each pixel of the output sample image was judged to be correct or not. The evaluation results are shown in Table 2. It can be seen that the semantic segmentation model based on DeepLabv3+ improved the mPA by 0.7% and reduced the MAE by 10.7% compared with U-Net++ and obtained more accurate prediction results. This semantic segmentation model was also more refined compared to the classification model in Luo’s article. The visualization effect is shown in Figure 7. The white part in the figure is the part of the correct prediction by the model, and the red part is the part of the incorrect prediction by the model. The segmentation results show that the model had a good segmentation effect, and an MIoU of 74.89% indicates that the predicted results of the model were more accurate than the manually annotated boundary.
Subsequently, the DeepLabv3+ semantic segmentation recognition model was used to test the unlabeled sorbite metallographic images. For each sorbite metallographic image tested, the sorbite image and the length of a single pixel point of that image were input, then the recognition model output the sorbite content of the image. The output results were compared with the manually calibrated test results, and some of the test results are shown in Table 3. The test recognition deviations were almost all less than 5%, and the recognition results were very good.
At the same time, Luo [1] did not consider the imbalance of positive and negative distributions and foreground and background imbalance in sorbite samples, while this paper used loss function and its combination to deal with the imbalance problem, and the prediction results of different loss functions were also tested and analyzed. The three sets of results were based on DeepLabv3+, and the Backbone used was ResNet-34. The results are shown in Table 4. The model of the focal loss function alone predicts a mPA of 94.18% and a MAE of 4.46%, which demonstrates a good segmentation effect. The results of using the dice loss function alone were poor. After the combination of the two, the prediction results were optimized, and the mPA and MAE were improved to 94.28% and 4.17%, respectively. This fully illustrates that the focal loss + Dice loss combined loss function selected in this paper is correct and reasonable considering the imbalance of positive and negative distributions and the foreground and background imbalance in sorbite samples analyzed in 3.2. In this paper, the detection of sorbite content in a single image only took 10 s, which was 99.9% faster than that of 10 min using the manual cut-off method. On the premise of ensuring detection accuracy, the detection efficiency was significantly improved and the labor intensity was reduced.
Lou [1] standardized the sample preparation process without considering the diversity of data sources and feature distributions due to different sample preparation levels, corrosion depths, shooting equipment, illumination, and other factors. In this paper, a data augmentation was performed to expand the distribution of data sources and features, and the actual effects of the data augmentation were verified. The training and verification results of the data set before and after the perturbation added to the sample image were compared and analyzed. The data set was divided into three sub-datasets according to the different sample batches, and then the three sub-datasets were divided into training sets and test sets at a ratio of 9:1. The training set and test set of the first sub-dataset were written as Training set 1 and Test set 1, respectively, and so on for the others. Then training according to the respective training set followed by the testing of all test sets was conducted. In this project, the model prediction results of the original data and the model prediction results after adding perturbation were statistically analyzed, and the evaluation indexes were characterized by MAE, i.e., the absolute error between the sorbite content output by the model compared to the sample and the real sorbite content. The results are presented in Table 5 and Table 6. It can be seen that the results of the training and validation of the raw data had better prediction results for the autologous test dataset. However, the difference between the prediction results of the three test sets was reduced after the perturbation was added, indicating that the generalization ability and robustness of the model were improved after the perturbation was added.
The original sample images collected in this project were all 2048 × 1536, with a high resolution and large size. In general, large-size images contain more data information and reflect more features of the predicted object. However, using large-size images requires higher computing power, and if the characteristic size of the measured object is much smaller than the image size, using large-size images as the training set cannot achieve better results. In this project, considering the characteristic size of sorbite, we used a sliding window to divide each original image into sixteen 512 × 384 images, and then trained and tested the model. This operation can not only reduce the requirements for computing power and improve the efficiency of model training and prediction, but also evaluate the uniformity of the distribution of sorbite content in the whole image through the calculation of each small image. Specifically, after the model predicted the sorbite content of the 16 local areas cut from each image, the variance was calculated, and the standard deviation was used to evaluate the sample uniformity. The formula can be expressed as:
U n i f o r m i t y = i = 1 4 × 4 ( R i μ ) 2 4 × 4
where R i represents the ferrite content of the i th local region. Uniformity is the evaluation index of sample uniformity. The lower the value, the better the uniformity. Figure 8 shows that the experimental effect of uniformity evaluation can characterize the uniformity of the microstructure of the sample, so that the macroscopic performance of the original material can be inferred.

5. Conclusions

In this paper, DeepLabv3+ was selected as the semantic segmentation model, and ResNet-34 was used as the backbone network to establish an intelligent detection model of sorbite content based on deep learning. The metallographic images of high-carbon steel wire rods were manually labeled and cut as data sets. To solve the multi-distribution problem of the source and characteristics of the samples, this paper used the Dice loss and focal loss functions to design data perturbation processing to enhance the accuracy of the prediction results and the robustness of the model. Meanwhile, the uniformity of the samples was evaluated by separately predicting and analyzing the sorbite content in the slit region. The results show that the proposed method can realize the automatic statistics of sorbite content. The average pixel prediction accuracy was as high as 94.28%, and the average absolute error was only 4.17%. The composite application of the loss function and the enhancement of the data perturbation significantly improved the prediction accuracy and robust performance of the model. In this method, the detection of sorbite content in a single image only took 10 s, which was 99% faster than that of 10 min using the manual cut-off method. On the premise of ensuring detection accuracy, the detection efficiency was significantly improved and the labor intensity was reduced.

Author Contributions

Conceptualization, Z.Y. and X.Z.; methodology, Z.Y. and X.Z.; software, X.Z.; validation, G.H., F.X., and Q.Y.; investigation, X.Z.; resources, G.H., X.C., and Q.Y.; data curation, X.Z.; writing—original draft preparation, X.Z.; writing—review and editing, G.H., L.Q., X.C., and F.X.; supervision, Q.Y. and L.Q.; project administration, Z.Y.; funding acquisition, Z.Y. and X.Z.; All authors have read and agreed to the published version of the manuscript.

Funding

This project was supported by the Science and Technology Program of Jiangsu Provincial Administration for Market Regulation (grant no. KJ204115, KJ21125122, KJ2022062).

Data Availability Statement

The data presented in this study are available on request from the corresponding author.

Acknowledgments

Thanks to Baodong Feng, Xuebin Xu, Bo Liu, Linning Qian, and Jun Wan for the help with data calibration.

Conflicts of Interest

The authors declare no conflict of interest.

References

  1. Luo, X.Z.; Xiao, M.D.; Zhang, Z.Y.; Li, F.Q.; Zhu, X.R. Recognition discussion about sorbite in high-carbon wire rod steel based on artificial intelligence. Phys. Exam. Test. 2021, 39, 34–37. [Google Scholar] [CrossRef]
  2. YB/T 169-2014; Metallographic Test Method of Sorbite in High Carbon Steel Wire Rod. National Steel Standardization Technical Committee: Beijing, China, 2014.
  3. Wang, K.J.; Liu, H.Y. Categories and Morphological Features of Metallographic Microstructure in High Carbon Stelmor Wire Rods. Phys. Exam. Test. 2013, 31, 1–5. [Google Scholar] [CrossRef]
  4. Ren, Z.G.; Ren, G.Q.; Wu, D.H. Deep Learning Based Feature Selection Algorithm for Small Targets Based on mRMR. Micromachines 2022, 13, 1765. [Google Scholar] [CrossRef] [PubMed]
  5. Vaiyapuri, T.; Srinivasan, S.; Sikkandarn, M.Y.; Balaji, T.S.; Kadry, S.; Meqdad, M.N.; Nam, Y.Y. Intelligent Deep Learning Based Multi-Retinal Disease Diagnosis and Classification Framework. Comput. Mater. Contin. 2022, 73, 5543–5557. [Google Scholar] [CrossRef]
  6. Chowdhury, A.; Kautz, E.; Yener, B.; Lewis, D. Image driven machine learning methods for microstructure recognition. Comput. Mater. Sci. 2016, 123, 176–187. [Google Scholar] [CrossRef]
  7. Azimi, S.M.; Britz, D.; Engstler, M.; Fritz, M.; Mücklich, F. Advanced steel microstructural classification by deep learning methods. Sci. Rep. 2018, 8, 2128. [Google Scholar] [CrossRef] [PubMed]
  8. Park, H.; Öztürk, A. Machine Learning Approach on Steel Microstructure Classification. In Proceedings of the Europe-Korea Conference on Science and Technology, Vienna, Austria, 15–18 July 2021; pp. 13–23. [Google Scholar] [CrossRef]
  9. He, K.; Zhang, X.; Ren, S.; Sun, J. Deep Residual Learning for Image Recognition. In Proceedings of the IEEE Conference on Computer Vision and Pattern Recognition, Las Vegas, NV, USA, 27–30 June 2016; pp. 770–778. [Google Scholar] [CrossRef]
  10. Chen, L.C.; Zhu, Y.; Papandreou, G.; Schroff, F.; Adam, H. Encoder-Decoder with Atrous Separable Convolution for Semantic Image Segmentation. In Proceedings of the ECCV 2018, Munich, Germany, 8–14 September 2018; Springer: Cham, Switzerland, 2018; pp. 833–851. [Google Scholar] [CrossRef]
  11. Zhou, Z.W.; Rahman, S.M.M.; Tajbakhsh, N.; Liang, J.M. UNet++: A Nested U-Net Architecture for Medical Image Segmentation. In Proceedings of the DLMIA ML-CDS, Granada, Spain, 20 September 2018; Springer: Cham, Switzerland, 2018. [Google Scholar] [CrossRef]
  12. Huo, Y.; Li, X.; Tu, B. Image Measurement of Crystal Size Growth during Cooling Crystallization Using High-Speed Imaging and a U-Net Network. Crystals 2022, 12, 1690. [Google Scholar] [CrossRef]
  13. Li, Z.Z.; Yin, H.; Zuo, J.K.; Sun, Y.F. Ship Detection Model Based on UNet++ Network and Multiple Side-Output Fusion Strategy. Comput. Eng. 2022, 48, 276–283. [Google Scholar]
  14. Lv, B.L.; Li, Z.F.; Xi, Z.H.; Yao, Y.M.; Ji, J.J. Component Analysis of Coal Rock Microscopic Image Based on UNet++. Comput. Digit. Eng. 2022, 50, 389–393, 404. [Google Scholar]
  15. Liu, R.; Tao, F.; Liu, X.; Na, J.; Leng, H.; Wu, J.; Zhou, T. RAANet: A Residual ASPP with Attention Framework for Semantic Segmentation of High-Resolution Remote Sensing Images. Remote Sens. 2022, 14, 3109. [Google Scholar] [CrossRef]
  16. Chen, L.C.; Papandreou, G.; Kokkinos, I.; Murphy, K.; Yuille, A.L. DeepLab: Semantic Image Segmentation with Deep Convolutional Nets, Atrous Convolution, and Fully Connected CRFs. IEEE Trans. Pattern Anal. Mach. Intell. 2018, 40, 834–848. [Google Scholar] [PubMed]
  17. Chen, L.C.; Papandreou, G.; Schroff, F.; Adam, H. Rethinking Atrous Convolution for Semantic Image Segmentation. arXiv 2017, arXiv:1706.05587. [Google Scholar]
  18. Lin, T.-Y.; Goyal, P.; Girshick, R.; He, K.; Dollar, P. Focal Loss for Dense Object Detection. In Proceedings of the 2017 IEEE International Conference on Computer Vision (ICCV), Venice, Italy, 22–29 October 2017; pp. 2999–3007. [Google Scholar]
  19. Li, X.; Sun, X.; Meng, Y.; Liang, J.; Wu, F.; Li, J. Dice Loss for Data-Imbalanced NLP Tasks. In Proceedings of the Meeting of the Association for Computational Linguistics, Online, 5–10 July 2020; Association for Computational Linguistics: Toronto, ON, Canada, 2020. [Google Scholar]
  20. Shorten, C.; Khoshgoftaar, T.M. A survey on image data augmentation for deep learning. J. Big Data 2019, 6, 60. [Google Scholar]
  21. Sun, Y.Q.; Chen, X.Y.; Zhang, P.; Zhou, Y. Analysis and discussion on the sorbite volume fraction measurement method of 72A steel wire rod. Phys. Exam. Test. 2015, 33, 25–28. [Google Scholar] [CrossRef]
  22. Cai, W.; Zheng, J.W.; Qiao, L.; Qiang, L.Q. Indentification on Sorbite Structure in 82A High Carbon Steel Wire. Spec. Steel 2010, 31, 59–62. [Google Scholar] [CrossRef]
  23. Zhao, X.P.; Liu, Z.P.; Xiao, J.; Wu, H.L. Application of Digital Image Storage Technology in the Determination of Sorbite Content in High Carbon Wire Rod. Liugang Sci. Technol. 2017, 4, 42–45. [Google Scholar]
Figure 1. Example of sorbite content labeling. (a) Original image; (b) Labeling image.
Metals 13 00990 g001
Figure 2. Schematic diagram of the U-Net++ network structure [11], with permission from Springer, 2023.
Metals 13 00990 g002
Figure 3. Schematic diagram of the U-Net++ skip connection results [11], with permission from Springer, 2023.
Metals 13 00990 g003
Figure 4. Schematic diagram of the DeepLabv3+ network structure [10], with permission from Springer, 2023.
Metals 13 00990 g004
Figure 5. Schematic diagram of the atrous convolution receptive field.
Metals 13 00990 g005
Figure 6. Comparison of the effects before and after sample enhancement. (a) Original image; (b) Image after noise injection.
Metals 13 00990 g006
Figure 7. Schematic diagram of the sorbite sample segmentation effect.
Metals 13 00990 g007
Figure 8. Effect of sample uniformity analysis.
Metals 13 00990 g008
Table 1. Proportions of samples with different sorbite contents in the data set.
Sorbite Content/%[0–50)[50–60)[60–70)[70–80)[80–90)(≥90)
Sample Proportion/%04.712.226.638.318.2
Table 2. Comparison of the test results of different frames.
Seg_ModelBackbonemPAMIoUMAEEpoch Time(s)
DeepLabv3+ResNet3494.28%74.89%4.179
U-Net++ResNet3493.58%73.24%4.689
Table 3. Part of the test results of unlabeled metallographic images.
No.PredictionTruthMAE
181.1885.694.51
285.7985.430.36
387.1186.620.49
490.7188.991.71
591.5889.322.26
692.3590.292.06
792.0890.361.72
890.0589.630.42
990.1187.982.13
1090.6788.701.96
1188.3186.571.73
1287.6585.891.75
1385.0689.954.88
1491.2791.270.00
1590.3487.143.20
Table 4. Training results of the different loss schemes.
LossmPAMIoUMAEEpoch Time(s)
Focal Loss + Dice Loss94.28%74.89%4.179
Focal Loss94.18%73.18%4.469
Dice Loss71.01%52.76%21.899
Table 5. Prediction results of the original model.
Training Set\Test SetTest Set 1Test Set 2Test Set 3
Training set 13.363.844.18
Training set 27.405.778.09
Training set 38.569.194.43
Table 6. Model prediction results after adding perturbation.
Training Set\Test SetTest Set 1Test Set 2Test Set 3
Training set 13.473.793.51
Training set 26.655.507.19
Training set 37.828.024.12
Disclaimer/Publisher’s Note: The statements, opinions and data contained in all publications are solely those of the individual author(s) and contributor(s) and not of MDPI and/or the editor(s). MDPI and/or the editor(s) disclaim responsibility for any injury to people or property resulting from any ideas, methods, instructions or products referred to in the content.

