Article

Three-Dimension Crack Propagation Behavior of Conical-Cylindrical Shell

School of Mechanical Engineering, Jiangsu University of Science and Technology, Zhenjiang 212003, China
*
Author to whom correspondence should be addressed.
Metals 2023, 13(4), 698; https://doi.org/10.3390/met13040698
Submission received: 16 February 2023 / Revised: 24 March 2023 / Accepted: 28 March 2023 / Published: 3 April 2023
(This article belongs to the Special Issue Studies on Fatigue Behavior of Engineering Material and Structures)

Abstract

:
The conical-cylindrical shell is prone to stress concentration in the convex cone position under the action of deep-sea pressures. This results in unidirectional or bidirectional positive tensile stresses on the surfaces of the shell. The conical-cylindrical shell is a large, welded structure. Welding residual stress was generated at the cone-column joint position, resulting in high-stress concentration at this location. Under both the residual stress of welding and seawater pressure, cracks easily form and propagate on the shell weld toe, leading to fatigue damage and even structural failure. In this paper, based on the seawater’s alternating load and the residual stress of welding, the three-dimensional crack propagation process was studied for the submarine conical-cylindrical shell. The effects of crack depth and shape ratio on crack propagation trend and fatigue life were analyzed. The results can provide references for predicting the crack propagation trend, assessing the remaining life and evaluating the structural safety of the submarine conical-cylindrical shell.

1. Introduction

Conical-cylindrical shells are a transition structure widely used in the structural design of submarine pressure hulls, as shown in Figure 1. When connecting two pressure hulls with different diameters, the abrupt change in longitudinal geometric shape requires a cone transition, and the intersection of cone and cylinder must show a sudden change of high longitudinal stress. Due to deep-sea pressures, it is easy to generate stress at the conical column position. Therefore, the inner and outer surfaces of the submarine cone column junction are subject to unidirectional or bidirectional normal tensile stress. At the same time, the cone-column combined shell is a large, welded structure, and welding residual stress is generated, resulting in a high stress concentration at the cone-column joint. Furthermore, during the welding process, welding defects will inevitably occur, resulting in cracks at the cone column junction.
The fundamental reason for fatigue damage to submarine pressure structures is that submarines bear alternating loads during diving and floating, especially tensile alternating loads. The tensile stress is caused by the structural characteristics of the submarine itself and the welding process. The convex conical column combined shell of the submarine conforms to the above two characteristics, which makes it the most dangerous place regarding fatigue failure. Many articles and model tests on submarine fatigue have also confirmed that welding spots are the most prone to failure. Huang et al. [1,2] simulated the stress characteristics of the welded joint zone of a conical column of submarine structure by testing compressive, bending, and combined stresses under the axial loading of a welded angle plate. They studied the fatigue behavior of cracks at the weld of prefabricated parts under the fatigue load characterized by compressive, bending, and combined stresses. The surface-crack fatigue life of a submarine cone-column combined shell welding toe was calculated by using a stress intensity factor model modified for compressive stress. Through studying the thermal buckling of fractures in functionally gradient material plates, Van et al. [3] demonstrated that the differing static stability responses of plates to thermal loads is affected by the crack length and the thickness of the cracked plate. Shi et al. [4] analyzed the stress and welding residual stress of submarine structures, and the fatigue life of submarine structures was calculated by the local stress and strain method. By combining the finite element method with phase-field theory, Doan et al. [5,6] studied the influence of some materials and geometric parameters on the free vibration response of the cracked plate to simulate the fracture in a partial plate thickness. Li et al. [7] used the “MSC. Fatigue” analysis software to estimate the fatigue life of conical and cylindrical pressure shells. Hou [8] calculated the crack propagation rate by using the fatigue analysis method of fracture mechanics, and estimated fatigue life using the direct integration method and the successive iteration method. Zhang et al. [9] combined the crack propagation model with the calculation method of stress intensity, to predict the crack propagation behavior in the submarine conical column combined shell under several typical load spectra.
Therefore, the impact of crack defects on a submarine pressure structure should be considered both during the design stage and during service. It is necessary to consider not only the changing external seawater pressure that the submarine pressure structure is subjected to in the process of use, but also the possibility of crack propagation to fractures under welding residual stress. In this paper, the cone-column combined model of submarine pressure structures is selected as the research object. Based on the alternating sea water load, and considering both the welding residual stress and the stress concentration at the conical column caused by the sea water pressure, the three-dimensional crack propagation behavior of the cone-column joint model of submarines is studied.

2. Three-Dimensional Crack Propagation Model for Conical-Cylindrical Shells

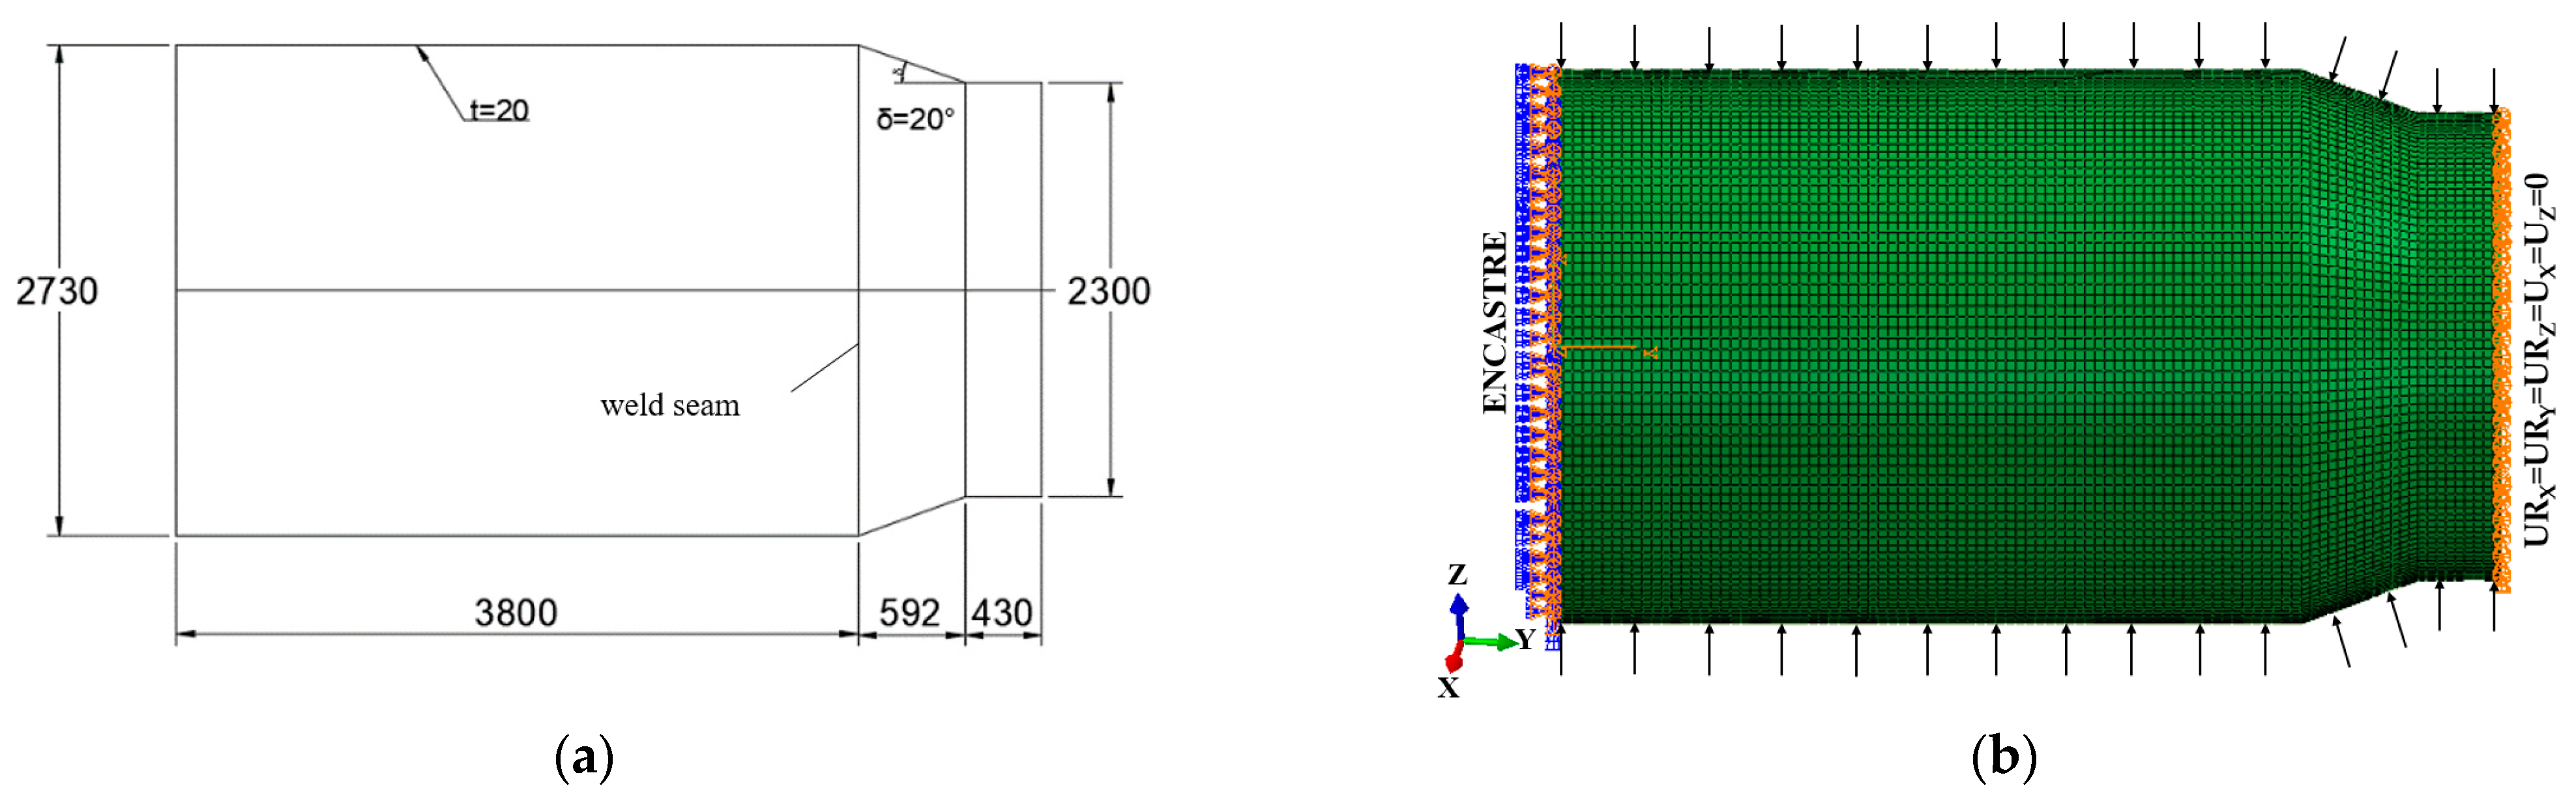
2.1. Finite-Element Modeling

This paper mainly studies the cracks at the convex cone weld of submarine conical-cylindrical shells. The shell material was 921A steel at a depth of 300 m. The specific geometric parameters and material performance parameters are shown in Table 1. The simplified numerical model is shown in Figure 2a. Figure 2b is a finite element analysis model of a conical-cylindrical shell. The boundary condition is that one end is completely constrained (Ux = Uy = Uz = 0, URx = URy = URz = 0) and the other end maintains axial motion (Ux = Uz = 0, URx = URy = URz = 0) [10]. Where, x, y, z represent the axis direction, R represents the rotation direction and U is displacement. The conical-cylindrical shell model was obtained with 62964 nodes and 46746 C3D8R solid element mesh models. The external surface of the model is subjected to uniformly distributed external pressure, as shown in Figure 2b.
When the submarine conical-cylindrical shell works at a 300 m depth underwater, the outer surface bears the uniformly distributed external pressure of seawater. The external load to be borne by the shell model was calculated according to the pressure formula of the German Lloyd’s Register of Shipping specification [11]. The formula is as follows:
P = 0.0101 × d
where, P is the external pressure of seawater, and d is the depth of submergence.

2.2. Welding Residual Stress

The submarine conical-cylindrical shell is a welded construction. Besides the effect of the welding structural form, it is also affected by the welding process and the original stress state of the welding body, which makes surface cracks easy to initiate.
Welding residual stress can be divided into two types according to the direction of stress action. One is longitudinal residual stress, whose direction of stress action is parallel to the weld. The other is lateral residual stress, with a direction of stress action perpendicular to the weld [2]. When the conical-cylindrical shell was cooled after welding, the longitudinal contraction of the weld was along the whole circumferential contraction. In order to achieve balance in the whole structure, the conical shell and the column shell produces a tensile effect on the weld, so the longitudinal contraction of the shell weld produces transverse residual stress.
According to the defect evaluation specification [12,13], the welding residual stress at the conical-cylindrical shell surface was evaluated. According to the distribution law of residual stress given by Ikushima [14], the distribution of welding residual stress perpendicular to the direction of the shell weld along the thickness of shell was regarded as a linear distribution. The distribution along the wall with thickness t can be expressed as (where, x = 0 is the outer surface of the weld):
σ R ( x ) = σ R ( 1 4 x / t ) ( 0 x t / 2 ) σ R ( x ) = σ R ( 4 x / t 3 ) ( t / 2 x t )
where σR is the maximum welding residual stress, which is 0.3 σs.
According to formula (2), the welding residual stress on the weld surface is tensile stress, and the maximum tensile stress is 0.3σs. The tensile stress decreases linearly along the thickness of the shell until it becomes 0 at 1/4 of the thickness. Then, it becomes compressive stress and gradually increases. The compressive stress reaches its maximum value of 0.3σs at 1/2 of the thickness of the shell. The variation of welding residual stress along the direction of shell thickness is shown in Figure 3. The numerical value of the welding residual stress was input into the interface specified by FRANC3D and distributed on the crack surface by software (FRANC3D, Version 8.0, FAC Corporation, Menlo Park, CA, USA).

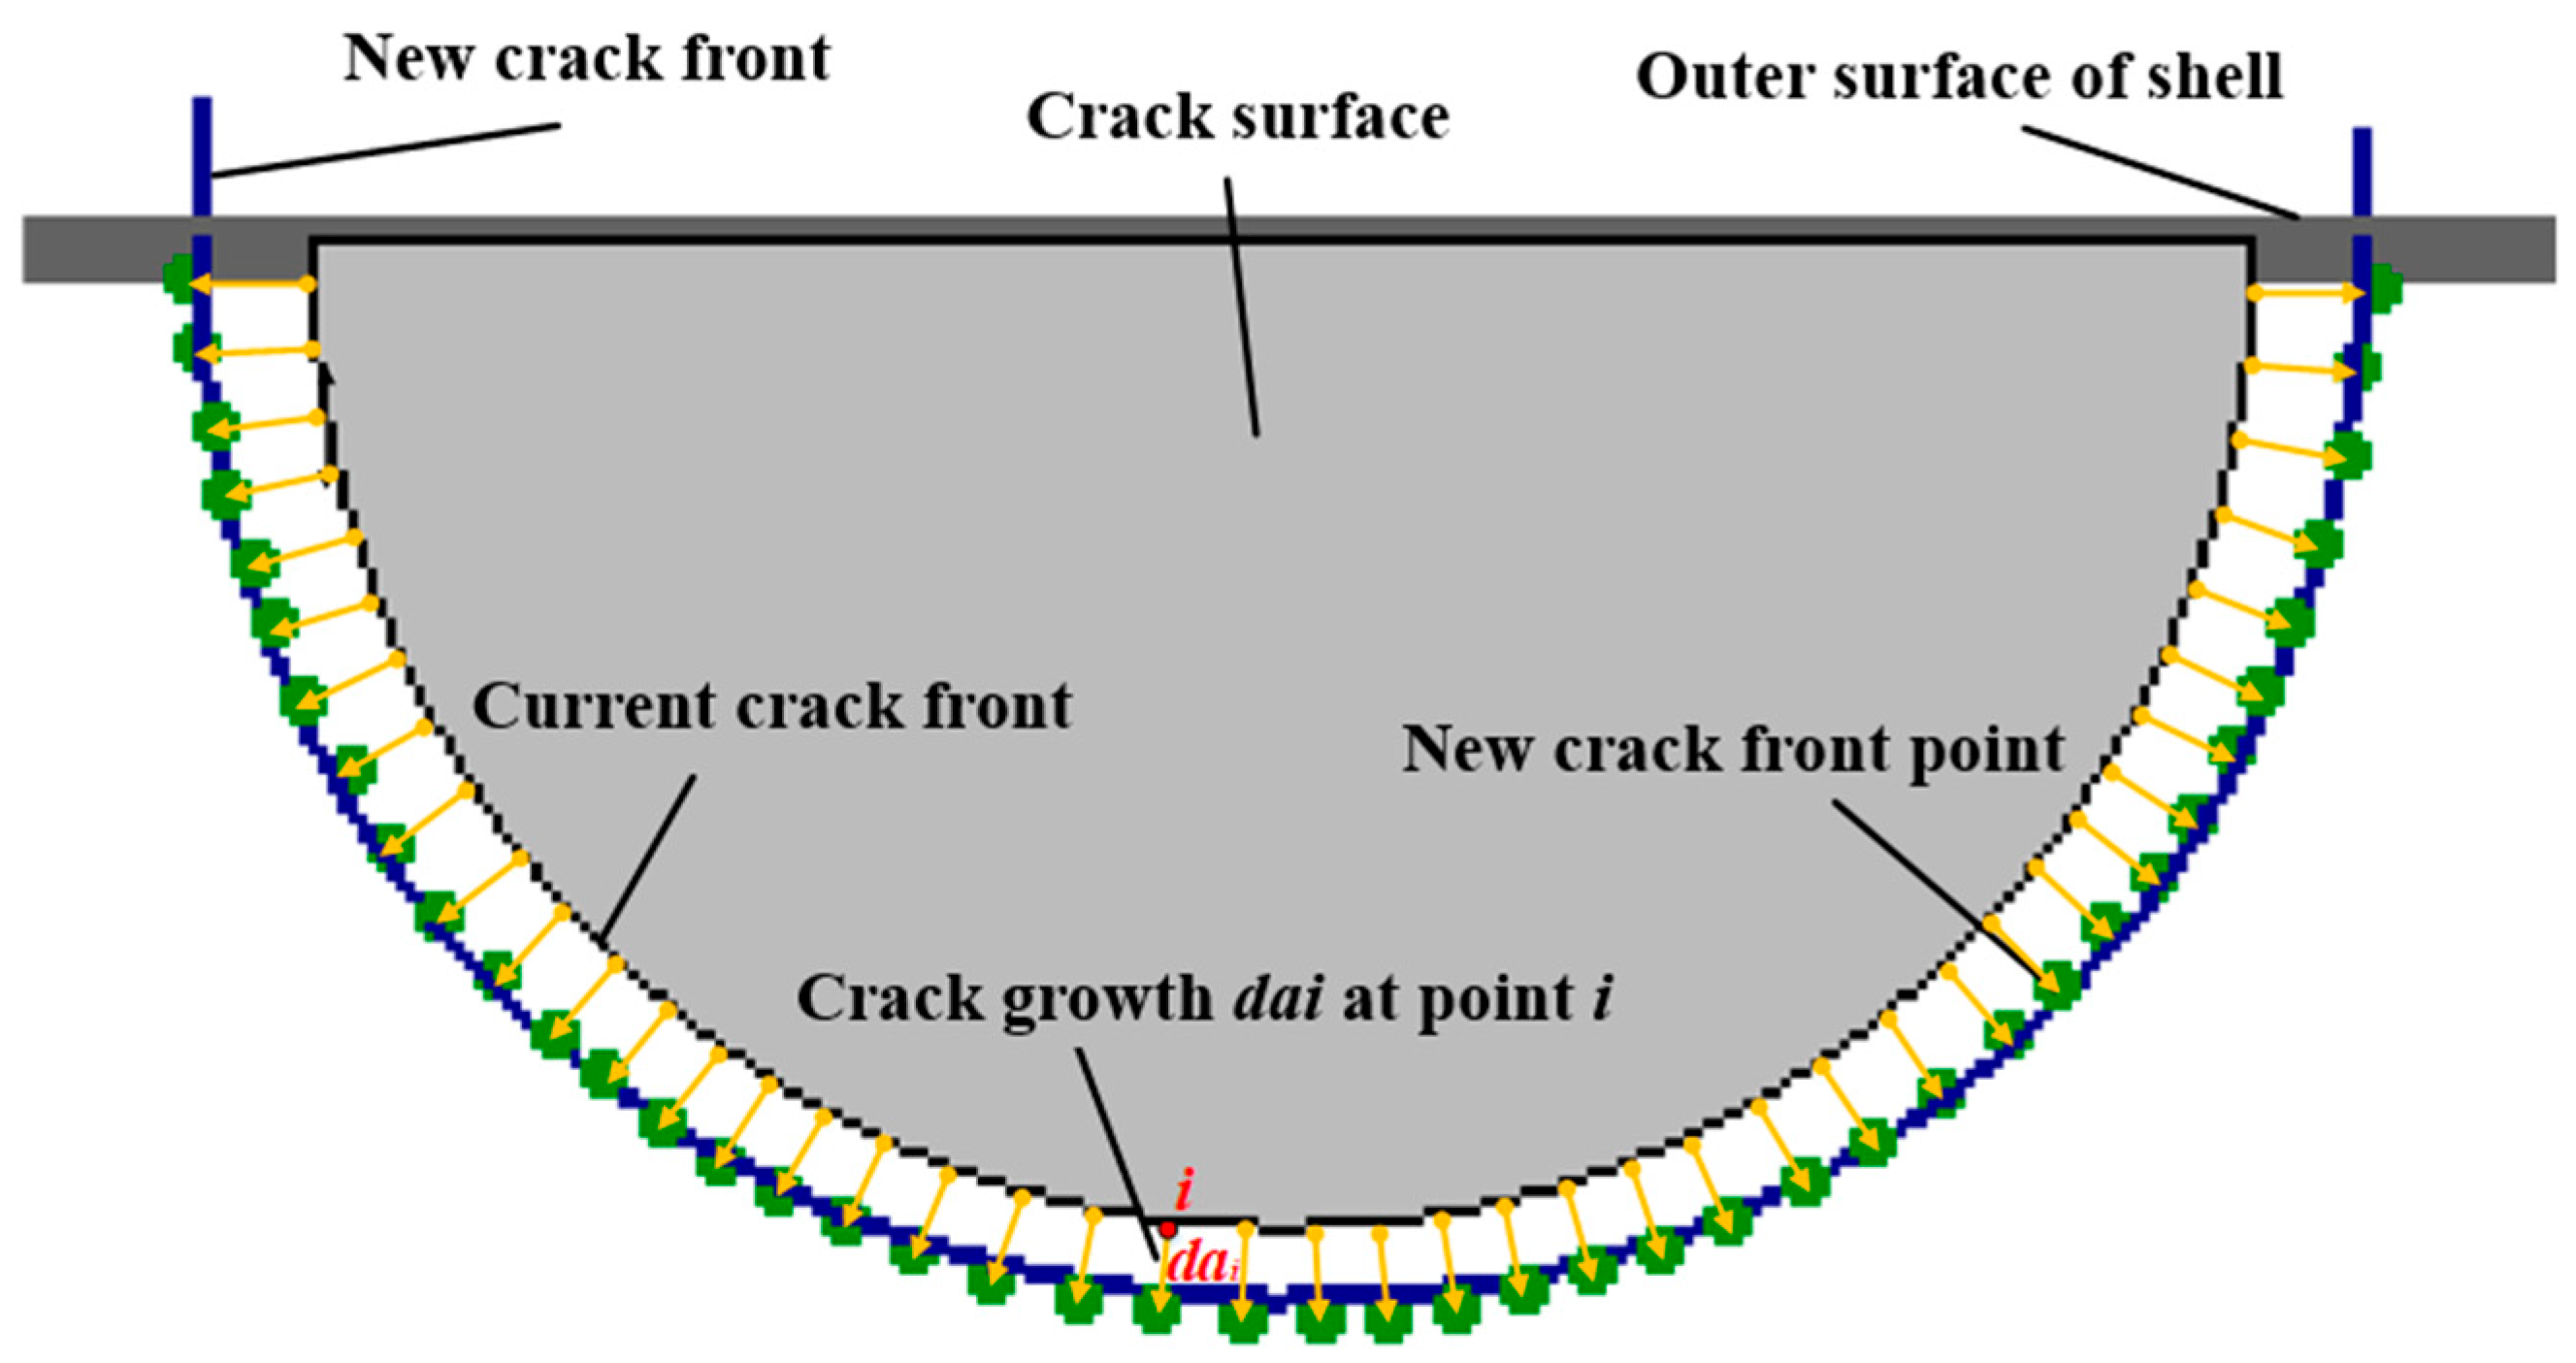
2.3. Surface Crack Propagation Model

Guo et al. [15,16] proposed the out of plane constraint factor TZ, and by introducing the concept of out of plane stress constraint factor TZ, the three-dimensional fracture study was transformed into a two-dimensional plane problem under triaxial stress constraints for analysis. Combined with the two-dimensional crack-tip field solution, the analytical formulas of the linear elastic and elastic-plastic crack-tip stress field represented by the three-dimensional three parameters K T T Z and J Q T T Z were derived, respectively, which extend the crack-tip field solution to the cracks under the general stress state, and also extend the fatigue fracture theory from two-dimensional to three-dimensional.
She et al.’s [17] analysis of the out-of-plane stress constraint factor (TZ) of several common cracks led to the development of the equivalent thickness concept based on out-of-plane constraint effects. Under a particular thickness, the TZ distribution at multiple crack front edge positions was quite similar, with the TZ distribution on the middle plane of a through straight crack plate. When the TZ at two points is the same, it can be considered that the thickness of point P on surface crack Beq is equivalent to B. The method for solving the constraint effect on the penetrating straight crack was extended to the non-penetrating curve crack. The schematic diagram of the equivalent thickness of point P was shown in Figure 4, where the equivalent thickness Beq,i can be obtained as follows:
B eq , i = c [ 1 φ u , i 6 t ]
φ u , i = π / 2 φ i π / 2 , 0 < φ i < π / 2
where i represents the crack front point, c is the semi-major axis of the ellipse, φi is the angle of each point at the crack front, Y is the crack shape ratio, and Beq,i is the equivalent thickness at each point of the crack.
The global constraint factor αg based on the equivalent thickness can be written as:
α g = 1 + 0.2088 ( r po / B eq ) 0.5 + 1.5046 ( r po / B eq ) 1 2 v + 0.2088 ( r po / B eq ) 0.5 + 1.5046 ( r po / B eq )
r po = π 8 K max σ flow 2
where rpo is the plastic zone size at the crack tip, v is Poisson’s ratio, σflow is the flow stress of the material, and Kmax is the maximum stress intensity factor.
The simulation of three-dimensional crack propagation on the surface of a conical-cylindrical shell can be seen as a process of advancing and fitting point i at the front edge of the crack. In the finite element analysis software, the propagation distance dai at the crack front point i is determined by the stress intensity factor at the crack front point i and the user-defined propagation distance in a certain proportion; then, the addition of dai and the crack length at the current point can generate a new crack front point. The line of new leading-edge points fitted under each step will be the new crack front after the expansion step, as shown in Figure 5. By using the finite element method, the stress intensity factor at the crack front i of the shell surface can be obtained.
According to formulas (5)–(8), the opening stress ratio Kopen/Kmax of the crack front of the conical-cylindrical shell can be obtained [18].
K open K max = 1 η 3
η = ( 1 R 2 ) 2 ( 1 + 10.34 R 2 ) ( 1 + 1.67 R 1.61 + 1 0.15 π 2 α g ) 4.6
where Kmax is the maximum stress intensity factor, Kopen is the opening stress intensity factor, Kopen/Kmax is the crack surface opening stress ratio considering the closure effect, and R is the loading stress ratio.
The effective stress intensity factor amplitude, ∆Keff,i, at the surface crack leading edge point, i, can be solved according to formula (8) [19]. The crack propagation model of the steel 921A conical-cylindrical shell is as follows:
Δ K eff = K max K open = Δ K ( 1 K open / K max 1 R )
d a i d N = 1.31 × e 11 Δ K e f f , i 2.44

3. Calculating the Stress Intensity Factor

3.1. Theoretical Background

In this paper, the M-integral method provided by Franc3D software (Version 8.0, FAC Corporation, Menlo Park, CA, USA) was used to solve the stress intensity factor. Knowles [20] first proposed the concept of M-integral. Budiansky [21] explained the relationship between the energy release rate and the M-integral. Freund [22] applied the M-integral method to the plane elastic crack problem to solve the stress intensity factor. Herrmann [23] concluded that the description of the energy release rate by the M-integral method is more reasonable than that by the J-integral. Ai et al. [24] validated the accuracy of the M-integral method in Franc3D software to solve the stress intensity factor of the semi-elliptical surface crack on a plate, and the relative error with the theoretical solution was within 4%.
Consider an elastic, solid plane which is in a state of two-dimensional deformation. The displacement vector ui depends only on the Cartesian coordinates x1 and x2. For any simple curve C in the deformed plane, the value of M is defined by the line integral
M = C ( W x i n i T k u k , i x i ) d l i , k = 1 , 2
W = ε i j σ i j d ε i j
where C is the closed curve around the crack tip, W is elastic energy density, ni is the unit outside normal of curve C, and Tk is the surface force acting on the inside of the curve.
The property of the path-independence of M in (11) follows directly from conservation law. Therefore, M is a path-independent line integral. If the region enclosed by contour C contains a cavity, then the value of M for this contour is nonzero, in general.
For three-dimensional problems, the M-integral expression can be generalized as:
M = S W x i n i T k u k , i x i 1 2 T i u i d l i , k = 1 , 2 , 3
The relationship between M-integral and stress intensity factor was as follows:
M ( 1 , 2 ) = 2 ( 1 v 2 ) E K Ι ( 1 ) K Ι ( 2 ) + 2 ( 1 v 2 ) E K Ι Ι ( 1 ) K Ι Ι ( 2 ) + 2 ( 1 + v ) E K Ι Ι Ι ( 1 ) K Ι Ι Ι ( 2 )
In this formula, KI, KII, and KIII represent the stress intensity factors of the opening type, sliding type, and tearing type, respectively.

3.2. Introducing Crack

In engineering practice, surface cracks were generally described as semi-elliptic cracks. The principal stress of the submarine pressure hull is compressed in nature, but at the welding point of the convex conical-cylindrical shell, due to the change of geometric shape, the longitudinal curvature at this point has a sudden change. The hydrostatic pressure will cause a bending moment here, which presents a combination of compressive and bending forces. The bending moment will cause bending stress, causing longitudinal tensile stress on the outer surface.
The welding residual stress at the convex cone is greater than that at the concave cone, so the convex cone is more likely to have fatigue fractures under cyclical loads. Therefore, the convex cone position was selected as the research object, and it was believed that the crack was initially generated on the outer surface, and then extended to the inner surface. In this paper, a semi-elliptical surface crack was introduced into the convex cone toe of the submarine conical-cylindrical shell. The crack location was shown in Figure 6.
The model of a conical-cylindrical shell with cracks was established. The stress intensity factor was calculated using the M-integral method. Reference [25] details the influence of grid parameters of 20-node and 12-node singular elements. The results show that the 20-node singular element finite element model was stable and reliable. The stress intensity factor calculated by the model was independent of the grid state in the region near the crack tip, and stable results can be obtained in numerical analysis. In this paper, the 20-node singular element was used around the crack front, the crack tip was divided into three rings of elements, and it was symmetrically distributed to reduce the dispersion error.

3.3. Stress Intensity Factors under Different Initial Cracks

In this paper, several groups of stress intensity factors with different crack depths and shape ratios were calculated. The crack size and calculation results were shown in Table 2. The calculation results of KI were much larger than that of KII and KIII, so the surface cracks there are mainly opening-type cracks. Compared with the type I stress intensity factors, the effects of type II and III stress intensity factors are small, so the following is mainly to discuss the type I stress intensity factors.
The shape of the semi-elliptical was affected by shape ratio a/c. The smaller the value of a/c, the flatter and longer the crack surface. The larger the value of a/c, the closer the crack surface is to the semicircle. The variation curves of the maximum value of crack KI at different depths under the same crack shape ratio were compared, as shown in Figure 7. When the depth is constant, the larger the a/c value is, the smaller the crack length direction size is, and the smaller the stress intensity factor is. When a/c gradually approaches 1, the decreasing trend of the stress intensity factor tends to be flat. When the initial crack shape ratio is constant, the stress intensity factor increases while the crack depth increases.

4. Crack Propagation Results and Analysis

4.1. Initial Crack Shape Ratio’s Impact on Crack Propagation

The shape of the crack surface is related to the shape ratio. Crack shape ratio Y is the ratio of crack depth a to the semi-major axis c. The smaller Y is, the longer the semi-elliptical crack. Several groups of initial cracks of different shapes with an initial depth of 1 mm and a shape ratio, Y0, of 0.2, 0.4, 0.6, 0.8, and 1 were added to the weld position of the conical-cylindrical shell for crack propagation analysis.
When the initial crack extends to 0.2 times the shell thickness along the depth direction, the critical size is reached, that is, ac = 4 mm, and the crack stops growing. The shape ratio under each crack propagation step in the FRANC3D software is taken as the ordinate, and the ratio between crack depth and critical size under each crack propagation step is set as the abscissa. The variation trend of shape ratios could be obtained, as shown in Figure 8. According to the results of each step from the initial crack to the critical size, the shape changes of the crack front under each step are summarized. Figure 9 is a schematic diagram of crack shape evolution with an initial crack depth of 1mm and a shape ratio of 0.4. The green is the initial crack shape, and the black is the shape when the crack depth expands to 1.97 mm and 2.93 mm, respectively. The red is the final shape, when the crack depth is 4 mm and the propagation stops, that is, the failure depth of the conical-cylindrical shell.
It can be seen from Figure 8 that when Y0 is between 0.2 and 0.6, the crack shape ratio increases continuously during the growth process, indicating that the crack propagates rapidly along the depth direction of the shell, and then tends to become flat. When Y0 is 0.8, the crack propagation trend is relatively gentle. When Y0 is 1, the transverse development rate of the crack is higher than the depth direction. When the three-dimensional crack propagates to the critical size of the submarine cone-column joint model, the crack shape ratio is stable at about 0.85.
Figure 10 shows the a-N curve of crack propagation under different shape ratios, whose slope can also reflect the crack propagation velocity along the depth direction. The fatigue life of the conical-cylindrical shell is calculated by combining the data of crack propagation results and the relevant fatigue parameters. The relevant numerical results are shown in Table 3.
It can be seen in Table 3 that when the initial crack depth is the same, the fatigue life of conical-cylindrical shell is positively correlated with the change of crack shape ratio. The pressure shell fatigue life is about 187,018 times when Y0 is 0.2, and 429,121 times when Y0 is 1, which is 2.2 times longer than that when Y0 is 0.2 and 1.09 times longer than that when Y0 = 0.8. Therefore, when the crack has the same initial depth, cracks with a smaller shape ratio have a longer crack surface, and the greater the influence on the fatigue life of the conical-cylindrical shell.

4.2. Initial Crack Depth’s Impact on Crack Propagation

Several groups of initial cracks of different shapes with an initial shape ratio of 1 and a depth, a0, of 0.3, 0.5, 0.8, 1, and 2mm are added to the weld position of the conical-cylindrical shell for crack propagation analysis. According to the crack propagation results in FRANC3D, the shape ratio variation trend of each crack propagation step is obtained, as shown in Figure 11. According to the results of each step from the initial crack to the critical size, the shape changes of the crack front under each step are summarized. Figure 12 is a schematic diagram of crack shape evolution, with an initial shape ratio of 1 and a depth of 1 mm, where the green is the initial crack shape, and the black is the shape when the crack depth expands to 2.07 mm and 2.92 mm, respectively. The red is the final shape when the crack propagates to the failure depth of the conical-cylindrical shell.
Figure 11 shows that when the initial cracks of different sizes, Y0 = 1, expands at the cone-column junction, the shape ratio decreases continuously and then gradually becomes flat. When the surface crack propagates to the critical size of the submarine cone-column joint model, the shape ratio is stable at about 0.85. It shows that in this process, the crack propagation velocity in the depth direction is lower than that on both sides.
Figure 13 shows the a-N curve of crack propagation under different initial depths. In the early stage of propagation, the crack does not change significantly along the depth direction, but then increases rapidly. However, the larger sized crack cannot be ignored compared to the failure thickness of the conical-cylindrical shell; the larger crack causes structural failure in the process of growing faster, and the fatigue life is relatively low.
Table 4 shows the fatigue life calculation results of initial cracks at different depths when the shape ratio is 1. The larger the crack size of conical-cylindrical shell, the lower its fatigue life. The pressure shell fatigue life is about 207,893 times when a0 is 2, and 898,114 times when a0 is 0.3, which is 4.3 times longer than when a0 is 2 and 1.3 times longer than when a0 = 0.5mm. At this time, the fatigue life of conical-cylindrical shells is negatively correlated with the change of crack depth.

5. Conclusions

In this paper, based on the structural model of the cone column joint in the submarine pressure structure, several groups of cracks with varying sizes underwent a propagation examination, and the influence of different cracks on the fatigue life of conical-cylindrical shells is calculated. The following conclusions are reached.
(1)
When the initial crack with the same depth is introduced, the stress intensity factor is in direct proportion to the size change of the crack length direction. When the initial crack shape ratio is constant, the greater the crack depth, and the greater the stress intensity factor.
(2)
In the process of continuous crack propagation of the conical-cylindrical shell, the shape of the crack surface changes continuously. Multi-group crack propagation simulations show that when a crack with different sizes extends to a critical size for the thickness of the conical-cylindrical shell, its shape ratio is stable at 0.85.
(3)
When the initial crack depth is the same, cracks with a smaller shape ratio have a longer crack surface, and the greater the influence on the fatigue life of the conical-cylindrical shell. When the shape ratio is the same, the larger the crack depth direction, and the lower the life of the conical-cylindrical shell.
(4)
In the process of initial cracks of different sizes growing to a critical size, the rate changes slowly at the beginning. When the critical size is approached gradually, the speed increases significantly.

Author Contributions

Conceptualization, Y.Z. and J.Y.; methodology, Y.Z.; software, J.Y.; validation, Y.Z., J.Y. and H.P.; investigation, Y.Z. and J.Y.; data curation, Y.Z., J.Y. and H.P.; writing–original draft preparation, J.Y.; writing–review and editing, Y.Z.; All authors have read and agreed to the published version of the manuscript.

Funding

This work was supported by the National Natural Science Foundation of China [grant numbers: 52271277], the Natural Science Foundation of Jiangsu Province [grant no. BK20211343], and the State Key Laboratory of Ocean Engineering (Shanghai Jiao Tong University [grant no. GKZD010081]).

Institutional Review Board Statement

Not applicable.

Informed Consent Statement

Not applicable.

Data Availability Statement

The data presented in this study are available on request from the corresponding author. The data are not publicly available due to privacy.

Conflicts of Interest

The authors declare no conflict of interest.

References

  1. Huang, X.; Cui, W.; Shi, D. Calculation of Surface Crack Fatigue Life of High Strength Steel Welded Plate under Compressive Bending Combined Stress. J. Mech. Strength 2002, 3, 413–416. [Google Scholar] [CrossRef]
  2. Huang, X.; Cui, W.; Shi, D. Surface Crack Fatigue Life Calculation of Submarine Conical column Bonded Shell Toe. J. Ship Mech. 2002, 62–68. [Google Scholar]
  3. Van Do, T.; Hong Doan, D.; Chi Tho, N.; Dinh Duc, N. Thermal buckling analysis of cracked functionally graded plates. Int. J. Struct. Stab. Dyn. 2022, 22, 2250089. [Google Scholar] [CrossRef]
  4. Shi, D.; Geng, F.; Huang, X. Analysis of Fatigue Crack Formation Life of Submarine Structure. J. Harbin Eng. Univ. 2000, 3, 70–74. [Google Scholar]
  5. Doan, D.H.; Zenkour, A.M.; Van Thom, D. Finite element modeling of free vibration of cracked nanoplates with flexoelectric effects. Eur. Phys. J. Plus 2022, 137, 447. [Google Scholar] [CrossRef]
  6. Tho, N.C.; Cong, P.H.; Zenkour, A.M.; Doan, D.H.; Van Minh, P. Finite element modeling of the bending and vibration behavior of three-layer composite plates with a crack in the core layer. Compos. Struct. 2023, 305, 116529. [Google Scholar]
  7. Li, L.; Wang, Z.; Sun, Q. Pressure cone column combined with finite element shell fatigue life prediction. J. Mar. Eng. 2004, 37–40. [Google Scholar]
  8. Hou, W. Fatigue performance of convex cone cylinder composite shell of submarine structure. Ship Sci. Technol. 1990, 1–9. [Google Scholar]
  9. Zhang, D.; Huang, X.; Cui, W. A Prediction Method for Fatigue Crack Growth of Ship Structures under Complex Loads. J. Ship Mech. 2015, 19, 541–552. [Google Scholar]
  10. Li, L.; Wan, Z.; Pan, G. Different internal Pressure Influence on Welding Residual Stresses of Cone-cylinder Pressure Shell. Trans. China Weld. Inst. 2010, 400–410. [Google Scholar] [CrossRef]
  11. Germanischer Lloyd Group. Rules for Classification and Construction; Germanischer Lloyd: Hamburg, Germany, 2009. [Google Scholar]
  12. Institute of Pressure Vessel Defects Assessment Specification preparation group; Institute of Chemical Machinery and Automation Pressure vessel Defects Assessment Specification preparation group. Specification for defect evaluation of Pressure Vessels. Petrochem. Equip. 1985, 14, 46–59. [Google Scholar]
  13. Japan Welding Engineering Society. JWES 2805-1980 Methods of Assessment for Defects in Fusion-Welded Joints with Respect to Brittle Fracture; JWES: Tokyo, Japan, 1980. [Google Scholar]
  14. Ikushima, K.; Shibahara, M. Large-scale non-linear analysis of residual stresses in multi-pass pipe welds by idealized explicit FEM. Weld. World 2015, 59, 839–850. [Google Scholar] [CrossRef]
  15. Zhao, J. Research on Three-Parameter Three-Dimensional Fracture of Macroscopic Structure. Ph.D. Dissertation, Nanjing University of Aeronautics and Astronautics, Nanjing, China, 2008. [Google Scholar]
  16. Guo, W. Three-Dimensional Fracture and Fatigue Crack Propagation. Ph.D. Dissertation, Xi’an Northwestern Polytechnical University, Xi’an, China, 1991. [Google Scholar]
  17. She, C.; Zhao, J.; Yu, P. Three-parameter descriptions for the three-dimensional stress field near the crack front and a concept of equivalent thickness. Entia Sin. 2014, 1, 55–67. [Google Scholar]
  18. Chang, T.; Guo, W. A model for the through-thickness fatigue crack closure. Eng. Fract. Mech. 1999, 64, 59–65. [Google Scholar] [CrossRef]
  19. Paris, P.; Erdogan, F. A Critical Analysis of Crack Propagation Laws. J. Basic Eng. 1963, 85, 528–533. [Google Scholar] [CrossRef]
  20. Knowles, J.K.; Sternberg, E. On a class of conservation laws in linearized and finite elastostatics. Arch. Ration. Mech. Anal. 1972, 44, 187–211. [Google Scholar] [CrossRef]
  21. Budiansky, B.; Rice, J.R. Conservation laws and energy-release rates. J. Appl. Mech. 1973, 40, 201–203. [Google Scholar] [CrossRef]
  22. Freund, L.B. Stress intensity factor calculations based on a conservation integral. Int. J. Solids Struct. 1978, 14, 241–250. [Google Scholar] [CrossRef]
  23. Herrmann, A.G.; Herrmann, G. On energy-release rates for a plane crack. J. Appl. Mech. 1981, 48, 525–528. [Google Scholar] [CrossRef]
  24. Ai, S.; Yu, M.; Cheng, X.; Wang, J. Analysis and application of three-dimensional crack growth based on Franc3D. J. Mech. Strength 2018, 40, 251–254. [Google Scholar]
  25. Chen, J.; Huang, Y.; Liu, G. Analysis of finite element model for calculating stress intensity factor based on crack tip singular element. Shipbuild. China 2010, 51, 56–64. [Google Scholar]
Figure 1. Submarine pressure hull.
Metals 13 00698 g001
Figure 2. Conical-cylindrical shell model. (a) Geometric model (b) Numerical model.
Metals 13 00698 g002
Figure 3. The distribution of residual stresses.
Metals 13 00698 g003
Figure 4. (a,b) Schematic diagram of equivalent thickness.
Metals 13 00698 g004
Figure 5. New crack front after fitting.
Metals 13 00698 g005
Figure 6. The location of the crack in the model.
Metals 13 00698 g006
Figure 7. The maximum value of different cracks, KI.
Metals 13 00698 g007
Figure 8. Variation of shape ratio during crack propagation.
Metals 13 00698 g008
Figure 9. Change of crack surface during crack propagation.
Metals 13 00698 g009
Figure 10. The a-N curve of the conical-cylindrical shell.
Metals 13 00698 g010
Figure 11. Variation of shape ratio during crack propagation.
Metals 13 00698 g011
Figure 12. Change of crack surface during crack propagation.
Metals 13 00698 g012
Figure 13. The a-N curve of conical-cylindrical shell.
Metals 13 00698 g013
Table 1. Geometric and physical parameters of the model.
NameValue
Big end diameter D1 (mm)2730
Small end diameter D2 (mm)2300
Half-cone angle (°)20
Thickness t (mm)20
Yield strength σs (MPa)645
Elastic modulus E (MPa)2.1 × 10⁵
Poisson’s ratio v0.3
Table 2. Calculation results of the maximum of KI(KI_max/MPa·mm1/2).
Depth a (mm)a/c
0.20.40.60.81
0.3241.96220.75194.79176.75175.09
0.5316.78282.33248.96230.01229.29
0.8399.79356.89313.54291.82289.10
1448.61396.75349.95324.00320.53
2637.73560.06497.77462.11461.21
Table 3. Fatigue life of conical-cylindrical shell with different shape ratio.
HeaderInitial Crack Shape Ratio Y0
0.20.40.60.81
2c (mm)9.679.499.379.329.33
Y0.8270.8430.8540.8580.857
N (cycle)187,018272,835344,854390,981429,121
Table 4. Fatigue life of conical-cylindrical shell with different initial depths.
Initial Crack Depth a0 (mm)
0.30.50.812
2c (mm)9.319.299.309.339.34
Y0.8590.8610.8600.8570.856
N (cycle)898,114685,470507,892429,121207,893
Disclaimer/Publisher’s Note: The statements, opinions and data contained in all publications are solely those of the individual author(s) and contributor(s) and not of MDPI and/or the editor(s). MDPI and/or the editor(s) disclaim responsibility for any injury to people or property resulting from any ideas, methods, instructions or products referred to in the content.

