1. Introduction
Magnesium is the lightest structural metal, about one-third lighter than aluminum, and it has less than one-quarter of the density of ferrous alloys. Moreover, magnesium has a high specific strength and stiffness as well as high damping properties compared to other metals. It is abundantly available in the earth’s crust and seawater and has a high recyclability. Magnesium alloys are also superior at electromagnetic interference shielding, which makes them well suited for housings of portable electronic consumer goods. However, while cast magnesium is widely utilized, there are a number of technical difficulties hampering the large-scale use of wrought magnesium alloys.
Generally, magnesium sheets have a poor formability at room temperature, which is improved markedly above 175 °C [
1]. During the primary fabrication process, e.g., rolling, grains rotate to unfavorable orientations (strong texture) for isotropic plasticity [
2]. Further processing steps must therefore be carried out at elevated temperature to thermally activate additional modes of deformation, which leads to high production costs. Further issues that limit the applicability of wrought magnesium are a strong yield asymmetry [
3] due to deformation twinning, edge-cracking in rolling and a low ductility at high strength [
4] as well as poor corrosion resistance [
2].
No matter whether the difficulties associated with the poor ductility of wrought magnesium at ambient temperature will be overcome by innovative processing, alloy and/or microstructure design, understanding the underlying physical mechanisms and microstructural changes in the material during processing is paramount.
A lot of research effort was dedicated to uncovering the operating modes of deformation in magnesium. Well-known studies on magnesium single crystals were performed by Wonziewicz and Backofen [
5] as well as by Kelly and Hosford [
6] in the 1960s. Both studies included plane strain compression tests on differently oriented magnesium single crystals, demonstrating their complex deformation behavior, which is characterized by profuse deformation twinning and the occurrence of recrystallization. However, the investigations mentioned above were limited to rather small strains as their focus was on the temperature dependence of slip and twinning activation. Following these classical works, there was surprisingly little incentive to characterize the deformation behavior of Mg single crystals, despite the apparent need for reliable modeling based on real physical mechanisms. Hence, the lack of a holistic understanding of the deformation behavior, microstructure and texture evolution in Mg single crystals calls for a reexamination of the fundamental underlying mechanisms, especially considering the advent of more advanced characterization techniques and general progress in research.
Compared to investigations of polycrystals, studies on single crystals claim several advantages. Single crystals can be precisely oriented with respect to the loading axes, which allows one to target and isolate specific modes of deformation, especially in conjunction with imposed constraints. Furthermore, model case experiments on single crystals provide an opportunity to examine the deformation behavior, microstructure and texture evolution depending on the initial orientation of the crystal. The operating slip modes and the critical resolved shear stress (CRSS) can be readily determined. Multiple generations of deformation twins can be easily distinguished even when the typical twin morphology is lost, which is rarely possible in polycrystals. The emergence of new grains and their orientation relationship to the surrounding matrix can be readily traced, which can grant valuable insight in the mechanisms of recrystallization [
7]. In general, the use of single crystals permits a much clearer and forthright analysis of the observed microstructural changes compared to conventional studies on polycrystals.
In light of these advantages of studies employing single crystals, it is imperative to note that, in general, individual grains in a polycrystal do not deform as single crystals. This is especially true for metals with crystal structures of high symmetry where multiple slip is prevalent. Single crystal studies therefore aim at exposing the underlying physical mechanisms, rather than claiming to directly predict the deformation behavior of polycrystals. That said, in the case of magnesium, very strong basal textures are predominant; hence, individual grains often undergo a similar deformation compared to what is tested in single crystal studies, especially when constraints are used. Furthermore, the small number of independent deformation modes, i.e., the dominance of basal slip and extension twinning at room temperature, entails a deformation behavior of the polycrystal that can be approximated by a Sachs-type model [
8,
9,
10], in which the operation of only one deformation mode per grain is assumed. To this end, understanding the deformation behavior of single crystals is indispensable.
Deformation of Mg at room temperature is particularly arduous owing to only a limited number of slip and twinning systems that can be activated to accommodate the imposed deformation. Plastic anisotropy is greatly pronounced, i.e., crystals of varying orientations are expected to exhibit a drastically different mechanical response (see, for example [
11,
12]). Performing model case experiments on specifically oriented single crystals allows to isolate and to identify the mechanisms of deformation, which in turn yields valuable insight in the deformation behavior of polycrystalline Mg.
The aim of the present work is to provide an overview of the mechanical response and microstructure evolution of specially oriented pure Mg single crystals during plane strain compression at room temperature in order to expose the mechanism involved. Special emphasis is placed on the investigation of crystal orientations in which basal slip is inhibited initially since that provides an opportunity to focus on non-basal slip systems and deformation twinning more exclusively. Furthermore, the critical resolved shear stress of slip and twinning, the work hardening and the fracture behavior are characterized.
4. Deformation Behavior and Failure of Crystals with ‘Hard’ Orientations
As expected, out of all tested orientations, crystals with the ‘hard’ basal orientations A and B in
c-axis compression displayed the least ductile behavior. As mentioned, basal slip was suppressed in this case. However, in the initial rapid work hardening regime, the deformation was already plastic since the highest work hardening rates (
= 6.3 GPa and
= 6.9 GPa for orientation A and B, respectively) were still a fraction of the Young’s modulus (
= 50.8 GPa) in the
c-axis direction. As discussed in [
5,
6], a minimal deviation from the exact alignment of the
c-axis from the compression direction is enough to activate basal slip due to the very low critical resolved shear stress of about 0.5–1.5 MPa [
24,
25,
26,
27,
28,
29,
30,
31,
32,
33,
34]. The initial strain hardening rate in the case of easy basal slip (orientation G) was determined to be
= 13.5 MPa. The highest Schmid factor for basal slip in orientation G was
= 0.5 owing to the alignment of the basal plane at an angle of 45° to the compression direction. Since orientation A and G differed only in the inclination of their
c-axes with respect to CD, their initial linear strain hardening rates (assuming basal slip only) are related by
where
is the basal shear hardening rate,
and
are the true stress and true strain, respectively, with the corresponding orientations denoted as subscript. The Schmid factor for basal slip in the case of orientation A would be
ideally. From Equation (1) it follows that
if the observed initial linear strain hardening rates for the orientations A and G are used. This Schmid factor translates into a deviation of
from the ideal ‘hard’ orientation A, which is not unreasonable. However, if the deformation was governed by basal slip only, the
c-axis would have rotated further towards the compression direction throughout straining, continuously increasing the strain hardening rate
. Experimentally, a decrease in strain hardening was observed in both cases of orientation A and B (
Figure 4), which suggests the activation of a different deformation mode.
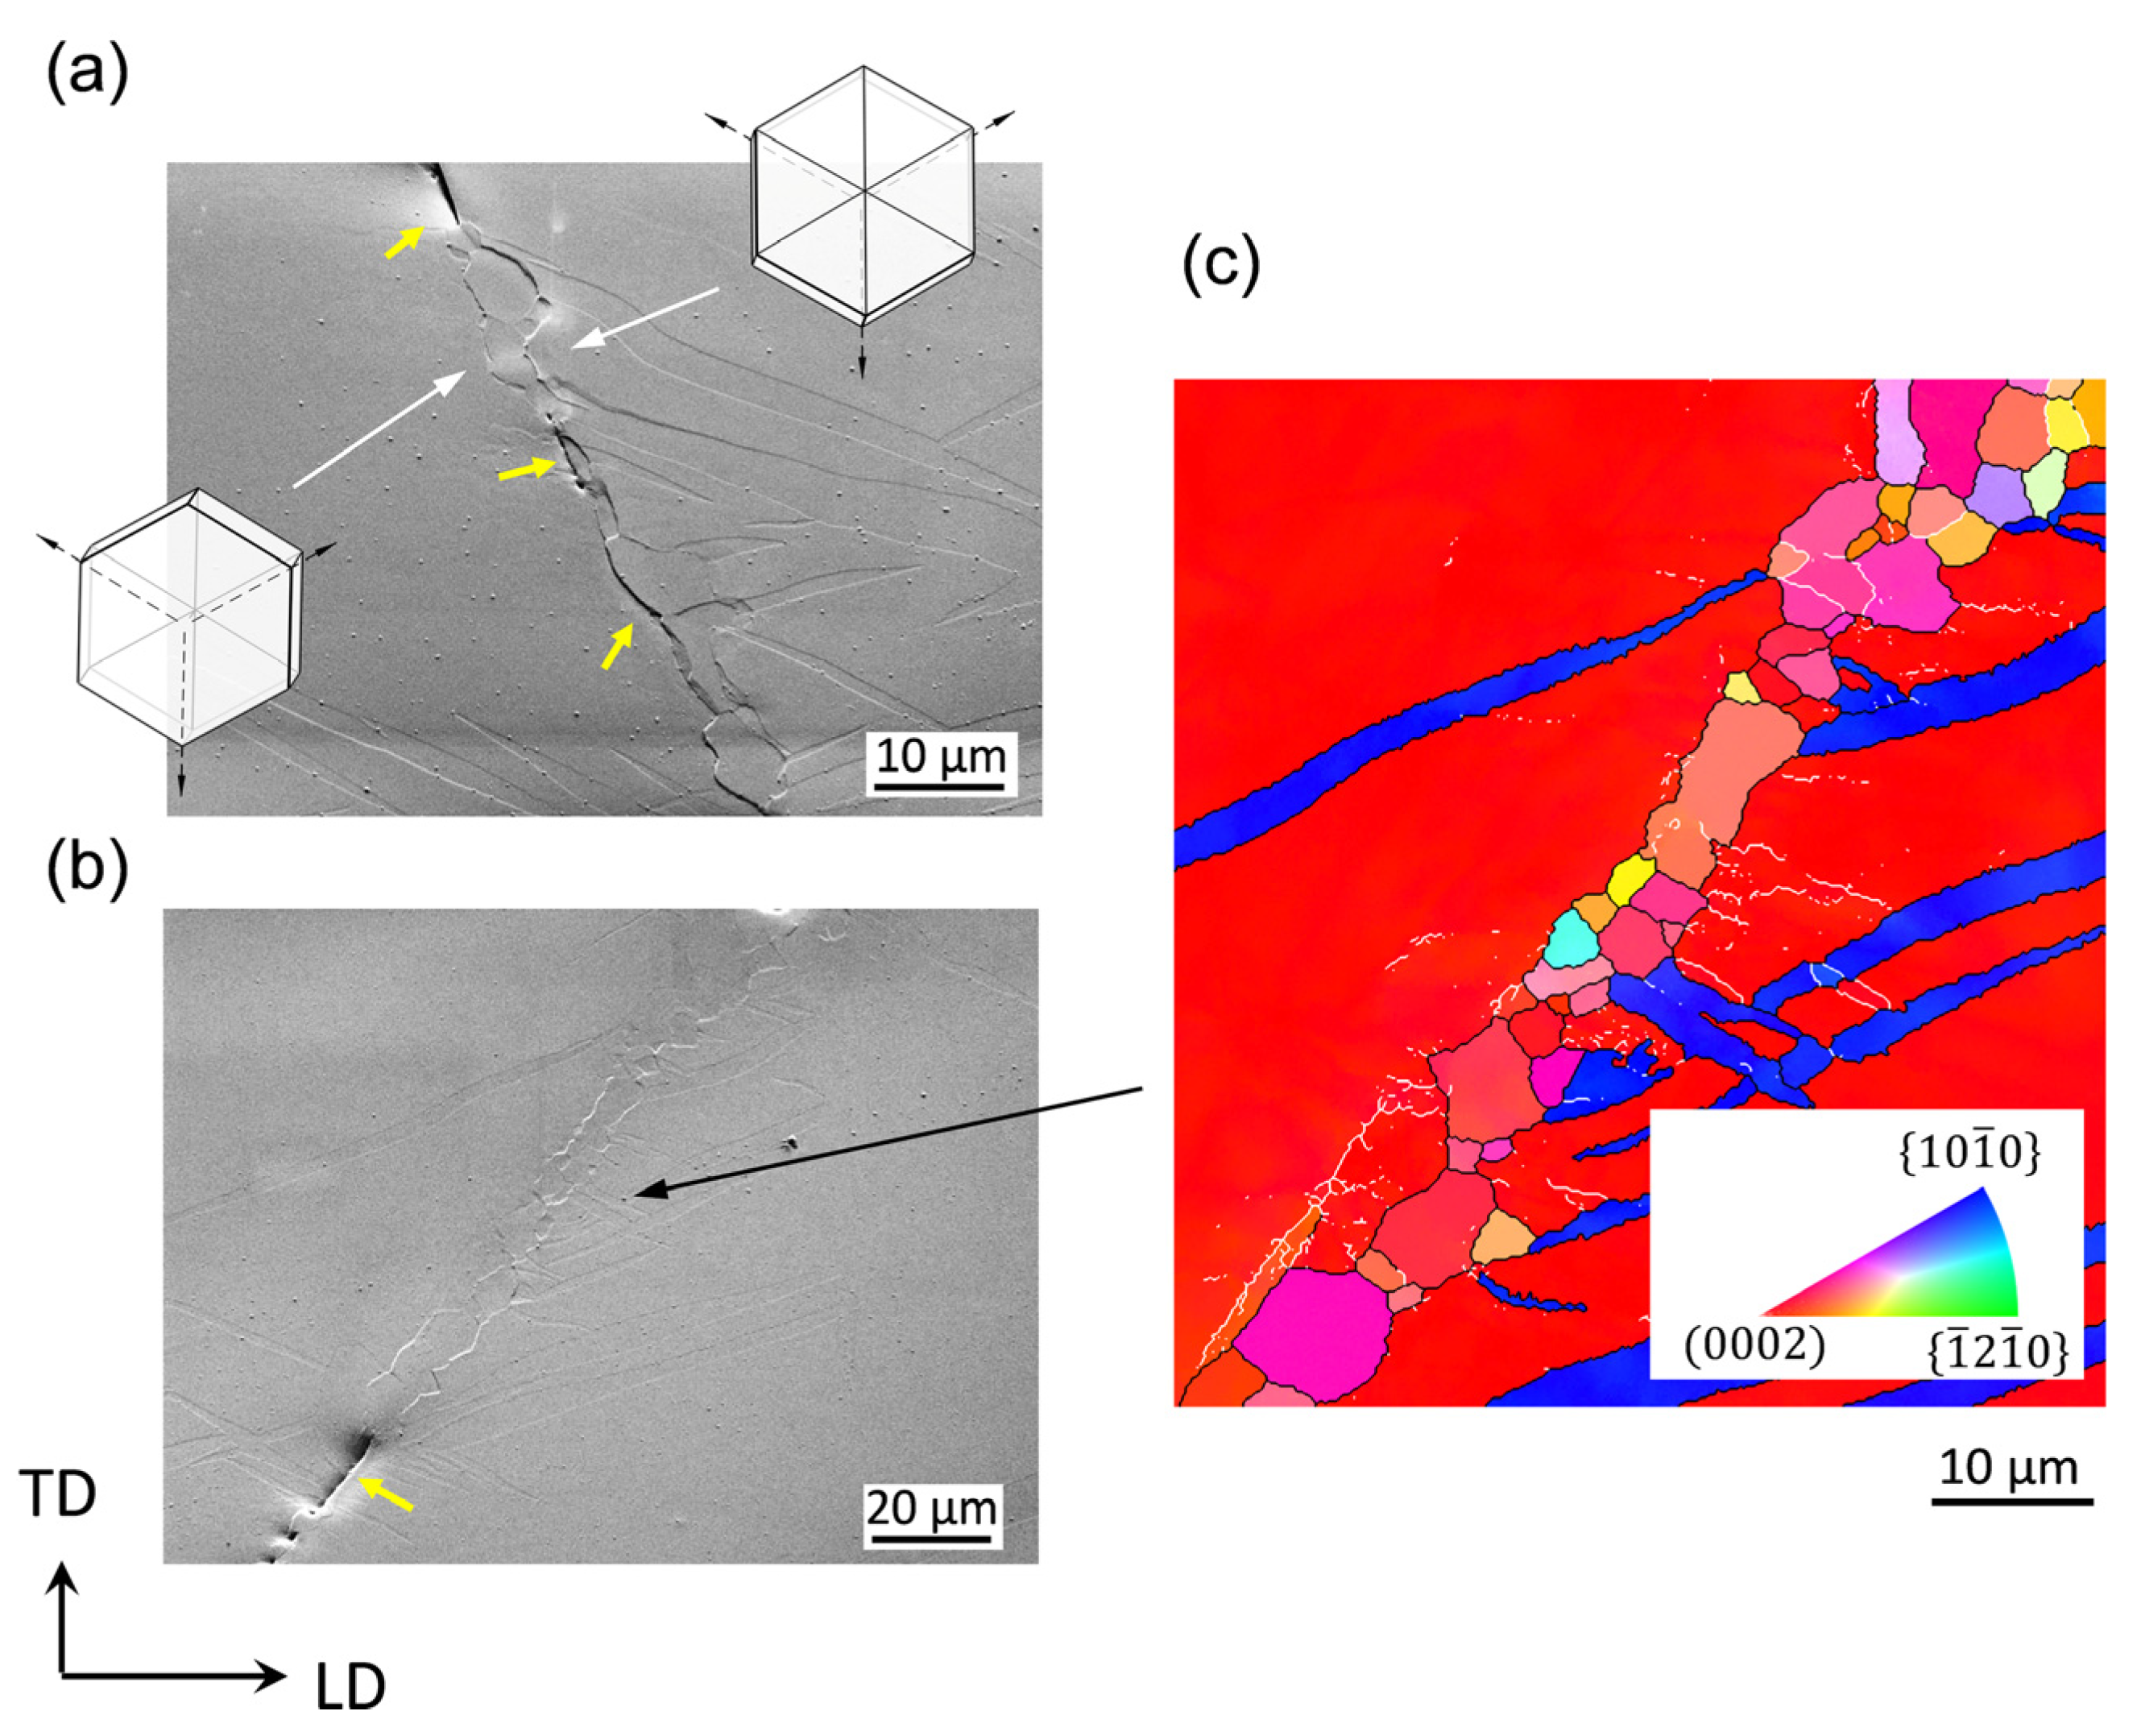
Slip lines observed in A-oriented crystals were parallel to the trace of
planes (
Figure 6), indicating the activation of pyramidal II slip. As opposed to basal slip, pyramidal 〈
〉 slip is able to accommodate the plane strain compression (contraction in CD and extension in LD) imposed on the samples and is most likely the reason for the decrease in the strain hardening rate (
Figure 4).
Slip lines have also been ascertained in the case of orientation B that could not be a result of basal slip (
Figure 7). The broad range of inclinations of the observed slip lines (43–58° to TD) suggests the activation of pyramidal 〈
〉 slip and cross slip between different pyramidal planes. Assuming the activation of pyramidal II slip as in the case of orientation A, a possible slip plane would be
for dislocations with a Burgers vector parallel to
. Such dislocations could also glide on the
plane, i.e., constituting pyramidal I slip. The inclinations of the slip traces for glide on
and
would be 39° and 58.4° to TD, respectively, or any angle between that if cross slip is taken into account. This range of inclinations corresponds well to what was observed experimentally.
Despite the activation of pyramidal 〈
〉 slip in crystals of both hard orientations A and B, the specimens failed by cracking along
planes (
Figure 5). The
fracture plane has also been reported previously by Kelley and Hosford [
6] for PSC of Mg single crystals as well as by Reed-Hill and Robertson [
35] for tension at −190 °C. More recently, the same fracture plane has been observed during equal-channel angular pressing (ECAP) [
36] and
c-axis compression [
37,
38] of Mg single crystals at room temperature. While both A- and B-oriented specimens failed, the true stress at fracture was higher for orientation B (
Figure 4). The
fracture planes are illustrated in
Figure 19. In the case of orientation A (
Figure 19a), the shear stress on the active
fracture planes (in a direction parallel to LD) depends only on the active stress component in CD (the
planes are parallel to TD). By contrast, the shear stress on the
planes resulting from the active stress component in orientation B (
Figure 19b) is always reduced by the lateral compressive reaction stress (in TD), which is presumably the reason for the higher fracture stress.
As mentioned in
Section 3.2, cracks and bands of recrystallized grains were evident parallel to the trace of
planes (
Figure 8). Twins that follow a
habit plane were reported by Yoshinaga and Horiuchi [
39] and by Kitahara et al. [
38] for the case of
c-axis compression of Mg single crystals. However, the twins in [
38] could have been ordinary
twins instead of
twins since both shared the same inclination (39°) of the twin trace on the observed
plane. On the other hand, the horizontal lines that were shown in [
38] on the
plane were most likely slip traces rather than twin traces.
twins have not been ascertained by orientation measurements, neither in [
38], nor in [
39]. In the present study no indication of
twinning was found, i.e., twinning was not the origin of the recrystallized
bands.
Adjacent to the
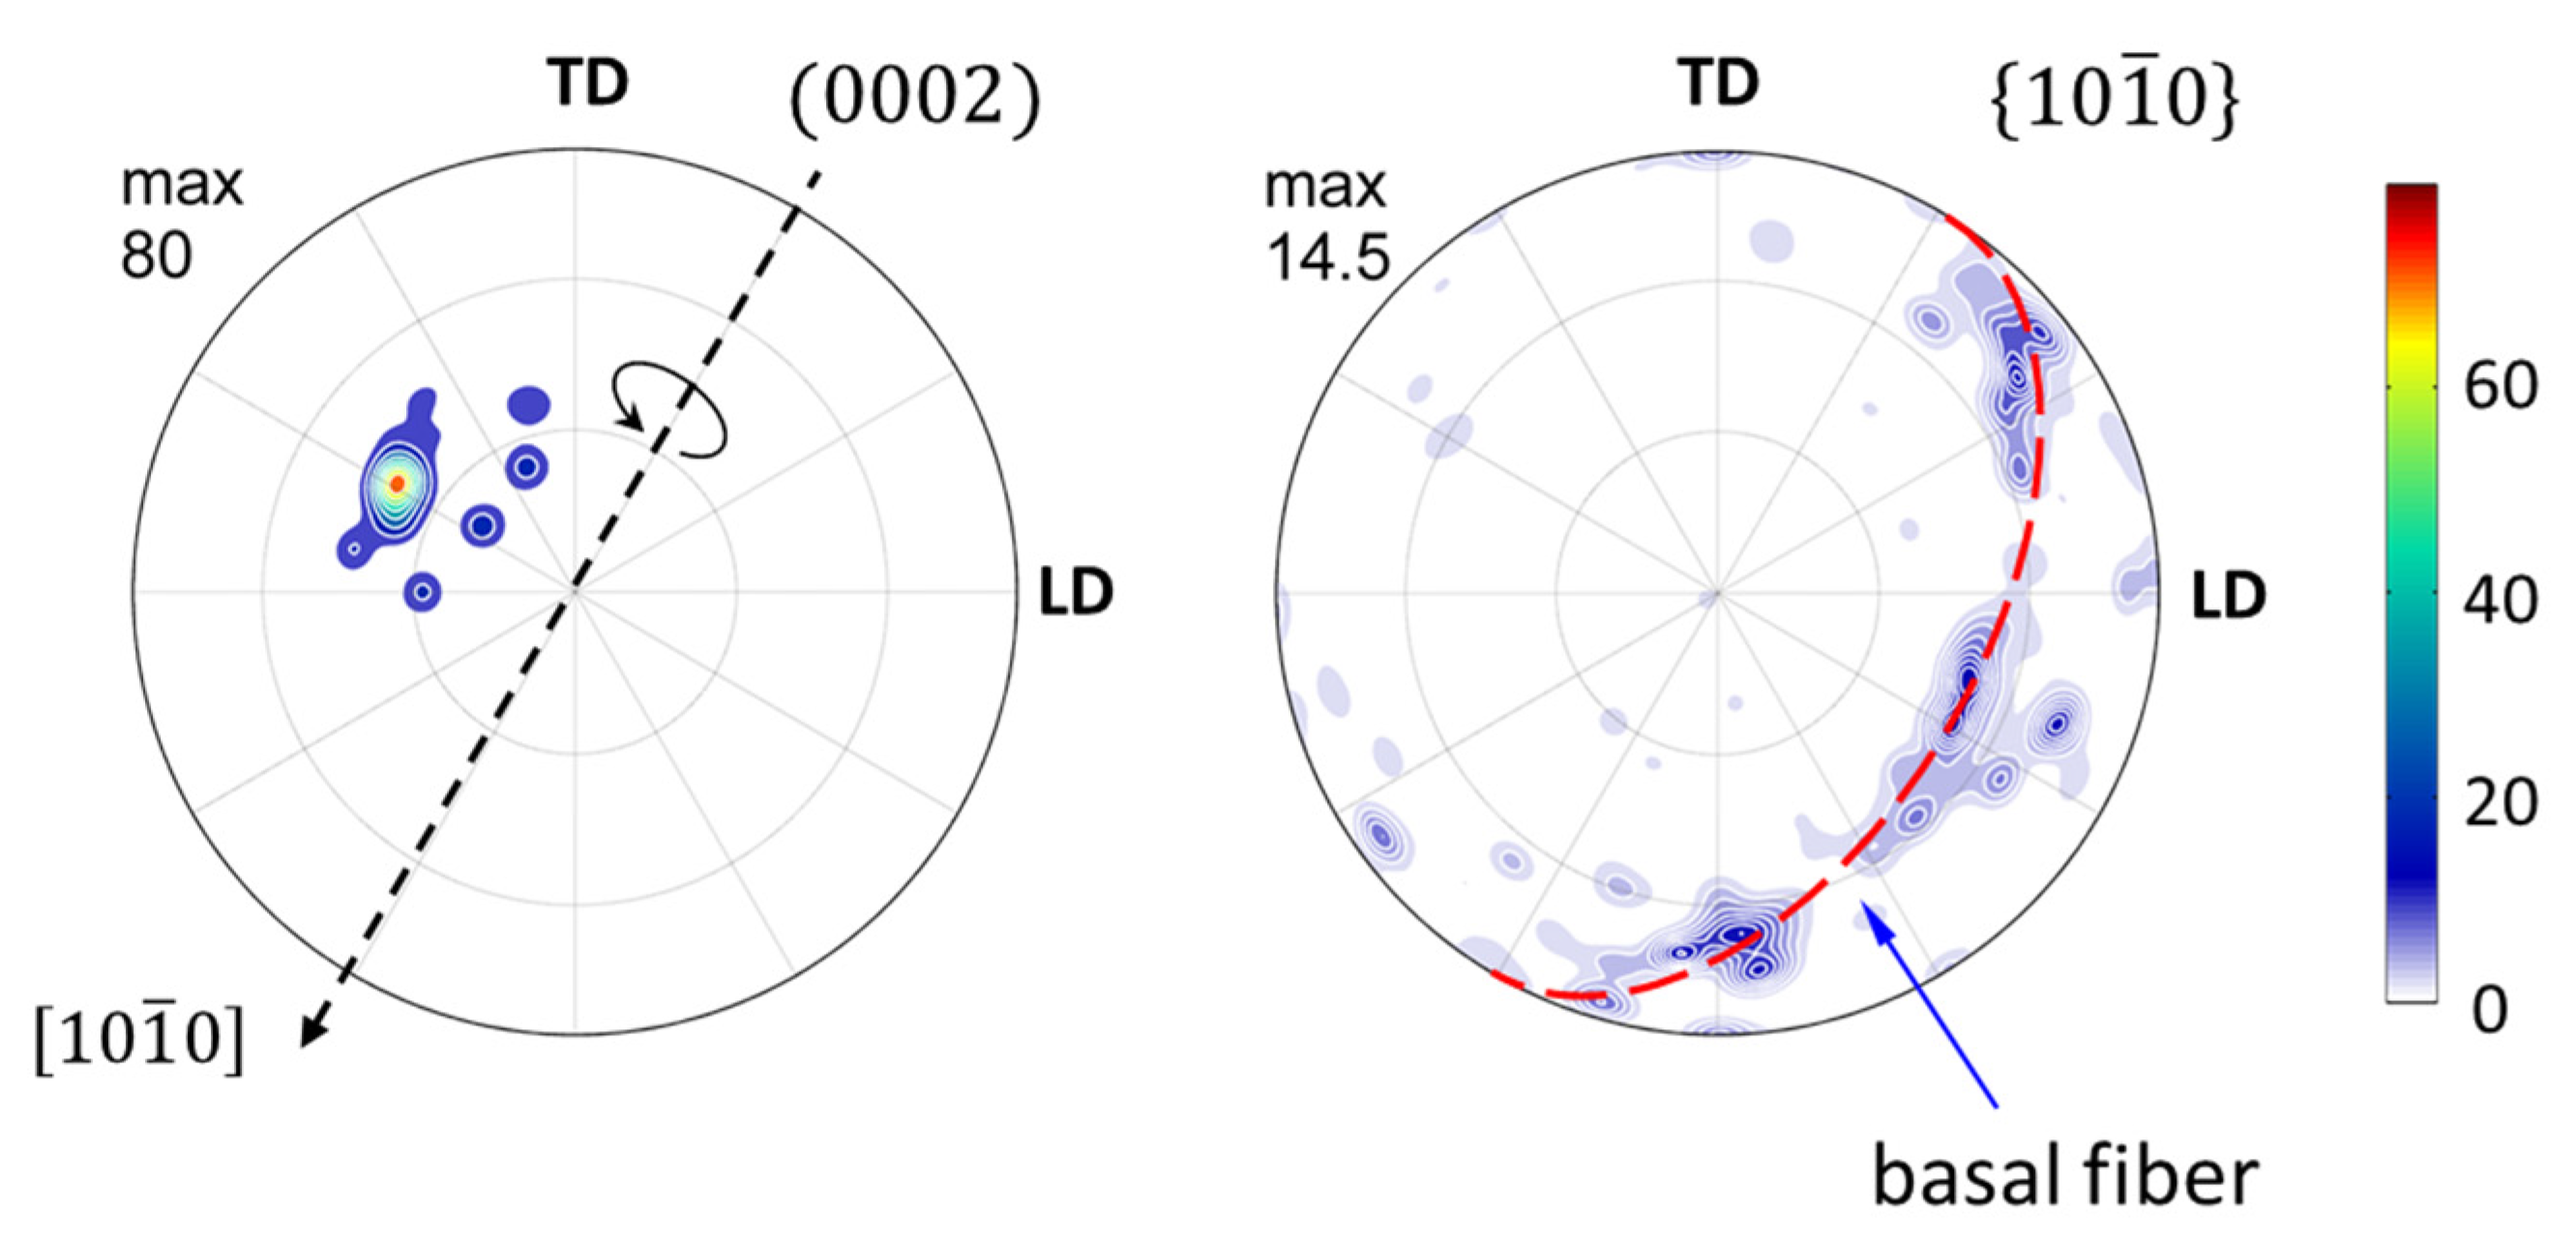
bands, the matrix was rotated away from the initial hard orientation, providing further evidence for the activation of pyramidal slip. The orientations of the recrystallized grains, extracted from the orientation map in
Figure 8c, are given in the form of pole figures in
Figure 20.
The
c-axes were rotated away from the center of the pole figure, i.e., the hard orientation, by up to 40° around the
axis (that was parallel to the band itself). Since
twinning can be ruled out, this rotation must be attributed to localized pyramidal 〈
〉 slip. In fact, thin bands orientated close to
have been observed by Jensen and Backofen [
40] in a zirconium alloy in grains where the deformation was accommodated by 〈
〉 slip. Fracture occurred along such bands of highly localized shear that came about due to thermal softening during slip-band formation [
40]. It is suggested that the
bands observed in the present study were likewise caused by highly localized shear. However, in the present case of pure Mg, such bands recrystallized dynamically with fracture subsequently occurring in those softened regions along grain boundaries. (The same bands that were not recrystallized were also seen in Mg-0.8 wt.% Gd crystals as was recently reported in [
41]. The shear localization/softening was most likely responsible for the drop in flow stress prior to fracture (
Figure 4). Further indication of the occurrence of (continuous) dynamic recrystallization in such bands of localized 〈
〉 slip activity is provided by the apparent tendency towards a basal fiber in the band (
Figure 20b). As reported and discussed in [
21], the formation of a basal fiber, i.e., the rotation of grains around their
c-axes is a recurring element during the continuous dynamic recrystallization in Mg.
Failure of specimens with the hard orientations A and B was not a result of a limited number of available slip systems, i.e., the absence of pyramidal 〈
〉 slip at room temperature, as is generally believed. Pyramidal slip was very well active at room temperature, but the localization of slip led to an instability in flow, which ultimately caused the fracture along
bands, i.e., 〈
〉 slip can be viewed as a mechanism inducing plastic instability, rather than contributing to a homogeneous deformation at ambient temperature. That being said, at elevated temperatures, the specimens deformed without failure during
c-axis compression [
42], aided by the profuse formation of contraction twins (with CDRX inside twin bands) and presumably, a diminishing tendency for slip localization with increasing temperature [
43].
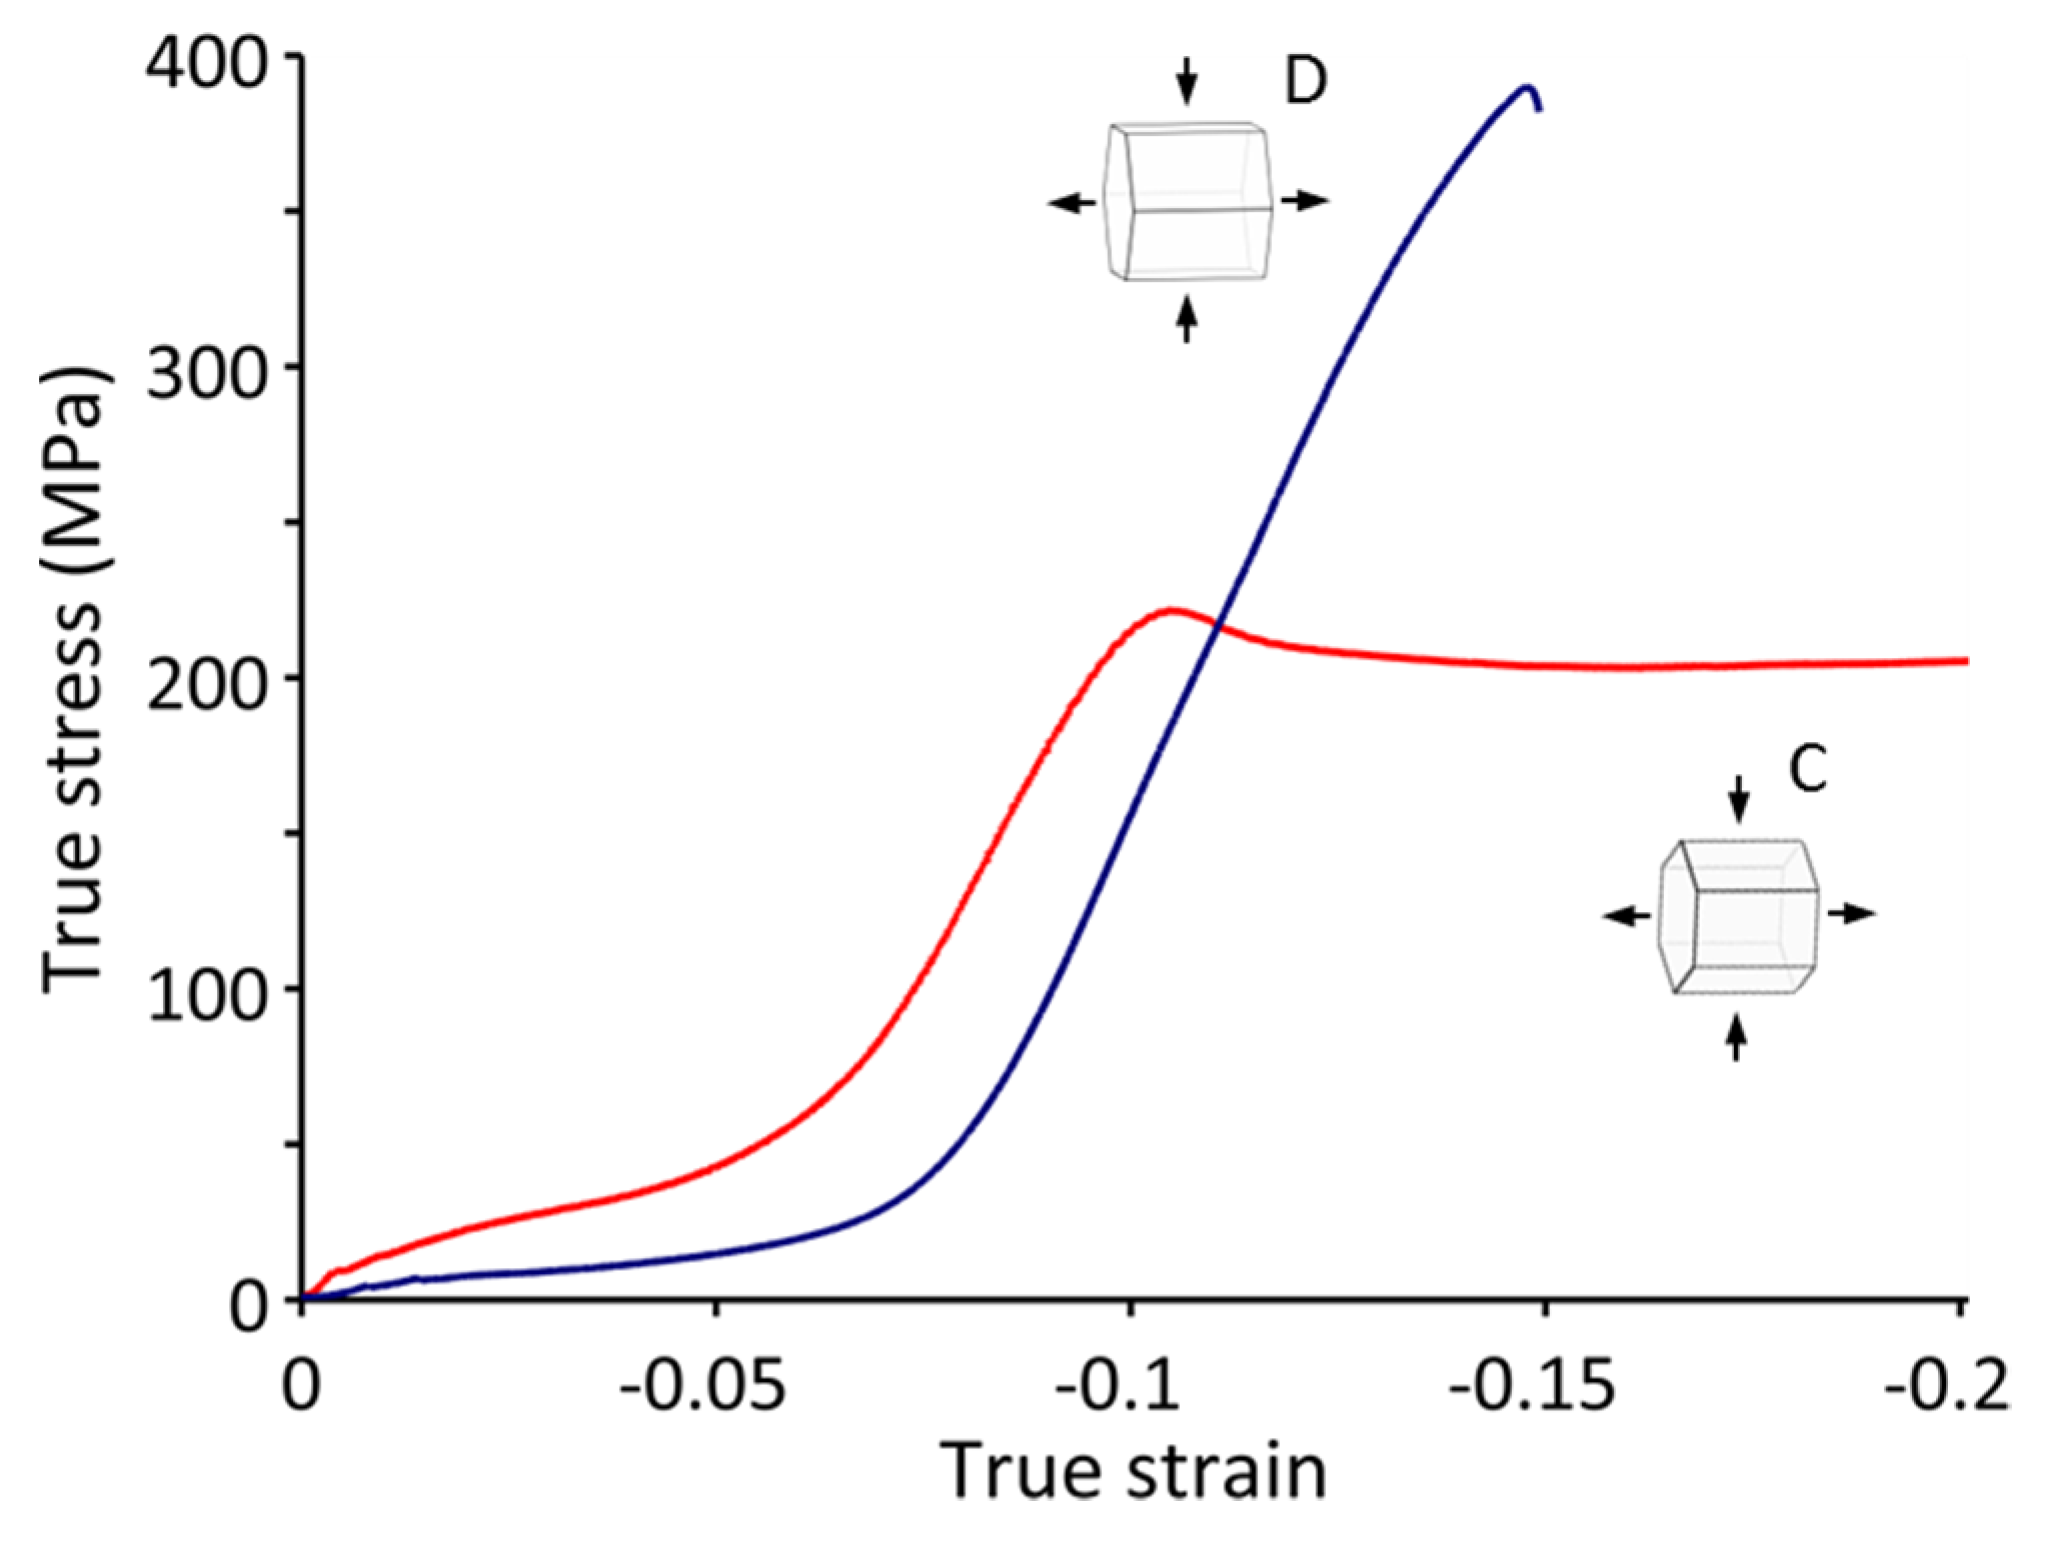
5. Impact of Extension Twinning on the Ductility of Mg Single Crystals Subjected to Compression Perpendicular to the c-Axis
Specimens of orientation C and D were favorably aligned for
extension twinning since extension along the
c-axis was free to occur in LD.
Figure 21 shows basal pole figures depicting the calculated
extension twin orientations for the initial specimen orientations C and D. For each starting orientation, six extension twins were possible.
Four equally high Schmid factor extension twins in orientation C transformed the matrix into twin orientations with the
c-axis aligned at an angle of 30° to CD (
Figure 11a and
Figure 21a), yielding a non-zero Schmid factor (
) for basal slip as opposed to a zero Schmid factor (ideally) in the case of the starting orientation. The averaged displacement gradient tensor (expressed in the sample reference frame LD-TD-CD) for the four active twin systems is given by (see Appendix in [
23])
Hence, contraction of the
c-axis due to extension twinning was accompanied by some contraction in TD (negative
component). This stage of profuse
extension twinning corresponded to the initial low strain hardening region on the flow curve (red curve in
Figure 9). The strain hardening rate increased once twinning was exhausted (maximum strain of
). It is noted that during the primary twinning stage the flow stress did not remain constant, which means that twinning became more difficult with increasing strain, probably as a consequence of the decreasing residual volume of the parent matrix at strains approaching –4.8%, reflecting the grain size sensitivity of twinning [
9,
44,
45,
46].
That being said, taking into account slip, one would not expect the strain hardening rate to increase after twinning ceases to operate because the Schmid factor for basal slip in the twinned volume is non-zero. However, the deformation produced by basal slip in the twinned volume was resisted by the channel-die constraints. Hence, basal slip was mostly suppressed. Only a small amount of strain could be accommodated by basal slip since extension twinning yielded some contraction in TD (
). Thus, the flow stress increased rapidly until
contraction twinning was activated, leading to flow softening (
Figure 9 and
Figure 22) due to intense shear localization and continuous dynamic recrystallization (CDRX) at room temperature (see [
21]). The end of the rapid work hardening stage, slightly before the peak stress on the flow curve in
Figure 22, can therefore be correlated with the onset of
contraction twinning. Taking into account the Schmid factor for the observed
twin variant in the new tension twinned matrix (
), the CRSS for contraction twinning at room temperature amounts to
= 61 MPa, which is well below the range of values (
) reported by Wonsiewicz and Backofen [
5] for various orientations.
In the case of orientation D, two high Schmid factor extension twin variants were observed to appear, which converted the initial matrix into twin orientations located nearly in the center of the basal pole figure (
Figure 11b and
Figure 21b). Extension twinning was activated at stresses above 4 MPa, which translates into a CRSS of
and is in good agreement with the CRSS for extension twinning reported by Yu et al. (
MPa) [
47] and Reed-Hill and Robertson (
) [
48].
The averaged displacement gradient tensor (LD-TD-CD reference frame) for the two active twin systems is given by
Extension twinning in orientation D did not entail any contraction in TD but produced ideal plane strain compression. More strain (contraction in CD) was accommodated by twinning in comparison with orientation C; hence, the initial region of low strain hardening was longer in orientation D (blue curve vs. red curve in
Figure 9).
Twinning transformed orientation D into the ‘hard’ orientation B, the ductility of which was rather limited as discussed in the previous section. Consequently, the strain hardening rate of orientation D became very similar to that of orientation B and specimens fractured at the same stress (
Figure 3b).
It is worth pointing out that after the conversion of the initial matrix, specimens with the starting orientation D were again almost single-crystalline with only low angle grain boundaries present, as shown in
Figure 13 (parallel to TD), owing to the misorientation relationship of 7.4° 〈
〉 between the two twin variants. On the other hand, the four twin variants consuming orientation C introduced high angle grain boundaries, i.e., 60° 〈
〉 and 60.4° 〈
〉 [
21]. Moreover, in specimens of orientation C secondary extension twins, i.e., 86.3° 〈
〉 grain boundaries were also present after the conversion of the initial matrix.
In addition to the apparent difference in ductility between the C- and D-oriented crystals, their mechanical behavior during the incipient stage of deformation, i.e., in the stage characterized by large-scale twinning, was distinguished by a higher strain hardening rate in the crystals of orientation C vis-à-vis the D-oriented crystals with 544 MPa and 297 MPa, respectively (
Figure 9). The four twin variants that originated from orientation C (
Figure 21a) were mutually more constrained, i.e., impeding each other, than the two twin variants from orientation B (
Figure 21b), having a virtually identical orientation. As the conversion of the original single crystal orientation was progressing, it became more difficult to twin the “residual” fragmented matrix as smaller grains offer a greater resistance against twinning. The fragmentation of the initial matrix was more distinct in case of orientation C due to the higher number of twin variants, creating smaller pockets of stable retained matrix, thus resulting in a higher strain hardening rate. Moreover, the twins in the C-oriented crystals had to form in pairs of symmetric variants (symmetric about LD) to mutually cancel out their shear components in TD, whereas in the case of orientation D, the twins did not introduce any shear in TD at all, so they could form more easily a priori, which is reflected in the low CRSS of about 2 MPa.
In both cases of orientation C and D, basal slip was effectively suppressed in the twinned volume. However, the deformation behavior was markedly different. The most striking difference was in the appearance of
contraction twins in orientation C [
21] that were not present in orientation D, although the latter reached a higher flow stress and the
c-axis was aligned parallel to CD (favorably for contraction twinning). This can be attributed to the presence of high angle grain boundaries in orientation C, which acted as nucleation sites for
contraction twins. No such high angle grain boundaries existed in orientation D, but only low angle grain boundaries were present after the conversion by extension twinning, which, however, did not facilitate contraction twinning.
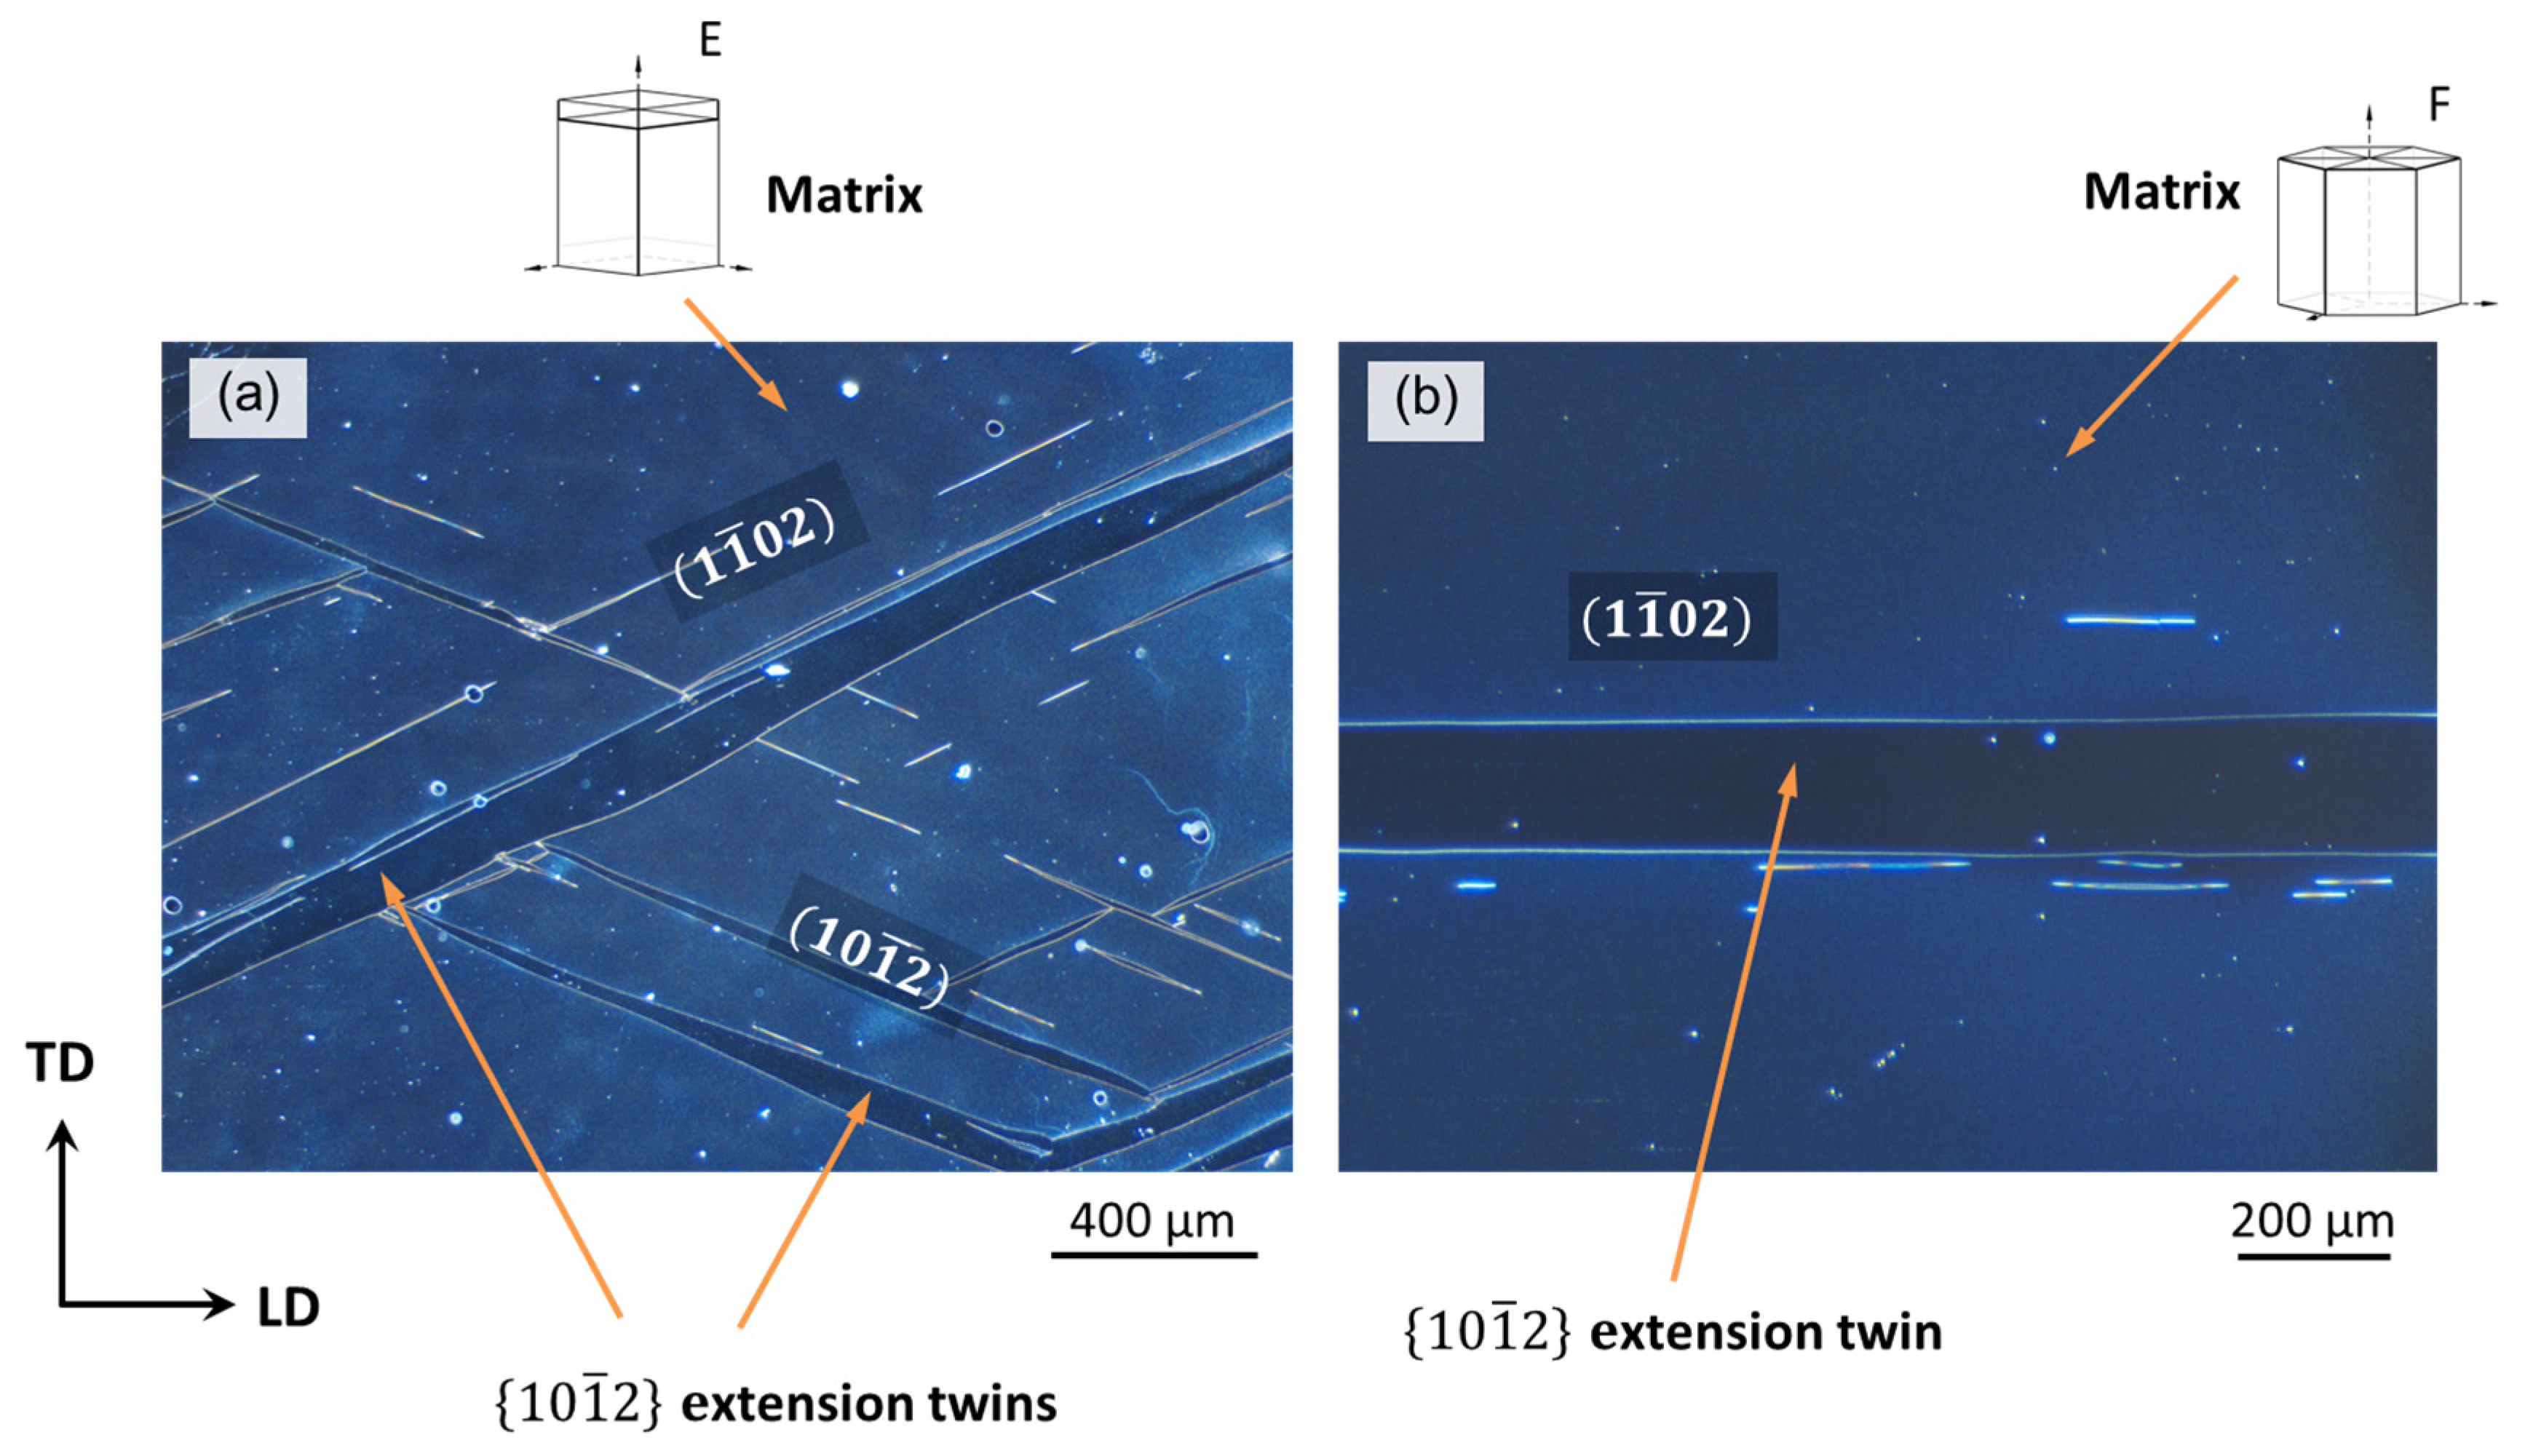
A similar conclusion can be drawn for the case of orientations E and F. The calculated
extension twin orientations for these initial orientations are illustrated in
Figure 23. Similar to the case of orientations C and D, four variants of extension twins formed in crystals of orientation E (
Figure 23a) and two variants formed in crystals of orientation F (
Figure 23b). The twin orientations in the E-oriented specimens had a non-zero Schmid factor as in the case of the twin orientations of the C-oriented ones (
Figure 21a), but basal slip was not suppressed by the channel-die constraints in the twinned volume.
The twin orientations in the F-oriented specimens rotated the matrix towards the hard orientation A, in which basal slip was naturally suppressed, which is the reason for the higher flow stress in case of orientation F compared to orientation E (
Figure 14). It would seem that fracture under such conditions must have been unavoidable.
Large
extension twins formed despite the constrained
c-axis (
Figure 15). However, these twins could not grow to such an extent as to consume the entire matrix, like they did in the case of orientations C and D, i.e., high angle grain boundaries (86.3° 〈
〉 twin boundaries) were still present. Instead, the formation of
extension twins increased the compressive constraint stress (in TD), inhibiting their own growth, until
contraction twins nucleated at
extension twin boundaries (
Figure 17) and compensated the
c-axis extension, while relieving the constraint stress. Such a cooperative twinning was a necessary deformation mechanism in specimens of both orientations E and F to substitute the inactive prismatic slip at room temperature [
22].
With respect to prismatic slip, it is noted that if prismatic slip was active, it would have yielded a rotation around the
c-axis in orientation F (not in orientation E as it is a stable orientation [
6,
22]). However, no rotation/spin around the
c-axis was detected; hence, prismatic slip was not activated in the matrix at room temperature under the most geometrically favorable conditions.
If it were not for the
c-axis constraint and the suppression of extension twinning, crystals of orientation F would have completely converted into single crystals with the hard orientation A and failed as a result. On the other hand, without any extension twins, contraction twins would not have nucleated either. Thus, a microstructure comprising many fine extension twins seems to be most preferable for the formation of
contraction twins, which can for instance be achieved by inhibiting the growth of
twins through precipitation [
49,
50].
Concerning the propagation of
extension twins, it is noteworthy that these ‘profuse’ twins grow easily by the migration of their twin interfaces, i.e., shear-coupled grain boundary migration [
51]. By contrast,
contraction twin bands propagate by nucleation and limited growth of new fine parallel lamellae (
Figure 17b), which reflects the difficulty of the migration of
twin boundaries under mechanical stress at room temperature.
6. On the Mechanical Response of Crystals with Soft Orientations
The calculated Schmid factors (SF) for basal slip in orientations G and H are listed in
Table 2. (For the calculation of the SF in the current study see
Appendix A). G-oriented crystals were aligned such that, ideally, only one slip system with the maximum Schmid factor of
(
Table 2) should be activated in order to accommodate the imposed deformation, i.e., the case of easy basal slip. The shear direction
for this slip system was perpendicular to TD; that is, basal slip was free to occur. By contrast, in orientation H, two basal slip systems with equally high Schmid factors (
Table 2) must be activated, i.e., coplanar slip, to accommodate the strain. Shear along only one of the two shear directions is resisted by the channel-die constraints; hence, both systems must contribute equally to the overall deformation in a cooperative fashion.
The shear stress (
)–shear strain (
) curves for orientations G and H are depicted in
Figure 24. The critical resolved shear stress for basal slip at RT was determined to be
= 1.2 MPa and
1.15 MPa for orientation G and H, respectively, which is less than the CRSS for
contraction twinning by a factor of about 50. The reduced shear hardening rate for orientation G in stage A (initial linear hardening stage) is given by
, where
= 16.4 GPa is the shear modulus for basal slip. For comparison, Sułkowski et al. [
32] reported a reduced initial (stage A) shear hardening rate of
for the same orientation deformed in tension, which is close to the value measured in the present work, despite the prevalent friction in channel-die compression. For orientation H, the reduced shear hardening rate (stage A) amounts to
(shear direction
), which is considerably higher than in the case of easy basal slip in orientation G (
). This increased hardening in orientation H can most probably be attributed to the channel-die constraints and/or to the interaction of basal dislocations with different Burgers vectors, given that a coplanar slip system hardens proportionally to the dislocation density accumulated in the other coplanar system during stage A in magnesium [
34].
The reduced shear hardening rates in the rapid work hardening region in
Figure 24 were
and
for orientation G and H, respectively, which is an order of magnitude greater compared to the initial region of low strain hardening. As was shown in [
23], this increase in strain hardening was accompanied by changes in the microstructure, namely, the appearance of
extension twin bands that presumably acted as barriers for dislocations slip. The appearance of
twins during the rapid hardening stage (stage B) was also observed by Yoshinaga and Horiuchi [
28] as well as by Hirsch and Lally [
29] on single crystals strained in tension. In the study by Sułkowski et al. [
32], the work hardening in stage B was rather moderate (reduced coefficient of
) compared to the rapid hardening stage in our work for orientation G (
). Twins have not been observed in [
32], but the increase in work hardening was associated with the appearance of low angle grain boundaries, i.e., subgrain formation, that reduced the mean dislocation free path.
Thus, there are ample reasons to suggest that, in contrast to fcc crystals, the stage of rapid hardening in Mg is not governed primarily by the interaction of primary dislocations with forest dislocations [
52] but rather by actual changes in the microstructure [
28].
7. Summary and Concluding Remarks
In this work, an overview is given to comprehensively illustrate the mechanical response and microstructure evolution of specifically oriented pure magnesium single crystals under plane strain compression at room temperature.
Mg crystals of ‘hard’ orientations that were compressed along the c-axis displayed high hardening rates and limited ductility at room temperature, failing at a true strain of about −7%, although pyramidal 〈〉 slip was readily activated, as ascertained by observation of slip traces and lattice rotation. Fracture occurred along recrystallized bands aligned along crystallographic planes, which were the result of highly localized shear. The failure in c-axis contraction at ambient temperature is therefore fostered by a tendency for localization of pyramidal 〈〉 slip and is of a ductile nature.
In crystals favorably aligned for
c-axis extension, profuse
extension twins, forming massively in the early stages of deformation, consumed the entire crystal, leaving no trace of the original matrix, which demonstrates the ease of nucleation and growth potential of extension twins. The dominant
extension twins corresponded to high Schmid factor twin variants in both cases of compression along 〈
〉 as well as 〈
〉 crystallographic directions. In both cases, basal slip was effectively suppressed in the twinned volume. The deformation behavior of the differently oriented crystals, however, was remarkably different.
extension twinning during compression along 〈
〉 resulted in a microstructure effectively comprising one single orientation (single crystal) with the
c-axis becoming parallel to the compression direction, i.e., twinning produced a single crystal of a ‘hard’ orientation. Preventing the formation of such a ‘hard’ texture component by promoting low Schmid factor twin variants is vital in order to improve the room temperature ductility. By contrast, in compression along 〈
〉, exceptionally high room temperature ductility can be achieved. Considering the microstructure evolution, the decisive difference was in the appearance of
contraction twins in the latter case, which were not present in the former. Subsequently, substantial weakening of the texture was attained by multiple generations of extension/contraction twins and the occurrence of dynamic recrystallization inside contraction twin bands. The formation of a hard basal texture component that is associated with poor room temperature ductility was therefore fully suppressed (for more details, see [
21]).
The formation of extension twins could not be prevented by the channel-die constraints when c-axis extension was confined; however, growth of this ‘profuse’ twin type was very well inhibited. The presence of high angle grain boundaries and, in particular, twin boundaries was found to be a prerequisite for the activation of contraction twinning by providing nucleation sites for the latter.
Prismatic slip was not found to operate at room temperature in the case of starting orientations most favorably aligned for prismatic slip; instead, cooperative
extension and
contraction twinning was activated (for more details see [
22]).
Deformation of crystals with ‘soft’ orientations that were favorably oriented for easy basal and coplanar basal slip, respectively, was characterized by a long initial region of low work hardening (stage A). The reduced shear hardening rates were and for easy basal slip and coplanar slip, respectively. The low work hardening region (stage A) of easy basal slip and coplanar basal slip gradually transitioned into a region of rapid work hardening (stage B) with shear rates that were an order of magnitude greater compared to stage A. The increase in work hardening in stage B was attributed to changes in the microstructure rather than the interaction of primary dislocations with forest dislocations.


