Article

Corrosion Fatigue Analysis in Power Steam Turbine Blade

by
José Alfredo Rodrígez Ramírez
1,
Christian Marisol Clemente Mirafuentes
2,*,
Manuela Alejandra Zalapa Garibay
2,
Juan C. García Castrejón
1 and
Luis Gonzalo Guillén Anaya
2
1
Centro de Investigación en Ingeniería y Ciencias Aplicadas, (CIICAp), Universidad Autónoma del Estado de Morelos, Av. Universidad 1001, Col. Chamilpa, Cuernavaca 62209, Mexico
2
Instituto de Ingeniería y Tecnología, Universidad Autónoma de Ciudad Juárez, Av. Del Charro Norte 450, Col. Partido Romero, Chihuahua 32310, Mexico
*
Author to whom correspondence should be addressed.
Metals 2023, 13(3), 544; https://doi.org/10.3390/met13030544
Submission received: 3 February 2023 / Revised: 21 February 2023 / Accepted: 3 March 2023 / Published: 8 March 2023
(This article belongs to the Special Issue Electrochemical Corrosion and Protection of Steels and Alloys)

Abstract

:
The corrosion fatigue behavior of a martensitic stainless steel AISI 410 with 12% Cr, used in the fabrication of steam turbine blades at low pressure (L-P), was studied using the electrochemical noise technique (EN) under mechanical fatigue (immersion and aired) conditions. The tests were done in a simulated environment using four levels of mechanical stress (Δσ) in a 3 wt.% NaCl solution at 90 °C. The specimens underwent pitting corrosion when exposed to the corrosive environment; afterwards, such pits generated mechanical strength sites over the metallic surface, facilitating the initiation and propagation of cracks, which was already enhanced by the applied cyclic loads. From scanning electron microscope (SEM) images, it was possible to observe localized plastic deformation. In such instances, the fatigue damage was caused by the microplasticity (μ), i.e., the shear strength, resulting from the breakdown of the passive layer that was subjected to mechanical load, which led to a significant increment of the velocity of crack propagation, and therefore, a decrement of the useful life of the material. The obtained results show that the fatigue resistance limit in the corrosive medium was lower than that observed in aerated conditions due to the sum of the effects of mechanical fatigue and corrosion.

1. Introduction

The blades of a steam turbine are critical components in electric power plants. Turbines convert the mechanical energy of high temperature, high pressure steam into electrical energy via the rotary movement of the steam turbine rotor [1,2]. Low-pressure turbine blades (L-P) are more susceptible to failure compared to high- or intermediate pressure blades (H-P and I-P, respectively).
These low-pressure blades experience fatigue failure under high and low cycles (HCF and LCF) due to centrifugal, steam and excitation forces. The latter is known as transitory resonance, because of the acceleration and deceleration of the rotor during shutdown and start-up operations [3,4]. These problems affect the useful life of the blades and, consequently, the performance of the steam turbine. The environment inside the turbine is another factor that affects the life of the blades, because of the contact of the working fluid with the surface, resulting in corrosion failure. This type of failure manifests in wear, dissolution or oxidation of the blades due to the presence of impurities in the fluid or steam, i.e., dissolved sodium chloride and sulfate. By the blades being in contact with the fluid, corrosion occurs which is localized and uniform; this involves electrochemical reactions between the metal surface and the working fluid [5,6,7].
Various studies have shown that the corrosion of martensitic stainless steel with 12% Cr can be severe due to the presence of sodium chlorate; such corrosion is typically generated in localized areas. Corrosion processes develop in different stages: the metastable growth of the pit; the dissolution of the substratum where the pit occurs; the growth of the pit, which will act as a stress concentrator; pit transition to crack nucleation; and finally, the occurrence of a fracture [8,9,10]. Damage accumulation due to fatigue not only depends on the load, but also on the synergistic effect of the stress (Δσ) and the environment inside the turbine. Therefore, the combined effect of both mechanisms is more severe and limits the operation of the steam turbines [11,12,13].
In this work, the corrosion fatigue behavior was evaluated using the electrochemical noise technique (EN). Similarly, elastic linear fracture mechanic theory was used to evaluate the influence of corrosion pits on the propagation velocities of cracks based on a cyclic load. Numerical methods were used to calculate the stress intensity factor (SIF) through finite elements, based on the results of the corrosion fatigue (CF) experimental tests. To complement these studies, mechanical fatigue tests were carried out under aerated conditions to compare the effects of stress amplitude on crack growth and propagation and the effect of corrosion pitting leading growth on crack propagation using specimens exposed to a 3% NaCl solution.

2. Materials and Methods

To study the effect of corrosion under mechanical loading, two stages of rotational bending fatigue tests with center loading were carried out: Stage 1—12 fatigue tests in aerated conditions; and Stage 2—12 fatigue tests following exposure to 3% NaCl. In addition, scanning electron microscopy (SEM) and spectroscopy (EDX) were used to observe the surfaces of the samples before and after the appearance of corrosion.

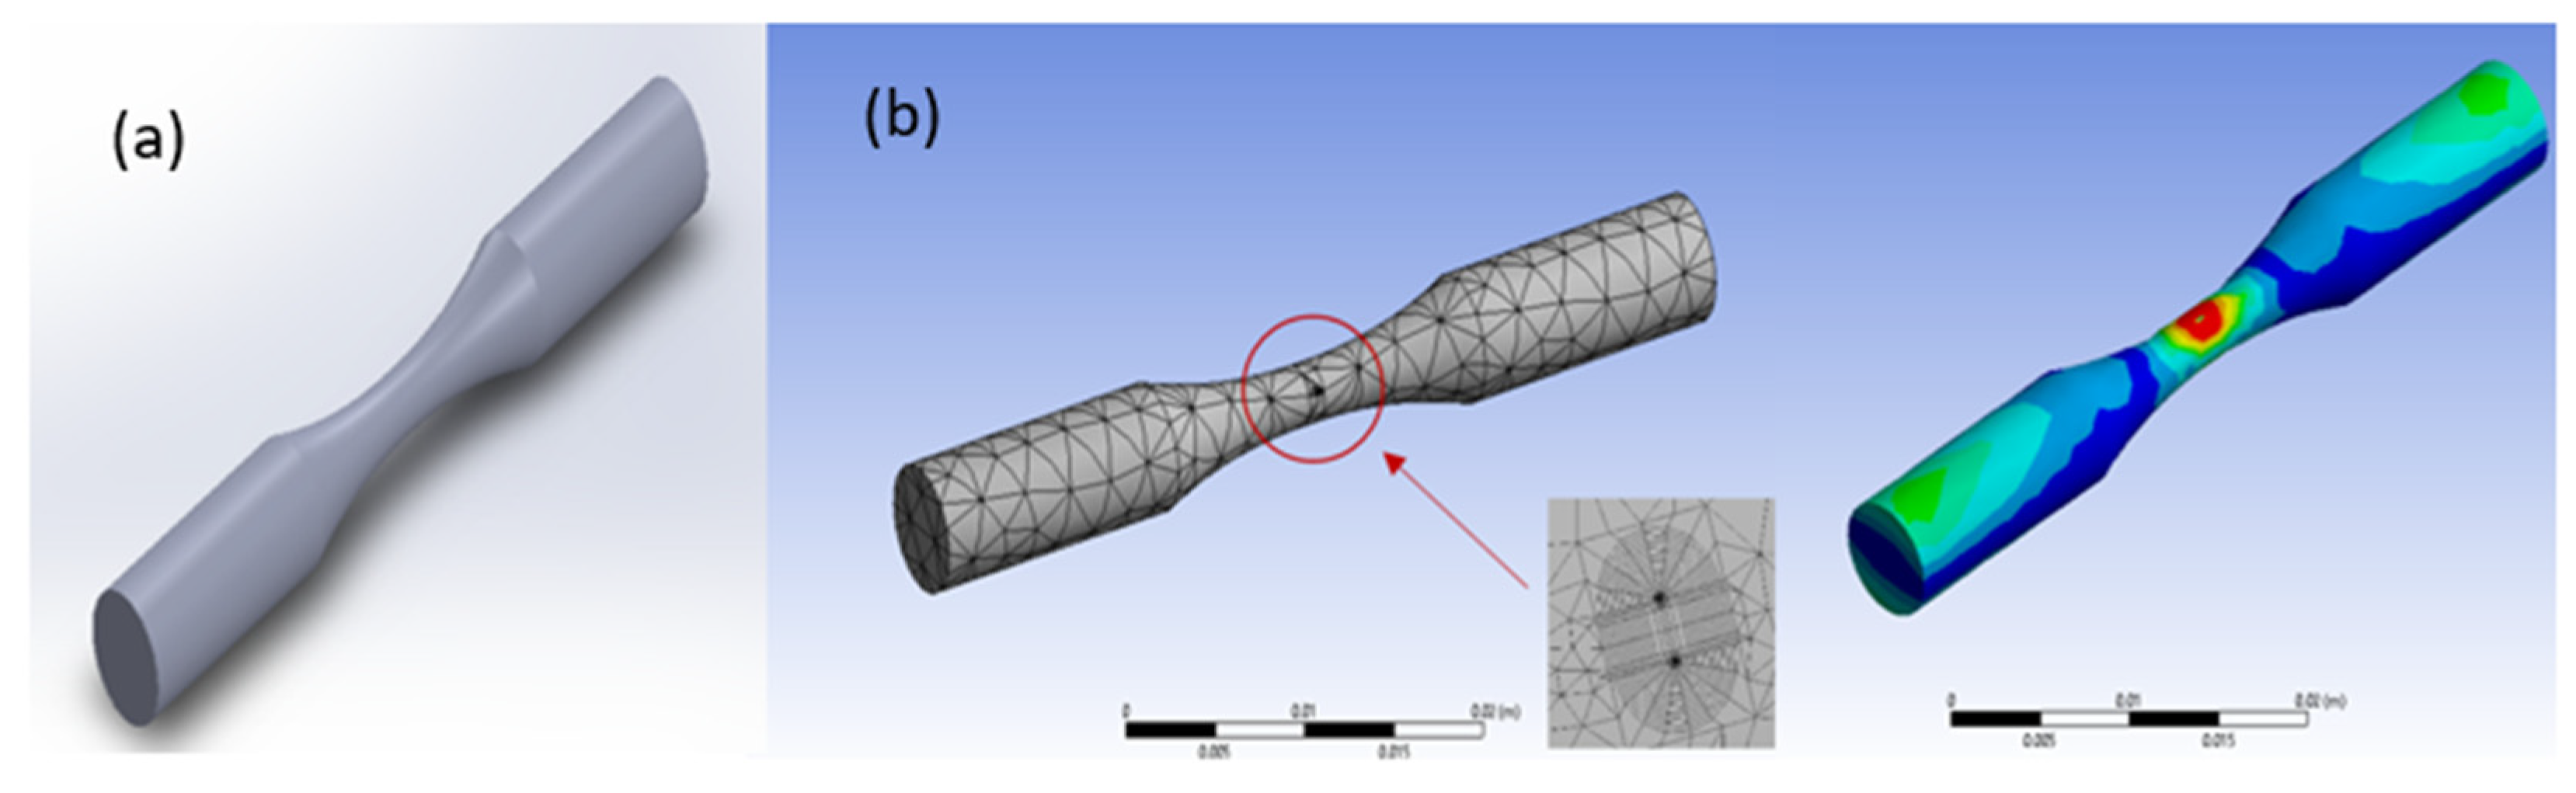
2.1. Specimen Preparation

AISI 410 martensitic type stainless steel was used as the study material; the mechanical properties and the chemical composition are shown in Table 1 and Table 2. The samples were machined according to the ASTM E466 [14] for corrosion fatigue, as seen in the Figure 1.

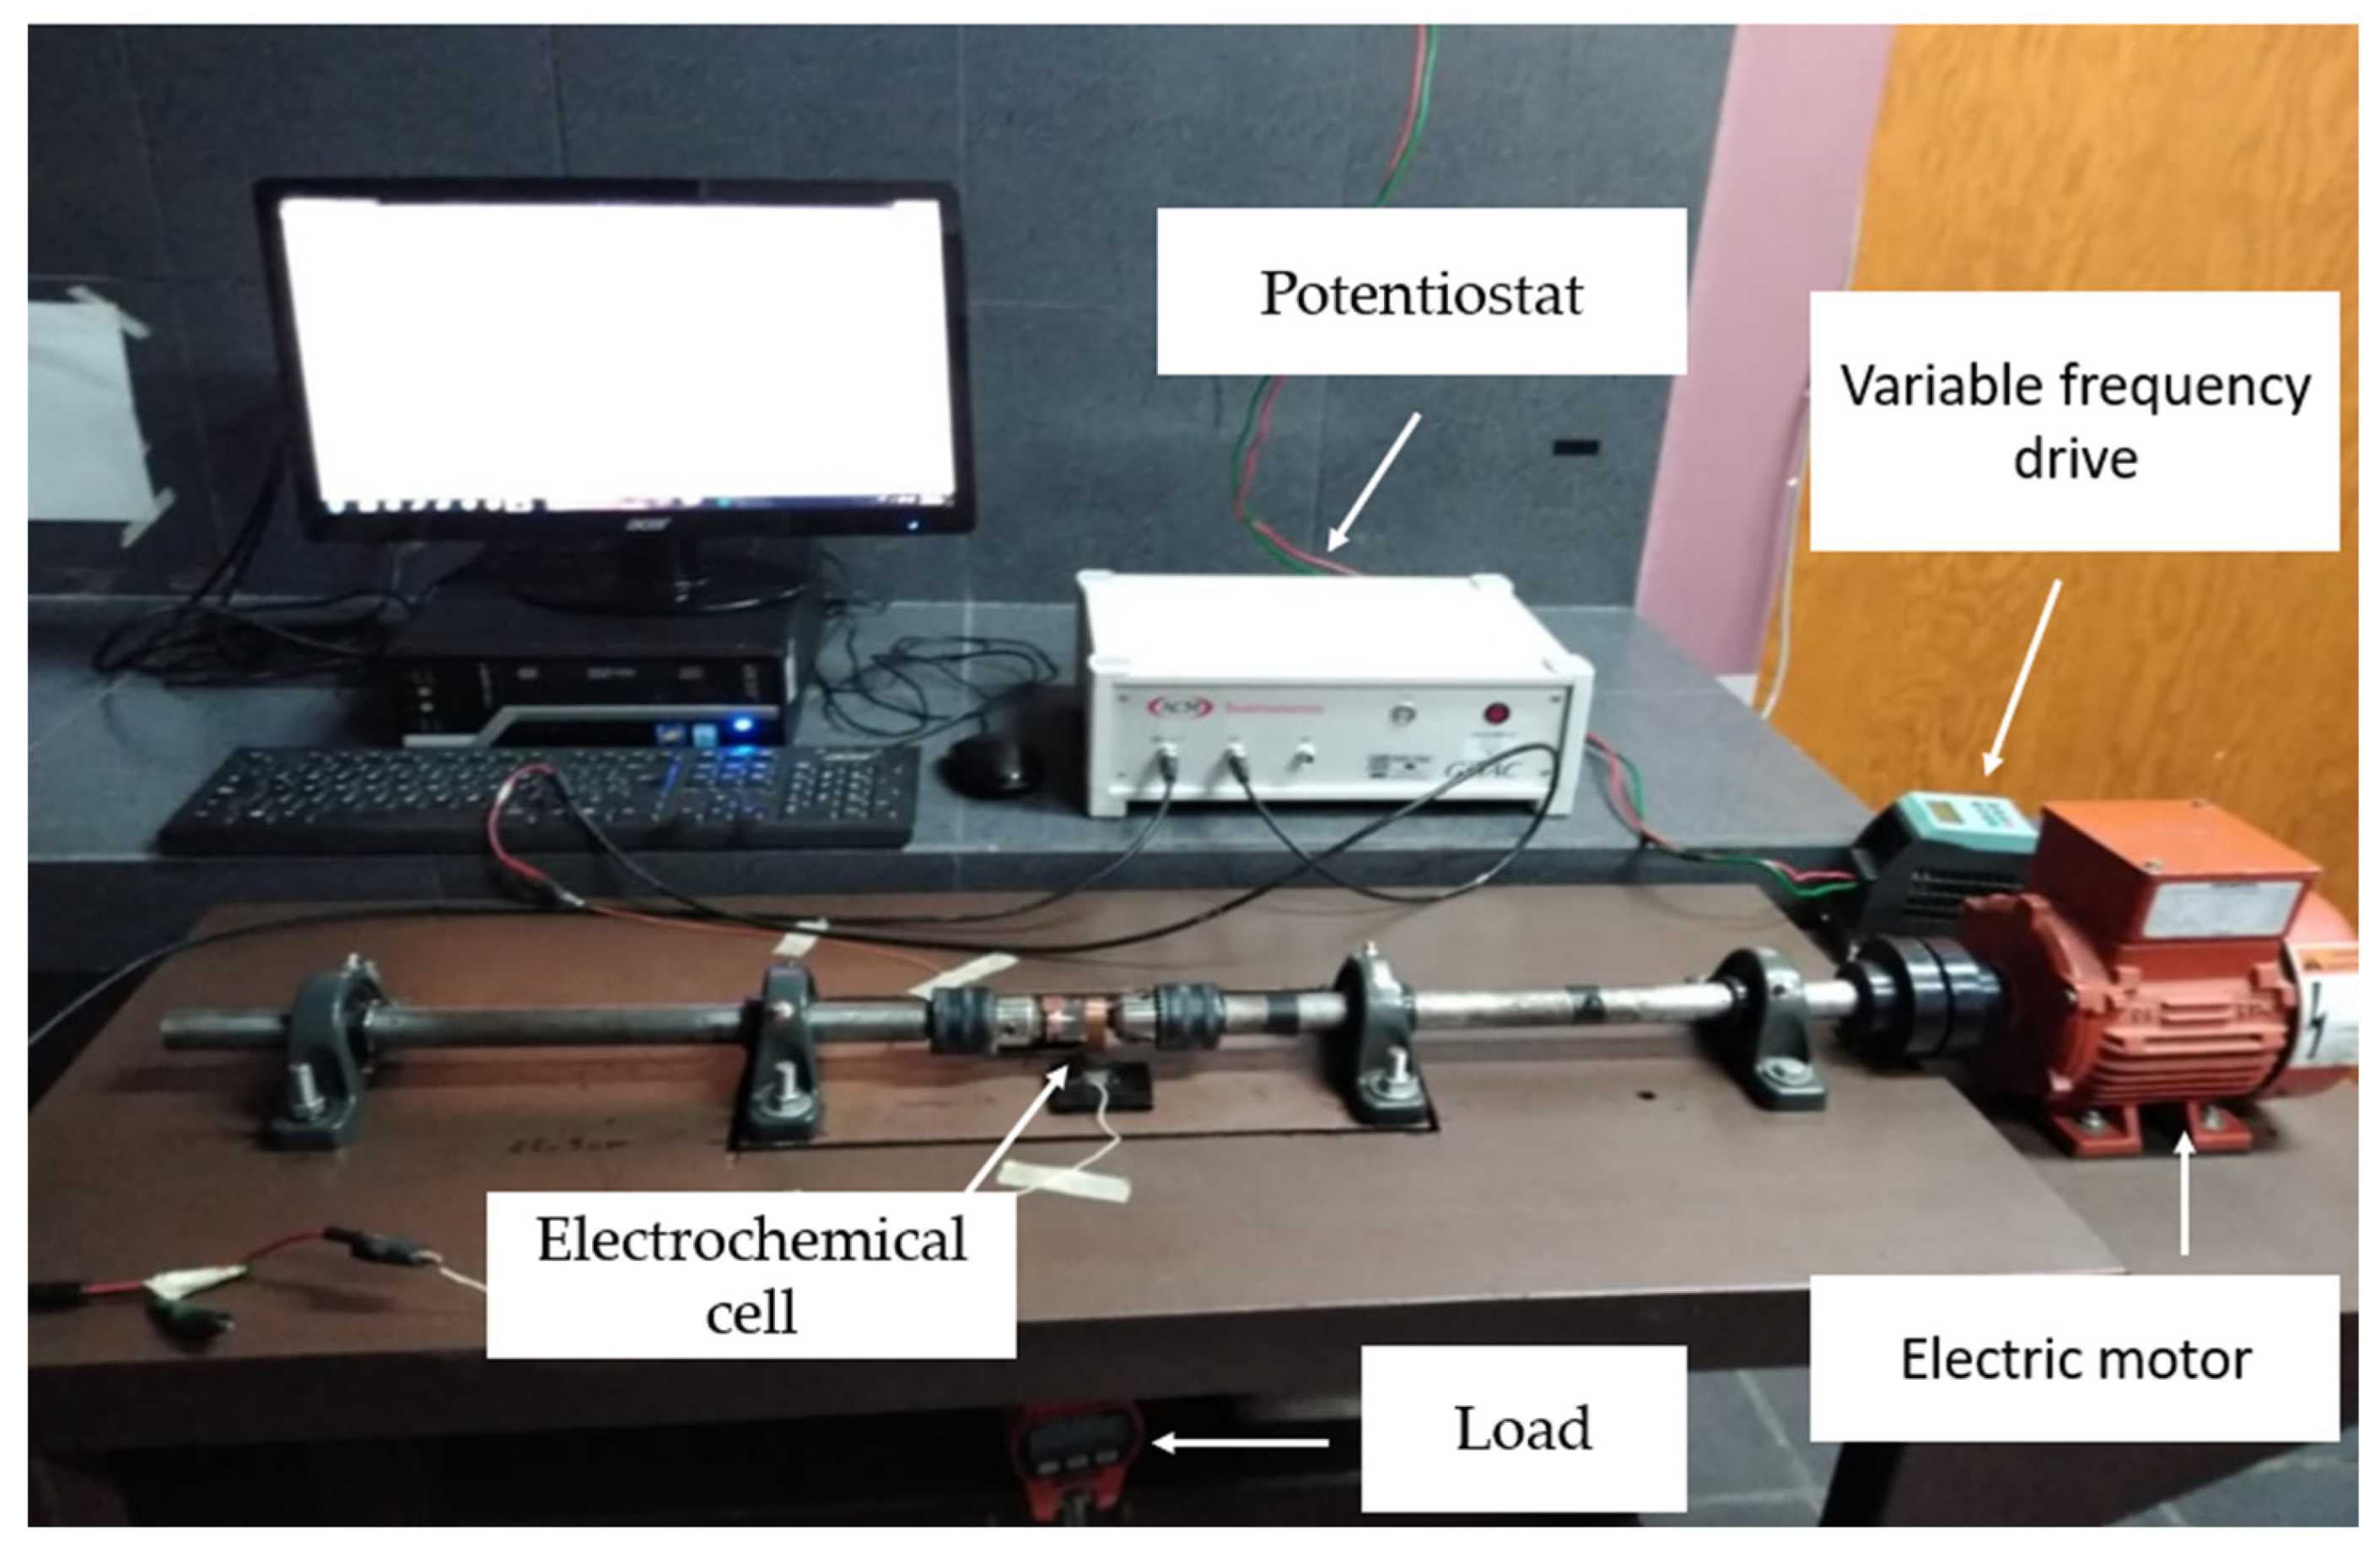
2.2. Corrosion Fatigue Test

For the electrochemical measurements, the specimens were prepared according to ASTM G01 and ASTM G31 [15,16]. The specimens were ground using 600 grit silicon carbide paper, rinsed with distilled water, degreased with acetone, and dried under a warm air stream. The electrochemical cell comprised a two-electrode setup, with one working electrode (the specimen) and one 0.5 mm diameter/50 mm long platinum wire as the reference. The two electrodes were electrically connected to an ACM Instruments potentiostat. The working electrode was spot welded to an 80Cr-20Ni wire, which was isolated using a 2 mm diameter acrylic tube. The gap between the wire and the tube wall was filled with epoxy resin. Electrochemical noise has been used to determine the type of corrosion, especially with localized corrosion; briefly, the potential noise provides data related to the corrosive activity. The electrochemical noise technique can be used to study aqueous corrosion during the initiation and propagation of cracks. Corrosion fatigue tests were performed on a fatigue machine with a rotative flexion type Moore at a frequency of 20 Hz, 1200 RPM and with four stress levels. An overview of all tests is given in Table 3. The load applied to each test was determined by the following Equation (1):
S = M c I
where M is the moment in the specimen, c the distance from the center to one point of interest of the specimen, and I is the inertia moment. The loads were applied between the bearings, i.e., the beam was simply supported to achieve a pure flexion, as shown in Figure 2. The samples rotated and were submitted to repetitive flexion loads and compression through the application of constant loads.
For the corrosion fatigue tests, a corrosion measurement cell was used that was designed and fabricated with an inert material, i.e., polymethyl methacrylate and epoxic resin. The cell had a capacity of 40 mL; it was filled with a 3 wt.% NaCl solution at 90 °C. Figure 3 shows the electrochemical cell array for the measurement of potential electrochemical noise. The array featured three electrodes: the working electrode (AISI 410 SS) and two platinum electrodes as references.

2.3. Crack Propagation Speed

Linear elastic fracture mechanics theory was used to compare crack propagation in immersed and aired specimens. The cracks in the specimens were generalized as defects with semielliptical forms, as is shown in Figure 4.
The crack propagation was calculated with the Paris Equation (2):
d a d N = C Δ K m
where C and m are the dimensional constants of the material, i.e., 1.35 × 10⁻¹⁰ y 2.25, respectively, based on the crack propagation of AISI 410 SS stainless steel [17]. This equation is related to the propagation speed of the crack, i.e., da/dN, and the range of stress intensity factor (ΔK); this factor quantitively describes the local stress at the tip of the crack. It is obtained with the following Equation (3).
K = f g Δ σ π α
where Δσ is the range of nominal stress applied in relation to the localization of the crack, α is the size of the crack, and f(g) is a polynomial factor that takes into account the conditions of the crack geometry, in this case, 1.12. Other parameters were obtained for the calculation of the propagation speed with the following Equation (4):
0 N 1 d N = a i a f d a C f g Δ σ π α m 2

2.4. Numerical Model to Measure Corrosion Fatigue

A numerical model was designed to estimate fatigue life based on a calculation of the stress intensity factor (K) along a semielliptical crack located on the surface of the specimen. The semielliptical crack was prolate with its major axis perpendicular due to the direction of the load application. This was done in the model to simulate observations of cracks due to fatigue in a corrosive environment.
The calculation was made through finite element analysis using the “Static Structural” module of ANSYS WORKBENCH. Figure 5 shows the crack geometry used to calculate the factor of stress intensity.
The geometry of the specimen, designed with SOLIDWORKS, is shown in Figure 6. The solid was meshed using tetrahedral elements; 16,513 nodes and 7645 elements were used to determine numerically the stress intensity factor (K) in order to predict the behavior of fatigue crack growth and estimate its useful life under aerated conditions and in a corrosive environment. Cracks with different size dimensions, determined from experimental tests on the geometry, were achieved. In the numerical analysis, they were also taken as boundary conditions: loads (N), rotational speed (rad/s), and material fatigue properties. Once the cracks of different sizes had been achieved, we sought to determine the stress intensity factor that exceeded the fracture toughness (KIC) of the material in order to visualize corrosion fatigue degradation.
Table 4 shows the properties of the fatigued material [18,19], which was introduced to ANSYS to calculate the stress intensity factor (K).

3. Results

3.1. Curve in Corrosion Fatigue

The stress vs. cycle number (S-N) curves were obtained in immersed and aired specimens, as shown in Figure 7. According to the obtained results, the fatigue resistance of the steel exposed to NaCl at 3% was reduced because of localized corrosion which was a consequence of the chloride ions that penetrated the surface of the material, causing the rupture of the passive layer of the surface of the specimen in some areas. Additionally, the mechanical load weakened the structure of the AISI 410 stainless steel. A passive layer was generated in some areas of the material but was mechanically damaged because of the fatigue load. A reduction of the lifespan of the specimen exposed to sodium chloride was also observed compared to that of the samples that had not been submerged in the solution. Through linear adjustment of the experimental data, the ratio of lifespan to fatigue in a corrosive and aired environment was determined:
A i r : log S = 3.6863 0.2026 × log N
N a C l   a l   3 % : log S = 3.6058 0.1885 × log N

3.2. a-N Curve in Corrosion Fatigue

The life prediction relative to fatigue was determined analytically through the a-N curve. Using this method, it is possible to determine if the blades can still operate even though there are cracks. By knowing the growth rate of cracks in blade materials, such blades can remain in service as long as the cracks do not surpass the critical size (ac) [20,21]. In order to produce a crack growth curve, it was necessary to subject the cracked PA2 and PE3 samples to cyclic loads of constant amplitude of 750.6 MPa; the two cracked specimens are shown in Figure 8. The data for the growth of a crack of constant amplitude (Δσ) are shown in Figure 9. The length of the crack (a) was determined relative to the corresponding cycle number (N) in which the crack was measured, obtained from experimental data for each specimen exposed to immersion and an aired environment. As shown in the a-N curve, a bigger propagation of crack occurred and a reduction in the number of cycles was observed for the specimen exposed to the NaCl solution. The loads on the tip of the crack and the pits caused the damage accumulation to be much greater once the crack had been initiated.

3.3. Curve da⁄dN-ΔK

Data for the crack propagation speed evaluation were obtained under experimental conditions R = −1 y (σmax) = 750 MPa. Figure 10 shows that the fatigue crack growth in a corrosive environment was bigger than that in aired conditions because, with each increase in mechanical load, a new surface was exposed to the NaCl solution, resulting in the accumulation of damage with each cycle and a reduction in the lifespan of the specimen.

3.4. Stress Intensity Factor

The stress intensity factor (K) was determined analytically and numerically along the cracks, as shown in Figure 11. The critical K was obtained based on the fracture toughness (KIC). The obtained stress intensity factor range (ΔK) was used to predict the behavior of crack growth due to fatigue/corrosion fatigue. Figure 12 shows (K) vs. crack length with stress values σ = 750 MPa, 667 MPa, 583 MPa, and 500 MPa in air and NaCl [22,23].
The results showed a bigger growth of (K) in the NaCl solution because of the interaction of the solution at the tip of the crack with the surface of the potential, which produced pitting corrosion, i.e., the main initiator of cracks.

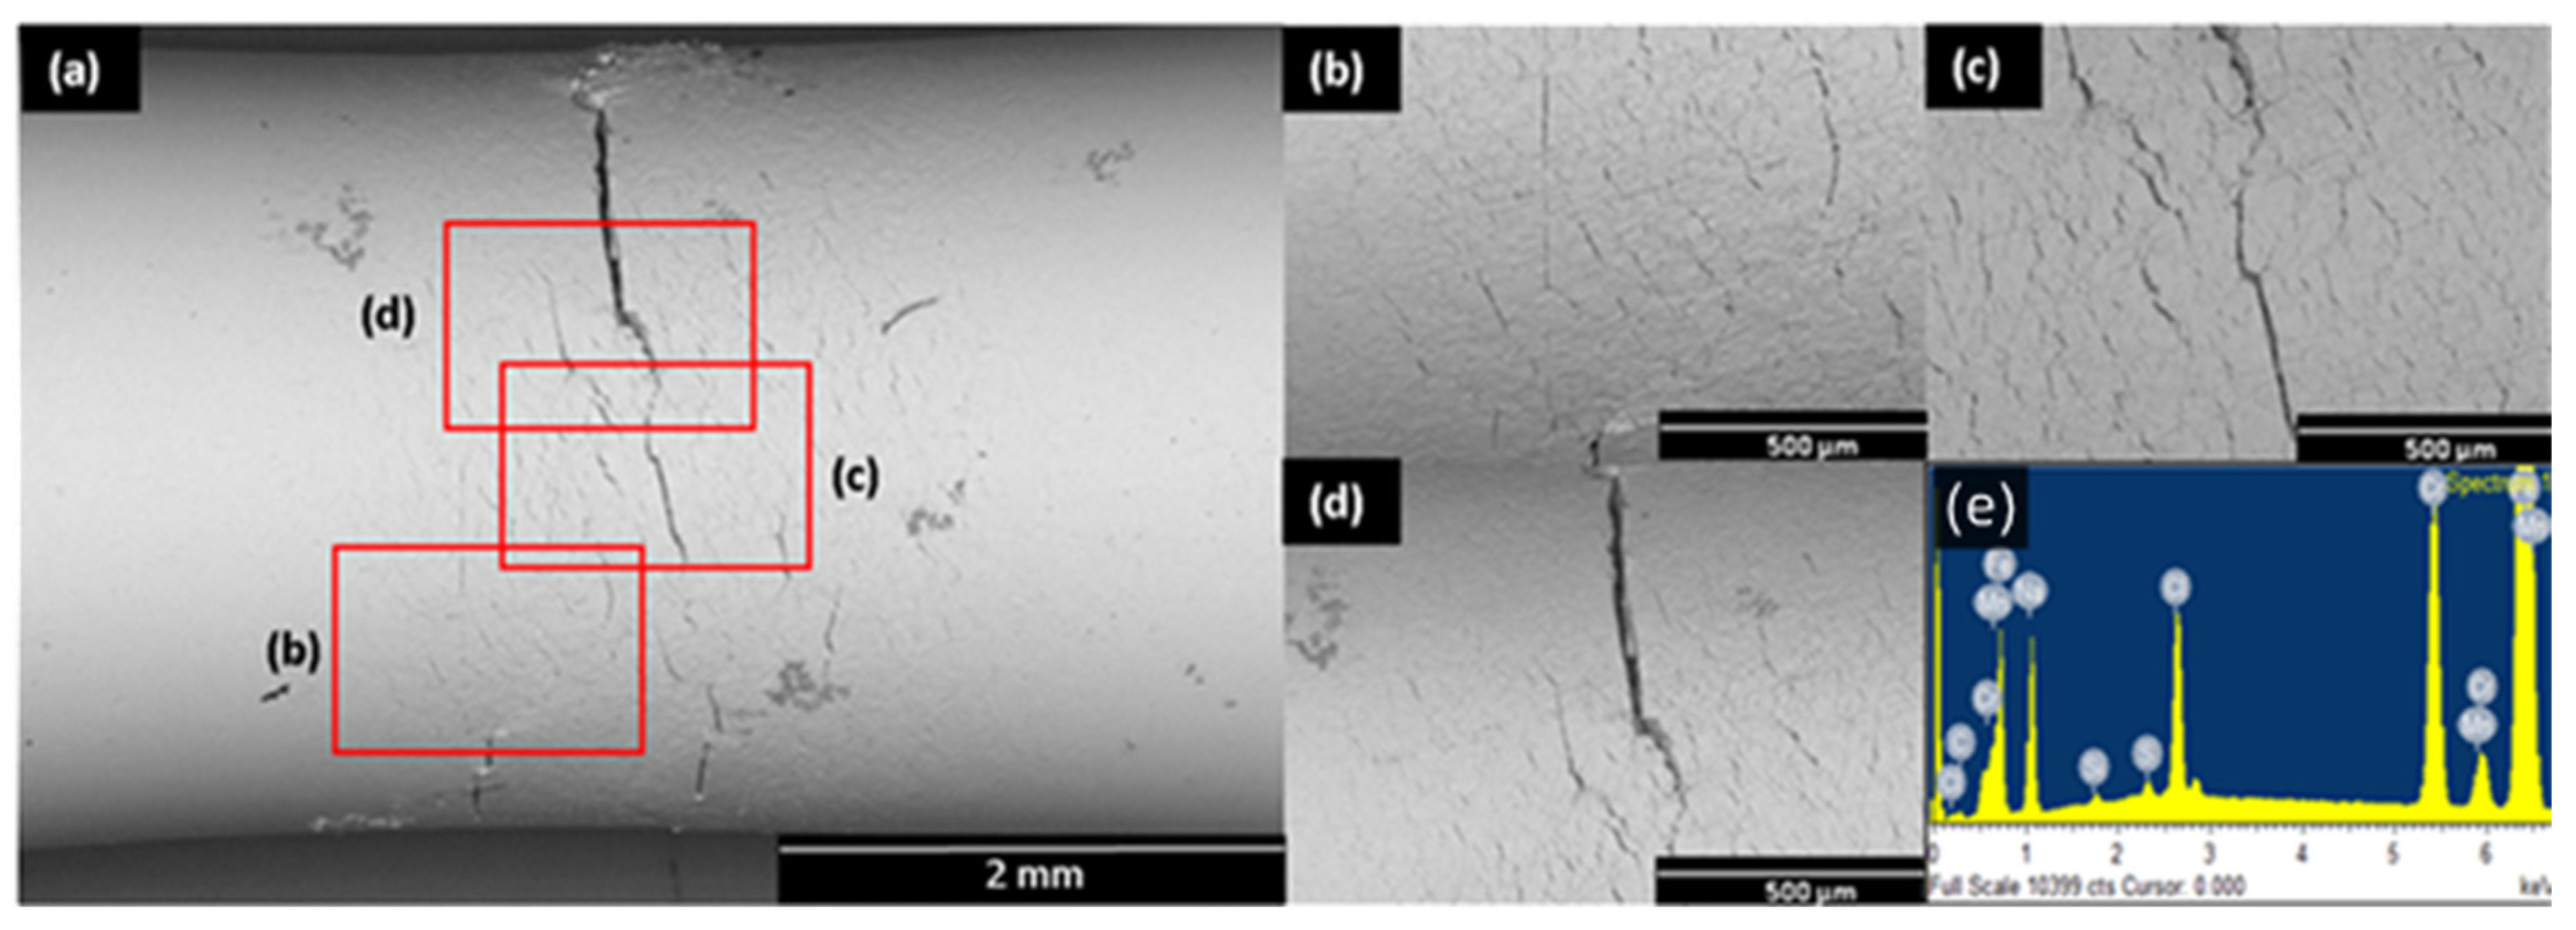
3.5. Scanning Electron Microscopy

The influence of the sodium chloride solution on AISI 410 SS in terms of material surface degradation, as consequence of the electrochemical processes between the steel and the corrosive solution, involves the charge transfer reactions that initiate the instability of the steel. The material exposed to the corrosive medium forms a chromium oxide protective layer, also called a passive layer. This layer can act as a barrier, protecting the material from the NaCl solution and limiting the oxidation and reduction corrosion reactions. However, the resistance of the passive layer is dependent on the environmental conditions to which the steel is exposed, as well as factors such as the chemical composition of the metal, the temperature, the concentration of the NaCl solution, and as the mechanical strength of the material. Figure 13, Figure 14, Figure 15 and Figure 16 present some images of samples that obtained the result more representative after being exposed to corrosion fatigue conditions in NaCl 3 wt.% at different load cycles; 750 MPa, 667 MPa, 583 MPa, 550 MPa. During the beginning of the load cycles, the initiation of cracks manifests in the formation of fine cracking lines on the metallic surfaces, called dislocations. Dislocations form due to localized stress which exceeds the tensile strength, as show Figure 13c, Figure 14d, Figure 15a and Figure 16b.
Once the fine cracking lines start to appear, the corrosive solution can enter the small cracks, and when the propagation of cracks develops, the depth and the width of the cracks increase, allowing the NaCl solution to penetrate more deeply inside the enlarged cracks as shown in Figure 13a, Figure 14a, Figure 15a and Figure 16a. As a consequence, the exposure surface of the AISI 410 SS also increases, and the degradation of the material accelerates. The relationship between the mechanical strength due the applied load and the subsequent formation of cracks directly affects the corrosion activity.
From the SEM images, it was possible to observe the localized plasticity on the material surface where the corrosion fatigue damage was caused by the micro-plasticity that was enhanced by the shear strength [22,23], as shown in Figure 13a and Figure 15d. At the beginning of the tests, AISI 410 SS formed a metallic oxide film via interaction with the corrosive medium; however, when the specimens were subjected to the load cycles, the protective film was mechanically damaged because of crack growth, causing some areas to undergo localized corrosion, a phenomenon that could be monitored by electrochemical potential noise measurements. The pits over the metallic surface intensify the stress in a localized way, causing additional damage to the material structure and generating a repetitive micro-deformation process, which is enhanced by the mechanical load as shown in Figure 13b,d
Figure 13c and Figure 14c show the cracking of the material due to the mechanical load and exposure of the corrosive medium. This was attributed to the localized attack of the aggressive medium in areas of the material where there was a concentration of stress, such as pits or ends of cracks, where intense attacks occurred, i.e., in anodic (dissolution) and cathodic (reduction) zones. On the other hand, Figure 13b,d show the corrosion products derived from the sodium chloride solution (protuberances and lighter areas), i.e., metal oxides. Figure 14d shows localized corrosion confined to an area in the form of cavities; the main cause of this was the rupture of the passive layer on the surface due to the presence of aggressive species and the concentration of chloride ions [24].
The zones marked as b, c and d in the Figure 15 and Figure 16 show fine lines parallel to the crack due to the initial fatigue loading conditions. The slip lines on the surface were due to dislocations (linear defects) in the material structure that could move and multiply under the action of shear stress, leaving permanent microstrains which resulted in the formation of new slip bands through the accumulation of stress in the grains of the material. All of this resulted in the initiation of a crack. Consequently, slip bands are associated with the breakdown of the passive layer, allowing the stainless steel surface to come into contact with the NaCl solution and facilitating the formation of pits and cracks [25,26,27].

3.6. Electrochemical Noise during Corrosion Fatigue

Figure 17 shows the electrochemical noise pattern (ENP) at different magnitudes of the studied load cycles. The ENPs were obtained under conditions of mechanical fatigue and following exposure to an aqueous solution of NaCl 3% (wt.%). In general terms, the electrochemical potential noise pattern of the four studied cases shows a periodical behavior of negative and positive transients, indicating localized corrosion and the recovery of the passive layer, respectively. The recurrence of the negative transients occurred because of the microcrack growth resulting from the applied mechanical loads. However, the highly negative potential transients may have indicated the propagation of larger cracks. The presence of larger cracks results in significant exposure of the metallic surface, since the corrosive solution can penetrate deep inside the cracks, exacerbating the anodic oxidation process and propagating cracks [28].
The presence of larger cracks increases the exposure of the metallic surface. The potential time series obtained from the electrochemical noise measurement under a load cycle of 750 MPa at 90% (Sult) showed a similar pattern in the three experimental tests with different load cycles. In the first test at 7344 cycles, a sequence of positive potential transients was observed up to 120 s, with an intensity of up to 70 mV. Afterwards, small magnitude oscillations appeared up to 200 s. This behavior showed the mechanism by which the material protects itself, i.e., through the formation of a passive oxide layer. Later, a negative transient of −150 mV was observed which remained stable for up to 245 s, indicating the formation of a crack and the propagation thereof, mainly as a result of the applied load. As stated above, when cracks appear and propagate, the exposed area of the material increases. Subsequently, a recovery of the potential was observed at 265 s, indicating the formation of metallic oxides around and inside the cracks. After 300 s, two positive transients were observed, indicating the repassivation of the material; however, the new passive layer subsequently broke and the metallic surface under mechanical load was again exposed to the corrosive solution, resulting in the formation of another crack, as evidenced by the negative transient that occurred at 326 s. The other two load cycles of 6492 and 7080 presented similar behavior, showing some drops in potential that indicated crack growth. However, the negative transients were not as intense as in the first case; this may have been due to the fact that material did not have a homogeneous microstructure, even though the specimens were obtained from the same commercial bar, or to the fact that the load cycles were smaller.
The time series from the electrochemical potential noise measured during the experimental test at a load cycle of 667.2 MPa (80% Sult) showed a higher white noise behavior with interesting positive and negative transients. The potential time series at a cycle of 18,576 showed continuous oscillations of small magnitudes at different times (white noise), indicating the formation of protective layers; however, at 210 and 415 s, large negative potential transients were observed, indicating the generation of microcracks over the metal surface. At 620 s, a potential recovery was observed, indicating the formation of a protective oxide on the surfaces of the cracks. After 14,532 load cycles, the behavior was similar to that at 18,576 cycles; however at 13,680 cycles, the white noise presented a much smaller magnitude, and only at 500 s was a potential transient of low intensity observed, indicating the possible generation of a micro-crack. This decreased noise pattern was probably due to the lowest magnitude of the load cycles. The electrochemical noise measurements for the 583.8 MPa (70% Sult) showed a similar noise pattern for the tests at 31,500 and 32,640 cycles, revealing a negative potential transient of −20 mV at 1500 s; this was probably associated with microcracks like those shown in Figure 13c. At 32,640 cycles, the potential increased; this was indicative of the trend of the material to form a protective oxide layer. With regard to the test with 27,972 cycles, the noise pattern, with several positive and negative transients of significant magnitude, clearly shows the corrosive activity and mechanical fracture of the AISI 410.
The positive transients were associated with the passivation of the material, whereas the negative transients indicated the formation of microcracks or/and the nucleation of pits. The potential time series obtained from the electrochemical noise measurement for a load of 500 MPa (60% Sult) showed a saw tooth pattern; this was related to crack growth. The negative potential transients of such a pattern evidence a characteristic corrosion fatigue mechanism, in which the rupture of the passive layer followed by the nucleation of pits and the parallel initiation and propagation of cracks occurred [29]. The recovery of the potential, especially at 59,400 cycles, was due to the passivation of the material; nevertheless, the aggressiveness of the corrosive solution and the applied load enhanced the localized corrosion, as shown in Figure 13d, where significant cracks and several pits are visible.

4. Conclusions

  • The S-N curves for AISI 410 SS, used in the manufacture of steam turbine blades, in an inert and corrosive environment (3% NaCl solution) were obtained considering a fatigue limit of 1 × 10⁵ cycles. It was found that the sodium chloride solution exacerbated material fatigue by up to 40% at room temperature. A fatigue limit was estimated at 345.65 MPa for the corroded specimens.
  • A better understanding was gained of the variation of the mechanisms behind the initiation and propagation of cracks when specimens are exposed to a corrosive medium and an inert environment. The a-N curves were determined together with the crack growth (da/dN) of AISI 410 SS under fatigue conditions. The mechanical performance of AISI 410 stainless steel was determined from these curves, indicating that the mechanical performance was affected by the corrosion process, decreasing the mechanical resistance despite the short duration of exposure to the corrosive environment. The crack lengths varied depending on the magnitude of the load to which the specimens were subjected during the tests.
  • From the electrochemical potential noise measurements, it was possible to monitor the corrosion fatigue activity of the AISI 410 SS at 90 °C. The noise pattern showed positive and negative transients, with the high intensity negative transients indicating the presence of pits on the material surface. This behavior was due to the damage of the passive layer resulting from its dissolution by the corrosive species, in addition to the applied loads which, in turn, enhanced the micro-deformation and led to the initiation of micro-cracks. These cracks then propagated due to the oxidation of the interior surfaces.

Author Contributions

J.A.R.R.: Writing and numerical simulation. C.M.C.M.: Investigation, Supervision, Methodology, Writing—review & editing, Funding acquisition. M.A.Z.G.: Data curation and SEM images analysis. J.C.G.C.: Writing and Electrochemical noise analysis. L.G.G.A.: Numerical simulation. All authors have read and agreed to the published version of the manuscript.

Funding

This research received no external funding.

Data Availability Statement

The data used to support the finding of this study are available from the corresponding author upon request.

Conflicts of Interest

The authors declare no conflict of interest.

References

  1. Wang, W.-Z.; Xuan, F.-Z.; Zhu, K.-L.; Tu, S.-T. Failure Analysis of the Final Stage Blade in Steam Turbine. Eng. Fail. Anal. 2007, 14, 632–641. [Google Scholar] [CrossRef]
  2. Mazur, Z.; Garcia-Illescas, R.; Aguirre-Romano, J.; Perez-Rodriguez, N. Steam Turbine Blade Failure Analysis. Eng. Fail. Anal. 2008, 15, 129–141. [Google Scholar] [CrossRef]
  3. Kim, H. Crack Evaluation of the Fourth Stage Blade in a Low-Pressure Steam Turbine. Eng. Fail. Anal. 2011, 18, 907–913. [Google Scholar] [CrossRef]
  4. Turnbull, A.; Zhou, S. Comparative Evaluation of Environment Induced Cracking of Conventional and Advanced Steam Turbine Blade Steels. Part 2: Corrosion Fatigue. Corros. Sci. 2011, 53, 503–512. [Google Scholar] [CrossRef]
  5. Cuevas-Artega, C.; Rodriguez, J.A.; Clemente, C.M.; Rodríguez, J.M. Pitting Corrosion Damage for Prediction Useful Life of Geothermal Turbine Blade. Am. J. Mech. Eng. 2014, 2, 164–168. [Google Scholar]
  6. Rodríguez, J.A.; Clemente, C.M. Damage Prediction in Geothermal Turbine Blades Based on the Measurement of Electrochemical Noise. Int. Organ. Sci. Res. 2016, 6, 19–24. [Google Scholar]
  7. Jonas, O.; Machemer, L. Steam Turbine Corrosion and Deposits—Problems and Solutions. In Proceedings of the 37th Turbomachinery Symposium, Texas A&M University. Turbomachinery Laboratories, Houston, TX, USA, 8–11 September 2008. [Google Scholar]
  8. Jiang, J.; Xu, D.; Xi, T.; Shahzad, M.B.; Khan, M.S.; Zhao, J.; Fan, X.; Yang, C.; Gu, T.; Yang, K. Effects of Aging Time on Intergranular and Pitting Corrosion Behavior of Cu-Bearing 304L Stainless Steel in Comparison with 304L Stainless Steel. Corros. Sci. 2016, 113, 46–56. [Google Scholar] [CrossRef]
  9. Bhandari, J.; Khan, F.; Abbassi, R.; Garaniya, V.; Ojeda, R. Modelling of Pitting Corrosion in Marine and Offshore Steel Structures—A Technical Review. J. Loss Prev. Process Ind. 2015, 37, 39–62. [Google Scholar] [CrossRef]
  10. Horner, D.A.; Connolly, B.J.; Zhou, S.; Crocker, L.; Turnbull, A. Novel Images of the Evolution of Stress Corrosion Cracks from Corrosion Pits. Corros. Sci. 2011, 53, 3466–3485. [Google Scholar] [CrossRef]
  11. Schönbauer, B.M.; Stanzl-Tschegg, S.E.; Perlega, A.; Salzman, R.N.; Rieger, N.F.; Turnbull, A.; Zhou, S.; Lukaszewicz, M.; Gandy, D. The Influence of Corrosion Pits on the Fatigue Life of 17-4PH Steam Turbine Blade Steel. Eng. Fract. Mech. 2015, 147, 158–175. [Google Scholar] [CrossRef]
  12. Zhou, S. Environmental Assisted Cracking of Turbine Blade Steels—A Review. 2007. Available online: https://eprintspublications.npl.co.uk/3813/ (accessed on 9 January 2023).
  13. Gandy, D.; Shingledecker, J.; Viswanathan, R. Advances in Materials Technology for Fossil Power Plants. In Proceedings of the Sixth International Conference; ASM International: Santa Fe, NM, USA, 2010. [Google Scholar]
  14. ASTM 466-15; Standard Practice for Conducting Force Controlled Constant Amplitude Axial Fatigue Tests of Metallic Materials. ASTM International: West Conshohocken, PA, USA, 2021. Available online: https://www.astm.org/e0466-15.html (accessed on 9 January 2023).
  15. ASTM G1-03; Standard Practice for Preparing, Cleaning, and Evaluating Corrosion Test Specimens. ASTM International: West Conshohocken, PA, USA, 2017. Available online: https://www.astm.org/g0001-03r17e01.html (accessed on 9 January 2023).
  16. ASTM G31; Standard Practice for Laboratory Immersion Corrosion Testing of Metal. ASTM International: West Conshohocken, PA, USA, 2012. Available online: https://www.astm.org/g0031-72r04.html (accessed on 9 January 2023).
  17. Arana, J.L.; González, J.J. Fracture Mechanics; Euskal Herriko Unibersitatea, Argitalpen Zerbitzua: Guipúzcoa, Spain, 2002; pp. 55–58. [Google Scholar]
  18. Rao, J.S. Turbine Blade Life Estimation; Alpha Science Int’l Ltd.: New Delhi, India, 2000. [Google Scholar]
  19. The Metals Black Book, 2nd ed.; 1: Ferrous Metals; CASTI Publ.: Edmonton, AB, Canada, 1995.
  20. Schweizer, C.; Seifert, T.; Nieweg, B.; von Hartrott, P.; Riedel, H. Mechanisms and Modelling of Fatigue Crack Growth under Combined Low and High Cycle Fatigue Loading. Int. J. Fatigue 2011, 33, 194–202. [Google Scholar] [CrossRef]
  21. Negru, R.; Marsavina, L.; Muntean, S.; Pasca, N. Fatigue Behaviour of Stainless Steel Used for Turbine Runners. In Advanced Engineering Forum; Trans Tech Publications Ltd.: Berlin, Germany, 2013. [Google Scholar]
  22. Miao, C.; Li, R.; Yu, J. Effects of Characteristic Parameters of Corrosion Pits on the Fatigue Life of the Steel Wires. J. Constr. Steel Res. 2020, 168, 105879. [Google Scholar] [CrossRef]
  23. Katinić, M.; Kozak, D.; Gelo, I.; Damjanović, D. Corrosion Fatigue Failure of Steam Turbine Moving Blades: A Case Study. Eng. Fail. Anal. 2019, 106, 104136. [Google Scholar] [CrossRef]
  24. Frankel, G.S. Pitting Corrosion of Metals: A Review of the Critical Factors. J. Electrochem. Soc. 1998, 145, 2186. [Google Scholar] [CrossRef]
  25. Krupp, U.; Alvarez-Armas, I. Short Fatigue Crack Propagation during Low-Cycle, High Cycle and Very-High-Cycle Fatigue of Duplex Steel—An Unified Approach. Int. J. Fatigue 2014, 65, 78–85. [Google Scholar] [CrossRef]
  26. Prasad Reddy, G.V.; Sandhya, R.; Laha, K.; Depres, C.; Robertson, C.; Bhaduri, A.K. The Effect of the Location of Stage-I Fatigue Crack across the Persistent Slip Band on Its Growth Rate—A 3D Dislocation Dynamics Study. Philos. Mag. 2017, 97, 1265–1280. [Google Scholar] [CrossRef]
  27. Ahmed, J.; Wilkinson, A.J.; Roberts, S.G. Study of Dislocation Structures near Fatigue Cracks Using Electron Channelling Contrast Imaging Technique (ECCI). J. Microsc. 1999, 195, 197–203. [Google Scholar] [CrossRef] [PubMed]
  28. Lu, B.T. Crack Growth Model for Pipeline Steels Exposed to Near-Neutral PH Groundwater. Fatigue Fract. Eng. Mater. Struct. 2013, 36, 660–669. [Google Scholar] [CrossRef]
  29. Arganis-Juarez, C.R.; Malo, J.M.; Uruchurtu, J. Electrochemical Noise Measurements of Stainless Steel in High Temperature Water. Nucl. Eng. Des. 2007, 237, 2283–2291. [Google Scholar] [CrossRef]
Figure 1. Geometry and dimensions of the specimen used in the experimental CF (in mm).
Metals 13 00544 g001
Figure 2. Rotating bending machine for the corrosion fatigue tests.
Metals 13 00544 g002
Figure 3. Electrochemical cell comprising W1 (AISI410 SS) and W2, i.e., the platinum reference electrode.
Metals 13 00544 g003
Figure 4. Semielliptical surface of a crack.
Metals 13 00544 g004
Figure 5. Crack geometry.
Metals 13 00544 g005
Figure 6. Geometry of the specimen with (a) SOLIDWORKS® and (b) ANSYS WORBENCH®.
Metals 13 00544 g006
Figure 7. Geometry S-N curve for 410 SS in air and in 3% NaCl under a maximum cycles stress of Δσ = 750.6 MPa, 667.2 MPa, 583.8 MPa, and 500.4 MPa. Load frequency f = 20 Hz.
Metals 13 00544 g007
Figure 8. Crack samples: PA2 (62,102 cycles) and PE3 (43,560 cycles).
Metals 13 00544 g008
Figure 9. Data of crack size with constant amplitude. a-N curve for 410 SS in air and 3% NaCl under a maximum cycle stress of Δσ = 750.6 MPa. Load frequency f = 20 Hz.
Metals 13 00544 g009
Figure 10. Comparison of the fatigue crack propagation curve for 410 SS in air and corrosion exposed 3% NaCl under maximum cycles stress of Δσ = 750.6 MPa, 667.2 MPa, 583.8 MPa, and 500.4, MPa. Load frequency f = 20 Hz.
Metals 13 00544 g010
Figure 11. Profile of the critical crack (ac).
Metals 13 00544 g011
Figure 12. Comparison of the stress intensity factors vs. crack length for 410 SS in air and corrosion exposed to 3% NaCl under load frequency f = 20 Hz.
Metals 13 00544 g012
Figure 13. Evaluation of the corrosion fatigue of AISI 410 SS during cyclic stress in NaCl up to 750 MPa. (a) Crack in the neck of the sample, (b) Localized corrosion on sample surface, (c) End of the crack, (d) Corrosion pitting on sample surface, (e) EDS of corrosion products.
Metals 13 00544 g013
Figure 14. Evaluation of the corrosion fatigue of AISI 410 SS during the cyclic stress in NaCl up to 667 MPa. (a) Crack in the neck of the sample, (b) Localized corrosion on sample surface, (c) pitting corrosion, (d) Crack on sample surface, (e) EDS of corrosion products.
Metals 13 00544 g014
Figure 15. Evaluation of the corrosion fatigue of AISI 410 SS during cyclic stress in NaCl up to 583 MPa. (a) Crack in the neck of the sample, (b) Microcracks on sample surface, (c) Microcracks on sample, (d) Crack on sample surface and pitting corrosion, (e) EDS of corrosion products.
Metals 13 00544 g015
Figure 16. Evaluation of the corrosion fatigue of AISI 410 SS during cyclic stress in NaCl up to 500 MPa. (a) Crack in the neck of the sample, (b) End of crack, (c) Localized corrosion, (d) Corrosion pitting on sample surface, (e) EDS of corrosion products.
Metals 13 00544 g016
Figure 17. Time series of the electrochemical potential noise for AISI 410 SS exposed to a 3% NaCl solution under maximum stress of: σmax = (a) 750 MPa (90 % Sult); (b) 667 MPa (80% Sult); (c) 583 MPa (70% Sult), and (d) 500 MPa (60% Sult), with load frequency f = 20 Hz y R = −1.
Metals 13 00544 g017
Table 1. Chemical composition of AISI 410 SS at ambient temperature.
CCrMnSiNiMoCuSPFe
0.13120.410.220.30.180.0090.0020.020Bal.
Table 2. Mechanical properties of AISI 410 SS.
Tensile Strength (MPa)Yield Strength (MPa)Elongation (A%)Area Reduction (%)
8347211240
Table 3. Stress levels used in the four corrosion fatigue tests.
Stress (MPa)Load (N)
75047.17
66741.92
58340.75
50034.93
Table 4. Fatigue properties of AISI 410 SS.
PropertyMagnitude
Fatigue strength coefficient, σf1655 MPa
Fatigue ductility coefficient, ε′f0.73
Fatigue strength exponent, b−0.076
Fatigue ductility exponent, c−0.62
Cyclical deformation hardness exponent, n′0.14
Cyclical resistance coefficient, K′750 MPa
Disclaimer/Publisher’s Note: The statements, opinions and data contained in all publications are solely those of the individual author(s) and contributor(s) and not of MDPI and/or the editor(s). MDPI and/or the editor(s) disclaim responsibility for any injury to people or property resulting from any ideas, methods, instructions or products referred to in the content.

