1. Introduction
Residual stresses generated as a result of a conforming process are a problem of the major concern in engineering. These stress states play a key role in the catastrophic failure of structural components such as prestressing steel wires that are highly susceptible to hydrogen embrittlement (HE) related phenomena [
1,
2,
3,
4,
5]. So, any effort leading to reduce residual stress is strongly welcomed. In the particular case of the wire drawing (the conforming process widely used for obtaining commercial prestressing steel wires to be used in prestressed concrete), different methods are used in order to obtain more efficient and reliable components. On one hand, some of them are composed by diverse post-drawing treatments with the aim of releasing the stress distribution after cold drawing [
6]. On the other hand, others are based on design modifications of the conforming process, mainly focused on the die geometry [
7,
8,
9,
10,
11,
12,
13,
14].
Numerical simulations by means of finite element method (FEM) are considered in many studies as a useful and reliable tool for revealing the residual stress caused after wire drawing [
15,
16,
17,
18]. Thus, FEM simulations are used for analyzing the influence of diverse parameters of the manufacturing process such as die geometry (reduction ratio, inlet die angle, bearing length,…) [
10,
14,
17,
18,
19,
20,
21,
22], friction [
17,
18,
20,
21], drawing speed [
17,
22,
23], drawing steps [
16], drawing force [
16,
19,
21], back tension [
16]. In addition, FEM simulations were also used for studying the benefits of innovative designs of wire drawing process [
14,
23,
24]. Furthermore, FEM simulations are applied for the analysis of the role of material behavior analyzing the material strain hardening [
17,
25,
26]. Moreover, FEM simulations are widely used for the analysis of the generation and evolution of defects during wire drawing [
27,
28,
29] and their influence on fracture-related phenomena [
30,
31]. In addition, the influence of inclusions on fracture of cold drawn wires are analyzed in multiple studies by means of FEM simulations [
32,
33].
It is worth to point out that an improvement of the mechanical behaviour against fatigue is achieved when residual stresses of compressive nature are generated near the wire surface [
34]. Thus, today, the use of surface post-treatments such as shot peening (whose aim is to introduce a compressive stress in the vicinity of the component surface) is widespread in industry for increasing the life of parts undergoing fatigue loading. Taking into account the same idea, to promote a compressive stress state at the part surface, a process known as skin pass is also used [
12,
13]. Briefly, this one consists of applying a soft reduction of the wire diameter at the end of the drawing chain. In certain cases, the skin pass is performed in the same drawing die [
12]. According to [
12], a final reduction of 1–5% of the wire diameter, developed in the same die, causes a significant reduction and redistribution of the stress state.
Cold drawn wires are highly susceptible to hydrogen-damage-related phenomena, in particular to HE [
35,
36]. Stress and strain state plays a key role in the main stage of such a phenomenon: the hydrogen diffusion from the hydrogenation surface towards prospective damage zones. The variables representing the stress and strain state in the well-known hydrogen diffusion model [
37,
38,
39,
40,
41,
42] are the inwards gradient of hydrostatic stress and the inwards gradient of hydrogen solubility dependent on equivalent plastic strain. These variables act as driving forces for hydrogen diffusion and, hence, hydrogen is diffused from the hydrogenation surface towards inner points with (i) lower hydrogen concentration, (ii) higher hydrostatic stress and (iii) higher hydrogen solubility that depends on equivalent plastic strain.
Unfortunately, there is a lack of information with regard to the influence of skin pass on the stress redistribution of the aforesaid variables and, therefore, on hydrogen diffusion causing HE in prestressing steel wires. So, to fill this gap, in this paper, the effects of the skin pass on the reduction and redistribution of the manufacturing-induced residual stress and strain fields in cold drawn pearlitic steel wires are analyzed. Special attention is paid to the variables involved in the hydrogen diffusion assisted by stress and strain causing HE: the hydrostatic stress and the equivalent plastic strain. To achieve this goal, diverse wire drawing processes were simulated by means of finite elements considering modified drawing dies with different soft secondary reductions degrees, to reveal the residual stress and strain states. The obtained results are compared with the residual stress and strain fields obtained after the first step of an industrial wire drawing process with conventional dies, i.e., without skin pass zone, used for obtaining a real commercial prestressing steel wire. In addition, a numerical simulation by FE of the hydrogen diffusion assisted by stress and strains were carried out in order to estimate the hydrogen accumulation in wires drawn using a conventional die and using an optimal skin pass die (including a soft secondary wire diameter reduction) from the mechanical point of view. This way, the improvement of the mechanical behaviour of the wires in inert and hydrogenating environments can be estimated, and the optimal values for developing the modified wire drawing are revealed.
2. Materials and Methods
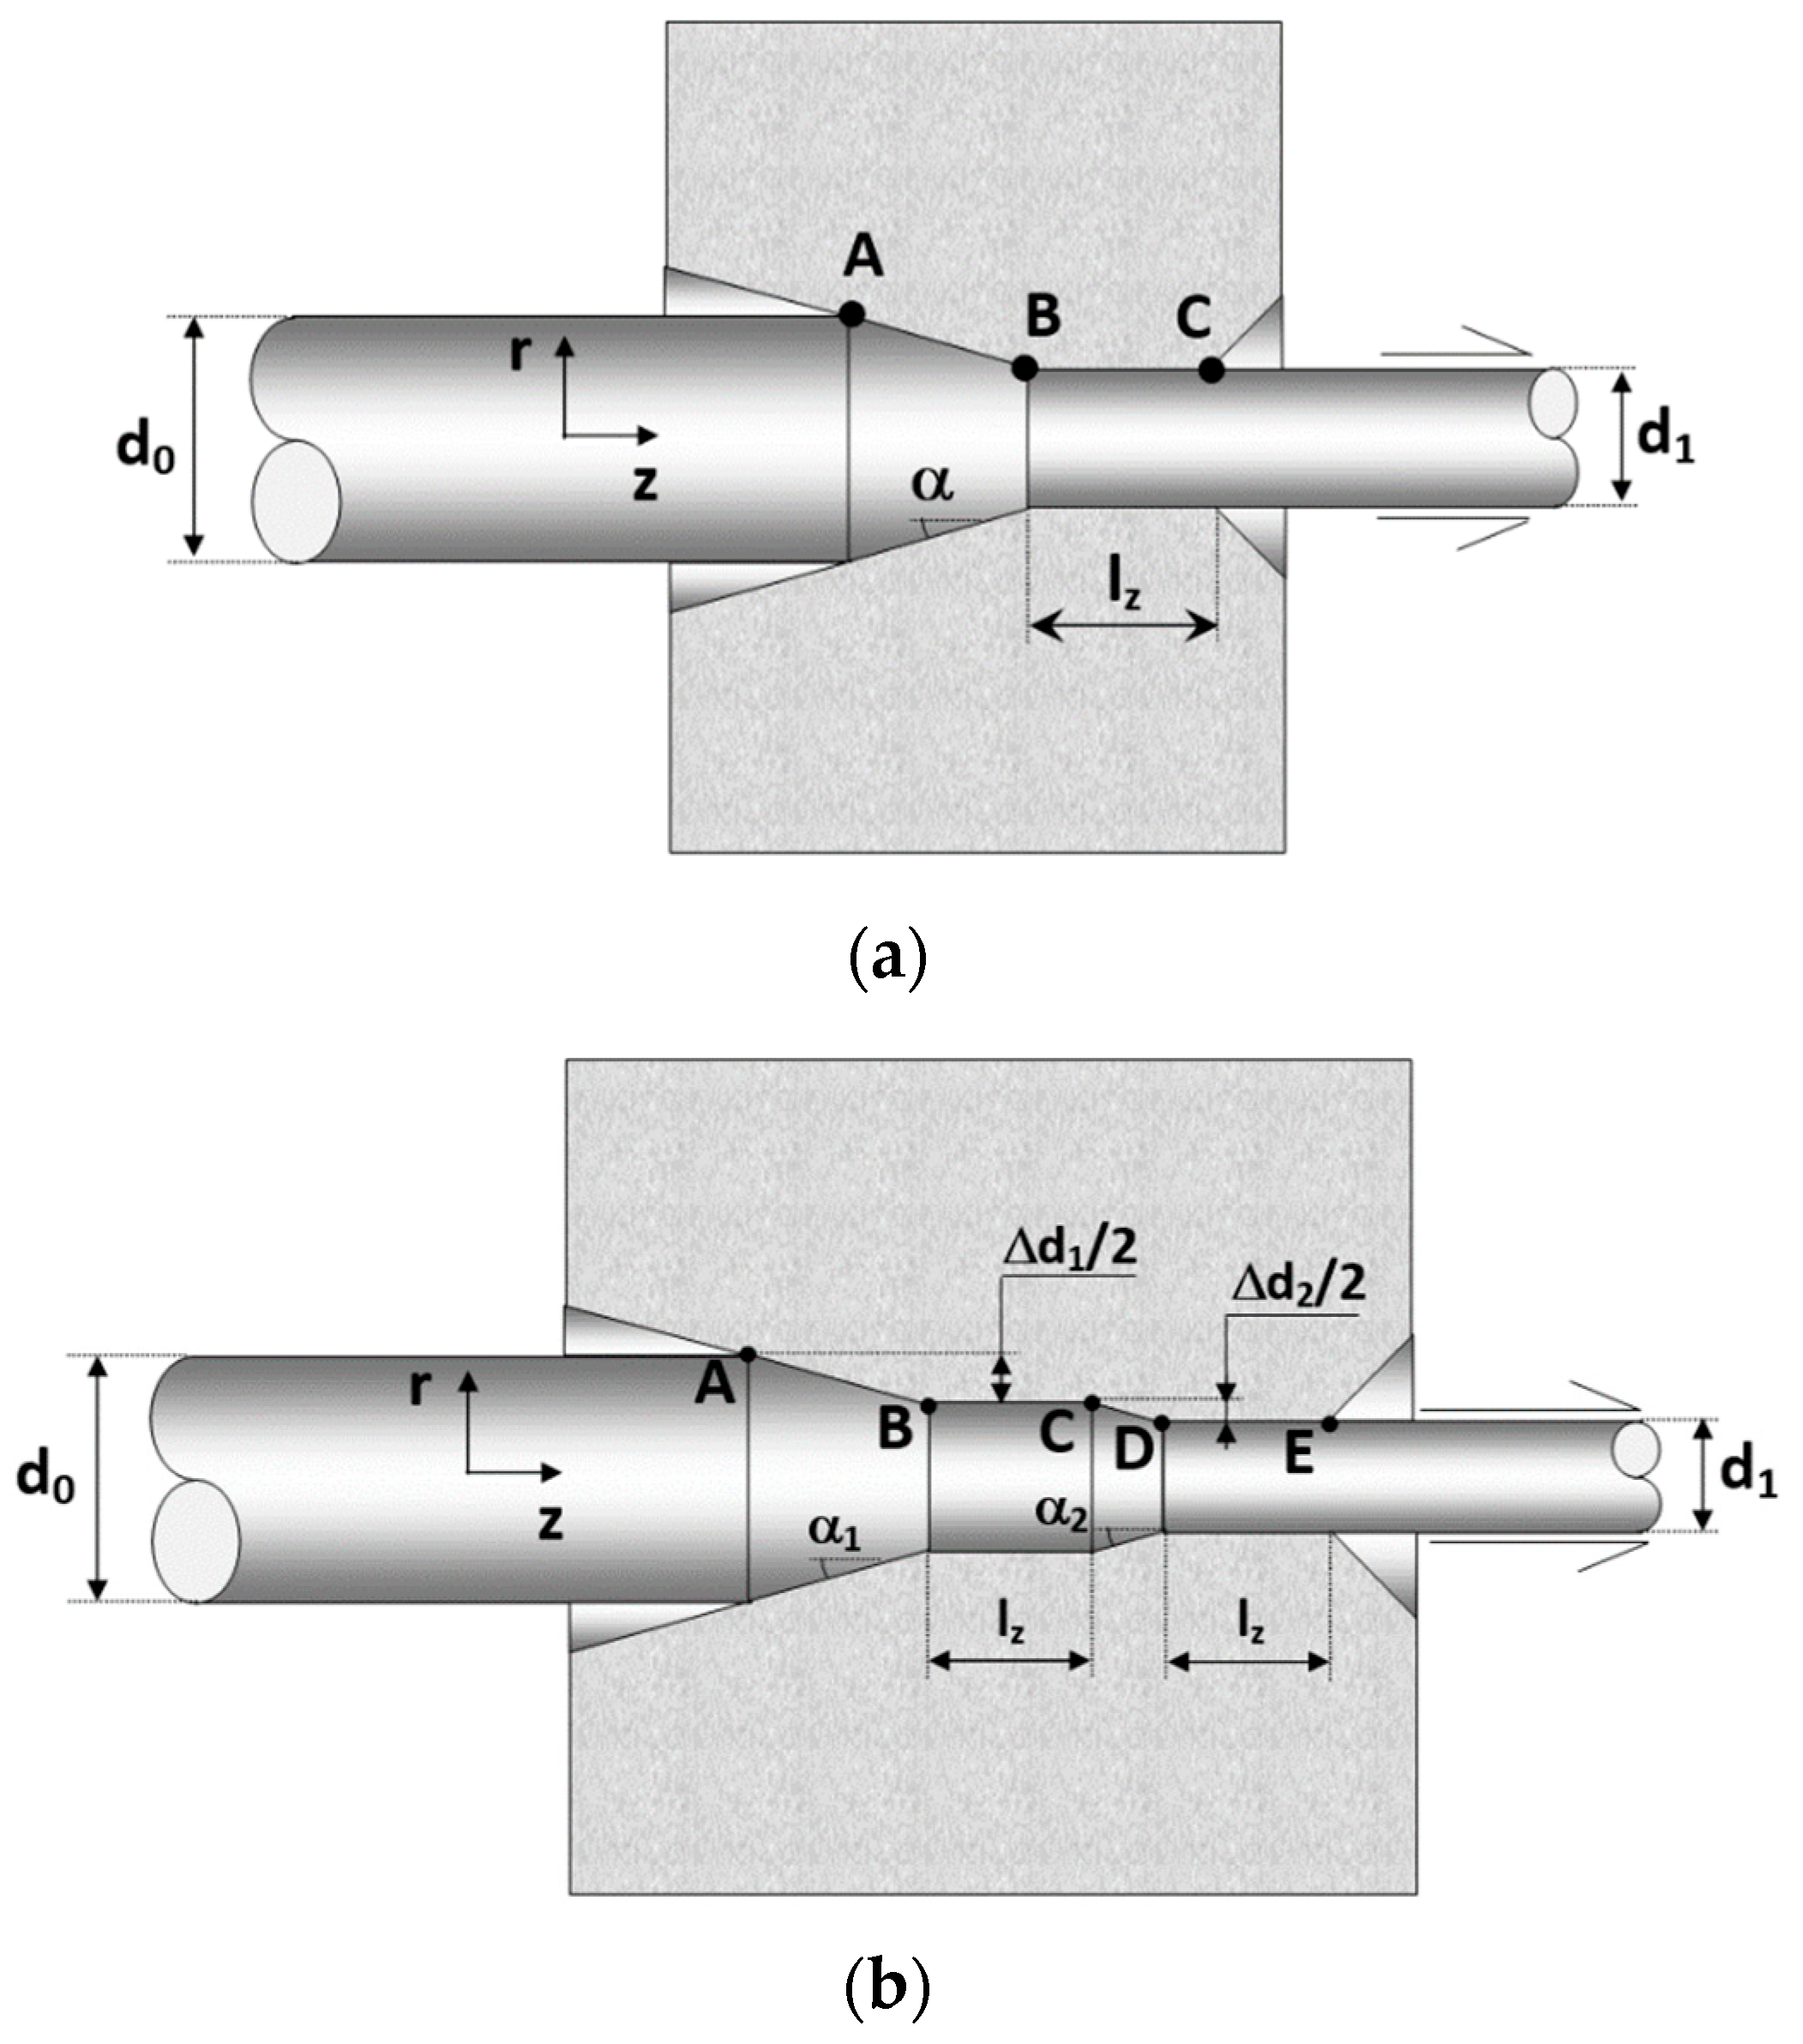
The numerical simulation of wire drawing was carried out considering diverse die geometries by means of a commercial FEM code (MSC.Marc). The geometry of a conventional die (
Figure 1a) can be divided into two main zones: the wire reduction zone (A–B in
Figure 1a) and the bearing length zone (B–C in
Figure 1a). According to the study [
10], soft variations of the inlet die angle (α) produce significant variations on the plastic strain and the residual stress distributions, whereas such changes on the residual stress and strain state are only noticeable when the bearing length (
lz) is lower than a characteristic value (
lz =
d0),
d0 being the initial wire diameter. However, for defining the geometry of the modified drawing die where a secondary soft reduction (CD zone in
Figure 1b) after the main bearing length (BC zone in
Figure 1b), two additional parameters are needed: the secondary die angle (α
2) and the secondary diameter reduction (∆
d2).
To reveal the influence of the secondary reduction (∆
d2 in
Figure 1b) on the residual stress and strain states after wire drawing with modified drawing dies, four different numerical simulations of the first step of a commercial wire drawing process were carried out. In this drawing step, the cross-sectional area of the wire is reduced from an initial diameter
d0 = 12.0 mm to a final one
d1 = 10.8 mm (wire radius,
a = 5.4 mm). For the modified drawing dies including the skin pass zone, the whole drawing step diameter reduction (Δ
d = 1.2 mm) is divided into two consecutive reductions: the main reduction (∆
d1 in
Figure 1b) and the secondary reduction (∆
d2 in
Figure 1b).
A dimensionless parameter called skin pass reduction ratio λ, defined as λ = ∆d2/∆d, is used in this study. This way, the following reduction ratios were considered in the analysis: (i) a slight reduction λ = 1/24, i.e., ∆d1 = 1.15 mm and ∆d2 = 50 μm, two medium reductions, (ii) λ = 1/12, i.e., ∆d1 = 1.10 mm and ∆d2 = 100 μm, (iii) λ = 1/6, i.e., ∆d1 = 1.00 mm and ∆d2 = 200 μm, and finally (iv) a high reduction λ = 1/3, i.e., ∆d1 = 0.80 mm and ∆d2 = 400 μm. For all the cases, the same bearing length (lz = d0) was considered after the main and secondary reductions.
Finally, an inlet die angle commonly used in conventional wire drawing was chosen for both the primary and the secondary reductions (α
1= 7°, α
2 = 7°). Axisymmetric formulation was applied due to the radial symmetry of both wire and die considering elastoplastic large deformations with updated Lagrangian formulation. Several meshes were used until required mesh convergence was achieved. The material considered in simulations is a pearlitic steel obtained from a real drawing chain with the following chemical composition: 0.800% C, 0.690% Mn, 0.230% Si, 0.012% P, 0.009% S, 0.004% Al, 0.265% Cr, 0.060% V [
43]. The pearlite colony of the hot rolled bar analyzed in this study can be considered as an ellipsoidal geometry according to [
44]. Thus, the longitudinal section and transverse section of such ellipsoid are ellipses with the following axis length: 20 μm and 10 μm at the longitudinal section; 15.2 μm and 14.8 μm at the transversal section according to the analysis developed in the study [
44]. The interlamellar spacing of the hot roller bar is 0.056 μm according to [
45].
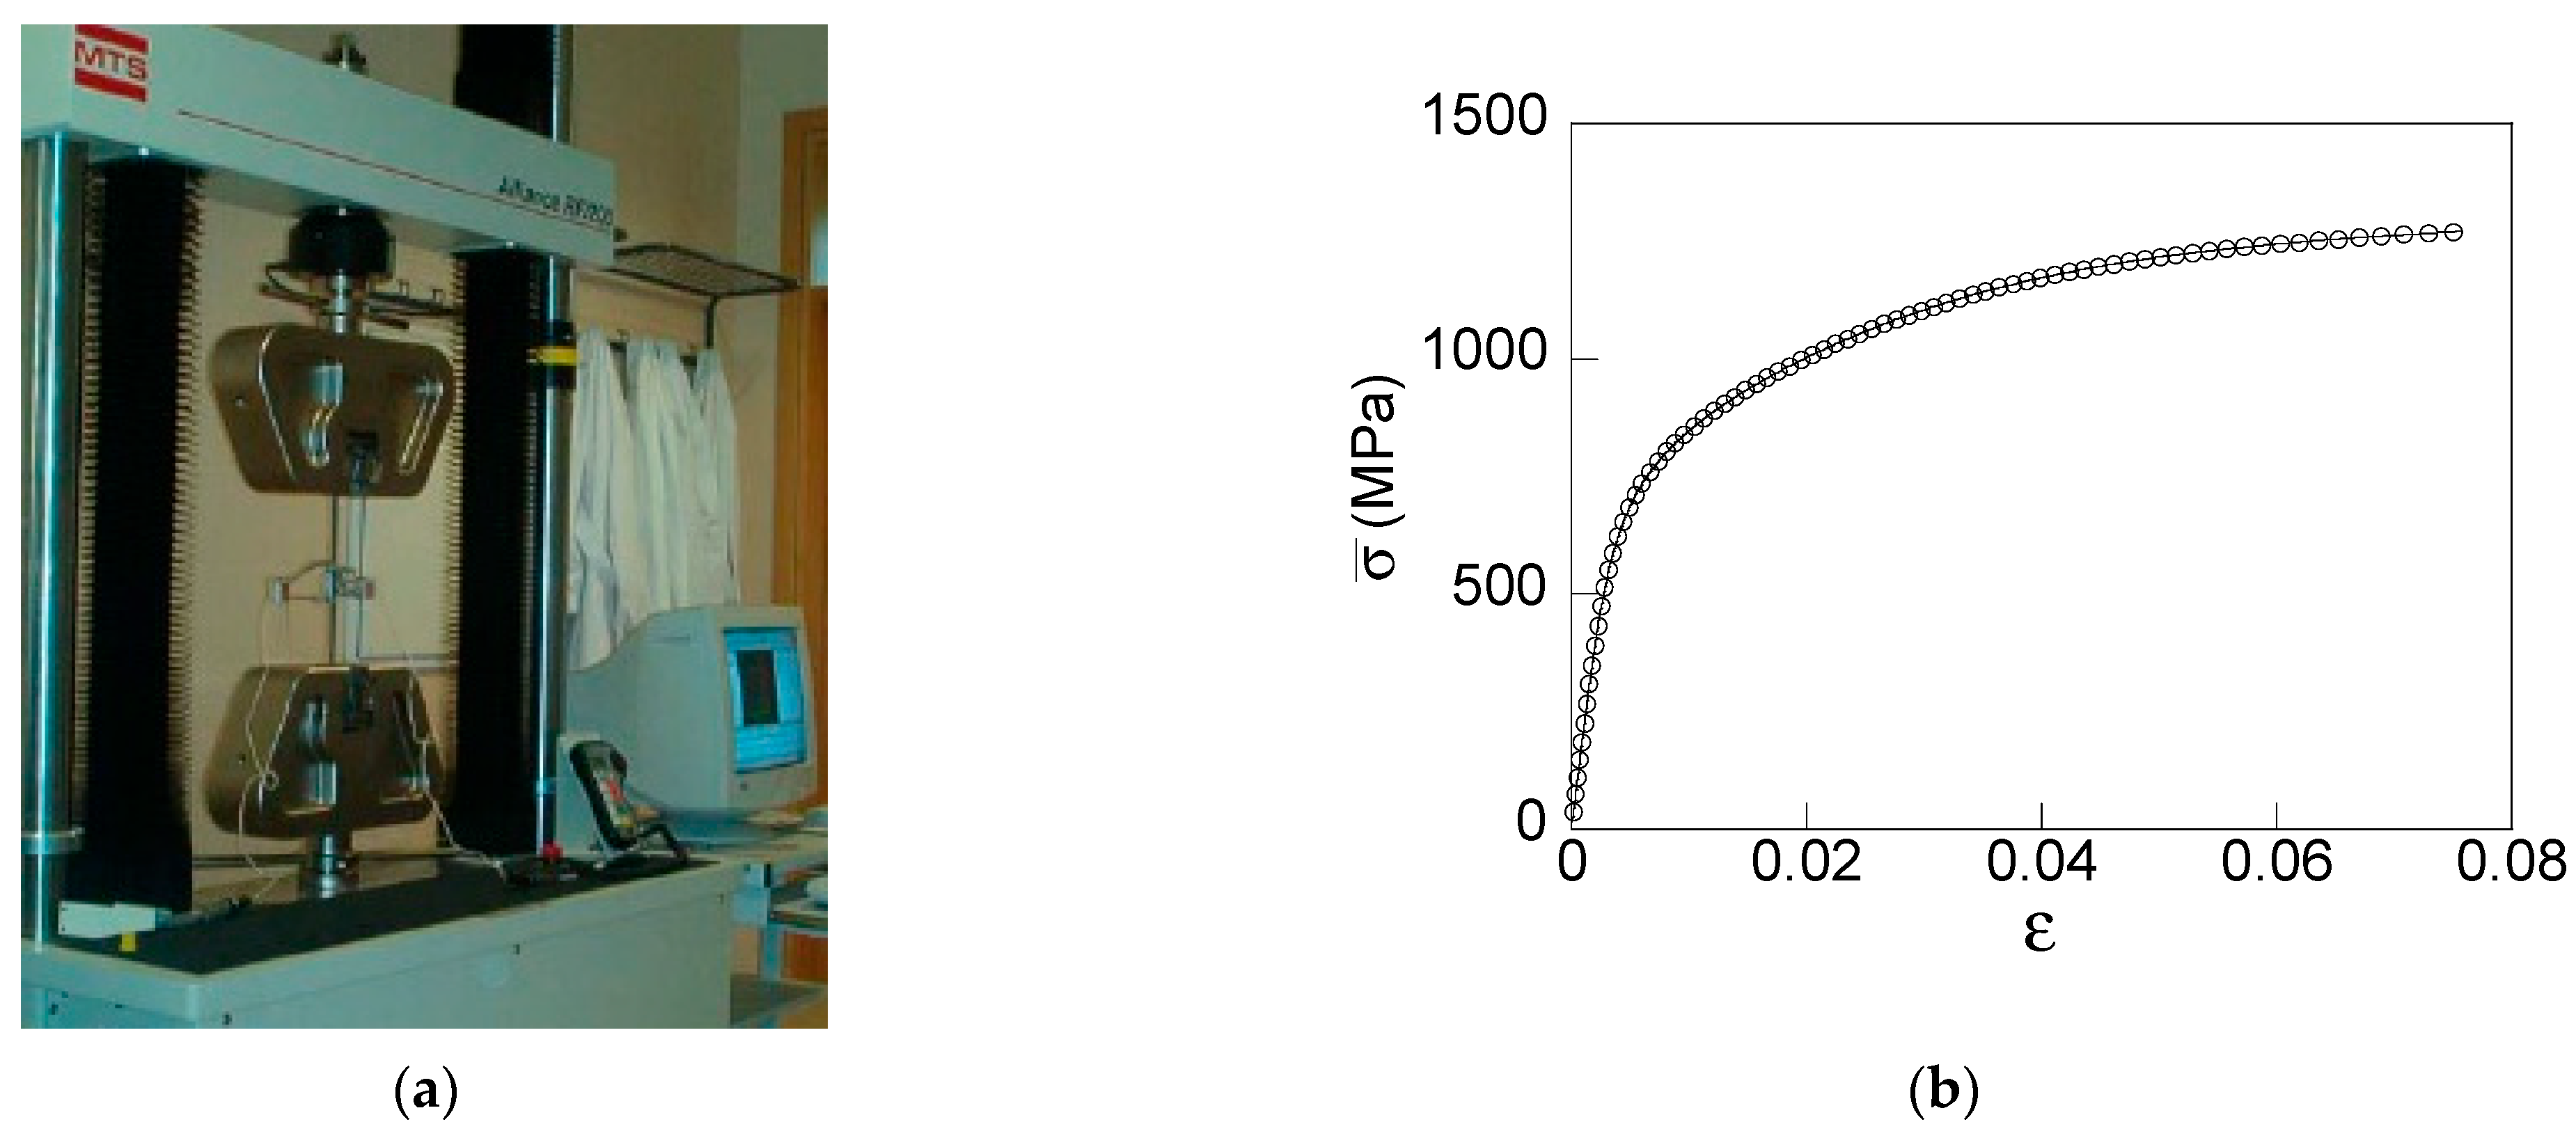
In this paper, the same steel was used in all the numerical simulations. The constitutive model applied was elastoplastic solid with von Mises yield surface, associated flow rule, and isotropic strain-hardening according to [
43]. Conventional tension tests up to fracture (
Figure 2a) were carried out under a constant displacement rate of 2 mm/min in a universal test machine (MTS RF/200), in order to reveal the mechanical properties of the pearlitic steel used in FEM simulations. Samples of 300 mm length of hot rolled bars corresponding to a real commercial wire drawing chain were tested. From the test results, the material true stress and true strain curve was revealed (
Figure 2b) allowing to obtain the following mechanical properties: Young modulus,
E = 194 GPa and yield strength, σ
Y = 720 MPa.
Commonly, conventional drawing dies are made with ceramic materials such as tungsten carbides since a high stiffness, strength and resistance to wear are essential requirements for obtaining a wire with the specified dimensions at the end of wire drawing. Thus, in this study, dies were modeled as rigid bodies since this one can be considered as a fine approach to the real behaviour of such a component during drawing. Wire was modelled as a deformable body with a non-uniform mesh of 4-nodes quadrilateral elements. Thus, the element size is progressively increased from the wire center up to the wire-die contact zone where a fine mesh is required. A mesh convergence test was carried out in order to select the most adequate mesh for calculations. As results, a mesh of 3381 nodes and 3200 elements was considered in FEM simulations.
With regard to the boundary conditions, nodes placed at the wire symmetry axis were fixed in the radial direction due to the axisymmetric geometry. In addition, a linearly increasing displacement was imposed at the nodes located at the front extreme of the wire up to reaching a final displacement that places the wire completely out of the die. The slope of this linear variable displacement is related to the drawing speed; thus, a commonly used drawing speed of 50 mm/s was included in the simulations. Previous studies revealed that friction does not influence on final stress distributions after wire drawing [
27] and, for this reason, this parameter was not included in the FEM simulations, selecting a frictionless contact between the die and the wire.
3. Stress and Strains Induced by Cold Drawing
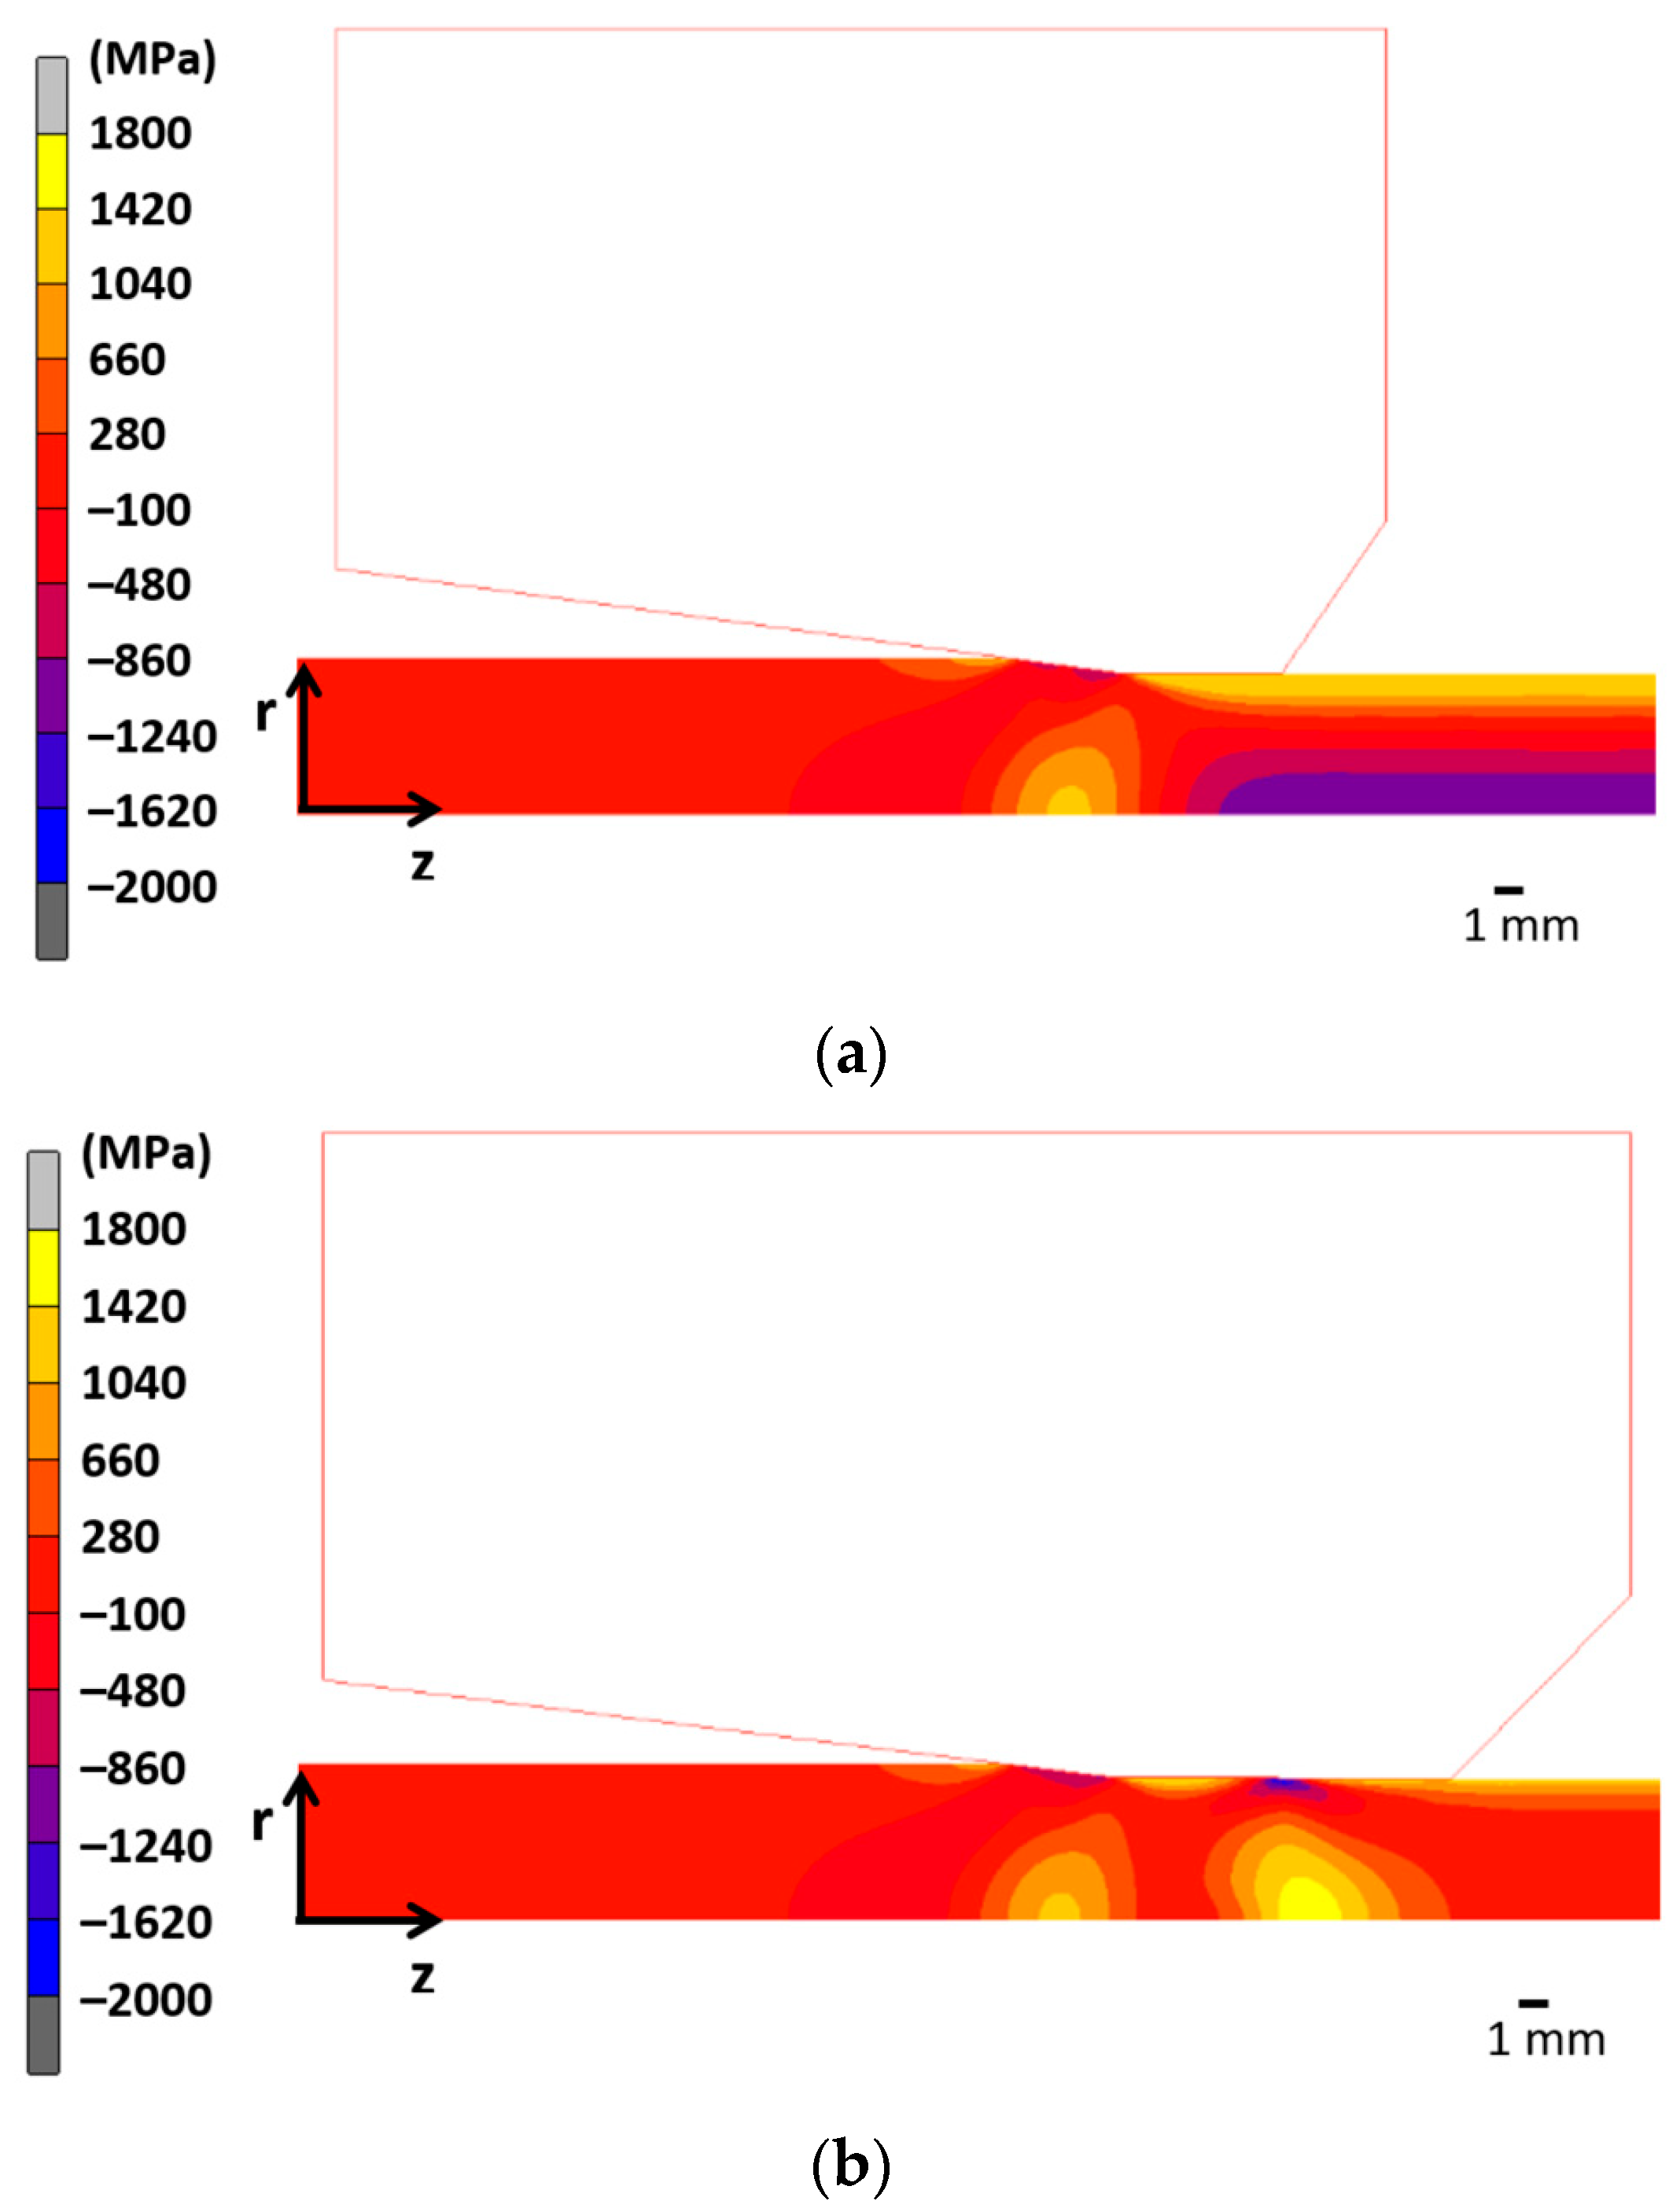
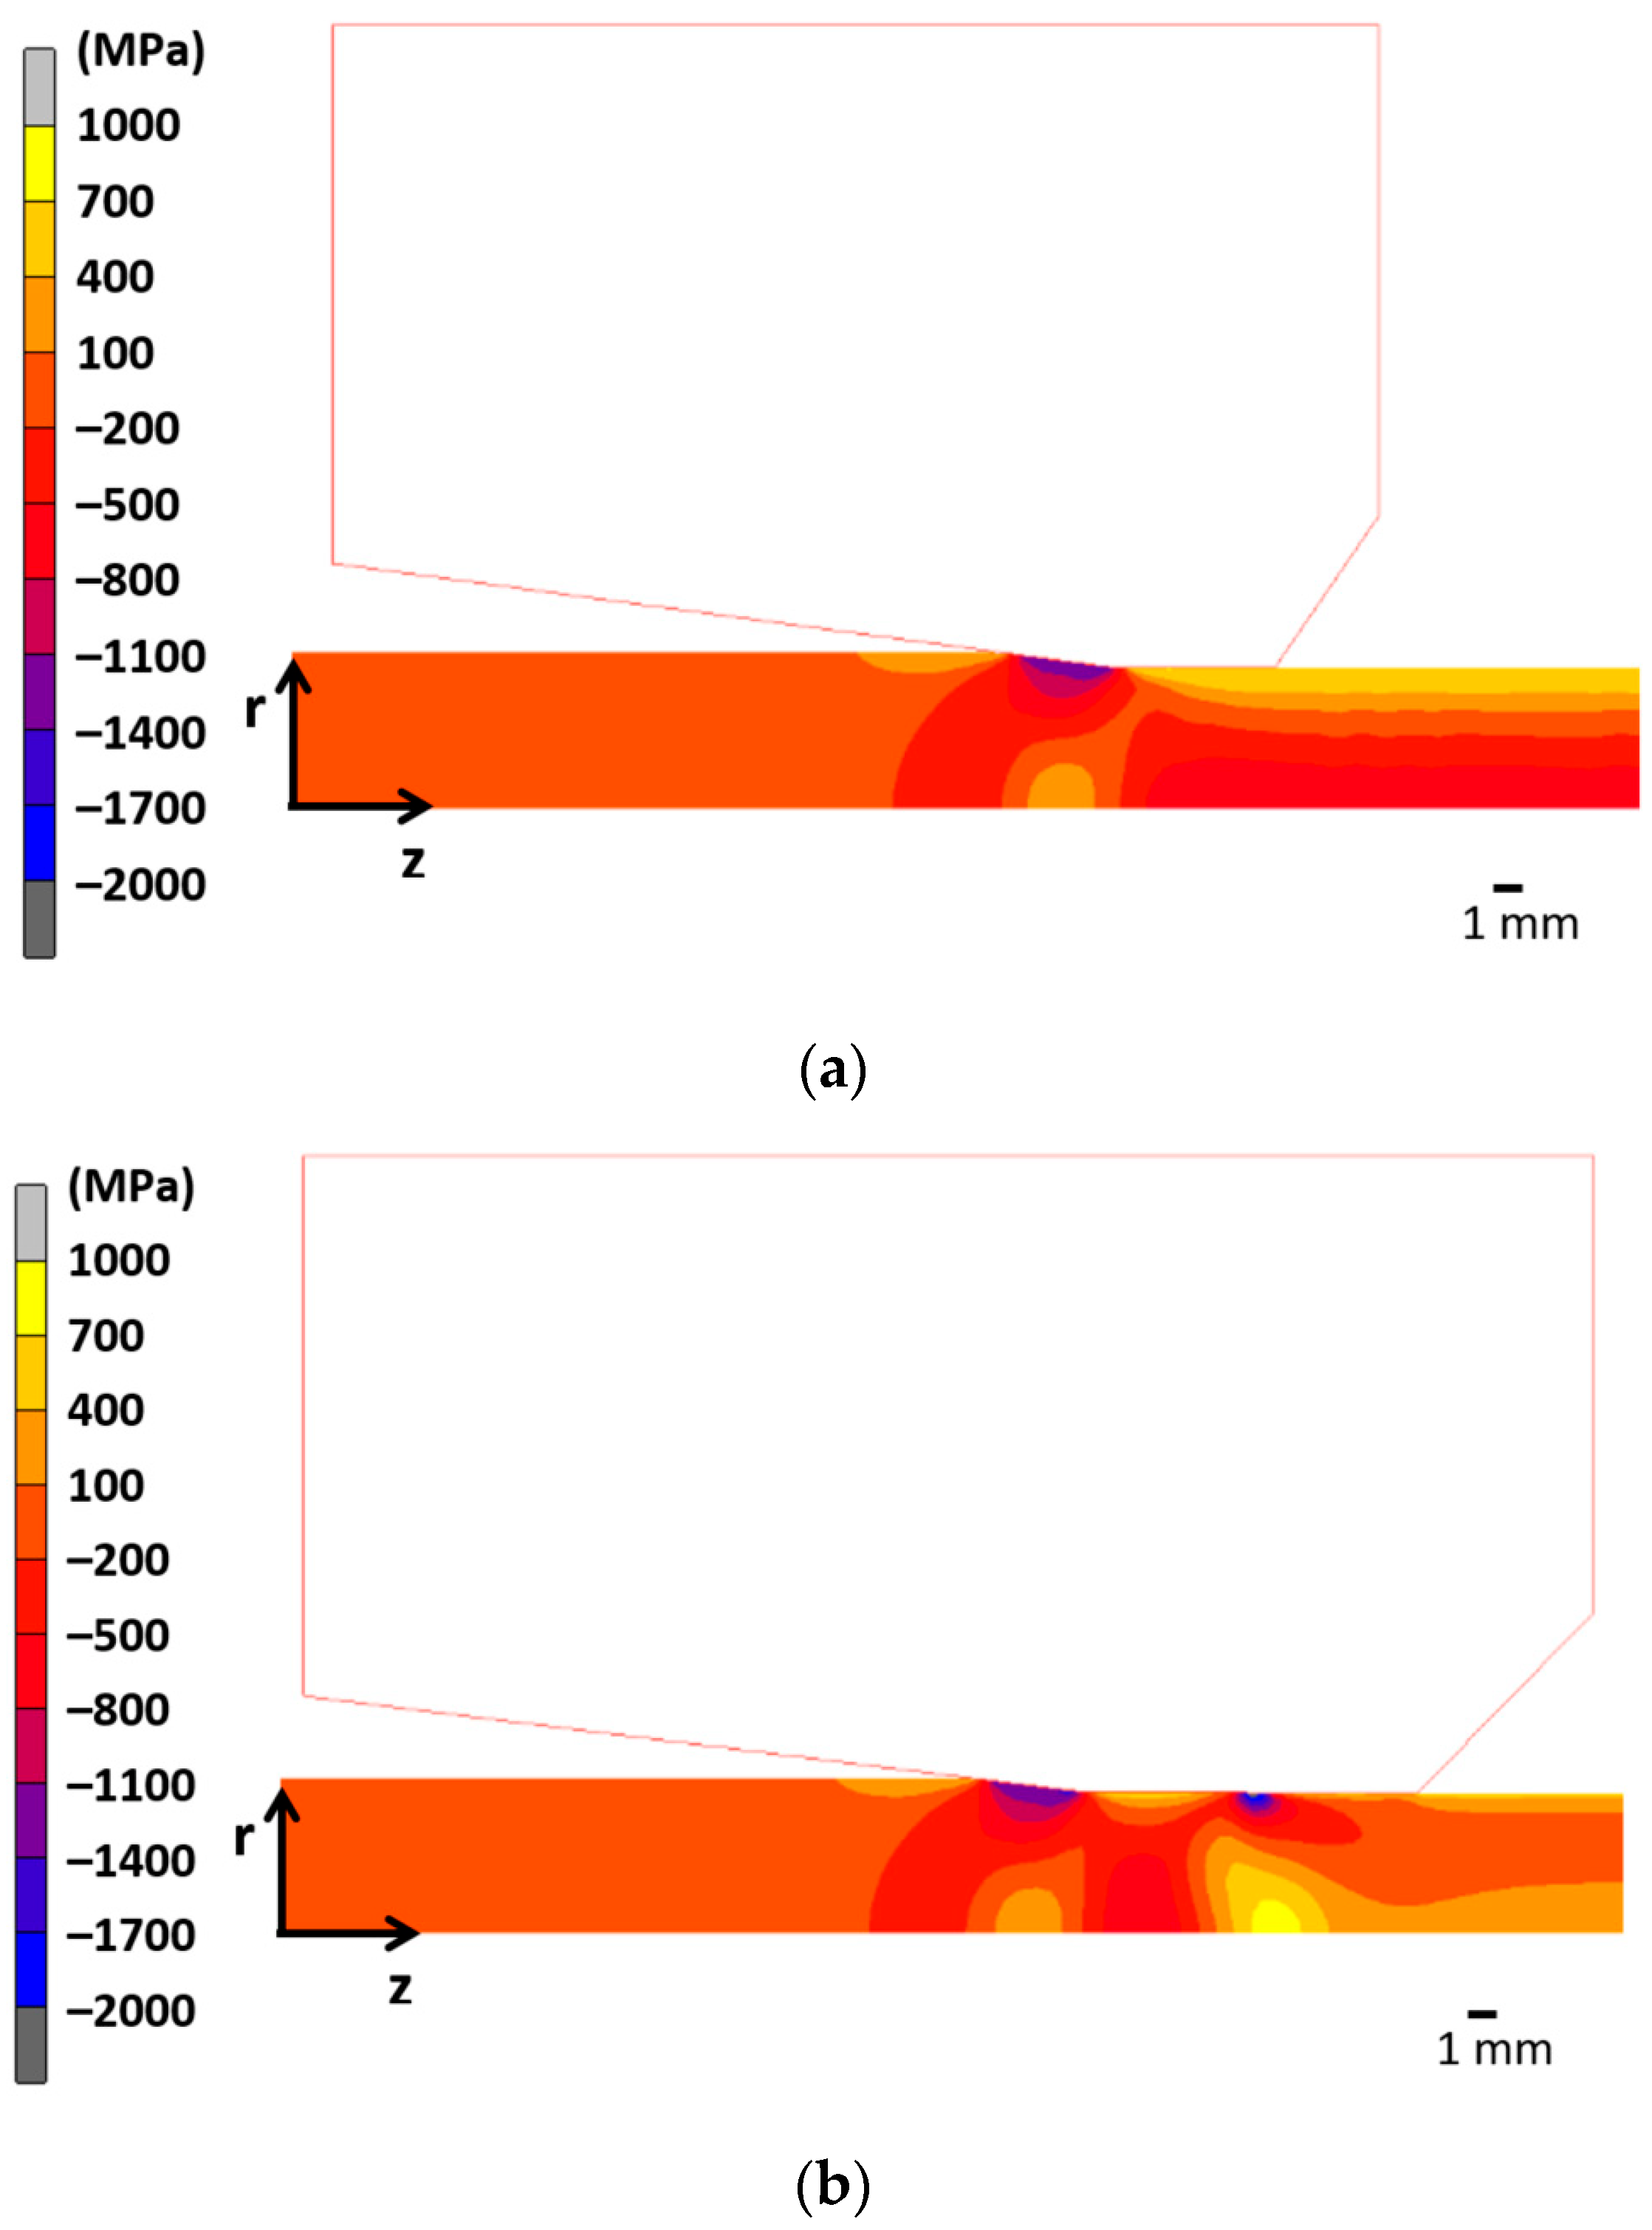
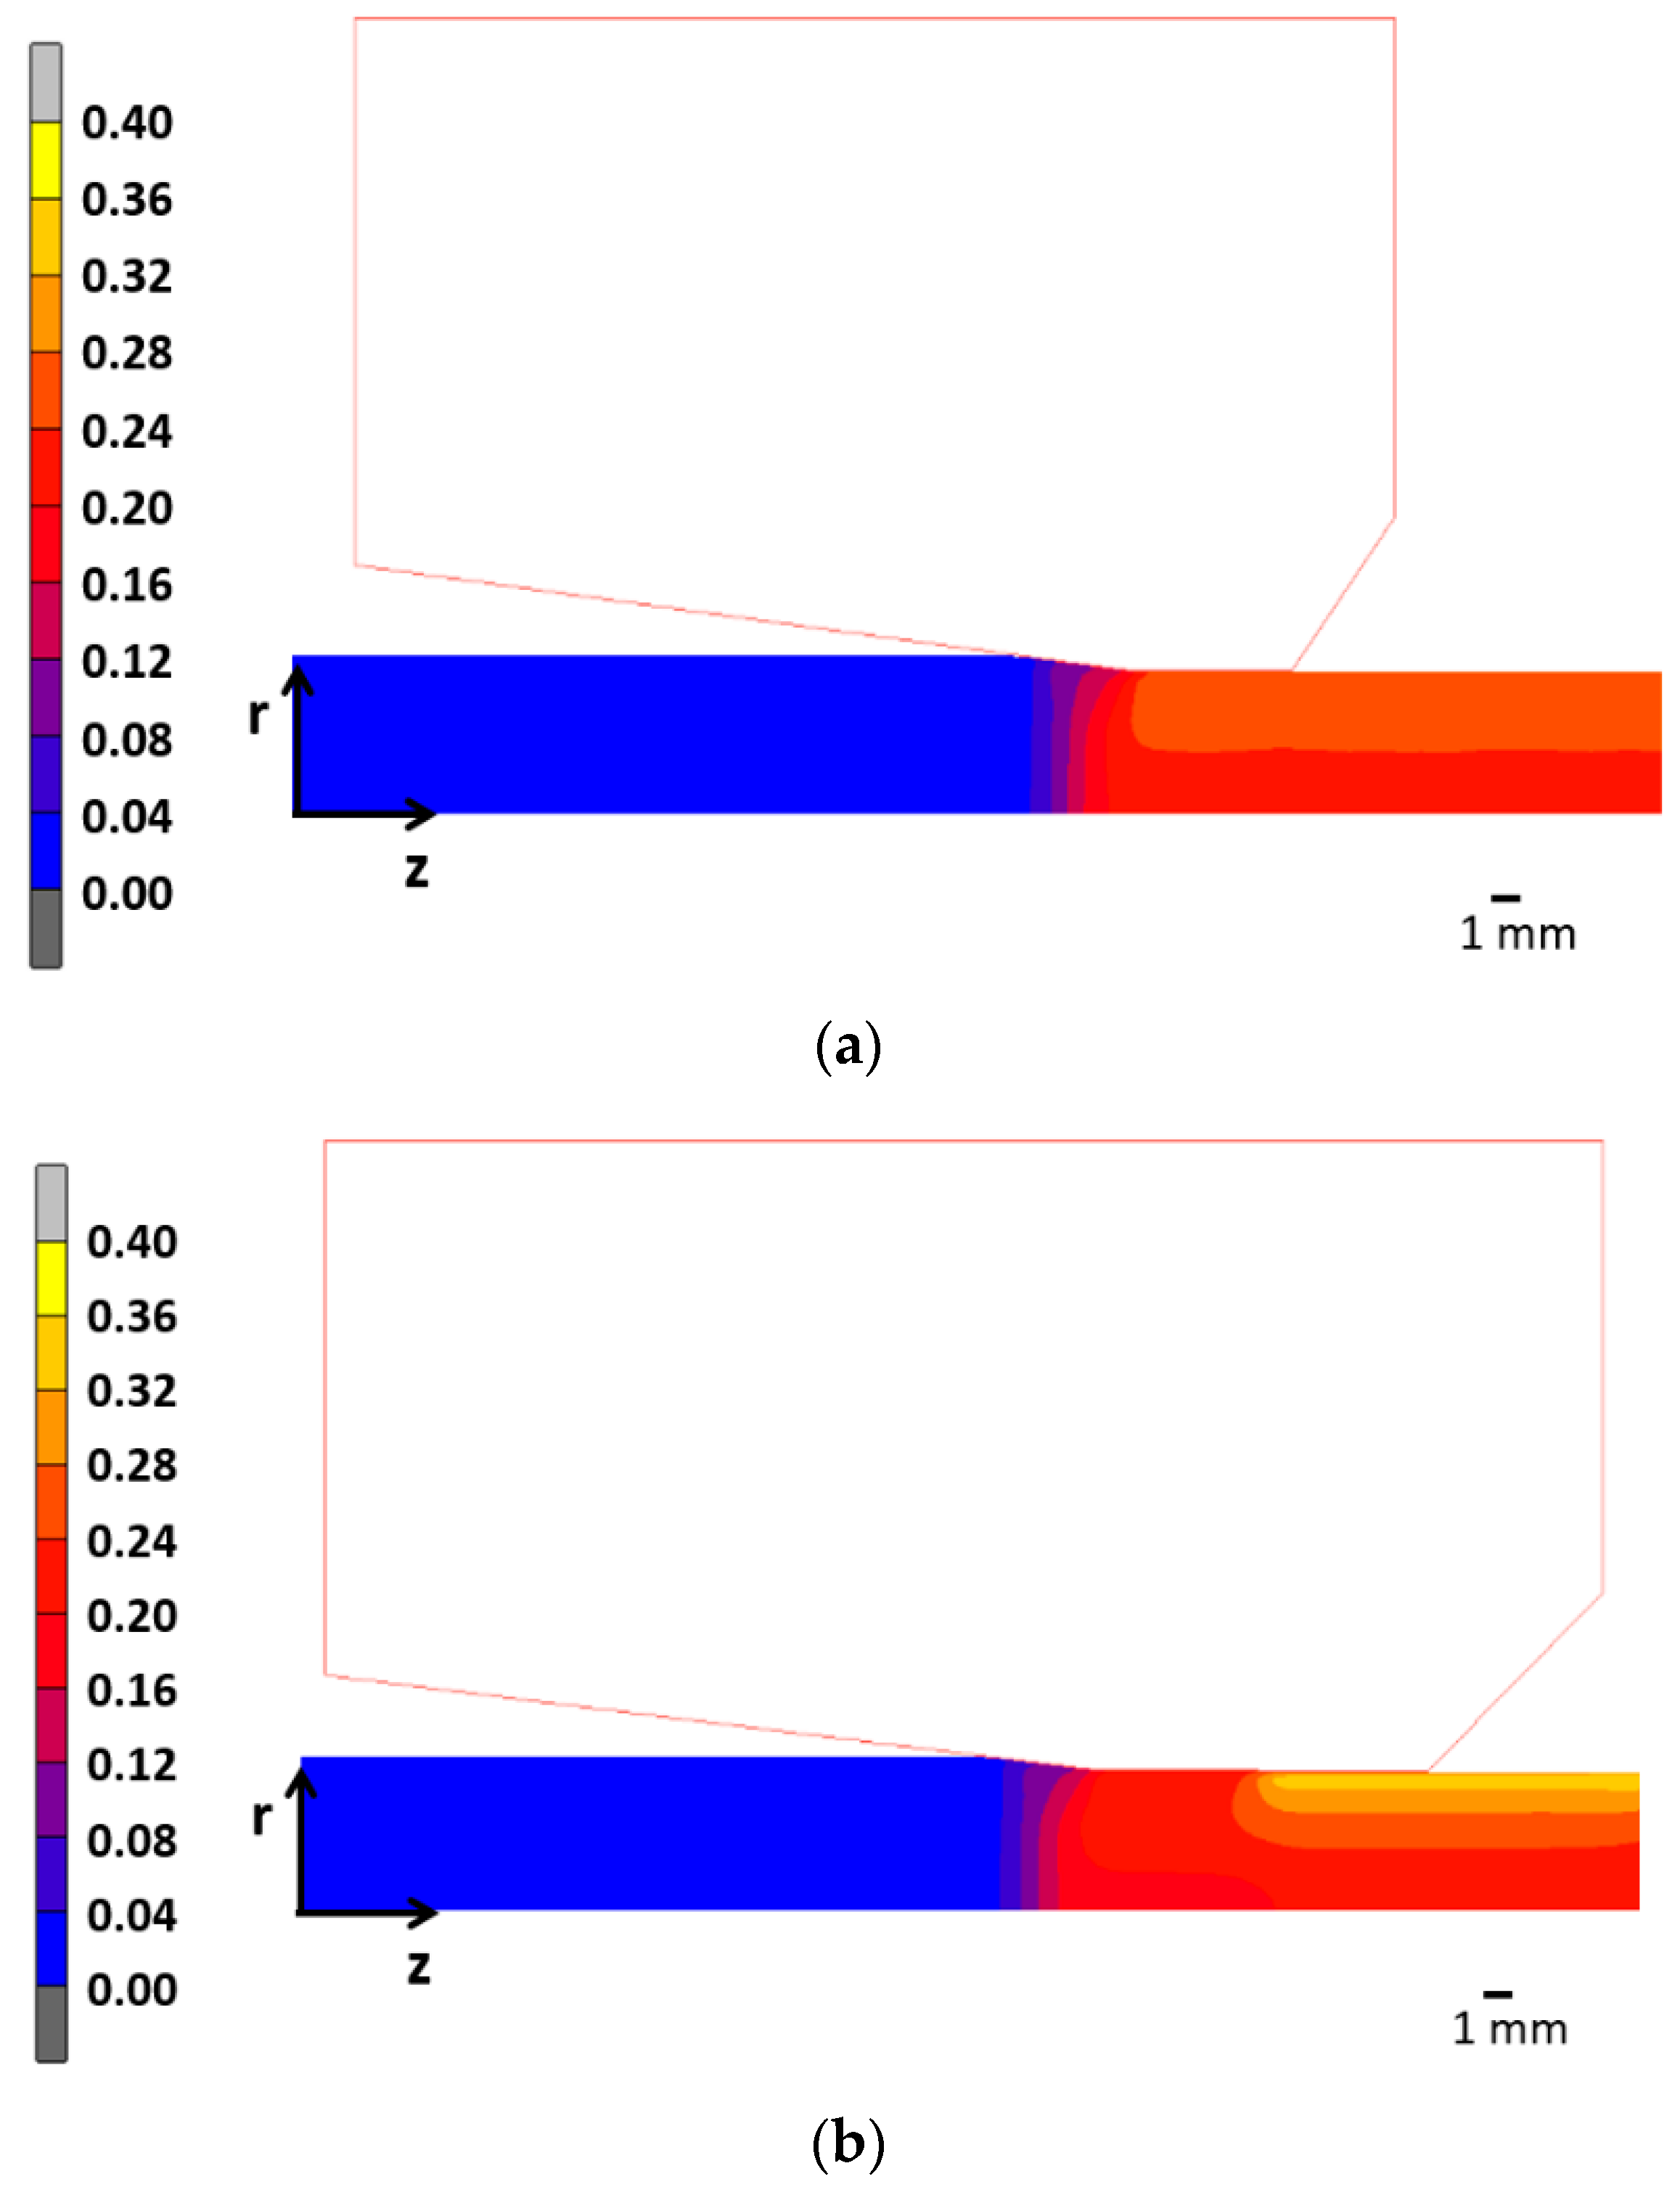
FEM simulations reveal the stress and strain fields during and after the first drawing step. The chromatic maps (
Figure 3 and
Figure 4) qualitatively show the main changes in axial and hydrostatic stress fields when modified dies (including a skin pass zone) are used, compared to the those generated with conventional dies. To go further in the analysis, the radial distribution, from the wire center at the wire symmetry axis
r = 0 to the wire surface
r = 5.6 mm, of axial stress and hydrostatic stress obtained for wires drawn with different secondary reduction degrees are shown in
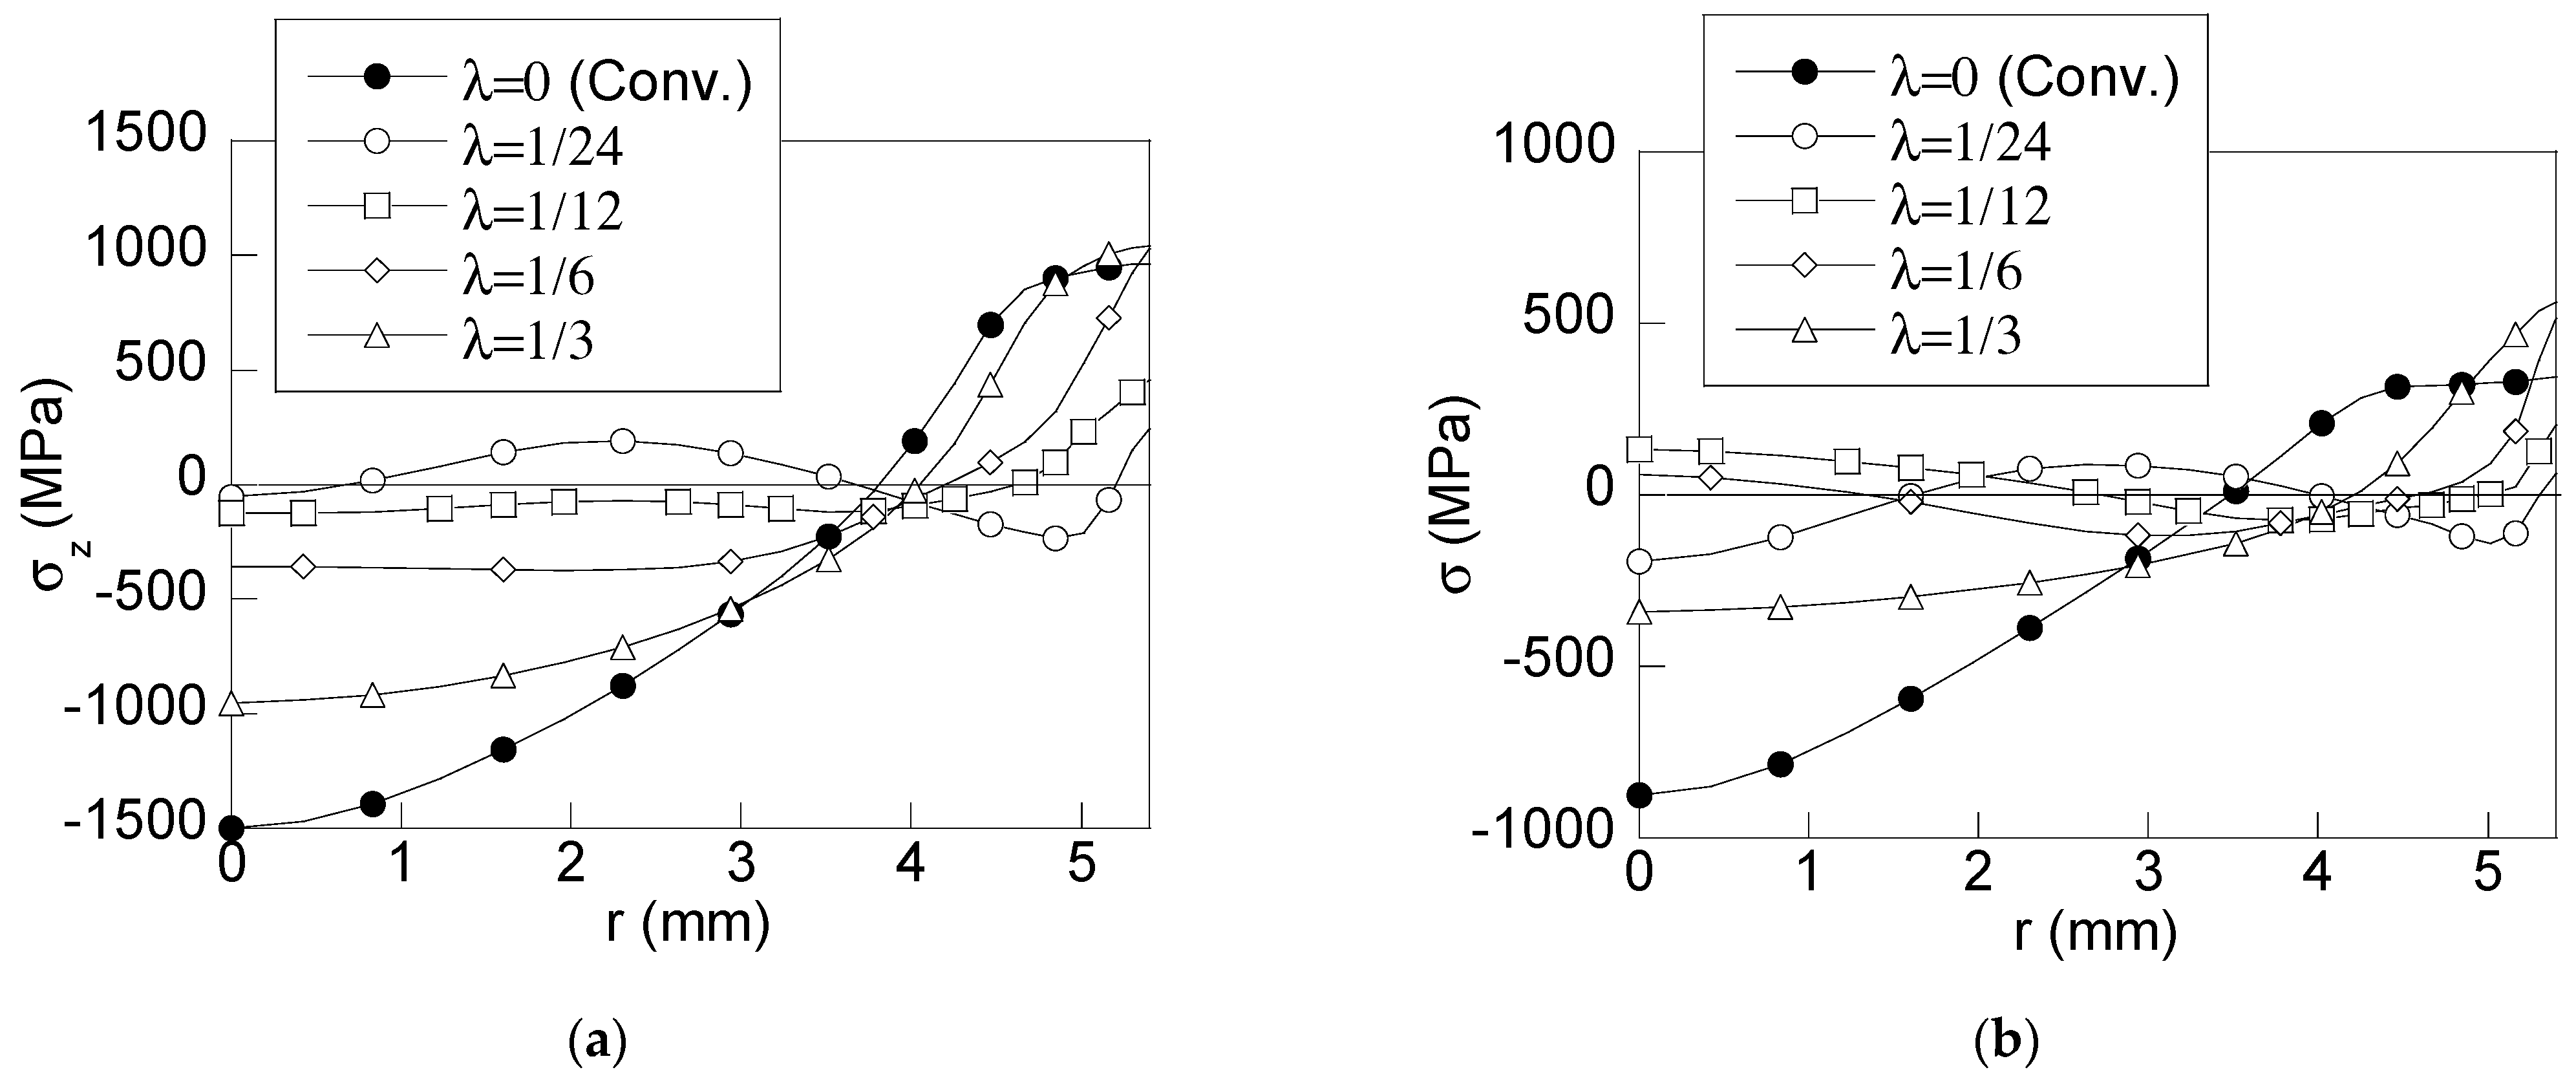
Figure 5a and
Figure 5b, respectively, compared with those obtained after a conventional process (filled circles).
The main differences may be summarized as follows: (i) the axial and the hydrostatic stress after drawing with modified dies are significantly reduced at the inner points of the wire and (ii) reductions in the vicinity of the wire surface are also obtained.
Figure 5a,b reveals the secondary reduction (∆
d2) as a key parameter in the redistribution of residual stress after cold drawing with modified dies including a skin pass soft reduction. Thus, for high secondary reduction (λ = 1/3), the shape of both axial and hydrostatic stress distributions are similar to that obtained in a conventional process. This way, in the axial stress distribution shown in
Figure 5a, a tensile stress zone appears close to the wire surface (3.8 mm <
r < 5.4 mm) and lowers with depth (
x =
d/2 −
r) up to becoming of compressive nature for
r < 3.8 mm with the same decreasing trend up to the wire core. Nevertheless, the stress distribution is deeply changed for low values of the reduction ratio λ. Thus, the tensile stress zone is narrower (4.2 mm <
r < 5.4 mm) and compressive stresses are distributed almost uniformly at the inner points. In the case of the lowest reduction ratio (λ = 1/24), a compressive zone appears placed close to the wire surface (3.8 mm <
r < 5.1 mm). As results, a tensile zone is found at the half of the wire radius (0.8 mm <
r < 3.8 mm) with a slight compressive zone near the wire center.
With regard to the hydrostatic stress distributions (
Figure 5b), a similar effect is observed but, in this case, the initial compressive stress zone (0 <
r < 3.5 mm) becomes slightly tensile at the wire core surroundings (0 <
r < 2.0 mm) for reduction ratios λ = 1/12 and λ = 1/6. As in the case of axial stress, the distribution of the hydrostatic stress obtained for the lowest reduction ratio (λ = 1/24) exhibits a zone of compressive stress near the wire surface (4.0 mm <
r < 5.2 mm) and a tensile stress zone in the middle of the wire radius (2.0 mm <
r < 4.0 mm) becoming compressive at the wire center.
From obtained results, two interesting effects can be highlighted. On one hand, as the parameter ∆d2 decreases, the axial stress state of compressive nature at the wire core decreases up to a 90% of the axial stress corresponding to a conventional cold drawn wire. A similar reduction is obtained in the hydrostatic stress distribution but, in this case, the stress state is of tensile nature. On the other hand, the axial stress at the wire surface is progressively reduced with the parameter λ, reaching a reduction of 50% for λ = 1/12 and a 75% for the lowest one (λ = 1/24). In the case of the hydrostatic stress at the wire surface (σΓ), results show an increment of this variable (60%) for high reduction ratios (λ = 1/3) with regard to the conventional wire drawing. Nevertheless, the value of σΓ decreases with the reduction ratio λ, and this way, a final reduction of 40% of the hydrostatic stress at the wire surface is obtained with a modified die considering a reduction ratio of λ = 1/12, whereas the reduction is about 80% for the lowest reduction ratio λ = 1/24. So, these cases (reduction ratios of λ = 1/12 and λ = 1/24) seem to be optimal for obtaining cold drawn wires with lower residual stress than conventional cold drawn wires since high reductions of both axial and hydrostatic stress state are obtained, resulting in a more uniform radial distribution of these variables.
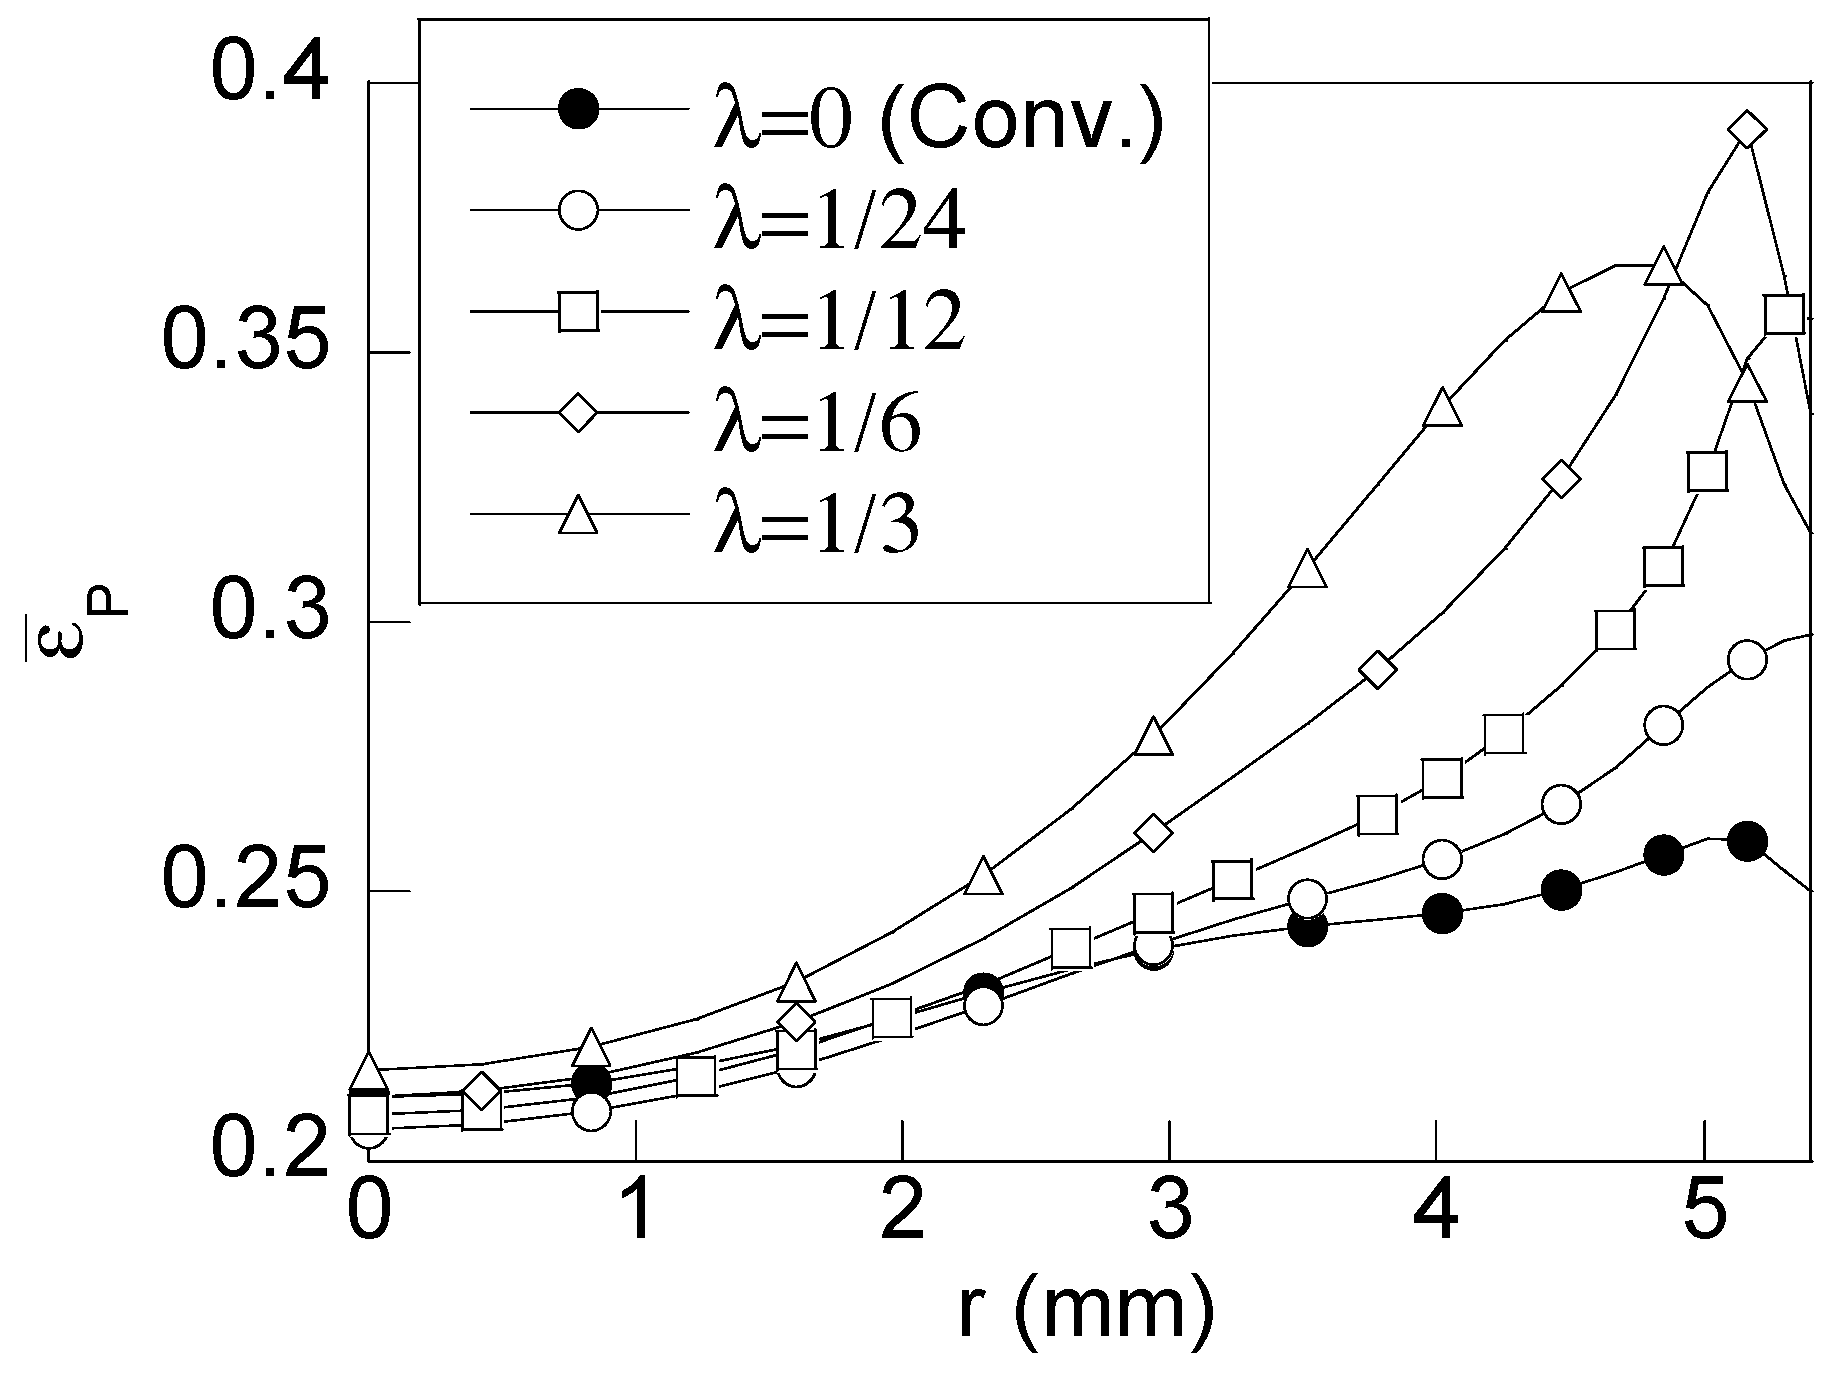
In a similar way,
Figure 6 shows the equivalent plastic strain field during wire drawing and
Figure 7 shows the radial distribution of equivalent plastic strain, from the wire center at the wire symmetry axis
r = 0 to the wire surface
r = 5.6 mm, obtained in the wire drawn with diverse secondary reduction degrees compared with the one obtained in a conventional cold drawing (filled circles).
According to the obtained results, the wire drawn using modified dies exhibits a less homogenous distribution of plastic strain, reaching higher values than those produced in a conventional drawing process. This effect is particularly relevant at the wire surface surroundings (3 mm< r <5.4 mm). For deeper points, such an increment progressively vanishes with depth from the wire surface up to disappearing nearby the wire core (r < 2 mm) where similar plastic strain is obtained for all analyzed cases. According to these results, the maximum equivalent plastic strain generated in the wire after cold drawing increases with the reduction ratio λ, except for the highest value considered of such a parameter (λ = 1/3).
As can be noticed in
Figure 7, the highest increment of the maximum equivalent plastic strain (obtained for λ = 1/6) is around 50% higher than the one obtained with a conventional drawing whereas for the other cases of study is around 35% (λ = 1/12) and 20% (λ = 1/24) respectively. In addition,
Figure 7 reveals that the position where the maximum equivalent plastic strain appears is also affected by the reduction ratio λ. Thus, for low secondary reductions (λ = 1/12 and λ = 1/24) the maximum is placed at the wire surface and, as this parameter is increased, the position of such a maximum is moved towards inner points of the wire.
Thus, a positive inwards gradient of equivalent plastic strain is obtained for high values of λ whereas low reduction ratios exhibit a negative inwards gradient. In addition, for higher reduction ratios, a wider high strained zone is obtained. It is also interesting to analyze changes in the equivalent plastic strains at the wire surface. There, an increment of 25% of equivalent plastic strain is obtained for the highest reduction ratio (λ = 1/3) whereas the increment is about 40% for the secondary reduction ratio λ = 1/12. The lowest increment, about 20% is obtained for the lowest reduction ratio (λ = 1/24).
Following the previous analyses, the optimum conditions for the wire drawing are obtained using low values of the secondary reduction since, under such conditions, not only a substantial reduction of residual stresses (both axial and hydrostatic) is obtained at the wire core but also at the wire surface. For achieving a better approach for the optimal case of the skin pass technique applied to prestressing steel wires, additional cases corresponding to different values of the secondary reduction were considered as follows: ∆d2 = 20 μm (λ = 1/60), ∆d2 = 75 μm (λ = 1/16) and ∆d2 = 150 μm (λ = 1/8).
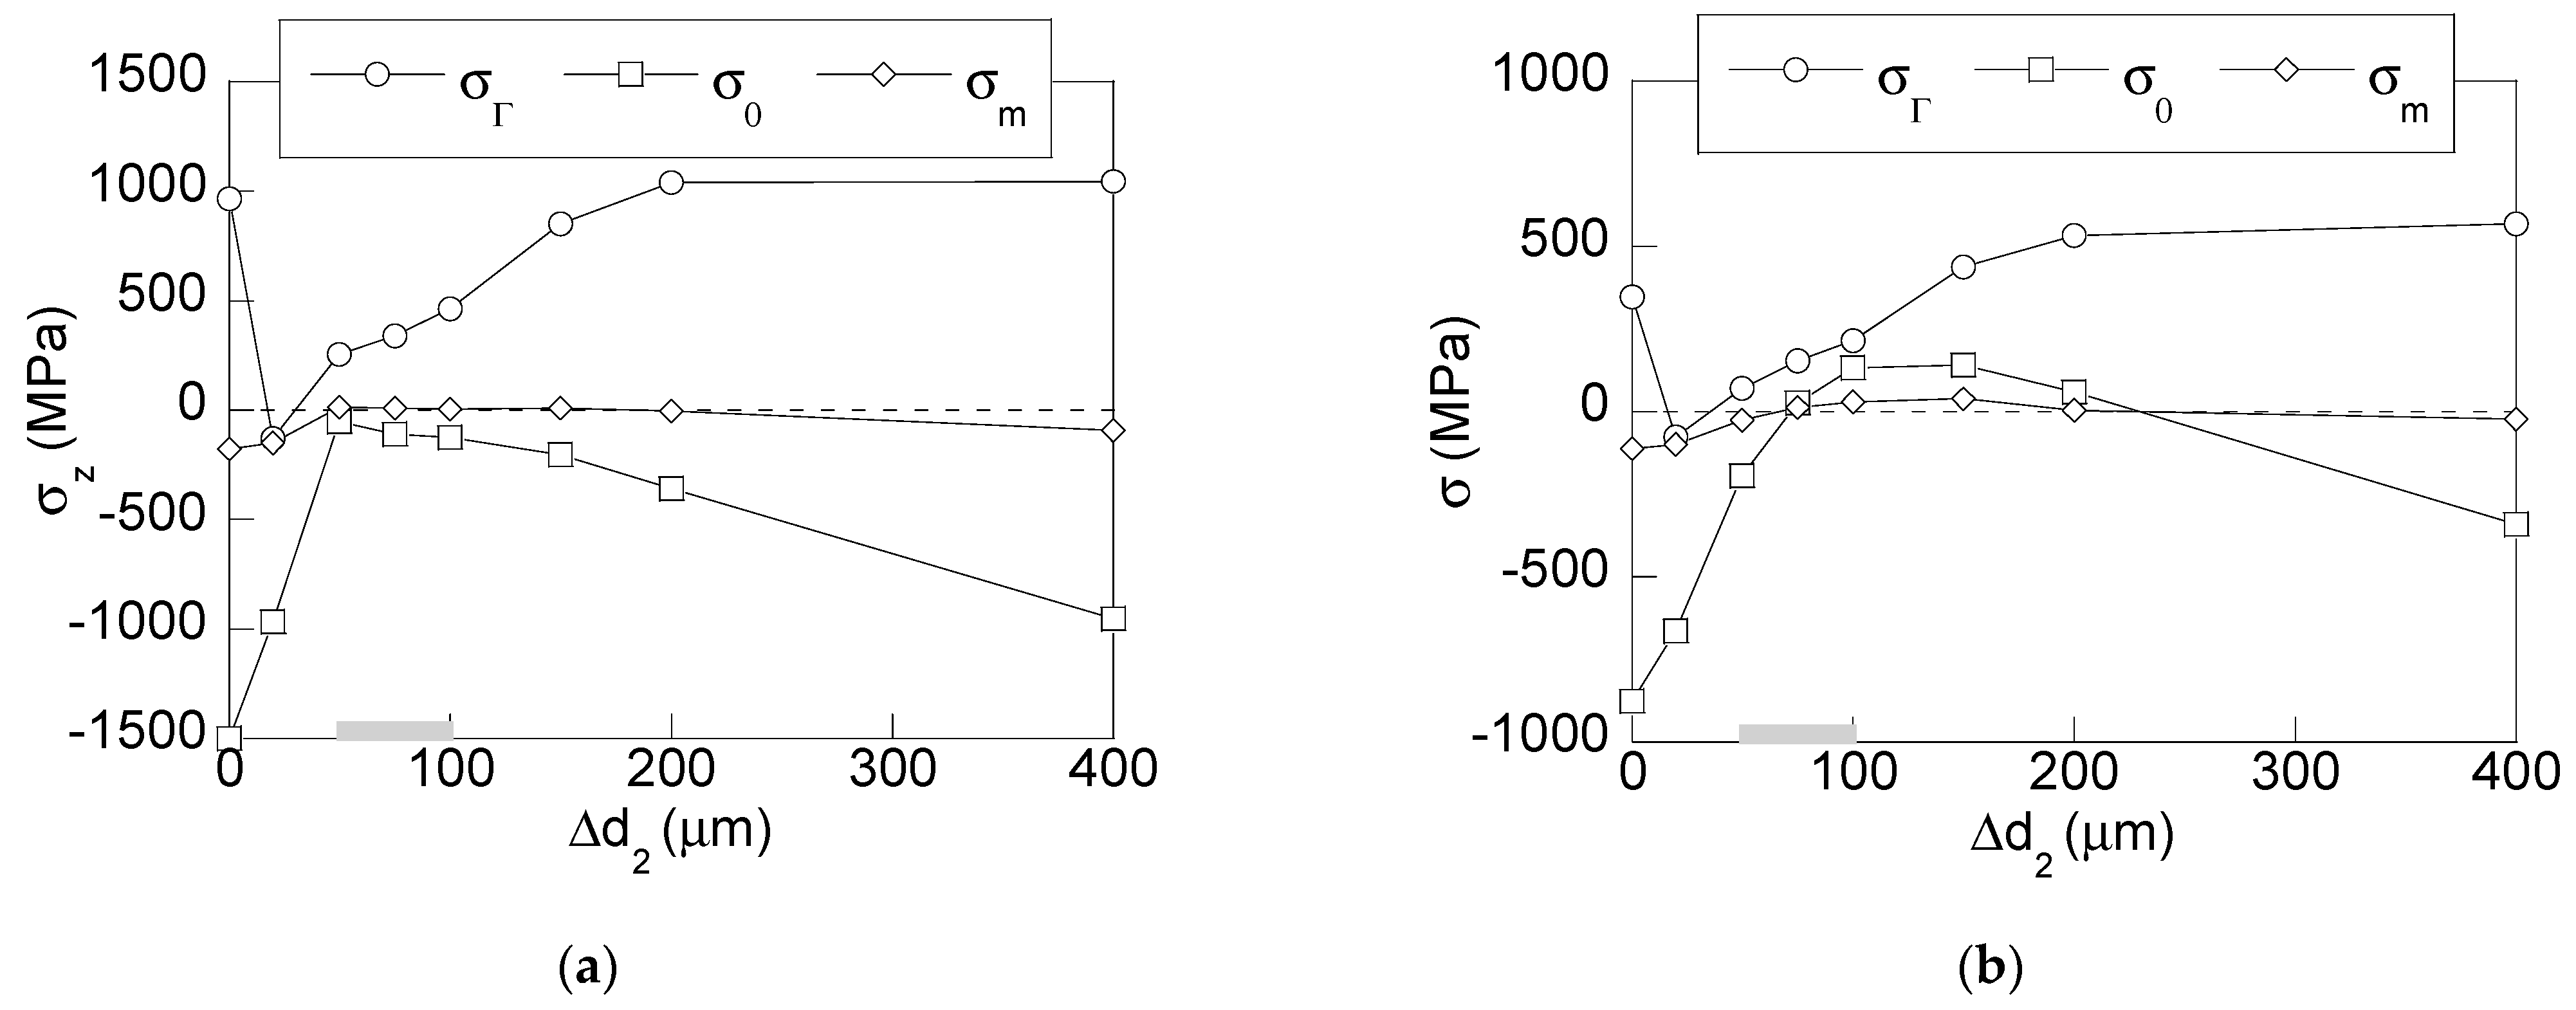
The optimal case from the structural integrity point of view can be considered as that reducing residual stresses and generating more uniform stress distributions. So, to find out such a case, the values of the key features of the stress distribution for axial and hydrostatic stress, namely: (i) the stress at the wire surface, σ
Γ, (ii) the stress at the wire core, σ
0, and finally (iii) a measure of the uniformity of the stress distribution: the average stress, σ
m, are represented in
Figure 8a,b, for all the cases of the study. In a similar way,
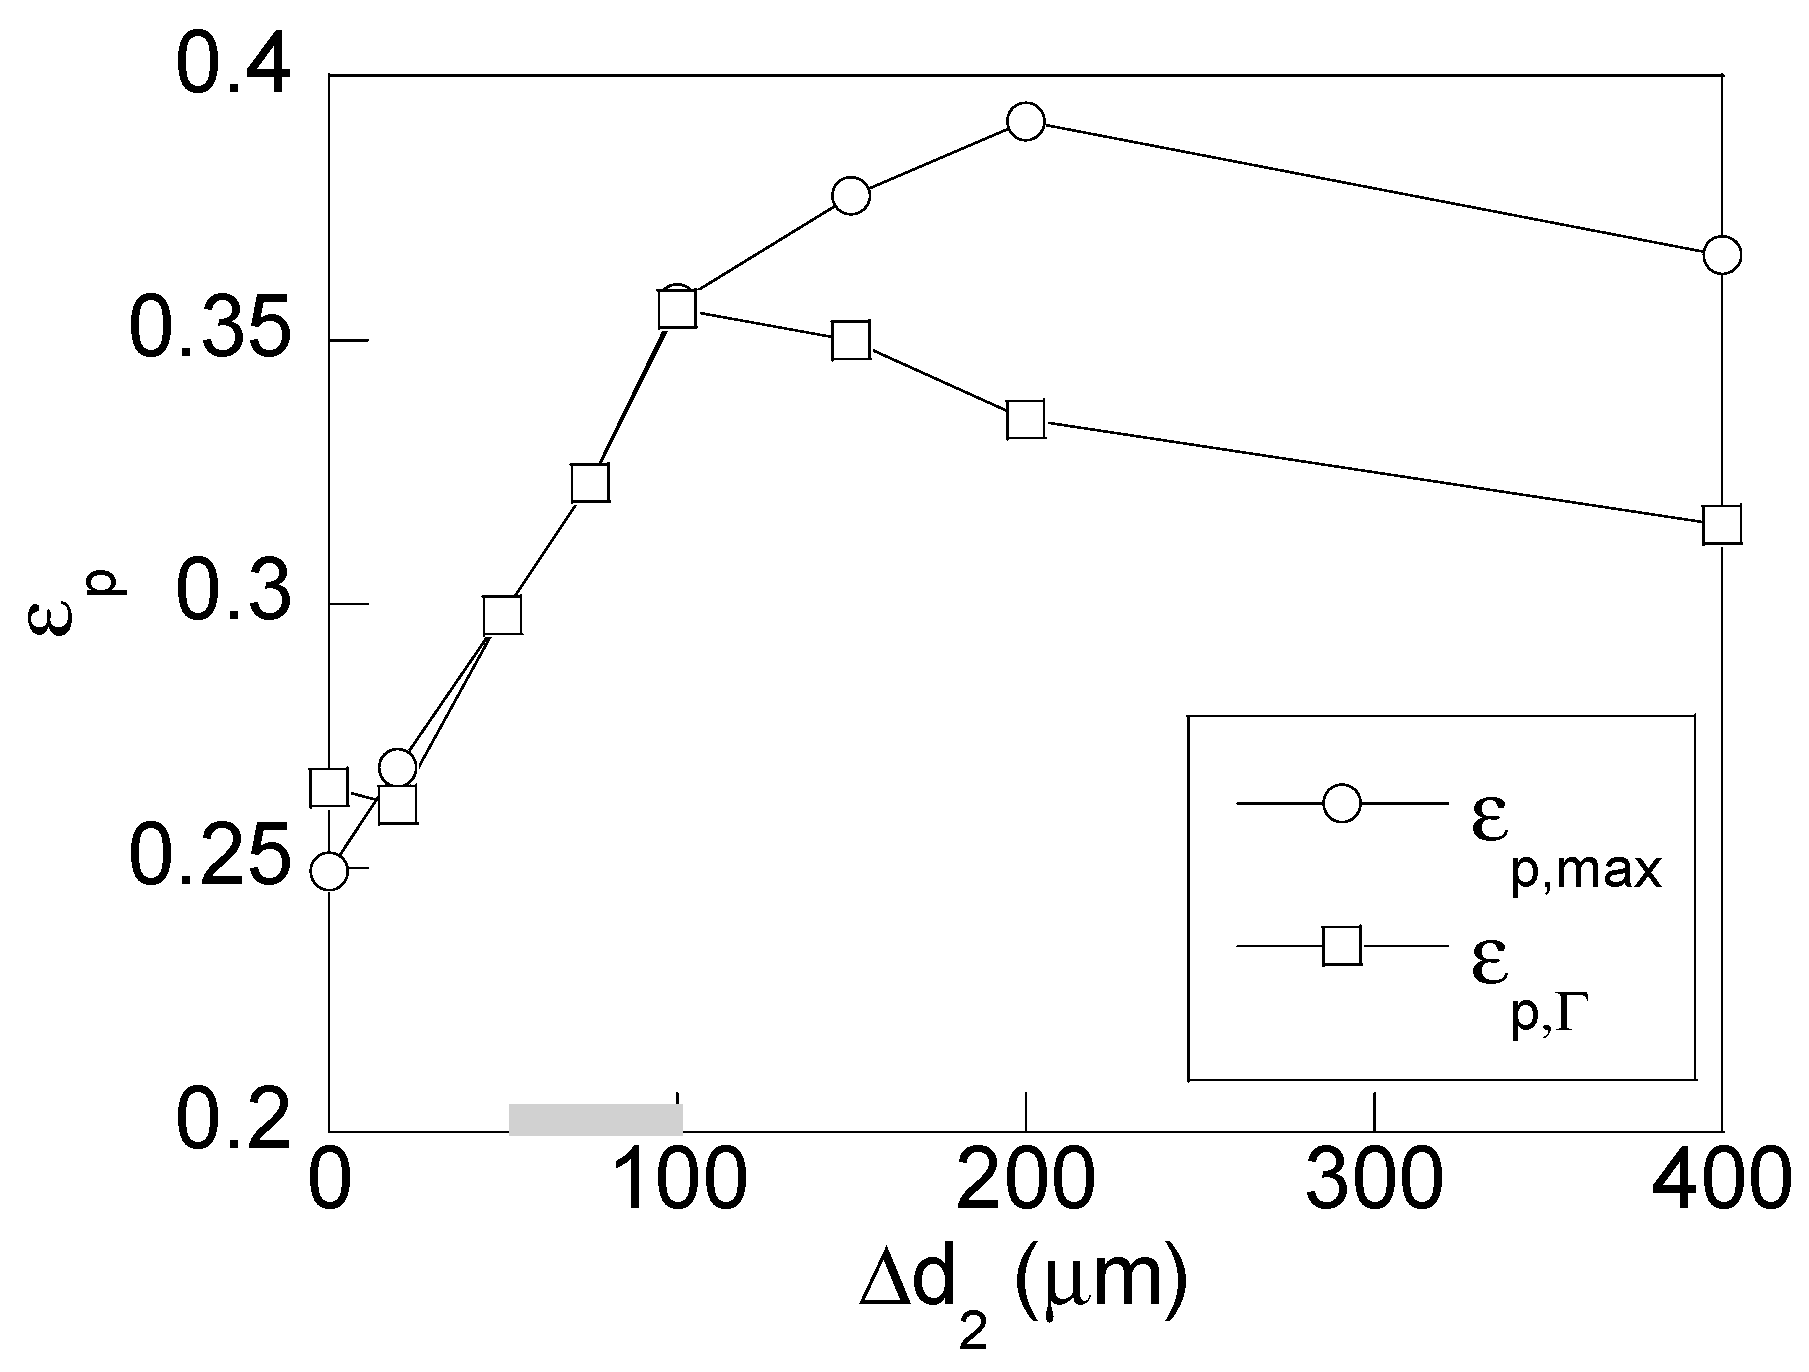
Figure 9 shows two key parameters of the distribution of equivalent plastic strain, namely: (i) the maximum value of the equivalent plastic strain and (ii) the value of such a variable at the wire surface.
According to results plotted in
Figure 8, a progressive reduction of both axial and hydrostatic stress at the wire core and of average stress is achieved as the secondary reduction is increased from conventional wire drawing (λ = 0) up to the case corresponding to λ = 1/24 (∆
d2 = 50 μm) where the minimum axial stress at wire core (almost null) is reached. Hereafter, the trend changes for higher values of the secondary reduction and the axial stress at the wire core is progressively increasing with the reduction ratio λ, it always being of compressive nature.
In the case of hydrostatic stress at the wire core (
Figure 8b), tensile stress appears for secondary reduction within the range 75 μm < ∆
d2 < 200 μm. For higher values of ∆
d2, the stress state returns to be of compressive nature, increasing the value of hydrostatic stress with the secondary reduction. According to the variation shown in
Figure 8b, the stress reduction at the wire surface is progressively lower as the secondary reduction is increased. Thus, the maximum reduction of the stress state at the wire surface is obtained for the lowest reduction ratio considered, λ = 1/60 (∆
d2 = 20 μm). Notice that, for values of ∆
d2 higher than 100 μm, the stress at the wire surface overcome that obtained by using conventional dies.
Thus, the optimal case from the mechanical point of view for reducing the residual stress state is within the range of values between ∆
d2 = 50 μm and ∆
d2 = 100 μm (shaded line in
Figure 8), since within such a zone, the lowest values of the stress at the wire surface and at the wire core are obtained without significantly increasing the average stress. Unfortunately, the maximum reductions at the wire surface and at the wire core are not reached for the same value of secondary reduction. So, the optimum case depends on if the maximum stress reduction has to be located at the wire core or at the wire surface.
With regard to the equivalent plastic strain (
Figure 9), the maximum plastic strain and the plastic strain at the wire surface are similar for low values of the secondary reduction up to ∆
d2= 100 μm (λ = 1/12). For these cases, the equivalent plastic strain increases with the value of ∆
d2 and for high secondary reductions, the equivalent plastic strain at the wire surface is progressively reduced. However, the maximum plastic strain is still increased up to a reduction ratio of λ = 1/6 (∆
d2 = 200 μm), and later it decreases for higher reduction ratios. Within the optimal zone according to stress reductions analyzed in
Figure 8, ∆
d2 ∈ (50 μm, 100 μm), the increment of plastic strains is within the range 20–40% compared to the values obtained for a conventional drawing. According to these results, the maximum value of the equivalent plastic strain is always reached at the wire surface for values included within the optimal range. This fact means that the inwards gradient of equivalent plastic strains is negative and, consequently, it acts against hydrogen diffusion towards the inner points of the wire.
4. Hydrogen Embrittlement
To achieve a better understanding of the implications on the HE of previously discussed changes in the stress and plastic strain distributions, a brief description of the governing equations of the main stage of HE, the hydrogen diffusion within the metal lattice, seems to be adequate [
37,
38,
39,
40,
41,
42]. Hydrogen diffuses from the wire surface to inner points as a function of the inwards gradients of both hydrostatic stress (σ) and hydrogen solubility (
Ksε) as follows [
37,
38,
39,
40,
41,
42]:
J being the hydrogen flux,
D the diffusion constant,
C the hydrogen concentration,
R the molar gas constant,
VH the partial volume of hydrogen,
T the absolute temperature and
Ksε the hydrogen solubility that is a function of equivalent plastic strain [
39].
The hydrogen diffusion equation can be expressed as a second-order partial differential equation applying the matter conservation law and the Gauss–Ostrogradsky theorem, thereby resulting:
The steady-state solution of previous equation represents the equilibrium concentration of hydrogen for infinite time of exposure to hydrogenating environment (
Ceq) in the form of a Maxwell–Boltzman type distribution as follows:
where
C0 is the equilibrium hydrogen concentration for the material free of both stress and strain fields.
Therefore, hydrogen diffuses toward inner points due to: (i) the negative gradient of hydrogen concentration; (ii) the positive gradient of hydrostatic stress; (iii) the positive gradient of hydrogen solubility, which is related to the gradient of equivalent plastic strain (
Ksε= 1 + 4ε
P, [
39]). This way, the analysis of the plastic strain gradient will lead to similar results to those obtained analyzing hydrogen solubility gradient considering the linear dependence of the latter variable on equivalent plastic strain.
A FEM simulation of the hydrogen diffusion assisted by stress and strains was carried out in order to reveal the hydrogen accumulation in wires drawn with both conventional dies and the optimal die (
non-conventional) from the mechanical point of view, as previously discussed. Similar hydrostatic stress and equivalent plastic strains fields are obtained after cold drawing by FEM in the wire radial direction (cf.
Figure 4 and
Figure 6). Consequently, variations on the axial direction are negligible and a one-dimensional (1D) axisymmetric approach can be used for the analysis of hydrogen diffusion assisted by stress and strains to reveal the hydrogen accumulation on the wire. This way, a FEM numerical simulation of the axisymmetric boundary-value problem of stress-strain affected diffusion (Equation (2)) was implemented in a general propose mathematical software. The Galerkin method was applied considering the same element shape functions
Ne(
r) as trial and weighting functions in usual terms [
39]. In addition, the hydrostatic stress σ(
r) and equivalent plastic strain ε
P(
r) radial distributions were approximated using the same shape functions as follows:
where
j = 1,…,
M corresponds to the number of node of the FEM mesh,
M being the total number of nodes.
The weak form of the weighted residual statement of the problem rendered the system of ordinary differential equations with respect to the FEM nodal concentration values
Cj (
t) as the functions of time as follows:
where the components of the element matrices [...] and the vector-columns {...} are, respectively:
applying the flux of hydrogen
JS on the part
Sf of the surface, whenever convenient.
Finally, the first-order differential Equation (5) can be solved by programming the time-marching numerical scheme proposed for diffusion-type equations [
46]. This way, for the
m-
th time interval [
tm–1,
tm], the nodal concentration values
Cm–1 and
Cm are obtained from the following equation:
where Δ
t =
tm −
tm–1, and θ must assure the stability of this time-marching scheme. The imposed initial conditions
C0 are included in the first time interval (at
m = 1). Afterwards, the solution of the following matrix equation gives the values for hydrogen concentration of the following time interval
Cm:
Thus, the hydrogen distribution for any time during exposure to the hydrogenating environment can be obtained. The described procedure of time integration was proven to be unconditionally stable when the parameter θ is between 0.5 and 1, i.e., θ ∈ [0.5, 1].
For the sake of simplicity, the same mesh discretization used in the numerical modelling of the wire drawing was considered for simulating the hydrogen diffusion assisted by stress and strain, assuming linear trial functions for both space and time variables. The parameters involved in the simulations were chosen as follows: fixed temperature,
T = 298 K; partial molar volume of hydrogen for iron-based alloys,
VH = 2 cm
3/mol [
47]. In this study, the hydrogen diffusivity
D for the hot rolled bar A0 was taken from previous studies as follows:
D = 6.6 × 10
−11 m
2/s [
48].
From numerical simulations, the radial distributions of hydrogen concentrations, from the wire center at the wire symmetry axis
r = 0 to the wire surface
r = 5.6 mm, were estimated (
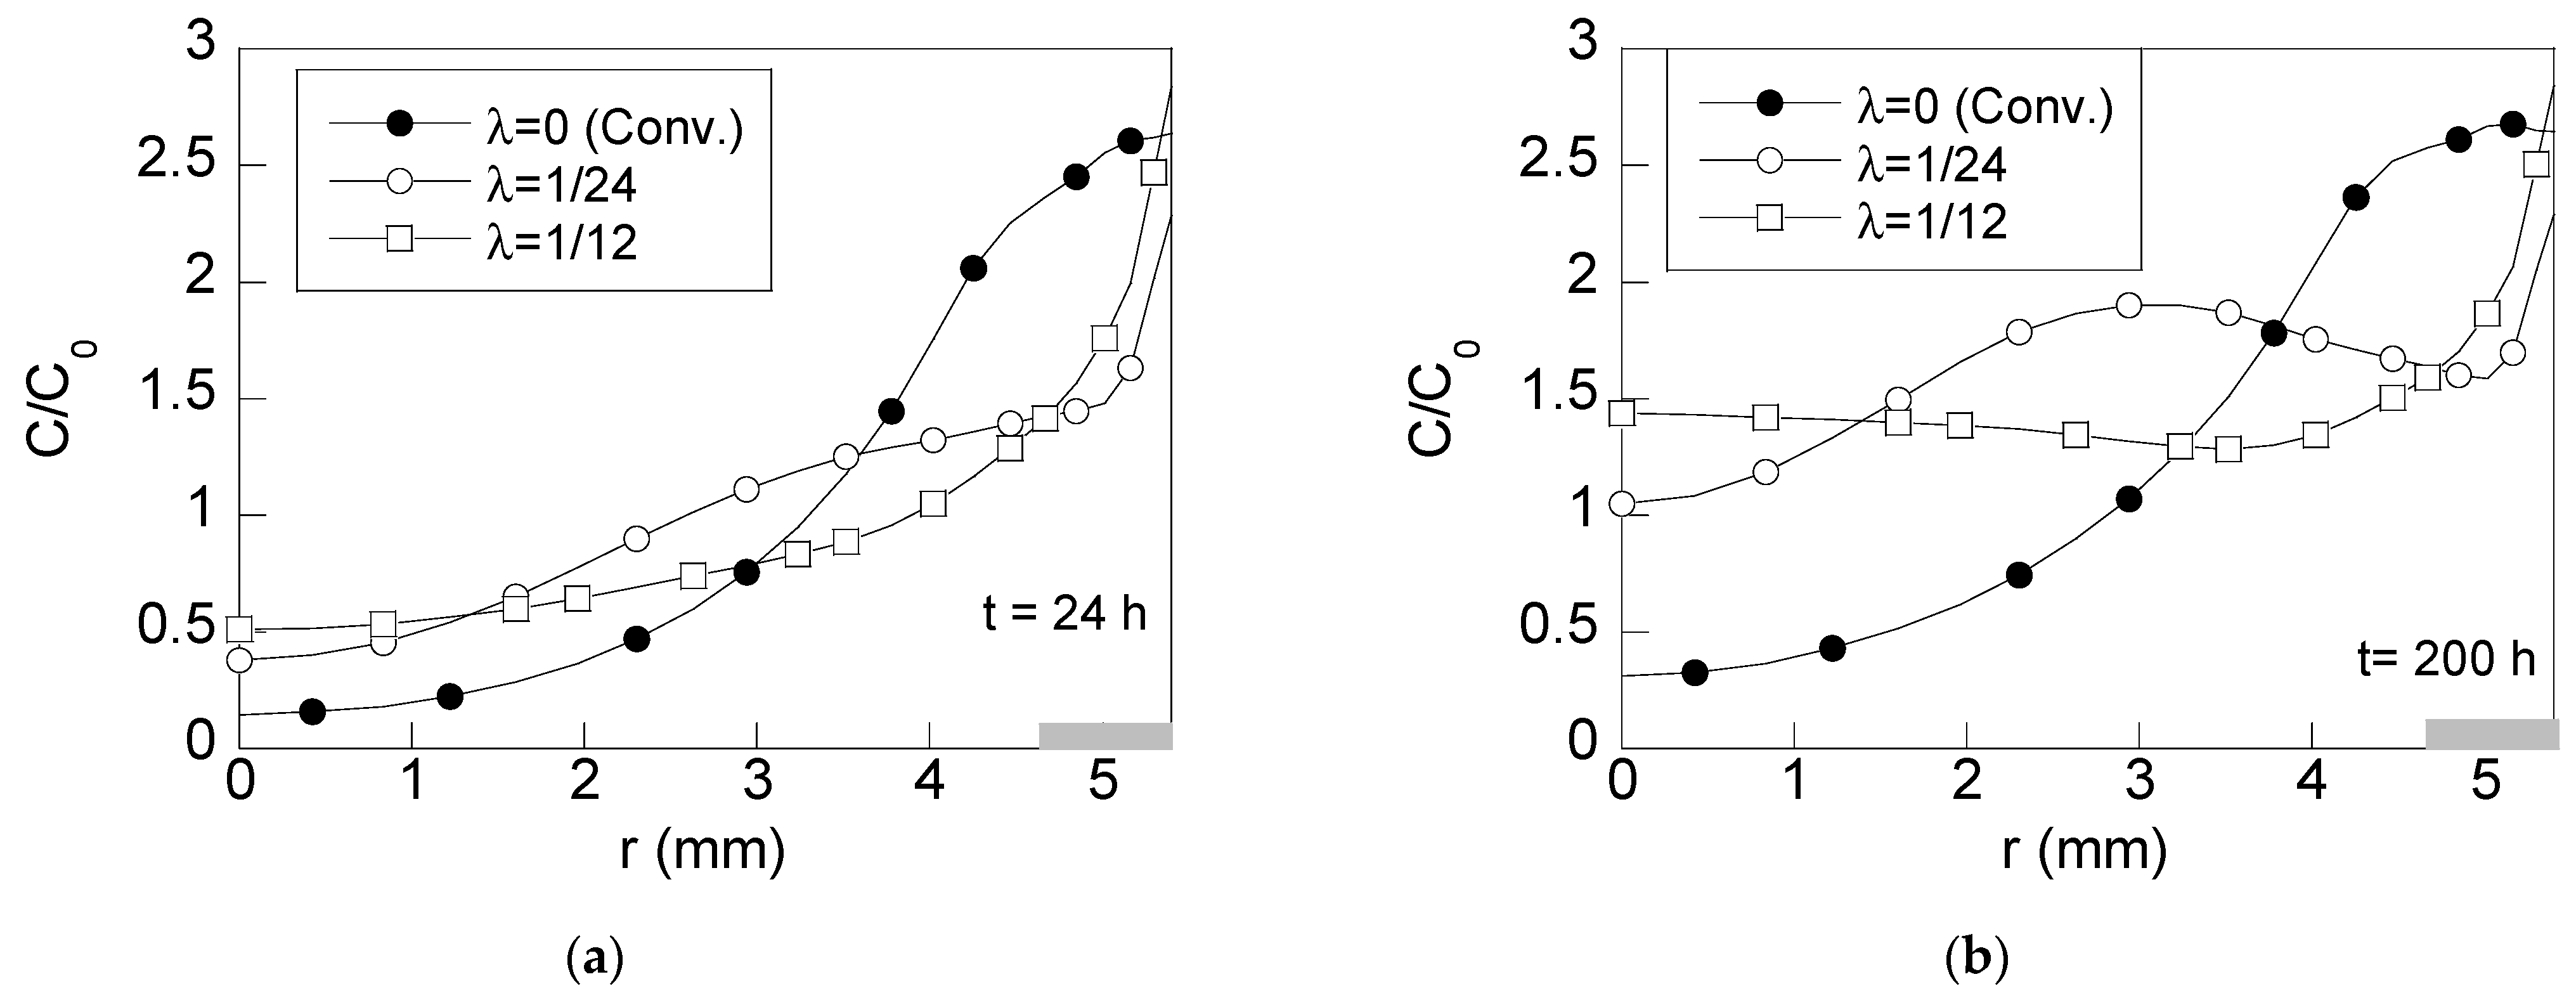
Figure 10) for both a conventionally drawn wire and for wires drawn with
non-conventional (
innovative) modified dies for short times of exposure to hydrogen environment (24 h) and for long times of exposure (200 h). For the sake of clarity, only three cases are represented in
Figure 10: (i) the conventional wire drawing and (ii) wires drawn with the optimal reduction ratios according to the previously discussed, (λ = 1/12 and λ = 1/24).
The radial distribution of hydrogen concentration reveals that changes in stress and plastic strains caused by a wire drawing including dies with skin pass zones are beneficial from the HE point of view. Thus, a significant reduction of the hydrogen content as high as 40% for λ = 1/24 and 30% for λ = 1/12 is obtained for short (24 h) and long times (200 h) of exposure to a hydrogenating environment at the wire surface surroundings. Notice that, according to [
49,
50,
51,
52,
53], such a zone is the place where the prospective damage zone (
x = 450 μm,
r/
a = 0.90) appears in these wires. However, for inner points of the wire (0 <
r < 3.5 mm), a higher hydrogenation than the one obtained using conventional dies is reached at the wire core. This effect is due to the reduction of the negative hydrostatic stress (
Figure 5b) cancelling the beneficial effect of compressive stresses on hydrogen accumulation observed in a conventional wire drawn. For long times of exposure, the hydrogen concentration at the inner points of the wire is significantly increased (see
Figure 10b), but it is worth to point out that the hydrogen amount is always lower (about a 75% for the reduction ratio 1/12 and 30% for the reduction ratio 1/24) than the one obtained in conventional wires at the prospective damage zone.
In addition, the hydrogen concentration at the wire surface is an indicator of the hydrogen potentially diffusible towards the inner points of the wire. Two competitive effects influence on this variable in wires drawn with modified dies: on one hand, the increment of equivalent plastic strains and, on the other hand, the reduction of hydrostatic stress. Thus, the analysis of such a parameter reveals that a slight increment of 10% is obtained for a wire drawn using dies with a reduction ratio of λ = 1/12, whereas a reduction of 10% is reached for dies with a reduction ratio of λ = 1/24. According to this, a lower amount of hydrogen is available at the wire surface for diffusing towards inner points in the case of the lowest reduction ratio.
Therefore, it can be concluded that the effect of skin pass is also beneficial from the HE point of view for the reduction ratio λ = 1/12 since the hydrogen concentration is notably reduced in the prospective damage zone (up to a 30%) instead of the soft increment of hydrogen concentration at the wire surface. However, a better reduction of hydrogen concentration is obtained for a reduction ratio λ = 1/24. For this case, the hydrogen amount is lower at the wire surface (10%) and, also, it is lower (40%) throughout the prospective damage zone. Consequently, the hydrogen microstructural damage leading to final catastrophic failure [
49,
50,
51,
52,
53] will be lower too, and the susceptibility of such a wire to the HE-related phenomena will be lower.
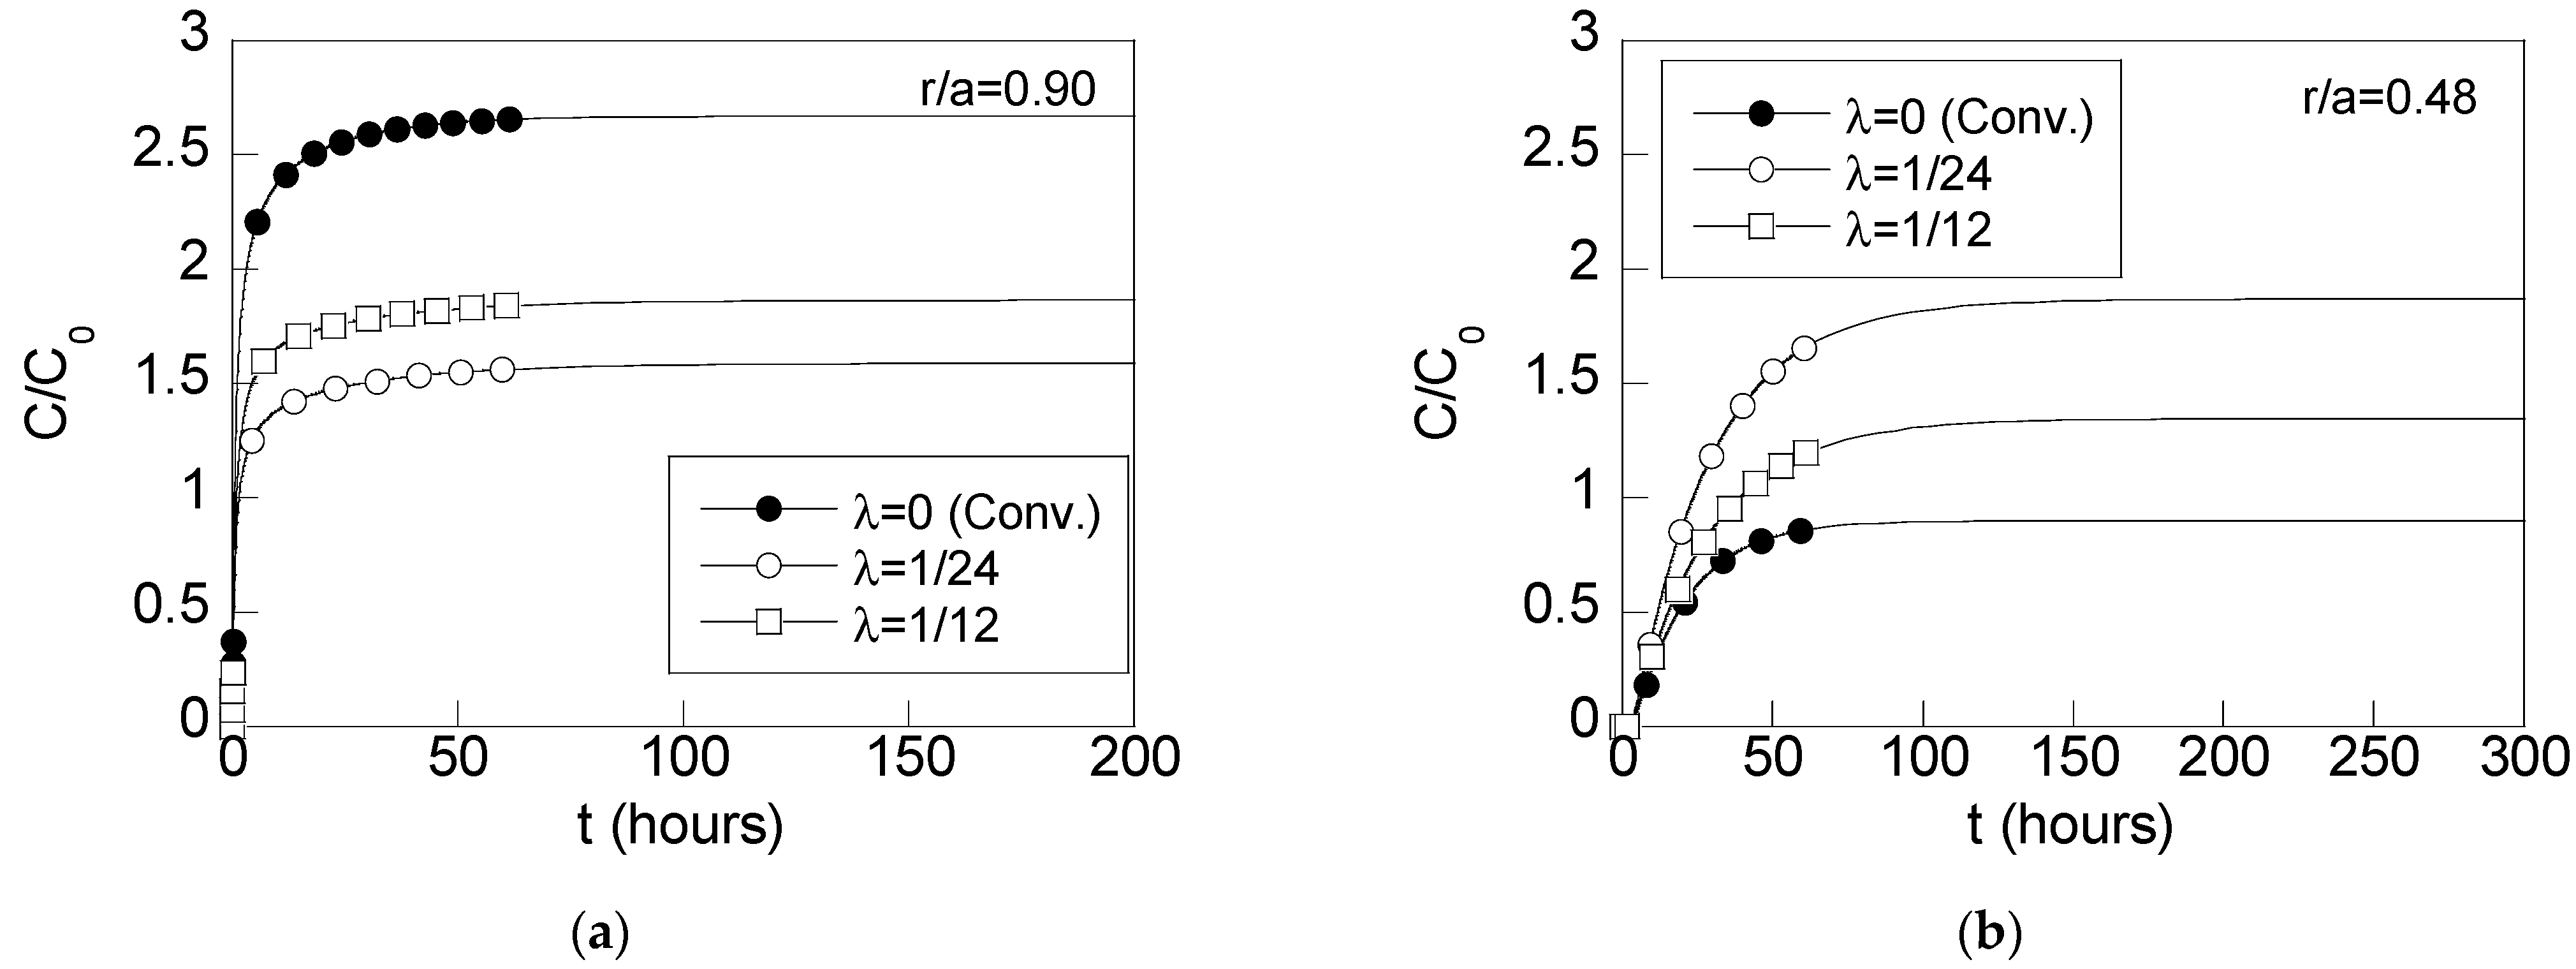
To go further in the analysis, the time evolution of the hydrogen accumulation is shown in
Figure 11 for two positions of relevance,
r/
a = 0.48 and
r/
a = 0.90.
The time evolution of hydrogen concentration reveals how hydrogen is accumulated at certain points of interest. In this study, the main attention is focused on the prospective damage zone (5.0 mm <
r < 5.4 mm) and the zone where the hydrogenation of wires drawn with modified dies were higher than the hydrogenation in conventional wires (2.0 mm <
r < 4.0 mm). Thus, at the prospective damage zone (
Figure 11a), the hydrogen amount obtained with modified dies is notably lower than the hydrogen concentration obtained in a conventional wire drawn as previously discussed. In addition, the slope of the curves shows that the hydrogen accumulation is about a 30% faster in conventional wires reaching a high amount of hydrogen sooner than wires drawn with modified dies including a skin pass zone. Thus, the beneficial effect of using skin pass dies is again revealed since the hydrogen accumulation is lower and also slower than the one appearing in wires using conventional dies.
In the case of inner points,
r/
a = 0.48 (
Figure 11b), the trend of hydrogen accumulation is just the opposite. This way, the hydrogen accumulation is higher and faster for wires drawn with dies including a skin pass zone, being faster for low reduction ratios (16% for λ = 1/12 and 52% faster for λ = 1/24 regarding to a conventional wire). This way, these results reveal the beneficial effect of inner compressive stress obtained in conventional wires acting against hydrogen diffusion. It is worth highlighting that the slopes of the hydrogen accumulation curves are smoother than those observed at the prospective damage zone (
Figure 11a), or, in other words, the hydrogen accumulation at the inner points is notably slower than the one at the wire surface surroundings. So, it can be concluded that at inner points, the hydrogen concentration reaches lower values than at the wire surface surroundings and, also hydrogen accumulation takes more time at that place than at the wire surface surroundings. Consequently, hydrogen damage is less probable to occur at inner points of the wire.


