Article

Study on Denitration Performance of Mn-Ce/TiO2 Low-Temperature SCR Catalyst

1
College of Metallurgy and Energy, North China University of Technology, Tangshan 063200, China
2
Chengde Vanadium & Titanium New Material Co., Ltd., Chengde 067102, China
*
Author to whom correspondence should be addressed.
Metals 2023, 13(2), 426; https://doi.org/10.3390/met13020426
Submission received: 18 January 2023 / Revised: 31 January 2023 / Accepted: 17 February 2023 / Published: 18 February 2023

Abstract

:
Low sintering flue gas temperatures and large temperature fluctuations require the development of low-temperature and efficient SCR (selective catalytic reduction) catalysts suitable for the sintering process. It has been shown that modified Mn-Ce/TiO2 catalysts have good denitration capability and have potential commercial use. In this experiment, TiO2-loaded Mn and Ce SCR catalysts were prepared using the impregnation method, and a series of characterizations of the samples were carried out to illustrate the effect of the active material on the denitration efficiency. The kinetic analysis provides theoretical as well as data support for the subsequent optimization of the SCR catalysts. The results show that the denitration efficiency of the catalysts can reach 93.86% when the Mn content is 10% and the Ce content is 3%. The doping of active substances can increase the specific surface area, total pore volume and average aperture of the catalysts and improve the adsorption capacity of the catalysts.

1. Introduction

The iron and steel industry is an important guarantee for the security of the national economy and national defense. In the past three decades, the rapidly developing iron and steel industry has provided strong support for China’s economic construction. As a high-energy and high-pollution industry, it will inevitably have a certain impact on the environment. Within the industry, sintering flue gas in the traditional blast furnace ironmaking process has always been a problem to be solved. SOx, NOx and other harmful gases have caused certain damage to the environment, so discharged flue gas must be pretreated [1,2]. The most mature synergistic approach to desulfurization and denitration is semi-dry desulfurization coupled with low- and medium-temperature SCR denitration [3,4,5], which removes dust and sulfur oxides from the flue gas before entering the denitration process. The dust and sulfur contents of the sintered flue gas do not have a large impact on SCR catalysts [6].
The sintering flue gas temperature is low, but at present, commercial catalysts in steel plants are generally high-temperature types, so this article aims to develop a low-temperature catalyst suitable for the sintering process and to analyze the factors affecting the performance of this catalyst from a kinetic point of view. MnOx-loaded catalysts have low-temperature activity [7,8,9] and are the first choice for preparing low-temperature catalysts [10,11,12]. During preparation, doped metal oxides, especially transition metals, such as Fe, Ce, Cu, Nb, Sn, Ni and Cr [13,14,15,16], play a very important role in improving the activity of SCR catalysts. Ce is easy to convert between its own oxide Ce2O3 and CeO2 and has strong oxygen storage and release capacity. The addition of Ce has the most significant effect on the denitration efficiency of the catalyst [17]. Xiang Gao et al. [18] prepared a series of CeOx/TiO2 catalysts and found that the denitration efficiency of the CeOx/TiO2 catalysts is up to 98.6% at 450 °C but less than 40% at 175 °C. Cimino et al. [19] explored the influence of acetate and nitrate as precursors in the denitration performance of MnOx/TiO2 catalysts. The results showed that manganese oxide prepared with manganese acetate as a precursor has a stronger reduction ability at low temperatures. Wang et al. [20] prepared a series of Mn-Ce/Ti-PILCs catalysts. Mn (6%)-Ce (6%)/Ti-PILCs have good low-temperature activity, and the NO conversion rate at 250 °C is more than 95%. Among them, the valence conversion of Mn4+/Mn3+ and Ce4+/Ce3+ is conducive to the removal of NO.
This experiment used TiO2 as the carrier and adopted the impregnation method to prepare Mn/TiO2 and Mn-Ce/TiO2 catalysts. By changing the amount of Mn and Ce added, catalysts with different loading amounts were obtained, and the denitration performance of the samples was measured. Finally, the samples were characterized via XRD, SEM, BET, etc. By comparing the denitration efficiency of each sample and its characteristics, the influence law of loading on the denitration efficiency was analyzed, the optimal parameters for the preparation of Mn-Ce/TiO2-type catalysts were provided, and the mechanism of the influence of each active substance on the denitration efficiency of the catalysts was elaborated to provide data support for the subsequent optimization of low-temperature SCR denitration catalysts. For the evaluation of the catalytic denitration performance, the expression η NO x is shown in Formula (1):
η NO x = 1 NO x i n NO x o u t NO x i n × 100 %
where η NO x is the denitration rate of catalysts, NOxin is the concentration of NOx at the inlet of the catalytic unit, and NOxout is the concentration of NOx at the outlet of the catalytic unit.

2. Materials and Methods

2.1. Instruments and Reagents

The main instruments used in this experiment are shown in Table 1.
The reagents used in this experiment are shown in Table 2.

2.2. Preparation of Mn/TiO2 Catalysts

The Mn/TiO2 catalysts were prepared by loading manganese nitrate as a metal active component on TiO2. The operating method was as follows: A certain amount of TiO2 powder was weighed in a beaker. Then, a manganese nitrate solution was added, followed by the addition of a certain amount of deionized water, with stirring at room temperature for 2 h. The sample was placed in an ultrasonic cleaner for auxiliary impregnation for 2 h. After removal, it was stirred evenly with a glass rod, placed in an oven, heated up to 105 °C and dried for 12 h. Then, the completely dried sample was taken out, ground to a powder and transferred to a crucible. The sample was roasted in a muffle oven at 500 °C for 4 h; after cooling, it was removed, ground again and sealed for reserve [21]. The obtained catalysts are shown in Table 3.

2.3. Preparation of Mn-Ce/TiO2 Catalysts

In addition to single-component Mn/TiO2 catalysts, Mn-Ce/TiO2 catalysts were also prepared for this experiment. The effect of the amount of Ce added on the Mn/TiO2-based catalyst was explored. On the basis of adding the manganese nitrate solution, a certain amount of cerium nitrate was weighed and stirred with water with TiO2 powder. The preparation method for these catalysts was the same as that for the above catalysts, as shown in Table 4.

2.4. Experimental Method

The experimental method was as follows: The tubular resistance furnace was started, the heating rate was set to 5 °C/min, and the temperature was kept constant for 1~2 h after reaching the target temperature. A certain amount of the catalyst was weighed, it was spread evenly on the quartz cotton, and the quartz cotton was placed in the quartz tube. At both ends of the sealed tube furnace, high-purity N2 was introduced to discharge other gases in the pipe, and then O2, NO and NH3 were introduced to regulate each gas at the required flow. The gas entered the catalytic reaction device after passing through the gas-mixing device. The mixed gas reacted with the catalyst, and the reaction gas entered the PTM600-3 gas analyzer. The analyzer used the pumping detection method to suck the gas in the environment into the instrument for detection. If the gas concentration in the environment was uniform and stable, the reading could be stable for about 30 s. The conceptual diagram of the whole installation is shown in Figure 1.

2.5. Working Mechanism of Catalyst

The schematic diagram of the SCR denitration technology is shown in Figure 2, and the main reactions occurring on the catalyst are shown in Formulas (1)–(4). When the flue gas passing through the SCR catalyst contains NH3, NOx and O2, these three gas molecules react with the comproportionation of N on the catalyst surface, and the oxidation of NO and the reduction of NH3 generate harmless N2, thus realizing the removal of NO.
4 NH 3 + 4 NO + O 2     c a t a l y z e r     4 N 2 + 6 H 2 O  
4 NH 3 + 6 NO   catalyzer   5 N 2 + 6 H 2 O
4 NH 3 + 2 NO 2 + O 2   catalyzer   3 N 2 + 6 H 2 O
8 NH 3 + 6 NO 2   catalyzer   7 N 2 + 12 H 2 O

2.6. Catalyst Characterization

2.6.1. X-ray Diffraction Analysis

The D/MAX2500PC X-ray diffraction instrument from Rigaku Co., Ltd. (Akishima, Japan), was used to examine the powdered catalyst with a scanning diffraction angle ranging from 2θ = 5° to 80° and a scanning speed of 10°/min. The diffraction pattern obtained could be used to determine the crystalline phase of TiO2 in the catalyst and the type and morphology of the compound produced after loading the active material.

2.6.2. Scanning Electron Microscope Analysis

The S-4800 field emission scanning electron microscope from Hitachi, Japan, was used to scan the catalyst, which had an acceleration voltage of 0.5~30 kV and a magnification of 20~800 k. The electron micrographs at 100 k magnification were chosen for this experiment to observe the effect of the loaded active substance on the morphology of the TiO2 particles and the effect on the original pore structure from the morphology. The effect of the loaded active substance on the morphology of the TiO2 particles and on the original pore structure was observed morphologically.

2.6.3. Specific Surface Area and Pore Structure Analysis

The specific surface area, total pore volume and mean pore size of the catalysts were tested using a McASAP 2460BET physical adsorption instrument. The test utilized the adsorption properties of solid materials to measure the specific surface area and pore structure of the material in terms of gas molecules. N2 was selected as the adsorption gas and the samples were degassed at 200 °C for 7 h. Several catalysts were measured to explore the effect of the addition of the active material on the original specific surface area, pore volume and pore size of TiO2 and the relationship between the efficiency of the catalyst and these surface parameters.

2.6.4. In Situ Diffuse Reflectance Fourier Spectroscopy (FTIR) Analysis

The catalyst was routinely pressed into a powder using a Thermo Fisher Nicolet iS20 FTIR spectrometer in the wave number range of 500 to 4000, as different chemical bonds absorb infrared light at different frequencies, so each bond has its own corresponding spectrum, namely a molecular absorption spectrum. The location and intensity of the peaks in the spectrum can be used to determine the functional groups and active sites contained in the catalyst.

2.6.5. X-ray Photoelectron Spectroscopy

The elemental, valence and relative contents of the catalysts were measured using the Thermo Fisher EscaLab Xi+ X-ray Photoelectron Spectrometer. As the energy of the photoelectrons escaping from different atoms or molecules differs when they are excited by X-rays, the instrument measures the energy of the escaping electrons and draws an XPS spectrum, from which a comparison can be performed to determine the element in the catalyst and the valence state of that element, as well as the relative content of different valence states of the same element.

3. Results and Discussion

3.1. Study on Catalyst Denitration Performance

3.1.1. Effect of Mn on the Denitration Performance of Mn-Based/Mn-Ce Catalysts

The relationship between the denitration efficiency of Mn-based catalysts and the content of Mn is shown in Figure 3a. The denitration efficiency of the six Mn-based catalysts in Table 1 was tested under experimental conditions ranging from 100 to 225 °C. It can be observed from the diagram that the catalytic efficiency of the catalyst first increased and then decreased with the increase in the Mn content. When the content of Mn was 10%, the highest value of the catalyst efficiency was 86.53%. As the content of Mn continued to increase, the efficiency of the catalyst began to decrease.
Figure 3b shows the denitration performance of catalysts 6~15 in Table 4. During the process of increasing the Mn content from 3% to 10%, the catalyst efficiency increased with the increase in the Mn content, and the Mn content continued to increase. The denitration efficiency of the Mn-Ce catalysts began to decrease, and the most efficient catalyst was still M10C3. With Figure 3a,b, it is not difficult to see that adding either Mn or Mn and Ce together improves the catalytic efficiency of the catalyst. However, the improvement in the catalytic efficiency is limited, and an excessive load reduces the denitration efficiency of the catalyst.

3.1.2. Effect of Ce on Denitration Performance of Mn-Ce Catalysts

The denitration performance changes in catalysts 1~5 and M10 in Table 4 were tested in the temperature range of 100~225 °C. The effect of the Ce content on the denitration performance of the catalysts is shown in Figure 4. The denitration performance of the catalyst loaded with Mn and Ce was improved compared with that of the catalyst only loaded with Mn. The catalytic efficiency of the catalyst increased first and then decreased with the increase in the Ce content. When the Ce content was 3%, the maximum efficiency of the catalyst could reach 93.86%. When the Ce content increased to 4% and 5%, the denitration efficiency of the catalyst started to decrease gradually.

3.2. Characterization of Catalyst Samples

3.2.1. XRD Analysis of Catalysts

The XRD spectra of catalysts M10 and M10C1~M10C5 are shown in Figure 5. Due to the high content of TiO2, the main characteristic peak of the catalysts was anatase-type TiO2, and the characteristic peak of TiO2 partially overlapped with that of MnOx and CeO2. The diffraction peaks of MnO2 and Mn2O3 can be observed in the XRD pattern, which occurred at 2θ = 37°, 48.4°, 74.7° and near 76.1° and at 2θ = 55.3°, 62.3°, 69° and 70.8°. Due to the low amount of doped Ce, the diffraction peak of CeO2 was observed only in the diffraction pattern of the M10C5 catalyst at 2θ = 48° and around 70.5°. The peak type of the added active material oxides was not as obvious as that of TiO2, which indicates that the oxide formed by the added active material distributed uniformly without obvious aggregation [22].

3.2.2. SEM Analysis of Catalysts

The morphology of the TiO2, M10, M10C1, M10C3 and M10C5 catalysts is shown in Figure 6. Figure 6A shows the TiO2 powder. TiO2 is a uniform, round, elliptical and smooth particle with a particle size of 50–100 nm. After loading Mn, compared with the surface of pure TiO2, some finer particles attached to the surface of the M10 catalyst, resulting in unsmooth bumps. After loading Mn and Ce, it could be seen that the surface of the TiO2 particles was rougher, and there were almost no smooth TiO2 particles. The active substances were highly dispersed but also produced a small amount of agglomeration. With the increase in Ce loading, the surface roughness of the catalyst also increased. The active substances were uniformly attached to the surface of the TiO2 particles, providing more pores. Figure 6E shows the M10C5 catalyst. Excessive Ce loading caused serious agglomeration on the surface of the catalyst, and the distribution of mesopores was uneven. Excessive Ce doping led to the sintering and agglomeration of some active substances and pore plugging, which was not conducive to the adhesion of gas molecules [23]. According to the analysis of the experimental results, a proper amount of active material agglomeration is conducive to the catalytic reaction, whereas an excessive amount of active material agglomeration affects the performance of the catalyst.
Figure 7 shows the morphology of M8C3, M10C3 and M12C3. With the increase in the Mn content, it could be observed that the surface of the catalyst became rougher, and the amount of Mn added continuously increased. In M12C3, due to the load exceeding the limit of the surface energy of TiO2 particles, the M12C3 catalyst began to produce some fine particles in the pores between TiO2 particles. With the increase in the Mn content, the structure of the catalyst gradually became compact, and the gap between particles was gradually filled, becoming smaller and smaller.

3.2.3. BET Analysis of Catalysts

After loading Mn or Mn-Ce on the TiO2 powder, the specific surface area of the catalysts was improved to varying degrees compared with that of TiO2. The pore volume and pore size of the catalyst loaded with a single Mn element were lower than those of TiO2, and the pore volume of the catalyst loaded with Mn and Ce was higher than that of TiO2. The pore size of the Mn-Ce catalysts, except for M10C5, significantly increased compared with that of TiO2. The surface parameters of TiO2 and various catalysts are shown in Table 3. It can be seen from 
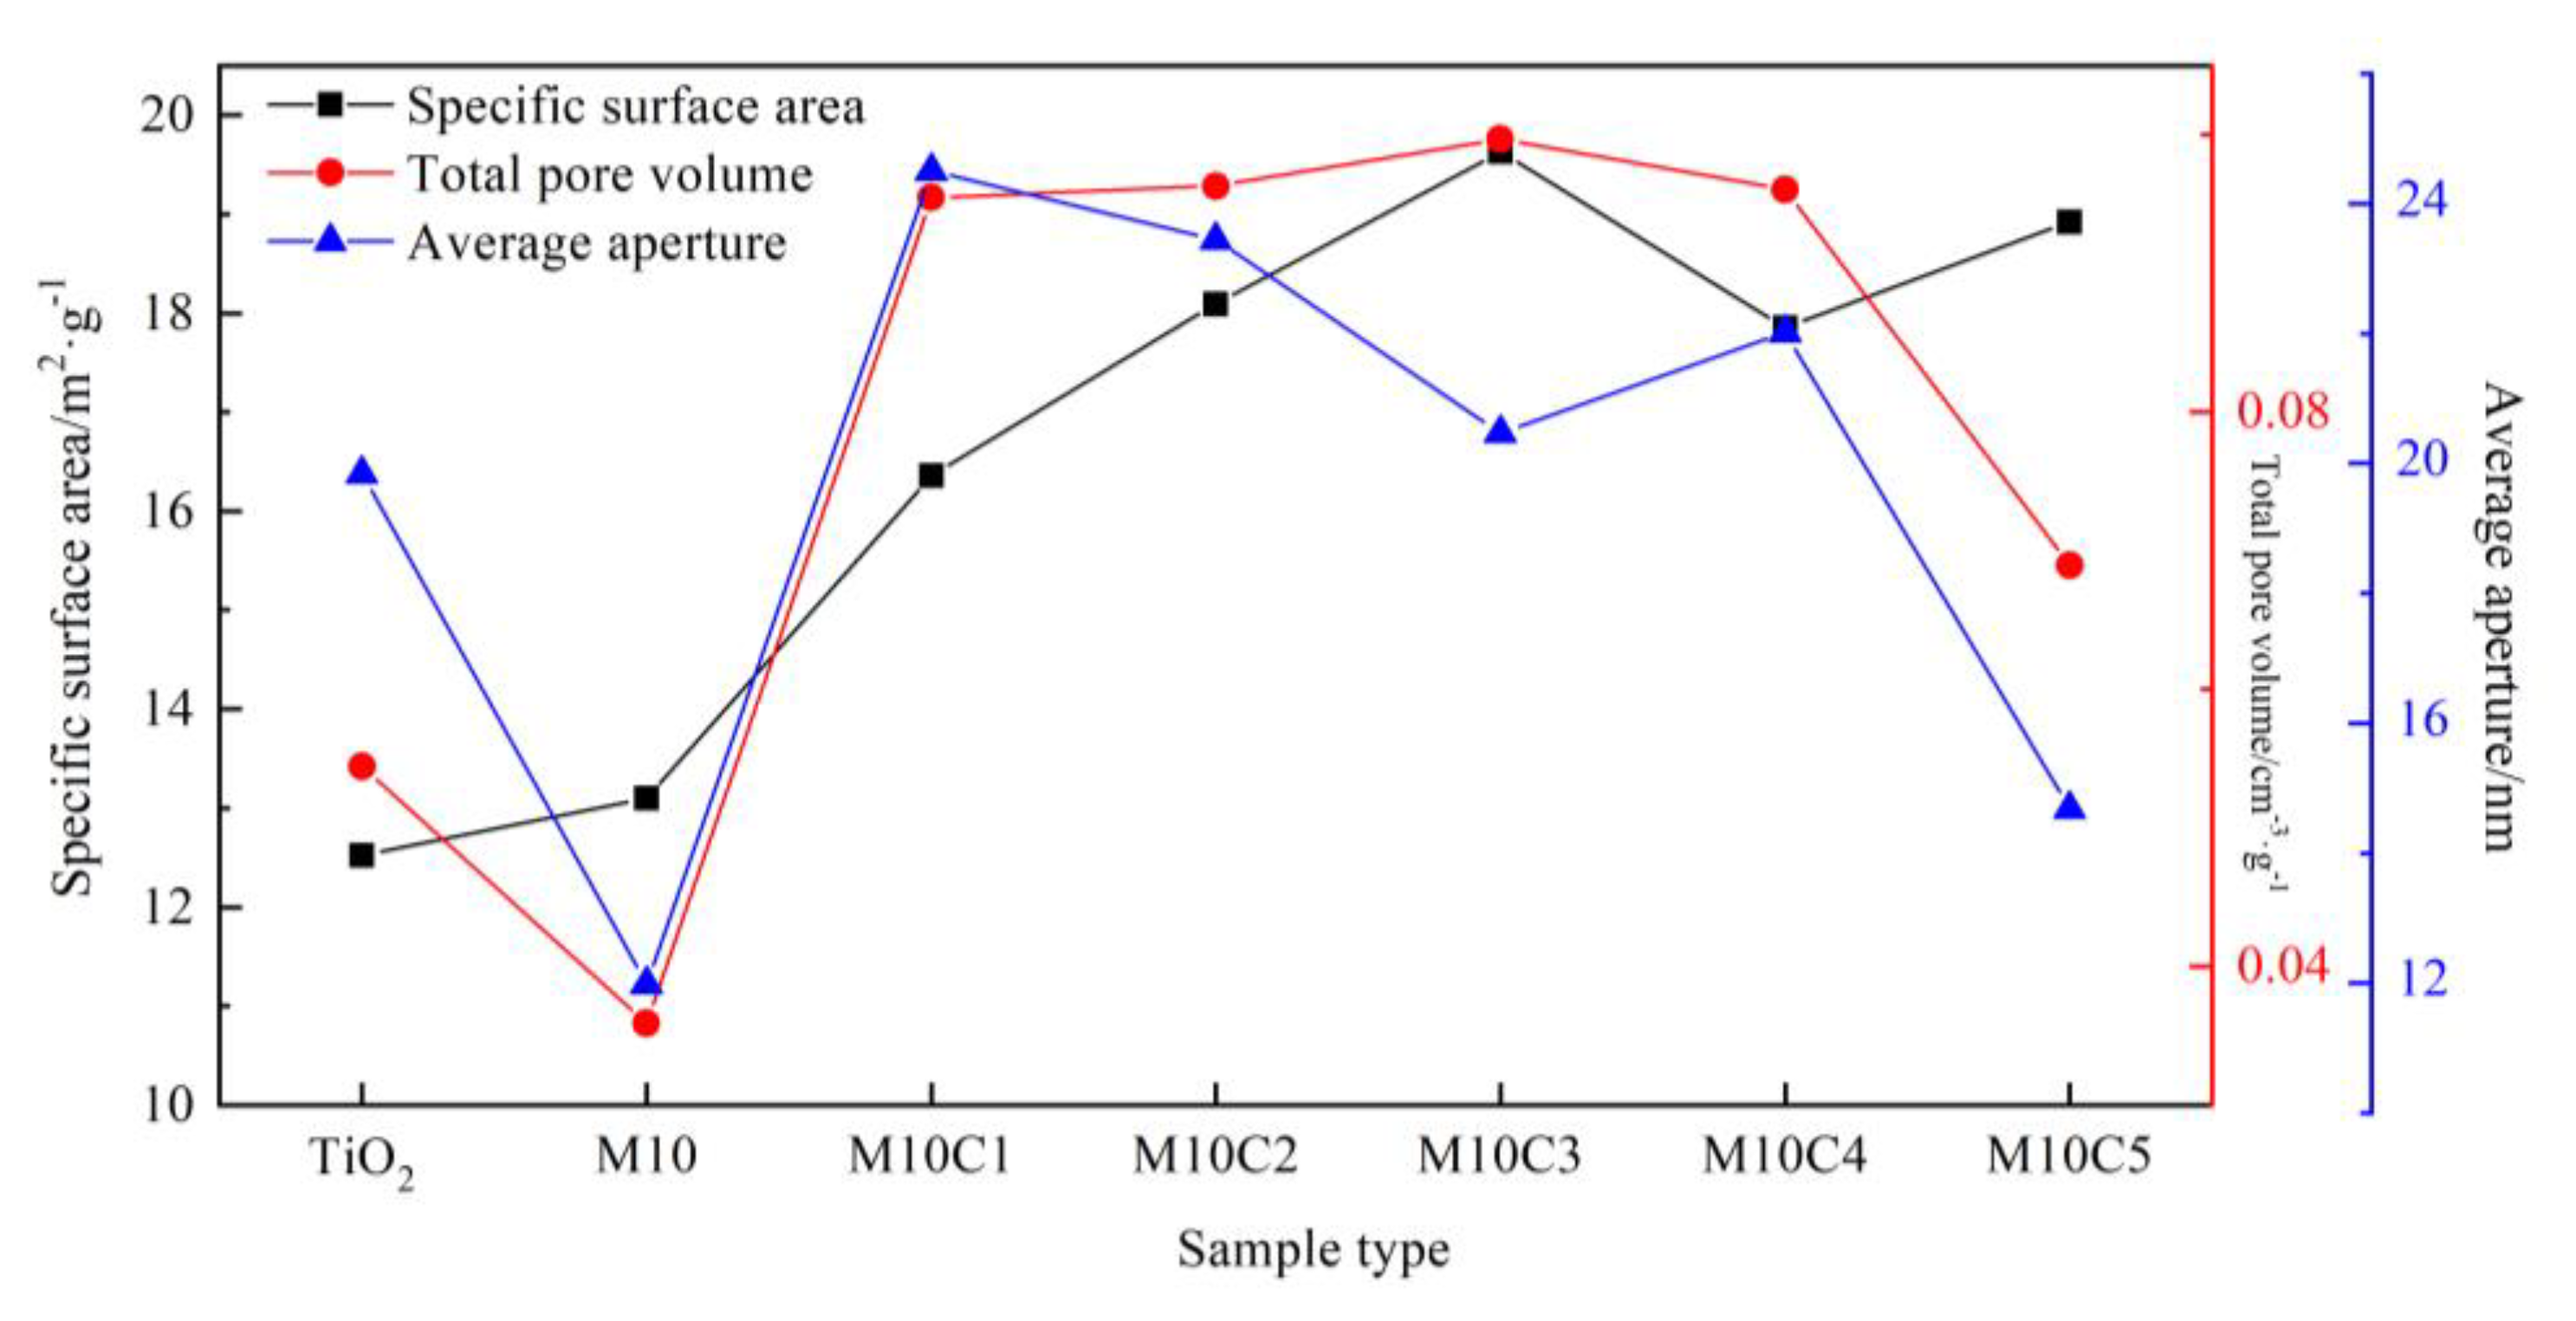
Table 5 that the specific surface area of the TiO2 powder was only 12.53 m2·g−1. After adding 10% Mn, the specific surface area slightly increased to 13.10 m2·g−1. After adding Mn and Ce at the same time, the specific surface area was significantly increased. The catalyst with 10% Mn and 3% Ce content had the largest specific surface area, which was 55.9% higher than that of TiO2. As the Ce content continued to increase, the specific surface area of the catalyst began to decrease.
After loading Mn on TiO2, the pore volume decreased. It may be that the oxide of Mn blocked the mesopores between some TiO2 particles. The addition of Ce significantly increased the pore volume of Mn-based catalysts, which was larger than the pore volume of TiO2. It is believed that the simultaneous addition of Ce and Mn inhibits the aggregation of Mn species, making them well dispersed on the carrier surface in an amorphous state [24], thus improving the pore volume of the catalyst. The pore volume of the M10C3 catalyst was the largest, increasing by about 83.1% compared with that of TiO2. As the Ce content continued to increase, the pore volume of the catalyst began to decrease. When the Ce content reached 5%, the pore volume of the catalyst decreased significantly.
Similar to the change in pore volume, the addition of Mn reduced the average aperture of TiO2, which may have been due to the adhesion of Mn oxide on the surface of TiO2 particles, making the pore size between particles decrease or even disappear. After Ce was added, the pore size increased significantly, and the average aperture of the M10C3 catalyst with the best catalytic efficiency was 3.2% higher than that of TiO2. However, from the data, there was no obvious relationship between the change in the average aperture and the amount of Ce added.
Figure 8 shows the change trend of the surface parameters of TiO2 and various catalysts. It can be seen from the figure that, when the Ce content increased from 1% to 3%, the average aperture of the catalyst decreased; when the Ce content increased from 3% to 4%, the average aperture of the catalyst increased; and when the Ce content increased to 5%, the average aperture of the catalyst decreased significantly. Combined with the change analysis of the total pore volume, the simultaneous addition of Mn and a small amount of Ce created more larger pores and improved the average aperture of the catalyst. With the increase in the Ce content, the average aperture of the catalyst began to decrease gradually, but the total pore volume still increased, indicating that the number of macropores in the catalyst decreased, and the number of small pores increased. When the Ce content was 3%, the denitration efficiency of the catalyst reached the highest value. At this time, the average aperture was the smallest among the Mn-Ce catalysts. However, the total pore volume was the largest. Therefore, the efficiency of the catalyst was not directly related to the size of the average aperture. The large number of evenly distributed pores in the catalyst was more conducive to the denitration reaction.
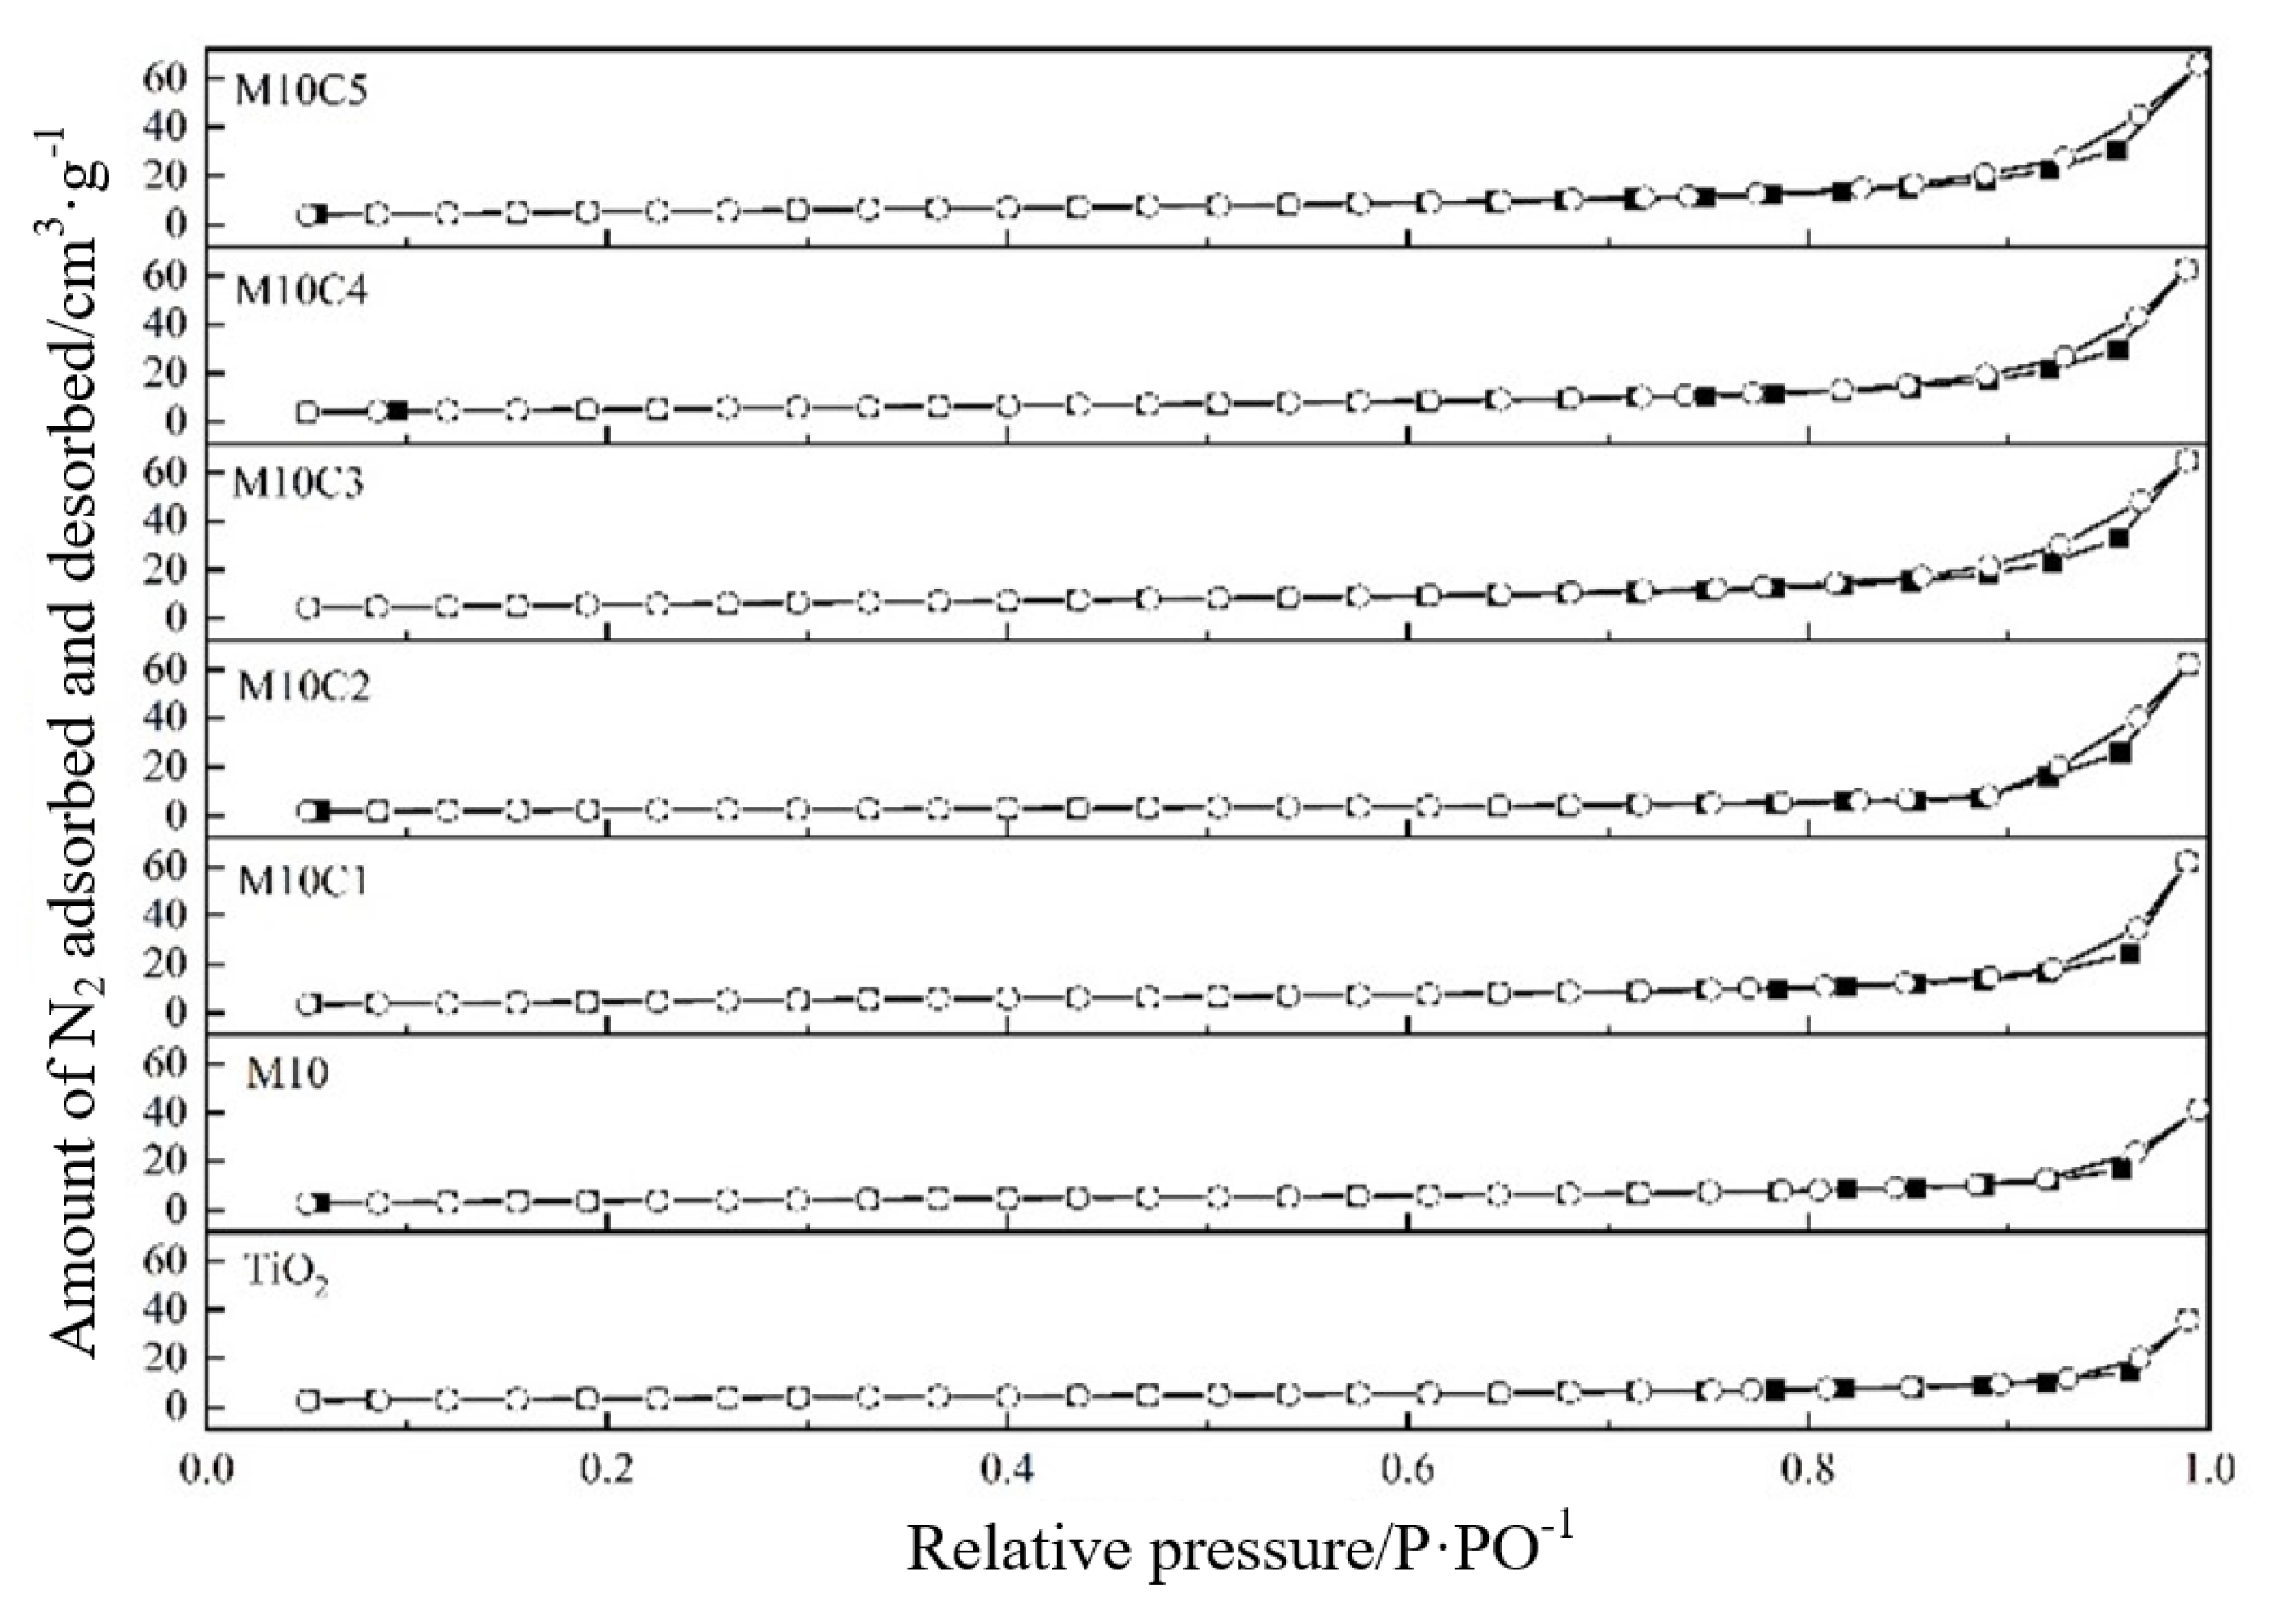
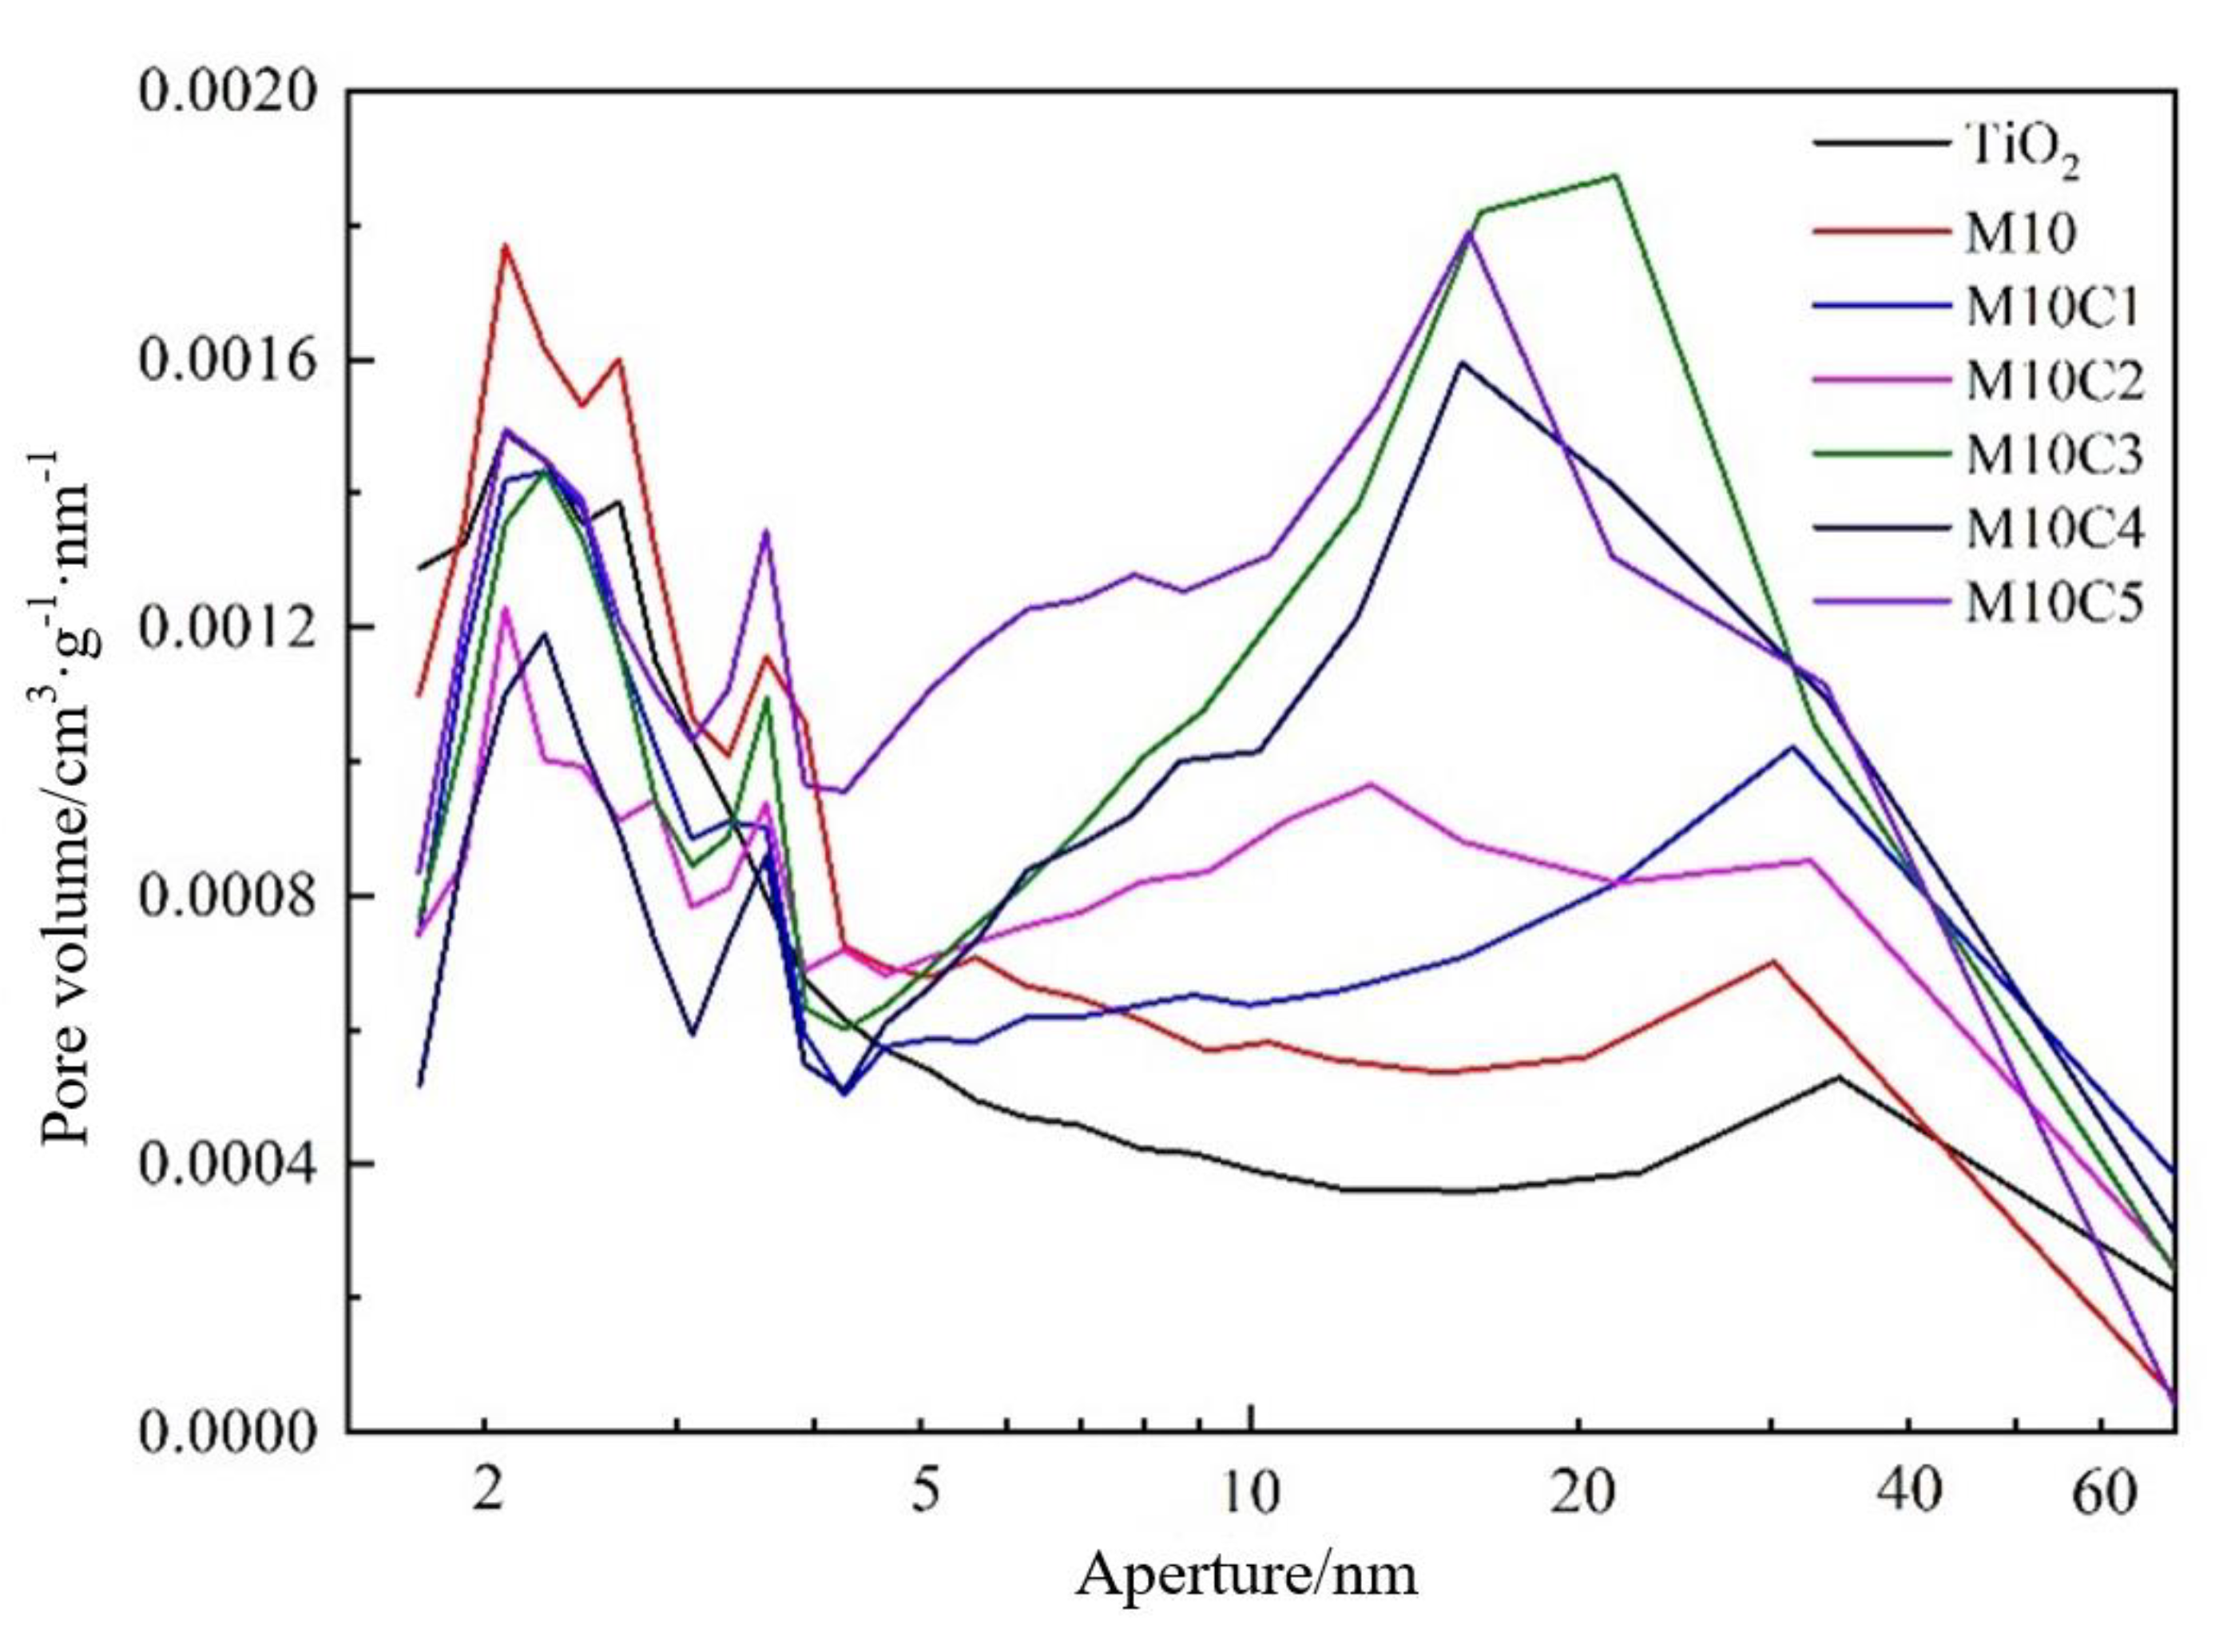
The isothermal adsorption and desorption diagram and pore size distribution curve of the sample are shown in Figure 9 and Figure 10. The isotherms of the samples were all type IV isotherms with obvious H3 mesoporous hysteresis loops, which proved that the mesopores in the samples were mainly formed by the stacking of TiO2 particles [25], and the addition of Mn blocked some large pores, thus leading to the reduction in pore volume. After Ce was added, the area of the hysteresis loop increased significantly, indicating that the number of mesopores in the sample increased, and that the joint addition of Mn and Ce increased the number of mesopores in the catalyst, thus enhancing the gas adsorption capacity of the sample. When the Ce content was greater than 3%, the area of the hysteresis loop decreased slightly, and at this time, the denitration efficiency of the catalyst also began to decrease, indicating that the addition of excessive Ce reduces the number of mesopores in the catalyst. This would affect the denitration performance of the catalyst.
From Figure 10, it can be seen that the addition of Mn increased the number of mesopores in the range of 2~4 nm and decreased the number of large pores above 50 nm, thus decreasing the average pore size of TiO2. After the addition of Ce, the number of mesopores from 2 to 4 nm started to decrease, and the number of mesopores from 10 to 50 nm increased. Therefore, the average pore size of the catalyst increased. At a Ce content of 3%, the number of mesopores from 10 to 50 nm increased, the number of pores around 20 nm was the highest, and the average pore size of the catalyst at this time was 20.47 nm, which indicated that the distribution of pores was more uniform in the M10C3 catalyst. As the Ce content continued to increase, the number of pores in the 10–50 nm range began to decrease gradually, and the denitration effect of the catalyst began to deteriorate gradually at this time.
Combining the above surface parameter changes with the pore size distribution analysis, it can be seen that the addition of Mn created a large number of small pores and also consumed some of the larger pores, thus reducing the average pore size and pore volume compared to those of TiO2. As the Ce content increased, the combination of Mn and Ce tended to be more uniform, and the M10C3 catalyst had a large number of mesopores around 20 nm. Although the average pore size was reduced, the distribution of the pores was more uniform, the pore capacity of the catalyst surface had a greater influence on the catalyst, and the uniformly distributed mesopores of around 20 nm were more conducive to the reaction. In addition, the addition of excess Ce would block the pores and reduce the number of these mesopores, resulting in the poor denitration performance of the catalyst.

3.2.4. FTIR Analysis of Catalysts

The Fourier infrared spectra of the M10, M10C3 and M10C5 catalysts are shown in Figure 11. It can be seen from the figure that the characteristic peak of the M10 catalyst at about 3460.63 cm−1 disappeared after Ce was added. With the addition of and increase in Ce, the two characteristic peaks at about 593 cm−1 and 684 cm−1, respectively, represented a reduction in the area of the Mn-O stretching vibration peak in Mn2O3 and MnO2. The results show that the doping of Ce affected the O-H bond on the surface of the catalyst, the interaction between Ce and Mn, and the vibration intensity of Mn-O, and the relative content of MnOx decreased.

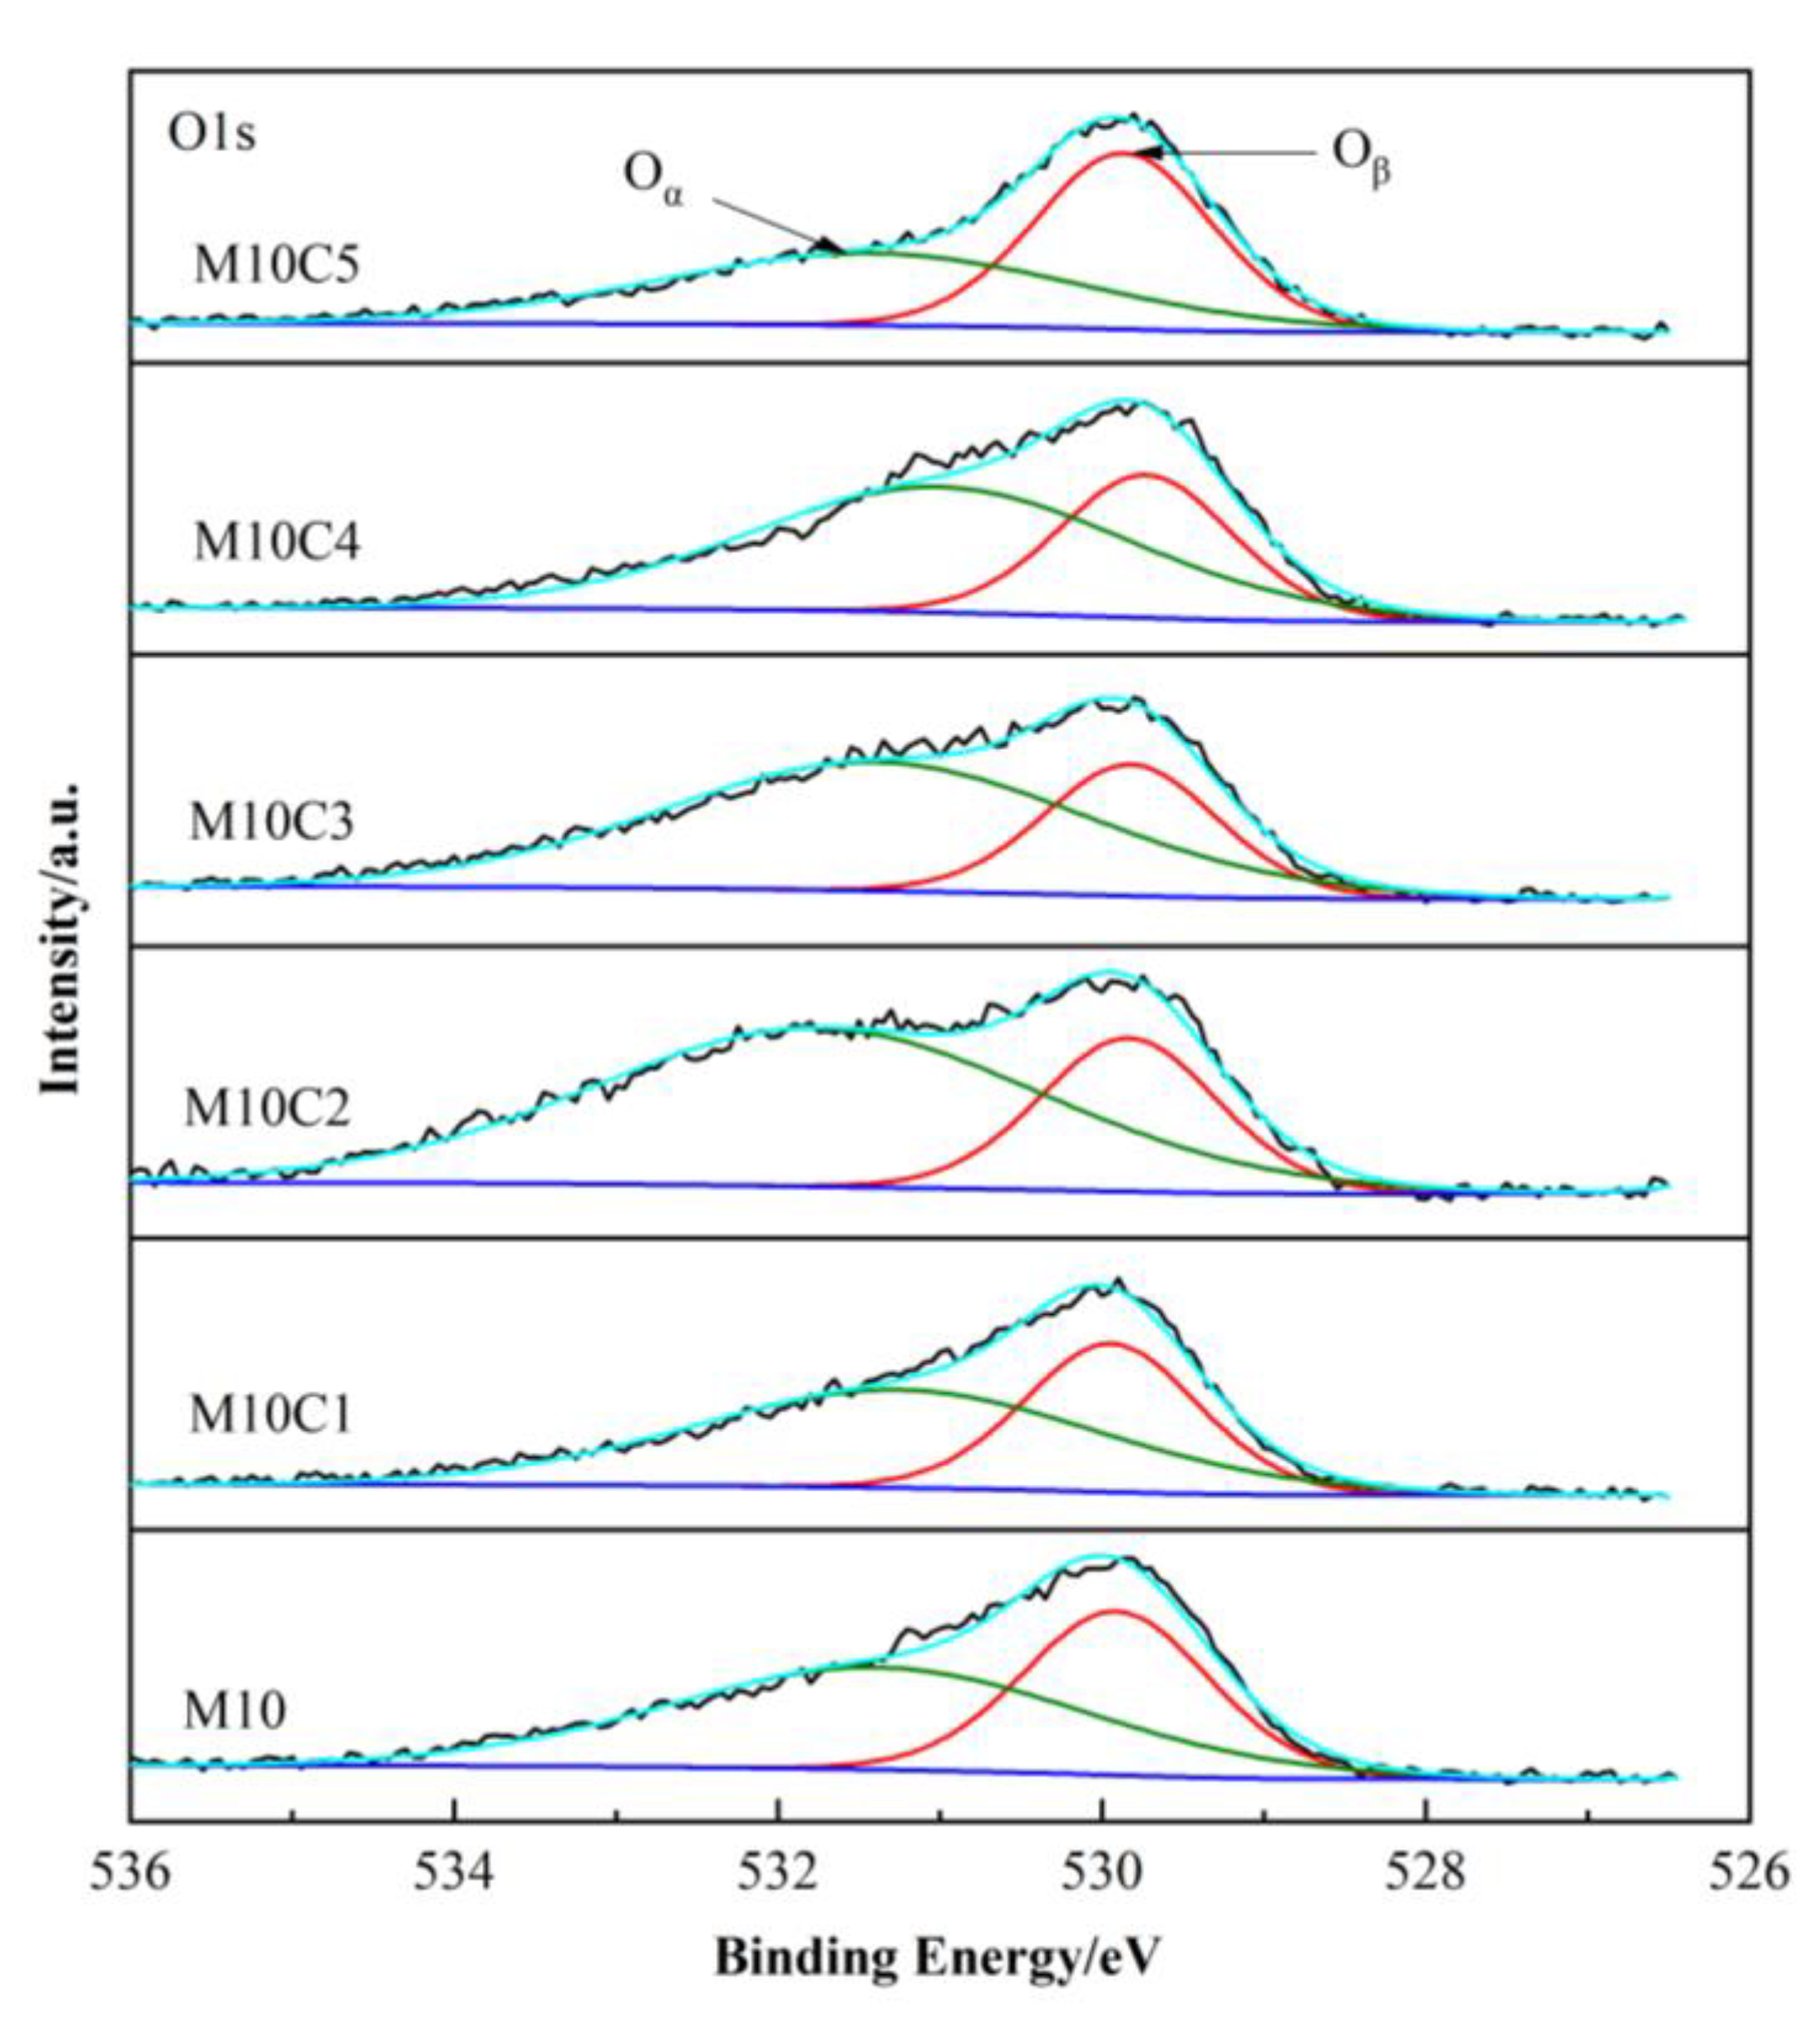
3.2.5. XPS Analysis of Catalysts

Figure 12 shows the O1s XPS spectra of some catalysts. The O1s spectra of the catalysts were fitted as two characteristic peaks representing the Oα and Oβ of chemisorbed oxygen on the surface of the catalysts [2], which were located at 529.9 eV and 531.4 eV, respectively. It can be seen from the diagram that the peak area of Oα increased significantly with the increase in the Ce content. When the Ce content reached 2%, the peak area of Oα began to decrease. Table 6 shows the relative content of O on the surface of the catalyst. The ratio of Oα/Oα+ Oβ increased first and then decreased with the increase in the Ce content. The literature review shows that Oα is more active than Oβ and more conducive to the reaction [26]. The changes reflected by the XPS spectra are in agreement with the experimental results.
Figure 13 shows the XPS spectrum of the Mn2p orbital of the M10~M10C5 catalysts. The Mn2p orbital of the catalysts has two characteristic peaks, Mn2p1/2 and Mn2p3/2 [27], which are located at 638.6 eV and 649.9 eV, respectively. Mn exists as Mn3+, Mn4+ and Mn-sat [28]. It is known from the literature that Mn4+ is more active in the catalytic reaction [29].
Table 7 shows the relative content of Mn on the surface of the catalysts. The relative content of Mn4+ was the highest before the addition of the Ce element. After the addition of 1% Ce, the relative content of Mn4+ rapidly decreased. By continuing to add Ce, the relative content of Mn4+ began to rise, and the Ce content reached 3%. The further addition of Ce would reduce the Mn4+ content on the surface of the catalysts.
The results show that the M10 catalyst without Ce had a higher content of Mn4+ but a lower denitration efficiency than the Mn-Ce catalyst. Although the content of Mn4+ decreased after adding Ce, the catalytic effect was improved to a certain extent, indicating that the relative content of Mn4+ was not the only factor affecting the catalytic effect. From the data trend, as the content of Mn4+ or Ce added to the Mn-Ce catalyst becomes higher, the catalytic effect becomes better. This indicates that the different valence states of Ce on the surface of the catalyst also had an important influence on the catalytic effect.
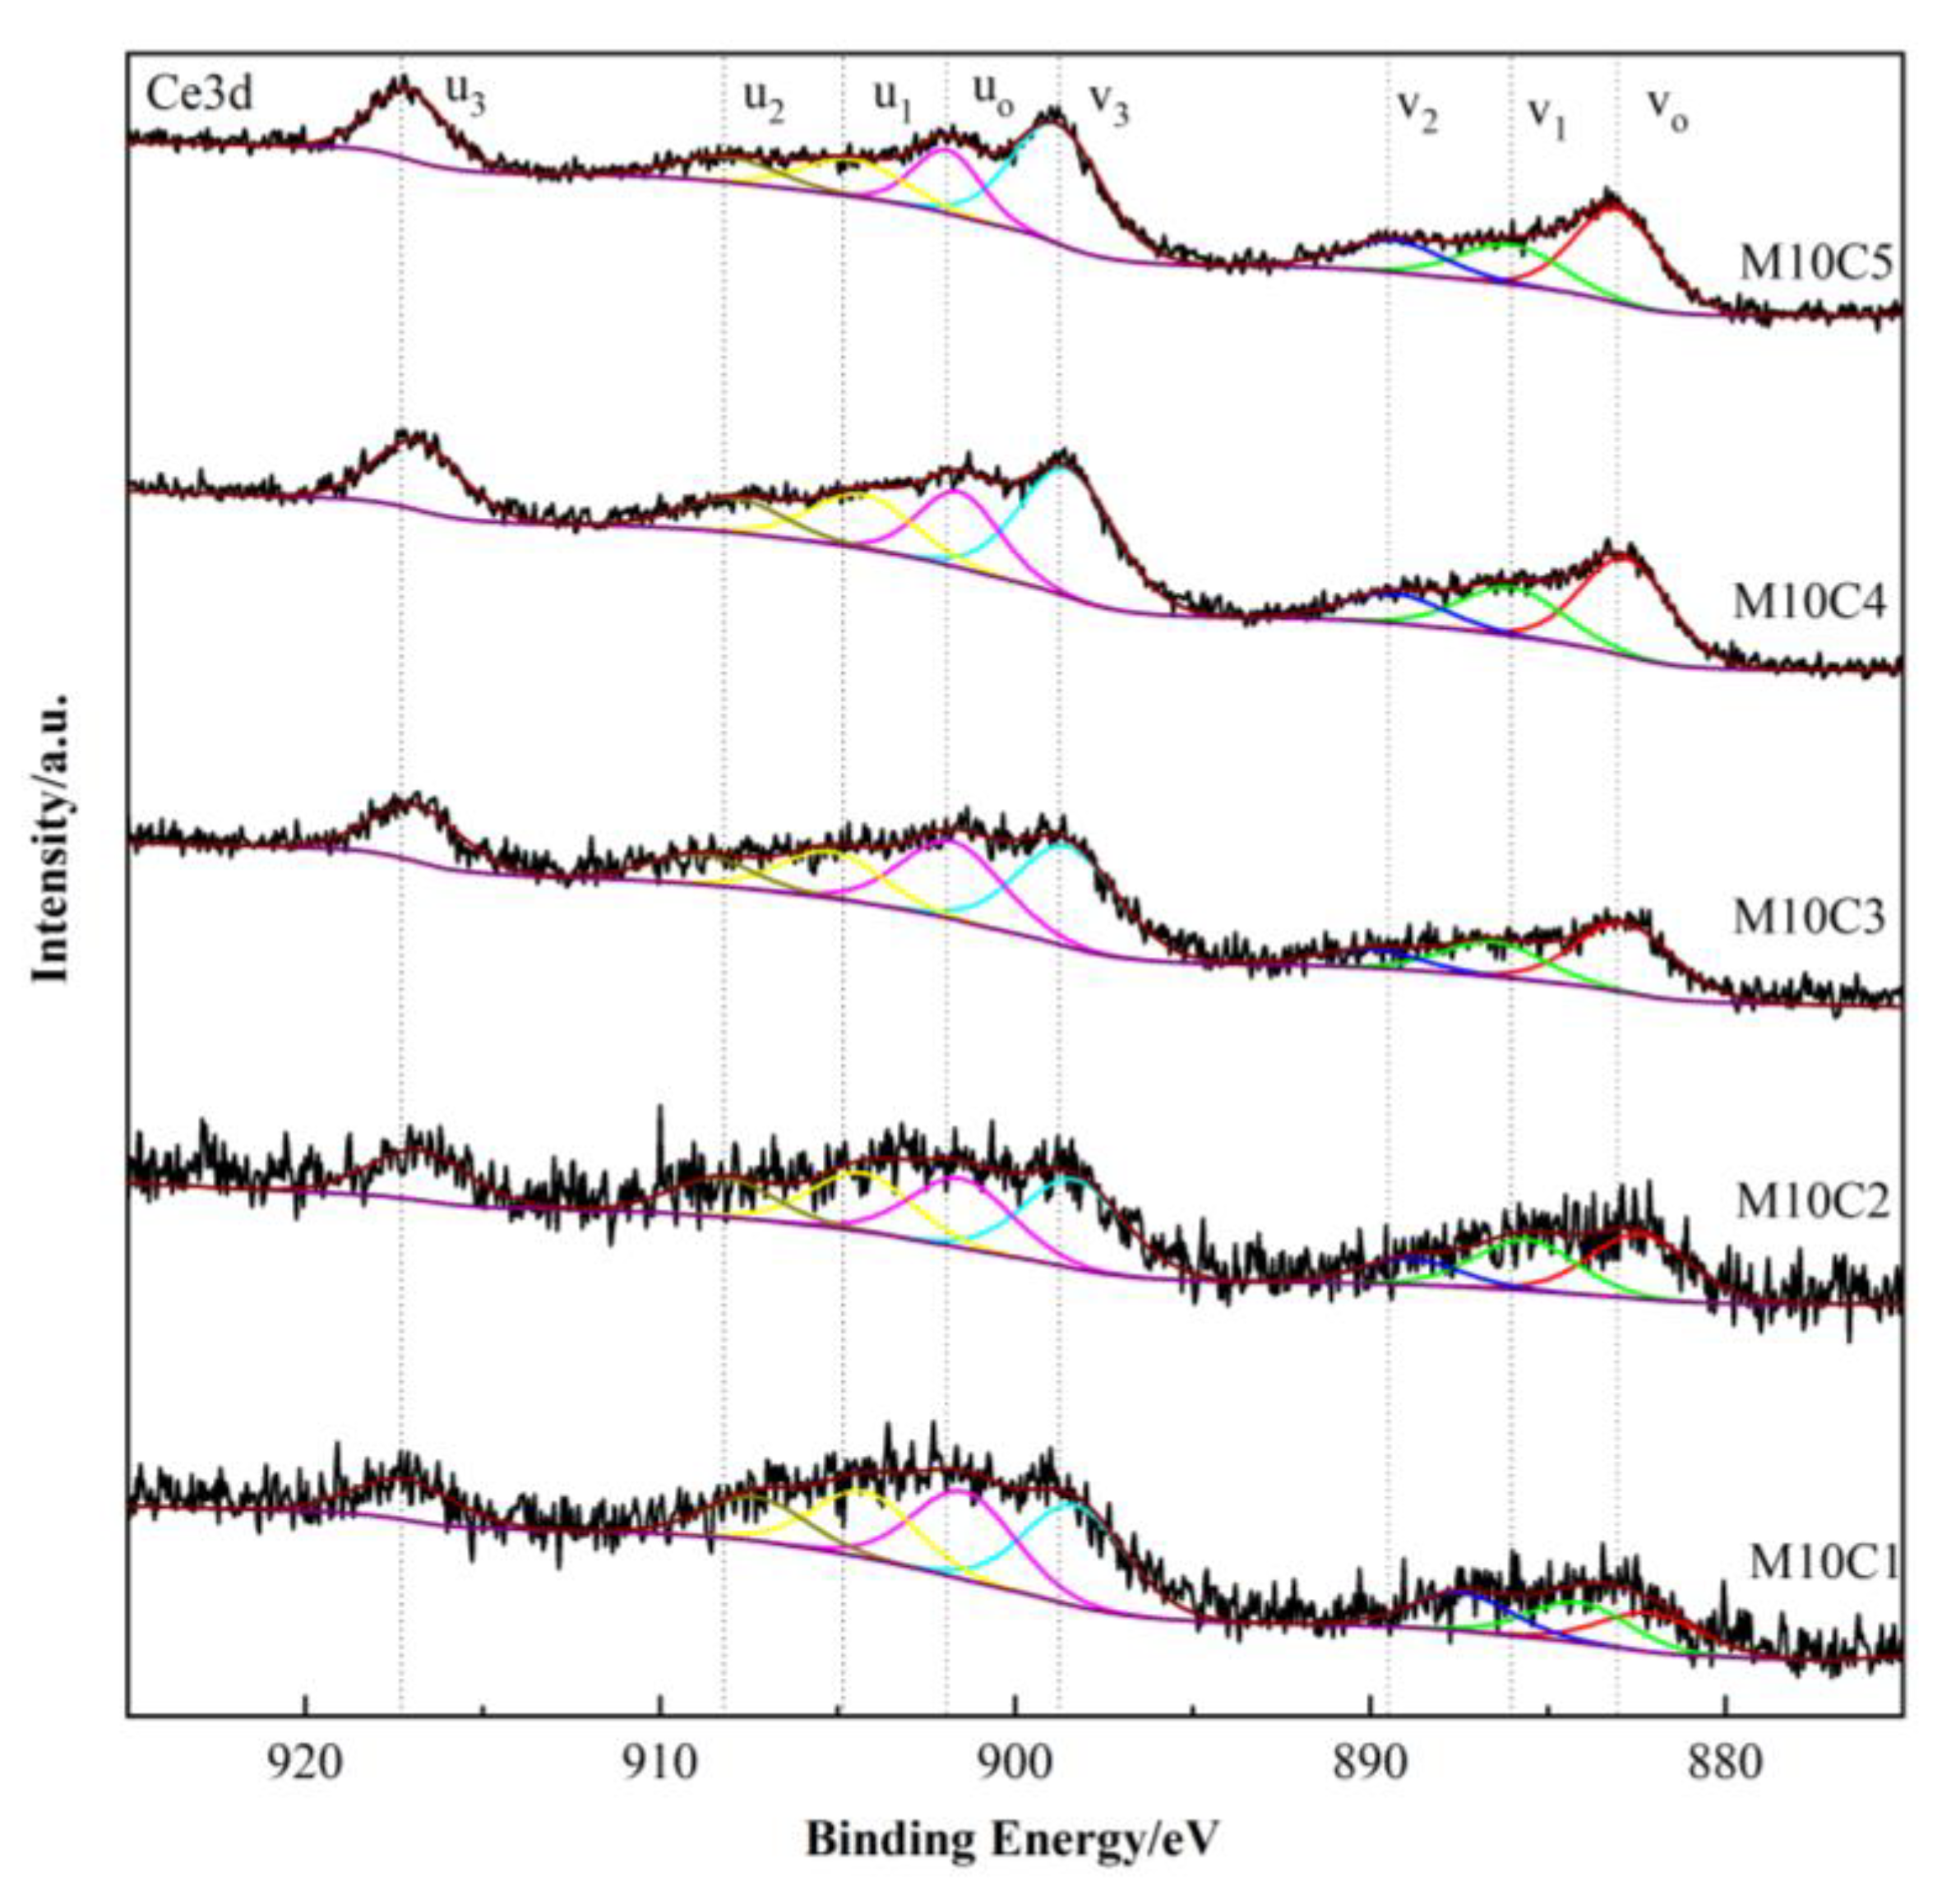
Figure 14 shows the XPS spectrum of the Ce3d orbital of the M10C1~M10C5 catalyst. The peaks at u1 and v1 represent the peaks of Ce3+3d3/2 and Ce3+3d5/2, respectively. The peaks at u0, u2 and u3 and v0, v2 and v3 are Ce4+3d3/2 and Ce4+3d5/2, respectively. The coexistence of Ce3+ and Ce4+ facilitates the storage and release of oxygen [30]. The presence of Ce3+ is more conducive to the generation of oxygen voids and can improve the denitration effect of the catalyst and the mercury oxidation rate [1]. The relative content of Ce3+ in the sample increased first and then decreased with the increase in the Ce content, which was the highest in M10C3 (25.31%).
The relative content of Ce on the surface of the catalysts is shown in Table 8. The change trend of Ce3+ in the Mn-Ce catalyst was similar to that of Mn4+ in that it increased first and then decreased. The highest Ce content was 3%. Based on the analysis of the experimental results, although the Oα content in the M10C2 catalyst was high, the catalytic effect of the M10C3 catalyst was the best. Therefore, the relative content of Oα in the Mn-Ce catalyst had a greater influence on the catalytic effect than that of Mn4+ and Ce3+.

4. Conclusions

The maximum catalyst efficiency of a single loaded Mn element was 86.53%, and the maximum denitration efficiency of the Mn-Ce catalyst was 93.86%.
When the content of Mn in the Mn-Ce catalyst was less than 10% and the content of Ce was less than 3%, the efficiency of the catalyst increased with the increase in the content of the added Mn or Ce. This is consistent with the findings reported in the literature [31]. After exceeding this range, the efficiency of the catalyst would decrease with the increase in active substances. It can also be noted that the highest denitration performance of the catalyst sample was achieved at 175 °C, and the denitrification efficiency started to decrease as the temperature increased further. The possible reason for the results of the analysis is that, at higher reaction temperatures, the non-selective oxidation side reactions of NH3 intensified, producing N2O and some NO, where the increase in Mn and Ce species exacerbated this side reaction at high temperatures. Moreover, these side reactions proceeded to reduce the concentration of the reducing agent NH3, resulting in the inhibition of the selective catalytic reaction. The BET and SEM characterization results of the catalyst showed that the specific surface area and pore volume of the M10C3 catalyst increased by 55.9% and 83.1% compared with those of TiO2, and the average aperture did not change significantly. The load beyond this range would block some pores of the catalyst, which would not be conducive to the catalytic reaction.
The O1s orbital XPS spectra of the catalysts showed that the addition of 3% Ce increased Oα by 51.1%, and the relative content of Oα began to decrease when the Ce content exceeded 3%. The interaction between Ce and Mn affected the intensity of the Mn-O vibration peak and reduced the relative content of Mn4+. However, the introduction of Ce3+ also promoted the catalytic reaction. When the Ce content was 3%, the contents of Mn4+ and Ce3+ were the highest, at 53.95% and 25.31%, respectively.

Author Contributions

Conceptualization, R.L.; methodology, Q.H. and Y.G.; software, Q.H.; validation, R.L.; formal analysis, Q.H.; investigation, Y.L.; resources, R.L.; data curation, Y.L. and Q.H.; writing—original draft preparation, Y.L.; writing—review and editing, R.L. and Y.G.; visualization, Y.L.; supervision, Y.G.; project administration, R.L.; funding acquisition, R.L. All authors have read and agreed to the published version of the manuscript.

Funding

This research was funded by the National Natural Science Foundation of China (Grant No. 51674122) and the Hebei Natural Science Foundation High-end Iron and Steel Metallurgy Joint Fund (Grant No. E2020209208).

Data Availability Statement

Research data are available upon reasonable request to the authors.

Conflicts of Interest

The authors declare no conflict of interest.

References

  1. Lei, Z.; Hao, S.; Yang, J.; Zhang, L.; Fang, B.; Wei, K.; Lingbo, Q.; Jin, S.; Wei, C. Study on denitration and sulfur removal performance of Mn-Ce supported fly ash catalyst. Chemosphere 2021, 270, 128646. [Google Scholar] [CrossRef]
  2. Xiaojiang, Y.; Keke, K.; Jun, C.; Li, C.; Wen, L.; Wanxia, Z.; Jing, R.; Yang, C. Enhancing the denitration performance and anti-K poisoning ability of CeO2-TiO2/P25 catalyst by H2SO4 pretreatment: Structure-activity relationship and mechanism study. Appl. Catal. B Environ. 2020, 269, 118808. [Google Scholar] [CrossRef]
  3. Shan, W.; Liu, F.; He, H.; Shi, X.; Zhang, C. The Remarkable Improvement of a Ce-Ti based Catalyst for NOxAbatement, Prepared by a Homogeneous Precipitation Method. ChemCatChem 2011, 3, 1286–1289. [Google Scholar] [CrossRef]
  4. Ding, S.; Liu, F.; Shi, X.; Liu, K.; Lian, Z.; Xie, L.; He, H. Significant Promotion Effect of Mo Additive on a Novel Ce-Zr Mixed Oxide Catalyst for the Selective Catalytic Reduction of NOx with NH3. ACS Appl. Mater. Interfaces 2015, 7, 9497–9506. [Google Scholar] [CrossRef]
  5. Chang, H.; Chen, X.; Li, J.; Ma, L.; Wang, C.; Liu, C.; Schwank, J.W.; Hao, J. Improvement of activity and SO2 tolerance of Sn-modified MnOx-CeO2 catalysts for NH3-SCR at low temperatures. Environ. Sci. Technol. 2013, 47, 5294–5301. [Google Scholar] [CrossRef]
  6. Shubin, Y. Applicable conditions and kinetics of low-temperature flue gas denitration catalyst. In Proceedings of the 2018 Sintering Flue Gas Denitration and Comprehensive Treatment Technology Seminar, Tangshan, China, 16 March 2018; p. 4. [Google Scholar]
  7. Ping, L.; Changping, L.; Zhengkang, D.; Shiqiu, G.; Guangwen, X.; Jian, Y. Applicable conditions and kinetics of low-temperature flue gas denitration catalyst. CIESC 2019, 70, 2981–2990. [Google Scholar]
  8. Xiaobo, W. Fe Promotion Effect in Mn/USY for Low-temperature Selective Catalytic Reduction of NO with NH3. Chin. Chem. Lett. 2006, 17, 991–994. [Google Scholar]
  9. Long, R.Q.; Yang, R.T.; Chang, R. Low temperature selective catalytic reduction (SCR) of NO with NH3 over Fe-Mn based catalysts. Chem. Commun. 2002, 5, 452–453. [Google Scholar] [CrossRef]
  10. Xinyang, G.; Wangchen, H.; Yuxin, Z.; Shan, R.; Jian, Y. Research overview of manganese based low temperature NH3-SCR denitration catalyst. Mater. Rep. 2021, 35, 13085–13099. [Google Scholar]
  11. Li, J.; Chang, H.; Ma, L.; Hao, J.; Yang, R.T. Low-temperature selective catalytic reduction of NOx with NH3 over metal oxide and zeolite catalysts—A review. Catal. Today 2011, 175, 147–156. [Google Scholar] [CrossRef]
  12. Tang, X.; Hao, J.; Xu, W.; Li, J. Low temperature selective catalytic reduction of NO with NH3 over amorphous MnO catalysts prepared by three methods. Catal. Commun. 2007, 8, 329–334. [Google Scholar] [CrossRef]
  13. Chen, C.; Jia, W.; Liu, S.; Cao, Y. The enhancement of CuO modified V2O5-WO3/TiO2 based SCR catalyst for Hg° oxidation in simulated flue gas. Appl. Surf. Sci. 2018, 436, 1022–1029. [Google Scholar] [CrossRef]
  14. Zhao, L.; He, Q.-s.; Li, L.; Lu, Q.; Dong, C.-q.; Yang, Y.-p. Research on the catalytic oxidation of Hg° by modified SCR catalysts. J. Fuel Chem. Technol. 2015, 43, 628–634. [Google Scholar] [CrossRef]
  15. Chi, G.; Shen, B.; Yu, R.; He, C.; Zhang, X. Simultaneous removal of NO and Hg° over Ce-Cu modified V2O5/TiO2 based commercial SCR catalysts. J. Hazard. Mater. 2017, 330, 83–92. [Google Scholar] [CrossRef]
  16. Zhang, Y.; Zhu, X.; Shen, K.; Xu, H.; Sun, K.; Zhou, C. Influence of ceria modification on the properties of TiO2-ZrO2 supported V2O5 catalysts for selective catalytic reduction of NO by NH3. J. Colloid Interface Sci. 2012, 376, 233–238. [Google Scholar] [CrossRef]
  17. Liu, Y. Study on Reaction Kinetics and Alkali Metal Poisoning of Mn-Ce/TiO2 Low Temperature SCR Catalyst. Master’s Thesis, Xi’an University of Architecture and Technology, Engineering Technology, Xi’an, China, 2017. [Google Scholar]
  18. Gao, X.; Jiang, Y.; Zhong, Y.; Luo, Z.; Cen, K. The activity and characterization of CeO2-TiO2 catalysts prepared by the sol-gel method for selective catalytic reduction of NO with NH3. J. Hazard. Mater. 2010, 174, 734–739. [Google Scholar] [CrossRef]
  19. Cimino, S.; Mangone, C.; Scala, F. Combined mercury removal and low-temperature NH3-SCR OF NO with MnOx/TiO2 sorbents/catalysts. Combust. Sci. Technol. 2018, 190, 1488–1499. [Google Scholar] [CrossRef]
  20. Wang, Y.; Shen, B.; He, C.; Yue, S.; Wang, F. Simultaneous Removal of NO and Hg° from Flue Gas over Mn-Ce/Ti-PILCs. Environ. Sci. Technol. 2015, 49, 9355–9363. [Google Scholar] [CrossRef]
  21. Ren., W. Preparation of Mn-Ce-Ox/TiO2 Catalyst by Impregnation and Its Denitration Performance. Master’s Thesis, Shanghai University of Applied Technology, Engineering Technology, Shanghai, China, 2020. [Google Scholar]
  22. Yao, X.; Kong, T.; Yu, S.; Li, L.; Yang, F.; Dong, L. Influence of different supports on the physicochemical properties and denitration performance of the supported Mn-based catalysts for NH3-SCR at low temperature. Appl. Surf. Sci. 2017, 402, 208–217. [Google Scholar] [CrossRef]
  23. Qi, Y.; Shan, X.; Wang, M.; Hu, D.; Song, Y.; Ge, P.; Wu, J. Study on Low-Temperature SCR Denitration Mechanisms of Manganese-Based Catalysts with Different Carriers. Water Air Soil Pollut. 2020, 23, 231. [Google Scholar] [CrossRef]
  24. Yanzheng, L.; Xuetao, W.; Qianwei, Z.; Shaofeng, L.; Yufeng, Z. Preparation of bimetallic Ce-Mn/ZSM-5 catalyst and study on NH3-SCR denitration performance. J. Fuel Chem. Technol. 2020, 48, 205–212. [Google Scholar]
  25. Shaoxin, W.; Shaofei, Z.; Song, S.; Jianjun, L. Study on the effect of Ce-doped modification on the low-temperature selective catalytic reduction denitration performance of MnFe2O4. Environ. Pollut. Control 2022, 44, 292–296+301. [Google Scholar] [CrossRef]
  26. Tong, Q.; Changhong, L.; Zhigang, L.; Wei, M.; Hong, S. Effect of support equilibrium ions on the catalytic performance of MnOx/ZSM-5 for NH3-SCR. China Environ. Sci. 2021, 41, 3176–3183. [Google Scholar] [CrossRef]
  27. Hanbing, H.; Yusi, w.; Weiyi, F.; Li, Z.; Jing, Z.; Guohui, Z. Study on the CO-SCR anti-sulfur and denitration performance of V-doped OMS-2 catalysts. Ceram. Int. 2021, 47, 33120–33126. [Google Scholar] [CrossRef]
  28. Yanan, C. Experimental Study on Denitration and Mercury Removal with Mo-Mn/TiO2 Catalyst. Master’s Thesis, Southeast University, Dhaka, Bangladesh, 2017. [Google Scholar]
  29. Wu, H.; He, M.; Liu, W.; Jiang, L.; Cao, J.; Yang, C.; Yang, J.; Peng, J.; Liu, Y.; Liu, Q. Application of manganese-containing soil as novel catalyst for low-temperature NH3-SCR of NO. J. Environ. Chem. Eng. 2021, 9, 105426. [Google Scholar] [CrossRef]
  30. Zhao, W.; Rong, J.; Luo, W.; Long, L.; Yao, X. Enhancing the K-poisoning resistance of CeO2-SnO2 catalyst by hydrothermal method for NH3-SCR reaction. Appl. Surf. Sci. 2022, 579, 152176. [Google Scholar] [CrossRef]
  31. Lee, S.M.; Park, K.H.; Hong, S.C. MnO/CeO2–TiO2 mixed oxide catalysts for the selective catalytic reduction of NO with NH3 at low temperature. Chem. Eng. J. 2012, 195–196, 323–331. [Google Scholar] [CrossRef]
Figure 1. Experimental device diagram.
Metals 13 00426 g001
Figure 2. Technical schematic diagram of SCR denitration.
Metals 13 00426 g002
Figure 3. (a) Denitration efficiency of Mn-based catalysts; (b) Denitration efficiency of Mn-Ce catalysts.
Metals 13 00426 g003
Figure 4. Denitration efficiency of Mn-Ce catalysts.
Metals 13 00426 g004
Figure 5. XRD diffraction patterns of M10 and some Mn-Ce/TiO2 catalysts.
Metals 13 00426 g005
Figure 6. SEM of TiO2 and catalysts: (A) TiO2; (B) M10; (C) M10C1; (D) M10C3; (E) M10C5.
Metals 13 00426 g006
Figure 7. SEM of Mn-Ce catalysts: (A) M8C3; (B) M10C3; (C) M12C3.
Metals 13 00426 g007
Figure 8. Change diagram of surface parameters of TiO2 and various catalysts.
Metals 13 00426 g008
Figure 9. Figure of N2 adsorption and desorption of TiO2 and various catalysts.
Metals 13 00426 g009
Figure 10. Pore size distribution of TiO2 and various catalysts.
Metals 13 00426 g010
Figure 11. FTIR spectra of M10, M10C3 and M10C5 catalysts.
Metals 13 00426 g011
Figure 12. O1sXPS spectra of M10 and some Mn-Ce/TiO2 catalysts.
Metals 13 00426 g012
Figure 13. Mn2pXPS spectra of M10 with partial Mn-Ce/TiO2 catalysts.
Metals 13 00426 g013
Figure 14. Ce3dXPS spectra of partial Mn-Ce/TiO2 catalysts.
Metals 13 00426 g014
Table 1. Experimental instruments.
NameModelManufacturer
Precision ScalesFA224LShanghai Hengping
Mass Flow ControllerKD800-4FChangzhou Kede
Horizontal Tube FurnaceRS 80Shanghai Bona Thermo
DrierBPJ-9023AShanghai Hezheng
Magnetic Stirrer79-1Beijing Zhongxing
Ultrasonic CleanerAK-040A/BShenzhen Yujie
Flue Gas AnalyzerPTM600-3Shenzhen Yiyuntian Electronics
X-Ray Photoelectron SpectroscopyEscaLab Xi+Thermo Fisher Scientific
X-Ray DiffractionD/MAX2500PCRigaku Corporation
Physical AdsorptionASAP 2460Micromeritics
FESEMS-4800Hitachi Limited
FTIRNicolet iS20Thermo Fisher Scientific
Table 2. Experimental reagents.
NameFormulaFinenessManufacturer
TitaniaTiO2Analytically pureSCRC
Cerium nitrateCe(NO3)3·6H2OAnalytically pureSCRC
ManganeseMn(NO3)250%SCRC
Copper nitrateCu(NO3)2·3H2OAnalytically pureSCRC
Absolute alcoholCH3CH2OH99.5%SCRC
Deionized waterH2O100%SCRC
Table 3. Name and content of Mn-based catalysts.
NameM4M6M8M10M12M14
Mn content (%)468101214
Table 4. Name and content of Mn-Ce catalysts.
Order NumberNameMn Content (%)Ce Content (%)
1M10C1101
2M10C2102
3M10C3103
4M10C4104
5M10C5105
6M3C333
7M4C343
8M5C353
9M6C363
10M7C373
11M8C383
12M9C393
13M10C3103
14M11C3113
15M12C3123
Table 5. Surface parameters of TiO2 and various catalysts.
SampleSpecific Surface Area (m2·g−1)Pore Volume
(cm3·g−1)
Average Aperture (nm)
TiO212.530.0544519.84
M1013.100.0359211.98
M10C116.360.0954924.50
M10C218.100.0963023.44
M10C319.630.0996920.47
M10C417.850.0960622.01
M10C518.920.0689414.68
Table 6. Relative content of O on catalyst surface (%).
SampleSCRM10M10C1M10C2M10C3M10C4M10C5
Oα/Oα + Oβ73.6146.8460.8072.5570.7866.0549.31
Oβ/Oα + Oβ26.3953.1639.2027.4529.2233.9550.69
Table 7. Relative Mn content on catalyst surface (%).
SampleM10M10C1M10C2M10C3M10C4M10C5
Mn4+/Mn3+ + Mn4+64.1834.0050.4153.9551.1934.44
Mn4+/Mn59.2930.6545.8051.6146.7029.59
Table 8. Relative content of Ce on the catalyst surface (%).
SampleM10C1M10C2M10C3M10C4M10C5
Ce3+/Ce3++Ce4+21.8724.4425.3120.8518.50
Disclaimer/Publisher’s Note: The statements, opinions and data contained in all publications are solely those of the individual author(s) and contributor(s) and not of MDPI and/or the editor(s). MDPI and/or the editor(s) disclaim responsibility for any injury to people or property resulting from any ideas, methods, instructions or products referred to in the content.

