Article

Numerical Simulation of Low-Pressure Carburizing and Gas Quenching for Pyrowear 53 Steel

1
Research and Development Center, Pratt & Whitney Rzeszów S.A., 35-078 Rzeszów, Poland
2
Faculty of Mechanical Engineering and Aeronautics, Rzeszow University of Technology, 12 Powstańców Warszawy Ave., 35-959 Rzeszów, Poland
3
Research and Development Laboratory for Aerospace Materials, Rzeszow University of Technology, 4 Żwirki i Wigury Str., 35-959 Rzeszów, Poland
*
Author to whom correspondence should be addressed.
Metals 2023, 13(2), 371; https://doi.org/10.3390/met13020371
Submission received: 31 December 2022 / Revised: 6 February 2023 / Accepted: 6 February 2023 / Published: 12 February 2023
(This article belongs to the Special Issue Material Modeling in Multiphysics Simulation)

Abstract

:
The hardness and phase composition are, among other things, the critical material properties considered in the quality control of aerospace gears made from Pyrowear 53 steel after high-pressure gas quenching. The low availability of data on and applications of such demanding structures justify investigating the choice of the material and the need to improve its manufacturability. In this study, computational finite-element analyses of low-pressure carburizing followed by oil and gas quenching of Pyrowear 53 steel were undertaken, the objective of which was to examine the influence of the process parameters on the materials’ final phase composition and hardness. The material input was prepared using JMatPro. The properties computed by the CALPHAD method were calibrated by the values obtained from physical experiments. The heat transfer coefficient was regarded as an objective variable to be optimized. A 3D model of the Standard Navy C-ring specimen was utilized to predict the phase composition after the high-pressure gas quenching of the steel and the hardness at the final stage. These two parameters are considered good indicators of the actual process parameters and are used in the industry. The results of the simulation, e.g., optimized heat transfer coefficients, cooling curves, and hardness and phase composition, are presented and compared with experimental values. The accuracy of the simulation was validated, and a good correlation of the data was found, which demonstrates the quality of the input data and setup of the numerical procedure. A computational approach to heat treatment processes’ design could contribute to accelerating new procedures’ implementation and lowering the development costs.

1. Introduction

Quenching is a critical heat treatment operation in the manufacturing process, which determines the enhancement of the fatigue durability and wear resistance of carburized steel components, such as power-transmitting gears. Aerospace gearbox development requires the application of modern materials with more resistance to tempering at elevated temperatures. In the 1970s, the Pyrowear 53 low-alloy steel was developed when a new material for power transmission was needed due to the limitations of the commonly used 9310 steel and its tendency to score and scuff under high-temperature conditions. This steel was designed to operate mainly in power transmission components such as gears due to its surface durability and fatigue resistance, enhanced by the compressive residual stress generated during carburizing and related to the delayed formation of martensite near the surface. Gears made of Pyrowear 53 are able to maintain their properties even when no lubrication is present due to the material’s wear resistance. The outstanding properties of Pyrowear 53 are achieved thanks to, among other things, the high content of silicon, providing resistance to softening during tempering, nickel, responsible for added toughness and fabricability, molybdenum, to ensure hot hardness, and vanadium, providing secondary hardening, whichalso increases the material’s susceptibility to grain refinement [1]. In contrast to typical steel grades for carburizing, Pyrowear 53 contains molybdenum and copper. The addition of these two elements distinguishes it among the variety of steel grades. Molybdenum is responsible for increasing the heat and wear abrasion resistance, and copper improves the lubrication properties and shock load [2]. The carburization process of Pyrowear 53 is recommended at temperatures between 870 and 927 ° C, while hardening from 904 to 921 ° C. To obtain the maximum hardness and dimensional stability, subzero treatment is recommended at −73 ° C. Double-tempering is recommended for applications requiring elevated dimensional stability [3,4]. For parts with tight dimensional tolerances, such as power transmission components, distortions, being an effect of heat treating, have a substantial economic impact on the following machining processes, increasing the overall production costs by 20–40% to eliminate dimensional deviations [5].
The analysis of the metallurgical effects during quenching is of great importance. Due to the complexity of the interrelation between the phenomena and their transient characteristics, it is challenging to capture the sequence and magnitude of these effects experimentally. Numerical simulations of heat treatment processes have been developed and used in the industry to analyze transient processes such as quenching thanks to constantly growing computational capabilities and commercial software availability. There are multiple systems based on the finite-element method, specifically dedicated to heat treatment processes’ design and optimization; among them, DANTE [6], DEFORM2D/3D [7,8], and Simufact [9] are either fully dedicated or provide specific modules to solve the thermo-mechano-metallurgical problems often coupled with diffusion models for carburization or nitriding analyses. For the computational approach to be efficient, this requires detailed input data, which, in the case of steels’ heat treatment analysis, may be difficult to find in the literature or to determine experimentally, as the key to numerical simulation is predicting that the final property of the material is an effect of the stress evolution caused by the phase transformation, as well as the difference between the properties of the coexisting phases. Therefore, the precise definition of the input data for specific phases present in the system is crucial. To define the temperature-dependent thermophysical and mechanical properties of each phase or the TTT/CCT diagrams, software such as JMatPro [10,11,12] or Thermo-Calc [13] based on the CALPHAD method can be used.
Witness specimens are commonly used to eliminate the need to cut up production parts, leading to increased costs for development efforts. Standard Navy C-ring-type specimens are known to reflect the dimensional change of the actual components under investigation. Its asymmetric geometry prevents uniform cooling and delays the beginning of phase transformation in thicker sections, causing distortion. The relatively simple geometry of the specimens makes it easy to use as, usually, three characteristics are measured: the outer diameter, inner diameter, and gap. Numerous research works utilizing the computational approach and using the C-ring-type specimens as the baseline have been conducted to predict the distortions that are an effect of the heat treatment, confirming the accuracy of simulations’ capabilities and the geometry of the specimen [5,14,15,16].
This paper describes the simulation procedure to predict the influence of the carbon content and quenching process parameters on the phase composition and hardness distribution after heat treatment. Because of the relatively new process of high-pressure gas quenching of Pyrowear 53 for applications in demanding structures, such as aerospace gears, and the limited amount of literature references related to its properties, the objective of this work was to research them. To achieve this, numerical simulations were used to predict the material’s behavior under specific process conditions. Quenching by high-pressure gas quenching (HPGQ) and OH70 quenching oil was employed to validate the computational results.

2. Materials, Methods, and Modeling

2.1. Test Specimen

Twelve Navy C-ring-type specimens, as presented in Figure 1, were analyzed in this study. The choice of the specimen geometry was dictated by the fact that it is widely known and accepted in the heat treatment industry as having numerous advantages, among which the most important is the ability to analyze rapid temperature changes during quenching and their effects on various cross-sections of the treated parts [17,18,19]. The Navy C-ring is a short cylinder with an eccentric hole open at one extreme. Each cross-section has a different size and, therefore, cooling rate, which leads to variations in the metallurgical effects and, finally, the properties of the material being analyzed. Due to the transient size change, the C-ring specimen is a good indicator of actual parts’ behavior during heat treatment. Six specimens were carburized, while another six were left without carburization. All specimens underwent cryogenic treatment and tempering. Quenching was performed in OH70 quenching oil. Low-pressure carburizing (LPC) and high-pressure gas quenching (HPGQ) were performed in an ALD MonoTherm HK.446.VC.10.gr vacuum furnace. The details of the heat treatment procedure for all samples are presented in Table 1.
Specimen Nos. 1 to 6 were processed by LPC at 921 °C, which consisted of 16 boost–diffusion cycles. The carbon carrier boosts’ total time was 17 min, while the entire process time was approximately 9.5 h. After the LPC was finished, specimens were cooled down slowly to room temperature. The load, containing three carburized specimens, Nos. 1, 2, and 3, and three that were kept uncarburized, Nos. 7, 8, and 9, was then heated up to 913 °C and held at this temperature for a sufficient period of time to ensure obtaining a homogeneous temperature and, therefore, the austenitic microstructure in the whole volume, then quenched. A standard industrial procedure for parts requiring dimensional stability cryogenic treatment at −75 °C was performed to finish the martensitic transformation. Tempering was performed at 230 °C for 4 h. As two different techniques of quenching were employed in this research, a variety of heat-transfer-related parameters had to be incorporated into the simulation. A protective copper cladding was employed for specimens hardened in oil to prevent surface oxidation and decarburization. The copper coating and stripping were performed electrochemically. Oil quenching was performed in the RIVA automatic quenching system, which includes a rotary furnace RDLS with a heating power of 10 kW, a quenching bath OQ-1000 equipped with a 1.1 kW agitation pump, and vertical collectors to ensure vertical stirring of the OH70 oil. The oil temperature was 45 °C. The heat transfer coefficient of the oil is shown in Figure 2. The heat transfer in the gas quenching was considered convective and almost constant [20], which is not realistic and constitutes the need for optimization to find realistic values. For the sake of this research, the value of the heat transfer coefficient (HTC) to the environment during gas quenching was optimized utilizing parabola optimization methods. The cooling curves captured during an experiment were the objectives. As shown in Figure 3, three heat transfer zones were defined, and specific upper and lower bounds and initial guesses were initialized for each. The HTCHPGQ optimization results were further used in the simulations.
Hardness was measured using the NEXUS 4303 tester and Vickers method under a 500 g load in the transverse and longitudinal cross-sections of the specimens, as shown in Figure 4, performed according to aerospace standards to confirm the effective case depth.
Carbon concentration measurement using glow discharge optical emission spectroscopy (GD-OES) was performed to provide validation data to correlate the simulation results with the empirical ones.

2.2. The Material

The material analyzed in this study was the Pyrowear 53 low-alloy steel. The steel’s chemical composition (wt.%) was measured using a Thermo ARL 3460 optical emission spectrometer. Table 2 presents the main alloying elements’ content.
In order to obtain an accurate description of the materials’ properties for each phase present in the material during the whole thermal cycle, which may be further used, the JMatPro simulation was utilized. The CAPLHAD results were then validated and adjusted by the experimental results. The main adjustments of the inputs made by the authors consisted of defining the carbon concentration’s influence on the martensite properties, such as hardness, as shown in Figure 5.
The model of carbon diffusivity Equation (1) described in [22] and supplemented with an alloy correction factor Equation (2) [23] that incorporates the influence of alloying elements on the diffusivity of carbon was used in this research. Thermal data such as thermal conductivity and heat capacity also required adjustments; therefore, experimental data were used [24]. A simulation that utilized the diffusion coefficient as a function of carbon concentration, temperature, and alloying elements’ concentration was performed. The results are presented in this paper.
D = 0.47 · e x p ( 1.6 % C ) · e x p ( 37 , 000 6600 % C ) R · T · q
where R and T are the Boltzmann constant and the carburizing temperature, respectively. Equation (2) describes the alloy correction factor.
q = 1 + [ % S i ] · ( 0.15 + 0.033 [ % S i ] ) [ % M n ] · 0.0365 + [ % C r ] · ( 0.13 0.0055 · [ % C r ] ) + [ % N i ] · ( 0.03 0.03365 · [ % N i ] ) + [ % M o ] · ( 0.025 0.01 [ % M o ] ) [ % A l ] · ( 0.03 0.02 [ % A l ] ) + [ % C u ] · ( 0.016 + 0.0014 [ % C u ] ) [ % V ] · ( 0.22 0.01 [ % V ] )

Heat Treatment

The continuous cooling transformation (CCT) diagram shown in Figure 6 was determined experimentally [24]. According to it, martensitic transformation starts at 438 °C. Other data may be found in the literature where values of 437 °C [25], 510 °C [4], or 460 °C [26] are mentioned. Because of the untypical chemical composition of Pyrowear 53, which may exceed the JMatPro limits, it was found that, compared to the empirical results, the data lack precision. Therefore, attempts were made to adjust and validate a numerical model of the material.
The adjustment of the martensite start temperature ( M s ) consisted of a modification of the model presented in [27] by the author. The results of the modification were compared to the experimental results and showed a good fit, as illustrated in Figure 7. It must be noted that the carbides present in Pyrowear 53 have a remarkable influence on the material’s hardness; however, in this simulation, martensite is the only phase formed from austenite’s decomposition; its hardness depends on the carbon content. Both the carbon concentration and hardness shown in Figure 5 are empirical data, and their origin, whether from structural martensite or carbides, are negligible from the numerical point of view in this case.

2.3. Modeling and Simulation

The simulation presented in this paper was based on the finite-element method. Two computational systems, DEFORM3D and Simufact Forming, were used in this study. An analysis of the thermo-mechano-metallurgical problem coupled with the carbon diffusion phenomenon is presented, and due to the model’s symmetry, a quarter of the specimen was used, as shown in Figure 8. The models were meshed using 895,845 tetrahedral elements. Surface refinement was implemented to ensure results’ accuracy close to the computational domain boundary. Boundary conditions, both thermal and diffusional, were assigned to the outer surface of the model. The elasto-plastic model of the material was used in the simulation. Hardness computations were based on a mixture of the volume fractions of specific phases.

2.3.1. Inverse Heat Transfer Analysis

Heat transfer capabilities of gaseous coolants depend on factors such as gas type, pressure, flow rates, turbulent behavior, or the complexity of parts being treated. The present research deals with two different quenching procedures. The first is well-researched and uses liquid quenchant OH70 quenching oil in this case, while the second is high-pressure gas quenching (HPGQ)—a technique in which convection is the primary mode of heat transfer during quenching. Because no precise data are available, the heat transfer coefficients for the high-pressure gas quenching were optimized, using the DEFORM3D Inverse Heat Transfer module, to obtain a realistic input for the quenching simulation. The cooling curves captured from the experiment were used as the optimization objectives, Broyden–Fletcher–Goldfarb–Shannon as the optimization algorithm, and B-spline as the interpolation method [8].

2.3.2. Thermal Field and Latent Heat

The thermal field is described by Fourier’s heat conduction equation for transient heat transfer. Considering the fact that the phase transformation taking place during rapid cooling of overcooled austenite, i.e., martensite creation, is exothermic, the latent heat of the phase transformation alters the thermal field, and therefore, Fourier’s equation can be written as
ρ C p T t = ( λ T ) + L
where ρ , C p , and λ are the density, specific heat, and thermal conductivity, respectively [28]. L is the latent heat of transformation considered as an additional heat source that influences the thermal field during quenching.
L = Δ E ζ n + 1 ζ n t n + 1 t n = Δ E · Δ ζ Δ t
where Δ E is the enthalpy of austenite transformation to a child phase (see Figure 9) and ζ n + 1 and ζ n are the volume fractions of the specific phase that transformed at t n and t n + 1 simulation time steps, respectively [29]. The initial condition at time step t = 0 is defined as
T t = 0 = T 0 ( x , y , z )
and the boundary condition for temperature field calculation during quenching can be expressed as
λ T n = h c T s T e + R · ϵ T s 4 T e 4
where T e and T s are the temperatures of the environment and the steel surface. Because the product of the Boltzmann constant R and the emissivity ϵ is considered as the radiation heat transfer coefficient,
R · ϵ = h r
Equation (6) can be written as
λ T n = h c T s T e + h r T s 4 T e 4 = h T s T e
where h c and h r are the convection and radiation coefficients, respectively, and where h is the total heat transfer coefficient [30,31], which combines the effect of convective and radiative heat transfer, as both of these phenomena take place simultaneously with a varied intensity along the quenching time. The determination of the total heat transfer coefficient was the main goal of the inverse heat transfer analysis.

2.3.3. Carbon Diffusion Modeling

A low-pressure carburizing process was used to create the gradient profile of the carbon concentration. The Neumann-type boundary conditions were used to calculate the carbon content on the surface [2]. The necessary data were the diffusion coefficient, carbon content at the surface in the equilibrium condition, and the mass transfer coefficient.
C t = D C
where D is the diffusion coefficient, t is time, and C is the carbon concentration at a specific position. This type of equation requires initial and boundary conditions’ definition. The initial condition for t = 0 is given as
C ( x , y , z ) = C 0
where C 0 is the initial carbon content in the steel before carburizing. In this work, carbides’ precipitation was neglected, and the assumption of no soot formation on the steel surface was made; therefore, the equation for the Neumann-type boundary condition expressing the mass balance at the surface may be simplified [32,33] as
D C = β C e C s
where C e is the carbon concentration in equilibrium with the atmosphere and C s is the carbon content in the gas–solid interface that reacts with the hot surface of the steel [33]. The surface carbon concentration C e is required to calculate the mass transfer coefficient β . The value of this coefficient was determined from the experiment, where the carbon saturation was constant in time and equal to 60 min. Then, for processes realized at a constant temperature, T = 921 °C in this research, the value of the mass transfer coefficient β can be calculated from Equation (12).
β = Δ m A t C e C S
where Δ m is the mass of carbon that the specimen could absorb with no soot formation on the surface and A is the specimen’s surface that underwent carburizing. For cyclic processes such as low-pressure carburizing, the determinative parameters are the number of cycles and the total time of the saturation kinetic model given as a function of temperature and time factors may be used [33,34,35]. The approach described above allows determining the carbon concentration in equilibrium with the atmosphere C e and the mass transfer coefficient β as 1.47 (wt.%) and 9.87 × 10⁻³ ( mm s ) , respectively.

2.3.4. Phase Transformation Kinetics

Depending on the cooling rate, phase transformations may be classified as diffusion-controlled and diffusionless. For transformation during which diffusion is the governing phenomenon, the Johnson–Mehl–Avrami–Kolmogorov (JMAK) model is widely accepted to describe the kinetics of isothermal phase transformation through the nucleation and growth of the new phase. Cooling the austenite leads to phase transformation into ferrite (F), pearlite (P), or bainite (B), and the volume fraction of the newly transformed phase can be predicted according to the JMAK model [36,37].
ζ ( F , P , B ) = 1 e b · t n
where ζ ( F , P , B ) stands for the volume fraction of ferrite, pearlite, and bainite, respectively, and b and n are material kinetic parameters defined as:
n = l n l n 1 ζ 1 l n 1 ζ 2 l n t 1 t 2
b = l n 1 ζ 1 t 1 n
The isothermal times of a certain temperature, t 1 and t 2 , and the corresponding volume phase fractions ζ 1 and ζ 2 are defined by means of TTT diagram analysis [29]. Volume fractions of 1% and 99% of the specific phase are usually used as the beginning and the end of certain phase transformations.
The martensitic transformation is a diffusionless transformation that occurs upon quick quenching of the austenite phase, and it is characterized by the martensite start and martensite finish temperatures. As the martensitic transformation is athermal, that is not being controlled by the thermal history of the material, the volume fraction of the transformed phase is calculated based on an equation incorporating the degree of undercooling of the material. For transformation’s kinetics description, a Koistinen–Marburger model [38] was used.
ζ M = ζ A 1 e K M M S T ( t )
where
K M = M S M f ln 0.1
While both the martensite start and martensite finish temperatures depend on the alloying elements’ concentration, the K M parameter is considered [39] as
i S i · x i = 0.14 x M n + 0.21 x S i + 0.11 x C r + 0.08 x N i + 0.05 x M o .
where T ( t ) is the temperature at a specific time step and ζ M and ζ A represent the volume phase fractions of martensite and austenite, respectively.

2.3.5. Hardness Prediction

Several technological parameters are considered when the heat treatment process is designed. Hardness is the most-important among them because it is a good indicator of the overall strengthening of the material while being simple to measure simultaneously. The overall hardness of the material is calculated based on the rule of phases mixture, which defines the total material’s hardness as a weighted sum of the volume fraction of
H V = ζ M H V M + ζ B H V B + ζ P H V P + ζ F H V F
where ζ i is the volume fraction of the i-th phase and H V i is its hardness for i = M , B , P , F , representing martensite, bainite, pearlite, and ferrite, respectively.
Multiple models are available in the literature describing models for hardness calculations, among which the Maynier model Equation (20) is considered reliable, although limited to carbon concentration up to 0.5%wt [40]. An additional Equation (21) for martensite hardness containing over 0.5% of carbon was proposed by Leslie [41]:
  • For %C < 0.5,
    H V = ζ M · ( 949 % C + 156.73 + 21 · l o g ( T 85 t i m e [ s ] ) ) + + ζ B · ( 185 % C + 29.14 + ( 53 · % C + 36.39 ) · l o g ( T 85 t i m e [ s ] ) ) + + ( ζ A + ζ F + ζ P ) · ( 223 · % C + 84.368 + 16.47 · l o g ( T 85 t i m e [ s ] ) )
  • For %C > 0.5,
    H V = ζ M · ( 1667 % C 926 % C 2 + 150 ) + + ζ B · ( 185 % C + 29.14 + ( 53 · % C + 36.39 ) · l o g ( T 85 t i m e [ s ] ) ) + + ( ζ A + ζ F + ζ P ) · ( 223 · % C + 84.368 + 16.47 · l o g ( T 85 t i m e [ s ] ) )
Both cases were used for the computations of the carburized case in steel, as the appropriate carbon concentration point has a trespassed point of 0.5% of carbon concentration.

3. Results and Discussion

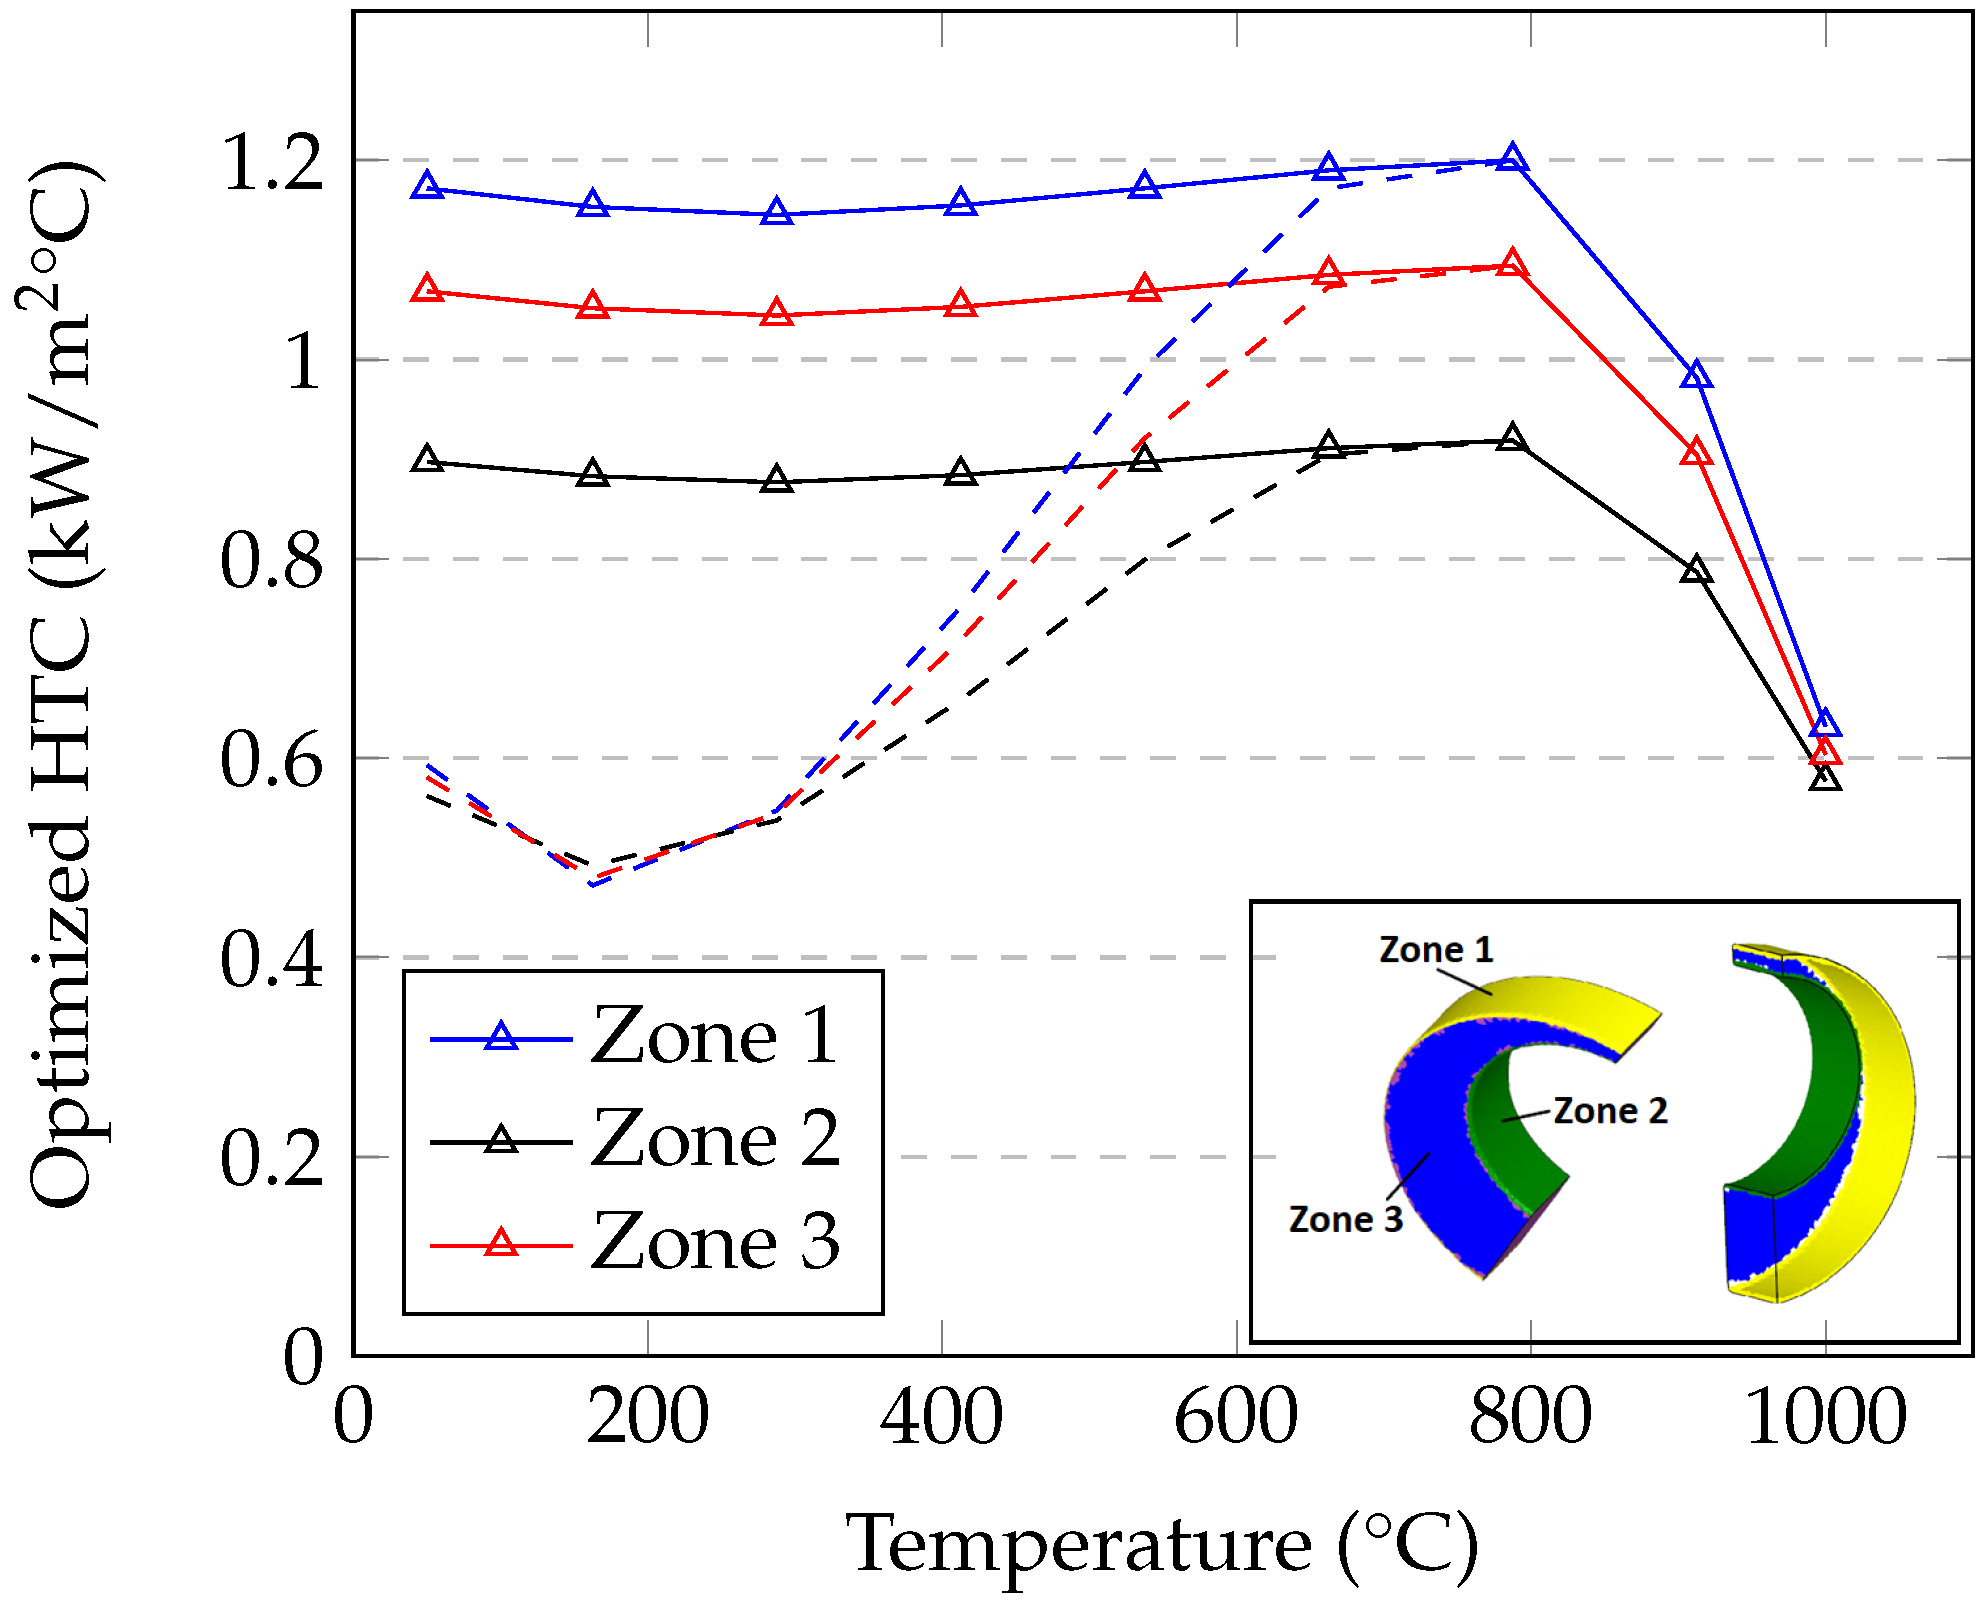
3.1. Heat Transfer Coefficient Optimization

The inverse thermal analysis and optimization result were that heat removal from the top, side, and bottom surfaces proceeds at different rates. Such behavior is related to the transient characteristic of cooling and the turbulent flow of the gas, which heats up at different rates during the cooling of the sample, changing its ability to accumulate energy. As a result, different heat transfer coefficient values are locally active on the surface. The DEFORM3D Inverse Heat Transfer module was utilized for this part of the simulation due to its capability to determine heat transfer coefficients based on an objective function, which in the case of quenching are the cooling curves at specific points and an environmental temperature drop as a boundary condition [42]. Optimization revealed that the heat transfer coefficient values vary depending on the temperature and the specimen’s location. The highest values were found for the outer diameter surface (Zone 1) reaching its maximum, i.e., 1.2 k W m 2 · ° C for a temperature of approximately 800 °C. Intermediate values of around 1.1 k W m 2 · ° C were determined for the specimen’s flat faces (Zone 3). In contrast, the lowest heat transfer of a maximum of 0.87 k W m 2 · ° C was found for the inner diameter (Zone 2).
The results showed the heat transfer coefficients as a function of temperature at the computational boundary, so influenced by the thermal field only with no accounting of time. The dashed lines in Figure 10 represent the results of the simulation, which did not take the latent heat of martensitic transformation into account; therefore, a dimple in the curves, reaching the minimum at 0.5 k W m 2 · ° C , is visible. This is a numerical artifact caused by the apparent heat capacity of the material. Further analyses of the heat transfer allowed us to optimize the apparent heat capacity and compute the value of the latent heat of the martensitic transformation by integrating the function described by the heat capacity peak’s data points. Integration with the trapezoid method and 100 steps were utilized, and eventually, the latent heat of 244 J g was determined and used in further simulations. Figure 11 shows the optimization results for the heat capacity and the cooling, where the determined value of martensitic transformation latent heat was used.
A more detailed analysis, which may include a time factor on the change of the quenching gas temperature and, therefore, impacting the heat transfer between the gas and the specimen’s surface, would require a CFD approach and computations of the transient thermal field in the whole volume of the vacuum chamber, which was not the goal of the current research.

3.2. Low-Pressure Carburizing

Carbon diffusion was simulated and compared with the GD-OES experimental results. Figure 12 compares the carbon profiles. Sixteen cycles of carbon boosts followed by a period of diffusion were modeled. The slight discrepancy of the carbon concentration curves in Figure 12b is an effect of modeling the diffusion coefficient in the steel and may be improved in further efforts.
The results of the carbon concentration simulation did not vary between the oil and high-pressure gas quenching processes. Diffusion coefficient model Equation (1) supplemented with the q factor implementing the chemical composition’s influence on material’s diffusivity Equation (2) and mass transfer coefficient Equation (12) allowed computing the diffusion of carbon with a good fit to the experimental values for Pyrowear 53 steel.

3.3. Cooling Behavior

Cooling was analyzed at two control points of the specimen marked in Figure 8. Point P1 was located in the middle of the thickest cross-section and was the indicator of the core material behavior. At the same time, the position of point P2 was aimed at carburized case analysis and, therefore, was located in the thinnest zone 0.05 mm circumferentially under the surface. Quenching started at time point t = 0. As presented in Figure 13a, in the first 10 s, the temperature did not drop, which is related to the location of the control point P1 in the center of the thickest cross-section, 7.95 mm from the surface. Because of the material’s heat conductivity, a temperature dropin the experimental curve may be observed. Martensitic transformation starts at approximately 421 °C, and because it is exothermic, the latent heat released during transformation contracts the quenching extraction, causing a plateau in the cooling curve. The amount of latent heat for Pyrowear 53 was calculated as presented in Section 3.1, and it was found to be equal to 244 J g . Figure 13b presents a simulated cooling curve for control point P2 located 0.05 mm from the surface. Here, the temperature decreases much faster with no initial period of constant temperature. Because of the carbon concentration in the surface layer is equal to approximately 1.1% wt. and the martensitic transformation starts slightly above 100 °C (see Figure 7), the plateau in the cooling curve may not be observed.
The computed cooling rates presented similarity to those obtained from the experiment. The choice of a cooling rate of 11 °C/s was found for a temperature T = 715 °C, which corresponds to a time point of t = 26 s of the quenching process. The decrease of the cooling rate value corresponding to a temperature of 422 °C was related to the temperature dropduring the exothermic martensitic transformation, as may be observed in Figure 14.

3.4. Phase Composition and Hardness

All specimens were tested against hardness. Both longitudinal and transverse cross-sections, as shown in Figure 4, were measured and showed similar results. The carburized material presented a similar carbon concentration profile, which did not depend on the quenching technique. The average hardness at a distance of 0.1 mm from the surface for carburized specimens was 760 HV. According to the AGMA standards, the effective case depth (ECD) is the distance from the surface of the specimen where the hardness is 50 HRC, corresponding to approximately 513 HV. For the analyzed process parameters, an effective case depth of 1.1 mm can be obtained for Pyrowear 53. Figure 15 compares the hardness distribution curves obtained from the simulation with the experimental curves, being the arithmetic average of all carburized specimens. The presented hardness profiles showed that the differences were barely noticeable, which means the carbon concentration profile was not affected by the quenching method. Figure 16 presents the transformation and final distribution of the phases after the quenching. Only two phases were present in Pyrowear 53 after heat treatment by the analyzed process. Although the cooling curve measured at P1 shown in the CCT diagram in Figure 6 crosses the point of the beginning of bainite transformation, the bainite was not observed, probably because of its content in the range of a few percent. Based on that, it was found that no products of austenite decomposition other than martensite formed with the cooling rates as analyzed, which is in agreement with other research [26].

4. Conclusions

This paper presented the results of heat-treated specimens made from Pyrowear 53 low-alloy steel. The simulation of the quenching of previously carburized and non-carburized specimens was analyzed. The analysis of the C-ring, which went through LPC, followed by different quenching techniques, also concluded that high-pressure gas quenching provides results comparable to standard oil quenching. The numerical simulation of the heat treatment processes could accelerate new procedures’ implementation and lower development costs. The simulation of the heat-treatment process using Simufact Forming supplied with the input of JMatPro material’s properties, although requiring validations and some adjustments, provided a good correlation with the experimental measurements for all analyzed variables. A computational approach as presented in this paper’s procedure for phase composition and hardness analysis may be successfully applied to the analysis of production parts made from different alloys to optimize the process by providing metallurgical analysis with a limited testing campaign.

Author Contributions

Conceptualization, B.I. and M.M.; methodology, B.I. and A.W.; software, B.I.; validation, B.I. and M.M.; formal analysis, M.M.; investigation, B.I. and A.W.; resources, B.I. and A.W.; data curation, B.I.; writing—original draft preparation, B.I.; writing—review and editing, B.I.; visualization, B.I.; supervision, M.M.; project administration, B.I.; funding acquisition, M.M. All authors have read and agreed to the published version of the manuscript.

Funding

This research received no external funding.

Data Availability Statement

Not applicable.

Acknowledgments

For calculations and simulations in this work, some of the results gathered within the framework of the development project in the TECHMATSTRATEG2/406725/1/NCBR/2020 program of the National Centre for Research and Development were used. In particular, the CCT diagram (Figure 6) was prepared by W. Zalecki from the Łukasiewicz Research Network - Upper Silesian Institute of Technology. The authors would also like to express their gratitude to FIN Sp. z o.o. for the preparation of the C-ring specimens that were used in the experiments described in this article.

Conflicts of Interest

The authors declare no conflict of interest.

References

  1. National Academy of Sciences. Materials for Helicopter Gears, Final Report No. NMAB-351; Technical Report; Committee on Helicopter Transmission Gear Materials: Washington, DC, USA, 1979. [Google Scholar]
  2. Korecki, M.; Wołowiec-Korecka, E.; Bazel, M.; Sut, M.; Kreuzaler, T. Thomas Detlef. Outstanding Hardening of Pyrowear® Alloy 53 with Low Pressure Carburizing. In Proceedings of the 70º Congresso Anual da ABM, Rio de Janeiro, Brazil, 17–21 August 2005. [Google Scholar] [CrossRef]
  3. AMS6308 Rev. F-Steel, Bars and Forgings 0.90Si-1.0Cr-2.0Ni-3.2Mo-2.0Cu-0.10V (0.07–0.13C) Vacuum Arc or Electroslag Remelted; SAE International: Warrendale, PA, USA, 2018. [Google Scholar]
  4. Technology, C. CarTech® Pyrowear® Alloy 53—Technical Datasheet.
  5. Easton, D.; Perez, M.; Huang, J.; Rahimi, S. Effects of Forming Route and Heat Treatment on the Distortion Behaviour of Case-Hardened Martensitic Steel type S156. Heat Treat 2017, 2017. [Google Scholar]
  6. Dowling, W.E. Development of a Carburizing and Quenching Simulation Tool: Program Overview. In Proceedings of the 2nd International Conference on Quenching and Control of Distortion, Materials Park, OH, USA, 9–13 September 1996; pp. 349–355. [Google Scholar]
  7. Arimoto, K. Development of heat treatment simulation system Deform-HT. In Proceedings of the 18th Heat Treating Conference, ASM International, Materials Park, OH, USA, 12–15 October 1998. [Google Scholar]
  8. Scientific Forming Technologies Corporation. DEFORM V13.0.1 Manual; Scientific Forming Technologies Corporation: Columbus, OH, USA, 2022. [Google Scholar]
  9. Farivar, H.; Rothenbucher, G.; Prahl, U.; Bernhardt, R. ICME-Based Process and Alloy Design for Vacuum Carburized Steel Components with High Potential of Reduced Distortion, Proceedings of the 4th World Congress on Integrated Computational Materials Engineering (ICME 2017); Springer: Berlin/Heidelberg, Germany, 2017; pp. 133–144. [Google Scholar]
  10. Schillé, J.P.; Guo, Z.; Saunders, N.; Miodownik, A.P. Modeling phase transformations and material properties critical to processing simulation of steels. Mater. Manuf. Process. 2011, 26, 137–143. [Google Scholar] [CrossRef]
  11. Guo, Z.; Saunders, N.; Schillé, J.; Miodownik, A. Material properties for process simulation. Mater. Sci. Eng. A 2009, 499, 7–13. [Google Scholar] [CrossRef]
  12. Guo, Z.L.; Turner, R.; Da Silva, A.D.; Sauders, N.; Schroeder, F.; Cetlin, P.R.; Schillé, J.P. Introduction of materials modeling into processing simulation. Trans Tech. Publ. 2013, 762, 266–276. [Google Scholar]
  13. Jo, A.; Thomas, H.; Lars, H.; Pingfang, S.; Bo, S. Thermo-Calc & DICTRA, computational tools for materials science. Calphad 2002, 26, 273–312. [Google Scholar]
  14. da Silva, A.; Pedrosa, T.; Gonzalez-Mendez, J.; Jiang, X.; Cetlin, P.; Altan, T. Distortion in quenching an AISI 4140 C-ring – Predictions and experiments. Mater. Des. 2012, 42, 55–61. [Google Scholar] [CrossRef]
  15. Nunes, M.M.; da Silva, E.M.; Renzetti, R.A.; Brito, T.G. Analysis of Quenching Parameters in AISI 4340 Steel by Using Design of Experiments. Mater. Res. 2019, 22, 1–7. [Google Scholar] [CrossRef]
  16. Sims, J.; Li, Z.; Ferguson, B.L. Causes of Distortion during High Pressure Gas Quenching Process of Steel Parts. In Proceedings of the Heat Treat 2019: 30th ASM Heat Treating Society Conference, Detroit, MI, USA, 15–17 October 2019; pp. 228–236. [Google Scholar] [CrossRef]
  17. Manivannan, M.; Northwood, D.; Stoilov, V. Use of Navy C-rings to study and predict distortion in heat treated components: Experimental measurements and computer modeling. Int. Heat Treat. Surf. Eng. 2014, 8, 168–175. [Google Scholar] [CrossRef]
  18. Boyle, E.; Bowers, R.; Northwood, D.O. The use of navy C-ring specimens to investigate the effects of initial microstructure and heat treatment on the residual stress, retained austenite, and distortion of carburized automotive steels. SAE Trans. 2007, 116, 253–261. [Google Scholar]
  19. Yu, H.; Yang, M.; Sisson, R.D. Application of C-Ring Specimen for Controlling the Distortion of Parts During Quenching. Met. Sci. Heat Treat. 2021, 63, 220–228. [Google Scholar] [CrossRef]
  20. Heuer, V. Gas Quenching. In Steel Heat Treating Fundamentals and Processes; ASM Handbook; ASM International: Almere, The Netherlands, 2013; Volume 4A. [Google Scholar]
  21. Adrian, H.; Karbowniczek, M.; Dobosz vel Sypulski, A.; Kowalski, J.; Kozdroń, S. Badania wpływu temperatury na zdolność chłodzącą wybranych olejów hartowniczych. Stal. Met. Nowe Technol. 2019, 9, 75–80. [Google Scholar]
  22. Tibbets, G.G. Diffusivity of carbon in iron and steels at high temperatures. J. Appl. Phys. 1980, 51, 4813–4816. [Google Scholar] [CrossRef]
  23. Neumann, F.; Person, B. A contribution to the metallurgy of gas carburization. The effects of alloying elements on the relationship between the carbon potential of the gas phase and that of the workpiece. Haerterei-Tech. Mitteilungen 1968, 23, 296–310. [Google Scholar]
  24. Research project “Development of high pressure gas quenching technology for the satellite gears of the FDGS engine’s epicyclic gearbox, made of Pyrowear 53 steel and operating under long-term and cyclically fluctuating loads” funded by National Center for Research and Development (Narodowe Centrum Badan i Rozwoju) under the TECHMATSTRATEG2/406725/1/NCBR/2020 program. Unpublished Research Data.
  25. Freborg, A.M. Investigating and Understanding the Role of Transformation Induced Residual Stress to Increase Fatigue Life of High Strength Steel Used in Transmission Gears. Ph.D. Thesis, University of Akron, Akron, OH, USA, 2013. [Google Scholar]
  26. Horstemeyer, M.F. Integrated Computational Materials Engineering (ICME) for Metals: Concepts and Case Studies; John Wiley & Sons: Hoboken, NJ, USA, 2018. [Google Scholar]
  27. van Bohemen, S.; Sietsma, J. Effect of composition on kinetics of athermal martensite formation in plain carbon steels. Mater. Sci. Technol. 2009, 25, 1009–1012. [Google Scholar] [CrossRef]
  28. Şimşir, C.; Gür, C.H. Simulation of quenching. In Handbook of Thermal Process Modeling of Steels; Routledge: Abingdon, UK, 2009; pp. 341–425. [Google Scholar]
  29. Li, J.; Feng, Y.; Zhang, H.; Min, N.; Wu, X. Thermomechanical Analysis of Deep Cryogenic Treatment of Navy C-Ring Specimen. J. Mater. Eng. Perform. 2014, 23, 4237–4250. [Google Scholar] [CrossRef]
  30. Li, H.; Zhao, G.; Huang, C.; Niu, S. Technological parameters evaluation of gas quenching based on the finite element method. Comput. Mater. Sci. 2007, 40, 282–291. [Google Scholar] [CrossRef]
  31. Sugianto, A.; Narazaki, M.; Kogawara, M.; Shirayori, A.; Kim, S.Y.; Kubota, S. Numerical simulation and experimental verification of carburizing-quenching process of SCr420H steel helical gear. J. Mater. Process. Technol. 2009, 209, 3597–3609. [Google Scholar] [CrossRef]
  32. Khan, D.; Gautham, B. Integrated modeling of carburizing-quenching-tempering of steel gears for an ICME framework. Integr. Mater. Manuf. Innov. 2018, 7, 28–41. [Google Scholar] [CrossRef]
  33. Zajusz, M.; Tkacz-Śmiech, K.; Dychtoń, K.; Danielewski, M. Pulse carburization of steel–model of the process. Trans. Tech. Publ. 2014, 354, 145–152. [Google Scholar] [CrossRef]
  34. Wierzba, B.; Romanowska, J.; Kubiak, K.; Sieniawski, J. The cyclic carburization process by bi-velocity method. High Temp. Mater. Process. 2015, 34, 373–379. [Google Scholar] [CrossRef]
  35. Smirnov, A.; Ryzhova, M.Y.; Semenov, M.Y. Choice of boundary condition for solving the diffusion problem in simulation of the process of vacuum carburizing. Met. Sci. Heat Treat. 2017, 59, 237–242. [Google Scholar] [CrossRef]
  36. Avrami, M. Kinetics of phase change. I General theory. J. Chem. Phys. 1939, 7, 1103–1112. [Google Scholar] [CrossRef]
  37. William, J.; Mehl, R. Reaction kinetics in processes of nucleation and growth. Trans. Metall. Soc. AIME 1939, 135, 416–442. [Google Scholar]
  38. Dp, K.; Re, M. A general equation prescribing the extent of the austenite-martensite transformation in pure iron-carbon alloys and plain carbon steels. Acta Metall. 1959, 7, 59–60. [Google Scholar]
  39. Simufact Engineering GmbH. Simufact Forming Users Manual; Simufact Engineering: Hamburg, Germany, 2022. [Google Scholar]
  40. Maynier, P.; Dollet, J.; Bastien, P. Hardenability concepts with applications to steels. In Proceedings of the International Conference on Artificial Intelligence in Medicine, New York, NY, USA, 1978; Volume 518. [Google Scholar]
  41. Leslie, W. Interstitial atoms in alpha iron. Leslie WC—The Physical Metallurgy of Steels; McGraw-Hill: New York, NY, USA, 1982; pp. 85–91. [Google Scholar]
  42. Wu, C.; Xu, W.; Wan, S.; Luo, C.; Lin, Z.; Jiang, X. Determination of Heat Transfer Coefficient by Inverse Analyzing for Selective Laser Melting (SLM) of AlSi10Mg. Crystals 2022, 12, 1309. [Google Scholar] [CrossRef]
Figure 1. The geometry of the C-ring specimen used in the research. Dimensions are in mm.
Metals 13 00371 g001
Figure 2. Heat transfer Heat transfer coefficients of OH70 oil’s dependence on temperature (adapted with permission from Ref. [21], Copyright 2019, Stal, Metale & Nowe Technologie).
Metals 13 00371 g002
Figure 3. Heat transfer zones’ definition.
Metals 13 00371 g003
Figure 4. Hardness check locations in C-ring cross-sections: transverse (a) and longitudinal (b).
Metals 13 00371 g004
Figure 5. Dependency of the martensite hardness on carbon concentration for Pyrowear 53 steel.
Metals 13 00371 g005
Figure 6. CCT diagram for Pyrowear 53.
Metals 13 00371 g006
Figure 7. Comparison of martensite start temperature models. Original vs. modified by the author.
Metals 13 00371 g007
Figure 8. Computational domain (a) and FE model with control points P1 and P2 and symmetry planes (b).
Metals 13 00371 g008
Figure 9. Enthalpies of Pyrowear 53 calculated in JMatPro [24].
Metals 13 00371 g009
Figure 10. Optimized values of the heat transfer coefficients for specific zones.
Metals 13 00371 g010
Figure 11. The latent heat of martensitic transformation’s optimization results. Optimized apparent heat capacity (a) and simulated cooling curve with optimized latent heat (b).
Metals 13 00371 g011
Figure 12. Simulated carbon concentration. Visualization of the carburized case (a) and comparison of the experimental and predicted concentration profiles (b).
Metals 13 00371 g012
Figure 13. Cooling curves for the core material at P1 (a) and the carburized case at P2 (b).
Metals 13 00371 g013
Figure 14. Cooling rates as a function of the process time (a) and the temperature (b).
Metals 13 00371 g014
Figure 15. Results of hardness profile simulation comparison with the experimentally measured after the HPGQ and oil quenching processes.
Metals 13 00371 g015
Figure 16. Computed phase volume fraction changes during quenching for a control point P1.
Metals 13 00371 g016
Table 1. Test plan description for all specimens.
Specimen No.LPCHPGQOil Q.
1++
2++
3++
4+ +
5+ +
6+ +
7 +
8 +
9 +
10 +
11 +
12 +
Table 2. Chemical composition of Pyrowear 53 steel.
ItemCSiNiCuMnCrMoVSPAl
Result0.1380.9451.8731.7760.3191.0603.3200.0920.0050.0070.002
SD *0.0040.0080.0110.0110.0010.0410.019----
* Standard deviation.
Disclaimer/Publisher’s Note: The statements, opinions and data contained in all publications are solely those of the individual author(s) and contributor(s) and not of MDPI and/or the editor(s). MDPI and/or the editor(s) disclaim responsibility for any injury to people or property resulting from any ideas, methods, instructions or products referred to in the content.

