Article

Thermodynamic Study of H2-FeO Based on the Principle of Minimum Gibbs Free Energy

1
School of Metallurgical and Ecological Engineering, University of Science and Technology Beijing, 30th Xueyuan Road, Haidian District, Beijing 100083, China
2
School of Intelligence Science and Technology, University of Science and Technology Beijing, 30th Xueyuan Road, Haidian District, Beijing 100083, China
3
Ironmaking Department of Beijing Shougang Co., Ltd., Tangshan 064404, China
*
Authors to whom correspondence should be addressed.
Metals 2023, 13(2), 225; https://doi.org/10.3390/met13020225
Submission received: 21 December 2022 / Revised: 20 January 2023 / Accepted: 21 January 2023 / Published: 25 January 2023
(This article belongs to the Special Issue Advances in Ironmaking and Steelmaking Processes)

Abstract

:
Studies have shown that the reduction of wustite is the limiting factor in the ironmaking process, whether in hydrogen-based shaft furnaces, hydrogen-rich blast furnaces or smelting reduction vessels. The study of the thermodynamic conditions for the reduction of molten wustite by hydrogen is of great significance for the optimization of the ironmaking process, energy saving and emission reduction. Previous studies have mostly focused on the thermodynamic study of the reduction at a lower temperature, but the data at high temperatures are different, which makes the calculation of thermodynamics difficult. Moreover, it is difficult to obtain experimental evidence for the data at high temperature, so calculation is needed to verify its feasibility. In this paper, a thermodynamic calculation model for the reduction of molten wustite by hydrogen based on the principle of minimum Gibbs free energy is developed. The enthalpy changes of the reaction at different temperatures and the partial pressure of hydrogen required for the reaction to occur are calculated, and the energy change during the reaction is analyzed. The results show that the partial pressure of hydrogen for the reduction of molten wustite by hydrogen at high temperatures decreases from 0.67 at 1650 K to about 0.65 at 2000 K. The enthalpy changes of reaction at 1873 K are only 1/4 to 1/3 of that at 1173 K compared with that at the corresponding temperature between hydrogen for the reduction of molten wustite (1873 K) and hydrogen-based shaft furnace reaction (1173 K). Interestingly, the thermodynamic calculations show that the effect of energy absorption in the gas–liquid reaction of hydrogen with wustite at high temperatures is much lower than in the gas–solid reaction zone at low temperatures. These results indicate that the energy change of the reduction of molten wustite by hydrogen at high temperatures is better than that of hydrogen reduction at low temperatures, and the thermodynamic conditions are more favorable, with slightly different results from different thermodynamic databases, but the general trend is the same. The results of this study will provide fundamental data to support new hydrogen metallurgy technologies in the future. If its correctness can be verified experimentally in the future, this result will be promoted to the development of a new alternative ironmaking technology, hydrogen-based smelting reduction.

1. Introduction

The reduction of wustite by hydrogen is the most important part of the stepwise reduction process of iron oxides, which is widely present in the cohesive zone reduction of blast furnace ironmaking, direct reduction in hydrogen-based shaft furnaces and hydrogen-rich smelting reduction processes [1]. The studies of the reduction of wustite contribute to the understanding of different ironmaking processes and the development and optimization of new ironmaking processes. In a hydrogen-rich blast furnace, the blast furnaces are often operated with full oxygen blast to achieve the hot air temperature required for the reduction of wustite by hydrogen. The development of the reduction of wustite by hydrogen in gas-based shaft furnaces was reviewed by scholars, such as Zhang et al. [2], who pointed out that the commonly used reducing gases at this stage are generally H2 and CO obtained from the cracking of natural gas, affirming the superior kinetic conditions of hydrogen in the stepwise reduction of iron oxides. In the hydrogen-based shaft furnace, the hydrogen content is higher than that of the hydrogen-rich blast furnace, and the heat load of the reduction reaction is higher, which requires a higher reduction gas feed temperature. Hayashi and Iguchi [3] determined the rate controlling step of smelting reduction by hydrogen through experiments, which reduces in the form of the progressive formation of the metallic iron spheres in the center of ferrous oxide droplets. The one-dimensional mass balance equation combined with the rate analysis shows that the chemical reaction itself is the rate controlling step in the early stages of reduction. In summary, the process of the hydrogen reduction of wustite contains gas–solid, gas–liquid and mixed gas-solid–liquid states, different reaction temperatures and states representing different smelting processes. The analysis of the reduction of wustite in different states is of great significance for the understanding and optimization of the ironmaking process.
Many pieces of work have been completed by domestic and international experts and scholars for the reduction of wustite by hydrogen. In terms of experimental research, at this stage, research on the reduction of molten iron oxides by hydrogen has mainly focused on the use of blast furnaces as experimental equipment in an attempt to simulate the mechanism by which the reduction reaction occurs. Katayama et al. [4] have studied the reduction of FeO in molten slag by hydrogen, based on the blast furnace process. The reduction of molten FeO by hydrogen has been studied by Ban-Ya et al. [5] using a thermal analysis balance, and the results show that the chemical reaction rate for the reduction of molten FeO by hydrogen is about 20 times the rate for the reduction of solid FeO by hydrogen. In terms of kinetic research, the reduction of wustite in molten slag by hydrogen has been studied by Nagasaka et al. [6]. The results show that the reduction rate of liquid wustite by hydrogen is much faster than that with solid carbon and CO gas. In terms of thermodynamic research, Fan X. et al. [7,8] have used thermodynamic calculations to simulate the effect of blowing different proportions of hydrogen in a hydrogen-rich blast furnace on the rate controlling step of the reaction; Luo’s [9,10] study of the thermodynamics of CO reduction in a hydrogen-based shaft furnace concluded that there is a peak in the ability of CO to reduce FeO, with a decreasing trend after the peak is reached; Kashiwaya et al. [11] compared the activity of each component in the reaction between H2 and CO reduction of FeO and concluded that the metal obtained by H2 reduction had a high oxygen activity. Whether or not thermodynamic conditions are met will directly affect whether or not a chemical reaction can take place, and most current thermodynamic studies of iron oxides are concerned with gas–solid phase reactions. A great deal of work has been completed in the past on the experimental study and kinetic conditions for the hydrogen reduction of wustite, but there is a lack of fundamental data on the thermodynamics of wustite reduction, especially at high temperature, and the available data come from a wide range of sources, with differences between different data, making the understanding and calculation of thermodynamics difficult. At the same time, the thermodynamic calculation at high temperatures is often difficult to be proved by experiments, so it is necessary to verify whether it is meaningful to carry out by calculation. Finally, the research on hydrogen-based smelting reduction in alternative ironmaking is not perfect. The thermodynamic calculation results of hydrogen-based melting reduction of wustite at high temperatures are given in this paper.
To address this, this paper is based on the minimum Gibbs free energy model to research different wustite states at different temperatures. By collecting and comparing thermodynamic data from different sources and simulating the Gibbs free energy, the partial pressure of hydrogen required for reaction and enthalpy change of the reaction and the process of reducing wustite to obtain metallic iron was analyzed; the energy changes of the three processes, hydrogen-rich blast furnace reduction of FeO, hydrogen-based shaft furnace reduction of wustite and the reduction of molten wustite by hydrogen in the smelting reduction vessel were obtained and compared. The results provide the necessary theoretical basis for further research into the reduction reactions of molten iron oxides and are of some reference significance.

2. Model of Hydrogen Reduction of wustite

The minimum Gibbs free energy model is the classical model for the study of equilibrium in multiphase systems and was proposed by White in 1958. The basic principle is that for a multiphase system, the total free energy is minimized when the system reaches thermodynamic equilibrium. In a reaction system for reducing iron oxides by hydrogen, assuming that H2 and Fe2O3 are present in the system at the beginning, there will be several possible groups of Fe2O3, Fe, FexO, Fe3O4, H2 and H2O in the system at equilibrium. It is generally accepted that the process of reducing iron oxides by hydrogen consists of the following reactions:
3 Fe 2 O 3 + H 2 = 2 Fe 3 O 4 + H 2 O ,
x 4 x 3 Fe 3 O 4 + H 2 = 3 4 x 3 Fe x O + H 2 O ,
Fe x O + H 2 = x Fe + H 2 O ,
1 4 Fe 3 O 4 + H 2 = 3 4 Fe + H 2 O ,
For the reaction of reducing molten wustite by hydrogen, four components of Fe, H2, FeO and H2O should be present in the equilibrium system. By fully considering the above four components, the result obtained from the calculation is the content of the system at equilibrium. The positive and negative values of the standard Gibbs free energy for the reduction of molten wustite by hydrogen allow a preliminary determination of the likelihood of the reaction proceeding and further analysis of how the reaction occurs. It is known empirically that reactions (1)–(4) can all occur within a certain temperature range. A Δ G θ   versus   T   curve is made from the Δ G θ of the above reaction as a function of T, which is the iron oxide gas–solid reduction equilibrium diagram for this reaction. Due to the different thermodynamic reference data in different metallurgical textbooks and thermodynamic handbooks, the resulting gas–solid reduction equilibrium diagrams for iron oxides are different. This paper focuses on the special case of Reaction (3).
FeO + H 2 = Fe + H 2 O ,
This reaction is the rate controlling step in the reduction of iron oxides by hydrogen. Common thermodynamic handbooks were consulted to obtain the Gibbs free energy G of the reactants FeO, H2 and the products Fe and H2O at different temperatures, and the G   versus   T   curves of the participating substances were obtained by fitting the (G, T) data points using MATLAB software (R2021b, MathWorks, Natick, MA, USA) [12,13,14,15,16]. It was again fitted using MATLAB software to obtain its Δ G θ   versus   T   curve.
Δ G T θ = G T , H 2 O θ + G T , F e θ G T , F e O θ G T , H 2 θ
Δ G θ = R T l n K θ = R T l n ( φ H 2 O φ H 2 )
φ H 2 = 1 [ 1 + exp ( Δ G θ R T ) ]
In addition, to examine Reaction (5) release or absorption of energy phenomena visually, the H θ   versus   T   curves of the substances involved in the reaction were obtained by fitting the (H, T) data points using MATLAB software according to the enthalpies of each substance involved in the reaction at different temperatures from the thermodynamic handbook.
Definition of Gibbs free energy:
G = H − TS
(H is the enthalpy of the substance and S is the entropy of the substance)
Isobaric thermal capacity C p :
C p = a + b T + c T 2 + d T 1
H T θ = C p d T = H 0 + a T + b 2 T 2 + c 3 T 3 + d T 1  
Δ H T θ = H T , H 2 O θ + H T , F e θ H T , F e O θ H T , H 2 θ  
Gibbs–Helmholtz equation:
[ ( Δ G T θ T ) T ] p = Δ H T θ T 2
d ( Δ G T θ T ) = Δ H T θ T 2 d T  
For the indefinite integral of the above equation:
G T θ = a 1 + a 2 T + a 3 T 2 + a 4 T 4 + a 5 T 1 + a 6 T l n T
The temperature range 1650–2000 K is defined and calculated every 1 K to obtain φ H 2   versus   T   and Δ H θ   versus   T   , T ∈ (1650–2000 K). The image is fitted to obtain the energy change regularity for Reaction (5).

3. Thermodynamic Calculations of Hydrogen Reduction of Wustite

3.1. Thermodynamic Data

For a more extensive and objective calculation of the reduction of molten wustite by hydrogen, this paper has consulted Thermochemical Properties of Inorganic Substances (1973) [17], Thermodynamic Data Manual of Practical Inorganic Matter (1981) [18], Thermodynamic Data Manual of Practical Inorganic Matter (2002) [19] and Thermodynamic Data Manual of Inorganic Matter (1993) [20], four common thermodynamic handbooks, referring to data given by the National Institute of Standards and Technology NIST website [21] and the thermodynamic calculation software FactSage [22,23] for metallurgical disciplines, some of which are selected for presentation purposes in Table 1, Table 2, Table 3, Table 4, Table 5 and Table 6 below.
FactSage is a common data calculation software for metallurgical disciplines. FactSage holds thermodynamic data for thousands of pure substances and the data provided in FactSage version 8.2 (GTT-Technologies and Thermfact/CRCT, Aachen and Montreal, GER and CAN) are used in this paper. FactSage calculates the corresponding φ H 2 and Δ H θ for every 1 K at the temperature range 298–2000 K. It has a large amount of data with high confidence and is used in common thermodynamic simulation studies. In the FactSage database, Reaction (5) has Δ H θ > 0 in the 298–1371 K range, which turns to Δ H θ < 0 after 1644 K and turns again after 1810 K with less energy absorption than at 1644–1810 K. The φ H 2   versus   T   and Δ H θ   versus   T   for Reaction (5) are obtained directly from the above numerical calculations. the specific values are given in Table 1.
NIST Chemical Database, a web-based database of physical properties from the National Institute of Standards and Technology. The thermodynamic data given in the database cover a wide range of temperatures and only the thermodynamic data for Fe, FeO, H2 and H2O in the high temperature range (1650–2000 K) and adjacent temperatures are listed here in Table 2 for subsequent calculations.
In addition to the two common databases mentioned above, the thermodynamic data for Fe, FeO, H2 and H2O from the following four thermodynamic manuals are presented in Table 3, Table 4, Table 5 and Table 6.
Of the six sets of thermodynamic data, the data given by the FactSage database are special in that the software can directly calculate the values of φ H 2 and Δ H θ at a given temperature. The remaining five sets of data give the enthalpy of the substances involved in the reaction; the Gibbs free energy; and, in some cases, the enthalpy changes and entropy values, but the units are not uniform. The normalization of the units resulted in the four thermodynamic handbooks giving essentially similar values, which differed significantly from the NIST website and FactSage, while the NIST website and FactSage database were not identical. However, it is worth noting that the thermodynamic handbooks give values at 100 K ranges, while FactSage is more precise, with each 1 K having its corresponding thermodynamic value.

3.2. Thermodynamic Equilibrium Diagram

The thermodynamic calculation of G i θ   versus   T   for each component in Reaction (5) gives the φ H 2   versus   T   function for the reaction, as shown in Table 7. The above Δ G θ   versus   T   function was fitted using MATLAB software to obtain the Δ G θ   versus   T   function for Reaction (5) at the temperature range 1650–2000 K in the above table reference. The image of φ H 2   versus   T   function is shown in Figure 1.
Figure 1 shows the calculated and fitted φ H 2   versus   T   function image for Reaction (5) obtained from six sets of thermodynamic data. φ H 2   versus   T   function images are commonly known as fork curves in the ironmaking industry.   φ H 2 is the partial pressure of hydrogen required for the reaction to occur. In all four thermodynamic handbooks, the φ H 2 versus   T function images show a decreasing trend and similar magnitude, all in the range of 0.6–0.7. The NIST database gives values that also show a decreasing trend but to a slightly greater extent than the four thermodynamic handbooks mentioned above. In addition, FactSage is more unusual, giving a slight upward trend and a folding point at 1809 K. The analysis of the φ H 2   versus   T   function image shows that the trend of the equilibrium curve is related to the Δ H θ of the reaction. If the reaction is endothermic ( Δ H θ > 0 ), the equilibrium curve shows a decreasing trend with increasing temperature. Therefore, the results obtained from the four thermodynamic handbooks and the NIST database all show that Reaction (5) is absorbing energy in the high temperature range (1650–2000 K) and the FactSage database shows a weakly releasing energy reaction.
In addition, φ H 2 characterises the partial pressure of hydrogen required for the reaction to occur, and the data given in References 14–17 all show a decreasing trend when fitted to data from the NIST database. Although the FactSage database gives the opposite result in this dimension, it does not show a significant upward trend until 1809 K and a much slower upward trend after 1809 K. It is considered that this fit does not affect subsequent conclusions. This suggests that the amount of hydrogen required for the reaction to occur is essentially constant or even less as the temperature increases.

3.3. Thermodynamic Enthalpy Change

The H i θ   versus   T   of each group in Reaction (5) was calculated thermodynamically to obtain the Δ H θ versus T function for the reaction, as shown in Table 8.
The above Δ H θ versus T function was fitted using MATLAB software to obtain the Δ H θ versus T function in the above table reference for doing Reaction (5) at the 298–2000 K temperature range. The image of the Δ H θ versus T function is shown in Figure 2.
The image of the Δ H θ versus T function provides a visual representation of the release or absorb energy of a reaction. If Δ H θ > 0 , the reaction is endothermic, and if Δ H θ < 0 , the reaction is exothermic. All six sets of thermodynamic data above show that Reaction (5) absorbs energy until 1184 K. Thereafter, the NIST database shows that the reaction gradually releases energy, and the energy released increases with increasing temperature until an inflection point at around 2000 K. For the FactSage database, there are abrupt changes around two temperature points, 1644 K and 1811 K. This is due to the fact that these points are the melting points of FeO and Fe, respectively. The remaining four thermodynamic handbooks all show a decreasing trend, i.e., the energy absorption becomes less as the temperature increases. The difference is that the calculations of the four thermodynamic manuals show a weakly absorption of energy at the high temperature range, while FactSage shows an energy released one. The fitting results show that Reaction (5) absorbs energy up to the temperature of 1642 K. Between the melting point of FeO (around 1642 K) and the melting point of Fe (around 1811 K), Reaction (5) absorbs energy strongly, while the release energy remains weak in the temperature range of the reduction of molten wustite by hydrogen after 1811 K, and the release of energy increases gradually with the increase in temperature. Furthermore, the data given on the NIST website show that Reaction (5) exhibits a release energy reaction after 1184 K. This data set differs considerably from the others, and the regularity it shows is questionable.

4. Discussion

It was shown that the rate of the reduction of the molten wustite by hydrogen at 1673 K is very fast and that the rate controlling step in this reaction is not the phase transfer but the chemical reaction itself. A synthesis of results from several papers found that the rate of the reduction of molten wustite by hydrogen was much faster than using other reducing agents, such as solid carbon, carbon dissolved in liquid iron and CO gas [24]. The rate controlling step, whether hydrogen-rich blast furnace, hydrogen-based shaft furnace or the reduction of molten wustite by hydrogen in the smelting reduction vessel is Reaction (5). The simulations of common thermodynamic handbooks’ data reveal that Reaction (5) has different energy changes in different temperature ranges.
At low temperatures (1123–1323 K), i.e., the temperature range applicable to hydrogen-based shaft furnaces, the fits given by the four thermodynamic handbooks and the FactSage database all showed a strong absorption of energy. At 1320 K, the enthalpy changes for Reaction (5) were 15,918.1411 J/mol (Reference 14), 15,854.2651 J/mol (Reference 15), 15,733.8543 J/mol (Reference 16), 16,730.8318 J/mol (Reference 17) and 15,011 J/mol (FactSage database), which is thought to absorb more energy. The NIST database differs significantly from the above five data sets in this range and the regularity is questionable.
At the mid-temperatures (1323–1650 K), i.e., the temperature range applicable to hydrogen-rich blast furnace, the fits given in the four thermodynamic handbooks, the FactSage database and the NIST database also show the absorbed energy, but the amount of energy decreases to varying degrees with increasing temperature. The enthalpy changes for Reaction (5) at 1650 K were 8919.1 J/mol (Reference 14), 9219.39377 J/mol (Reference 15), 8971.07641 J/mol (Reference 16) and 10,615.5912 J/mol (Reference 17), respectively. It is worth noting that at 1644 K (which can be considered to be around 1642 K) the enthalpy changes in the FactSage database change abruptly to a negative value (−22,451.538 J/mol); it is thought that this is due to the phase change of FeO.
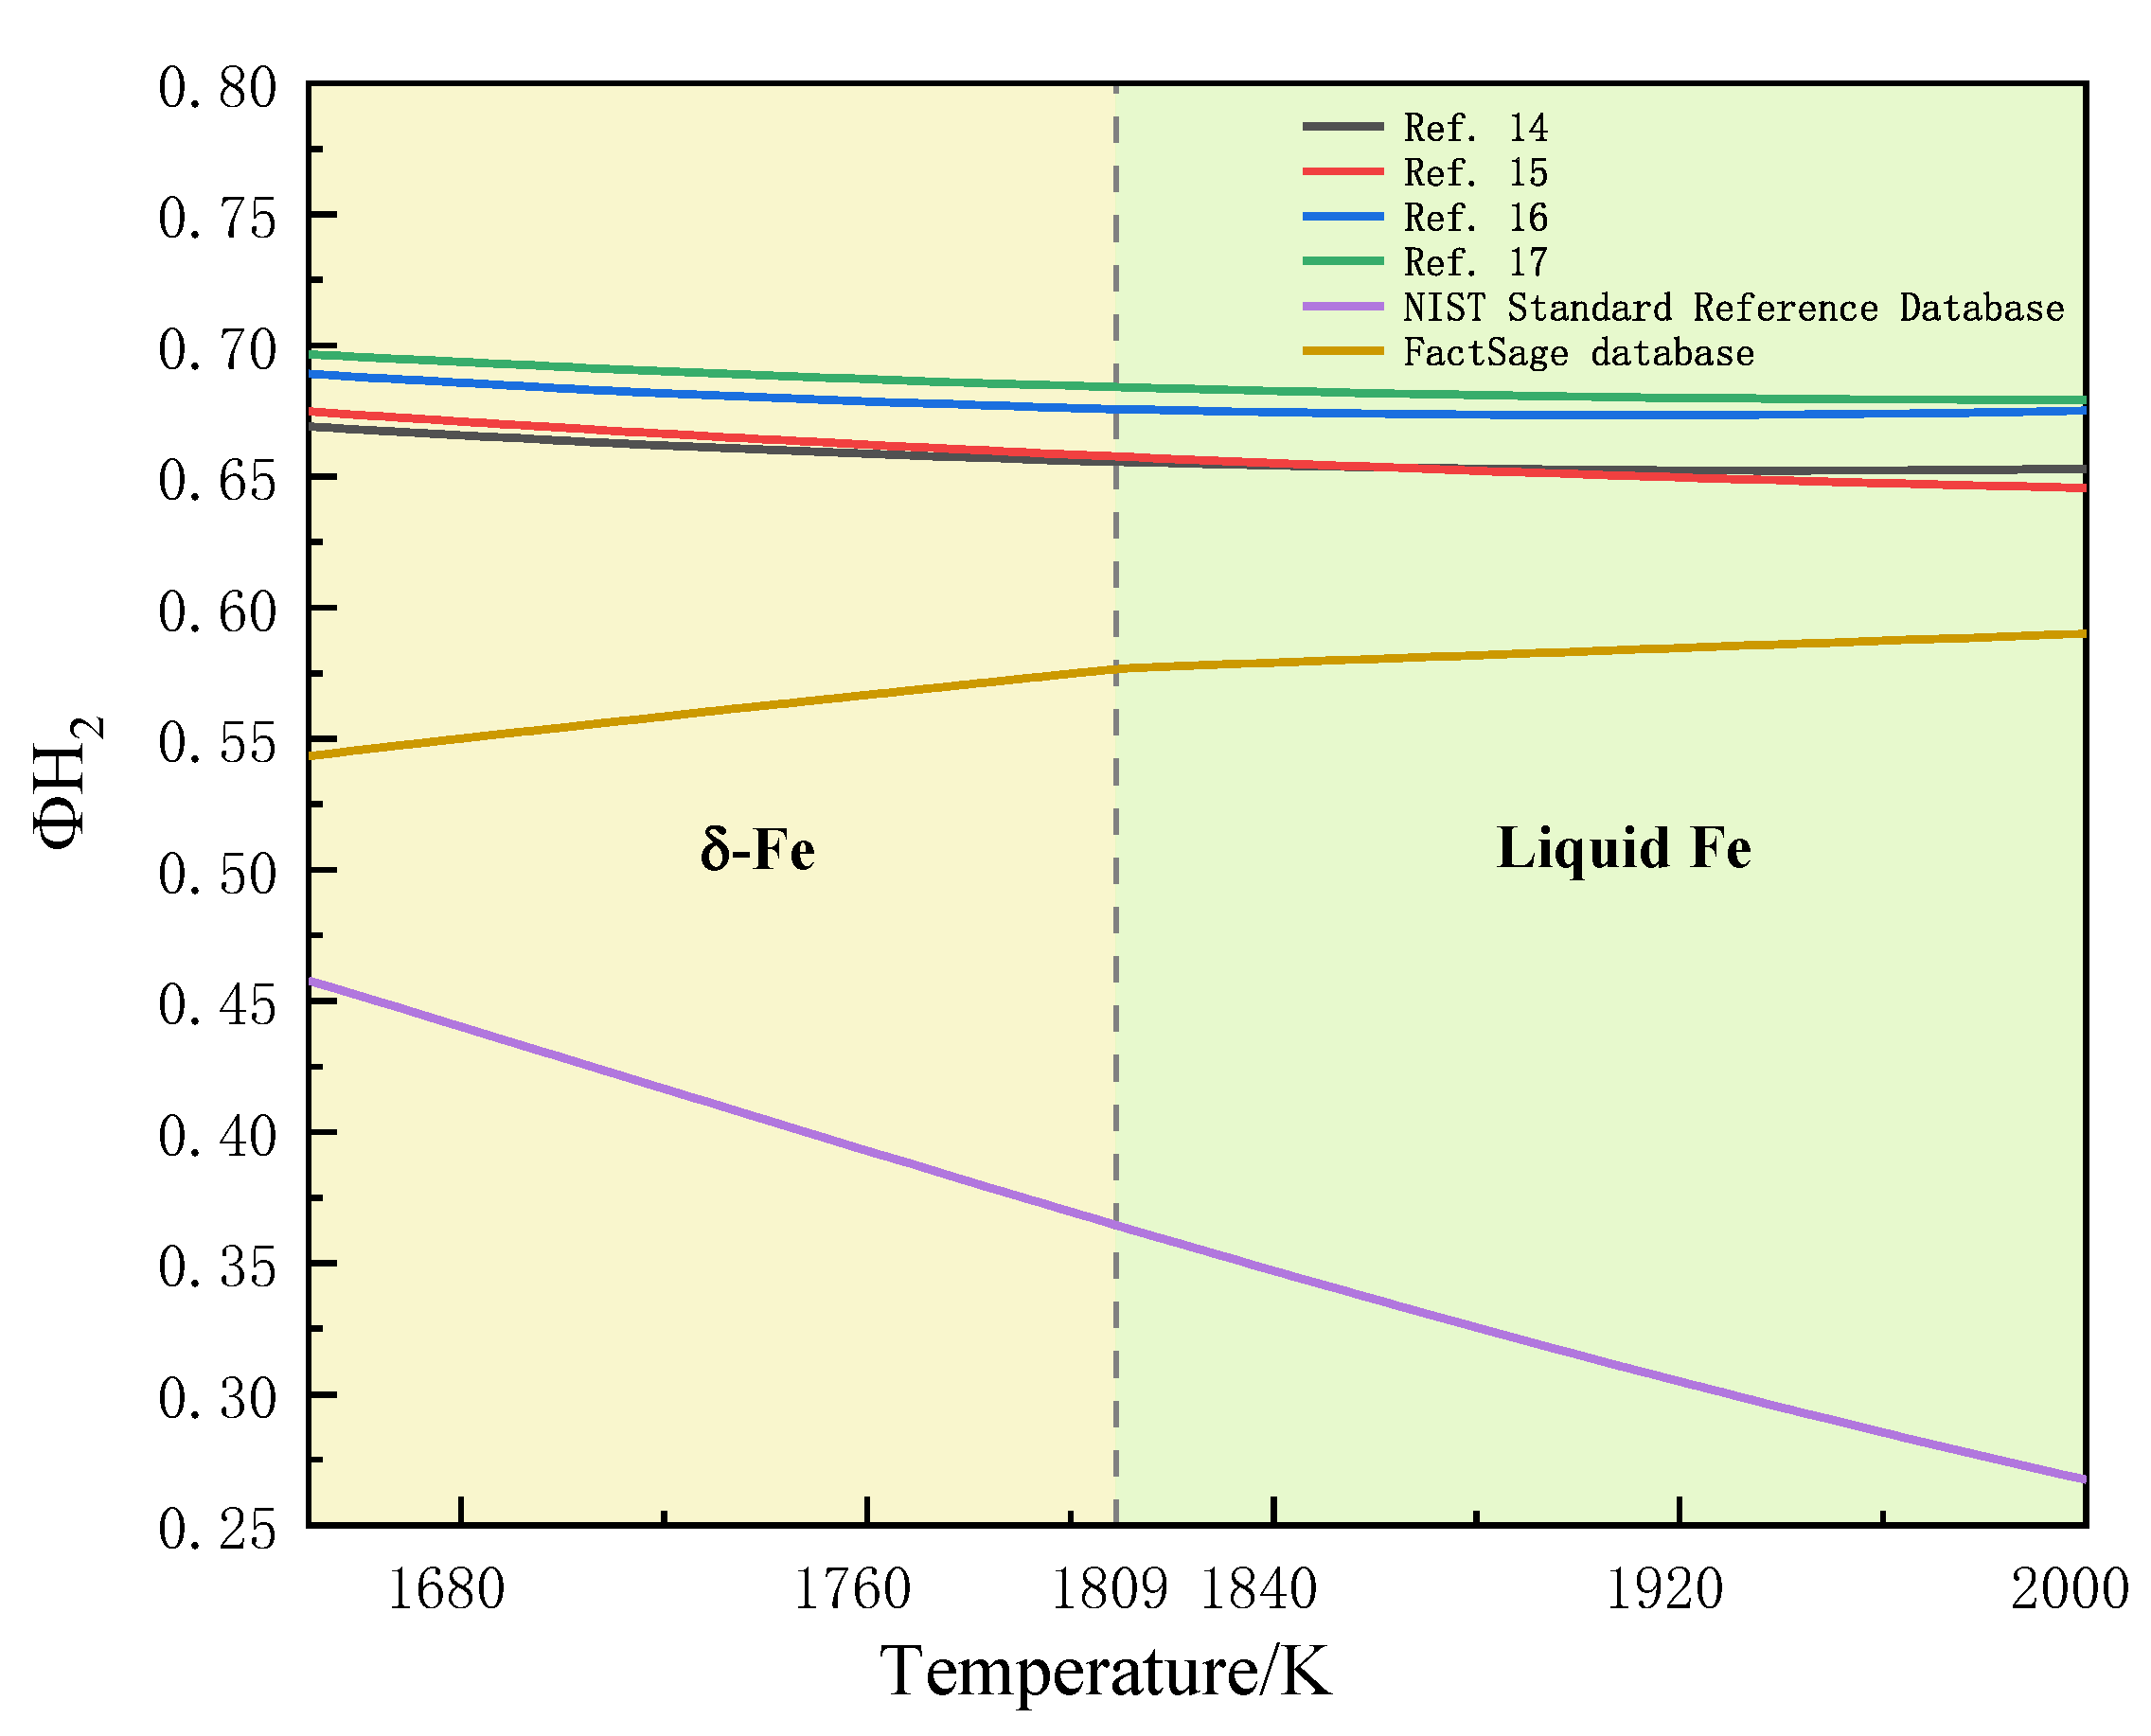
At the high temperatures (1650–2000 K), i.e., the temperature range for the reduction of molten wustite by hydrogen in the smelting reduction vessel, the enthalpy changes given in the four thermodynamic handbooks already show a weak absorption of energy, and at 2000K the enthalpy changes for Reaction (5) are 2780.72054 J/mol (Reference 14), 2773.43342 J/mol (Reference 15), 2431.86755 J/mol (Reference 16), 3177.25483 J/mol (Reference 17), 2431.86755J/mol (Reference 16) and 3177.25483J/mol (Reference 17). As the temperature increases, the amount of energy absorbed by the reaction decreases, gradually approaching thermal equilibrium. The thermodynamic data given in the FactSage database even show a release energy (−30,059.105 J/mol), which becomes more pronounced as the temperature increases. Furthermore, at 2000K, the partial pressure of hydrogen for Reaction (5) drops to 65.29% (Reference 14), 64.57% (Reference 15), 67.51% (Reference 16) and 67.92% (Reference 17), respectively. Although the FactSage database gives an increasing trend in the partial pressure of hydrogen, it is still only about 59.01% at 2000 K.
The energy absorption and release at around 1173 K (900 °C) is compared with that at around 1873 K (1600 °C) and the results are shown in Table 9. According to the FactSage database and the NIST database results, Reaction (5) is already release energy at a high temperature of 1873 K. The data given in four other thermodynamic handbooks show that the energy absorbed by Reaction (5) at 1873K is only 1/4–1/3 of that at 1173 K, which can be considered as weak absorption or release of energy.
In practice, comparing the energy absorption values at the two temperatures, the results are obvious. This means that at higher temperatures, the reduction of wustite to iron by hydrogen absorbs less energy. Although it costs more to provide heat with oxygen and hydrogen than to provide heat with oxygen and carbon, this result shows that a reaction with less energy absorption is obviously more energy efficient when it comes to heating with oxygen and hydrogen. That is, the reduction of smelting wustite by hydrogen at high temperature is more energy saving.
In another similar paper, a reduction method based on a hydrogen-based shaft furnace is proposed for solid-state direct reduction combined with hydrogen plasma reduction, a method that can also have the effect of saving hydrogen resources and which is set at an experimental temperature of 700 °C [25]. If the equipment allows, the reduction of molten wustite by hydrogen should also be experimented frequently. The Technical Research Laboratories in Korea Pohang, which attaches great importance to hydrogen metallurgy, points out that the problem facing the reduction of wustite by hydrogen at this stage is the heat absorption of the reaction and states that the application of this technology must be accompanied by a variety of processes and equipment changes [26].

5. Conclusions

Based on the above six sets of data, the variation in Gibbs free energy in the range of 298–2000 K was obtained using the principle of minimum Gibbs free energy, and the relationship between φ H 2 versus   T and Δ H θ versus   T was further deduced. The different data were found to be consistent in the calculation of enthalpy changes below 1665 K and similar at the temperature range 1809–2000 K; the four thermodynamic handbooks were similarly consistent in the calculation of φ H 2 . In the temperature range of 1665–1809 K, the calculation results of enthalpy changes of different data are different. The calculation results of φ H 2 in the four thermodynamic handbooks and the FactSage database are different, and further verification by experiment is required subsequently.
At low temperatures of 1123 K to 1323 K, i.e., in the hydrogen-based shaft furnace, the energy absorption is all around 15,000 J/mol, and the reaction energy absorption is violent.
At medium temperatures of 1323 K to 1650 K, i.e., in the hydrogen-rich blast furnace, the energy absorption drops to around 9000 J/mol, and the reaction is still in an energy-absorbing state, but the energy absorption is significantly reduced.
At high temperatures of 1650 K to 2000 K, i.e., in the reduction of molten wustite by hydrogen, the energy absorption drops to around 2500 J/mol and can be considered as weak absorption or release of energy. Comparing this result with the energy variation of the hydrogen-based shaft furnace, the difference is obvious. The energy absorption of the hydrogen-based shaft furnace is about three to four times greater than the energy absorption of the reduction of molten wustite by hydrogen at high temperatures. The partial pressure of hydrogen required for the reaction to occur at this time is similarly at a low level of about 60–65%.
In summary, it can be concluded that the reduction of molten wustite by hydrogen has better thermodynamic conditions, absorbs less energy and requires a lower partial pressure of hydrogen for the reaction to occur compared to the other two processes. Alternative ironmaking is gradually developing and Corex, Finex and HIsmelt processes are emerging; at this stage, it is still the direct reduction process that is more dominant, but with the rise in coke prices, smelting reduction will be the direction of future development of alternative ironmaking [27]. This paper provides support for the thermodynamic calculation of the reduction of molten wustite by hydrogen at high temperatures, which will be beneficial for the development of the molten reduction process when supplemented by experimental verification in the future.

Author Contributions

Z.L., Y.W. and T.W. conceived and designed the calculations; S.C. and T.W. performed the calculations; J.Z., Z.L., S.C. and T.W. analyzed the data; Y.W., S.C., T.W. and Y.L. wrote the paper. All authors have read and agreed to the published version of the manuscript.

Funding

This research was funded by the National Natural Science Foundation of China, (52174291), the Beijing New-star Plan of Science and Technology (Z211100002121115), the Central Universities Foundation of China (06500170), the Guangdong Basic & Applied Basic Research Fund Joint Regional Funds-Youth Foundation Projects (2020A1515111008) and the China Postdoctoral Science Foundation (2021M690369).

Data Availability Statement

All the data that support the findings of this study are included within the article.

Conflicts of Interest

The authors declare no conflict of interest.

References

  1. Zhang, J.; Li, Y.; Liu, Z.; Wang, T.; Wang, Y.; Li, K.; Wang, G.; Xu, T.; Zhang, Y. Isothermal kinetic analysis on reduction of solid/liquid wustite by hydrogen. Int. J. Miner. Metall. Mater. 2022, 29, 1830–1838. [Google Scholar]
  2. Zhang, F.; Cao, Z.; Xu, H. Development Status and Prospect of Direct Reduction Technology in Gas-based Shaft Furnace. Iron Steel 2014, 49, 1–10. [Google Scholar]
  3. Hayashi, S.; Iguchi, Y. Influence of gangue species on hydrogen reduction rate of liquid wustite in gas-conveyed systems. ISIJ Int. 1995, 35, 242–249. [Google Scholar] [CrossRef]
  4. Katayama, H.; Taguchi, S.; Tsuchiya, N. Reduction of Iron Oxide in Molten Slag with H2 Gas. Tetsu-to-Hagané 1982, 68, 2279–2286. [Google Scholar] [CrossRef] [PubMed] [Green Version]
  5. Ban-ya, S.; Iguchi, Y.; Nagasaka, T. Rate of reduction of liquid wustite with hydrogen. Tetsu-to-Hagané 1984, 70, 1689–1696. [Google Scholar] [CrossRef] [PubMed] [Green Version]
  6. Nagasaka, T.; Hino, M.; Ban-Ya, S. Interfacial kinetics of hydrogen with liquid slag containing iron oxide. Metall. Mater. Trans. B 2000, 31, 945–955. [Google Scholar] [CrossRef]
  7. Fan, X.; Li, C.; Wang, M. Effects of Adding Different Proportions of H2 to the Simulated Hydrogen-Rich Blast Furnace. Chem. Eng. Technol. 2022, 45, 2284–2291. [Google Scholar] [CrossRef]
  8. Iqbal, S.; Bahadur, A.; Ali, S.; Ahmad, Z.; Javed, M.; Irfan, R.M.; Ahmad, N.; Qamar, M.A.; Liu, G.; Akbar, M.B.; et al. Critical role of the heterojunction interface of silver decorated ZnO nanocomposite with sulfurized graphitic carbon nitride heterostructure materials for photocatalytic applications. J. Alloy.Compd. 2021, 858, 158338. [Google Scholar]
  9. Luo, W. Review and Thermodynamic Calculation of Gas-based Shaft Furnace Direct Reduction Ironmaking. EDP Sci. 2020, 218, 01032. [Google Scholar] [CrossRef]
  10. Sher, M.; Javed, M.; Shahid, S.; Iqbal, S.; Qamar, M.A.; Bahadur, A.; Qayyum, M.A. The controlled synthesis of g-C3N4/Cd-doped ZnO nanocomposites as potential photocatalysts for the disinfection and degradation of organic pollutants under visible light irradiation. RSC Adv. 2021, 11, 2025–2039. [Google Scholar] [CrossRef] [PubMed]
  11. Kashiwaya, Y.; Hasegawa, M. Thermodynamics of impurities in pure iron obtained by hydrogen reduction. ISIJ Int. 2012, 52, 1513–1522. [Google Scholar] [CrossRef] [Green Version]
  12. Tang, J. Nonlinear curve fitting based on matlab. Comput. Mod. 2008, 15. [Google Scholar] [CrossRef]
  13. Zheng, L.; Li, L.; Chen, Y. The comparison of Matlab and Mathematica in the application of nonlinear fitting. China Sci. Technol. Inf. 2012, 13, 185. [Google Scholar]
  14. Guo, H. The Course of Metallurgical Physical Chemistry, 2nd ed.; Metallurgical Industry Press: Beijing, China, 2012. [Google Scholar]
  15. Wang, F.; Wang, X. Mathematica and Its Applications to Mathematics; China Agriculture Press: Beijing, China, 2013. [Google Scholar]
  16. MATLAB, version 9.11. Software for technical computation. Cleve Moler Research, MathWorks, Inc.: Natick, MA, USA, 1984.
  17. Knacke, O.; Hesselmann, K. Thermochemical Properties of Inorganic Substances; Springer: Berlin, Germany, 1973. [Google Scholar]
  18. Ye, D. Thermodynamic Data Manual of Practical Inorganic Matter; Metallurgical Industry Press: Beijing, China, 1981. [Google Scholar]
  19. Ye, D. Thermodynamic Data Manual of Practical Inorganic Matter; Metallurgical Industry Press: Beijing, China, 2002. [Google Scholar]
  20. Liang, Y.; Che, Y.; Liu, X. Thermodynamic Data Manual of Inorganic Matter; Northeastern University Press: Shenyang, China, 1993. [Google Scholar]
  21. U.S. Department of Commerce. Available online: https://janaf.nist.gov/ (accessed on 13 November 2022).
  22. FactSage, version 8.2. Software for chemical thermodynamics, calculation. Thermfact/CRCT: Montreal, Canada; GTT-Technologies: Aachen, Germany, 2001.
  23. Cao, Z.; Song, X.; Qiao, Z. Thermodynamic Simulation Software FactSage and its application. Rare Met. 2008, 32, 216–219. [Google Scholar]
  24. Li, B.; Guo, H.; Guo, J.; Sun, G. Thermodynamic study of gas-solid reduction of iron oxides based on minimum Gibbs Free energy principle. J. Eng. Sci. 2017, 39, 1653–1660. [Google Scholar]
  25. Filho, I.; Springer, H.; Ma, Y.; Mahajan, A.; Silva, C.; Kulse, M. Green steel at its crossroads: Hybrid hydrogen-based reduction of iron ores. J. Clean. Prod. 2022, 340, 130805. [Google Scholar] [CrossRef]
  26. Yi, S.; Lee, W.; Lee, Y.; Kim, W. Hydrogen-based reduction ironmaking process and conversion technology. J. Korean Inst. Met. Mater. 2021, 59, 41–53. [Google Scholar] [CrossRef]
  27. Mameshin, V.; Zhuravlova, S. Modern condition and development prospects of alternative processes of the ferrous metallurgy. Theory Pract. Metall. 2018, 6, 71–75. [Google Scholar] [CrossRef]
Figure 1. Relationship between φ H 2 and temperature.
Metals 13 00225 g001
Figure 2. Relationship between enthalpy changes and temperature.
Metals 13 00225 g002
Table 1. Results of φ H 2 and Δ H θ calculations for Reaction (5) in the FactSage database.
Temperature/Kφ(H2)Hθ/J·mol−1
2980.99995809−20,001.1
3000.99995346−19,957.5
4000.9981561621,847.4
5000.9851006919,825.6
6000.9457303218,090.5
7000.8791908216,713.3
8000.7979278515,752.1
9000.7449672015,304.3
10000.7040439315,584.0
11000.6664205716,118.5
12000.6330348216,620.8
13000.6039971815,279.8
14000.5806687413,927.7
15000.5620789612,544.1
16000.5474145311,111.6
17000.55429572−20,636.4
18000.57477776−21,767.6
19000.58325040−8592.4
20000.59005277−9137.9
Table 2. NIST Standard Reference Database.
Temperature/K1500160017001800190020002100
Fe (H298 = 0 KJ·mol−1)HT-H298/KJ·mol−145.64349.33854.06658.26376.64181.2485.845
ST/J·mol−1·K84.33686.72089.58091.978102.082104.442106.688
FeOHT-H298/KJ·mol−169.50275.873106.549113.369120.189127.009133.829
H298/KJ·mol−1−268.484−267.642−243.540−242.774−256.202−255.866−255.541
ST/J·mol−1·K151.323155.435174.026177.924181.611185.109188.437
H2 (H298 = 0 KJ·mol−1)HT-H298/KJ·mol−136.29039.54142.83546.16949.54152.95156.397
ST/J·mol−1·K178.846180.944182.940184.486186.669188.418190.718
H2OHT-H298/KJ·mol−148.15152.90857.75862.69367.70672.79077.941
H298/KJ·mol−1−250.265−250.592−250.881−251.138−251.368−251.575−251.762
ST/J·mol−1·K250.620253.690256.630259.451262.161264.769267.282
Table 3. Thermochemical Properties of Inorganic Substances (1973).
Temperature/K1500160017001800190020002100
FeH/kcal·mol−111.30212.20813.39314.44318.79519.85120.911
G/kcal·mol−1−19.473−21.554−23.109−23.696−25.908−26.110−28.345
FeOH/kcal·mol−1−48.415−46.885−39.547−37.917−36.187−34.657−33.027
G/kcal·mol−1−102.691−106.359−110.299−114.508−118.807−123.192−127.659
H2H/kcal·mol−18.7119.48510.26611.05511.85112.65613.468
G/kcal·mol−1−55.408−59.708−64.056−68.451−72.890−77.370−81.892
H2OH/kcal·mol−1−46.545−45.431−44.291−43.126−41.935−40.719−39.477
G/kcal·mol−1−136.260−142.277−148.365−154.520−160.741−167.026−173.371
Table 4. Thermodynamic Data Manual of Practical Inorganic Matter (1981).
Temperature/K1500160017001800190020002100
Fe(H298 = 0 kcal·mol−1)HT-H298/cal·mol−111,30412,21113,39514,44518,79719,85320,913
ST/cal·mol−1·K20.5321.1221.7922.3924.7925.3325.85
FeO(H298 = −65.02 kcal·mol−1)HT-H298/cal·mol−116,60718,13725,47427,10428,73430,36431,994
ST/cal·mol−1·K36.2137.1941.6342.5643.4444.2845.07
H2(H298 = 0kcal·mol−1)HT-H298/cal·mol−18713948710,26811,05711,85412,65813,470
ST/cal·mol−1·K42.7543.2543.7344.1844.6145.0245.42
H2O(H298 = −57.98 kcal·mol−1)HT-H298/cal·mol−111,40712,52113,66014,32616,01717,23318,475
ST/cal·mol−1·K59.8160.5361.2261.8862.5363.1563.76
Table 5. Thermodynamic Data Manual of Practical Inorganic Matter (2002).
Temperature/K1500160017001800190020002100
Fe(H298 = 0 J·mol−1)HT-H298/J·mol−146,13149,82654,55558,75177,12981,73186,334
ST/J·mol−1·K84.77987.16490.02492.423102.526104.887107.132
FeO(H298 = −272,044 J·mol−1)HT-H298/J·mol−169,47975,881106,583113,402120,222127,042133,862
ST/J·mol−1·K151.414155.545174.152178.050181.738185.236188.563
H2(H298 = 0 J·mol−1)HT-H298/J·mol−136,45339,68942,95746,25849,59152,95756,355
ST/J·mol−1·K178.66180.954182.935184.822186.624188.351190.009
H2O(H298 = −241,814 J·mol−1)HT-H298/J·mol−147,72352,38557,15362,02967,01172,10077,297
ST/J·mol−1·K250.262253.270256.161258.947261.641264.251266.786
Table 6. Thermodynamic Data Manual of Inorganic Matter.
Temperature/K1600180020002200
FeH/kJ·mol−149.8158.7381.7290.92
G/kJ·mol−1−89.61−107.58−128.01−149.43
FeOH/kJ·mol−1−196.17−158.64−145.00−131.36
G/kJ·mol−1−445.01−479.10−515.44−553.14
H2H/kJ·mol−139.6846.2552.9559.78
G/kJ·mol−1180.94184.87188.33191.59
H2OH/kJ·mol−1−189.43−179.79−169.72−159.22
G/kJ·mol−1−594.64−645.86−698.19−751.54
Table 7. Δ G θ   versus   T   calculations from the NIST website and four thermodynamic handbooks.
References Δ G θ   versus   T
NIST Standard Reference Database 121467.46 2942.761 T 0.42514 T 2 + 5.144 × 10 5 T 4 + 1293.0311 T 1 + 462.88303 T l n T
Thermochemical Properties of Inorganic Substances (1973) 38148.142 308.0349 T 0.045298 T 2 + 8.13 × 10 6 T 4 + 442.08621 T 1 + 46.348489 T l n T
Thermodynamic Data Manual of Practical Inorganic Matter (1981) 25155.3608 + 32.5768065 T + 0.01043708 T 2 4.424 × 10 7 T 4 + 286.502223 T 1 7.797753 T l n T
Thermodynamic Data Manual of Practical Inorganic Matter (2002) 41071.779 235.4074 T 0.034435 T 2 + 7.255 × 10 6 T 4 + 447.86741 T 1 + 34.312306 T l n T
Thermodynamic Data Manual of Inorganic Matter 35359.172 181.6009 T 0.019334 T 2 + 3.876 × 10 6 T 4 + 356.47473 T 1 + 25.435745 T l n T
Table 8. Δ H θ versus T calculations from the NIST website and four thermodynamic handbooks.
References Δ H θ   versus   T
NIST Standard Reference Database 59.261072 + 98.954207 T 0.121208 T 2 + 3.213 × 10 5 T 3 + 10439.744 T 1
Thermochemical Properties of Inorganic Substances (1973) 19920.093 + 29.385873 T 0.035393 T 2 + 8.207 × 10 6 T 3 + 162.2773 T 1
Thermodynamic Data Manual of Practical Inorganic Matter (1981) 24749.9641 + 15.4796745 T 0.0238181 T 2 + 5.2918 × 10 6 T 3 + 242.831376 T 1
Thermodynamic Data Manual of Practical Inorganic Matter (2002) 21380.396 + 22.271131 T 0.028354 T 2 + 6.24 × 10 6 T 3 + 10418.891 T 1
Thermodynamic Data Manual of Inorganic Matter 20930.1194 + 14.8469727 T 0.0171551 T 2 + 2.6461 × 10 6 T 3 + 10383.6518 T 1
Table 9. The 1173 K versus 1873 K energy absorption and release.
References1173 K/J1873K/JRatios
FactSage database13,294.2−9880.6-
NIST Standard Reference Database1176.1−28,886.9-
Thermochemical Properties of Inorganic Substances (1973)18,938.54726.64.01
Thermodynamic Data Manual of Practical Inorganic Matter (1981)18,677.14959.23.77
Thermodynamic Data Manual of Practical Inorganic Matter (2002)18,571.34631.64.01
Thermodynamic Data Manual of Inorganic Matter19,021.05948.23.20
Disclaimer/Publisher’s Note: The statements, opinions and data contained in all publications are solely those of the individual author(s) and contributor(s) and not of MDPI and/or the editor(s). MDPI and/or the editor(s) disclaim responsibility for any injury to people or property resulting from any ideas, methods, instructions or products referred to in the content.

