Article

Microscale Strain Localizations and Strain-Induced Martensitic Phase Transformation in Austenitic Steel 301LN at Different Strain Rates

IMPACT—Multiscale Mechanics Research Group, Engineering Materials Science, Materials Science and Environmental Engineering, Tampere University, 33014 Tampere, Finland
*
Author to whom correspondence should be addressed.
Metals 2023, 13(2), 207; https://doi.org/10.3390/met13020207
Submission received: 7 December 2022 / Revised: 13 January 2023 / Accepted: 18 January 2023 / Published: 20 January 2023
(This article belongs to the Special Issue Study on Phase Transformation and Deformation of Metallic Materials)

Abstract

:
Microscopic strain and strain-induced phase transformation during plastic deformation in metastable austenitic steel were investigated at different strain rates. Quasi in-situ tension tests were performed sequentially with well-defined elongation intervals at room temperature at strain rates of 10−3 s−1 and 10−1 s−1. The tests were monitored by high-resolution optical imaging with a microscopic lens at a resolution of 0.23 µm/pixel. The macroscopic temperature was also measured with an infrared (IR) camera. The microstructure-level strain localizations were observed on the surface of the etched specimens by means of microscale digital image correlation (µDIC). Additionally, the microstructure was characterized by electron backscatter diffraction (EBSD) at the same location before and after deformation. The results of the study indicated that microscopic strain localizations favored the formation of α′-martensite particles. At the lower strain rate, high local strain concentrations formed at several locations in the microstructure, correlating with the areas where the formation of large martensite islands occurred. Martensite particles of various sizes formed nearby each other at the lower strain rate, whereas at the higher strain rate, martensite islands remained small and isolated. Although the macroscopic increase in temperature at both the studied strain rates was very low, at the higher strain rate, local heating on the microscopic scale could take place at the newly nucleated martensite embryos. This inhibited the further growth of the martensite particles, and local strain distribution also remained more homogeneous than at the lower strain rate.

1. Introduction

Metastable austenitic stainless steels are used in various engineering applications, where in addition to high corrosion resistance, excellent mechanical properties are also required. Numerous studies on these kinds of steels have demonstrated that the phase transformation from austenite to α′-martensite that takes place during plastic deformation provides a high ductility and strength. However, the extent of α′-martensite transformation on these kinds of steels is greatly influenced by different parameters, such as strain rate and temperature [1,2,3,4]. These conclusions are primarily drawn by performing experiments such as tension, compression, cyclic loading, biaxial loading, etc., under different deformation conditions and measuring the macroscopic martensite volume fraction during or after the test. On the other hand, detailed post-mortem microstructural-level investigations following such experiments have led to the conclusion that microstructural evolution notably influences the mechanical properties observed on the macroscale. In contrast, the local microstructural strain localization effects are often neglected, as the macroscale plastic deformation is assumed to be uniform until just before necking. Recent studies [5,6,7] have shown that different deformation mechanisms on the micrometer scale result in inhomogeneous localized plastic strain distribution. Thus, a better understanding of how the local microstructure and local strain evolves during plastic deformation under different loading conditions is essential for the further improvement of steels with better mechanical properties.
In-situ experiments in conjunction with various imaging techniques, such as optical microscopy and scanning electron microscopy (SEM), are used to study the microstructural processes under mechanical load on different types of materials. Since capturing an optical or SEM image of the microstructure typically requires several seconds, the majority of the in-situ experiments in the literature were performed as quasi in-situ tests. In such experiments, the crosshead movement is paused at certain well-defined loading conditions, such as displacement intervals, number of cycles, etc., without completely removing the specimen from the loading frame. The displacement and strain fields from the captured images are then often characterized using the grid method [8,9] and DIC [10]. The grid method requires a regular pattern on the surface of the specimen, whereas DIC relies on random speckle patterns. DIC is a very popular and powerful method, but one of the major challenges for this method at the micrometer scale is obtaining randomly distributed speckle patterns on the specimen surface. This has primarily been accomplished by preparing samples using different techniques, such as gold remodeling [11] and polishing followed by etching [5,12]. Several investigations [5,7,13,14,15] have already been published, in which miniaturized loading devices are directly mounted inside an SEM to carry out quasi in-situ experiments under different loading and environmental conditions. For example, Weidner and Biermann [5] carried out in-situ tensile tests in an SEM at a strain rate of 0.5 × 10⁻³ s−1 at different temperatures to analyze the deformation behavior of a metastable CrMnNi steel. The specimen surface was prepared by grinding and polishing for µDIC. They discovered that even at a small macroscopic strain of ε = 3.6%, local strains at room temperature increased up to 40%, and these areas corresponded to strain-induced α′-martensite areas revealed by EBSD. Likewise, Das et al. [15] used the gold remodeling method to obtain speckle patterns on the surface of 301 austenitic stainless steel specimens for µDIC, and they performed in-situ tensile tests inside an SEM at a strain rate of 4 × 10⁻⁴ s−1. They also demonstrated that strain accommodation is heterogeneous at the microstructural level, with some grains experiencing double local strains compared to the applied global strain and nearby grains exhibiting little or no strain.
High-resolution and high-magnification measurements of microstructural features are possible using quasi in-situ tests inside an SEM. Furthermore, the identification of individual slip planes, grain orientations, and phase information can also be readily obtained from EBSD measurements. However, this type of methodology also has certain drawbacks. Scanning and capturing the SEM images is time-consuming, which limits the achievable strain rate, and in addition, performing low strain rate experiments also takes at least some minutes. This can result in the deposition of carbon on the specimen surface. As a result, the scanned images can suffer from complex distortions resulting in various types of artifacts in the local strain calculation using µDIC [16]. Moreover, the area of interest that can be studied using SEM is very small and covers only a small number of grains.
The utilization of in-situ DIC optical microscopes is an approach to cover a larger area of interest of the microstructure. Padilla et al. [6] studied the inhomogeneous deformation of zirconium using a Navitar 12× zoom lens with a 2× adapter tube with a working distance of 100 mm to perform DIC optical measurements at the microscale level during a compressive test at a strain rate of 1 s−1. The optical resolution of their setup was 1.2 µm/pixel, and the experiment was carried out in about 1% strain intervals, as the blurring of the image could not be eliminated completely. Aydıner et al. [17] investigated deformation twinning in magnesium alloy during compression using microscopic DIC measurements with a Navitar Zoom lens at 18× magnification. The experimental setup had an optical resolution of 0.2 µm/pixel, and a similar refocusing was required between the strain increments.
As discussed above, many experimental studies have already been conducted to study in-situ microstructural changes during different types of mechanical loading. However, the association between the microscopic strain distribution and martensitic phase transformation behavior under different strain rates is still lacking. Recent work [18] on the local microstructural-level strain distribution at different strain rates during strain-induced martensitic phase transformation in 301LN metastable steel was performed using the ex-situ technique. Using an optical microscope, the microstructure of the specimen surface was imaged before and after a certain applied loading, and the local strains were calculated using DIC for each deformation increment. Although this method allows imaging at a higher spatial resolution, it requires the removal of the specimen from the mechanical test device for each increment measurement, which severely limits the practical applicability of the method.
The first objective of the present work was to study the local deformation behavior of parent austenite and the formation of α′-martensite in metastable austenitic steel 301LN in tensile loading under different strain rates. Secondly, the aim of the study was also to separate the effects of macroscopic (bulk) adiabatic heating from the effects of the strain rate on the mechanical response and microstructural evolution of the test material. For this approach, two distinct strain rates were needed: (1) a low strain rate test to ensure that no heating takes place and (2) a higher strain rate test, where the heating could be minimized via stepwise loading. In the current study, microscopic DIC was used to characterize the microstructural-level strain fields. The speckle patterns for the µDIC on the surface of the tensile specimens were achieved by polishing and etching. The optical images were captured during quasi in-situ tensile experiments with a small gap between the strain increments at two nominal strain rates of 10−3 s−1 and 10−1 s−1 using a stereo microscope, which had an optical resolution of 0.23 µm/pixel at the highest magnification of 12×. A large number of grains were studied, which provides a more representative analysis of the bulk sample on the microstructural level. Moreover, the macroscopic temperature on the opposite surface of the specimen was also measured with an IR camera for all the sequential loadings. The microscopic strain fields evaluated using µDIC were also combined with the data from EBSD. The effects of the strain rate on the local strain distribution and on the strain-induced martensitic phase transformation were investigated using the obtained data.

2. Experimental Methods

2.1. Material and Sample Preparation

The chemical composition of the metastable austenitic stainless steel EN 1.318-2B (AISI 301LN) studied in this work is shown in Table 1. The steel is nominally fully austenitic (FCC crystal structure) in the as-received condition and presents a strong phase transformation from nearly zero α′-martensite (BCC crystal structure) in the non-deformed state to nearly 100% martensite at strains close to uniform elongation at a low strain rate. It was obtained from Outokumpu Stainless LTD as 2 mm thick sheets, and the tensile specimens were prepared parallel to the rolling direction by laser cutting. Figure 1a depicts the specimen geometry, which had a gauge length of 4 mm, a width of 2 mm, and a shoulder radius of 3 mm.
For DIC measurements, a random speckle pattern is typically applied to the specimen surface. However, in this study, the tensile specimens were subjected to both optical DIC measurements and SEM-EBSD characterization before and after the deformation. The polished surface suitable for both purposes was prepared by manually grinding the gauge section of the specimens with silicon carbide grit papers. Finally, electropolishing was performed with a Struers A2 electrolyte under a voltage of 40 V for 120 s, followed by etching with 10% oxalic acid for 30 s. After grinding and electropolishing, the thickness of the samples was reduced by about 0.08–0.12 mm. To make sure that the microstructure and local strain evolution were compared at the same location, a region of interest with an area of 300 × 300 µm2 was defined in the center of the gauge section with four indentation marks. An optical microscope image of the marked location of one of the undeformed specimens is shown in Figure 1b, and a stereo-microscope image of the same specimen in the loading setup is shown in Figure 1c.

2.2. Setup and Test Procedure

Figure 2 shows the overall experimental setup consisting of a tension rig, Zeiss Discovery V8 stereo microscope, and Telops Fast-IR-2K IR camera. The quasi in-situ tensile tests were carried out with a custom-built Psylotech µTS test system. The tension rig has a load capacity of 7 kN and comprises two actuators. The tension specimen was pulled simultaneously from both ends, which allowed the center point of the specimen to be in a fixed position. As a result, microscopic DIC analysis could be carried out on the same location with a large area of interest. The stereo microscope has a maximum manual zoom of 8×. A Plan-Apochromat S 1.5× lens was mounted on the stereo microscope, which enabled a maximum magnification of 12× and a depth of field of 40 µm. The lens was positioned at a working distance of 30 mm from the specimen surface. The images for µDIC were obtained using two Imager M-Lite 16 MPix cameras from LaVision. With its highest magnification, the experimental setup had an optical resolution of 0.23 µm/pixel. The resolution of the optical images captured was 3040 × 3948 pixels.
The stereo microscope images did not remain in focus during the entire loading because of the reduction in the sample thickness. The maximum range of strain that could be covered without defocusing the image was approximately 1.5%. A similar result has been already reported by Padilla et al. [6], who used an optical system with a depth of field of 50 µm and loaded the samples in compression. Therefore, two quasi in-situ tensile tests were carried out sequentially at room temperature at well-defined displacement intervals at nominal strain rates of 10−3 s−1 and 0.1 s−1. The optical images of the sample surface for µDIC were obtained during deformation at different frequencies of 1 Hz and 20 Hz, respectively. In total, 15 loading steps were performed at an average true strain of 1.3% up to a final strain of about 20%. The holding time for each elongation interval was approximately 2 min. Between each strain interval, the microscopic images were re-focused manually and recorded. It should also be noted that for the quasi in-situ experiments, the actuator displacement was used to calculate the true strain, and the elastic compliance of the load train was corrected numerically during the analysis of the results. For the comparison, continuous tensile experiments were also performed at the same nominal strain rates. Furthermore, the surface temperature of the specimens was measured using the above-mentioned IR camera with a 100 mm lens. The temperature measurements and images for µDIC were taken on the two different sides/surfaces of the specimen. The TTL (Transistor–Transistor Logic)-compatible output signal was used for the synchronization of both the optical and infrared camera systems. During the experiments, for each loading step, the TTL pulse was sent from the Psylotech test machine to start image recording in both the optical and IR systems at the same time when the loading started. The µDIC strain analysis was carried out with the DaVis 10 software, and the IR surface temperature was analyzed using the Reveal-IR software.
The µDIC system was calibrated using a 3rd-order polynomial model. A micro calibration plate (MP 50 × 38 0.25 mm) made of a glass substrate provided by LaVision with a dot diameter of 0.083 mm and a dot distance of 0.25 mm was used for calibration [19]. Furthermore, the radiometric temperature of the specimens measured with the IR camera during each sequential loading had to be calibrated to the true surface temperature. This was achieved by externally heating a similar 301LN steel specimen that was placed between the grips of the Psylotech µTS test machine and then simultaneously recording the temperature of the specimen with both the IR camera and a spot-welded thermocouple. A more detailed explanation of the temperature calibration procedure for the same IR camera can be found in [20].

2.3. Microstructural Characterization

The EBSD measurements were performed using a Zeiss ULTRA plus scanning electron microscope equipped with an Oxford Instruments Symmetry CMOS EBSD detector. The measurements were conducted with an acceleration voltage of 20 kV, a detector tilt angle of 70°, and a step size of 0.15 μm, which was selected so that a relatively large area of interest could be measured within a reasonable time span. However, very small (less than 100 nm) martensite nuclei have been reported by Staudhammer et al. [21] and therefore some martensite particles may have not been detected with the step size used in the current analysis. Further transmission electron microscopy (TEM), high resolution-EBSD, and high energy X-ray diffraction could be carried out to study the fine structure of the strain-induced martensite. The AztechHKL software was used for data interpretation to obtain information related to austenite and α′-martensite phases as well as grain boundaries. Only grain boundaries with a misorientation greater than 15° were considered in the analysis. Moreover, the same EBSD orientation maps were utilized to compare the intragranular plastic deformation before and after the tension experiments based on the local misorientations. This was assessed using kernel average misorientation (KAM) in a matrix of 3 × 3 pixels. In addition, misorientations greater than 3 degrees were intentionally excluded from the current KAM analysis to exclude other grain boundaries.

2.4. Local Strain Fields Using DIC and EBSD Measurements

µDIC analysis was performed on sequences of 16 optical images to study the local deformation in the microstructure. These analyses were undertaken using the LaVision DaVis 10.2.1.79853 software, and it should be noted that the strain fields presented here were obtained solely through 2D-µDIC. The sum-of-differentials correlation method was used for the µDIC calculation. The smallest virtual strain gauge (VSG) that was possible to use without generating noisy local strain results was approximately 18 µm. A nonlinear 2nd-order subset shape function was used, as this leads to a higher spatial resolution of the local strain measurements as explained in our previous work [18]. The calculation parameters used in the DIC strain measurements are summarized in Table 2. The strain fields are represented in the material frame of reference. In contrast, the final local strain fields after the deformation to the plastic strain of 0.2 are represented in a pixel reference frame. These final local strain fields were superimposed on the EBSD images using the FIJI (ImageJ) software.

3. Results

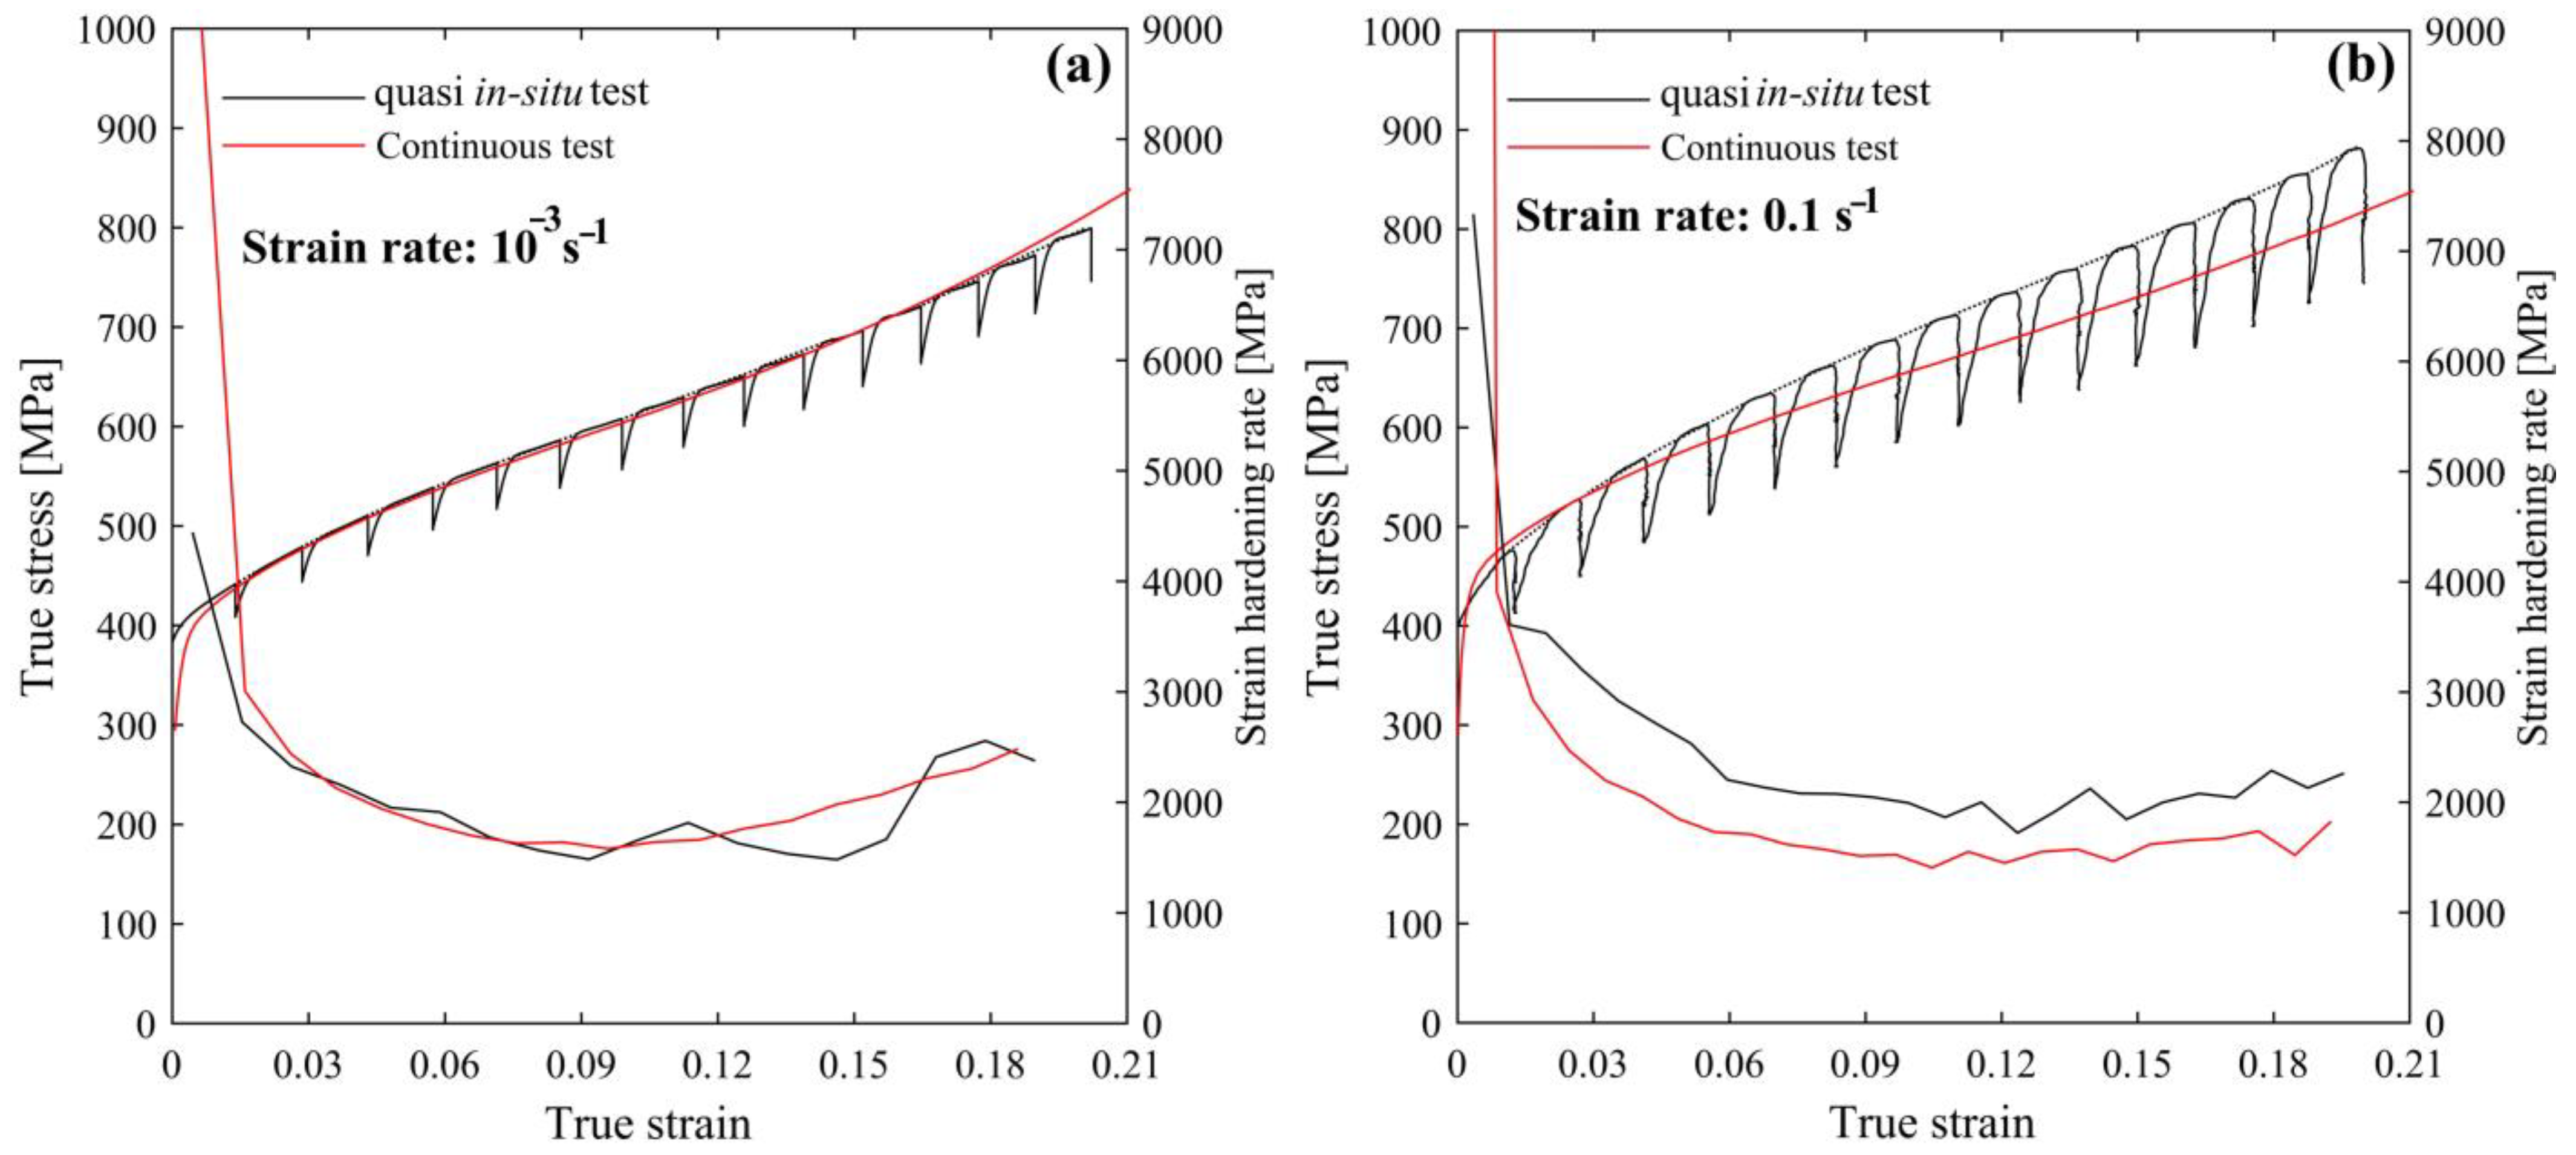
3.1. Macroscopic Observations

Figure 3 summarizes the true stress–true strain plots and the corresponding strain hardening rate plots of the experiments carried out at the nominal strain rates of 10−3 s−1 and 10−1 s−1. The red and black curves in Figure 3 compare the tensile behavior of the investigated metastable austenitic stainless steel 301LN under quasi in-situ loading and continuous loading, respectively. It should also be noted here that the quasi in-situ strain hardening curves were calculated by fitting the maximum true stress value of each sequential loading step using linear interpolation. The dotted line in Figure 3 is the fitted curve that was used for the calculation of the strain hardening rate. In the quasi in-situ tests, stress relaxation took place due to load frame compliance when the deformation was stopped after each sequential loading. The magnitude of the stress relaxation increased with increasing the strain rate.
From Figure 3a, it can be seen that at the lower strain rate of 10−3 s−1, the tensile behavior of the quasi in-situ test matched very well with the results obtained from the continuous test. This is also evident from the strain hardening curve. On the other hand, it can be observed that the stress–strain curve of the quasi in-situ tension test performed at the higher strain rate of 0.1 s−1 shown in Figure 3b differed from that of the continuous test. At this strain rate, the strain hardening rate was higher in the quasi in-situ test when compared with the hardening rate of the continuous test. This indicated that more α′-martensite was formed during the quasi in-situ loading than during continuous loading at the same strain rate, because the temperature histories differ between these types of tests, as discussed below.
The bulk temperature during the quasi in-situ tension test at the lowest strain rate of 10−3 s−1 remained constant. Moreover, the bulk surface temperature did not increase suddenly during a high strain rate sequential loading of 0.1 s−1. For all the sequential loadings at this strain rate, the highest bulk temperature increase was around 1 °C, as the heat generated during deformation dissipated to the surroundings during the holding periods. This is notably different to the continuous test at the higher strain rate, where the temperature increased up to 32 °C at the plastic strain of 0.2 [22].

3.2. Microscopic Strain at Different Strain Rates

The local strain fields in the microstructure were investigated and compared using µDIC with the procedure described above. The strain evolution in the microstructure was compared to the initial material frame of reference at the different strain levels, and finally the local strain data was superimposed with the EBSD map measured after deformation to a plastic strain of 0.2. Furthermore, it should be noted that more emphasis was placed on the identification of microstructural areas with high localized strain along the tensile direction rather than on the measurement of the absolute local strain values.
Figure 4 shows the selected local strain fields during the quasi in-situ tensile loading at the lower strain rate of 10−3 s−1 at different global strain levels. The tensile deformation was parallel to the rolling direction (vertical in the Figure 4 and Figure 5). Figure 4a shows the initial undeformed micro-optical image, which is overlayed with the grain and twin boundaries (indicated by black lines) obtained from the EBSD measurements. A few α′-martensite particles at the grain boundaries and inside the austenite grains (shown by the green color) were identified by EBSD. These particles were either present in the as-received state or were most likely produced during the initial sample preparation.
Figure 4b illustrates the microscale strain at the applied global strain of about 0.057. The distribution of the local strain in the microstructure is heterogeneous. Some of the austenitic regions, denoted by the black hexagon and circle symbols, developed high strains locally, and the maximum local strain is about twice that of the applied global strain. However, there are also some regions in the microstructure (shown by the blue color in the strain map) where austenite grains deformed little or remained almost undeformed along the tensile direction. Moreover, there are also regions in the microstructure where some of the austenite grains exhibited local plastic strains close to the applied global strain (one example of this is marked by the rectangle). Further evolution of strain in the microstructure with continued deformation to the macroscopic strain of 0.112 is shown in Figure 4c. The local strain values increased as the plastic deformation progressed. At this stage, it was apparent that the deformation proceeded in the same manner as previously described. The highly deformed regions of the microstructure continued to deform, while the unstrained regions remained almost undeformed as well.
Figure 4d shows a comparison of the results of the µDIC with the results obtained from the EBSD measurements in the same area of interest after finishing the tensile test at a 0.2 global plastic strain. A comparison of the results from the µDIC with the EBSD phase map showed that higher strain values correlated with the areas where extensive phase transformation of α′-martensite occurred. This is especially noticeable in the areas marked by the hexagon and circle, where large α′-martensite islands were formed. In one of the regions (shown by the rectangle) where the local deformation was nearly equal to the applied global plastic strain, small α′-martensite islands were observed. In contrast, in the regions where austenite grains deformed little (as indicated by the blue color in the strain maps), the phase transformation also seemed to be limited.
Similarly to the low rate test, a quasi in-situ tension test was performed at the higher strain rate of 10−1 s−1 up to a 0.19 macroscopic plastic strain. Figure 5 summarizes the selected results of the local strain field calculations performed at various global plastic strains. The optical image of the undeformed specimen overlaid with measurements from EBSD is shown in Figure 5a. Figure 5b illustrates the local strain field at the applied strain of 0.055. At this macroscopic strain, some austenite grains deformed notably, and some of the regions remained nearly undeformed. For instance, the two ellipse symbols in the strain map show the regions where local strains are highly concentrated. The local plastic strains in the majority of the austenite grains were close to the applied global plastic strain; one example of such a region is marked by the black rectangle. After further loading to a 0.11 global strain (Figure 5c), it was clearly visible that the average local strain in most of the austenite grains was close to the applied global strain. This indicated that the overall strain on the microscopic level at this applied strain was homogeneously distributed except for a few austenite grains.
Figure 5d illustrates the EBSD map of the grain boundaries and α′-martensite particles overlaid on top of the local strain map at the end of the test (macroscopic strain of 0.19). Martensitic phase transformation was notably limited in the majority of the regions with a low plastic strain. The higher strain values in the strain map correlated with areas where large α′-martensite islands were formed in the microstructure (see areas shown by two ellipse symbols). The size of the martensite particles formed at this high strain rate, however, was small when compared with the size of the martensite particles observed at the lower strain rate of 10−3 s−1 (compare Figure 4d and Figure 5d). Moreover, in the areas where the local microscopic strain was close to the applied macroscopic strain (for example, see the area indicated by the rectangle), a large number of small α′-martensite particles was found.

3.3. Evolution of KAM

The EBSD maps were further utilized to calculate the local misorientations, known as KAM, within the austenite and martensite phases before and after the tensile tests. KAM maps are known as an indicator of strain localization or stored defects [23] and also the geometrically necessary dislocation density [24,25,26]. However, the KAM value depends on the EBSD step size [27], so the comparison of the KAM maps of the specimens deformed at different strain rates was conducted with the same step size and within an equal scan area of 300 × 300 µm2. The KAM maps of both of the undeformed steel samples did not reveal significant gradients inside the initial austenite grains, indicating that the microstructures were almost strain-free and had a low dislocation density. At both strain rates, higher KAM values were found in the regions where α′-martensite particles had been formed. Increased KAM values were also frequently observed in the vicinity of the grain and phase boundaries. This indicated an increase in geometrically necessary dislocations at these locations to accommodate the strain gradients between the austenite grains [24] and the two phases [28]. The KAM maps of the samples deformed at both strain rates to the global strain of 0.2 are presented in the supplementary material, Figure S1.
For the quantitative analysis of the microstructural changes, the KAM statistics of both phases are plotted in Figure 6. In the as-received condition, the average KAM value of the austenite phase was 0.15°. Tensile deformation increased the average KAM of the austenite phase to a higher value of 0.45° at both the studied strain rates. On the other hand, the mean KAM value of newly formed strain-induced α′-martensite particles was found to be 0.65° regardless of the deformation conditions (see Figure 6b). The overall KAM distributions of both the austenite and newly formed α′-martensite phases at the plastic strain of 0.2 were not significantly affected by the strain rate. Similar observations of KAM values at different strain rates have also been reported in a TRIP alloy by Cai et al. [29].

4. Discussion

In the following section, the effect of the strain rate on microstructural-level strain distributions, as well as on the strain-induced transformation behavior of austenite to α′-martensite, will be discussed. In the current study, at the lower strain rate of 10−3 s−1, high local plastic strain concentrations were observed in several locations of the microstructure. In most of these highly localized areas, austenite grains deformed locally close to twice the amount of the applied macroscopic strain. Many martensite particles were formed very close to each other, resulting in large α′-martensite islands in such locations. This finding of areas with the highest local strain values correlating with areas with the formation of strain-induced α′-martensite agrees well with previous studies reported for CrMnNi TRIP steel [5]. The nucleation of α′-martensite particles at highly strained areas in stainless steel has also already been reported by Yeddu et al. [30] from observations using a numerical three-dimensional phase-field model. They found that martensite nucleates both along the grain boundaries as well as in those grain centers, where the strain is higher in comparison to the rest of the material. Similar observations of the formation of α′-martensite particles due to strain localizations on the microstructural level in austenite grains during plastic deformation were made by Lehnert et al. [7] in their investigations of high-alloy austenitic TRIP steel using µDIC. In the present study, it was also observed that there were some areas with high local strains, but no martensite particles were formed. This is reasonable, since there are other factors that also influence the formation of strain-induced martensite, such as grain orientation [31], stress triaxiality [32], and the initial grain size of the austenite phase [33,34,35].
In the current study, a more homogeneous microscale strain evolution was seen at the true strains of 0.055 and 0.11 at the higher strain rate compared to the lower rate, where microscopic strains were more heterogeneously distributed (Figure 4b,c and Figure 5b,c). However, after deformation to a 0.19 true strain at the higher strain rate, a similar trend in the formation of martensite islands in the areas of high local strain was observed, and a similar heterogeneous local strain distribution could be seen in the microstructure. Furthermore, the KAM distributions indicated that the local misorientations of the deformed parent austenite grains and the strain-induced α′-martensite particles evolved similarly at the two studied strain rates.
The EBSD data were further analyzed with MTEX 5.8.1 [36], and the minimum distances between the martensite particles of similar average sizes (as illustrated in Figure 7a) were calculated using the centroids of the particles. The measured distances between the particles, therefore, do not indicate the minimum distance of any martensite particles, rather they indicate the distance of two particles of approximately the same size. Additional EBSD data from interrupted tension tests carried out at strain rates of 2 × 10⁻⁴ s−1 and 0.5 s−1 are available from the previous work presented in ref. [18]. The average minimum distance of martensite particles, as described above, at different strain rates and deformation conditions is shown in Figure 7b. From the Figure, it can be seen that at the lower strain rates of 2 × 10⁻⁴ s−1 and 10−3 s−1, the average minimum distance between the similar size martensite particles was in the range of 1–6 µm, independent of the size of the particle. At the lower strain rates, the α′-martensite particles grew notably, leading to the formation of large martensite islands, which were found close to each other. When the strain rate was increased, the number of martensite particles in the microstructure after deformation was comparable to that observed after the low strain rate deformation, but there was a significant difference in the particle size. Large martensite islands were not readily formed during the higher strain rate deformation. This is very evident in Figure 7b, which shows that the size of the largest martensite islands decreased with an increase in the strain rate. It is also interesting to note that the average minimum distance between the martensite particles increased with an increase in the particle area at the higher strain rate. This suggests that at the higher strain rates, the nucleated martensite particles did not grow significantly, they did not form larger islands of many particles, and the particles remained as small martensite particles isolated from one another. This then resulted in a lower global phase transformation rate and also a lower strain hardening rate at the higher strain rate compared to that observed at the lower strain rate. However, when comparing the microstructures in Figure 4d and Figure 5d, the morphology of the strain-induced α′-martensite particles appeared very similar at both the strain rates; the morphology was irregular and blocky, as demonstrated by Murr et al. [37] based on TEM examinations of 304 stainless steel. That is, the only major difference between the studied strain rates seems to be the clustering tendency of the α′-martensite.
In our previous study [18], EBSD characterization was carried out on a relatively small region of interest (95 × 95 µm2). It was observed that there were differences in size distributions and clustering of the martensite particles between the different strain rates. The present data, which was based on a notably larger inspection area (300 × 300 µm2), verified this finding. Moreover, the average deformation increment before unloading in the previous study was about 5%, and the estimated macroscopic heating (per increment) of the specimen at the high strain rate test was around 5 °C, which, even though being quite small, might still affect the phase transformation rate. Therefore, in the present study, the macroscopic adiabatic heating of the specimen was avoided completely by utilizing a lower maximum strain rate and also smaller deformation increments. The high strain rate test was macroscopically isothermal, with a maximum increase of 1 °C as verified by the IR measurements.
These findings suggest that macroscopic heating of the specimens cannot be the reason for the reduced α′-martensite growth at the higher strain rates. However, more pronounced adiabatic heating, which suppresses phase transformation, may take place at the microstructural level during high strain rate deformation, as proposed earlier by Talonen [38]. Recent crystal plasticity modeling [39] in the same 301LN metastable steel has produced results supporting this theory. Using these models, it has been shown that the heat generation from dislocation slip and latent heat from the phase transformation increase the grain scale temperature more than that observed in the macroscopic experiment. The heat originating from plastic work and the latent heat of martensitic phase transformation may result in a non-uniform temperature distribution in the microstructure. This leads to local “hot spots” where the temperature is notably higher than in other locations, inhibiting the growth of α′-martensite particles. A similar hypothesis was also presented based on the results of strain rate jump tests in the same metastable austenitic steel [40]. In this type of experiment, the average bulk temperature of the specimen did not increase suddenly after the upward strain rate jump, but an immediate decrease in the bulk phase transformation rate at the high strain rate was observed.

5. Conclusions

The effects of the strain rate on the evolution of microscale strain fields and martensitic phase transformation in a metastable austenitic stainless steel EN 1.4318-2B were studied by means of µDIC analysis on optical images and microstructural characterization. Quasi in-situ macroscopic tension tests were carried out sequentially at two strain rates, 10−3 and 10−1 s−1, using a small strain increment of 1.3% to avoid notable macroscopic adiabatic heating at the higher strain rate. The microstructural evolution was also observed with EBSD before and after the experiments. Finally, the EBSD measurements were superimposed onto a contour plot of the local strain fields. Based on the results obtained, the following conclusions were drawn:
  • The increase in the local strain in the microstructure favored strain-induced martensitic phase transformation. In the studied deformation conditions, large α′-martensite islands were often found in areas with high local strains.
  • The growth of α′-martensite particles was delayed in the high strain rate test, and microstructural-level strain distribution also remained more homogeneous in the earlier stages of plastic deformation.
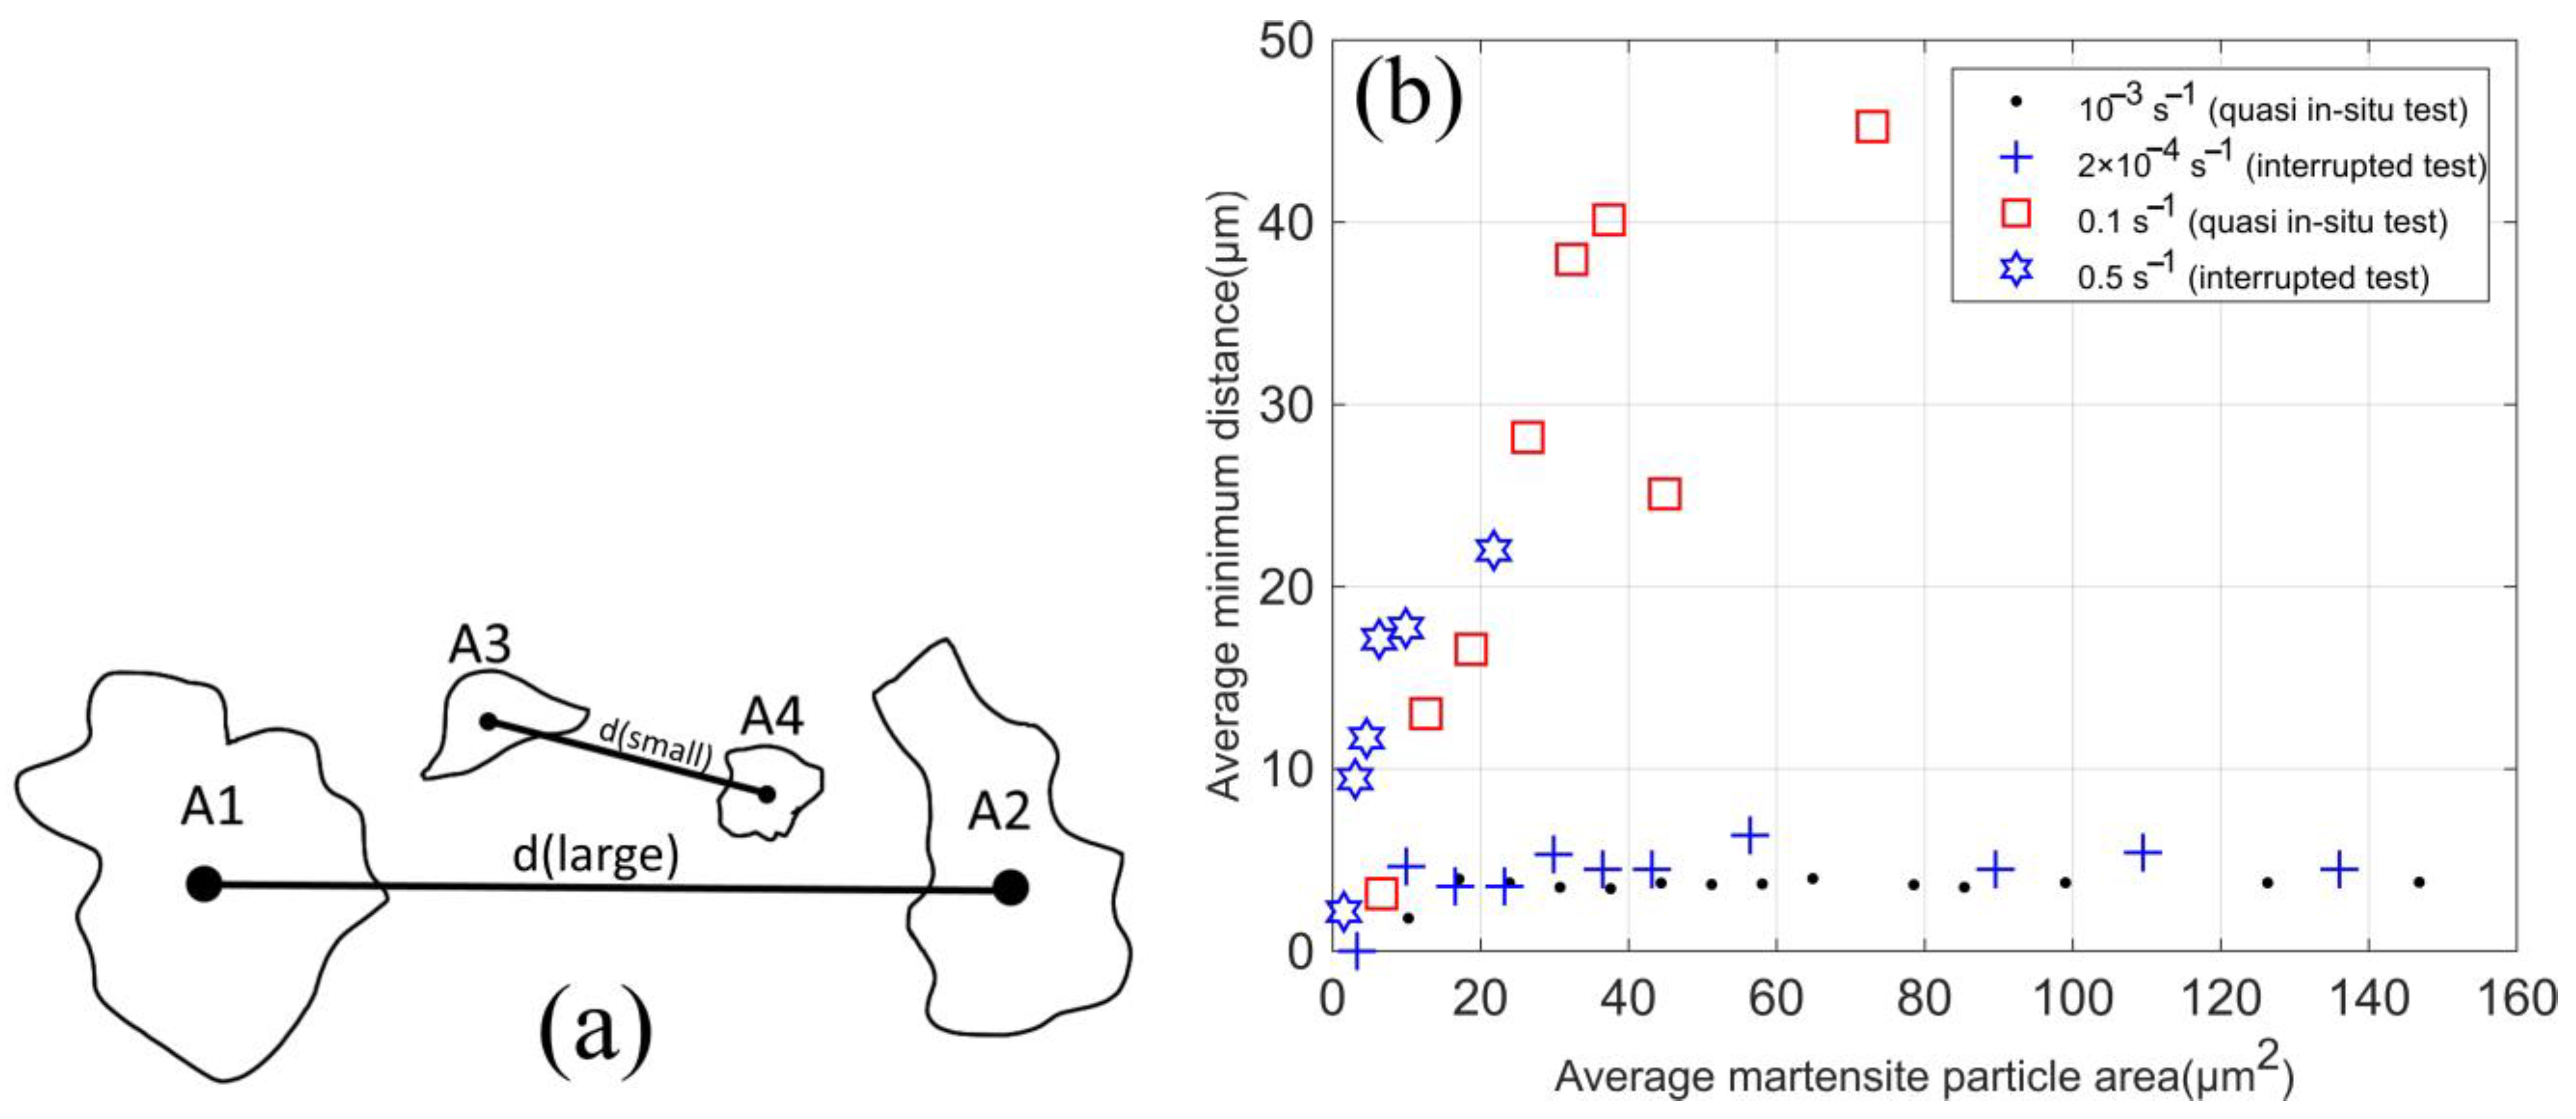
  • Large martensite islands were formed close to each other at the lower strain rate. In contrast, at the higher strain rate, the martensite islands were smaller and also isolated from one another.
  • The strain rate did not significantly affect the overall kernel average misorientation (KAM) distributions of either the austenite or martensite phases.
  • The effects of the strain rate on the material response and microstructural evolution were studied in loading conditions, where the bulk material heating was very small, as verified by the in-situ IR measurements. This implies that the increase in strain rate affects the phase transformation via additional mechanisms, such as localized microstructural heating.

Supplementary Materials

The following supporting information can be downloaded at: https://www.mdpi.com/article/10.3390/met13020207/s1, Figure S1: The phase maps and corresponding KAM maps of the deformed 301LN metastable steel samples at two different strain rates.

Author Contributions

Conceptualization, L.P., M.I. and M.H.; methodology, L.P.; software, L.P.; investigation, L.P., S.B. and G.C.S.; resources, M.H.; data curation, L.P.; writing—original draft preparation, L.P.; writing—review and editing, L.P., G.C.S., M.I. and M.H.; supervision, M.I. and M.H.; funding acquisition, M.H. All authors have read and agreed to the published version of the manuscript.

Funding

This research work was funded by the Tampere University graduate school.

Data Availability Statement

The data can be made available upon reasonable request to the corresponding author.

Acknowledgments

This work made use of the Tampere Microscopy Center facilities at Tampere University.

Conflicts of Interest

The authors declare no conflict of interest.

References

  1. Rosen, A.; Jago, R.; Kjer, T. Tensile Properties of Metastable Stainless Steels. J. Mater. Sci. 1972, 7, 870–876. [Google Scholar] [CrossRef]
  2. Hecker, S.S.; Stout, M.G.; Staudhammer, K.P.; Smith, J.L. Effects of Strain State and Strain Rate on Deformation-Induced Transformation in 304 Stainless Steel: Part I. Magnetic Measurements and Mechanical Behavior. Metall. Mater. Trans. A 1982, 13, 619–626. [Google Scholar] [CrossRef]
  3. Talonen, J.; Nenonen, P.; Pape, G.; Hänninen, H. Effect of Strain Rate on the Strain-Induced γ → α′-Martensite Transformation and Mechanical Properties of Austenitic Stainless Steels. Metall. Mater. Trans. A 2005, 36, 421–432. [Google Scholar] [CrossRef]
  4. Isakov, M.; Hiermaier, S.; Kuokkala, V.T. Effect of Strain Rate on the Martensitic Transformation During Plastic Deformation of an Austenitic Stainless Steel. Metall. Mater. Trans. A 2015, 46, 2352–2355. [Google Scholar] [CrossRef]
  5. Weidner, A.; Biermann, H. Combination of Different In Situ Characterization Techniques and Scanning Electron Microscopy Investigations for a Comprehensive Description of the Tensile Deformation Behavior of a CrMnNi TRIP/TWIP Steel. JOM 2015, 67, 1729–1747. [Google Scholar] [CrossRef]
  6. Padilla, H.A.; Lambros, J.; Beaudoin, A.J.; Robertson, I.M. Relating Inhomogeneous Deformation to Local Texture in Zirconium through Grain-Scale Digital Image Correlation Strain Mapping Experiments. Int. J. Solids Struct. 2012, 49, 18–31. [Google Scholar] [CrossRef] [Green Version]
  7. Lehnert, R.; Weidner, A.; Schimpf, C.; Wendler, M.; Biermann, H. Martensite Formation during Tensile Deformation of High-Alloy TRIP Steel after Quenching and Partitioning Route Investigated by Digital Image Correlation. Materialia 2019, 8, 100498. [Google Scholar] [CrossRef]
  8. Delpueyo, D.; Grédiac, M.; Balandraud, X.; Badulescu, C. Investigation of Martensitic Microstructures in a Monocrystalline Cu–Al–Be Shape Memory Alloy with the Grid Method and Infrared Thermography. Mech. Mater. 2012, 45, 34–51. [Google Scholar] [CrossRef]
  9. Mirmohammad, H.; Gunn, T.; Kingstedt, O.T. In-Situ Full-Field Strain Measurement at the Sub-Grain Scale Using the Scanning Electron Microscope Grid Method. Exp. Tech. 2021, 45, 109–117. [Google Scholar] [CrossRef]
  10. Tatschl, A.; Kolednik, O. A New Tool for the Experimental Characterization of Micro-Plasticity. Mater. Sci. Eng. A 2003, 339, 265–280. [Google Scholar] [CrossRef]
  11. Di Gioacchino, F.; Quinta da Fonseca, J. Plastic Strain Mapping with Sub-Micron Resolution Using Digital Image Correlation. Exp. Mech. 2013, 53, 743–754. [Google Scholar] [CrossRef]
  12. Paulsen, C.O.; Fagerholt, E.; Børvik, T.; Westermann, I. Comparing In Situ DIC Results from an Etched Surface with a Gold Speckled Surface. Metals 2019, 9, 820. [Google Scholar] [CrossRef] [Green Version]
  13. Kammers, A.D.; Daly, S. Digital Image Correlation under Scanning Electron Microscopy: Methodology and Validation. Exp. Mech. 2013, 53, 1743–1761. [Google Scholar] [CrossRef]
  14. Lim, H.; Carroll, J.D.; Battaile, C.C.; Buchheit, T.E.; Boyce, B.L.; Weinberger, C.R. Grain-Scale Experimental Validation of Crystal Plasticity Finite Element Simulations of Tantalum Oligocrystals. Int. J. Plast. 2014, 60, 1–18. [Google Scholar] [CrossRef]
  15. Das, Y.B.; Forsey, A.N.; Simm, T.H.; Perkins, K.M.; Fitzpatrick, M.E.; Gungor, S.; Moat, R.J. In Situ Observation of Strain and Phase Transformation in Plastically Deformed 301 Austenitic Stainless Steel. Mater. Des. 2016, 112, 107–116. [Google Scholar] [CrossRef] [Green Version]
  16. Sutton, M.A.; Li, N.; Garcia, D.; Cornille, N.; Orteu, J.J.; McNeill, S.R.; Schreier, H.W.; Li, X.; Reynolds, A.P. Scanning Electron Microscopy for Quantitative Small and Large Deformation Measurements Part II: Experimental Validation for Magnifications from 200 to 10,000. Exp. Mech. 2007, 47, 789–804. [Google Scholar] [CrossRef]
  17. Aydıner, C.C.; Telemez, M.A. Multiscale Deformation Heterogeneity in Twinning Magnesium Investigated with in Situ Image Correlation. Int. J. Plast. 2014, 56, 203–218. [Google Scholar] [CrossRef]
  18. Pun, L.; Soares, G.C.; Isakov, M.; Hokka, M. Effects of Strain Rate on Strain-Induced Martensite Nucleation and Growth in 301LN Metastable Austenitic Steel. Mater. Sci. Eng. A 2022, 831, 142218. [Google Scholar] [CrossRef]
  19. LaVision: StrainMaster System Components and Accessories. Available online: https://www.lavision.de/en/download.php?id=3930 (accessed on 1 August 2022).
  20. Soares, G.C.; Vázquez-Fernández, N.I.; Hokka, M. Thermomechanical Behavior of Steels in Tension Studied with Synchronized Full-Field Deformation and Temperature Measurements. Exp. Tech. 2021, 45, 627–643. [Google Scholar] [CrossRef]
  21. Staudhammer, K.P.; Murr, L.E.; Hecker, S.S. Nucleation and Evolution of Strain-Induced Martensitic (b.c.c.) Embryos and Substructure in Stainless Steel: A Transmission Electron Microscope Study. Acta Metall. 1983, 31, 267–274. [Google Scholar] [CrossRef]
  22. Vazquez-Fernandez, N.I.; Soares, G.C.; Smith, J.L.; Seidt, J.D.; Isakov, M.; Gilat, A.; Kuokkala, V.T.; Hokka, M. Adiabatic Heating of Austenitic Stainless Steels at Different Strain Rates. J. Dyn. Behav. Mater. 2019, 5, 221–229. [Google Scholar] [CrossRef] [Green Version]
  23. Tiamiyu, A.A.; Szpunar, J.A.; Odeshi, A.G. Strain Rate Sensitivity and Activation Volume of AISI 321 Stainless Steel under Dynamic Impact Loading: Grain Size Effect. Mater. Charact. 2019, 154, 7–19. [Google Scholar] [CrossRef]
  24. Choi, J.Y.; Ji, J.H.; Hwang, S.W.; Park, K.-T. TRIP Aided Deformation of a Near-Ni-Free, Mn–N Bearing Duplex Stainless Steel. Mater. Sci. Eng. A 2012, 535, 32–39. [Google Scholar] [CrossRef]
  25. Wang, M.; Huang, M.X. Abnormal TRIP Effect on the Work Hardening Behavior of a Quenching and Partitioning Steel at High Strain Rate. Acta Mater. 2020, 188, 551–559. [Google Scholar] [CrossRef]
  26. Hossain, R.; Pahlevani, F.; Sahajwalla, V. Revealing the Mechanism of Extraordinary Hardness without Compensating the Toughness in a Low Alloyed High Carbon Steel. Sci. Rep. 2020, 181. [Google Scholar] [CrossRef] [Green Version]
  27. Gussev, M.N.; Leonard, K.J. In Situ SEM-EBSD Analysis of Plastic Deformation Mechanisms in Neutron-Irradiated Austenitic Steel. J. Nucl. Mater. 2019, 517, 45–56. [Google Scholar] [CrossRef]
  28. Chen, L.; Jia, Q.; Hao, S.; Wang, Y.; Peng, C.; Ma, X.; Zou, Z.; Jin, M. The Effect of Strain-Induced Martensite Transformation on Strain Partitioning and Damage Evolution in a Duplex Stainless Steel with Metastable Austenite. Mater. Sci. Eng. A 2021, 814, 141173. [Google Scholar] [CrossRef]
  29. Cai, M.H.; Zhu, W.J.; Stanford, N.; Pan, L.B.; Chao, Q.; Hodgson, P.D. Dependence of Deformation Behavior on Grain Size and Strain Rate in an Ultrahigh Strength-Ductile Mn-Based TRIP Alloy. Mater. Sci. Eng. A 2016, 653, 35–42. [Google Scholar] [CrossRef]
  30. Yeddu, H.K.; Lookman, T.; Saxena, A. Strain-Induced Martensitic Transformation in Stainless Steels: A Three-Dimensional Phase-Field Study. Acta Mater. 2013, 61, 6972–6982. [Google Scholar] [CrossRef]
  31. Gey, N.; Petit, B.; Humbert, M. Electron Backscattered Diffraction Study of ε/α′ Martensitic Variants Induced by Plastic Deformation in 304 Stainless Steel. Metall. Mater. Trans. A 2005, 36, 291–3299. [Google Scholar] [CrossRef]
  32. Beese, A.M.; Mohr, D. Effect of Stress Triaxiality and Lode Angle on the Kinetics of Strain-Induced Austenite-to-Martensite Transformation. Acta Mater. 2011, 59, 2589–2600. [Google Scholar] [CrossRef]
  33. Varma, S.K.; Kalyanam, J.; Murk, L.E.; Srinivas, V. Effect of Grain Size on Deformation-Induced Martensite Formation in 304 and 316 Stainless Steels during Room Temperature Tensile Testing. J. Mater. Sci. Lett. 1994, 13, 107–111. [Google Scholar] [CrossRef]
  34. Kisko, A.; Misra, R.D.K.; Talonen, J.; Karjalainen, L.P. The Influence of Grain Size on the Strain-Induced Martensite Formation in Tensile Straining of an Austenitic 15Cr–9Mn–Ni–Cu Stainless Steel. Mater. Sci. Eng. A 2013, 578, 408–416. [Google Scholar] [CrossRef]
  35. Naghizadeh, M.; Mirzadeh, H. Effects of Grain Size on Mechanical Properties and Work-Hardening Behavior of AISI 304 Austenitic Stainless Steel. Steel Res. Int. 2019, 90, 1900153. [Google Scholar] [CrossRef]
  36. Bachmann, F.; Hielscher, R.; Schaeben, H. Grain Detection from 2d and 3d EBSD Data—Specification of the MTEX Algorithm. Ultramicroscopy 2011, 111, 1720–1733. [Google Scholar] [CrossRef]
  37. Murr, L.E.; Staudhammer, K.P.; Hecker, S.S. Effects of Strain State and Strain Rate on Deformation-Induced Transformation in 304 Stainless Steel: Part II. Microstructural Study. Metall. Trans. A 1982, 13, 627–635. [Google Scholar] [CrossRef]
  38. Talonen, J. Effect of Strain-Induced α′-Martensite Transformation on Mechanical Properties of Metastable Austenitic Stainless Steels. Ph.D. Thesis, Helsinki University of Technology, Espoo, Finland, 2007. [Google Scholar]
  39. Lindroos, M.; Isakov, M.; Laukkanen, A. Crystal Plasticity Modeling of Transformation Plasticity and Adiabatic Heating Effects of Metastable Austenitic Stainless Steels. Int. J. Solids Struct. 2022, 236–237, 111322. [Google Scholar] [CrossRef]
  40. Vázquez-Fernández, N.I.; Isakov, M.; Hokka, M. Strain Hardening and Adiabatic Heating of Stainless Steels After a Sudden Increase of Strain Rate. J. Dyn. Behav. Mater. 2022, 8, 316–321. [Google Scholar] [CrossRef]
Figure 1. (a) Schematic picture of the tensile specimen (dimensions are in mm), (b) optical microscope image showing the indentation marks on the area of interest (300 × 300 µm2), and (c) the same area observed with the stereo-microscope of the loading setup.
Metals 13 00207 g001
Figure 2. Experimental setup comprising the Psylotech µTS test system, stereo microscope, and infrared camera.
Metals 13 00207 g002
Figure 3. True stress vs. strain curves of the quasi in-situ and continuous tensile tests at nominal strain rates of (a) 10−3 s−1 and (b) 10−1 s−1. The drops in the curves were caused by the stress relaxation that occurred during holding periods.
Metals 13 00207 g003
Figure 4. (a) Undeformed microstructure, and µDIC maps overlaid with EBSD data of the specimen deformed to global strains of (b) εpl = 0.057, (c) εpl = 0.112, and (d) εpl = 0.2 at the strain rate of 10−3 s−1. The color coding represents the microscopic strain distribution, the black lines represent the grain boundaries, and the green color in (d) represents the transformed α′-martensite particles after deformation. The markings provided with different symbols in the Figure correspond to the same regions of the microstructure at various macroscopic strain levels. Additional information can be found in the text.
Metals 13 00207 g004
Figure 5. (a) Undeformed microstructure, and µDIC maps overlaid with EBSD measurements of the specimen deformed to global strains of (b) εpl = 0.055, (c) εpl = 0.11, and (d) εpl = 0.19 at the strain rate of 10−1 s−1. The color coding and annotations are the same as in Figure 4.
Metals 13 00207 g005
Figure 6. KAM distributions of (a) austenite and (b) martensite phases at two different strain rates.
Metals 13 00207 g006
Figure 7. (a) Schematic illustration of the calculation of the minimum distance between particles of certain similar sizes (a) from their centroid, and (b) the average minimum distance between the α′-martensite particles of similar size as a function of their average areas at different strain rates. The quasi in-situ tests were carried out to a true strain of 0.2 with increments of 1.3% true strain, and the interrupted tests were carried out to a true strain of 0.18 with larger increments of 5%. Interrupted test data were adopted from [18].
Metals 13 00207 g007
Table 1. Chemical composition of AISI 301LN steel in wt.%.
MaterialCSiMnPSCrNiNFe
301LN0.0220.381.180.0270.00217.46.70.151Bal.
Table 2. µDIC processing parameters used for both strain rate experiments.
Image scale factor (pixel/µm)4.34
Correlation methodSum-of-differential
Matching criteriaWVSSD *
Subset size (pixel)61
Step size (pixel)17
VSG size (pixel)78
Interpolant7-tap B-spline
Subset shape functionNonlinear second order
Subset weighting functionGaussian
Camera noise (%)2.75–3.3
Displacement resolution (µm)0.016–0.018
Strain resolution (µm/µm)2.14 × 10−3–3.46 × 10⁻³
* WVSSD: weighted-variables-based sum of squared differences.
Disclaimer/Publisher’s Note: The statements, opinions and data contained in all publications are solely those of the individual author(s) and contributor(s) and not of MDPI and/or the editor(s). MDPI and/or the editor(s) disclaim responsibility for any injury to people or property resulting from any ideas, methods, instructions or products referred to in the content.

