Article

Electrodeposition of Tin-Reduced Graphene Oxide Composite from Deep Eutectic Solvents Based on Choline Chloride and Ethylene Glycol

1
Center of Surface Science and Nanotechnology, University Politehnica Bucharest, Splaiul Independentei 313, 060042 Bucharest, Romania
2
Department of Inorganic Chemistry, Physical Chemistry and Electrochemistry, University Politehnica of Bucharest, 132 Calea Grivitei, 010737 Bucharest, Romania
*
Author to whom correspondence should be addressed.
Metals 2023, 13(2), 203; https://doi.org/10.3390/met13020203
Submission received: 19 December 2022 / Revised: 9 January 2023 / Accepted: 16 January 2023 / Published: 19 January 2023

Abstract

:
Some experimental results regarding the direct electrodeposition of tin-reduced graphene oxide composite (Sn-rGO) compared to the electrodeposition of tin metal (Sn) from a deep eutectic solvent (DES), namely using choline chloride-ethylene glycol eutectic mixtures, are presented. Raman spectroscopy demonstrated that GO is also reduced during the tin electrodeposition. Scanning electron microscopy (SEM) confirmed the presence of incorporated graphene related material in the composite film. X-ray diffraction patterns showed that the presence of rGO in the deposit diminished preferred orientation of Sn growth along the planes (101), (211), (301), and (112). The analysis of current-time transients involving Scharifker & Hills model has shown that Sn-rGO composite deposition process corresponds to a nucleation and tridimensional growth controlled by diffusion, with nucleation evolving from progressive to instantaneous upon increasing the overpotential. Diffusion coefficients at 25 °C of 9.4 × 10⁻⁷ cm2 s−1 for Sn(II) species in the absence and of 14.1 × 10⁻⁷ cm2 s−1 in the presence of GO, were determined. The corrosion performance has been assessed through the analysis of the recorded potentiodynamic polarization curves and of the electrochemical impedance spectra during continuous immersion in aerated 0.5 M NaCl aqueous solution at 25 °C for 144 h. A slight improvement of the corrosion performance in the case of the Sn-rGO composite coatings was noticed, as compared to pure Sn ones. Furthermore, the solderability performance has been evaluated. The solder joints showed a proper adhesion to the substrate with no fractures, and wetting angles around 44° have been determined, suggesting adequate solderability characteristics.

1. Introduction

Graphene-based materials attracted in recent years a tremendous amount of interest due to their unique thermal, mechanical, and electrical properties [1,2,3], which make them suitable to be used as fillers in the electrochemically prepared composite coatings [4,5].
Generally, it is largely accepted that electrodeposition procedure represents a lower cost route, meanwhile allowing the fabrication of various protective and functional coatings under relatively high deposition rates and microstructure control. A large range of metal and alloy composite coatings incorporating various graphene related materials could be produced, having applications in various areas including industrial and medical processes, sensors, energy and electronics [4,5,6,7].
As graphene (Gr) shows a poor dispersibility in aqueous solutions because of its hydrophobicity [5,8], the use of hydrophilic graphene oxide (GO) appeared to be preferable in order to provide uniform dispersions in the electrolytes. Since GO is an electrical insulator [9], a deoxygenation treatment of GO is required to restore the π-network, which in turn recovers the electrical conductivity of the resulting graphene materials [10]. Various routes for GO reduction are possible, based on chemical [11,12], photocatalytic [13,14], thermal [15,16], and electrochemical processes [17,18,19,20]. The electrochemical reduction of GO can be carried out via one-step and two-step approaches. In the one-step electrochemical approach, the GO sheets are directly electroreduced from an aqueous colloidal suspension to produce thin films on an electrode surface [17]. A phosphate buffer solution can be used both as a supporting and buffer aqueous electrolyte in this process [18]. Other electrolytes based on NaCl [19] and Na2SO4 [20] solutions have also been reported as disperse media for GO colloidal suspensions during the electrochemical reduction process.
The two-step electrochemical reduction firstly requires a pre-deposition of GO onto the electrode substrate prior to GO electroreduction.
Due to the stable dispersion in water of GO, the one-step co-electrodeposition of graphene oxide with metals was usually developed to prepare metal/graphene composites, as one of the most suitable strategies [4,5,6].
The metal/graphene composite films have been previously prepared from aqueous electrolytes containing anionic noble metal complexes, such as [AuCl4], [PtCl6]2−, [PdCl4]2− [21,22,23]. Hilder et al. [24] have reported, for the first time, a new method for the synthesis of Zn/graphene nanocomposite film by one-step co-electrodeposition technique using cationic precursors, such as Zn2+ ions. Subsequently, the preparation from aqueous electrolytes with cationic precursors of other metal/graphene composites with Ni [25], Cu [26], Co [27] or Sn [28,29] has been reported.
The development of electrodeposited Sn-GO composite coatings has shown promising electrochemical performance related to various industrial applications, such as corrosion protection, electronics fabrication or anode material for lithium-ion batteries [28,30]. In addition, the incorporation of graphene-related materials into Sn and Sn alloys acting as lead-free solders (i.e., SnAgCu, SnBi, SnZn and SnIn) facilitated an improvement of their wetting property, but an insignificant change in their melting point [31,32,33,34]. Table 1 briefly presents the main results from previous reports regarding the electrodeposition of Sn and Sn alloy composites with graphene related materials involving aqueous electrolytes.
While the reinforcement of metal and alloy coatings with graphene derivatives may provide enhanced characteristics mainly from mechanical, tribological, and corrosion protection viewpoints, their low dispersibility due to strong van der Waals interactions that cause agglomerates, represents a critical point. Currently, composite coatings with homogeneous Gr, GO, or rGO distribution can be obtained involving various surfactants or dispersing agents and functionalization techniques [4,29,37,38].
In the past decades, ionic liquids (ILs) appeared to be suitable dispersants for various carbon-based nanomaterials, including multiwall carbon nanotubes (MWCNTs) and graphene-related materials [39,40]. In addition, the wider potential window reduces the possibility of any side reactions occurring that can affect the metal deposition onto the substrate, such as hydrogen evolution. However, the usage of ILs is hindered by their high cost and sensitivity to the presence of water. The so-called Deep Eutectic Solvents (DESs), consisting of mixtures of a quaternary ammonium salt with hydrogen bond donors such as amides, carboxylic acids or alcohols, represent a strong potential substitute to common ILs. They are now widely acknowledged as a new class of ionic liquid analogues as they share many characteristics and properties with conventional ILs. DESs, proven to be cheap and easy to make, are potentially recyclable and biodegradable so they may represent a more environmentally friendly alternative for a wide range of electrochemical processes, including metals and alloys electrodeposition [41,42]. Moreover, in recent years it has been shown that DESs provide stable GO or rGO dispersions [43,44], so that they can be considered suitable electrolytic media to electrodeposit metal-graphene derivatives (Gr, GO, rGO) composite coatings.
The electrodeposition of Sn and Sn alloys attracted an increased interest as they are involved in a large range of industrial applications including light engineering and electronics. Furthermore, due to the health and environmental concerns, especially in electronic industry, though in the automotive or decorative plating ones as well, these coating types could represent ecological alternatives to replace lead-based solders or Ni-Cr decorative coatings [45,46]. In addition, Sn based layers represent a promising anode material for lithium-ion batteries [47].
Sn and Sn alloy coatings could be electrochemically obtained using various DESs consisting in binary mixtures of choline chloride (ChCl) with urea, ethylene glycol, malonic acid, or propylene glycol [46,47,48,49]. While hydrated SnCl2 has been involved as precursor to Sn2+ ions in most of the reported investigations, Vieira et al. [50] used the corresponding tetrabutylammonium chlorometalate salt ([NnBu4][SnCl3]). The analysis of the chronoamperometric behavior has shown that the electrodeposition of Sn on glassy carbon electrode proceeded through 3D-progressive nucleation at low overpotentials and changed to instantaneous nucleation at higher overpotentials.
A significant research effort has been devoted to the development of lead-free solder alloys using electrodeposition as a very convenient route, due to its advantages such as compatibility with photolithography, ease in extending substrate size, environmentally benign and good end properties [51]. Furthermore, the use of DESs during the electrochemical process provides certain advantages as compared to aqueous electrolytes, including a good solubilization of metal salts, less complicated electrolyte formulations and insensitivity towards water and oxygen. Several experimental results reported in the previous literature regarding the fact that electrodeposition of Sn and Sn alloys are also able to act as lead-free solders using DES based electrolytes are briefly summarized in Table 2.
Only a few studies discussed the electrodeposition of metal-graphene/GO composite coatings involving DES based electrolytes. The electrodeposition of zinc-graphene oxide (Zn-GO) composite coatings involving eutectic mixtures of choline chloride-urea has been reported by Li et al. [44]. It has been shown that the use of this solvent allowed excellent dispersion stability of GO sheets without the presence of any additional additives. According to the performed XPS studies, it has been found out that part of oxygen functional groups was removed and the GO was partially reduced during the electrochemical deposition process. In addition, the presence of GO changed the preferred crystal orientation of the Zn from (101) to (002) plane. The Zn-GO composite coatings exhibited better corrosion performance as compared to that of pure Zn ones and the increase in GO content within the deposit facilitated a further improvement of corrosion resistance. Brandao et al. [57] reported the electrodeposition of Sn-reduced graphene oxide (Sn-rGO) composite under potentiostatic and galvanostatic conditions, using choline chloride–ethylene glycol-based DES, also known as Ethaline. The authors firstly prepared rGO using the chemical reduction of GO in the presence of hydrazine and then it was dispersed in the DES based electrolyte under ultrasonic stirring. The performed nucleation investigations have shown that the Sn-rGO deposits were formed through a 3D instantaneous process with growth controlled by diffusion. The XRD and Raman analyses confirmed the rGO incorporation within the Sn matrix. The obtained Sn-rGO composite coatings showed higher roughness but lower electrical conductivity as compared to pure Sn, explained by the presence of the amorphous carbon in the deposit. The assessment of the corrosion performance showed that Sn-rGO composite coatings presented better protective characteristics during long exposure periods to 0.5 M NaCl aggressive solution as compared to pure Sn. Rosoiu et al. [58] investigated the electrodeposition of NiSn-rGO composite coatings from choline chloride: ethylene glycol (1:2 molar ratio) deep eutectic solvent using pulsed current conditions. Dispersed ammonia functionalized GO has been involved to prepare the electrolytes. Based on Raman spectroscopy, it has been shown that, during the electrochemical reduction process, GO was reduced to rGO and incorporated within the NiSn alloy matrix. The successful incorporation of the carbon-based material has been also evidenced through SEM analyses. In addition, changes in the surface morphology, grain size, and surface roughness of NiSn alloy matrix were noticed in the presence of rGO. As a result of the performed accelerated laboratory corrosion tests in 0.5 M NaCl for 336 h, a slight improvement of the corrosion performance was noticed in the case of the NiSn-rGO composite coatings as compared to pure NiSn alloy ones.
Considering all that is presented above, the main aim of the work is the investigation of the electrodeposition of Sn-rGO composite coatings from eutectic mixtures of choline chloride and ethylene glycol. The influence of the applied current density on the physical-chemical characteristics of the resulted composite coating will be studied. The corrosion behavior in 0.5 M NaCl aqueous solution exposure, as well as the solder ability performance, will be also explored. It is worth mentioning here that, to the best of our knowledge, this is the first investigation reporting the direct electrochemical deposition of Sn-rGO composites using DESs, with potential applications as solder layers with improved wettability.

2. Materials and Methods

Choline chloride (HOC2H4N(CH3)3Cl, 99%), anhydrous ethylene glycol (EG, 99.5%), tin dichloride dihydrate (SnCl2·2H2O, 99.9%), and ammonium functionalized graphene oxide (GO, 1 mg/mL dispersion in water), were all purchased from Sigma-Aldrich and used as received. The homogeneous colorless deep eutectic solvent, denoted as ILEG, was formed by stirring the mixture of the two components, choline chloride (ChCl) and ethylene glycol (EG) in a molar ratio of 1:2, at 70 °C for about 30 min. Then, SnCl2 • 2H2O salt was added and the mixture was heated at 85 °C with gentle magnetic stirring until a clear liquid was formed. For co-electrodeposition of Sn-rGO composite, the graphene oxide was dispersed by ultrasonication in ILEG bath containing SnCl2 • 2H2O for 60 min.
Both Sn metal and Sn-rGO composite bulk coatings were prepared in a two-electrode cell under galvanostatic control at current densities in the range 15–30 mA cm−2 using a direct current power supply (0–3 A, 0–30 V). The constant electric charge of 18 C cm−2 was used for all of the deposition experiments to ensure that the nominal thickness of the deposits would be relatively constant. All electrochemical deposits were obtained from ILEG, containing 0.7 M SnCl2 with/without 20 mg L−1 GO, at 70 °C, under constant magnetic stirring. In order to have the same water content in the electrolyte without GO, 20 mL L−1 of distilled water (MilliQ water, 18 MΩ resistance) was added.
The films were deposited on copper plates (30 × 25 × 0.2 mm, having a constant geometrical surface of 7.5 cm2 subjected to the electrodeposition process). A platinized titanium mesh was used as counter electrode. Prior the deposition experiment, the copper surface was cleaned with acetone and microetched for 30 s in an aqueous solution of 5% (vol.) H2SO4 and 10% (vol.) H2O2 (30% wt.), followed by rinsing with distilled water and drying. After deposition, the samples were rinsed with hot distilled water, acetone and air dried.
Cyclic voltammetry (CV) and chronoamperometry (CA) studies were carried out in a glass cell with three electrodes: a glassy carbon (GC) disk (Pine, 0.196 cm2) as working electrode, a platinum mesh as counter electrode, and a silver wire placed directly in DES based electrolyte as the quasi-reference electrode. The CV experiments were performed by applying various sweep rates in the range of 5–100 mV s−1. These investigations were undertaken using an Autolab PGSTAT 12 potentiostat (Eco Chemie–Metrohm Autolab, Utrecht, The Netherlands) controlled with GPES (v. 4.9) software. Before each experiment, the GC working electrode was polished with 0.3 µm alumina paste (Struers, Cleveland, OH, USA), rinsed with distilled water and air dried.
The surface morphology of the electrochemically prepared Sn and Sn-rGO thin films was analyzed by scanning electron microscopy (SEM) using a SU8230 HITACHI (High-Technologies Corporation, Tokyo, Japan) equipped with the energy dispersive X-ray detector (EDX, Oxford Instruments, High Wycombe, UK).
The phases and structures of the deposits were investigated by X-ray diffractometry (XRD) (High Resolution SmartLab X-ray diffractometer Rigaku, Rigaku, Tokyo, Japan) 9 kW, with rotating anode) using Cu Kα radiation with wavelength of 1.5406 Å. The phase identification was made by referring to the ICDD (PDF-2) database.
Confocal micro-Raman spectroscopy technique was applied for spectroscopic studies of the pristine GO and Sn-rGO coatings in ambient conditions using a LabRam HR800 system (Horiba Jobin Yvon, Longjumeau CEDEX France). All the Raman spectra were generated by exposing the specimens to a 2 mW, 532.18 nm green excitation laser and dispersing the emitted signal onto the CCD detector using a 600 lines/mm grating with a spectral resolution around 0.6 cm−1.
In order to get information on the corrosion performance of the electrodeposited Sn-rGO composite coatings, accelerated laboratory tests consisting in continuous immersion in aerated 0.5 M NaCl aqueous solution at 25 °C up to 144 h were performed, with intermediary visual examinations. Potentiodynamic polarization curves at a sweeping rate of 1 mV s−1 and electrochemical impedance spectroscopy (EIS) at open-circuit potential using 0.5 M NaCl solution were recorded against Ag/AgCl/KCl sat reference electrode and Pt mesh counter electrode. The geometrical surface of the working electrode in the electrochemical tests was 0.2 cm2. EIS spectra, recorded with 10 mV ac voltage within 100 kHz–0.1 Hz frequency ranges were processed using ZView 2.4 software from Scribner Association Inc., Derek Johnson, NC, USA. A minimum of 3 pieces of the deposited Sn and Sn-rGO coatings onto copper metallic substrate (70 × 25 mm) were subjected to the immersion test.
The solderability performance was evaluated by dipping it in molten SAC 305 (Sn3.0Ag0.5Cu) alloy and by measurement of the angle of wettability that provides information on the degree of solder contact and strength of the solder joint, according to IPC-TM-650 [59] and IPC-610E [60] procedures.

3. Results

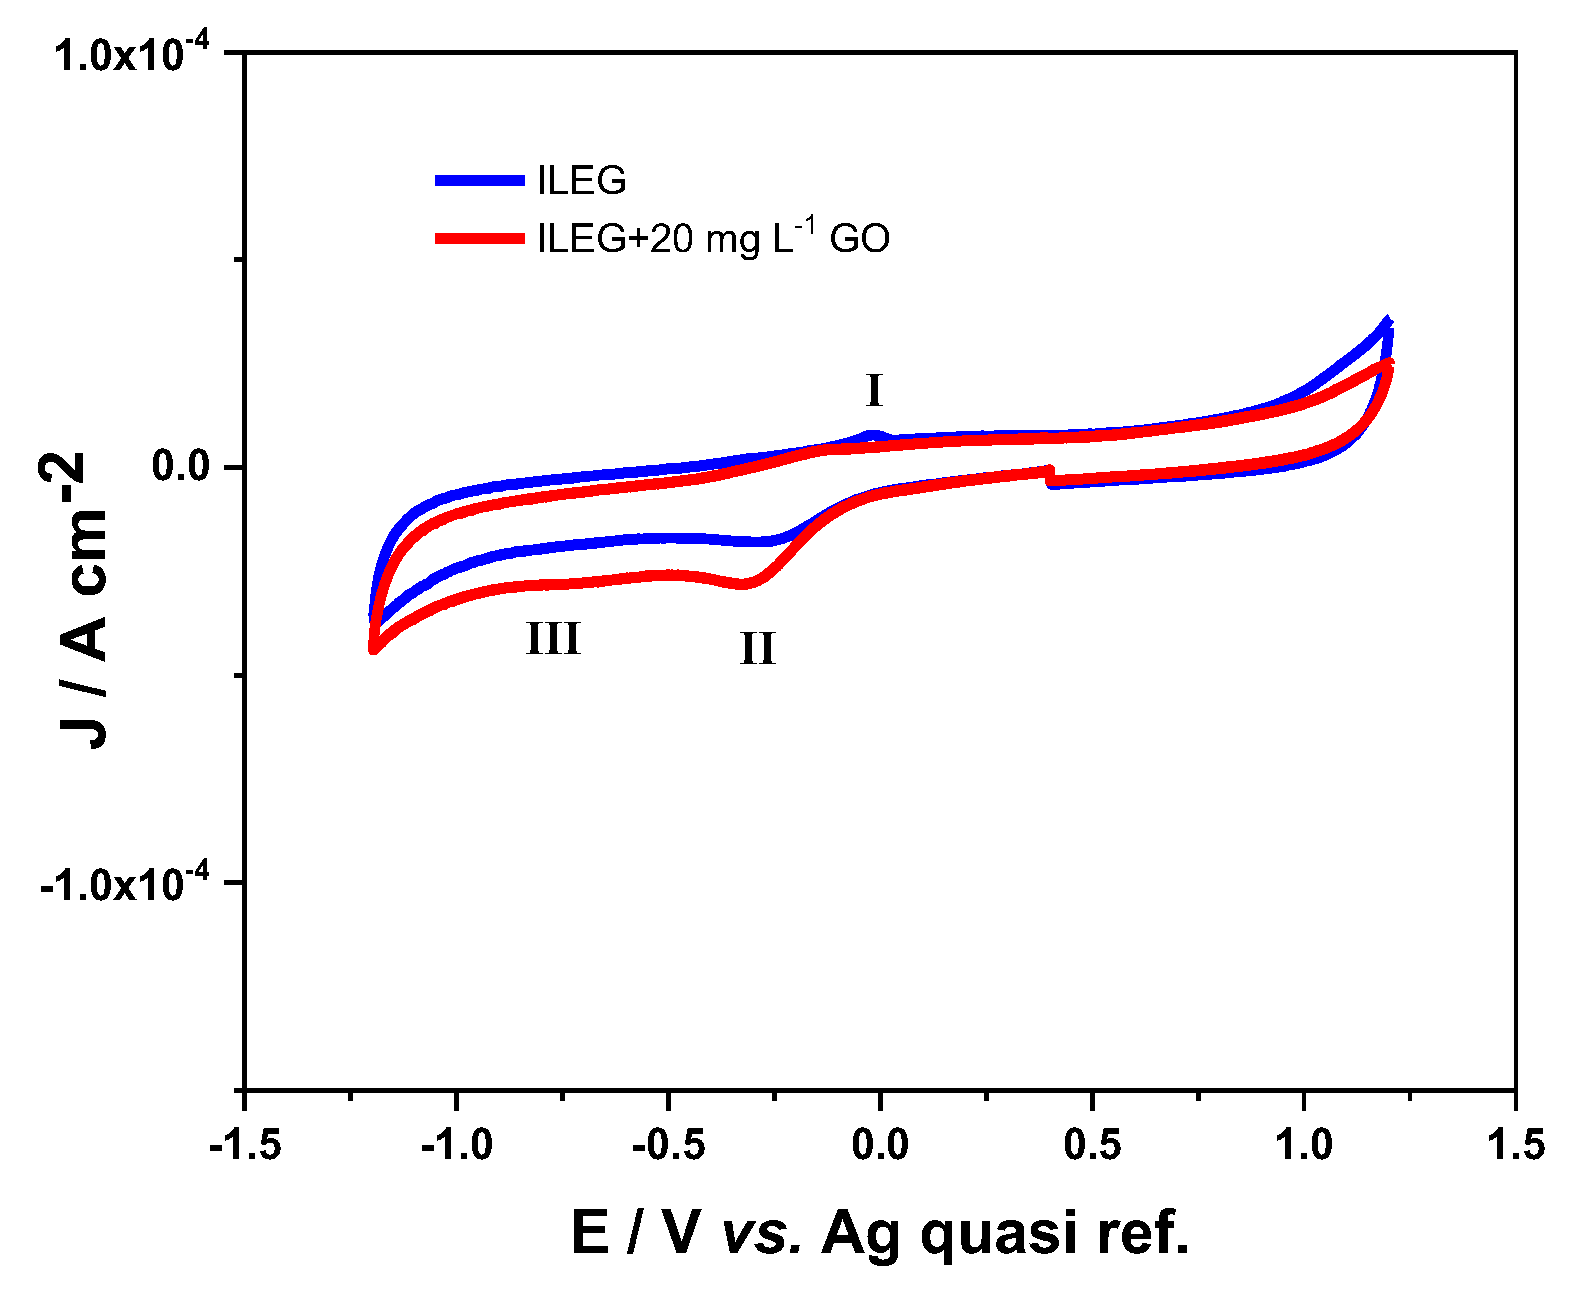
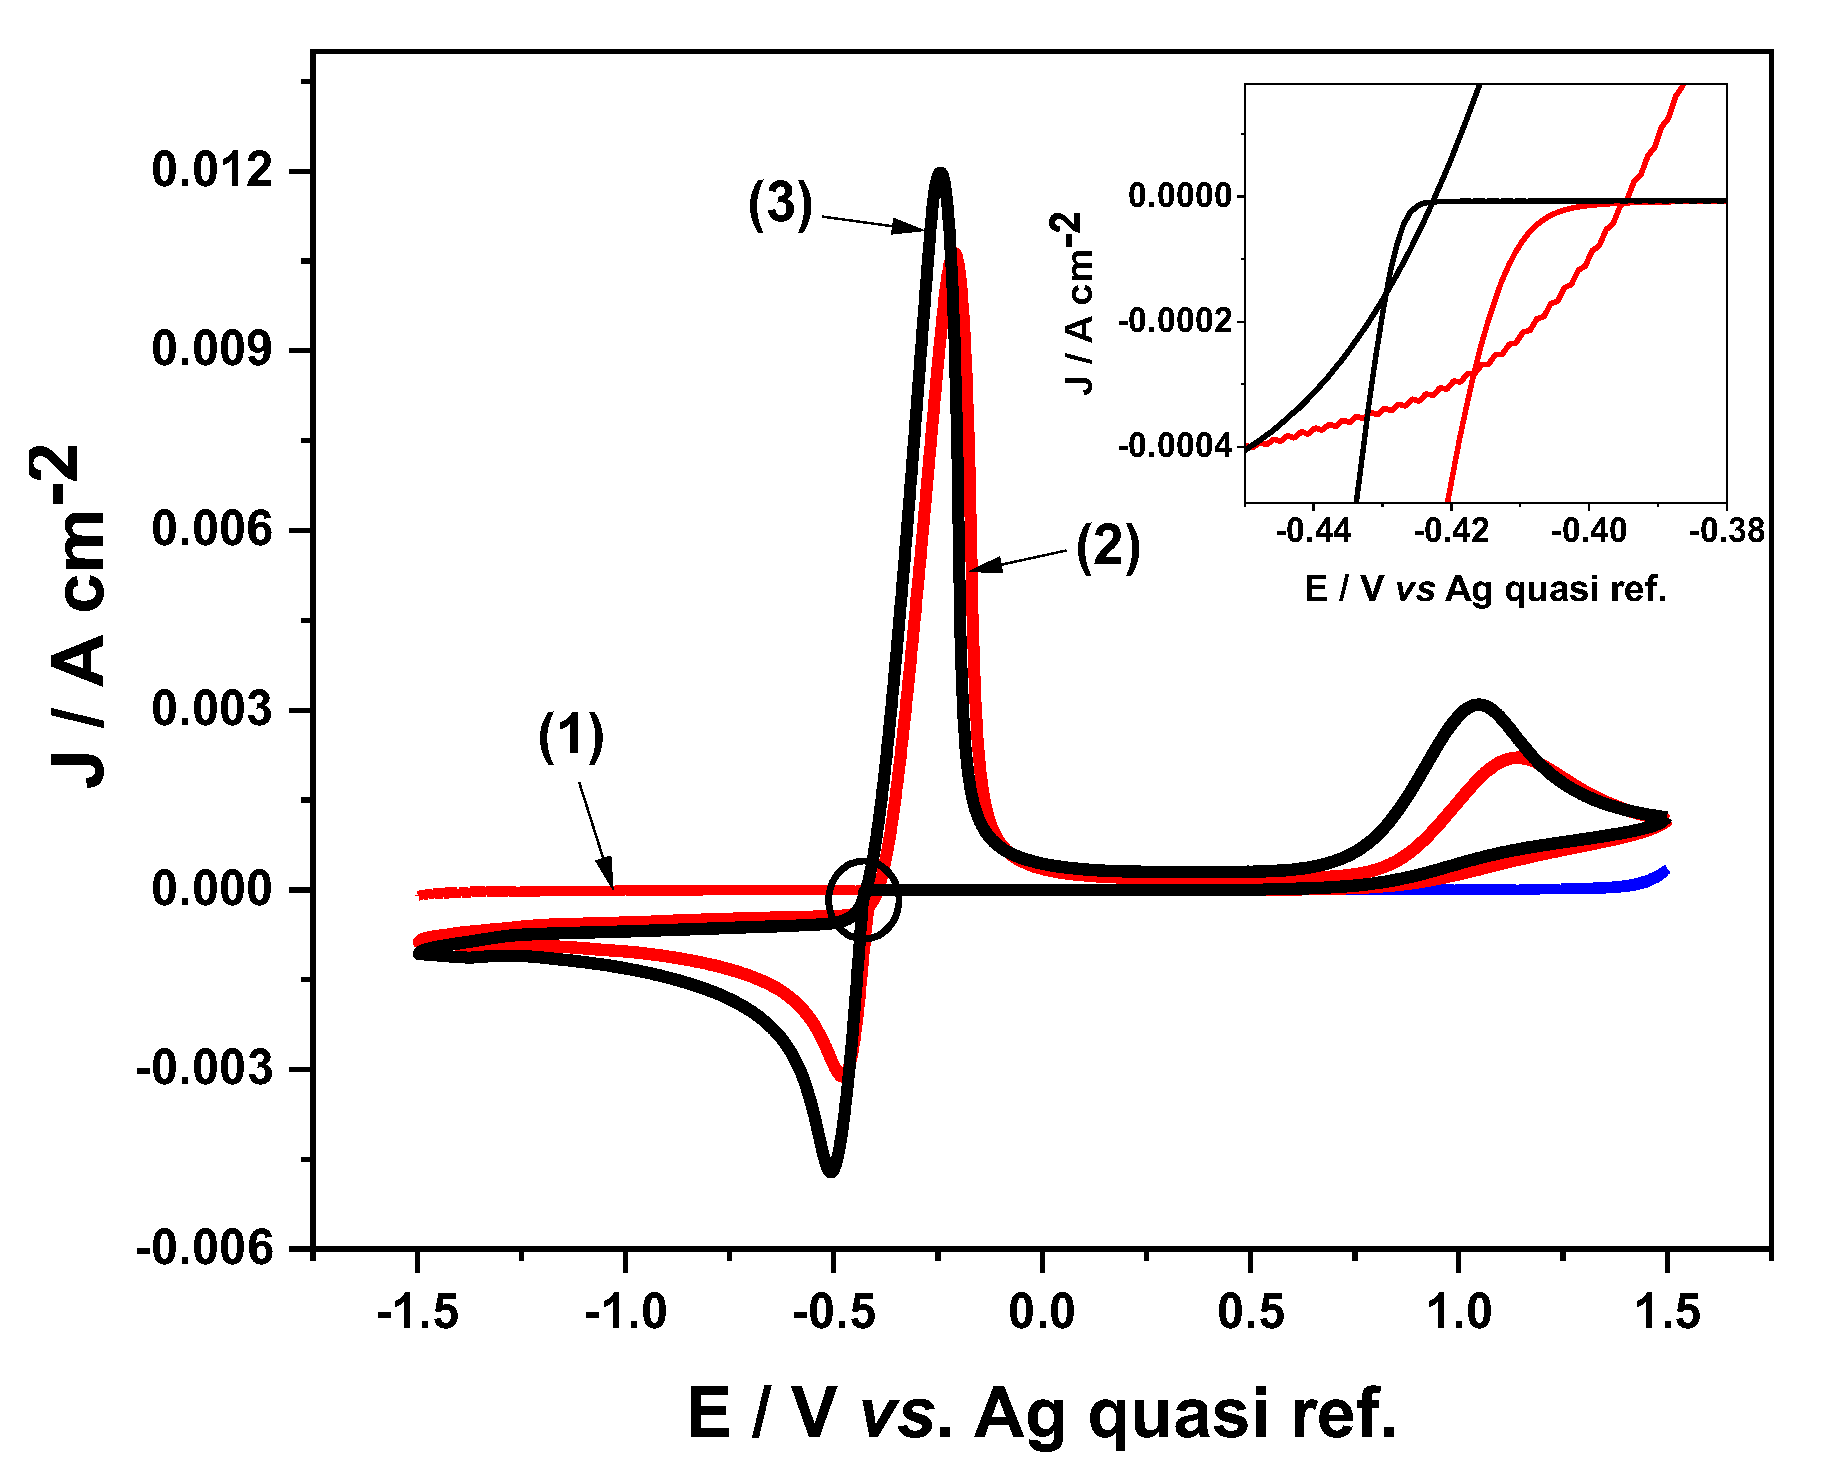
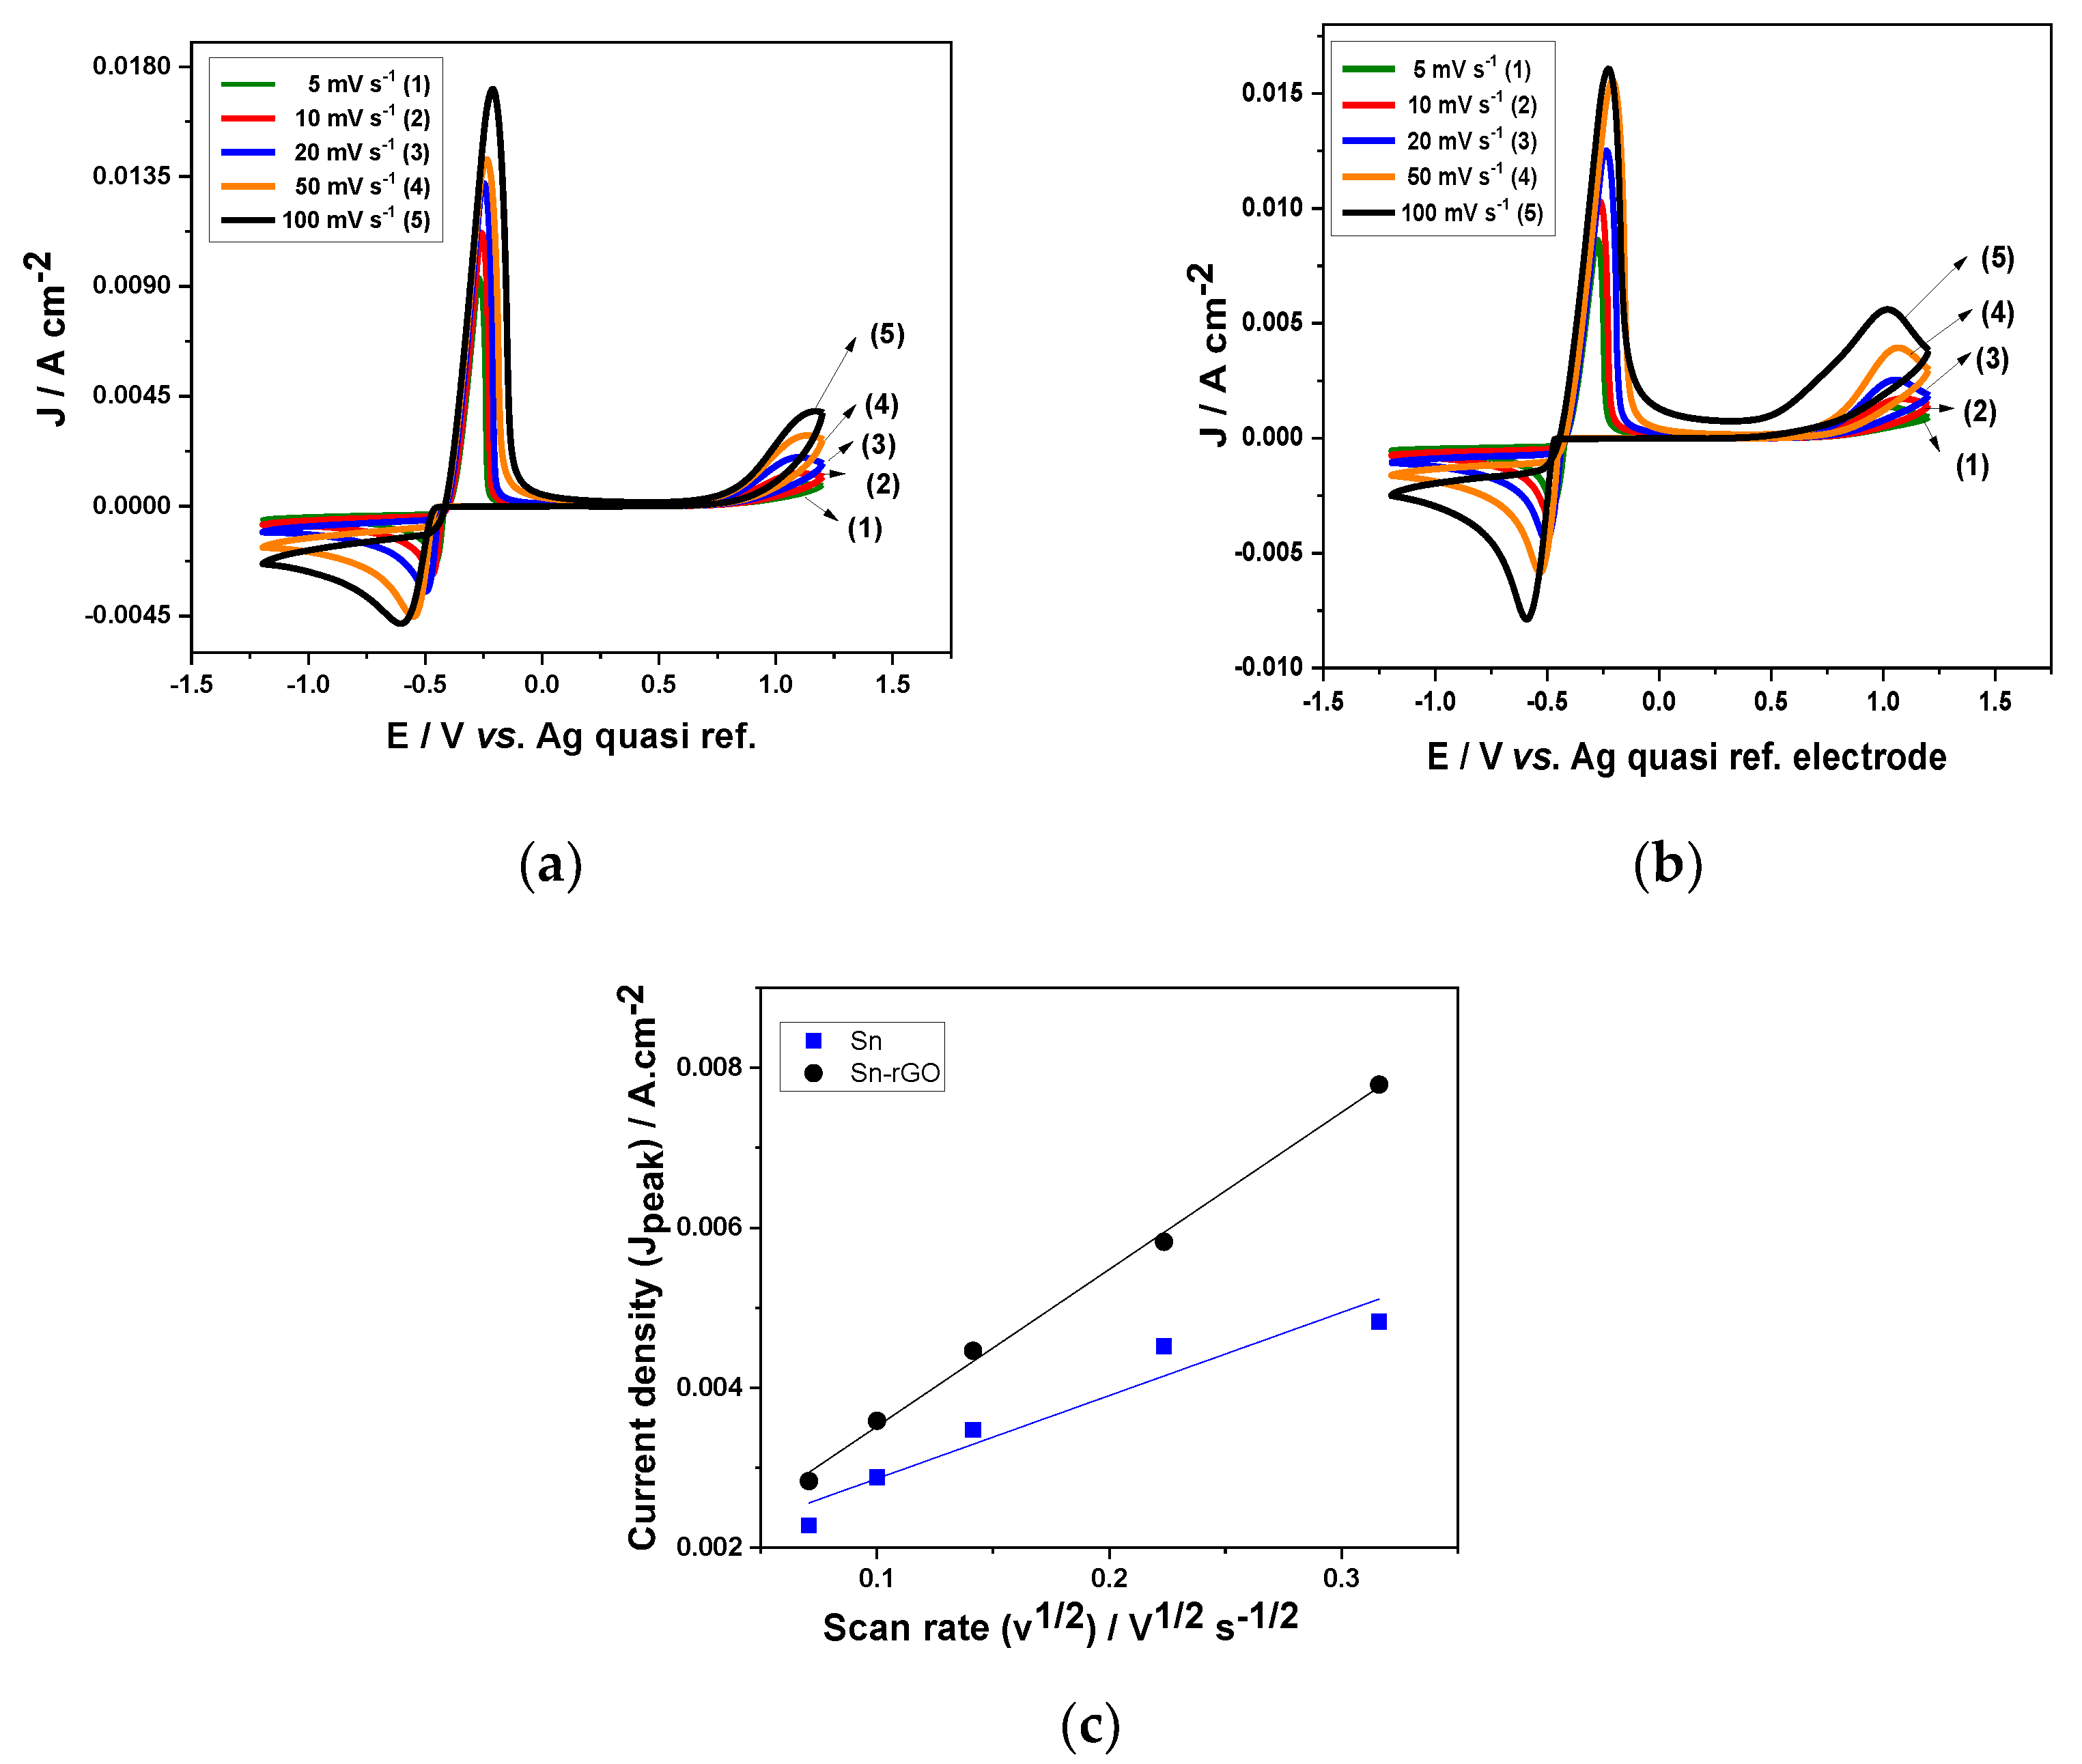
3.1. Cyclic Voltammetry

Cyclic voltammetry using a GC working electrode was carried out in the ILEG solvent in the absence and in the presence of 20 mg L−1 GO at 25 °C, as exemplified in Figure 1. One anodic peak (I) and two cathodic peaks (II and III) were evidenced on the recorded CV in the presence of GO.
The anodic peak I and cathodic peak II could be attributed to redox pair of some electrochemically active oxygen-containing groups on graphene planes, such as -OH, C-O-C, -COOH [61], and the large cathodic current peak III at about −0.7 V was assigned to the irreversible electrochemical reduction of GO [62], since it is absent in blank ILEG. In addition, the intensity of the cathodic peak II in the ILEG containing GO was higher than in the pure ILEG, suggesting that some species present in ILEG and the oxidic groups on the graphene surface were simultaneously reduced on the GC. The reduction of GO was further confirmed by Raman spectroscopy.
To study the one step co-electrodeposition of Sn-rGO composite, the cyclic voltammetry curves were recorded comparatively in ILEG, containing 0.05 M SnCl2 with/without 20 mg L−1 GO. In order to have the same water content in electrolyte without GO, 20 mL L−1 of distilled water was added.
Figure 2 shows the CVs for Sn and Sn-rGO composite electrodeposited on GC electrode. The voltammetric profile of curves 2 and 3 was similar, with a well-defined peak in the negative scan that could be attributed to the reduction of Sn2+ ions and two anodic peaks corresponding to Sn2+ formation by stripping of metallic deposit (−0.25 V) and further oxidation of Sn2+ to Sn4+ (more positive than 1 V), respectively, in agreement with the data reported by Vieira et al. [50]. It can be observed that the cathodic peak potential for Sn-rGO composite film deposition (−0.5 V) shifted to negative compared to that of Sn film (−0.47 V). Additionally, the onset of the reduction in Sn-rGO occured at −0.42 V, a value slightly more negative when compared to that of Sn2+, which occurred at −0.39 V. This shift of Sn reduction potential indicated that the presence of GO influenced the deposition process by adsorbing on the active sites of the cathodic surface. A similar behaviour has been reported in [63] during the electrodeposition of Ni/graphene composite from an aqueous solution and in [58] when NiSn-rGO from DES based electrolyte has been involved. It can be observed that both peak current density and the diffusion limiting current density for Sn-rGO composite deposition onto GC electrode were higher than those for Sn metal deposition. This could be the consequence of increased active surface area due to the incorporation of graphene in the coating. In addition, a current loop (crossover) may have been observed at around −0.42 V, characteristic of the metal electrodeposition under nucleation control [50,56].
The CVs of SnCl2 in ILEG based electrolyte in the absence and in the presence of GO recorded on GC electrode are presented in Figure 3, at different scan rate values.
As illustrated in Figure 3a,b, the cathodic peak potentials were shifted to more negative values as the scan rate increased, suggesting the quasi-reversibility of the process, in agreement with other results reported in [56,64]. Thus, cathodic peak potentials of −0.45 V at 5 mV s−1 and −0.59 V at 100 mV s−1 were noticed in the case of ILEG based electrolyte, while on addition of GO, these values were −0.47 V at 5 mV s−1 and −0.60 V at 100 mV s−1. As expected, higher values of the cathodic and anodic peak currents were noticed with the increase in scan rate. The linear dependence of the cathodic peak current and the square root of scan rate as illustrated in Figure 3c indicated that the deposition process occurs under diffusion-controlled growth, both in the absence and in the presence of GO in the electrolyte.

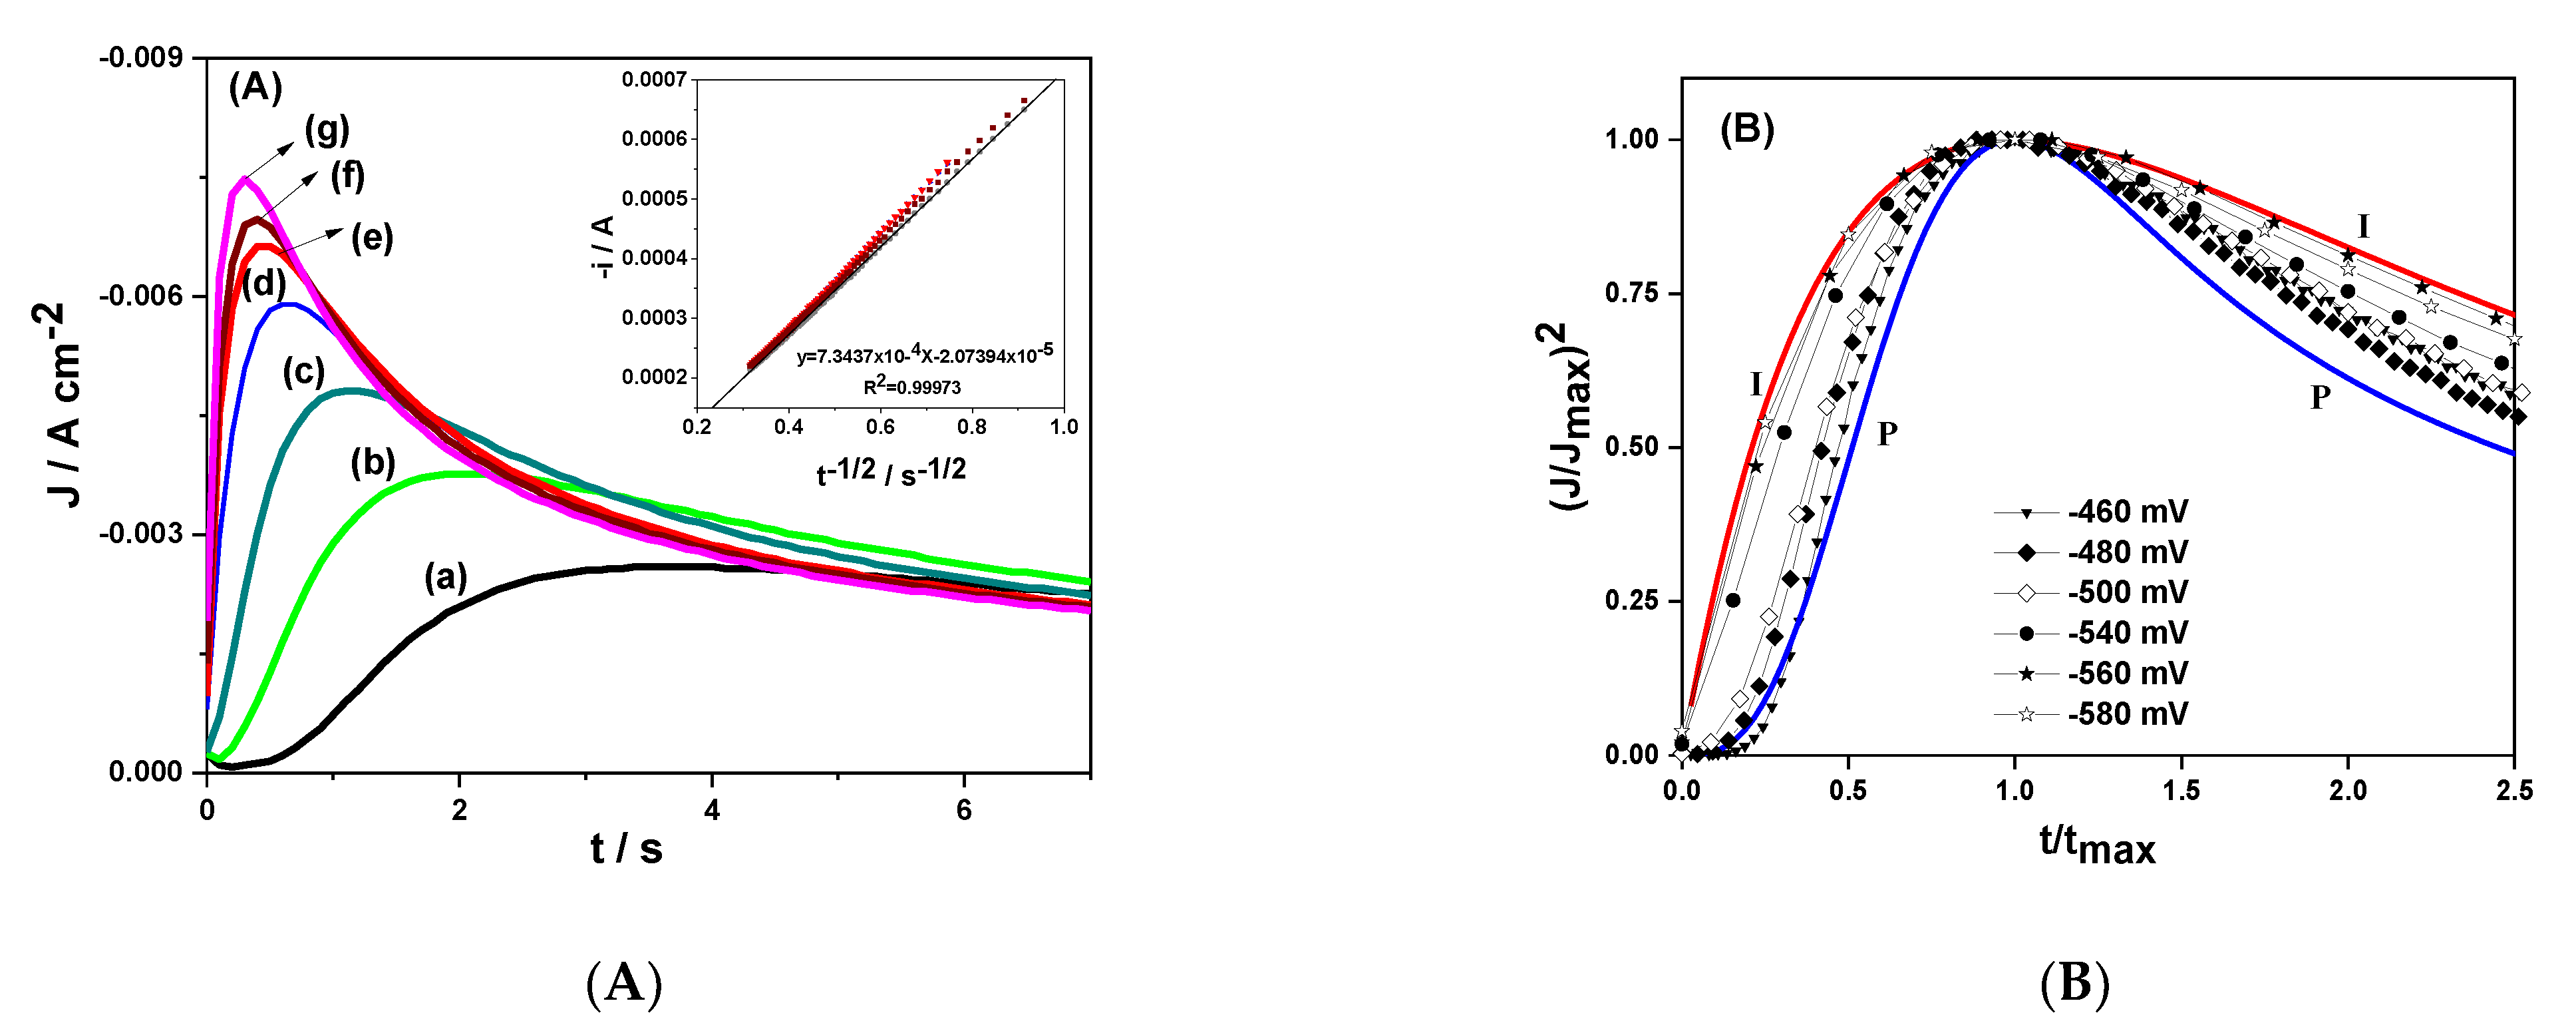
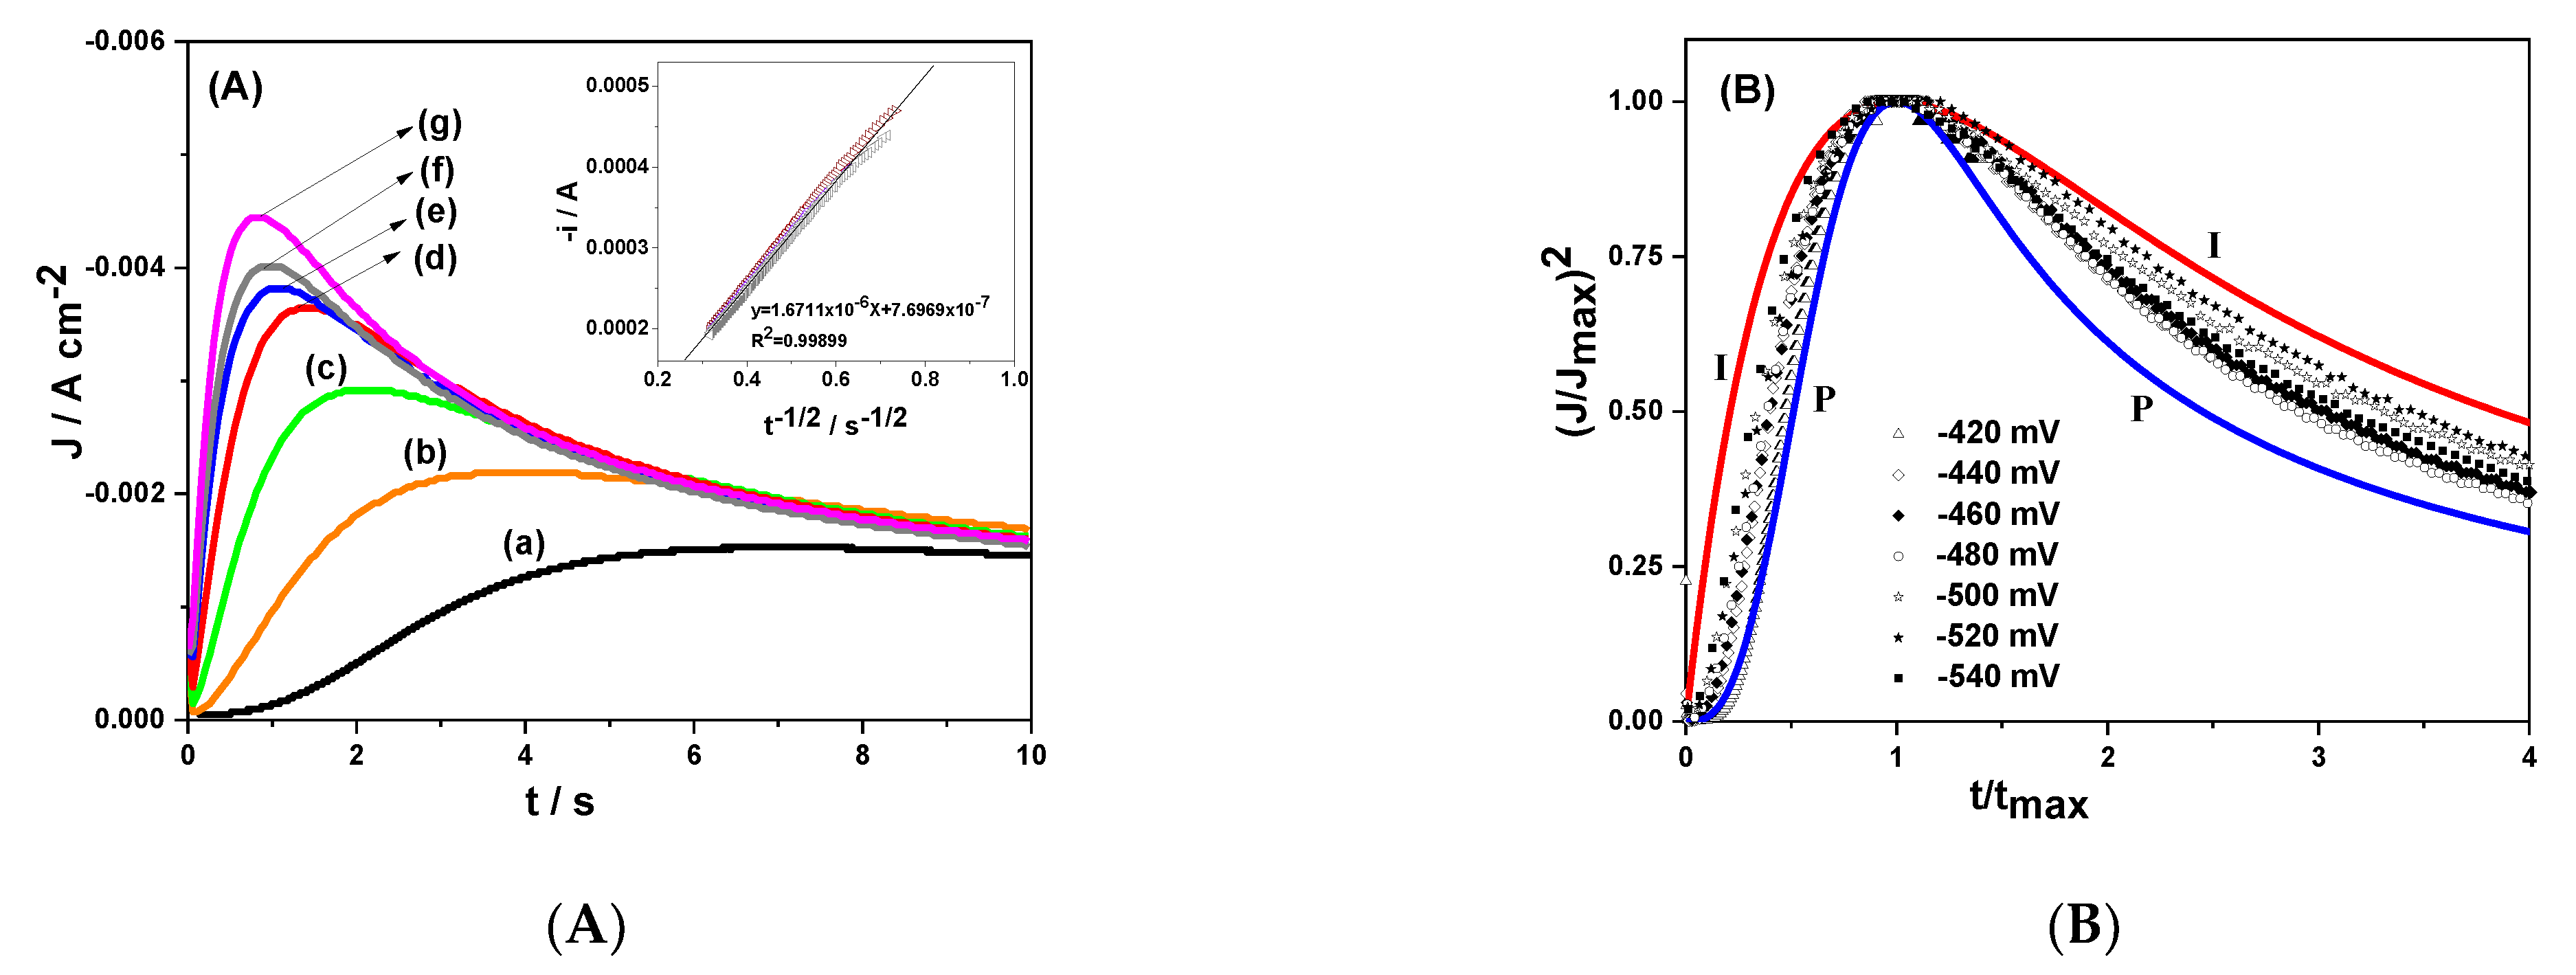
3.2. Chronoamperometry

Chronoamperometry investigations were carried out to get more details on the nucleation and growth process during Sn and Sn-rGO electrodeposition onto GC working electrode. The experiments were performed starting from a potential where no deposition occurs towards potentials at which reduction process was induced. A freshly polished GC substrate was involved every time. Therefore, the current density–time (j–t) transients at different applied potentials have been recorded, as presented in Figure 4A and Figure 5A, related to the electrodeposition of Sn-rGO and Sn, respectively.
All current transients showed the typical profile of diffusion-controlled nucleation process with three-dimensional nucleation and growth. At the beginning of each transient there was a charging of the electrical double layer. Then, an increase in faradaic current occurred, due to the growth in size of the independent nuclei and/or to the increase in the number of nuclei. During this stage of the deposit evolvement, the diffusion zone of individual nuclei began to overlap at time tmax, the hemispherical mass-transfer became a linear mass-transfer and the cathodic current reached a current density maximum, jmax. After tmax, the current transients decayed slowly due to the increased diffusion layer thickness and the transients’ approach that corresponded to linear diffusion to the total area of the electrode surface. As the applied cathodic potential was more negative, the corresponding current density maxima (jmax) are larger and the corresponding time periods (tmax) are shortened. The presence of the GO in the ILEG based electrolyte did not significantly change the current transient profile; however, the tmax values corresponding to Sn-rGO deposition were shorter than those noticed for Sn ones. This phenomenon could be related either to the adsorption of the GO on the GC surface electrode or to the electro-reduction of GO on the formed nuclei [30,65].
In order to get more information on the Sn and Sn-rGO composite nucleation mechanisms, the recorded current transients have been analyzed using the theoretical model proposed by Scharifker and Hills [66] that considers the two extreme cases of nucleation, respectively: (i) instantaneous, when all nuclei are immediately formed after the step potential, and (ii) progressive (nuclei formed according to kinetics). Dimensionless theoretical transients for instantaneous and progressive nucleation were plotted according to the Equations (1) and (2), respectively:
j 2 j max 2 = 1.9542 t max t 1 exp 1.2564 t t max 2
j 2 j max 2 = 1.2254 t max t 1 exp 2.3367 t 2 t max 2 2
Figure 4B and Figure 5B illustrate the plots of (j/jmax)2 vs. t/tmax calculated according to Equations (1) and (2) along with the dimensionless experimental data taken from the j-t curves in Figure 4A and Figure 5A, respectively.
In the case of Sn-rGO deposition (see Figure 4B), a transition from near-progressive nucleation at lower applied cathodic potentials towards instantaneous nucleation at more cathodic potential values was evidenced. The experimental data in the case of Sn deposition (see Figure 5B) fit well to the theoretical curve for progressive nucleation for lower cathodic potentials. As the applied potential was shifted towards more negative values, the non-dimensional experimental curves were displaced towards the region between progressive and instantaneous nucleation, showing an intermediate behavior.
It is worth mentioning that, when analyzing the published data related to Sn and Sn-rGO electrodeposition in different ionic liquids, it was not possible to identify a common nucleation and growth mechanism [49,57,67,68], as the reported experimental conditions were different. Tachikawa et al. [67] proposed a progressive nucleation model during Sn deposition on a Pt electrode in 1-n-butyl 1-methylpyrrolidinium bis(trifluoromethylsulfonyl) imide (BMPTFSI) at 25 °C. Leong at al. [68] investigated the nucleation of Sn at the GC electrode in 1-ethyl-3- methylimidazolium dicyanamide (EMI-DCA) at 40 °C and an intermediate case between instantaneous and progressive nucleation was obtained, as the experimental data were situated between the two theoretical curves. An instantaneous process during Sn deposition on GC electrode at 75 °C from various DESs has been reported by Salomé et al. [49]. In addition, Brandao et al. [57] showed that the nucleation of Sn and Sn composites with various carbon nanomaterials on GC surface from choline chloride-ethylene glycol eutectic mixtures at 75 °C occurred through a 3D instantaneous process with growth controlled by diffusion. In the actual experimental conditions, the DES based electrolyte temperature was lower than that used on the referred studies, the detection of progressive nucleation at lower applied cathodic potentials in the case of Sn-rGO deposition and of intermediate nucleation in the case of Sn deposition could be justified. These findings were also consistent with the reports for ([NnBu4][SnCl3]) in choline chloride-ethylene glycol eutectic mixture at 30 °C that evidenced the transition from 3D-progressive nucleation at low overpotentials towards instantaneous nucleation at higher overpotentials [50].
As all the descending parts of the recorded j-t transients showed an appropriate concordance, the diffusion coefficient of Sn2+ species could be calculated using Cottrell equation [69]:
i = nAFc j 0 D j π t
In Equation (3) i is the current passing through electrolyte in A, n represents the number of transferred electrons, F equals to 96,485 C mol−1, A is the area of the planar electrode in cm2, c is the bulk concentration in mol cm−3, t is the time in s, and D is the diffusion coefficient of electro-active species in cm2 s−1.
As exemplified in the insets from Figure 4A and Figure 5A, the decaying portions of the current transients showed a linear i–t−1/2 relationship, with correlation coefficients higher than 0.99. From the slope of these straight lines, and using Equation (3), the diffusion coefficients of Sn(II) species in ILEG + 0.05 M SnCl2 in the absence and in the presence of GO were determined. The average values of the diffusion coefficient at 25 °C were found to be 9.4 × 10⁻⁷ cm2 s−1 for Sn(II) species in the absence and 14.1 × 10⁻⁷ cm2 s−1 in the presence of GO. The determined values were of the same order of magnitude with the other literature data for ionic liquid-based systems. The reported diffusion coefficient from the reduction step SnCl3 + 2 e → Sno + 3 Cl in choline chloride-ethylene glycol eutectic mixture was 1.96 × 10⁻⁷ cm2 s−1, using cyclic voltammetry and relationship between the peak current and scan rate for an irreversible system, in [64]. Values of the diffusion coefficient of Sn (II) in reline (choline chloride: urea), propeline (choline chloride: propylene glycol), and ethaline (choline chloride: ethylene glycol) eutectic mixtures calculated from chronoamperometry were 4.1× 10 −7 cm2 s−1, 1.2 × 10 −6 cm2 s−1, and 1.4 × 10 −6 cm2 s−1, respectively, at 75 °C, as outlined in [49]. It is worth mentioning the relatively higher diffusion coefficients in the presence of GO, suggesting that the GO incorporation in the Sn matrix could facilitate an improvement of the electron transfer.
The previously presented non-dimensional analysis by Scharifker & Hills model may be supplementary analyzed considering the rising part of the current transients, according to the equations derived assuming progressive nucleation (Equation (4)) and instantaneous nucleation (Equation (5)):
j = 2 3 zF π 2 Dc 3 / 2 M 1 / 2 ρ 1 / 2 N 0 At 3 / 2
j = zF π 2 Dc 3 / 2 M 1 / 2 ρ 1 / 2 N 0 t 1 / 2
where zF is the molar charge of the depositing species, D is the diffusion coefficient, c represents the bulk concentration of metal ions, M is the molecular weight, ρ is density, N0 is the maximum number of nuclei obtainable under the prevailing conditions and A is the steady state nucleation rate constant per site [70].
As illustrated in Figure 6 for the recorded j-t transients in the case of Sn-rGO electrodeposition from ILEG based electrolyte containing 20 mg L−1 GO, a linear dependence was clearly observed.
The calculated slope values from these logarithmic plots were closer to 3/2 (1.8 at −450 mV and 1.55 at −470 mV) for less negative potentials, while in the case of more cathodic potentials the values were closer to 1/2 (0.67 at −510 mV and 0.41 at −530 mV). These findings support the previously obtained data from the Scharifker and Hills model, showing the same trend from near-progressive nucleation (j ~ t3/2) towards instantaneous nucleation (j ~ t1/2), as the applied cathodic potential was shifted from less to more negative values.

3.3. Physical Characterization of Sn-rGO Composite Coatings

The Sn-rGO electrodeposition was carried out using copper metallic substrates involving ILEG containing 0.7 M SnCl2 and 20 mg L−1 GO under galvanostatic control, at different current densities in the range 5–30 mAcm−2, at 70 °C, under magnetic stirring. For comparison the Sn electrodeposition was performed from electrolyte without GO.

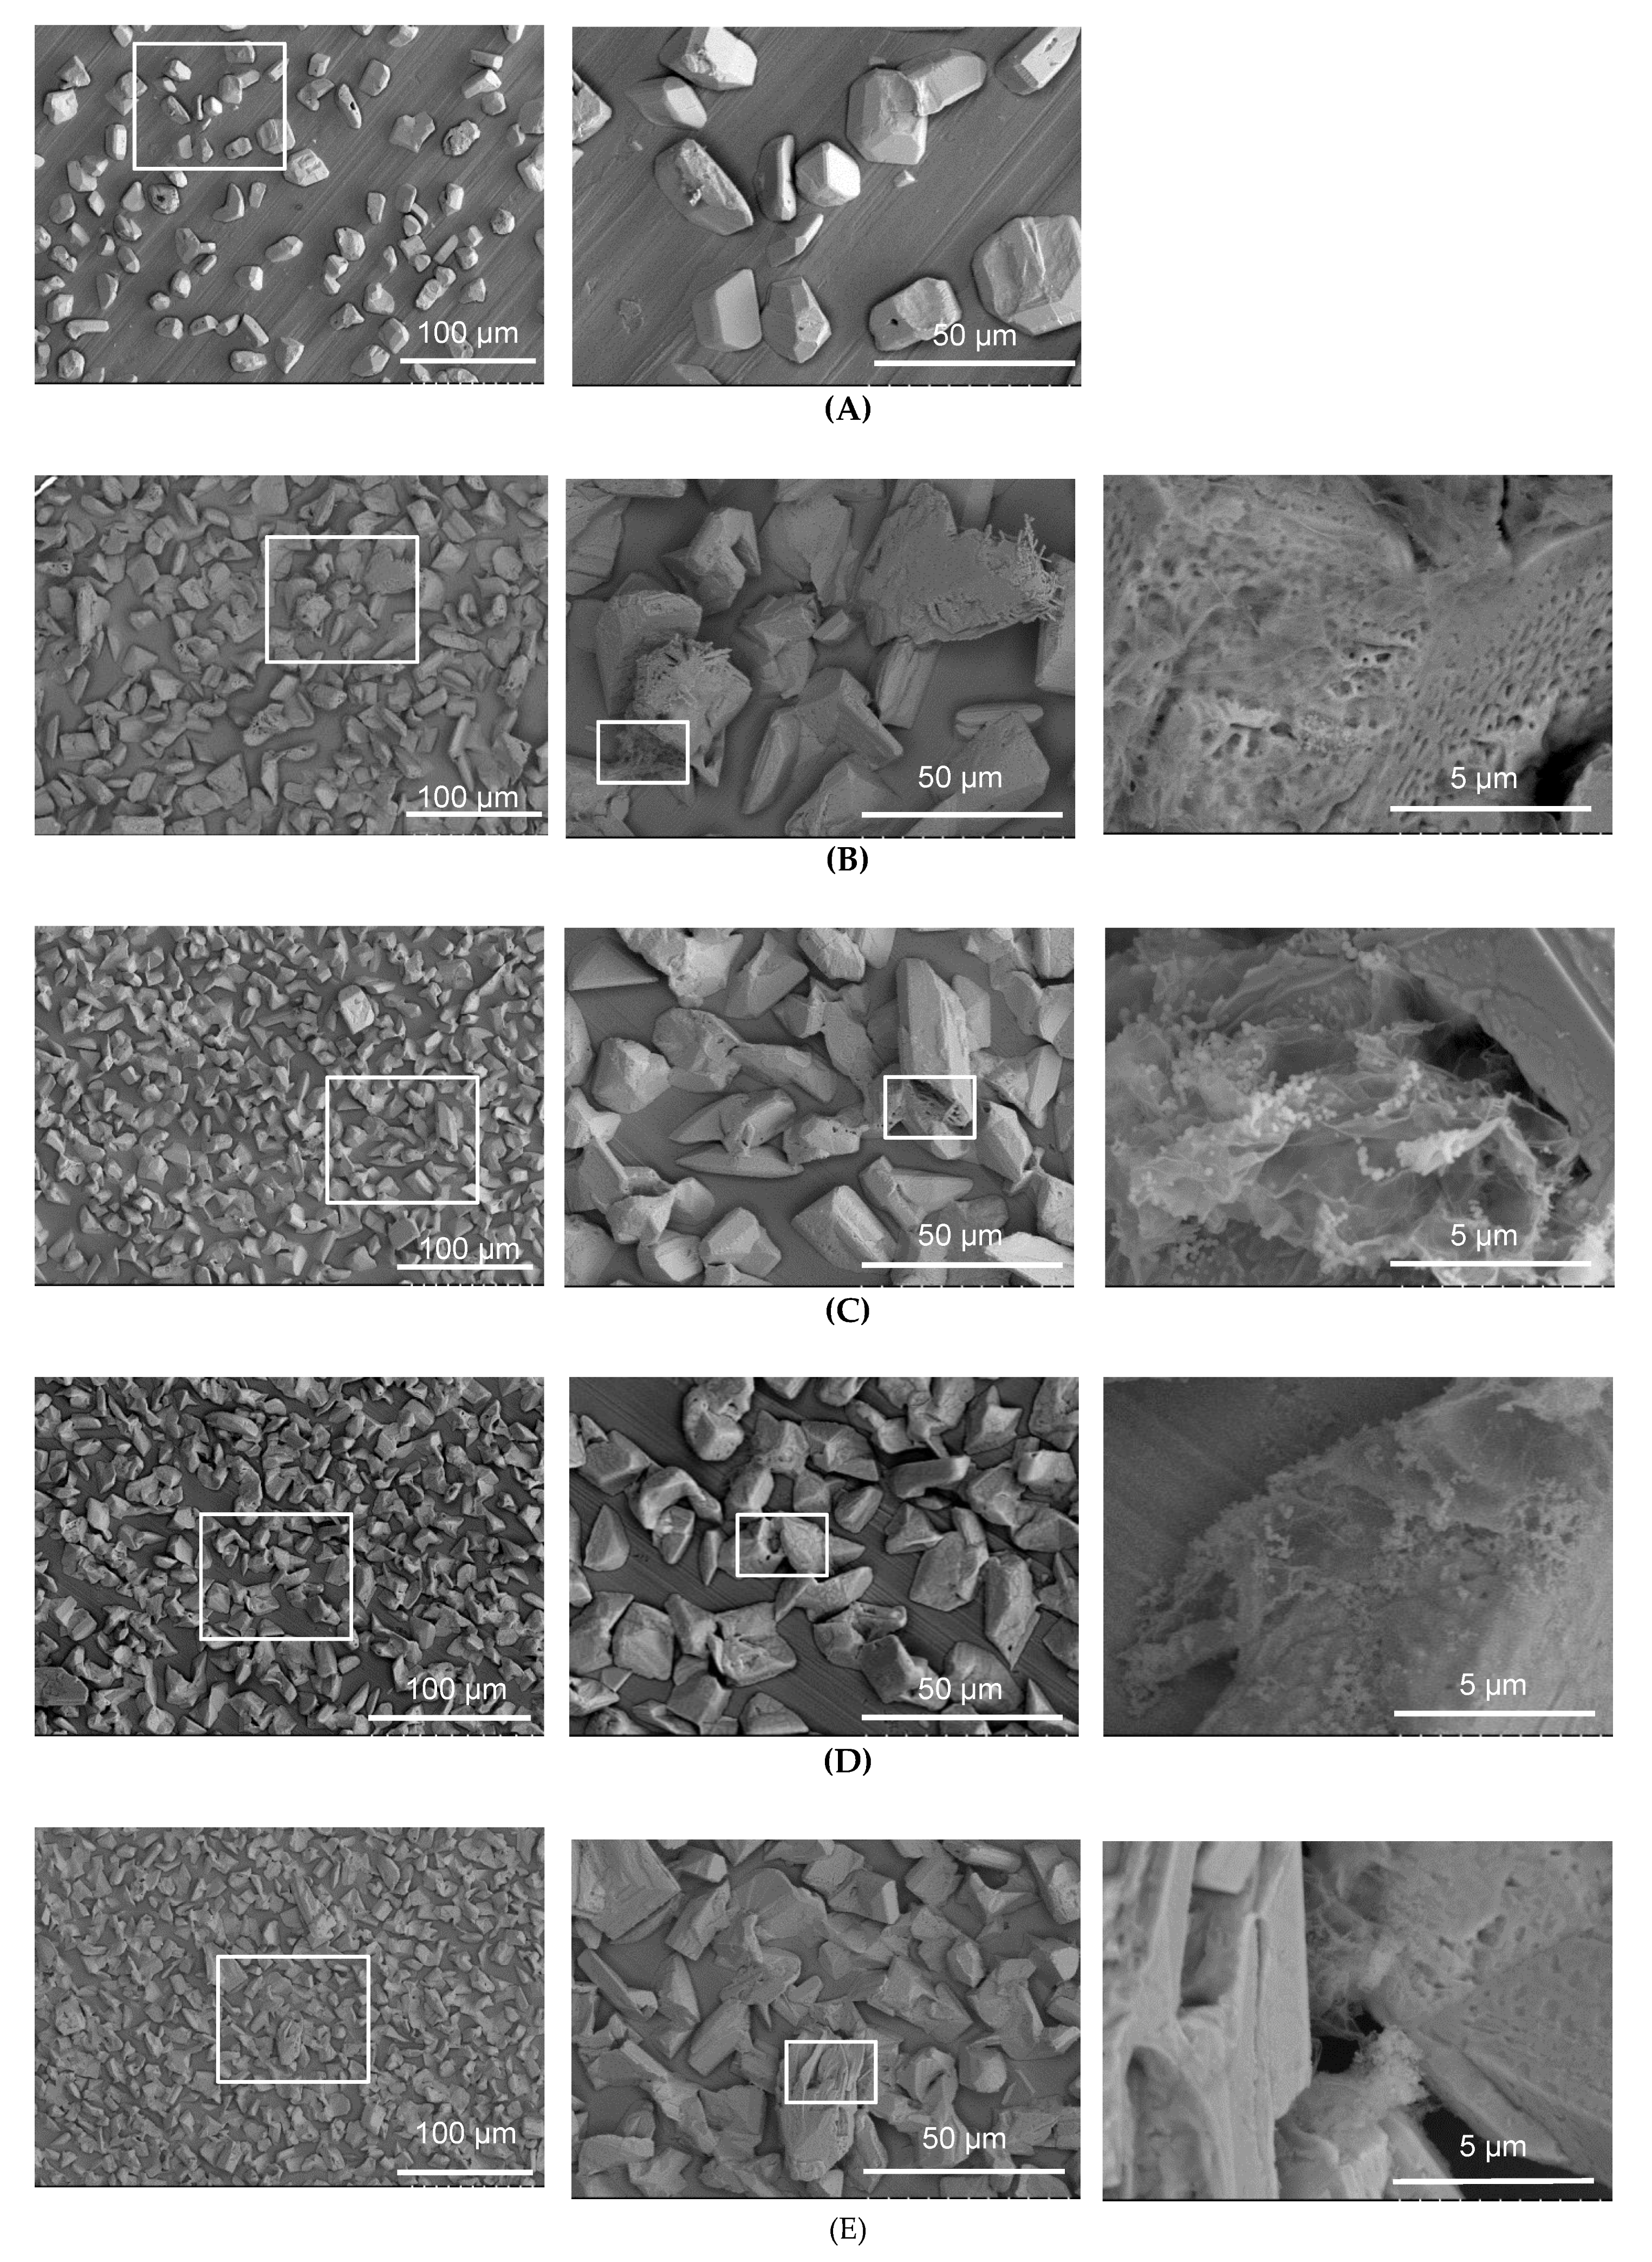
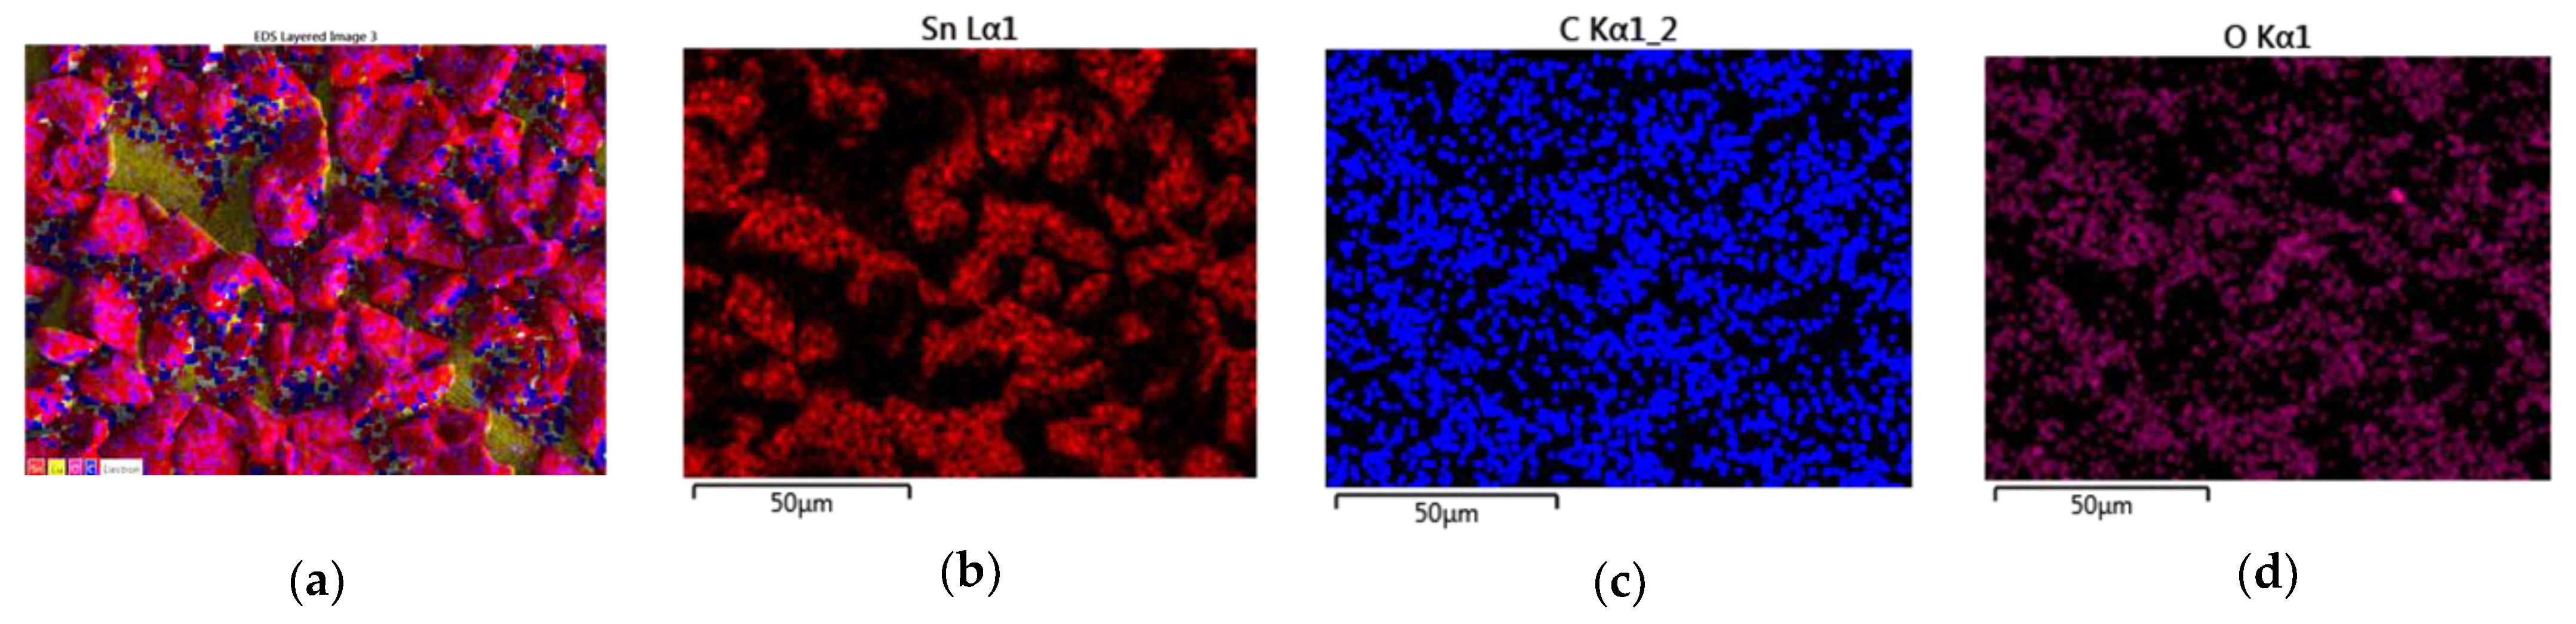
3.3.1. Surface Morphology
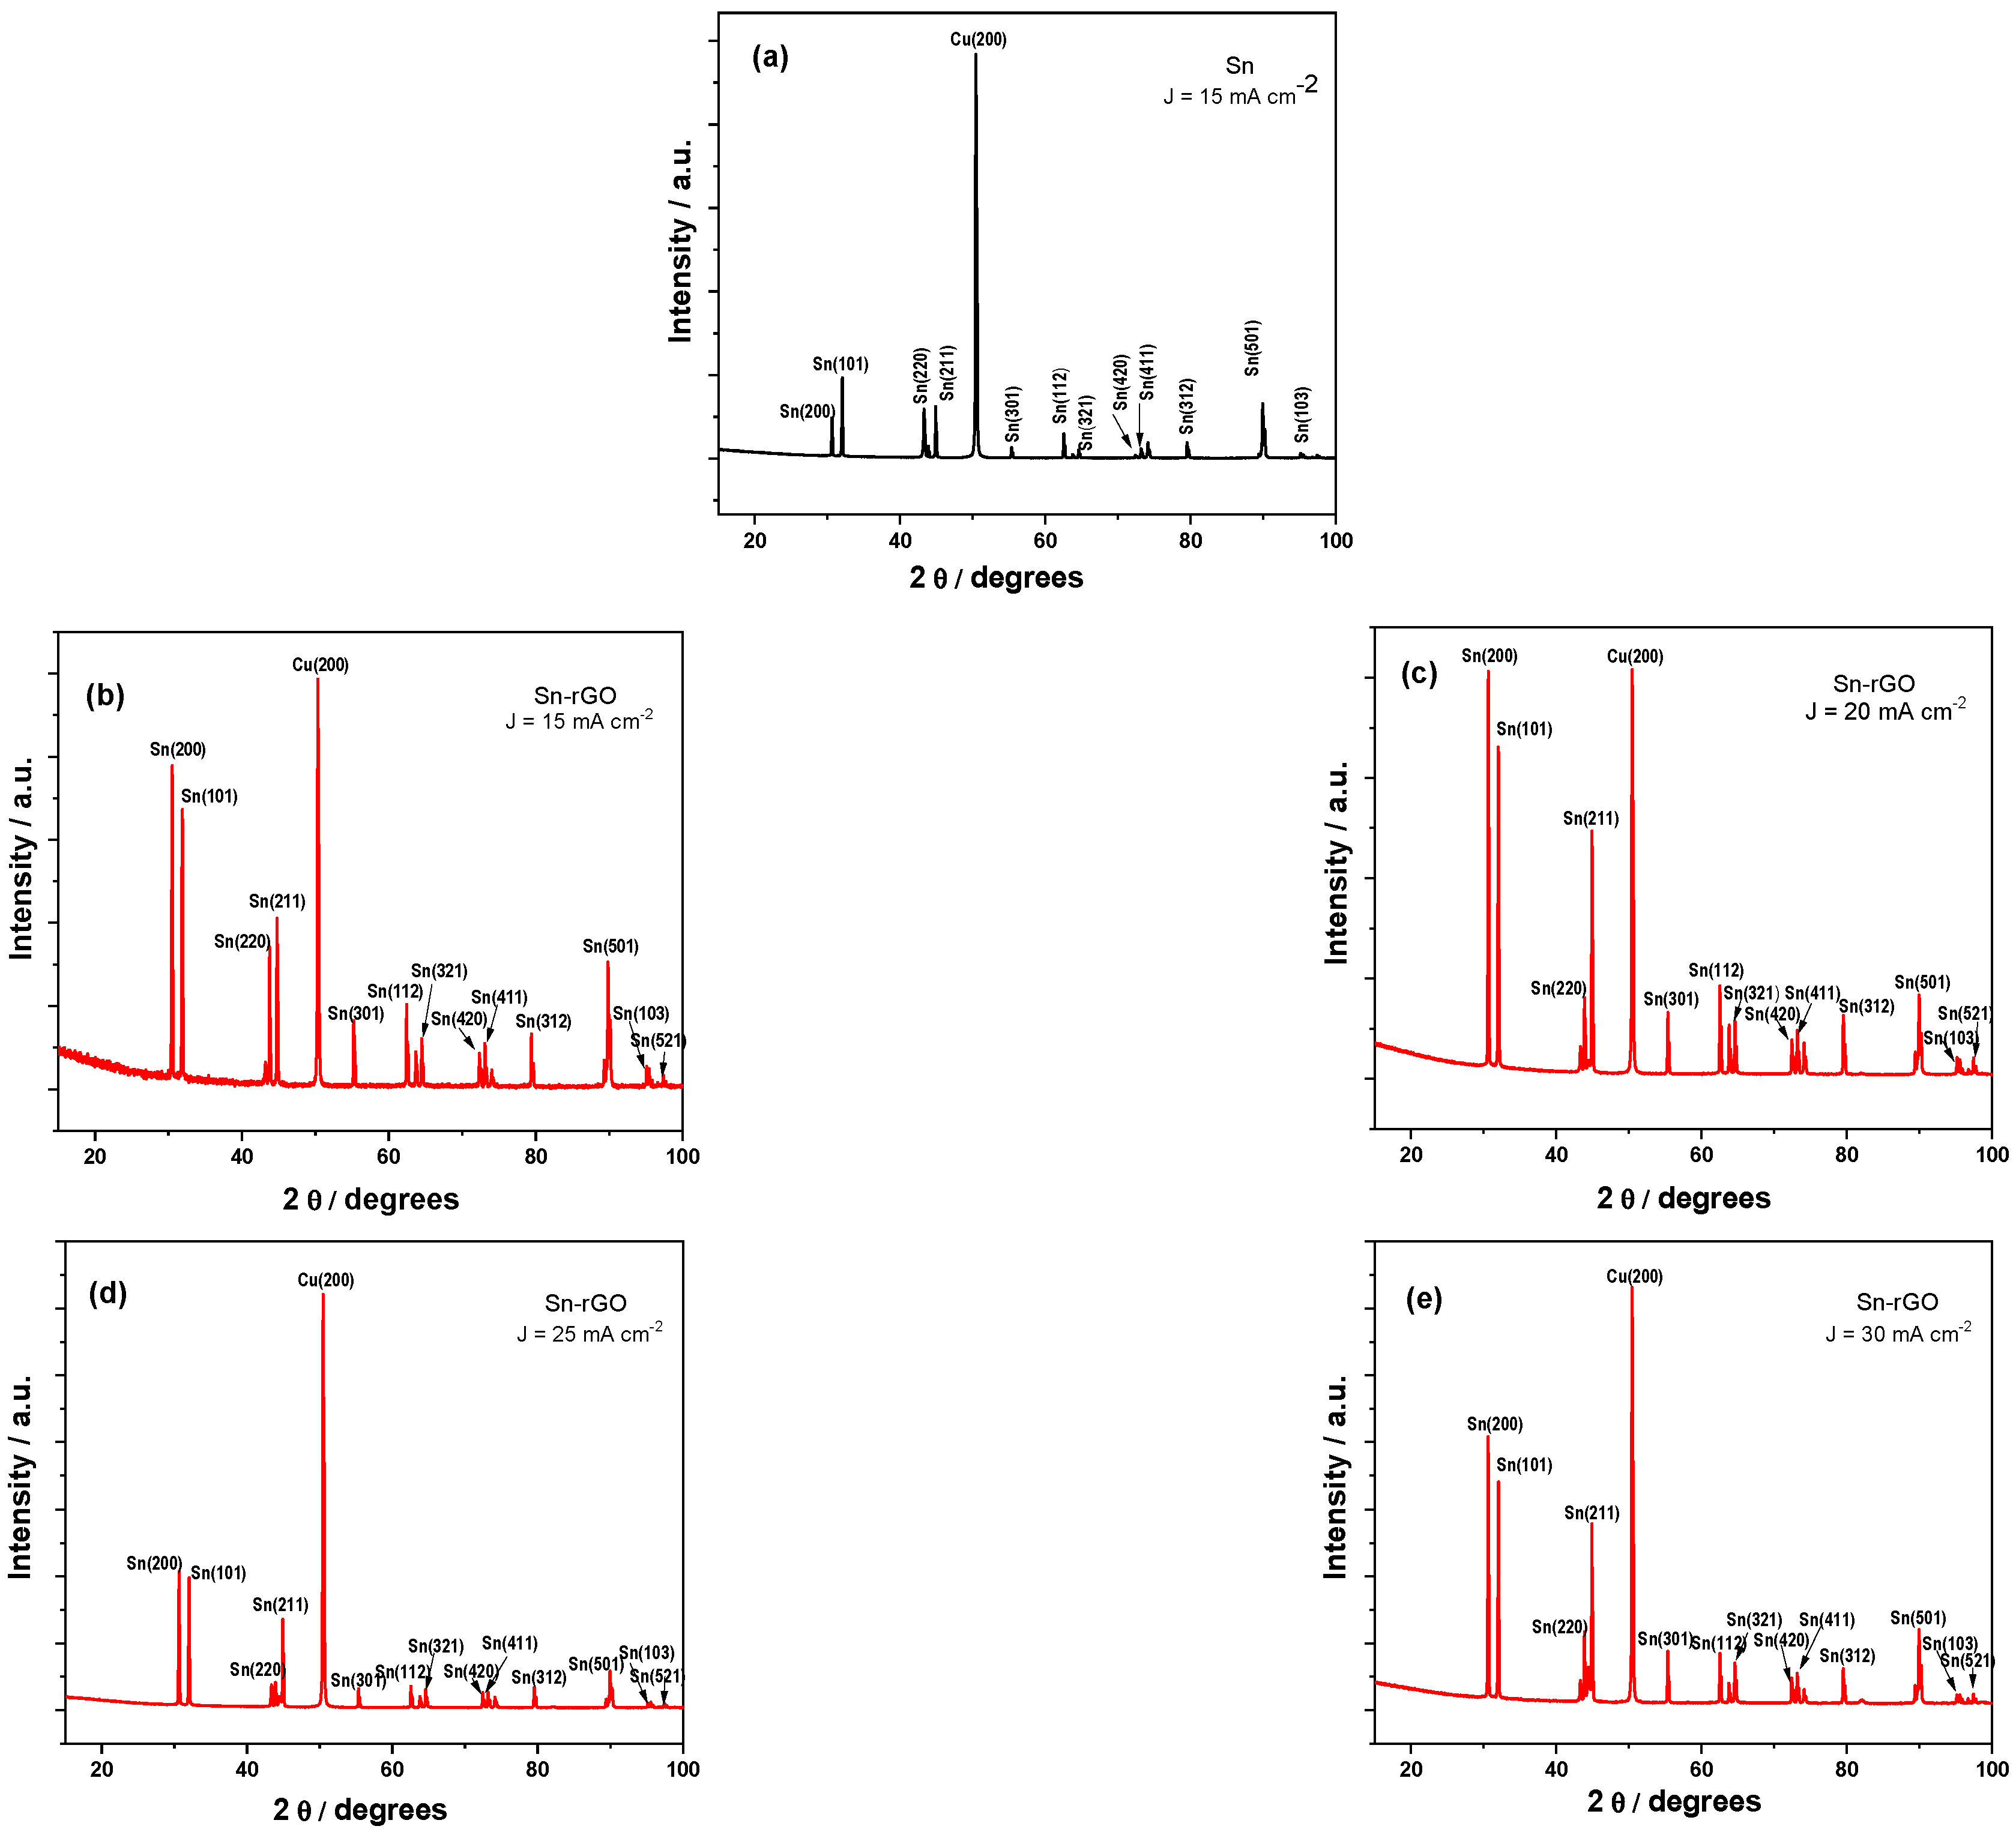
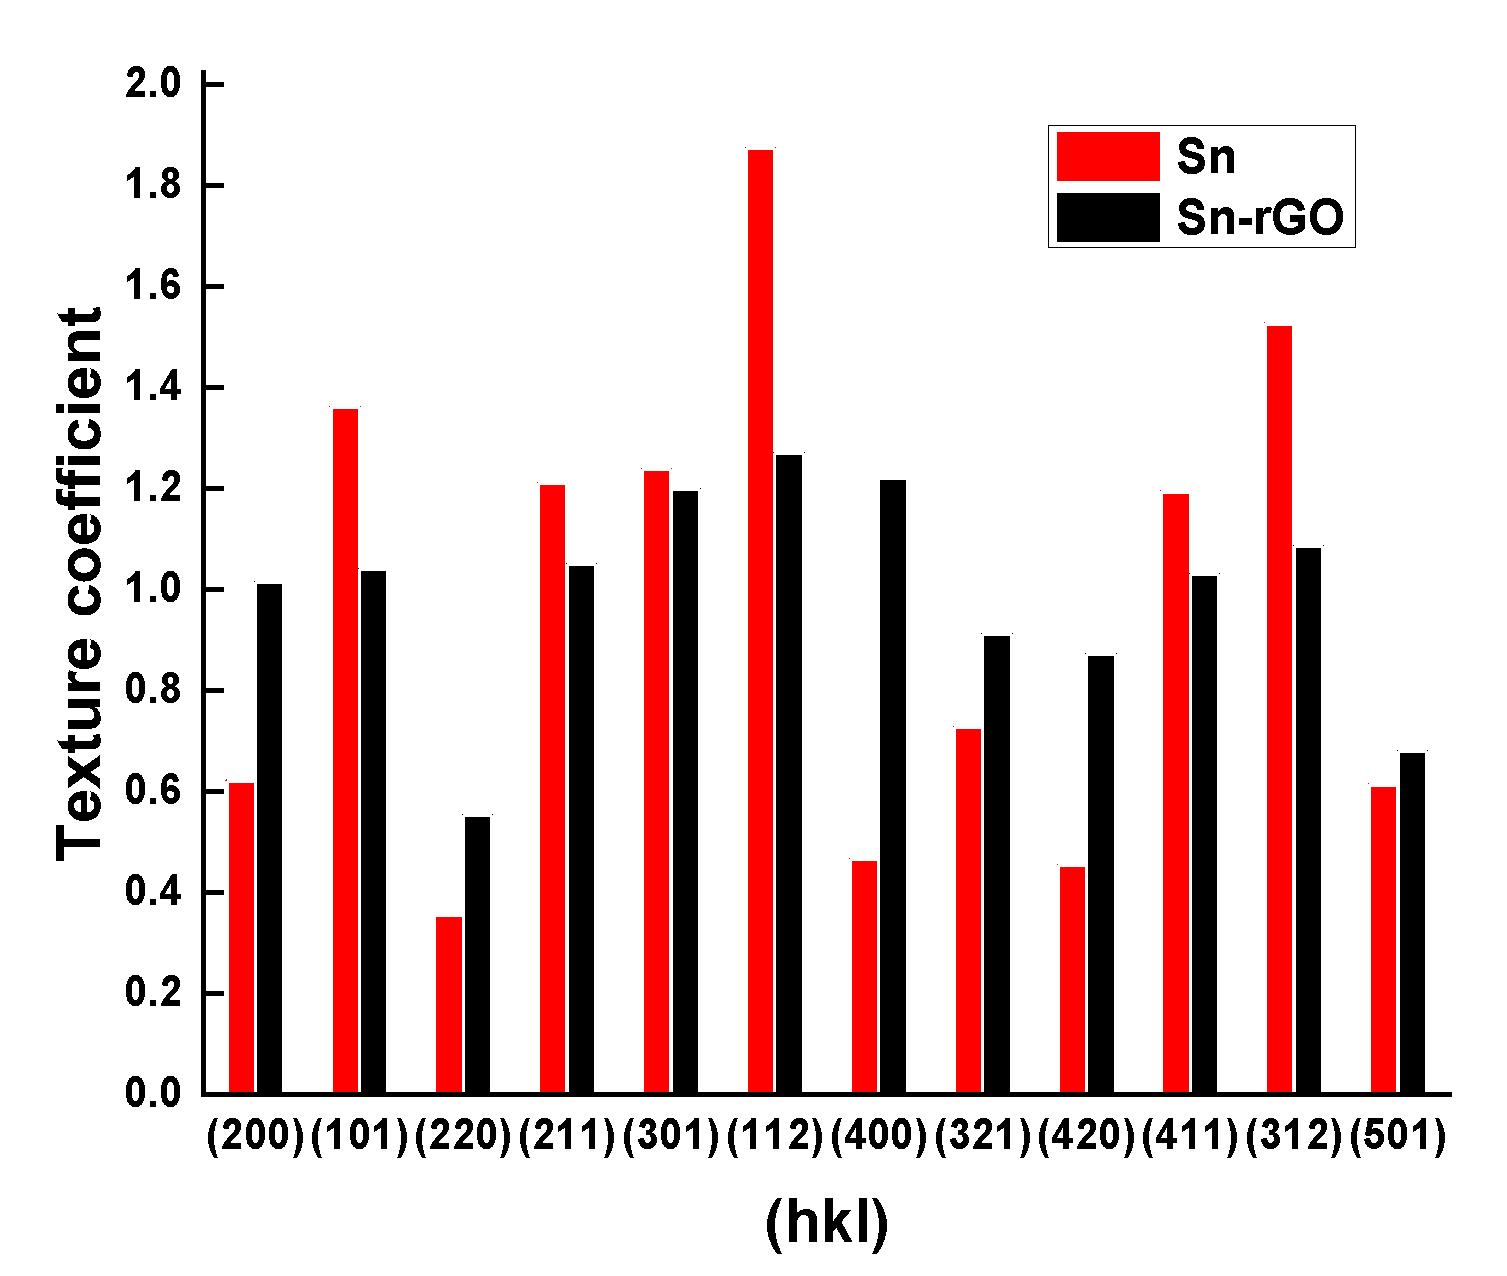
The comparative morphology of Sn and Sn-rGO deposits was studied by scanning electron microscopy (SEM) and the recorded images are shown in Figure 7.
Figure 7A presents an example of SEM micrographs for a pure Sn coating electrodeposited at 15 mA cm−2. A morphology consisting of relatively irregular cuboid-shaped particles perpendicularly grown on the entire surface could be evidenced, with mean sizes of about 12–19 μm. SEM micrographs related to the Sn-rGO composites, as illustrated in Figure 7B–E, show a slight degradation of the cuboid formations associated with grains coalescence. As the applied current grew higher (i.e., above 20 mA cm−2), the deposit became more compact and the grain sizes were smaller, about 8–11 μm, which also showed a proper incorporation of the rGO sheets. At current densities lower than 15 mA cm−2, the graphene related material was less visible. Quite similar results were reported by Berlia et al. who studied electrodeposition of Sn/graphene composite from SnCl2 aqueous bath [28].
An example of the spatial distribution profiles for the main elemental components in the case of Sn-rGO composite coating is shown in Figure 8.
As illustrated by EDX maps, all atomic species were uniformly distributed in the composite coating.

3.3.2. XRD Analysis

The recorded X-ray diffractograms are comparatively presented in Figure 9, for the deposited coatings of Sn (Figure 9a) and Sn-rGO composite (Figure 9b–e) at various applied current densities.
The diffraction peaks of crystalline Sn are clearly distinguishable. Therefore, characteristic peaks at 30.6, 32.02, 43.89, 44.88, 55.34, 62.53, 63.76, 64.57, 72.39, 73.17, 79.50, 89.41, 95.15 and 97.40° have been identified, along with some peaks of the Cu substrate. All strong diffraction lines can be indexed to the tetragonal Sn phase according to ICDD-PDF card number: 00-004-0673 indicating the crystalline nature of coatings. The diffraction peaks which were associated with (101), (211), (301) and (112) diffraction planes were the most intense ones in the case of pure Sn.
The intensity of the diffraction line at 2θ around 24–27° from the rGO nanosheets was not prominent [71], thus the structure of composite was similar to that of pure tin. Other studies also reported the absence of the characteristic peak at 2θ at 24–27° upon one-step electrochemical reduction of GO. This behaviour has been attributed to very thin platelets of graphene [72], also suggesting that the GO has been electrochemically reduced [73]. Another reason for this disappearance could be related to the lost or disordered stacking of graphene layers in the electrochemically reduced GO [73,74].
Values of the average grain size were calculated from XRD patterns using Scherrer equation for the first four peaks at different current densities. Average sizes of the crystallites were between 82 and 98 nm for pure Sn, while values in the range 77–92 nm have been determined in the case of Sn-rGO composite. The average size of the grains slightly increased as the applied current density was higher. For both Sn and Sn-rGO coatings, there was a competition between the nucleation and crystal growth at various current densities as well. The deposits obtained at increased overpotentials should have exhibited reduced grain sizes. However, as the applied current density was higher, an increase in the secondary hydrogen evolution reaction occurred, thus diminishing the real current density for metal electrodeposition. Consequently, the overpotential decreased and led to an increase in the grain size [53,75].
Smaller grain size for composite can be explained by the graphene related material incorporation in the deposit. During the growth of the electrodeposited film there was a competition between the nucleation and crystal growth. The graphene oxide provided more nucleation sites and hence it controlled and retarded the crystal growth; subsequently, the corresponding Sn grains in the composite coating had a smaller grain size [76,77].
Similar results were reported in [28] regarding the deposition of Sn-graphene composite from tin chloride based aqueous electrolytes.
The preferred orientation of Sn and Sn-rGO obtained deposits was estimated from X-ray data according to the methodology developed by Bérubé and L’Esperance [78].
The texture coefficient was calculated from the following equation:
Tc hkl = I hkl N I hkl × N Io hkl Io hkl
where Tc(hkl) is the texture coefficient of the hkl plane, I(hkl) is the measured peak intensity, Io is the relative peak intensity of the corresponding plane given for standard Sn powder sample from ICDD PDF file card number 00-004-0673, and N is the number of reflections.
The comparative analysis of the peaks for Sn and Sn-rGO composite electrodeposited at 15 mA cm−2, as illustrated in Figure 10, showed a more pronounced orientation along the planes (101), (112) and (312) in the case of pure Sn, while the presence of rGO in the deposit diminished this tendency. Furthermore, crystal growth along (200), (220), (400), (321), (420), and (501) was enhanced in the case of Sn-rGO composite as compared to the crystal growth direction in the case of pure Sn. These results were in agreement with the other literature data, showing that the incorporation of second phase materials to a growing metal matrix could influence the grain size and the preferred orientation of the deposit [28,36].

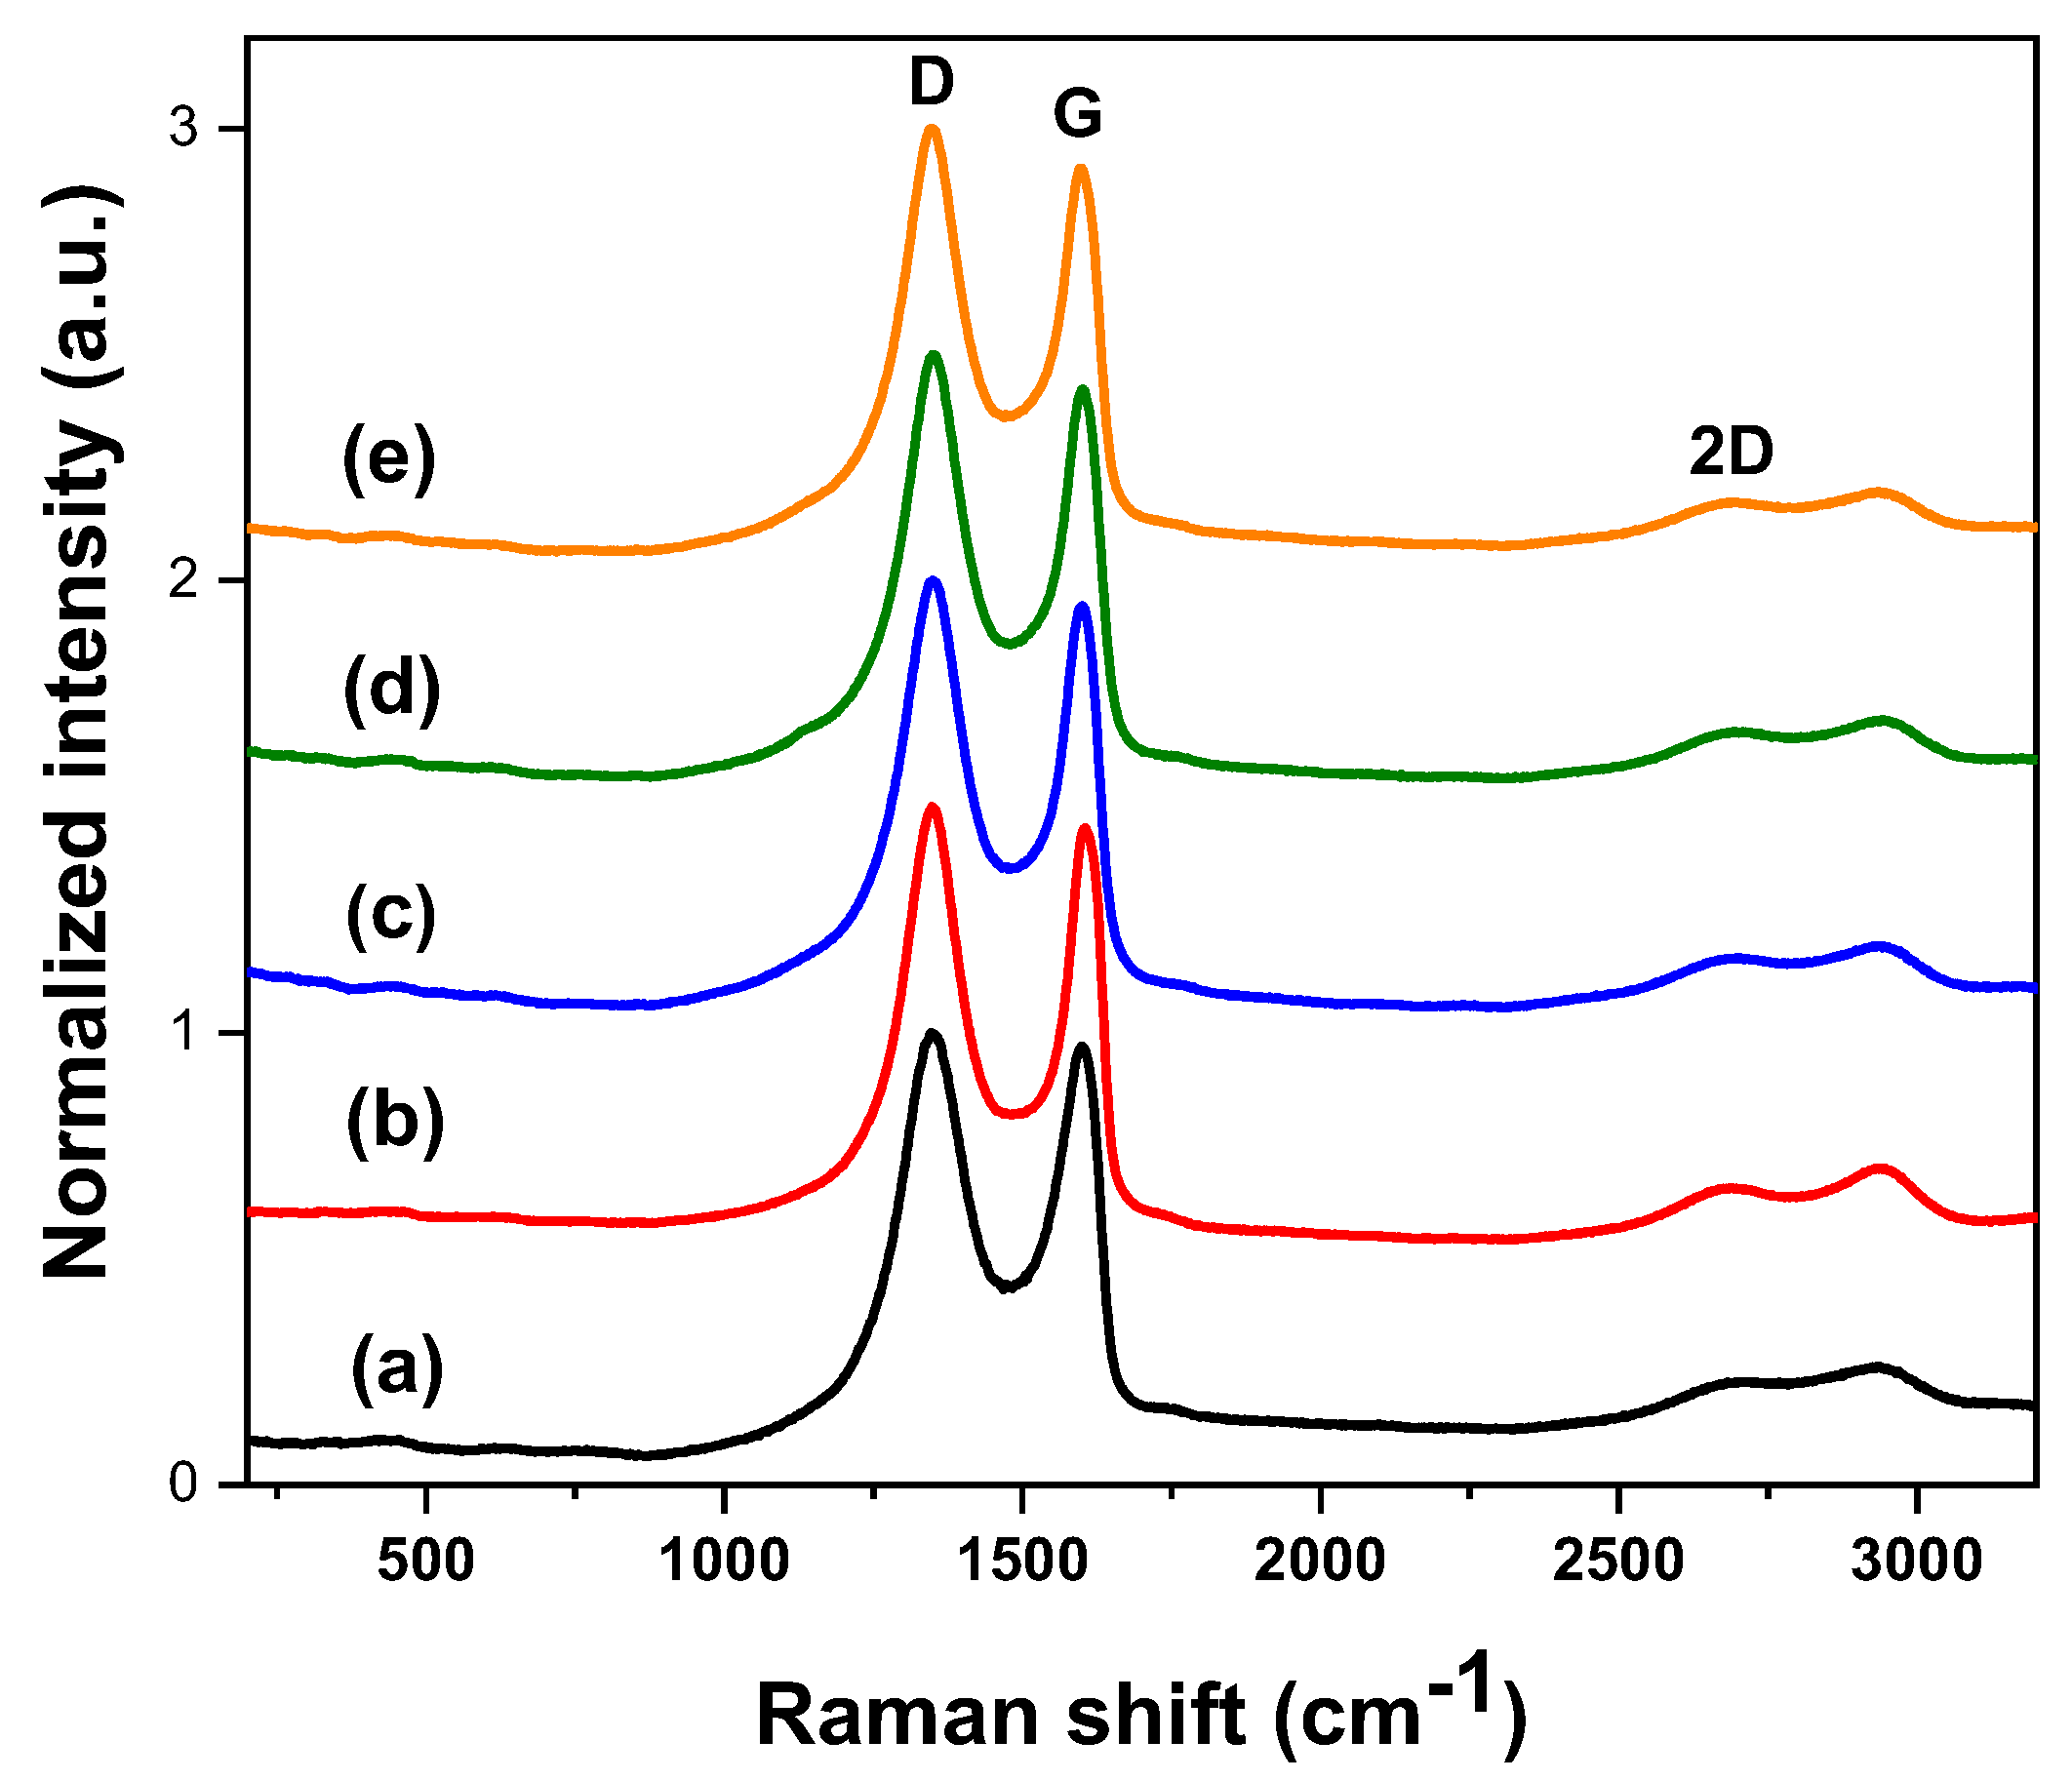
3.3.3. Raman Spectroscopy

Raman spectroscopy represents one of the most reliable techniques to identify and characterize the carbon-based materials [79]. Figure 11 presents examples of the recorded Raman spectra of the pristine (commercial) GO and of the electrodeposited Sn-rGO composites applying different current density values.
As shown in Figure 11, two peaks centered at about 1348 cm−1 (D band, breathing mode of k-point phonons of A1g symmetry) and 1599 cm−1 (G band usually assigned to the E2g phonon of C sp2 atoms) were observed in the Raman spectra of Sn-rGO composite coatings. The relative intensities of the D band to the G band (ID/IG ratio) were calculated to be about 1.03 for pristine GO. ID/IG ratio for rGO in composite coatings increased as the current density was higher, from 1.04 at 15 mA cm−2 to 1.08 at 30 mA cm−2. Higher D/G intensity ratio in Sn-rGO as compared to pristine GO suggested a decrease in the average size of the sp2 domains during electrochemical reduction process and the creation of new graphitic domains, also indicating that more defects could have been introduced during the electrochemical reduction process [58,62,80,81].

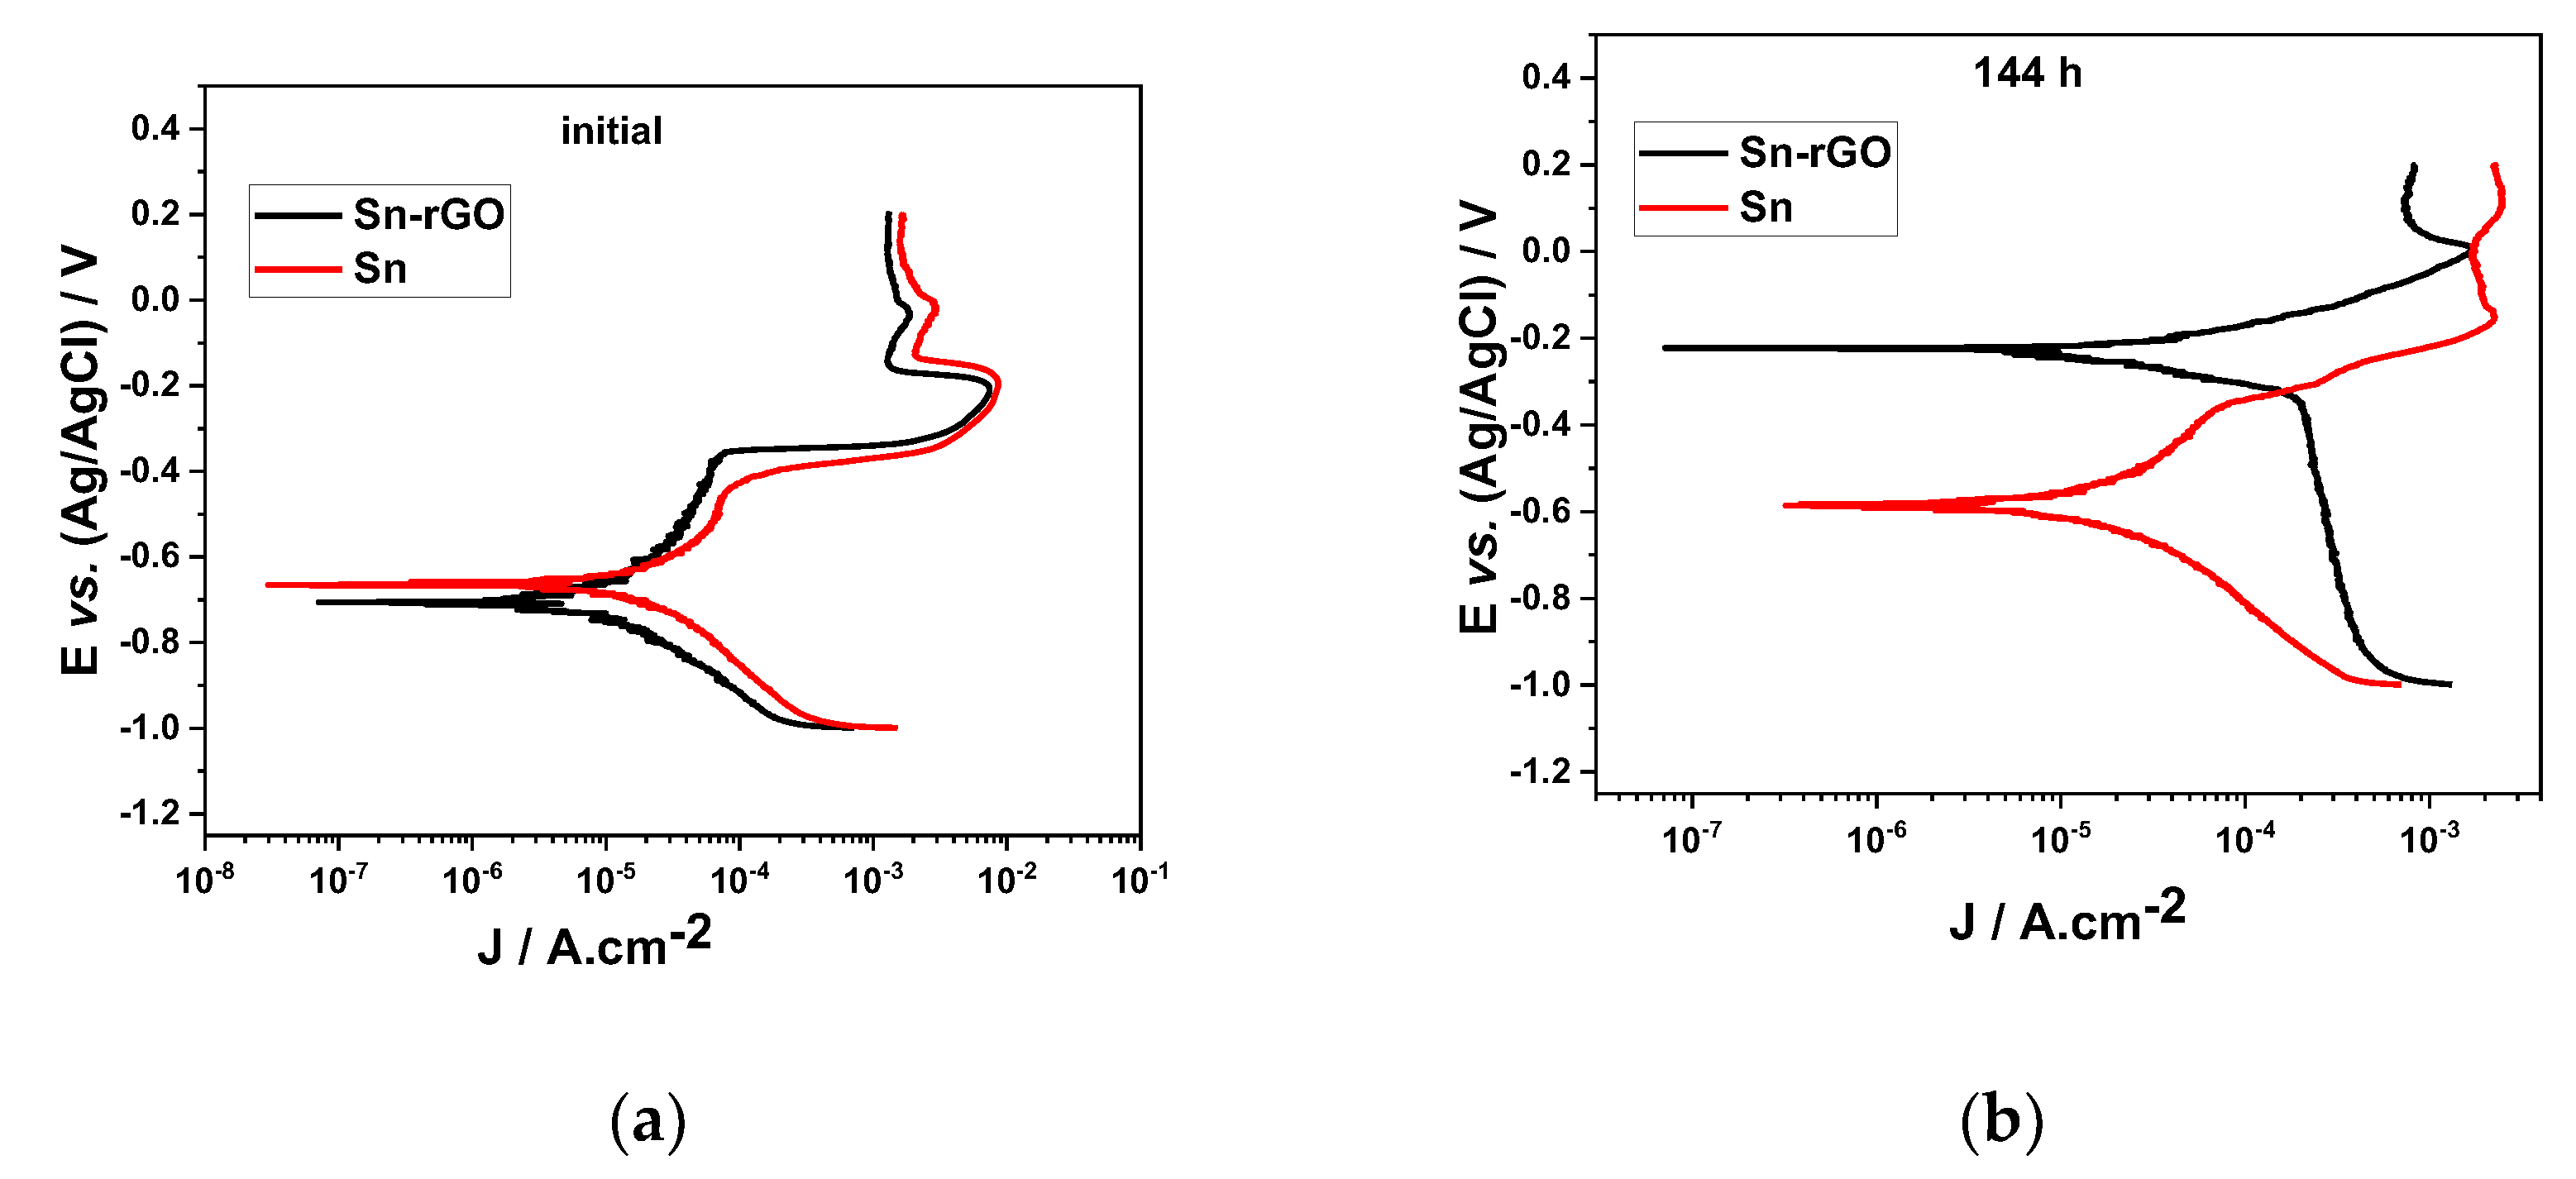
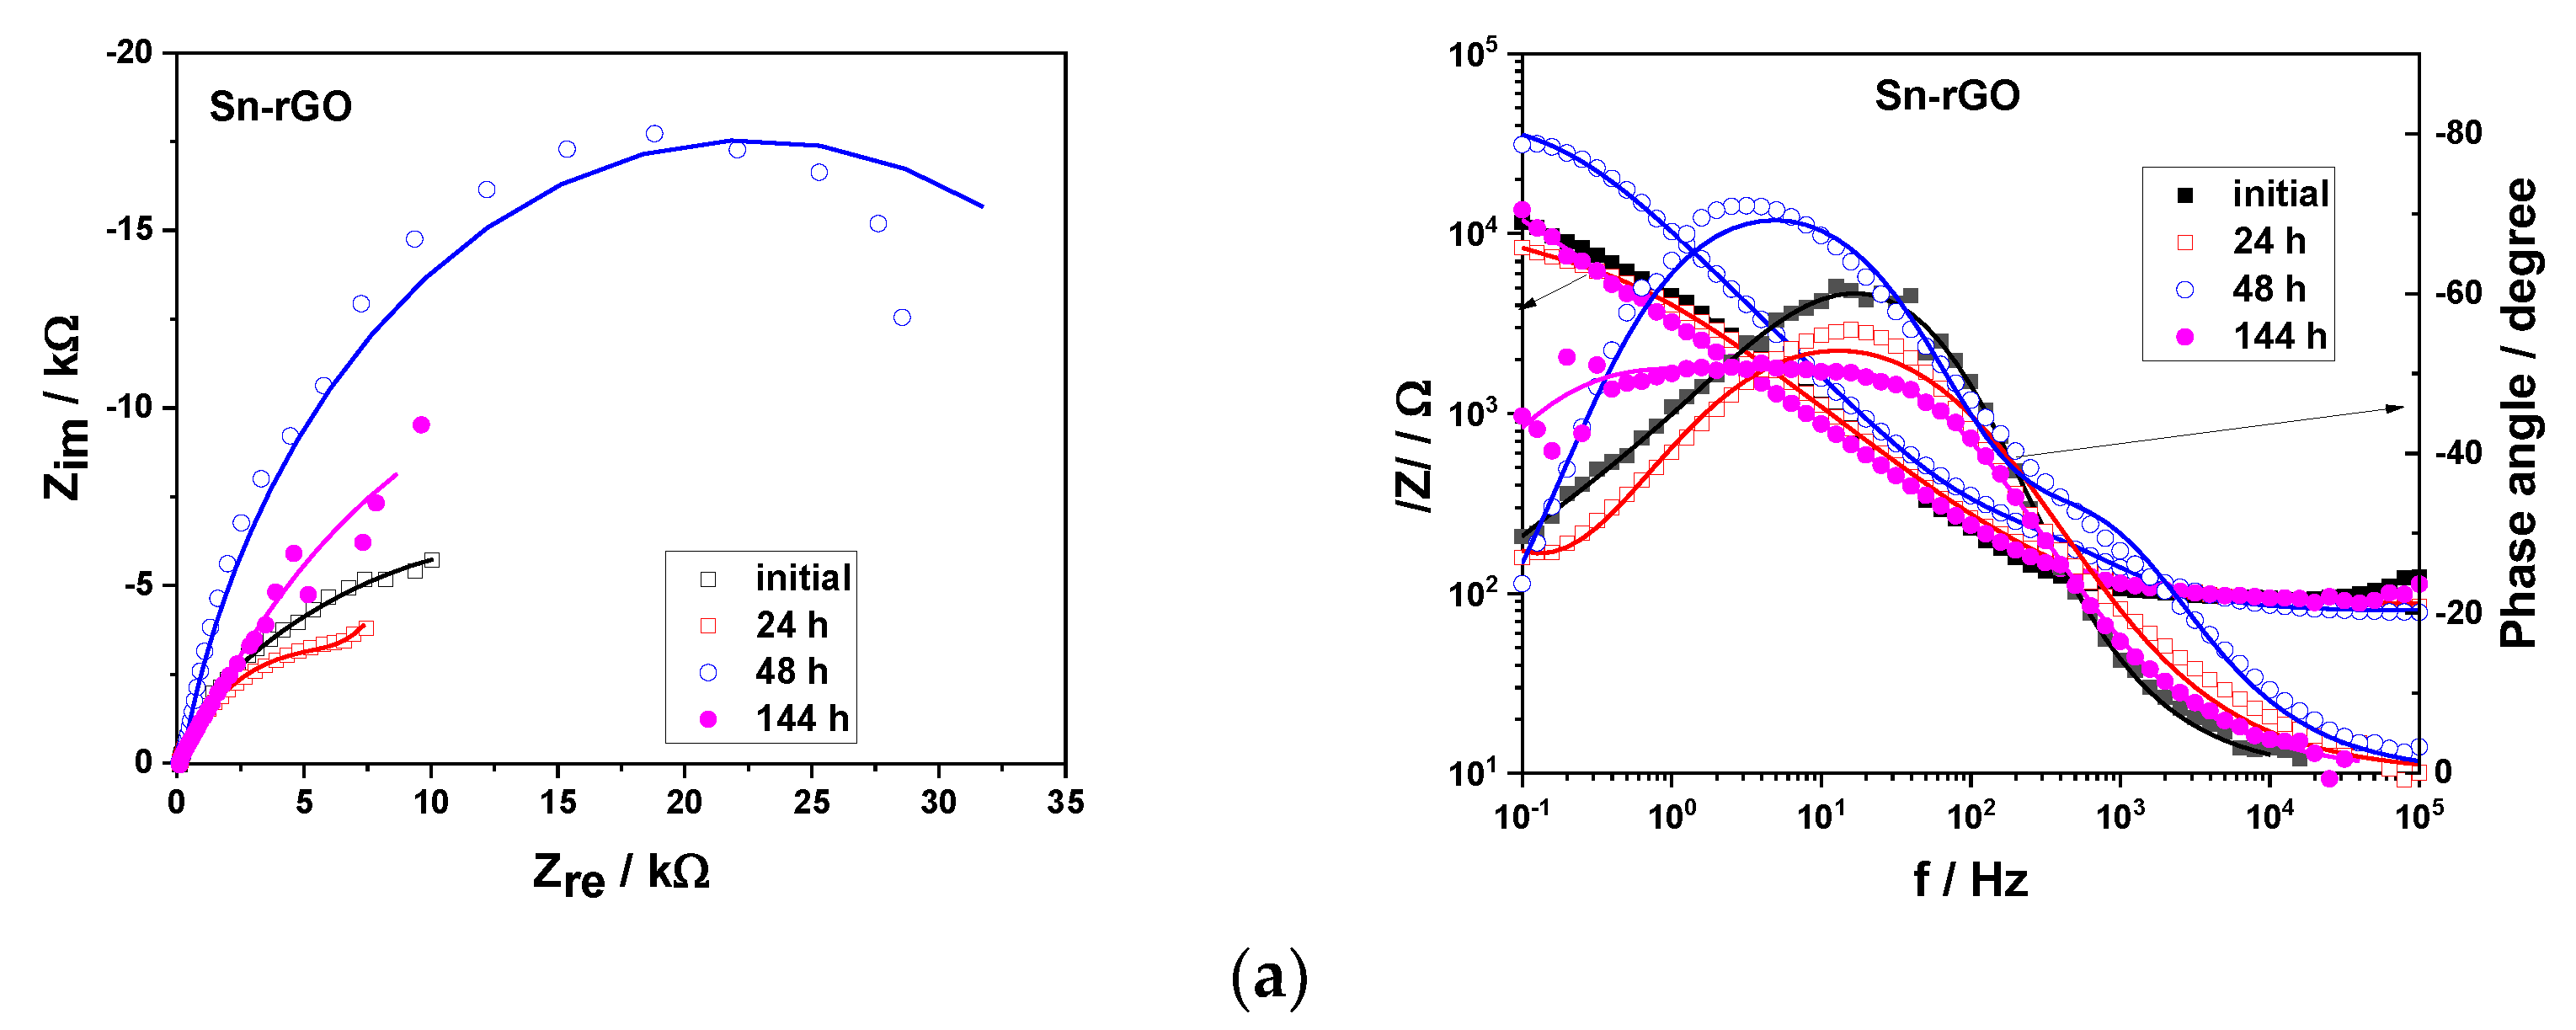
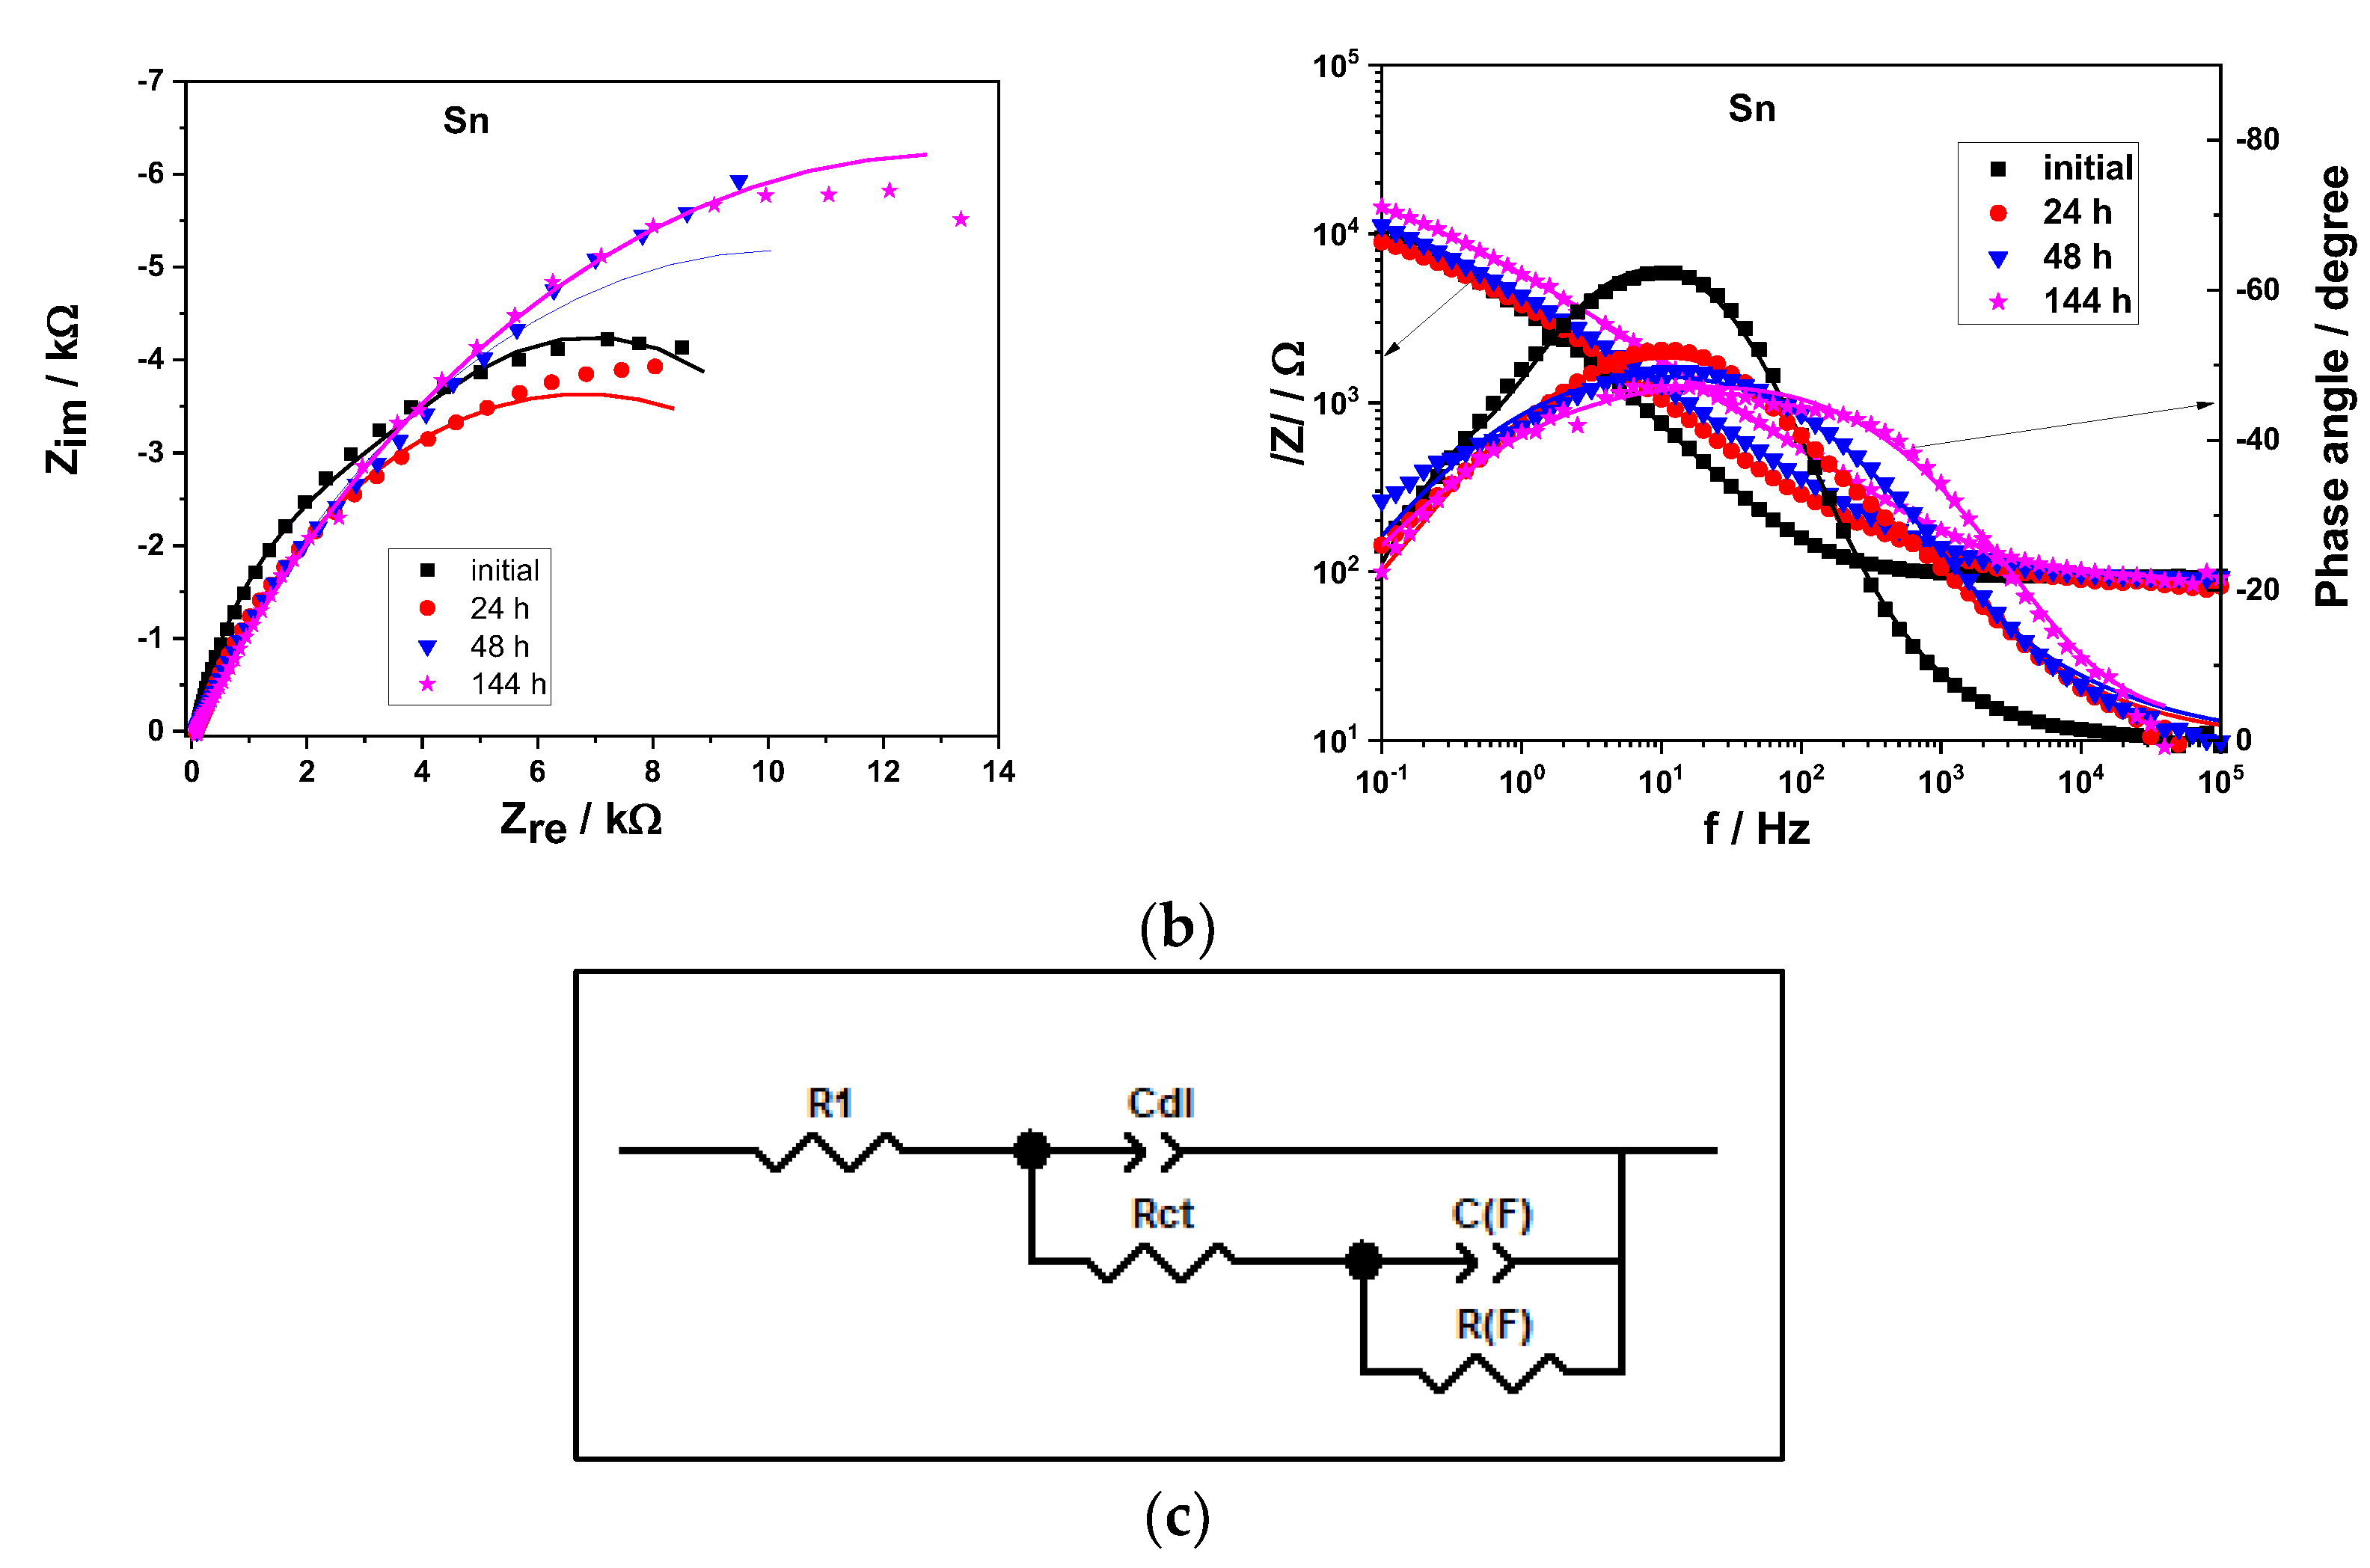
3.4. Corrosion Behavior of the Sn and Sn-rGO Composite Coatings

The comparative evaluation of the corrosion performance of the electrodeposited Sn and Sn-rGO composite coatings has been carried out involving the recorded potentiodynamic polarization curves and electrochemical impedance spectra (EIS) at open circuit potential, in aerated 0.5 M NaCl solution, after various immersion periods, up to 144 h.
Figure 12 presents the potentiodynamic polarization curves in semilogarithmic coordinates for the two studied deposits corresponding to the initial and final moment of immersion. The corrosion potential (Ecorr) and the corrosion current density (jcorr) were determined by extrapolation from the Tafel plots, and the obtained values are given in Table 3.
As illustrated in Figure 12a, on the initial moment of immersion, both coatings exhibited relatively comparable Ecorr values while the determined corrosion current density values showed a better corrosion protection provided by the Sn-rGO one. After 144 h of exposure in aggressive medium, the values of the jcorr became quite similar, regardless the coating type (see Figure 12b). Nevertheless, a significant displacement of the Ecorr towards positive direction was noticed in the case of Sn-rGO, associated with relatively lower currents on the anodic branch that could suggest a certain protection degree, due to the possible formation of a corrosion by-product layer. The possible non-uniform distribution of rGO, as well as the presence of some defects on the surface, might have allowed the diffusion of the Cl ions.
Figure 13a,b comparatively illustrates the recorded EIS spectra of Sn-rGO composite and Sn coatings recorded at open circuit potential in 0.5 M NaCl, as Nyquist and Bode plots. The proposed equivalent circuit to model the corrosion behavior of the deposits in the NaCl solution is presented in Figure 13c.
Both Nyquist diagrams show a semicircle arc in the relatively high-frequency range whose diameter is associated with the polarization resistance and may be correlated to the corrosion rate. A larger semicircle diameter for Sn-rGO specimen is evidenced, suggesting a better corrosion performance as compared to Sn deposit.
All Bode diagrams indicate a single time constant for corrosion kinetics, with the maximum modulus of impedance (|Z|) at lowest frequencies having values of 10–30 kΩ for Sn-rGO composite and about 10–13 kΩ for Sn deposit, respectively. Additionally, the maximum of the phase angle curves was recorded at 10-30 Hz frequency. At the initial moment, its value was −60° for both deposits. Then, the Sn-rGO exhibited an increase of phase angle maximum up to −70° after 48 h of exposure suggesting the formation of a slightly insulating corrosion products layer, followed by a further decrease (up to 144 h period), meaning less electrically insulating and even porous layer of products. In the case of Sn deposit, the phase angle gradually decreased up to −48° for 144 h exposure period.
The process can be modeled as a double-layer capacitor (Cdl) in parallel with a charge-transfer resistor (Rct), in series with a circuit consisting of a film capacitor (CF) in parallel with a film resistor (RF), all in series with the solution ohmic resistance (R1). During the fitting of the experimental data a constant phase element (CPE) was used instead of true double layer capacitance (Cdl) [29,58] in order to model more accurately the non-ideal behavior of Cdl capacitance.
In Table 4 the calculated values of the charge-transfer resistance (Rct) and of the film resistor (RF) for the corrosion of Sn-rGO composite and Sn coatings are presented, which were obtained by fitting the impedance data with ZView software.
It can be seen that on the initial moment of immersion coating resistances of about 24.9 kΩ for Sn-rGO, and around 4.6 kΩ for Sn coating, were estimated, which was in good agreement with the obtained results from the potentiodynamic polarization curves. As the immersion period had been increased up to 48 h, higher values of RF were noticed for both investigated coatings, suggesting the formation of a protective film on the surface. During the period 48–144 h a decrease in RF in the case of Sn-rGO occurred due to possible formation of a porous layer that allowed Cl- ions penetration, while Sn coating showed an increase in the film resistance, suggesting a less porous corrosion by-product film. Overall, the Sn-rGO composite deposit presented a slightly higher value of the film resistance as compared to the pure Sn coating.

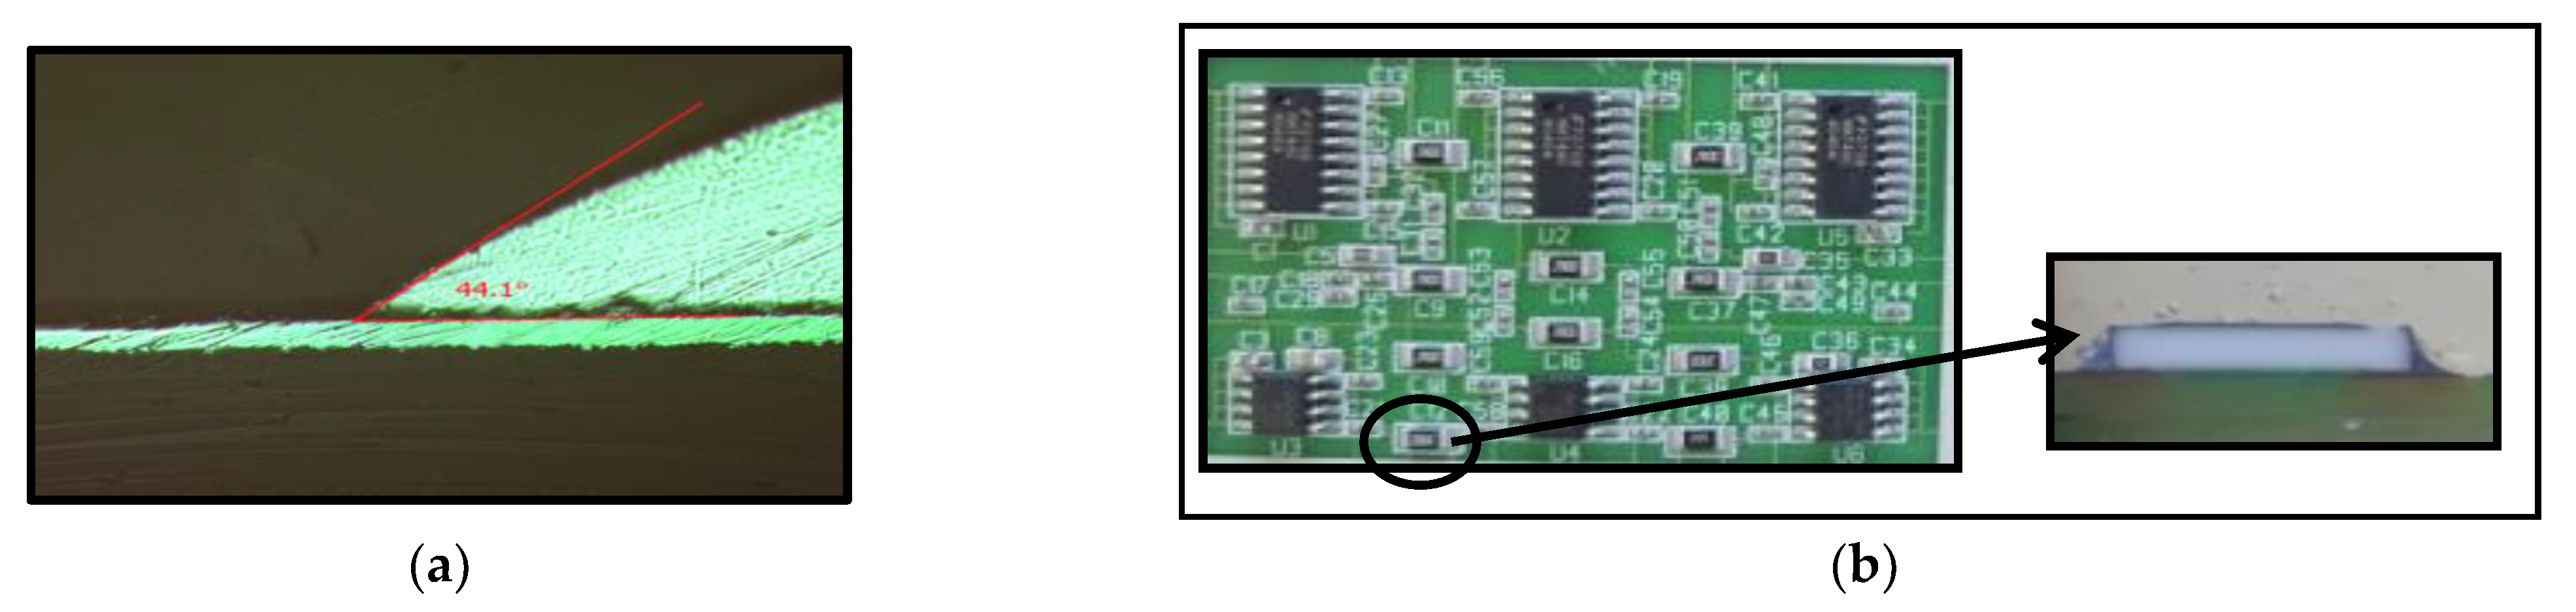
3.5. Solderability Tests

Solderability represents the ability of a base metal surface to be wetted by a molten tin alloy under certain conditions of temperature and time. Composite coatings reinforced by various types of nanoparticles, including metals, oxides, ceramic and carbon-based nanomaterials could represent an attractive route to improve the wettability of lead-free solders [33].
To obtain preliminary information on the reliability of the Sn-rGO composites as solder joints, the applied procedure followed the steps according to [59,60]. Therefore, the pre-coated with Sn-rGO specimens, using ILEG + 0.7 M SnCl2 + 20 mg L−1 GO electrolyte and applying a current density of 25 mA cm−2, were subjected to immersion in Sn3.0Ag0.5Cu molten solder bath at a temperature of 245 ± 5 °C for 10 s. After being dipped in a solder bath, the specimen surface was assessed visually to evidence the nonwetting and de-wetting areas. In addition, the wetting angle was determined as an indicator of the degree of solder contact and strength of the solder joint.
Figure 14 illustrates images of the wetting angle formed between the SAC 305 alloy and Sn-rGO composite coating after reflow at 245 °C, as well as of the sample surface mounted printed circuit boards (PCBs) and microsection through the solder joint on the PCB pre-coated with Sn-rGO composite.
As exemplified in Figure 14a, wetting angles around 44° have been determined, less than 90°, suggesting adequate solderability characteristics. However, the visual examination evidenced the presence of some nonwetting and de-wetting areas which might have been due to the possible presence of oxides on the composite surface before immersion in the molten SAC alloy. As shown in Figure 14b, the solder joints presented a proper adhesion to the substrate with no fractures. These findings suggest that the Sn-rGO composite coatings ensured a suitable bonding with the solder paste material.

4. Conclusions

The above-presented studies showed that Sn-rGO composite film can be directly co-electrodeposited from eutectic mixtures of choline chloride and ethylene glycol containing SnCl2 and graphene oxide. The involved electrolytic medium facilitated the formation of a stable and homogeneous dispersion of GO that allowed the further incorporation of rGO sheets in the tin matrix.
Uniform Sn-rGO composite coatings, exhibiting proper adhesion to the Cu metallic substrate, have been obtained.
The electrochemical investigations using cyclic voltammetry and chronoamperometry showed that that Sn-rGO composite deposition process corresponded to a nucleation and tridimensional growth controlled by diffusion, with nucleation evolving from progressive to instantaneous upon increasing the overpotential, under the applied experimental conditions.
The diffusion coefficients of Sn(II) ions at 25 °C were determined by analyzing the descending parts of the recorded j-t transients. Average values of 9.4 × 10⁻⁷ cm2 s−1 for Sn(II) species in the absence and 14.1 × 10⁻⁷ cm2 s−1 in the presence of GO, were calculated
SEM analyses, EDX maps and Raman spectroscopy evidenced the successful incorporation of graphene oxide into the metallic matrix. Furthermore, Raman spectra demonstrated that the GO had been reduced during the electrodeposition process.
X-ray diffraction patterns showed that the presence of reduced graphene oxide (rGO) in the deposit diminished the preferred orientation of tin growth along the planes (101), (112), and (301). An enhancement of the crystal growth along (200), (220), (400), (321), (420), and (501) planes in the case of Sn-rGO composite, as compared to those for pure Sn, was evidenced, too. Average sizes of the crystallites between 82 and 98 nm for pure Sn and in the range 77–92 nm for Sn-rGO composite have been determined using Scherrer equation.
A slight improvement in the corrosion performance in the case of the Sn-rGO composite coatings was noticed, as compared to pure Sn ones. In addition, the obtained results showed adequate solderability performance, so that the electrodeposited Sn-rGO composite could act as a solder layer with improved wettability, materialized by wetting angles around 44°.
While this study explored the one-step electrodeposition of Sn-rGO composite coatings from DES based electrolytes, further TEM investigations to get more detailed information on the structure, morphology, and orientation relationship of GO, rGO, Sn and Sn-rGO in the coatings will be performed. Moreover, future experiments related to the optimization of the operation conditions, including the use of higher concentrations of graphene oxide within the involved DES based electrolyte and the refining of the morphology through the use of pulsed current, are envisaged. It is expected that the improvement of the quality of the electrodeposited Sn-rGO composite coatings could contribute to the development of other interesting applications, including novel cathode materials for hydrogen evolution reaction and protective layers for bipolar plates used in proton exchange membrane fuel cells (PEMFCs).

Author Contributions

Conceptualization, writing-original draft preparation, cyclic voltammetry, chronoamperometry and solderability experiments and analysis, XRD analysis, S.C.; Raman experiments and analysis, XRD experiments, A.P.; electrodeposition experiments, A.C.; SEM investigation and analysis, D.B.; corrosion experiments and analysis, L.A.; writing—review and editing, visualization, T.V. and L.A.; funding acquisition, L.A. and M.E.; resources, M.E. All authors have read and agreed to the published version of the manuscript.

Funding

This research was partially funded by Romanian Ministry of Education and by Executive Agency for Higher Education, Research, Development and Innovation Funding, under NOVTINALBEST project 38/2016, M Era Net Program.

Data Availability Statement

Not applicable.

Conflicts of Interest

The authors declare no conflict of interest.

References

  1. Novoselov, K.S.; Geim, A.K.; Morozov, S.V.; Jiang, D.; Zhang, Y.; Dubonos, S.V.; Grigorieva, I.V.; Firsov, A.A. Electric field effect in atomically thin carbon films. Science 2004, 306, 666–669. [Google Scholar] [CrossRef] [PubMed] [Green Version]
  2. Balandin, A.A.; Ghosh, S.; Bao, W.; Calizo, I.; Teweldebrhan, D.; Miao, F.; Lau, C.N. Superior thermal conductivity of single-layer graphene. Nano. Lett. 2008, 8, 902–907. [Google Scholar] [CrossRef] [PubMed]
  3. Ray, S.C. Applications of Graphene and Graphene-Oxide Based Nanomaterials, 1st ed.; Elsevier Inc.: Amsterdam, The Netherlands; William Andrew Publishing: Waltham, MA, USA, 2015; pp. 1–38. [Google Scholar]
  4. Sadabadi, H.; Ghaderi, O.; Kordijazi, A.; Rohatgi, P.K. Graphene derivatives reinforced metal matrix nanocomposite coatings: A review. J. Met. Mater. Miner. 2022, 32, 1–14. [Google Scholar] [CrossRef]
  5. Biswal, H.J.; Vundavilli, P.R.; Gupta, A. Perspective—Electrodeposition of graphene reinforced metal matrix composites for enhanced mechanical and physical properties: A review. J. Electrochem. Soc. 2022, 167, 146501. [Google Scholar] [CrossRef]
  6. Hu, Z.; Tong, G.; Lin, D.; Chen, C.; Guo, H.; Xu, J.; Zhou, L. Graphene-reinforced metal matrix nanocomposites—A review. Mater. Sci. Technol. 2016, 32, 930–953. [Google Scholar] [CrossRef]
  7. Zhu, Y.; Pan, D.; Hu, X.; Han, H.; Lin, M.; Wang, C. An electrochemical sensor based on reduced graphene oxide/gold nanoparticles modified electrode for determination of iron in coastal waters. Sens. Actuators B Chem. 2017, 243, 1–7. [Google Scholar] [CrossRef]
  8. Hussain, A.K.; Al Naib, U.M.B. Recent developments in graphene based metal matrix composite coatings for corrosion protection application: A review. J. Met. Mater. Miner. 2019, 29, 1–9. Available online: https://jmmm.material.chula.ac.th/index.php/jmmm/article/view/540 (accessed on 17 December 2022).
  9. Zhao, J.; Pei, S.; Ren, W.; Gao, L.; Cheng, H. Efficient preparation of large-area graphene oxide sheets for transparent conductive films. ACS Nano 2010, 4, 5245–5252. [Google Scholar] [CrossRef]
  10. Paredes, J.I.; Villar-Rodil, S.; Fernandez-Merino, M.J.; Guardia, L.; Martinez-Alonso, A.; Tascon, J.M.D. Environmentally friendly approaches toward the mass production of processable graphene from graphite oxide. J. Mater. Chem. 2011, 21, 298–306. [Google Scholar] [CrossRef]
  11. Wang, G.X.; Yang, J.; Park, J.; Guo, X.L.; Wang, B.; Liu, H.; Yao, J. Facile synthesis and characterization of graphene nanosheets. J. Phys. Chem. C 2008, 112, 8192–8195. [Google Scholar] [CrossRef]
  12. Stankovich, S.; Piner, R.D.; Chen, X.Q.; Wu, N.Q.; Nguyen, S.T.; Ruoff, R.S. Stable aqueous dispersions of graphitic nanoplatelets via the reduction of exfoliated graphite oxide in the presence of poly(sodium 4-styrenesulfonate). J. Mater. Chem. 2006, 16, 155–158. [Google Scholar] [CrossRef]
  13. Williams, G.; Seger, B.; Kamat, P.V. TiO2–graphene nanocomposites. UV assisted photocatalytic reduction of graphene oxide. ACS Nano 2008, 2, 1487–1491. [Google Scholar] [CrossRef] [PubMed]
  14. Akhavan, O. Photocatalytic reduction of graphene oxides hybridized by ZnO nanoparticles in ethanol. Carbon 2011, 49, 11–18. [Google Scholar] [CrossRef]
  15. Liu, X.; Kim, H.; Guo, L.J. Optimization of thermally reduced graphene oxide for an efficient hole transport layer in polymer solar cells. Org. Electron. 2013, 14, 591–598. [Google Scholar] [CrossRef]
  16. Gao, X.; Jang, J.; Nagase, S. Hydrazine and thermal reduction of graphene oxide: Reaction mechanisms, product structures, and reaction design. J. Phys. Chem. C 2010, 114, 832–842. [Google Scholar] [CrossRef]
  17. Hung, Y.-F.; Cheng, C.; Huang, C.-K.; Yang, C.-R. A facile method for batch preparation of electrochemically reduced graphene oxide. Nanomaterials 2019, 9, 376. [Google Scholar] [CrossRef] [Green Version]
  18. Gao, F.; Qi, X.; Cai, X.; Wang, Q.; Gao, F.; Sun, W. Electrochemically reduced graphene modified carbon ionic electrode for sensitive sensing of rutin. Thin Solid Films 2012, 520, 5064–5069. [Google Scholar] [CrossRef]
  19. Hung, Y.F.; Cheng, C.; Huang, C.K.; Yang, C.R.; Tseng, S.F. Investigation of electrochemical reduction effects on graphene oxide powders for high-performance supercapacitors. Int. J. Adv. Manuf. Technol. 2021, 113, 1203–1213. [Google Scholar] [CrossRef]
  20. Quezada Renteria, J.A.; Ruiz-Garcia, C.; Sauvage, T.; Chazaro-Ruiz, L.F.; Rangel-Mendez, J.R.; Ania, C.O. Photochemical and electrochemical reduction of graphene oxide thin films: Tuning the nature of surface defects. Phys. Chem. Chem. Phys. 2020, 22, 20732–20743. [Google Scholar] [CrossRef]
  21. Liu, C.; Wang, K.; Luo, S.; Tang, Y.; Chen, L. Direct electrodeposition of graphene enabling the one-step synthesis of graphene–metal nanocomposite films. Small 2011, 7, 1203–1206. [Google Scholar] [CrossRef]
  22. Zhou, Y.G.; Chen, J.J.; Wang, F.B.; Sheng, Z.H.; Xia, X.H. A facile approach to the synthesis of highly electroactive Pt nanoparticles on graphene as an anode catalyst for direct methanol fuel cells. Chem. Commun. 2010, 46, 5951–5953. [Google Scholar] [CrossRef] [PubMed]
  23. Jiang, Y.; Lu, Y.; Li, F.; Wu, T.; Niu, L.; Chen, W. Facile electrochemical codeposition of ‘‘clean’’ graphene–Pd nanocomposite as an anode catalyst for formic acid electrooxidation. Electrochem. Commun. 2012, 19, 21–24. [Google Scholar] [CrossRef]
  24. Hilder, M.; Winther-Jensen, O.; Winther-Jensen, B.; MacFarlane, D.R. Graphene/zinc nano-composites by electrochemical co-deposition. Phys. Chem. Chem. Phys. 2012, 14, 14034–14040. [Google Scholar] [CrossRef]
  25. Kuang, D.; Xu, L.; Liu, L.; Hu, W.; Wu, Y. Graphene–nickel composites. Appl. Surf. Sci. 2013, 273, 484–490. [Google Scholar] [CrossRef]
  26. Xie, G.; Forslund, M.; Pan, J. Direct electrochemical synthesis of reduced graphene oxide (rGO)/copper composite films and their electrical/electroactive properties. ACS Appl. Mater. Interfaces 2014, 6, 7444–7455. [Google Scholar] [CrossRef]
  27. Toosinezhad, A.; Alinezhadfar, M.; Mahdavi, S. Cobalt/graphene electrodeposits: Characteristics, tribological behavior, and corrosion properties. Surf. Coat.Technol. 2020, 385, 125418. [Google Scholar] [CrossRef]
  28. Berlia, R.; Punith Kumar, M.K.; Srivastava, C. Electrochemical behavior of Sn-graphene composite coating. RSC Adv. 2015, 5, 71413–71418. [Google Scholar] [CrossRef]
  29. Gupta, A.; Srivastava, C. Optimum amount of graphene oxide for enhanced corrosion resistance by tin-graphene oxide composite coatings. Thin Solid Films 2018, 661, 98–107. [Google Scholar] [CrossRef]
  30. Hari Mohan, E.; Sarada, B.V.; Venkata Ram Naidu, R.; Salian, G.; Haridas, A.K.; Appa Rao, B.V.; Rao, T.N. Graphene-modified electrodeposited dendritic porous tin structures as binder free anode for high performance lithium-sulfur batteries. Electrochim. Acta 2016, 219, 701–710. [Google Scholar] [CrossRef]
  31. Sharma, A.; Sohn, H.-R.; Jung, J.P. Effect of Graphene Nanoplatelets on Wetting, Microstructure, and Tensile Characteristics of Sn-3.0Ag-0.5Cu (SAC) Alloy. Metall. Mater. Trans. A 2015, 47, 494–503. [Google Scholar] [CrossRef]
  32. Xu, L.Y.; Zhang, Z.K.; Jing, H.Y.; Wei, J.; Han, Y.D. Effect of graphene nanosheets on the corrosion behavior of Sn–Ag–Cu solders. J. Mater. Sci. Mater. Electron. 2015, 26, 5625–5634. [Google Scholar] [CrossRef]
  33. Zhang, P.; Xue, S.; Wang, J.; Xue, P.; Zhong, S.; Long, W. Effect of Nanoparticles Addition on the Microstructure and Properties of Lead-Free Solders: A Review. Appl. Sci. 2019, 9, 2044. [Google Scholar] [CrossRef] [Green Version]
  34. Li, M.l.; Gao, L.l.; Zhang, L.; Jiang, N.; Zhong, S.; Zhang, L. Interfacial reaction and properties of Sn/Cu solder reinforced with graphene nanosheets during solid–liquid diffusion and reflowing. J. Mater. Sci. Mater. Electron. 2021, 32, 26666–26675. [Google Scholar] [CrossRef]
  35. Rekha, M.Y.; Kamboj, A.; Srivastava, C. Electrochemical behavior of SnNi-graphene oxide composite coatings. Thin Solid Films 2018, 653, 82–92. [Google Scholar] [CrossRef]
  36. Rekha, M.Y.; Kamboj, A.; Srivastava, C. Electrochemical behaviour of SnZn-graphene oxide composite coatings. Thin Solid Films 2017, 636, 593–601. [Google Scholar] [CrossRef]
  37. Singh, S.K.; Samanta, S.; Das, A.K.; Sahoo, R.R. Tribological investigation of Ni-graphene oxide composite coating produced by pulsed electrodeposition. Surf. Interfaces 2018, 12, 61–70. [Google Scholar] [CrossRef]
  38. Szeptycka, B.; Gajewska-Midzialek, A.; Babul, T. Electrodeposition and corrosion resistance of Ni-graphene composite coatings. J. Mater. Eng. Perform. 2016, 25, 3134–3138. [Google Scholar] [CrossRef] [Green Version]
  39. Polo-Luque, M.L.; Simonet, B.M.; Valcárcel, M. Functionalization and dispersion of carbon nanotubes in ionic liquids. Trends Anal. Chem. 2013, 47, 99–110. [Google Scholar] [CrossRef]
  40. Zhang, B.; Ning, W.; Zhang, J.; Qiao, X.; Zhang, J.; He, J.; Liu, C.-Y. Stable dispersions of reduced graphene oxide in ionic liquids. J. Mater. Chem. 2010, 20, 5401–5403. [Google Scholar] [CrossRef]
  41. Abo-Hamad, A.; Hayyan, M.; Al-Saadi, M.A.; Hashim, M.A. Potential applications of deep eutectic solvents in nanotechnology. Chem. Eng. J. 2015, 273, 551–567. [Google Scholar] [CrossRef]
  42. Endres, F.; Abbott, A.P.; MacFarlane, D.R. Electrodeposition from Ionic Liquids, 2nd ed.; Wiley-VCH Verlag GmbH & Co.: Weinheim, Germany, 2017; ISBN 978-3-527-33602-9. [Google Scholar]
  43. Fang, Y.K.; Osama, M.; Rashmi, W.; Shahbaz, K.; Khalid, M.; Mjalli, F.S.; Farid, M.M. Synthesis and thermo-physical properties of deep eutectic solvent-based graphene nanofluids. Nanotechnology 2016, 27, 075702. [Google Scholar] [CrossRef] [PubMed]
  44. Li, R.; Liang, J.; Hou, Y.; Chu, Q. Enhanced corrosion performance of Zn coating by incorporating graphene oxide electrodeposited from deep eutectic solvent. RSC Adv. 2015, 5, 60698–60707. [Google Scholar] [CrossRef]
  45. Cheng, S.; Huang, C.M.; Pecht, M. A review of lead-free solders for electronic applications. Microelectron. Reliab. 2017, 75, 77–95. [Google Scholar] [CrossRef]
  46. Anicai, L.; Petica, A.; Costovici, S.; Prioteasa, P.; Visan, T. Electrodeposition of Sn and NiSn alloys coatings using choline chloride based ionic liquids: Evaluation of corrosion behavior. Electrochim. Acta 2013, 114, 868–877. [Google Scholar] [CrossRef]
  47. Gu, C.D.; Mai, Y.J.; Zhou, J.P.; You, Y.H.; Tu, J.P. Non-aqueous electrodeposition of porous tin-based film as an anode for lithium-ion battery. J. Power Sources 2012, 214, 200–207. [Google Scholar] [CrossRef]
  48. Abbott, A.P.; Capper, G.; McKenzie, K.J.; Ryder, K.S. Electrodeposition of zinc-tin alloys from deep eutectic solvents based on choline chloride. J. Electroanal. Chem. 2007, 599, 288–294. [Google Scholar] [CrossRef]
  49. Salomé, S.; Pereira, N.M.; Ferreira, E.S.; Pereira, C.M.; Silva, A.F. Tin electrodeposition from choline chloride based solvent: Influence of the hydrogen bond donors. J. Electroanal. Chem. 2013, 703, 80–87. [Google Scholar] [CrossRef]
  50. Vieira, L.; Burt, J.; Richardson, P.; Schloffer, D.; Fuchs, D.; Moser, A.; Bartlett, P.; Reid, G.; Gollas, B. Tin, bismuth, and tin-bismuth alloy electrodeposition from chlorometalate salts in deep eutectic solvents. Chemistryopen 2017, 6, 393–401. [Google Scholar] [CrossRef]
  51. Yingxin, G.; Haseeb, A.S.M.A.; Sabri, M.F.M. Electrodeposition of lead-free solder alloys. Solder. Surf. Mt. Technol. 2013, 25, 76–90. [Google Scholar] [CrossRef]
  52. Ghosh, S.; Roy, S. Characterization of tin films synthesized from ethaline deep eutectic solvent. Mater. Sci. Eng. B 2014, 190, 104–110. [Google Scholar] [CrossRef]
  53. Gao, Y.; Hu, W.; Gao, X.; Duan, B. Electrodeposition of SnBi coatings based on deep eutectic solvent. Surf. Eng. 2014, 30, 59–63. [Google Scholar] [CrossRef]
  54. Anicai, L.; Petica, A.; Costovici, S.; Moise, C.; Brincoveanu, O.; Visan, T. Electrodeposition of Sn–In alloys involving deep eutectic solvents. Coatings 2019, 9, 800. [Google Scholar] [CrossRef] [Green Version]
  55. Shaban, M.; Kholidy, I.; Ahmed, G.M.; Negem, M.; Abd El-Salam, H.M. Cyclic voltammetry growth and characterization of Sn–Ag alloys of different nanomorphologies and compositions for efficient hydrogen evolution in alkaline solutions. RSC Adv. 2019, 9, 22389–22400. [Google Scholar] [CrossRef] [PubMed] [Green Version]
  56. Rosoiu, S.P.; Costovici, S.; Moise, C.; Petica, A.; Anicai, L.; Visan, T.; Enachescu, M. Electrodeposition of ternary Sn-Cu-Ni alloys as lead-free solders using deep eutectic solvents. Electrochim. Acta 2021, 398, 139339. [Google Scholar] [CrossRef]
  57. Brandão, A.T.S.C.; Anicai, L.; Lazar, O.A.; Rosoiu, S.; Pantazi, A.; Costa, R.; Enachescu, M.; Pereira, C.M.; Silva, A.F. Electrodeposition of Sn and Sn composites with carbon materials using choline chloride-based ionic liquids. Coatings 2019, 9, 798. [Google Scholar] [CrossRef] [Green Version]
  58. Rosoiu, S.P.; Pantazi, A.G.; Petica, A.; Cojocaru, A.; Costovici, S.; Zanella, C.; Visan, T.; Anicai, L.; Enachescu, M. Electrodeposition of NiSn-rGO composite coatings from deep eutectic solvents and their physicochemical characterization. Metals 2020, 10, 1455. [Google Scholar] [CrossRef]
  59. IPC-TM-650 Procedure 2.1.1 rev.F- Microsectioning, Manual and Semi or Automatic Method. Available online: https://www.ipc.org/sites/default/files/test_methods_docs/2–1-01f.pdf (accessed on 10 December 2022).
  60. IPC-610E- Acceptability of Electronic Assemblies. Available online: http://www.ipc.org/TOC/IPC-A-610E.pdf (accessed on 10 December 2022).
  61. Chen, L.; Tang, Y.; Wang, K.; Liu, C.; Luo, S. Direct electrodeposition of reduced graphene oxide on glassy carbon electrode and its electrochemical application. Electrochem. Commun. 2011, 13, 133–137. [Google Scholar] [CrossRef]
  62. Guo, H.L.; Wang, X.F.; Qian, Q.Y.; Wang, F.B.; Xia, X.H. A green approach to the synthesis of graphene nanosheets. ACS Nano 2009, 3, 2653–2659. [Google Scholar] [CrossRef]
  63. Kumar, C.M.P.; Venkatesha, T.V.; Shabadi, R. Preparation and corrosion behavior of Ni and Ni–graphene composite coatings. Mater. Res. Bull. 2013, 48, 1477–1483. [Google Scholar] [CrossRef]
  64. Ghosh, S.; Ryder, K.; Roy, S. Electrochemical and transport properties of ethaline containing copper and tin chloride. Trans. IMF 2013, 92, 41–46. [Google Scholar] [CrossRef]
  65. Tseluikin, V.; Dzhumieva, A.; Yakovlev, A.; Mostovoy, A.; Lopukhova, M. Electrodeposition of graphene oxide modified composite coatings based on nickel-chromium alloy. Crystals 2021, 11, 415. [Google Scholar] [CrossRef]
  66. Scharifker, B.; Hills, G. Theoretical and experimental studies of multiple nucleation. Electrochim. Acta 1983, 28, 879–889. [Google Scholar] [CrossRef]
  67. Tachikawa, N.; Serizawa, N.; Katayama, Y.; Miura, T. Electrochemistry of Sn(II)/Sn in a hydrophobic room-temperature ionic liquid. Electrochim. Acta 2008, 53, 6530–6534. [Google Scholar] [CrossRef]
  68. Leong, T.-I.; Hsieh, Y.-T.; Sun, I.-W. Electrochemistry of tin in the 1-ethyl-3-methylimidazolium dicyanamide room temperature ionic liquid. Electrochim. Acta 2011, 56, 3941–3946. [Google Scholar] [CrossRef]
  69. Bard, A.J.; Faulkner, L.R. Electrochemical Methods: Fundamentals and Applications, 2nd ed.; John Wiley & Sons Inc.: New York, NY, USA, 2001; p. 163. [Google Scholar]
  70. Gunawardena, G.; Hills, G.; Montenegro, I.; Sharifker, B. Electrochemical nucleation. Part I. General considerations. J. Electroanal. Chem. 1982, 138, 225–239. [Google Scholar] [CrossRef]
  71. Alanyalioglu, M.; Segura, J.J.; Oro-Sole, J.; Casan-Pastor, N. The synthesis of graphene sheets with controlled thickness and order using surfactant-assisted electrochemical processes. Carbon 2012, 50, 142–152. [Google Scholar] [CrossRef]
  72. Toh, S.Y.; Loh, K.S.; Kamarudin, S.K.; Daud, W.R.W. Graphene production via electrochemical reduction of graphene oxide: Synthesis and characterization. Chem. Eng. J. 2014, 251, 422–434. [Google Scholar] [CrossRef]
  73. Hilder, M.; Winther-Jensen, B.; Li, D.; Forsyth, M.; MacFarlane, D.R. Direct electro-deposition of graphene from aqueous suspensions. Phys. Chem. Chem. Phys. 2011, 13, 9187–9193. [Google Scholar] [CrossRef]
  74. Shao, Y.; Wang, J.; Engelhard, M.; Wang, C.; Lin, Y. Facile and controllable electrochemical reduction of graphene oxide and its applications. J. Mater. Chem. 2010, 20, 743–748. [Google Scholar] [CrossRef]
  75. Sharma, A.; Jang, Y.J.; Jung, J.P. Effect of current density on morphology of electroplated tin. Surf. Eng. 2014, 31, 458–464. [Google Scholar] [CrossRef]
  76. Praveen, B.M.; Venkatesha, T.V. Electrodeposition and properties of Zn-nanosized TiO2 composite coatings. Appl. Surf. Sci. 2008, 254, 2418–2424. [Google Scholar] [CrossRef]
  77. Liu, C.; Su, F.; Liang, J. Producing cobalt–graphene composite coating by pulse electrodeposition with excellent wear and corrosion resistance. Appl. Surf. Sci. 2015, 351, 889–896. [Google Scholar] [CrossRef]
  78. Bérubé, L.P.; L’Espérance, G. A quantitative method of determining the degree of texture of zinc electrodeposits. J. Electrochem. Soc. 1989, 136, 2314–2315. [Google Scholar] [CrossRef]
  79. Saito, R.; Hofmann, M.; Dresselhaus, G.; Jorio, A.; Dresselhaus, M. Raman spectroscopy of graphene and carbon nanotubes. Adv. Phys. 2011, 60, 413–550. [Google Scholar] [CrossRef]
  80. Wang, G.; Wang, B.; Wang, X.; Park, J.; Dou, S.; Ahn, H.; Kim, K. Sn/graphene nanocomposite with 3D architecture for enhanced reversible lithium storage in lithium ion batteries. J. Mater. Chem. 2009, 19, 8378–8384. [Google Scholar] [CrossRef]
  81. Feng, B.; Xie, J.; Cao, G.; Zhu, T.; Zhao, X. Facile synthesis of ultrafine CoSn nanocrystals anchored on graphene by one-pot route and the improved electrochemical Li-storage properties. New J. Chem. 2013, 37, 474–480. [Google Scholar] [CrossRef]
Figure 1. Cyclic voltammograms (CVs) on GC working electrode at 20 mV s−1 in ILEG and ILEG containing 20 mg L−1 GO, 25 °C.
Metals 13 00203 g001
Figure 2. Cyclic voltammograms on GC at scan rate 20 mV s−1 in blank ILEG (1), ILEG containing 0.05 M SnCl2 (2) and 0.05 M SnCl2 and 20 mg L−1 GO (3), 25 °C. The inset shows the crossover in the encircled area.
Metals 13 00203 g002
Figure 3. Cyclic voltammograms on GC electrode in ILEG containing: (a) 0.05 M SnCl2 and (b) 0.05 M SnCl2 + 20 mg L−1 GO, at different scan rates, 25 °C; (c) cathodic peak current density vs. square root of scan rate.
Metals 13 00203 g003
Figure 4. Potentiostatic current-time transients for the electrodeposition of Sn-rGO (A) from ILEG + 0.05 M SnCl2 + 20 mg L−1 GO at 25 °C on GC electrode, at different potentials: (a) −460 mV, (b) −480 mV, (c) −500 mV, (d) −520 mV, (e) −540 mV, (f) −560 mV, (g) −580 mV. The inset shows the dependence of i vs. t−1/2 and linear fitting at −580 mV. (B) Non-dimensional plots for the transients from (A): instantaneous (I, red line), progressive (P, blue line) and experimental data (black lines).
Metals 13 00203 g004
Figure 5. Potentiostatic current-time transients for the electrodeposition of Sn (A) from ILEG + 0.05 M SnCl2 at 25 °C on GC electrode, at different potentials: (a) −420, (b) −440, (c) −460, (d) −480, (e) −500, (f) −520, (g) −540 mV. The inset shows the dependence of i vs. t−1/2 and linear fitting at −520 mV. (B) Non-dimensional plots for the transients from (A): instantaneous (I, red line), progressive (P, blue line) and experimental data (black line).
Metals 13 00203 g005
Figure 6. Double logarithmic plot of current vs. time for the rising part of the current transients recorded for Sn-rGO deposition from ILEG + 0.05 M SnCl2 + 20 mg L−1 GO. Various applied potentials: (a) −450 mV, (b) −470 mV, (c) −490 mV, (d) −510 mV, (e) −530 mV.
Metals 13 00203 g006
Figure 7. SEM images of: (A) Sn film electrodeposited at 15 mA cm−2 from ILEG + 0.7 M SnCl2 and (BE) Sn-rGO film electrodeposited from ILEG + 0.7 M SnCl2 + 20 mg L−1 GO at different current densities: (B) 15 mA cm−2, (C) 20 mA cm−2, (D) 25 mA cm−2, (E) 30 mA cm−2; temperature 70 °C, electric charge 18 C cm−2, different magnifications.
Metals 13 00203 g007
Figure 8. (a) EDX maps of elemental distribution for: Sn (b); C (c) and O (d) in the case of Sn-rGO composite coating electrodeposited from ILEG + 0.7 M SnCl2 + 20 mg L−1 GO at 25 mA cm−2; temperature 70 °C, electric charge 18 C cm−2.
Metals 13 00203 g008
Figure 9. Comparative X-ray patterns of: (a) Sn electrodeposited at 15 mA cm−2 from ILEG + 0.7 M SnCl2 and (be) Sn-rGO electrodeposited from ILEG + 0.7 M SnCl2 + 20 mg L−1 GO at different current densities: (b) 15 mA cm−2; (c) 20 mA cm−2; (d) 25 mA cm−2; (e) 30 mA cm−2; temperature 70 °C.
Metals 13 00203 g009
Figure 10. Texture coefficient values for different planes of Sn and Sn-rGO composite coatings calculated from XRD peak intensities (j =15 mA cm−2).
Metals 13 00203 g010
Figure 11. Comparative Raman spectra of: (a) graphene oxide and (b–e) Sn-rGO composite coatings obtained at different current densities: (b) 15 mA cm−2, (c) 20 mA cm−2, (d) 25 mA cm−2 and (e) 30 mA cm−2.
Metals 13 00203 g011
Figure 12. Polarization curves in semilogarithmic coordinates in 0.5 M NaCl for Sn and Sn-rGO composite coatings corresponding to the initial (a) and final (b) moments of immersion (25 °C, 1 mV s−1).
Metals 13 00203 g012
Figure 13. Nyquist (left) and Bode (right) plots for continuous immersion periods in 0.5 M NaCl: (a) Sn-rGO composite and (b) Sn coatings. Solid lines are the fit of the measured points using the equivalent circuit shown in (c).
Metals 13 00203 g013aMetals 13 00203 g013b
Figure 14. (a) Optical micrograph of the prepared microsection for the measurement of the wetting angle formed between the SAC 305 alloy and Sn-rGO composite coating after reflow at 245 °C; (b) images of the sample surface mounted PCBs and microsection through the solder joint on the PCB pre-coated with Sn-rGO composite.
Metals 13 00203 g014
Table 1. Results from previous reports regarding the electrodeposition of Sn and Sn alloy composites with graphene related materials involving aqueous electrolytes.
Coating TypeMetallic
Substrate
Electrolyte
Composition
Main Operation ParametersApplicationsReference
Sn
Sn + G composite
Mild steel9.2 g L−1 SnCl26.5 mA cm−2 for 20 min.
RT
pH 3.5
mild stirring
Corrosion protection[28]
26.7 g L−1 NH4Cl
30.9 g L−1 H3BO3
43.6 g L−1 Na gluconate
0.05 g L−1 G
Sn
Sn GO composite
Mild steel20 g L−1 SnSO46.25 mA cm−2 for
20 min.
RT
pH 4.0
mild stirring
Corrosion protection[29]
140 g L−1 C6H11NaO7
20 g L−1 C2H3NaO2
0.5 g L−1 SLS
0.125–2.5 g L−1 GO
Sn
Sn/rGO and
Sn/G/rGO composites
Carbon paper21.44 g L−1 SnSO42 A cm−2 for 10 s
RT
mild stirring
Binder free anode for high performance Li-S batteries[30]
54 mL L−1 conc.H2SO4(67–70%)
0.8 g L−1 GO
96.5Sn–3Ag–0.5Cu (denoted SAC)
SAC/GNS composites
Individual rod specimens (ϕ 6.5 × 3 mm)Powder metallurgy methodThe increase of the solder corrosion resistance for electronic packaging applications[32]
Sn-Ni alloy
Sn-Ni/GO composite
Mild steel50 g L−1 SnCl2 • 2 H2O3 mA cm−2 for
20 min.
45–50 °C
pH 2.5
mild stirring
Corrosion protection[35]
300 g L−1 NiCl2 • 6 H2O
85 g L−1 NH4HF2
2 g L−1 CTAB
0.125–0.5 g L−1 GO
Sn-Zn alloy
Sn-Zn/GO composite
Mild steel20 g L−1 SnSO46.25 mA cm−2 for
20 min.
RT
pH 4.5
mild stirring
Corrosion protection[36]
20 g L−1 ZnSO4 • 7 H2O
140 g L−1 C6H11NaO7
20 g L−1 C2H3NaO2
0.5 g L−1 SLS
0.125–0.5 g L−1 GO
Table 2. Results from the literature data regarding the electrodeposition of Sn and Sn alloys from DES based electrolytes.
Coating TypeMetallic
Substrate
Type of DESPrecursor of Sn2+ IonsMain Operating ParametersApplicationReference
SnLow carbon steelCholine chloride-ethylene glycol (1:2 molar ratio)0.05 M SnCl2 • 2H2O1.57 mA cm−2 for 3600 s
25–45 °C
Stirring (700–1300 rpm)
Protective coatings[52]
SnCu

Mild steel
Choline chloride-ethylene glycol (1:2 molar ratio);

Choline chloride-malonic acid (1:1 molar ratio)
0.5 M SnCl2 • 2H2O2–10 mA cm−2 for
20 min.
40–80 °C
1–10 mA cm−2 for
15 min.
90 °C
Protective coatings[46]
SnCu foilCholine chloride-ethylene glycol (1:2 molar ratio)0.1 M SnCl2 • 2H2OConstant voltages between 0.5–0.7 V
for 2–15 min.
RT
Anode
for lithium-ion battery
[47]
SnBi alloyCu foilCholine chloride-ethylene glycol (1:2 molar ratio)0.05 mol L−1 SnCl2Constant potentials between −1.1 and −1.5 V vs. Ag wire ref. for
1 C cm−2
90 °C
Solder alloy showing composition around the eutectic point[53]
0.05 mol L−1 BiCl3
0.1 mol L−1 H3BO3
SnIn alloyCuCholine chloride-ethylene glycol (1:2 molar ratio)0.05–0.1 M InCl32–10 mA cm−2 for
30 min.
60 °C
Solder alloy showing composition around the eutectic point[54]
0.03–0.05 M SnCl2 • 2 H2O
SnAg alloyPt
Cu
Choline chloride-ethylene glycol (1:2 molar ratio)0.03–0.075 M SnCl210–20 mA cm−2 for 20–25 min.
40 °C
Solder alloy
Decorative coatings
Electrocatalyst for HER in alkaline solutions
[55]
0.05–0.15 M AgCl
0.003–0.075 M C5H11NO2S (methionine)
SnCuNiCuCholine chloride-ethylene glycol (1:2 molar ratio)500 mM SnCl2 • 2 H2O8 mA cm−2 for
30 min.
60 °C
stirring
Solder alloy showing Sn-0.65Cu-0.06Ni stoichiometry close to the commercial one[56]
0.055 mM NiCl2 • 6 H2O
0.345 mM CuCl2 • 2 H2O
Table 3. Values of corrosion parameters from polarization curves in 0.5 M NaCl for Sn-rGO and Sn coatings after different conditioning periods.
Immersion
Period
Sn-rGOSn
Ecorr,
V/Ag/AgCl
jcorr,
μA cm−2
Ecorr,
V/Ag/AgCl
jcorr,
μA cm−2
Initial−0.7078.48 ± 0.24−0.66115.84 ± 1.22
144 h−0.24318.96 ± 0.58−0.5115.92 ± 2.17
Table 4. Values of Rct and RF by fitting impedance results for Sn-rGO composite and Sn coatings after exposure to 0.5 M NaCl solution for different times using the equivalent circuit proposed in Figure 12c. (The quality of the fitting was assessed considering the value of χ2 < 10−3).
Immersion
Period
Sn-rGOSn
Rct/ΩRF/ΩRct/ΩRF/Ω
Initial412124,94172794631
24 h978316,304117312,306
48 h30044,75725320,165
144 h389032,5412526,259
Disclaimer/Publisher’s Note: The statements, opinions and data contained in all publications are solely those of the individual author(s) and contributor(s) and not of MDPI and/or the editor(s). MDPI and/or the editor(s) disclaim responsibility for any injury to people or property resulting from any ideas, methods, instructions or products referred to in the content.

