
Preparation of Spinel-Type Black Pigments Using Microwave-Assisted Calcination of Stainless Steel Dust: The Effect of Manganese Molar Content

 , ,
, ,
Abstract
:1. Introduction
2. Experiment
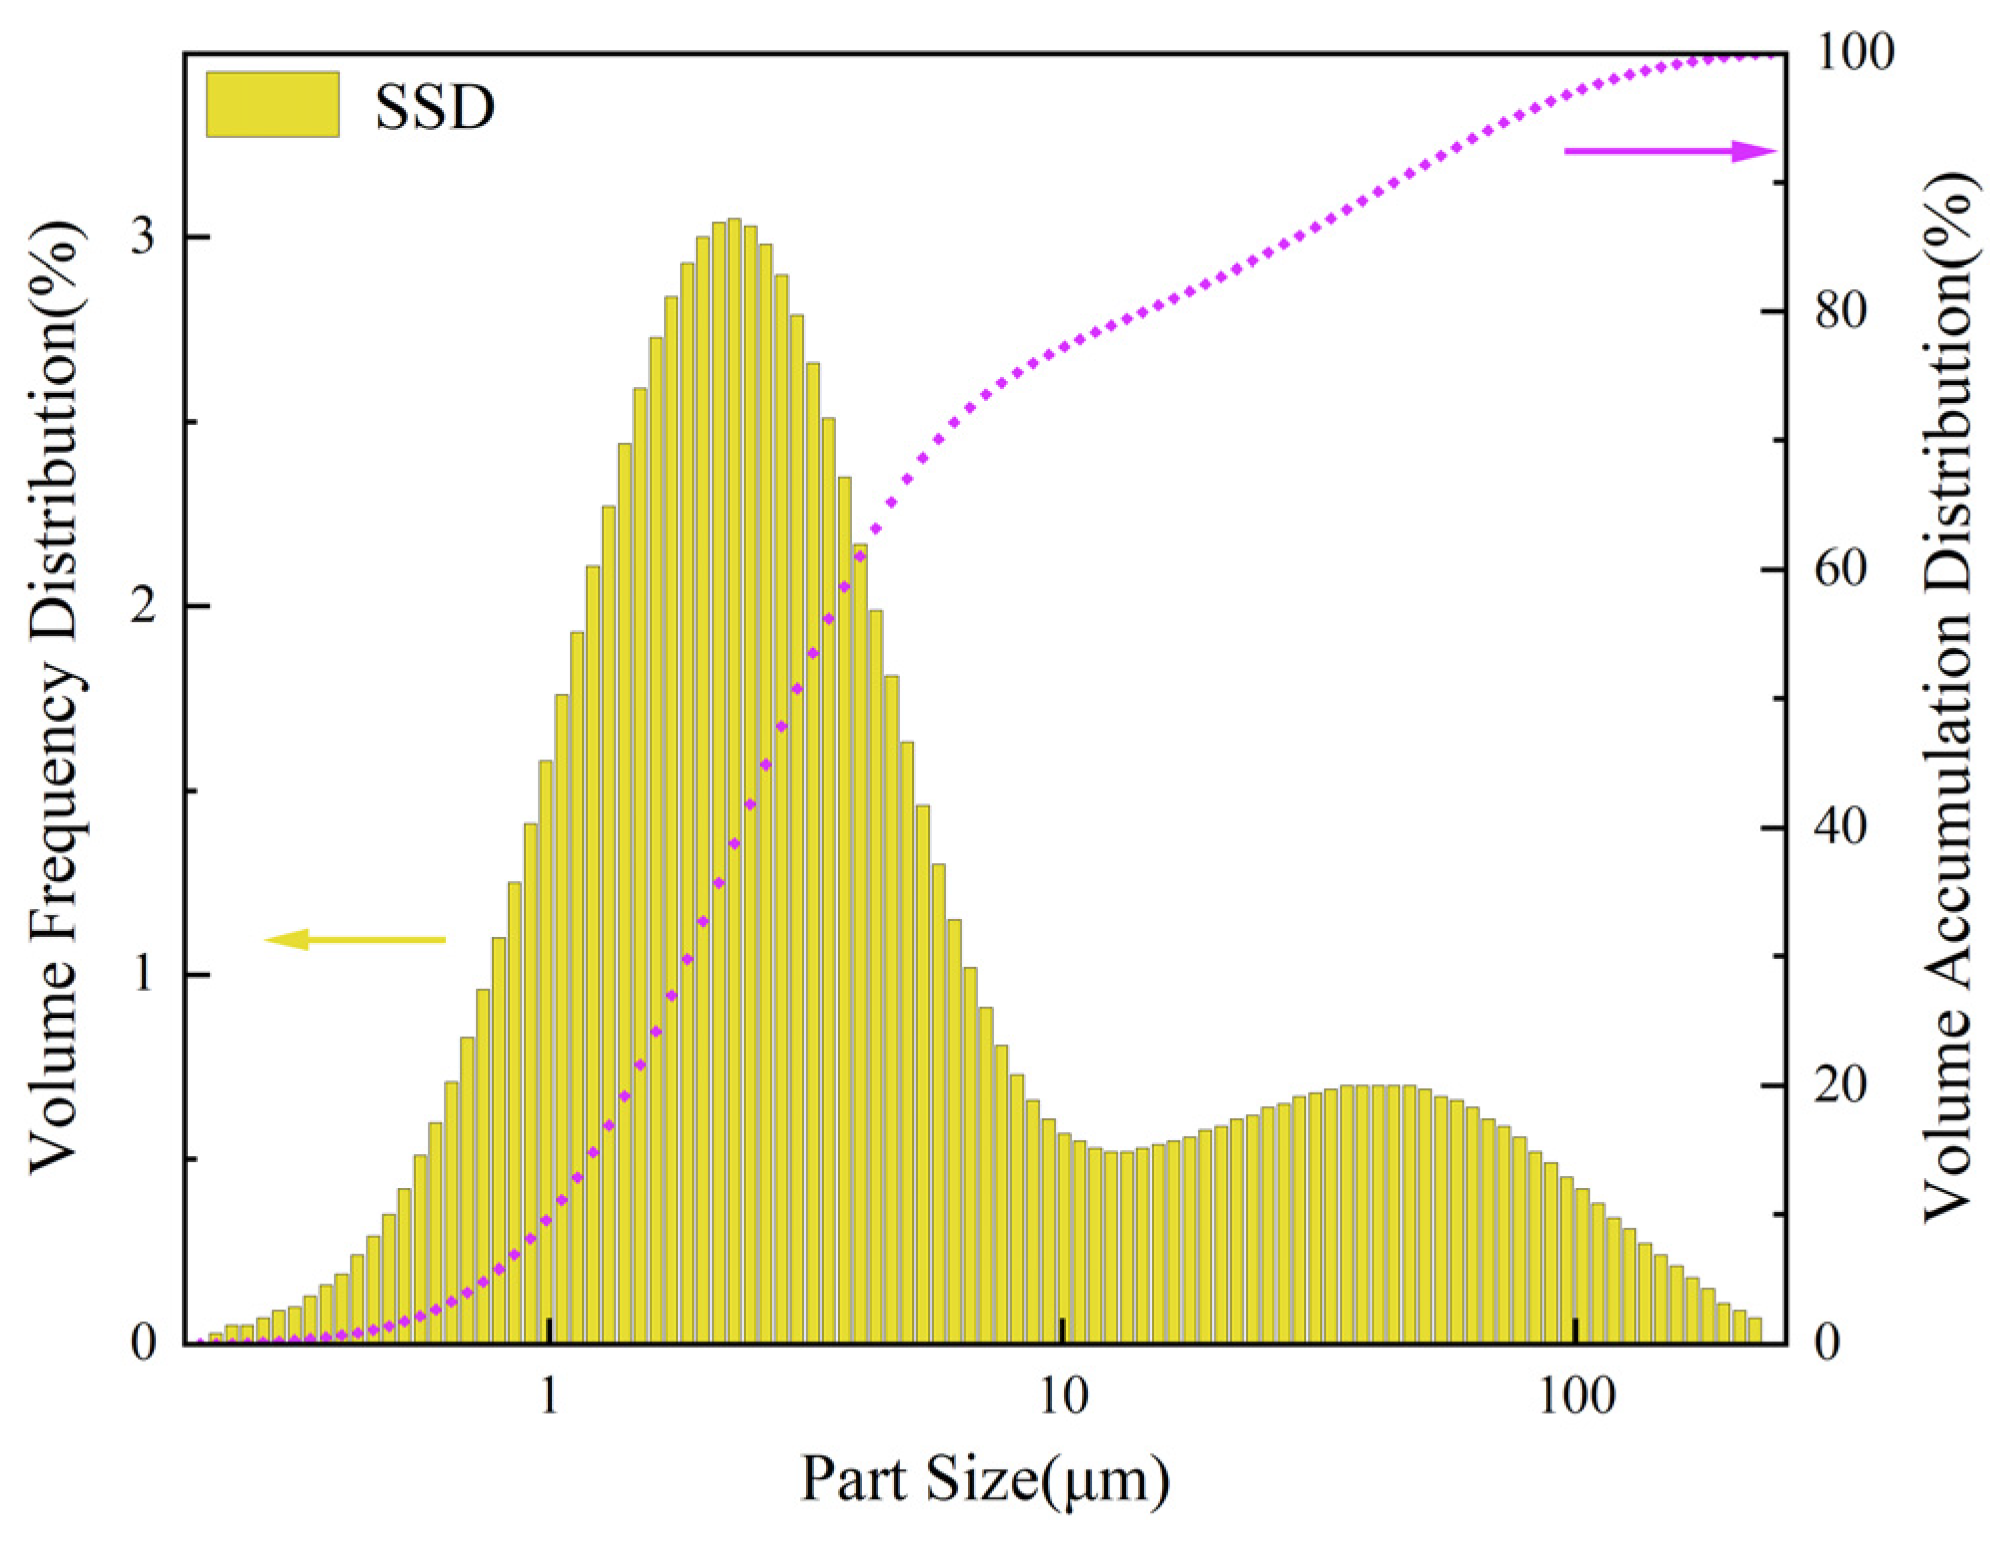
2.1. Raw Material
2.2. Process of Preparing Black Ceramic Pigments
2.3. Stability Test
2.4. Application of Pigments in Ceramic Glaze Preparation
2.5. Characterizations
3. Results and Analysis
3.1. Thermodynamic Analysis of the Fe2O3–Cr2O3–NiO–MnO Reaction System
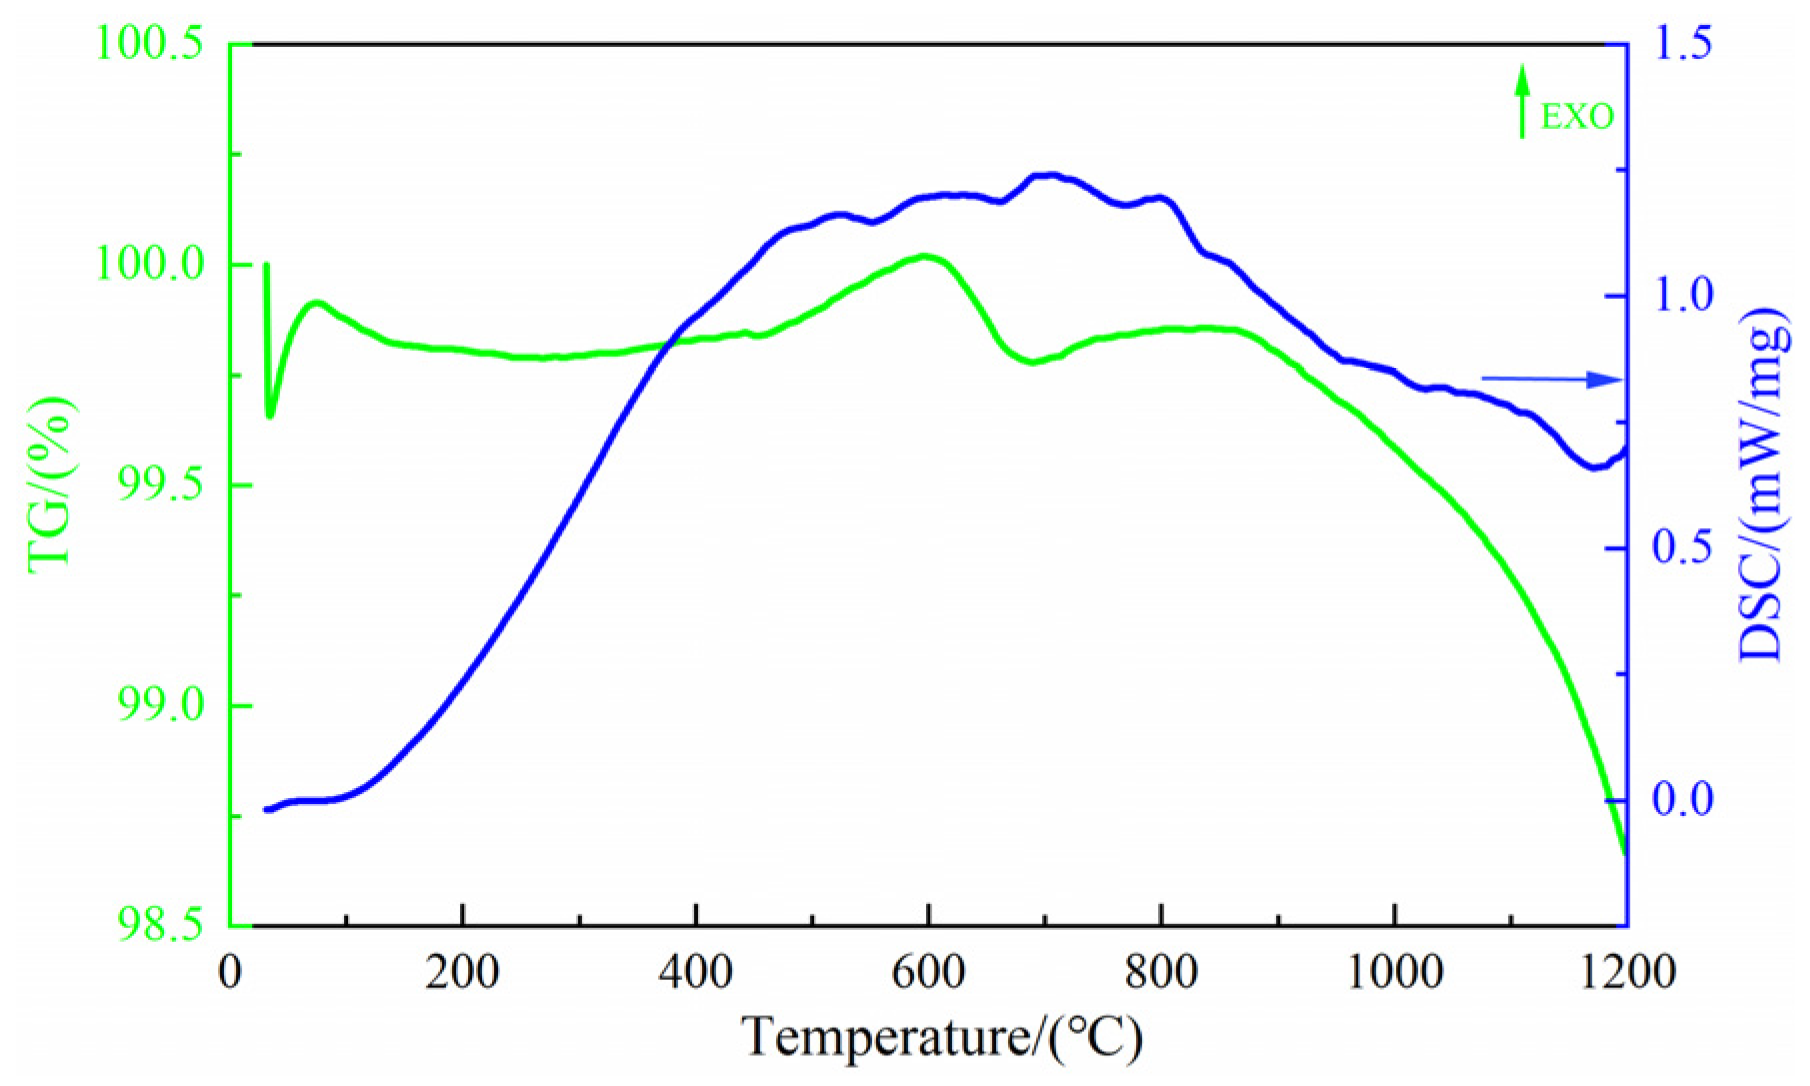
3.2. Thermal Stability of the Raw Mixture
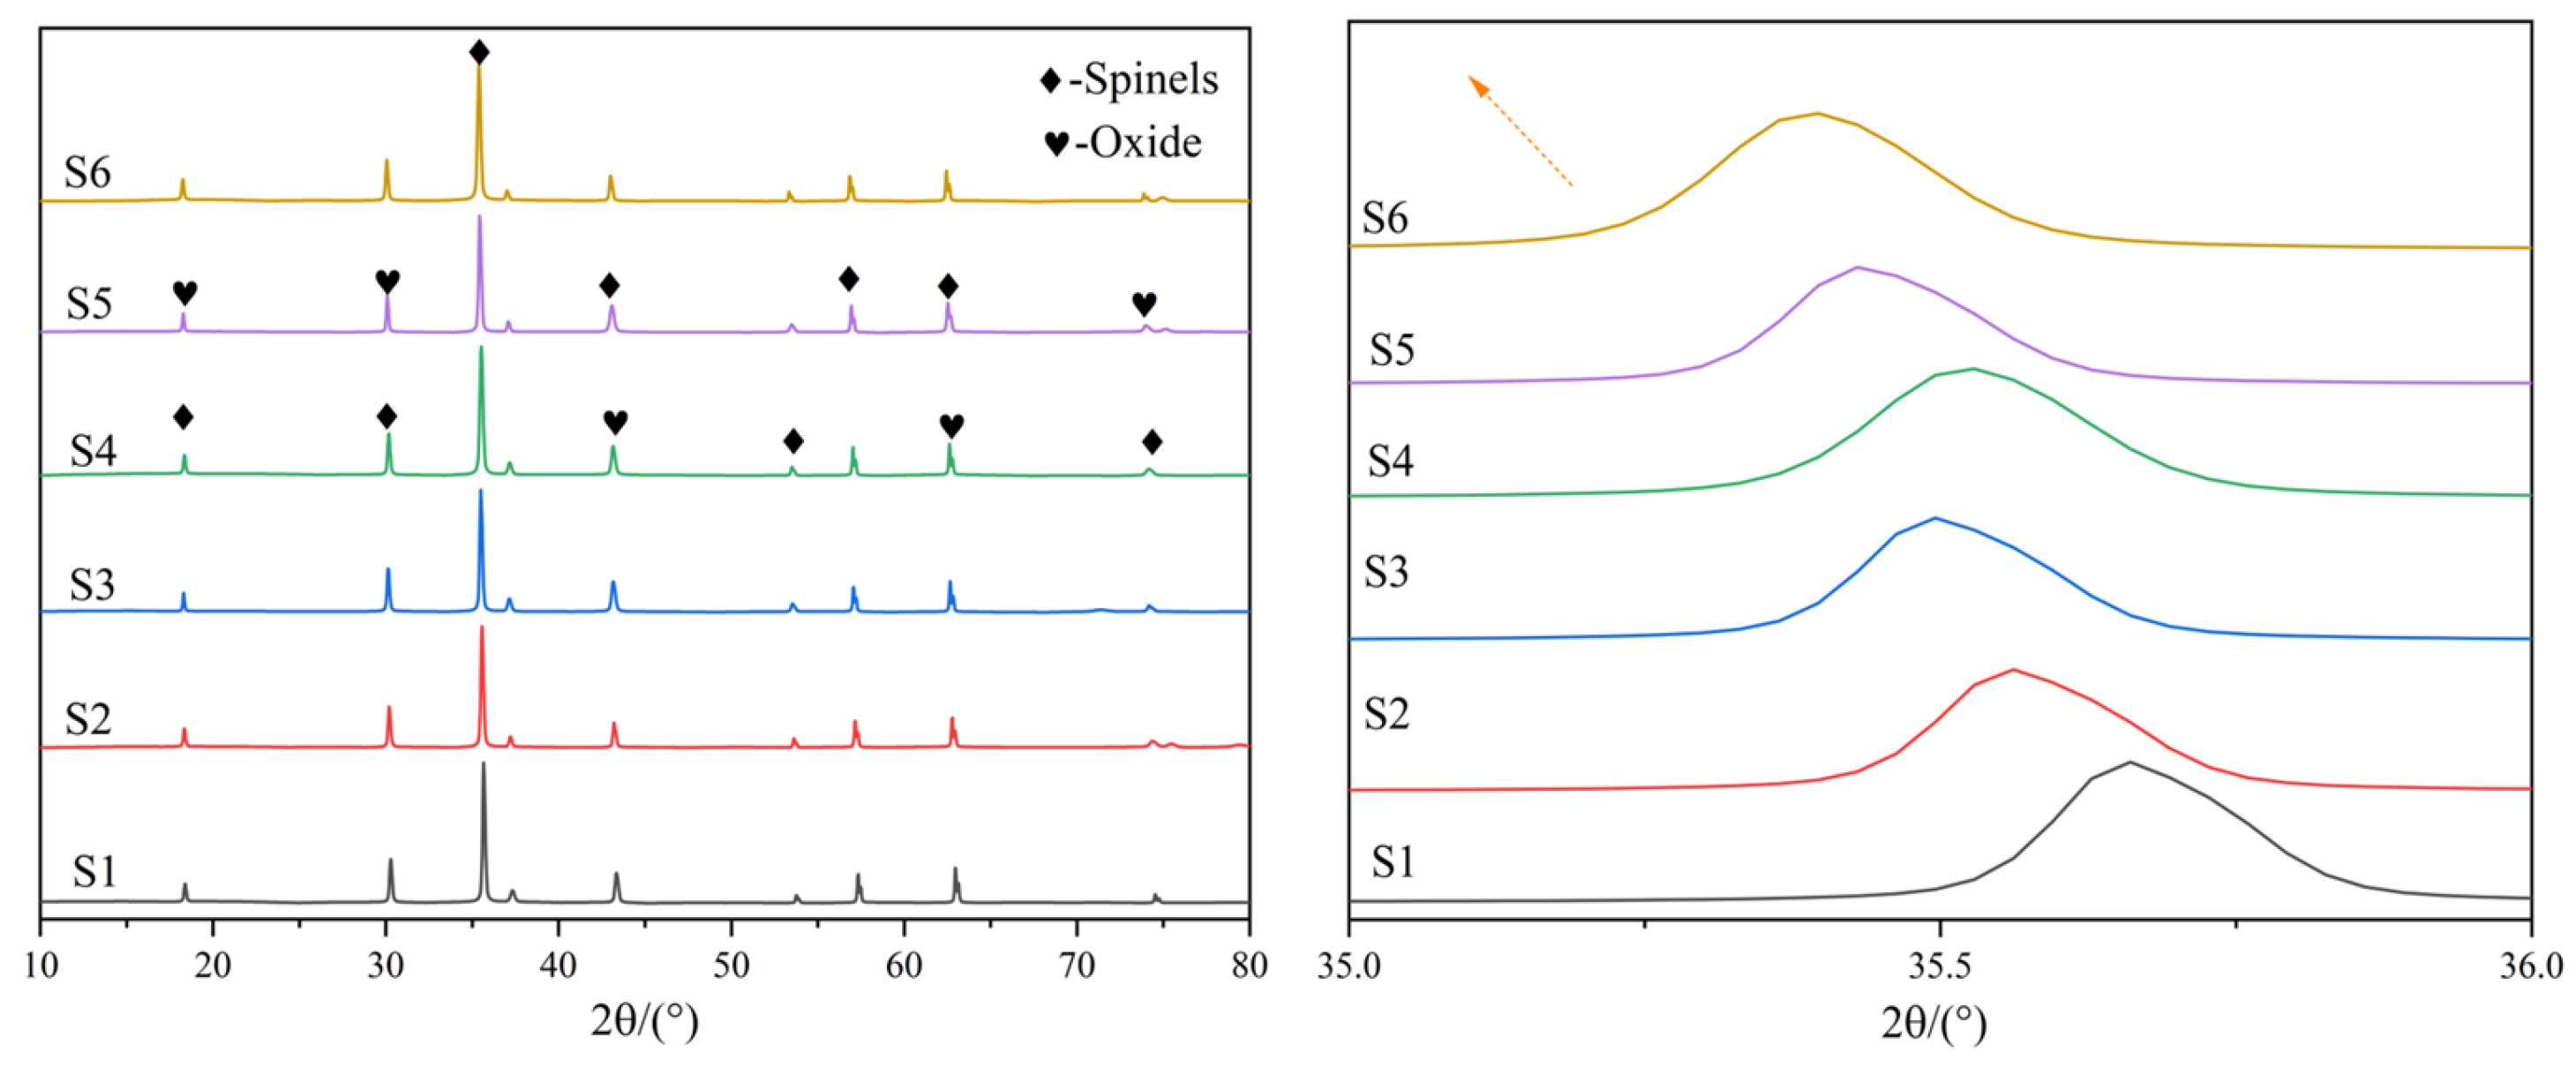
3.3. XRD Analysis and Crystal Structure of the Prepared Pigments
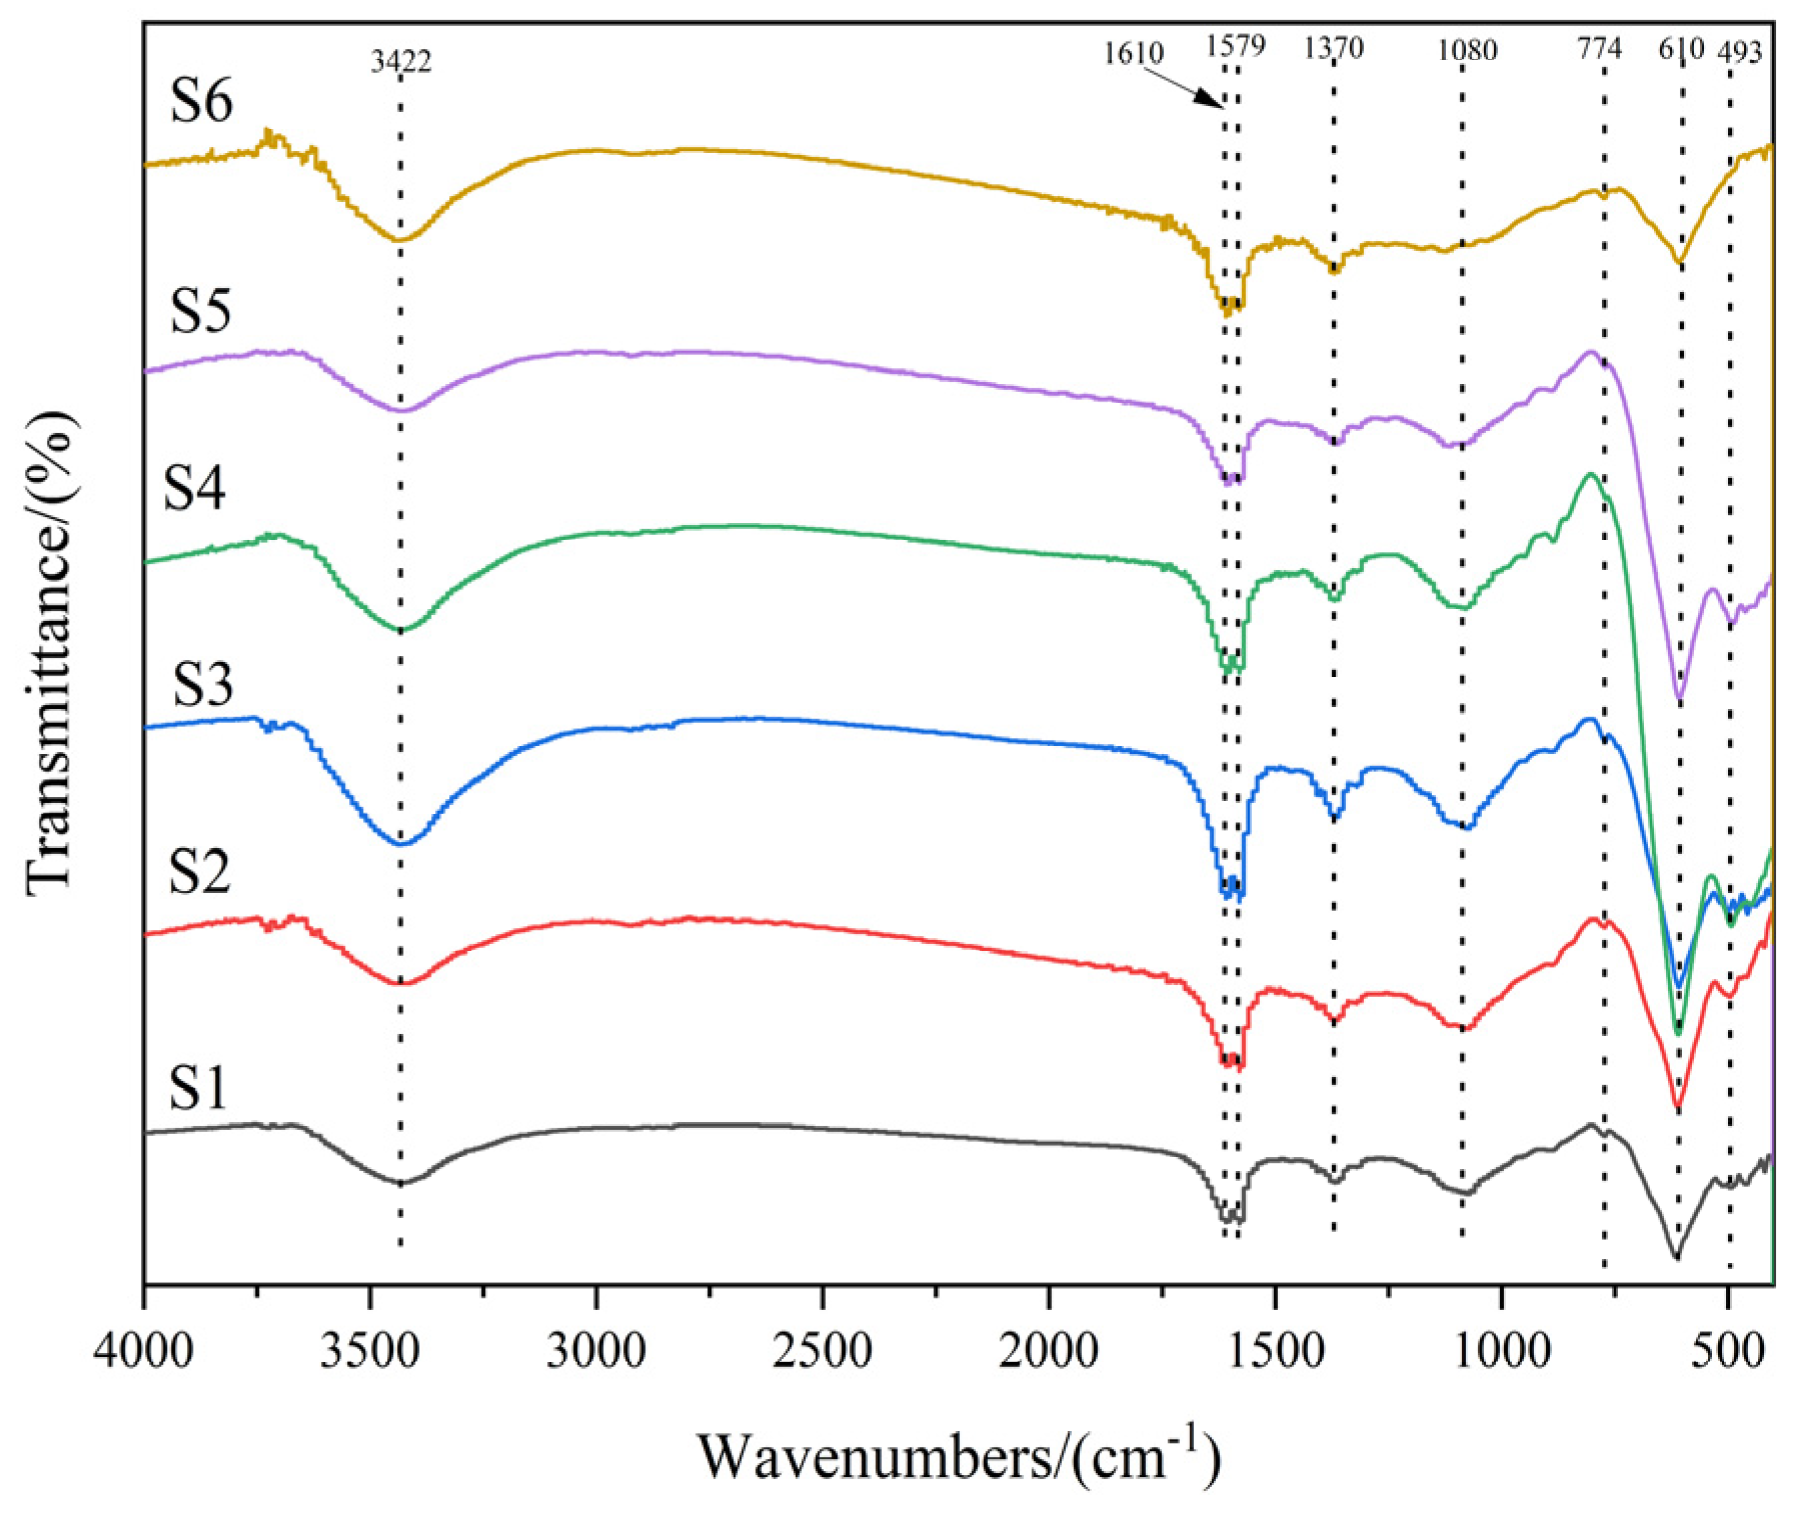
3.4. FTIR Analysis of the Prepared Pigments
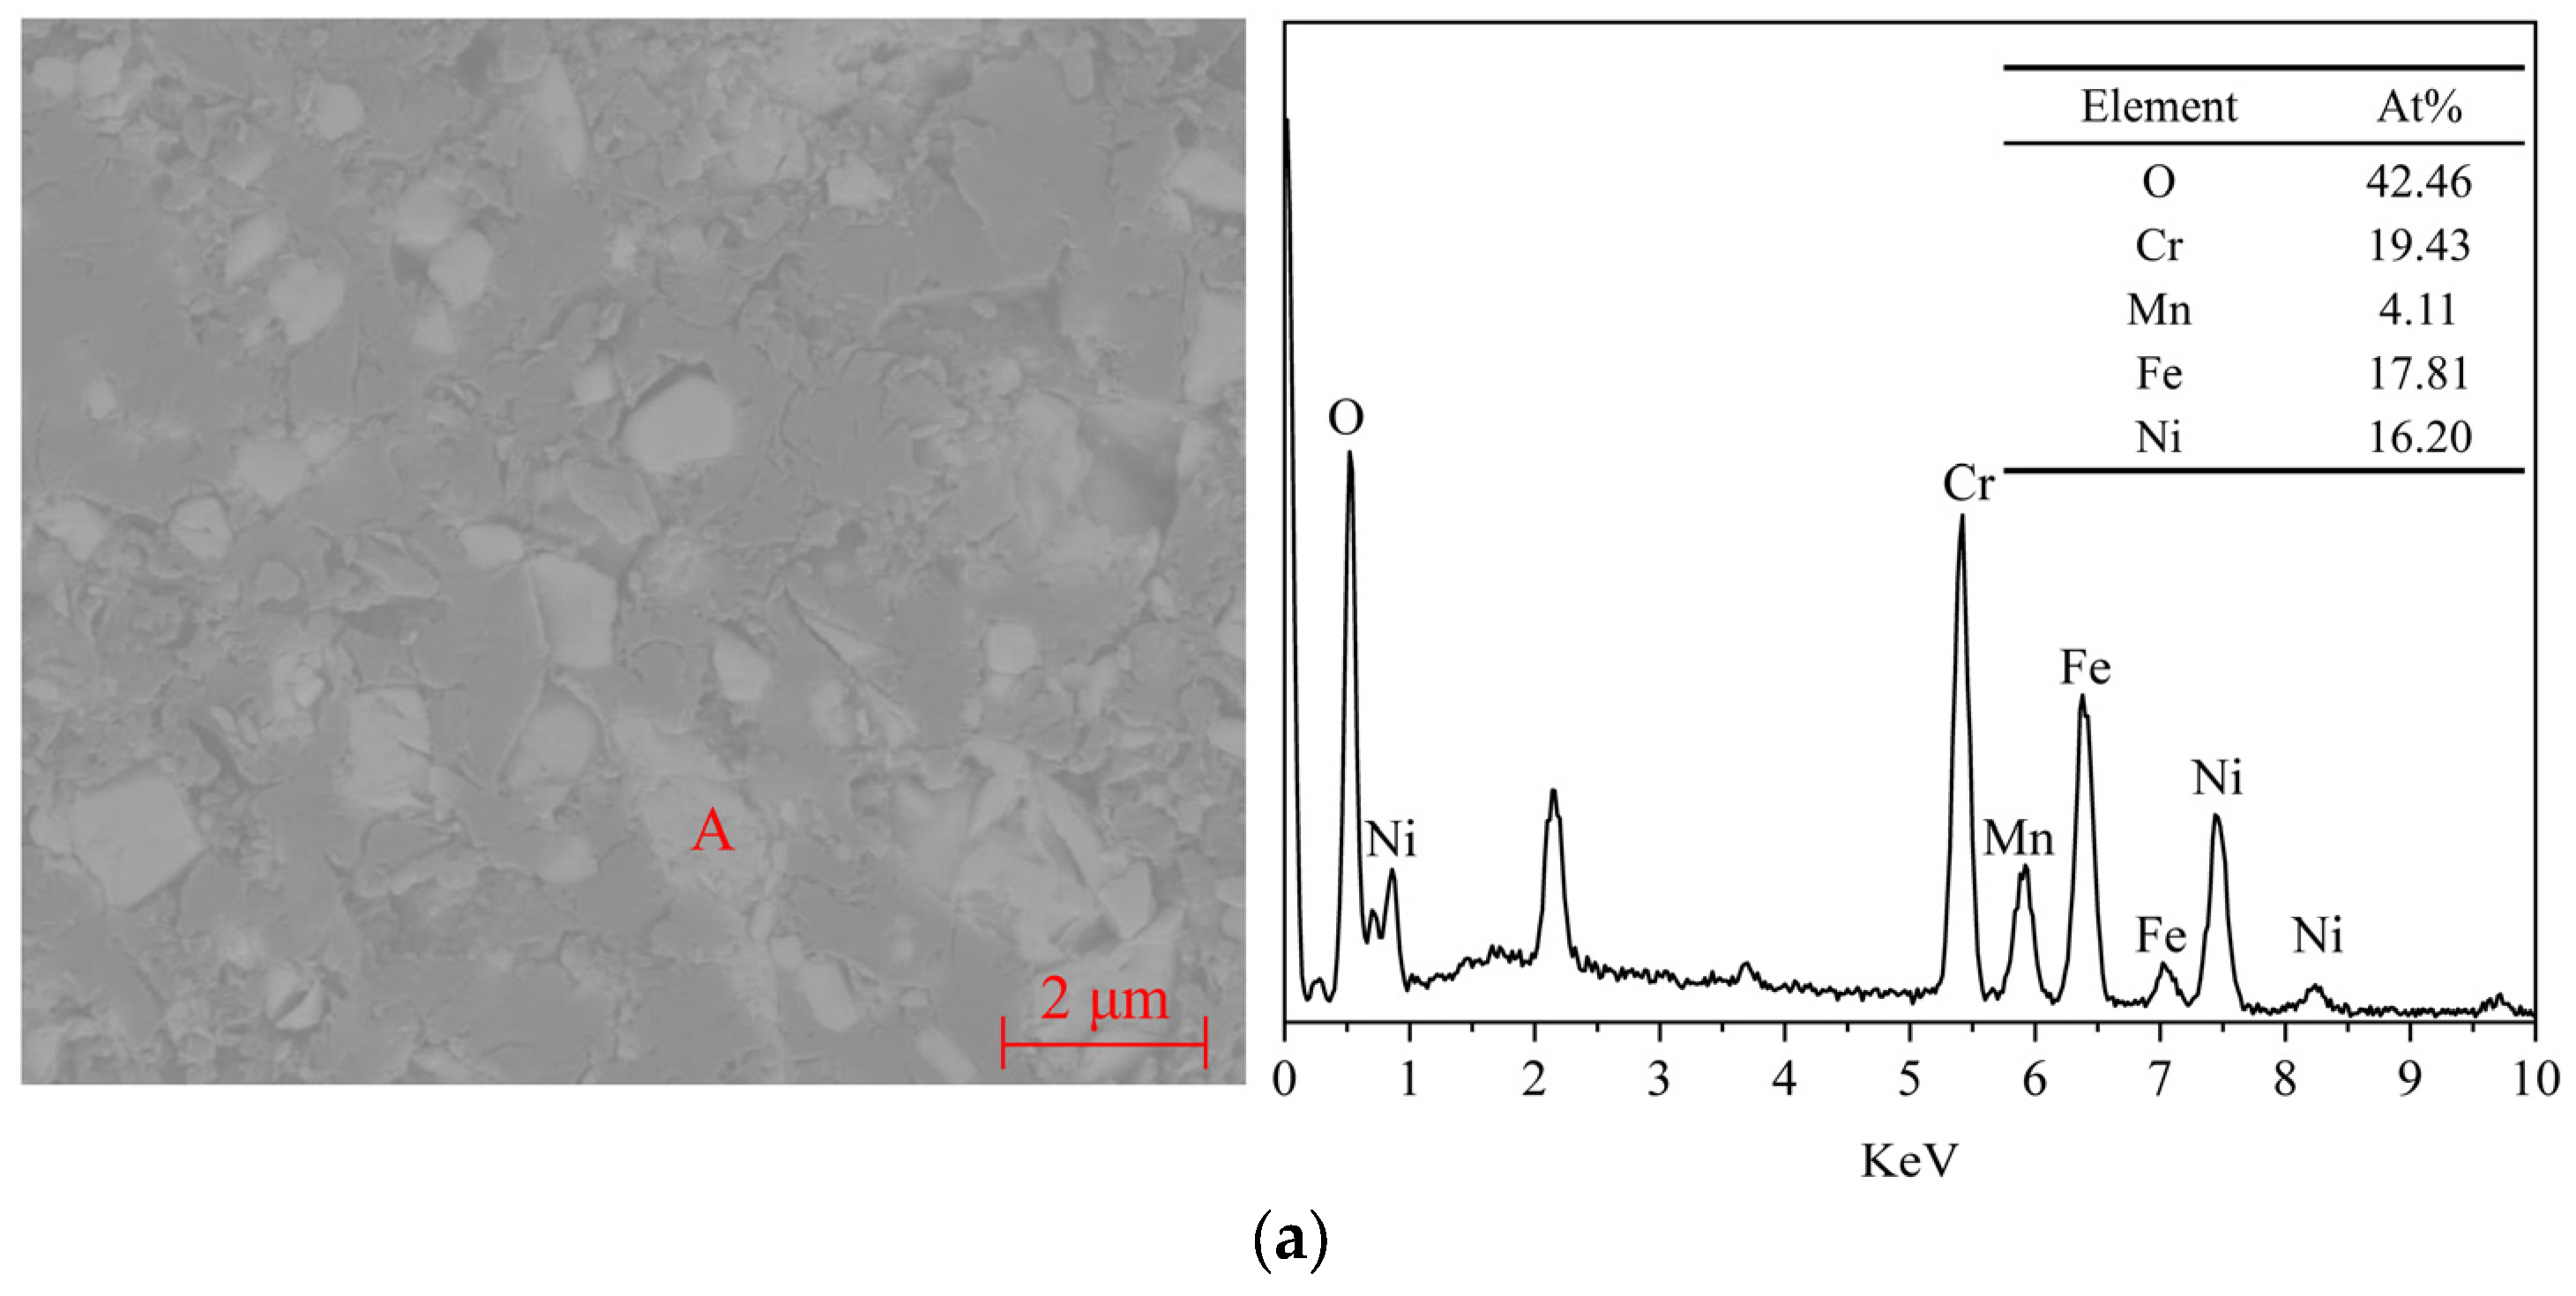
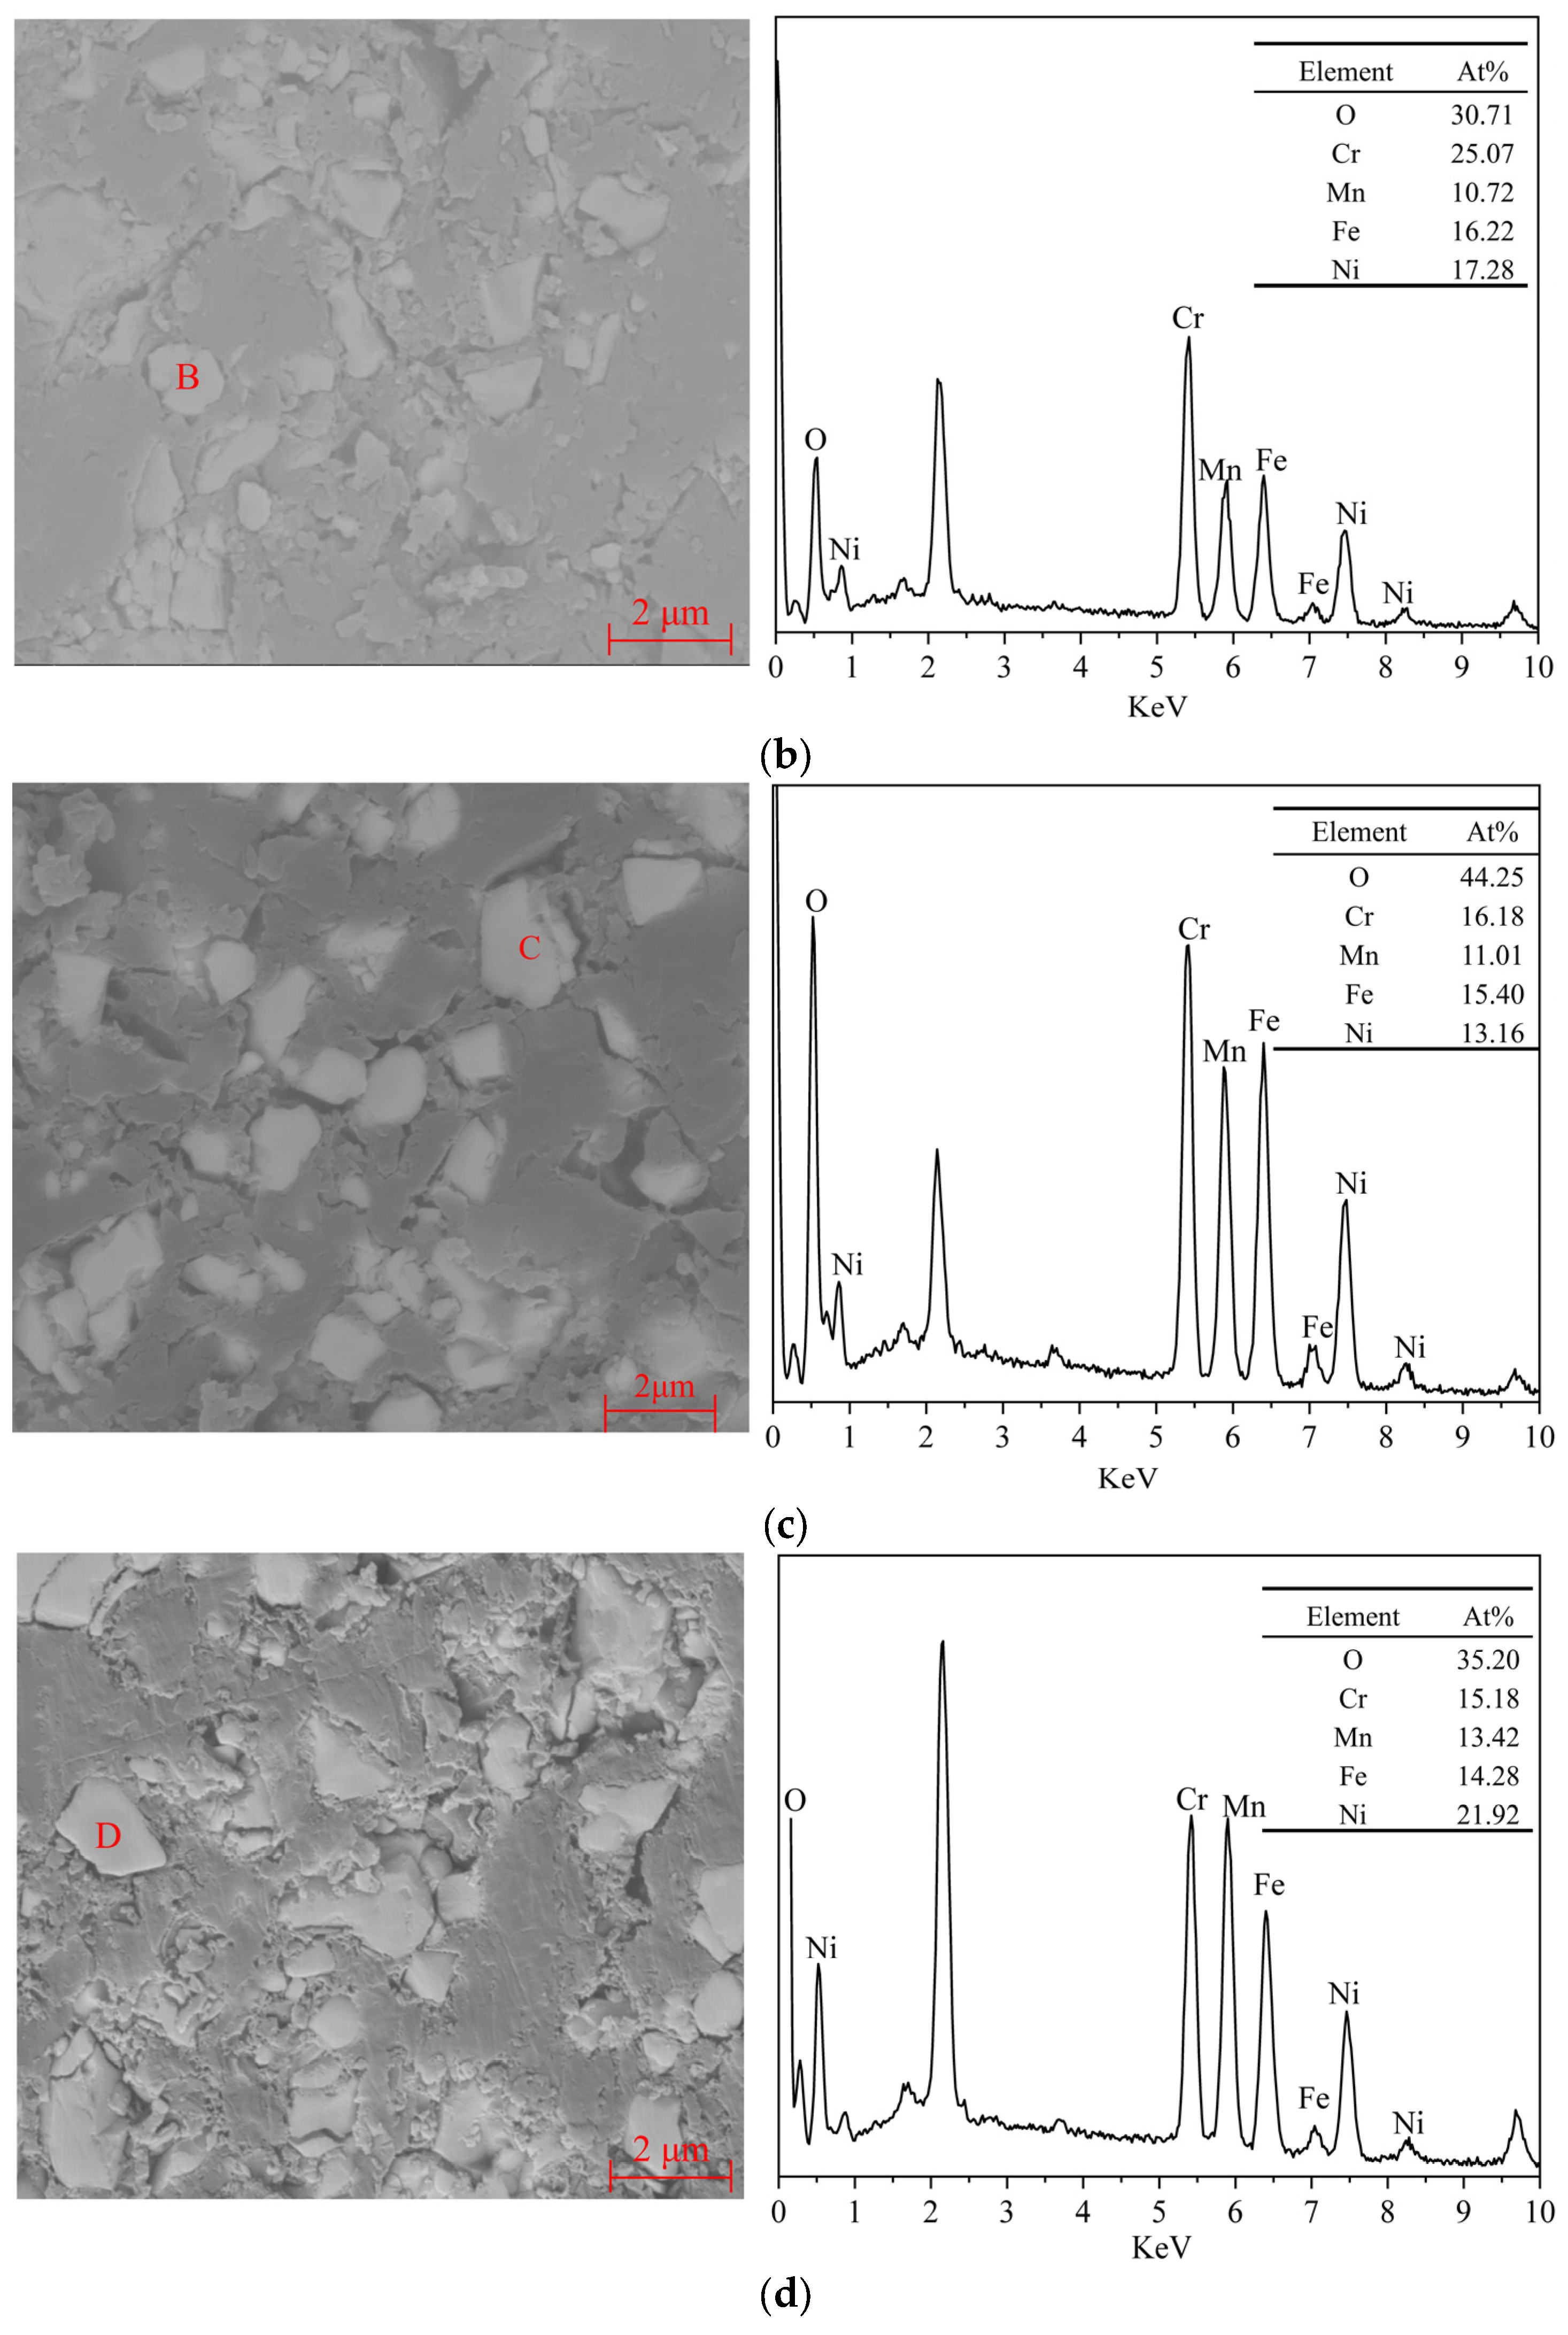
3.5. SEM of the Prepared Pigments
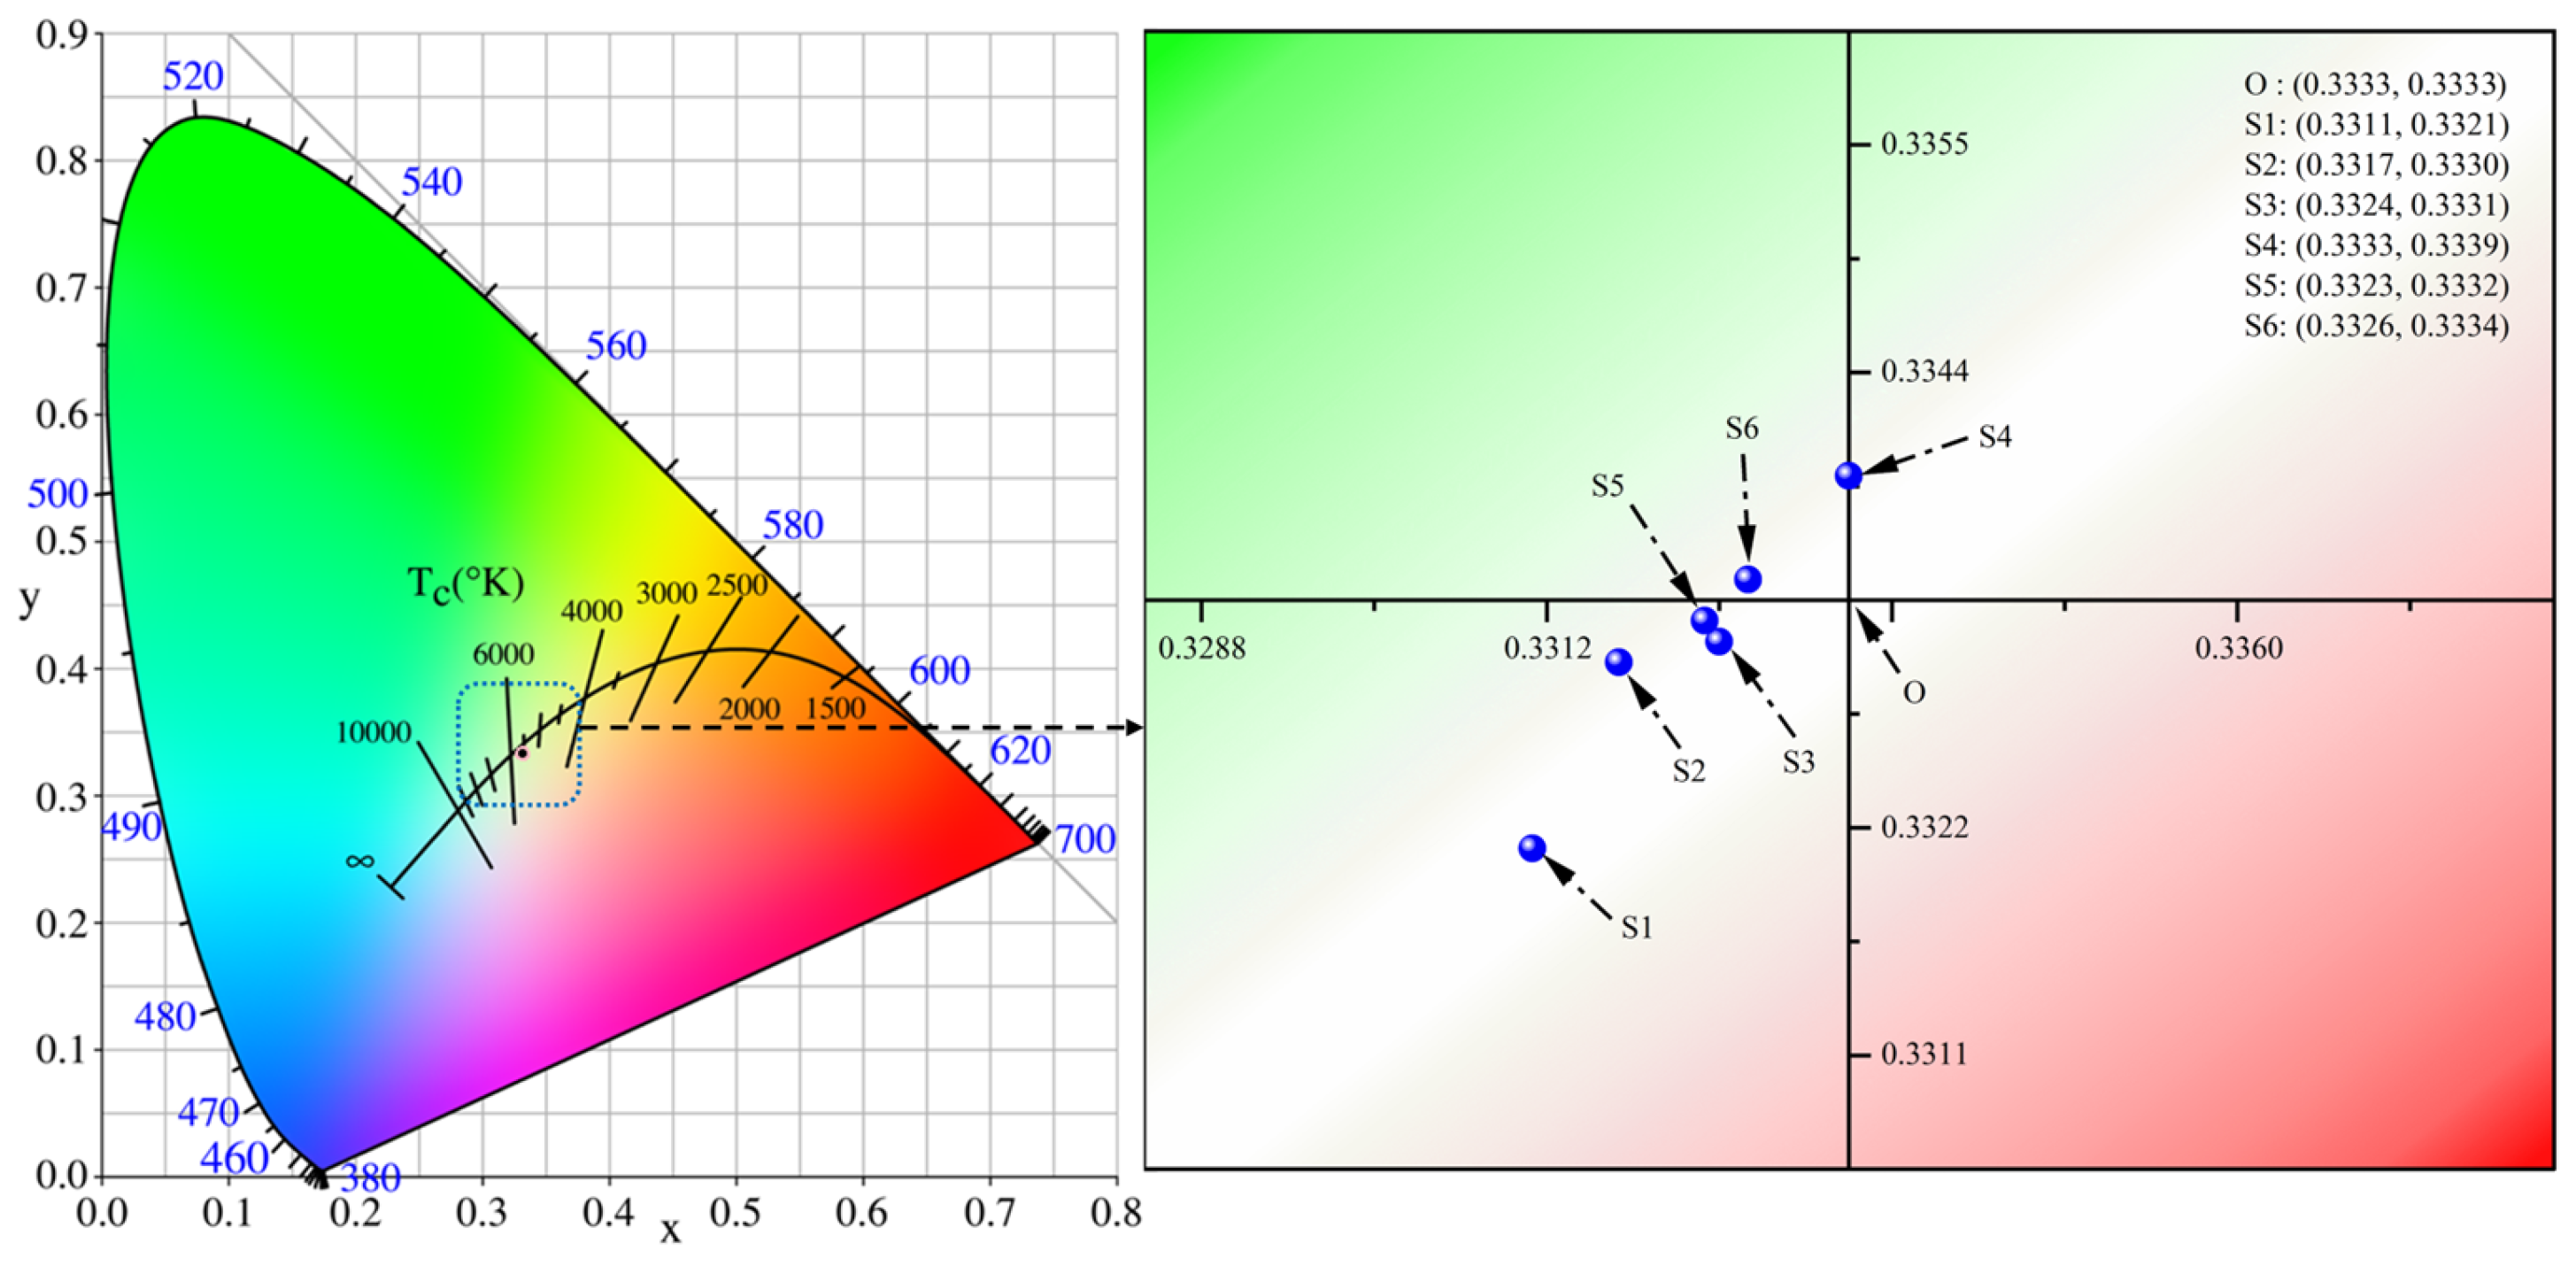
3.6. Optical Properties of the Prepared Pigments
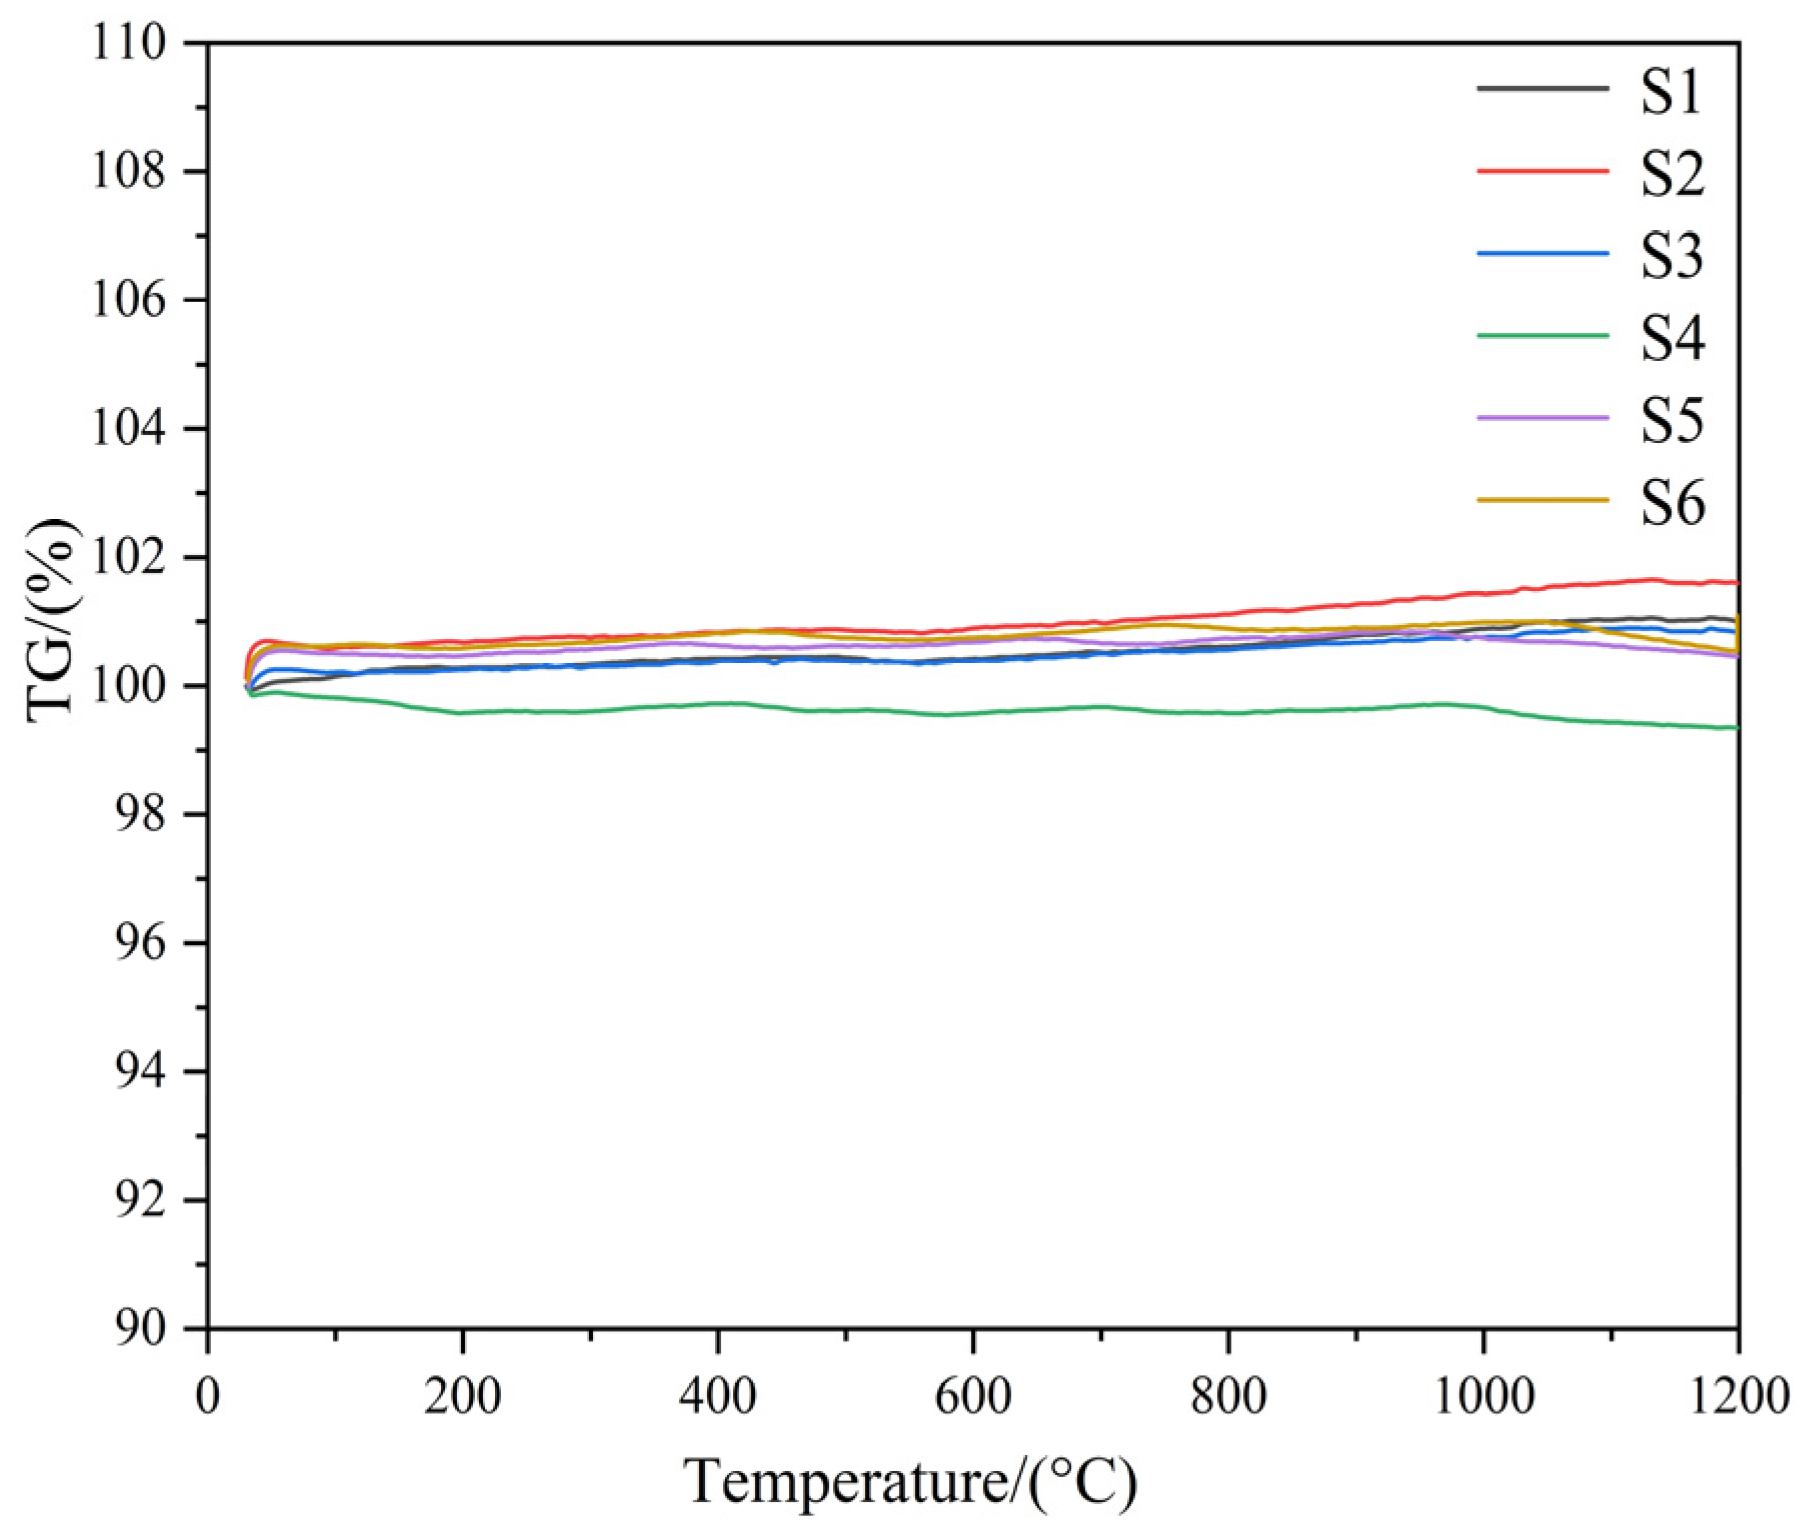
3.7. Stability Testing of the Prepared Pigment Samples
3.8. Application Studies of the Prepared Pigments
4. Conclusions
- (1)
- With the increase of MnO content in raw material, Mn gradually replaces Ni in the spinel phase, the average grain size becomes larger, the crystal plane spacing of black pigments increases from 0.2525 nm to 0.2535 nm, the grain size grows from 61.4619 nm to 79.7171 nm, and the lattice constant grows from 0.8377 to 0.8406 nm.
- (2)
- With the increase of MnO in the Fe–Cr–Ni–Mn series of black pigments, Mn3O4, MnCr2O4 and Ni(Fe,Cr)O4 begin to be generated, and exhibit a regular polyhedral structure. The band gap is reduced from 1.483 eV to 1.244 eV, the absorbance increases significantly and has a consistent absorbance in the visible range. Meanwhile, the L*, a*, and b* values are reduced from 41.8, 0.6, 1.6 to 32.0, 1.0, 0.8, respectively.
- (3)
- The Fe–Cr–Ni–Mn series of black pigments have great stability at 1100 °C, the best pigments in the Fe–Cr–Ni–Mn series of black pigments are chemically stable, acid, alkali and water resistant, with filtrate staining levels of 3–4 and higher, and cake discoloration levels of 5, which are sufficient for daily environments.
- (4)
- The absorbance of prepared pigments is highly consistent. With the formation of Mn-containing spinel phases and the increase in the concentration of transition metals, resulting in a shift in band gap energy and an enhancement of UV–Vis absorption.
Author Contributions
Funding
Institutional Review Board Statement
Informed Consent Statement
Data Availability Statement
Conflicts of Interest
Abbreviations
| SSD | Stainless Steel Dust |
| ICP-AES | Inductively Coupled Plasma-Atomic Emission Spectrometry |
| XRD | X-ray Diffraction Patterns |
| FTIR | Fourier Transform Infra-Red |
| UV–Vis | UV–Visible Spectrophotometer |
| SEM | Scanning Electron Microscopy |
| EDS | Energy Dispersion Spectrum |
| TG | Thermogravimetric |
| DSC | Differential Scanning Calorimetry |
References
- Zhou, Y.; Wang, H.Y.; Zhu, R.; Wei, G.S.; Dong, K. Green and efficient recovery of stainless steel dust by iron-bath direct reduction. Sep. Purif. Technol. 2023, 308, 123005. [Google Scholar] [CrossRef]
- Liu, P.J.; Liu, Z.G.; Chu, M.S.; Yan, R.J.; Li, F.; Tang, J.; Feng, J.G. Detoxification and comprehensive recovery of stainless steel dust and chromium containing slag: Synergistic reduction mechanism and process parameter optimization. Process Saf. Environ. Prot. 2022, 164, 678–695. [Google Scholar] [CrossRef]
- Liu, P.J.; Liu, Z.G.; Chu, M.S.; Yan, R.J.; Li, F.; Tang, J.; Feng, J.G. Multiobjective collaborative optimization of novel carbothermal reduction process of stainless steel dust and laterite nickel ore. Trans. Nonferrous Met. Soc. China 2023, 33, 1919–1931. [Google Scholar] [CrossRef]
- Liu, P.J.; Liu, Z.G.; Chu, M.S.; Yan, R.J.; Li, F.; Tang, J. Silicate slag system in carbothermal reduction of stainless steel dust: Strengthening mechanism and stable regulation. Mater. Chem. Phys. 2023, 304, 127850. [Google Scholar] [CrossRef]
- Ri, S.C.; Chu, M.S.; Chen, S.Y.; Liu, Z.G.; Hong, H. Self-reduction mechanism of coal composite stainless steel dust hot briquette. J. Iron Steel Res. Int. 2016, 23, 314–321. [Google Scholar] [CrossRef]
- Liu, P.J.; Liu, Z.G.; Chu, M.S.; Yan, R.J.; Li, F.; Tang, J. Carbothermal reduction of stainless steel dust and laterite nickel ore: Slag phase behavior regulation and self-pulverization control mechanism. ISIJ Int. 2023, 63, 586–595. [Google Scholar] [CrossRef]
- Zhuang, Q.Y.; Zhou, R.; Li, G.S.; Zhang, Y.H.; Xiong, X.L.; Geng, S.H.; Zou, X.L.; Cheng, H.W.; Zhang, Y.W.; Xu, Q.; et al. Synergistic preparation of metalized pellets using stainless-steel pickling sludge and blast-furnace bag dust. Metall. Mater. Trans. B 2022, 53, 1564–1582. [Google Scholar] [CrossRef]
- Zhu, R.L.; Huang, R.; Xu, A.X.; Li, B.; Zang, Y.G.; Deng, X.; Yang, J.; Li, M.; Long, X.Z. Research status and development of extraction process of zinc-bearing dust from ironmaking and steelmaking—A critical review. J. Iron Steel Res. Int. 2023, 30, 1303–1323. [Google Scholar] [CrossRef]
- Nemchinova, N.V.; Patrushov, A.E.; Tyutrin, A.A. Pyrometallurgical technology for extracting iron and zinc from electric arc furnace dust. Appl. Sci. 2023, 13, 6204. [Google Scholar] [CrossRef]
- Shi, Z.S.; Ding, Y.J.; Yin, X.P.; Liu, B.; Shen, H.L.; Wu, B.Y.; Zhao, B.H.; Han, F.L.; Ekberg, C.; Zhang, S.G. Enrichment of Ni–Mo–V via pyrometallurgical reduction from spent hydrogenation catalysts and the multi-reaction mechanism. Rare Met. 2023, 42, 2700–2712. [Google Scholar] [CrossRef]
- Lai, F.B.; Shi, W.; Hu, S.Y.; Li, X.H.; Chang, Q.B.; Wang, Y.Q.; Wang, Q.K. SrMn1-xFexO3-δ (x = 0–1) black ceramic pigment: Synthesis, color properties, and application. Ceram. Int. 2023, 49, 28824–28836. [Google Scholar] [CrossRef]
- Zhang, M.Q.; Yang, Y.J.; Feng, L.; Sun, X.Q. Synthesis and characterization of Fe3+ doped YIn1-yMnyO3 black pigment with high near-infrared reflectance. Ceram. Int. 2023, 49, 19290–19300. [Google Scholar] [CrossRef]
- Hajjaji, W.; Zanelli, C.; Seabra, M.P.; Dondi, M.; Labrincha, J.A. Cr-doped titanite pigment based on industrial rejects. Chem. Eng. J. 2010, 158, 167–172. [Google Scholar] [CrossRef]
- Dondi, M.; Zanelli, C.; Ardit, M.; Cruciani, G.; Mantovani, L.; Tribaudino, M.; Andreozzi, G.B. Ni-Free, black ceramic pigments based on Co—Cr—Fe—Mn spinels: A reappraisal of crystal structure, colour and technological behaviour. Ceram. Int. 2013, 39, 9533–9547. [Google Scholar] [CrossRef]
- Liu, M.K.; Ma, G.J.; Zhang, X.; Zheng, D.L.; Li, Z.Q. Preparation and coloring mechanism of cobalt-free black ceramic pigments from stainless steelmaking dust. Mater. Today Commun. 2022, 33, 104609. [Google Scholar] [CrossRef]
- Li, Z.Q.; Zhang, X.; Ma, G.J.; Muvunyi, R.A.; Zheng, D.L. Comparison of microwave and conventional processing stainless steelmaking dust to prepare black ceramic pigments. J. Ceram. Process. Res. 2023, 24, 1–7. [Google Scholar] [CrossRef]
- Li, Z.Q.; Zhang, X.; Ma, G.J.; Zheng, D.L.; Xu, J.; Xu, J. Effect of the Fe/Cr molar ratio and calcination temperature on the preparation of black ceramic pigment with stainless steel dust assisted by microwave processing. J. Clean. Prod. 2022, 372, 133751. [Google Scholar] [CrossRef]
- Li, Z.Q.; Zhang, X.; Ma, G.J.; Zheng, D.L.; Du, T.Y.; He, R.X. Effect of the nickel molar content on the preparation and properties of spinel-type black ceramic pigment by microwave processing from stainless steelmaking dust. Mater. Today Commun. 2022, 32, 104151. [Google Scholar] [CrossRef]
- Singh, C.; Khanna, V.; Singh, S. Sustainability of microwave heating in materials processing technologies. Mater. Today Proc. 2023, 73, 241–248. [Google Scholar] [CrossRef]
- García-Baños, B.; Sánchez, J.R.; Godes, J.L.; Leonelli, C.; Catalá-Civera, J.M. Evaluation of microwave synthesis of ceramic pigments based on in situ dielectric characterization. Materials 2023, 16, 2976. [Google Scholar] [CrossRef]
- Singh, R.; Sharma, V.; Pandey, P.M. Microstructural characteristics and mechanical behaviour of microwave-assisted sintered novel WC-Co ceramic based internally cooled turning tool. Mater. Charact. 2023, 200, 112855. [Google Scholar] [CrossRef]
- Wang, J.Y.; Han, A.J.; Ye, M.Q.; Chen, C.L.; Chen, X.; Zhu, X.F. Thermal insulation performance of novel coated fabrics based on Fe-Doped BaSnO3 near-infrared reflectance pigments. ACS Sustain. Chem. Eng. 2021, 9, 16328–16337. [Google Scholar] [CrossRef]
- Batista, G.H.; Psofogiannakis, G.; Junkermeier, C.E.; Paupitz, R. Mechanical properties and deformation-driven band gap tuning on [N]-Carbophenes. Comput. Mater. Sci. 2023, 222, 112103. [Google Scholar] [CrossRef]
- Blasco-Zarzoso, S.; Beltrán-Mir, H.; Cordoncillo, E. Sustainable norganic pigments with high near-infra-red reflectance based on Fe3+ doped YAlO3 for high temperature applications. J. Alloys Compd. 2023, 960, 170695. [Google Scholar] [CrossRef]
- Dzurenda, L. Natural variability of the color of beech wood in the color space CIE L*a*b*. Forests 2023, 14, 1103. [Google Scholar] [CrossRef]
- Mu, P.Y.; Zhou, G.T.; Chen, L.C.; Zhang, Z.F.; Zhang, Y.W.; Shen, W.X.; Wang, Q.Q.; Wan, B.; Fang, C.; Jia, X.P. Effect of Ni2O3 on diamond crystal growth in an Fe–Ni–C system under high temperature and high pressure. CrystEngComm 2021, 23, 2809–2815. [Google Scholar] [CrossRef]
- Sánchez-Ramos, S.; Doménech-Carbó, A.; Gimeno-Adelantado, J.V.; Peris-Vicente, J.; Valle-Algarra, F.M. Thermal Decomposition of Chromite Spinel with Chlorite Admixture. Thermochim. Acta 2008, 476, 11–19. [Google Scholar] [CrossRef]
- Roy, R.; Dutta, A. Structural, optical, electrical, and dielectric relaxation properties of rare earth containing sodium bismuth Titanate Na0.5Bi0.5TiO3 perovskite: Effect of ionic radius. J. Rare Earths 2023. [Google Scholar] [CrossRef]
- Gomaa, H.M.; Saudi, H.A.; Elkatlawy, S.M.; Yahia, I.S.; Makram, B.M.A.; Zahran, H.Y. Structure and electrical properties of some Fe-doped sodium borate devitrified glasses: Self-heating action. Appl. Phys. A 2023, 129, 322. [Google Scholar] [CrossRef]
- Sadat, M.E.; Bud’ko, S.L.; Ewing, R.C.; Xu, H.; Pauletti, G.M.; Mast, D.B.; Shi, D.L. Effect of dipole interactions on blocking temperature and relaxation dynamics of superparamagnetic iron-oxide (Fe3O4) nanoparticle systems. Materials 2023, 16, 496. [Google Scholar] [CrossRef] [PubMed]
- Gu, S.M.; Xia, M.; Zhou, C.; Kong, Z.H.; Molokeev, M.S.; Liu, L.; Wong, W.Y.; Zhou, Z. Red shift properties, crystal field theory and nephelauxetic effect on Mn4+-doped SrMgAl10-yGayO17 red phosphor for plant growth LED Light. Chem. Eng. J. 2020, 396, 125208. [Google Scholar] [CrossRef]
- Ye, M.Y.; Zhou, Y.Y.; Shao, T.Y.; Liu, H.Z.; Tao, Q.; Wang, X.; Tang, R.L.; Yue, H.J.; Li, Y.; Zhu, P.W. Effects of high pressure on the bandgap and the d–d crystal field transitions in wolframite NiWO4. J. Phys. Chem. C 2023, 127, 6543–6551. [Google Scholar] [CrossRef]
- Kim, G.; Sohn, I. Selective metal cation concentration during the solidification of stainless steel EAF dust and slag mixtures from high temperatures for increased Cr recovery. J. Hazard. Mater. 2018, 359, 174–185. [Google Scholar] [CrossRef] [PubMed]
- Khan, M.S.; Zou, B.S.; Shi, L.J.; Yao, S.F.; Bukhtiar, A.; Huang, W.G.; Lu, Y.; Cao, J.J.; Zheng, B.L. Carrier-mediated ferromagnetism in Mn(II)-doped ZnTe thin films and their optical properties: A first-principles study. J. Alloys Compd. 2023, 964, 171316. [Google Scholar] [CrossRef]
- Khan, M.S.; Zou, B.S.; Yao, S.F.; Haq, Z.U.; Abdulla, A.S.; Huang, W.G.; Zheng, B.L. Suppression of ferromagnetism due to N Co-doping in Cr(II)-doped ZnS nanowires and their optical properties: Insights from density-functional calculations. J. Magn. Magn. Mater. 2023, 582, 171013. [Google Scholar] [CrossRef]
- Thulasiramudu, A.; Buddhudu, S. Optical characterization of Mn2+, Ni2+ and Co2+ ions doped zinc lead borate glasses. J. Quant. Spectrosc. Radiat. Transf. 2006, 102, 212–227. [Google Scholar] [CrossRef]
- Charytanowicz, T.; Sieklucka, B.; Chorazy, S. Lanthanide hexacyanidoruthenate frameworks for multicolor to white-light emission realized by the combination of d-d, d-f, and f-f electronic transitions. Inorg. Chem. 2023, 62, 1611–1627. [Google Scholar] [CrossRef]
- Qi, Y.J.; Qi, H.Y.; Li, J.H.; Lu, C.J. Synthesis, microstructures and UV–Vis absorption properties of β-Ni(OH)2 nanoplates and NiO nanostructures. J. Cryst. Growth 2008, 310, 4221–4225. [Google Scholar] [CrossRef]
- Pailhé, N.; Wattiaux, A.; Gaudon, M.; Demourgues, A. Correlation between structural features and Vis–NIR spectra of α-Fe2O3 hematite and AFe2O4 spinel oxides (A=Mg, Zn). J. Solid State Chem. 2008, 181, 1040–1047. [Google Scholar] [CrossRef]
- Zhou, X.; Zhao, M.H.; Yang, J.; Han, Y.; Cao, L.; Han, Y.Y.; Wang, J.; Wang, Y.; Li, M.R. Chemical pressure enlarged camouflage color zone in Mn(IV)-activated yellow-green pigments. Mater. Today Chem. 2022, 25, 100902. [Google Scholar] [CrossRef]
- Fang, P.; Zhou, S.Y.; Liu, Y.; Ye, J.Y.; Wang, L.Z.; Li, C.; Zhuo, S.; Chen, W.F. Solution combustion synthesis of gray-blue Mn-Doped YBO3 pigments with high NIR reflectance for energy-saving buildings. Ceram. Int. 2022, 48, 37203–37211. [Google Scholar] [CrossRef]
- Banik, S.; Samina, P.I.; Rao, P.N.; Srivastava, H.; Sagdeo, A. Probing interband and intraband transitions in magneto-optical FeT (T = Cr, Co, Ni) alloys from electronic structure studies. Appl. Surf. Sci. 2021, 546, 148896. [Google Scholar] [CrossRef]


| Composition | SSD | Ceramic Paste | Common Transparent Glaze |
|---|---|---|---|
| Al2O3 | 0.2 | 20.29 | 11.14 |
| SiO2 | 3.38 | 66.41 | 0.55 |
| Fe2O3 | 69.60 | 0.55 | 0 |
| CaO | 5.21 | 1 | 11.13 |
| MgO | 0.55 | 1.35 | 1.80 |
| ZnO | 0.18 | 0 | 4.70 |
| MnO | 6.45 | 0 | 0 |
| Cr2O3 | 10.68 | 0 | 0 |
| NiO | 1.03 | 0 | 0 |
| K2O | 0 | 1.01 | 1.62 |
| Na2O | 0 | 2.82 | 2.07 |
| BaO | 0 | 0 | 2.96 |
| B2O3 | 0 | 0 | 0 |
| LOI | 0 | 0 | 11.36 |
| Sample | Fe/Cr/Ni/Mn Molar Ratio | Fe2O3/Cr2O3/NiO/MnO Molar Ratio |
|---|---|---|
| S1 | 1:1:1:0.25 | 0.5:0.5:1:0.25 |
| S2 | 1:1:1:0.5 | 0.5:0.5:1:0.5 |
| S3 | 1:1:1:0.75 | 0.5:0.5:1:0.75 |
| S4 | 1:1:1:1 | 0.5:0.5:1:1 |
| S5 | 1:1:1:1.25 | 0.5:0.5:1:1.25 |
| S6 | 1:1:1:1.5 | 0.5:0.5:1:1.5 |
| Reactions | |
|---|---|
| 4FeO(s) + O2(g) = 2Fe2O3(s) | −573,655 + 243.35T (273–1773 K) |
| 4Fe3O4(s) + O2(g) = 6Fe2O3(s) | −488,333 + 270.82T (273–1773 K) |
| 4MnO(s) + O2(g) = 2Mn2O3(s) | −373,811 + 226.71T (273–1773 K) |
| 6MnO(s) + O2(g) = 2Mn3O4(s) | −458,953 + 248.54T (273–1773 K) |
| 3MnO(s) + 3Fe2O3(g) = 2Fe3O4(s) + Mn3O4(s) | 14,602 − 11.072T (273–1773 K) |
| 2MnO(s) + O2(g) = 2MnO2(s) | −258,742 + 205.37T (273–1773 K) |
| FeO(s) + Fe2O3(s) = Fe3O4(s) | −21,331 − 6.8679T (273–1773 K) |
| FeO(s) + Cr2O3(s) = FeCr2O4(s) | −70,814 + 15.81T (273–1773 K) |
| NiO(s) + Fe2O3(s) = NiFe2O4(s) | −22,149 + 7.7441T (273–1773 K) |
| NiO(s) + Cr2O3(s) = NiCr2O4(s) | −9687 − 1.1389T (273–1773 K) |
| MnO(s) + Fe2O3(s) = MnFe2O4(s) | −15,602 − 5.5925T (273–973 K) −24,233 + 3.7215T (973–1773 K) |
| 4FeO(s) + O2(g) + 2NiO(s) = 2NiFe2O4(s) | −617,952 + 258.84T (273–1773 K) |
| 4Fe3O4(s) + O2(g) + 6NiO(s) = 6NiFe2O4(s) | −621,224 + 317.28T (273–1773 K) |
| Sample | 2θ/(°) | d/(nm) | D/(nm) | a = b = c/(nm) | ε | FWHM |
|---|---|---|---|---|---|---|
| S1 | 35.6607 | 0.2525 | 61.4619 | 0.8377 | 0.00101 | 0.19379 |
| S2 | 35.5617 | 0.2523 | 67.8779 | 0.8366 | 0.00102 | 0.18042 |
| S3 | 35.4957 | 0.2527 | 73.7168 | 0.8381 | 0.00111 | 0.18515 |
| S4 | 35.5287 | 0.2526 | 74.5451 | 0.8378 | 0.00120 | 0.19273 |
| S5 | 35.4297 | 0.2531 | 76.3250 | 0.8395 | 0.00154 | 0.18844 |
| S6 | 35.3967 | 0.2535 | 79.7171 | 0.8406 | 0.00134 | 0.18425 |
| Element | Coordination Number | Transition Type | Absorption Band/nm | Reference |
|---|---|---|---|---|
| Ni (II) | 4 | 2p (O2−)→3d (Ni3+) | 340–370 | [33] |
| Mn (II) | 4 | 4A2g→4T1g 4A2g→2T2g 6A1g→4T1g 6A1g→4T2g 6A1g→4Eg 6A1g→4A1g | 380–450 | [34] |
| Cr (III) | 6 | 4A2g→4T1g 4A2g→2T2g | 400–500 | [35] |
| Ni (II) | 6 | 3A2g→3T1g | 420–480 | [36] |
| Fe (III) | 4 | 2p (O2−)→3d (Fe3+) | 450–500 | [37] |
| Fe (III) | 6 | 2p (O2−)→3d (Fe3+) | 500–700 | [37] |
| Mn (II) | 4 | 4A2g→2Eg 4A2g→4T1g | 570–580 | [38] |
| Mn (III) | 6 | 2p (O2−)→3d (Mn3+) | 700–800 | [39] |
| Cr (III) | 6 | 4A2g→4T2g 4A2g→2T1g 4A2g→2Eg | 550–700 | [40] |
| Fe (III) | 6 | 6A1g→4T1g 6A1g→4T2g | 700 | [41] |
| Sample | L* | a* | b* | C* | Color Card |
|---|---|---|---|---|---|
| S1 | 37.9 | 0.3 | −0.1 | 0.32 |  |
| S2 | 38.5 | 0.3 | 0.0 | 0.30 | |
| S3 | 37.5 | 0.2 | −0.1 | 0.22 | |
| S4 | 36.1 | 0.2 | −0.1 | 0.22 | |
| S5 | 37.2 | 0.3 | −0.1 | 0.32 | |
| S6 | 37.3 | 0.2 | −0.2 | 0.28 | |
Disclaimer/Publisher’s Note: The statements, opinions and data contained in all publications are solely those of the individual author(s) and contributor(s) and not of MDPI and/or the editor(s). MDPI and/or the editor(s) disclaim responsibility for any injury to people or property resulting from any ideas, methods, instructions or products referred to in the content. |
© 2023 by the authors. Licensee MDPI, Basel, Switzerland. This article is an open access article distributed under the terms and conditions of the Creative Commons Attribution (CC BY) license (https://creativecommons.org/licenses/by/4.0/).
Share and Cite
Zhang, X.; Xu, Y.; Li, Z.; Liu, M.; Du, T.; He, R.; Ma, G. Preparation of Spinel-Type Black Pigments Using Microwave-Assisted Calcination of Stainless Steel Dust: The Effect of Manganese Molar Content. Metals 2023, 13, 1949. https://doi.org/10.3390/met13121949
Zhang X, Xu Y, Li Z, Liu M, Du T, He R, Ma G. Preparation of Spinel-Type Black Pigments Using Microwave-Assisted Calcination of Stainless Steel Dust: The Effect of Manganese Molar Content. Metals. 2023; 13(12):1949. https://doi.org/10.3390/met13121949
Chicago/Turabian StyleZhang, Xiang, Yanghui Xu, Zhiqiao Li, Mengke Liu, Tianyu Du, Ruixiang He, and Guojun Ma. 2023. "Preparation of Spinel-Type Black Pigments Using Microwave-Assisted Calcination of Stainless Steel Dust: The Effect of Manganese Molar Content" Metals 13, no. 12: 1949. https://doi.org/10.3390/met13121949