Article

Microstructural Evolution and Gas-Tight Properties of Yttria-Stabilized Zirconia/Crofer 22H Stainless Steel Brazed Joints with the Ag-Ge-Si Filler for Use in Solid-Oxide Fuel Cells

1
Department of Material Research, National Atomic Research Institute, Taoyuan 325, Taiwan
2
Department of Materials Science and Engineering, National Taiwan University, Taipei 106, Taiwan
*
Author to whom correspondence should be addressed.
Metals 2023, 13(11), 1866; https://doi.org/10.3390/met13111866
Submission received: 7 October 2023 / Revised: 5 November 2023 / Accepted: 7 November 2023 / Published: 9 November 2023

Abstract

:
In this paper, a novel 95Ag-2.5Ge-2.5Si (in wt %) filler is utilized for brazing yttria-stabilized zirconia (YSZ) electrolytes and commercial Crofer 22H interconnects for solid-oxide fuel cells’ (SOFCs) sealing application. Before brazing, surface metallization is applied on YSZ and Crofer 22H substrates to improve the wetting performance of the filler on YSZ and Crofer 22H substrates. The brazing procedure is performed at 900 °C for 10 min under a high vacuum (~10−6 torr) to prepare sandwiched YSZ/Crofer 22H brazed coupons. The metallization mentioned above can achieve reactive wetting toward YSZ ceramics. A Si/Ti-rich oxide layer and an Fe-Cr-Si alloying phase are formed at the brazed joints’ YSZ/filler and filler/Crofer 22H interfaces. After exposure to air at 750 °C for 100 h, Cu and Si contents suffer from oxidation and form CuO and SiO2, respectively, in the brazed zone and the YSZ/filler interface of the joints. The Fe-Cr-Si alloying phase at the filler/Crofer 22H interface is preserved without apparent oxidation. The pressure-drop test results show that the brazed joints’ gas tightness does not deteriorate significantly after thermal aging, which is attributed to the good interfacial integrity of thermal-aged joints.

1. Introduction

Solid-oxide fuel cells (SOFCs) are electrochemical energy-conversion devices that generate electricity directly from chemicals (hydrogen and oxygen) without combustion. Because SOFCs have superior characteristics of high energy-conversion efficiency and low carbon emission, they are regarded as an alternative clean energy system [1]. Traditionally, SOFCs must be operated at high temperatures (typically 800–1000 °C) to maintain their performance; however, a high temperature also accelerates SOFC materials’ degradation. Therefore, medium-temperature SOFCs (IT-SOFCs, 600–800 °C), which use high-catalytic-activity materials, have become popular in recent years [2,3]. For IT-SOFC stack assembly, robust interfacial sealing is usually required for long-term stable operation [4,5,6].
There are several methods developed for sealing SOFC stacks, such as glass bonding [7,8,9], mica-based compressive seals [5,10,11], and brazing [12,13,14]. Metallic bonds usually have better stress accommodation than covalent bonds, so more reliable SOFC sealing can be obtained via brazing. Brazing is a joining method without melting parent materials. After heating over the liquidus temperatures of filler metals, the molten fillers flow into the gap between the parent materials using capillary action. Metallurgical reactions will proceed until interfacial bonds are formed after solidification. There are many alloy systems used as brazing fillers, including Au-based alloys [15,16,17], Ag-based alloys [18,19,20,21,22], Ni-based alloys [23,24,25], etc.
Based on different process atmospheres, brazing can be divided into two groups: reactive-air brazing (RAB) [26,27,28,29] and vacuum brazing [14,15,16,17,18,19,23,24]. In the RAB method, a cermet sealant composed of noble metals and oxides, such as Ag-CuO, Ag-Nb2O5, and so on, is employed for joining SOFC electrolytes (typically yttria-stabilized zirconia, YSZ) and stainless-steel-based metal interconnects. The brazing process occurs directly in an air environment at around 1000 °C. Molten CuO has an excellent affinity to react with YSZ, contributing to better wetting with more CuO contents [26]. However, the formation of brittle Cu-Cr-Fe oxides at filler/stainless steel interfaces harms mechanical properties and accelerates joint deterioration [6,21,30,31,32]. Recent studies propose protective coating on stainless steel to alleviate the problem [6,28,33].
Compared to RAB, more reliable joints can be obtained through vacuum brazing. In the method, active metals, such as Ti, Zr, V, etc., are usually added to brazing fillers because the activity of the elements can facilitate reactive wetting and bonding for ceramic components [34,35,36]. Ag-based active fillers, such as Ticusil (68.8Ag-26.7Cu-4.5Ti, in wt %, melting range: 830–850 °C) and Cusil-ABA (63Ag-35.25Cu-1.75Ti, in wt %, melting range: 780–815 °C), have been used for brazing YSZ and stainless steels [18,37]. The reaction products, Cu/Ti-rich oxides (including Ti3Cu3O, Ti4Cu2O, TiO, and so on) and Fe/Ti-rich compounds, were observed at the YSZ/filler and the filler/steel interfaces, respectively.
Au-based active fillers, such as Gold ABA (96.4Au-3Ni-0.6Ti, in wt %, melting range: 1003–1030 °C) and Gold-ABA-V (97.45Au-0.8Ni-1.75V, in wt %, melting range: 1045–1090 °C), are also applied to YSZ/stainless steel braze [15,16,17]. For Gold ABA filler, results showed a Ti2O3 layer formed at the YSZ/filler interface, and an Au/Fe dissolution area began at the stainless steel side. For Gold-ABA-V filler, the same reaction products were observed on the stainless steel side; however, the V element had lower activity toward oxide ceramics, leading to poor bonding with YSZ.
There are also many studies related to the utilization of non-active fillers for brazing ceramics and metal components; to achieve the same effects as those of active fillers, adding reactive reagents (e.g., TiH2) into non-active fillers [25,38,39,40], or modifying the surface characteristic of ceramics via a metallization process [41,42,43], is usually employed before brazing.
In the past, we developed a brazing filler based on an Ag-Ge-Si alloy system [44]. The preliminary characterizations of the fillers were also investigated [45]. In this study, we will choose one of the alloy compositions as a sealant and combine it with the metallization method to join YSZ and stainless steels. The microstructure and gas tightness of the brazed joints will be examined to evaluate the feasibility of utilizing the alloy for SOFC sealing.

2. Material and Experimental Procedures

2.1. Brazing Filler Preparation

The brazing filler, 95Ag-2.5Ge-2.5Si in wt %, was prepared with vacuum arc re-melting (VAR). Ag (purity 99.99%), Ge (purity 99.9%), and Si (purity 99.9%) powders with the above stoichiometric ratio were mixed using ball milling; afterward, the powder mixtures were compressed into a compact with a hydraulic machine. Before arc melting, the chamber of electric-arc furnaces was evacuated to around 10−2 torr and filled with argon (purity 99.99%) at least three times to ensure low oxygen content. The Ag-Ge-Si compact was put on a water-cooling copper hearth and then melted with an electric arc to manufacture alloy ingots (arc melting was conducted at least twice to achieve a homogeneous composition). Finally, the bars were cut into specific dimensions for physical characterizations or rolled into a foil form for brazing (foil thickness of around 130 μm, rolling provided by KTX Material Co., Ltd., New Taipei City, Taiwan).

2.2. Characterization of the Brazing Filler

This paper will investigate the average chemical composition, melting range, coefficient of thermal expansion (CTE), and microstructure of arc-melted 95Ag-2.5Ge-2.5Si filler to obtain the basic properties of the alloy. For the chemical composition analysis, a small amount (~0.3 g) of the alloys was dissolved in aqua regia and prepared as a dilute solution beforehand. The sample was analyzed using inductively coupled plasma mass spectrometry (ICP-MS, ELEMENT XR, Thermo Fisher Scientific, Waltham, MA, USA). The melting range was measured via a differential thermal analyzer (DTA, Diamond TG/DTA, PerkinElmer, Waltham, MA, USA). A small amount (30~50 mg) of the filler was put on an alumina holder in the DTA furnace and experienced a heating and cooling cycle between room temperature (RT) and 1000 °C with a ramping rate of 10 °C/min in a nitrogen atmosphere. To determine the CTE, the filler alloy was cut into a rectangular shape (L: 5 mm × W: 5 mm × H: 10 mm) and examined via a thermal mechanical analyzer (TMA, Diamond TMA, PerkinElmer, USA) with a compressive load of 50 mN and heating rate of 10 °C/min from RT to 800 °C in a nitrogen atmosphere. The microstructure of the filler was inspected using a scanning electron microscope (SEM) and an electron probe micro-analyzer (EPMA, JXA-8530F Plus, JEOL, Tokyo, Japan).

2.3. Wetting Tests and Brazing of the YSZ Electrolyte and Crofer 22H Stainless Steel

The parent materials, YSZ (Kceracell, Geumsan-gun, Republic of Korea) and Crofer 22H stainless steel (VDM Metals, Werdohl, Germany), were machined into square sheets (L: 10 mm × W: 10 mm, t: 1 mm), polished with sandpapers and cleaned with ethanol solutions sequentially. Surface metallization of parent materials with the magnetron sputtering method had to be conducted to improve the compatibility between the 95Ag-2.5Ge-2.5Si filler and parent materials. The sputtering was implemented with an argon plasma under a vacuum level of around 10−3 torr at 200 °C. Metallic layers with specific thicknesses (Ti: 1 μm, Cu: 3 μm, Ag: 5 μm) were sequentially deposited on the surface of YSZ, and an Ag layer with a thickness of 5 μm coated on the surface of Crofer 22H. The contact angle measurement would verify the wetting performance of 95Ag-2.5Ge-2.5Si filler on parent materials. The arc-melted alloy beads (each one ~0.15 g) were put on metalized parent materials and then melted by heating up to 900 °C under 10−6 torr. 95Ag-2.5Ge-2.5Si foils were sandwiched between metalized parent materials and fixed with a ceramic holder for brazing. The brazing procedure was performed at 900 °C for 10 min with a heating rate of 10 °C/min; the vacuum level was controlled under 10−6 torr using a rotary pump and diffusion pump.

2.4. The Microstructural Observation of YSZ/Crofer 22H Brazed Joints

The YSZ/Crofer 22H brazed specimens were cut, mounted, and polished sequentially to prepare metallographic samples. SEM and EPMA (JXA-8530F Plus, JEOL, Japan) examined cross-sectional microstructures and quantitative chemical compositions. Elements’ distribution was analyzed through an energy-dispersive X-ray spectroscope (EDS, X-Max, Oxford Instruments, Oxford, UK). The as-brazed and thermal-aged (at 750 °C for 100 h in the air) joints were compared to investigate the evolution of interfacial microstructures.

2.5. The Gas-Tightness Tests of YSZ/Crofer 22H Brazed Joints

To prepare the samples for gas-tightness tests, parent materials were cut into square shapes in advance. The YSZ and Crofer 22H dimensions were L: 20 mm × W: 20 mm, and L: 14 mm × W: 14 mm, respectively. 95Ag-2.5Ge-2.5Si foils were cut into a frame form with an inner area of 8 × 8 mm2 and an outer area of 16 × 16 mm2. Afterward, the metallization and brazing of parent materials were the same as mentioned above. The gas-tight properties were examined through a pressure-drop device. For pressure-drop tests, the samples were connected to a buffer tank filled with helium under a pressure of 2 psig and then kept at RT and 750 °C for a period, respectively. The changes in the intake pressure with time would be recorded to evaluate the leakage situation during test periods. The definition of the average leakage rate is illustrated below [46].
L e a k a g e   r a t e = Δ P Δ t × V   ( m b a r · L / s )
P: the intake pressure change, Δt: the test period, V: the volume of the buffer tank, 10 L) [46].

3. Results and Discussion

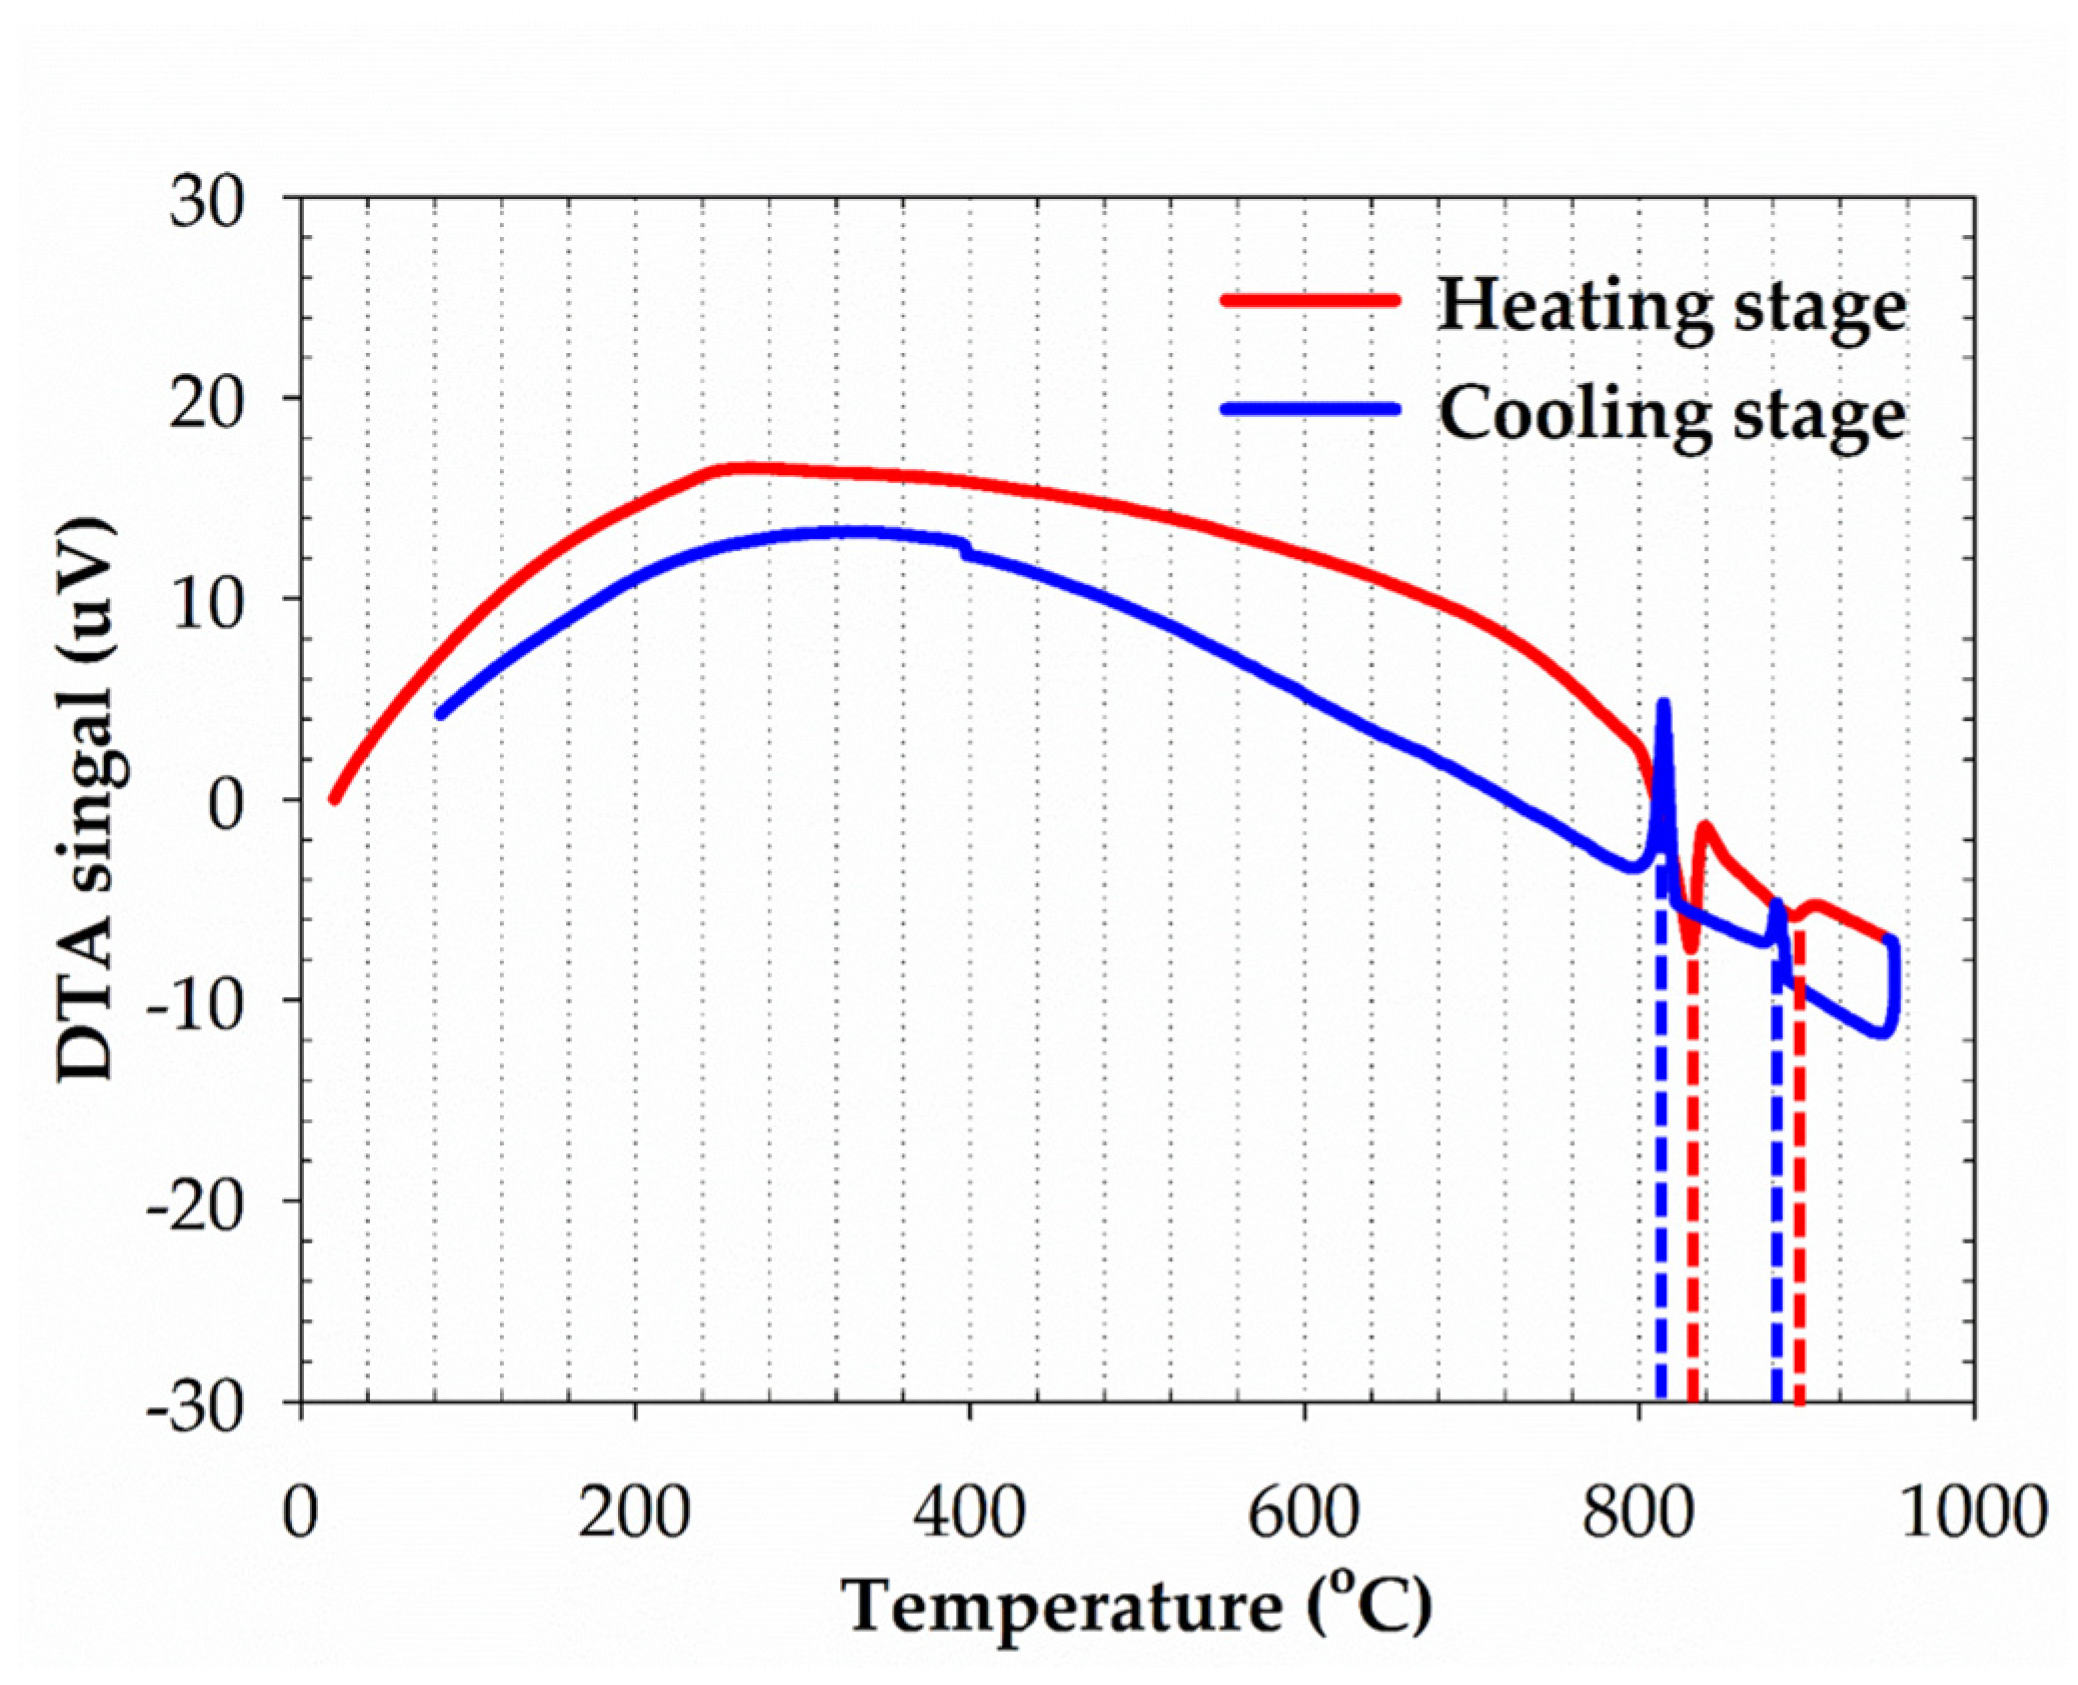
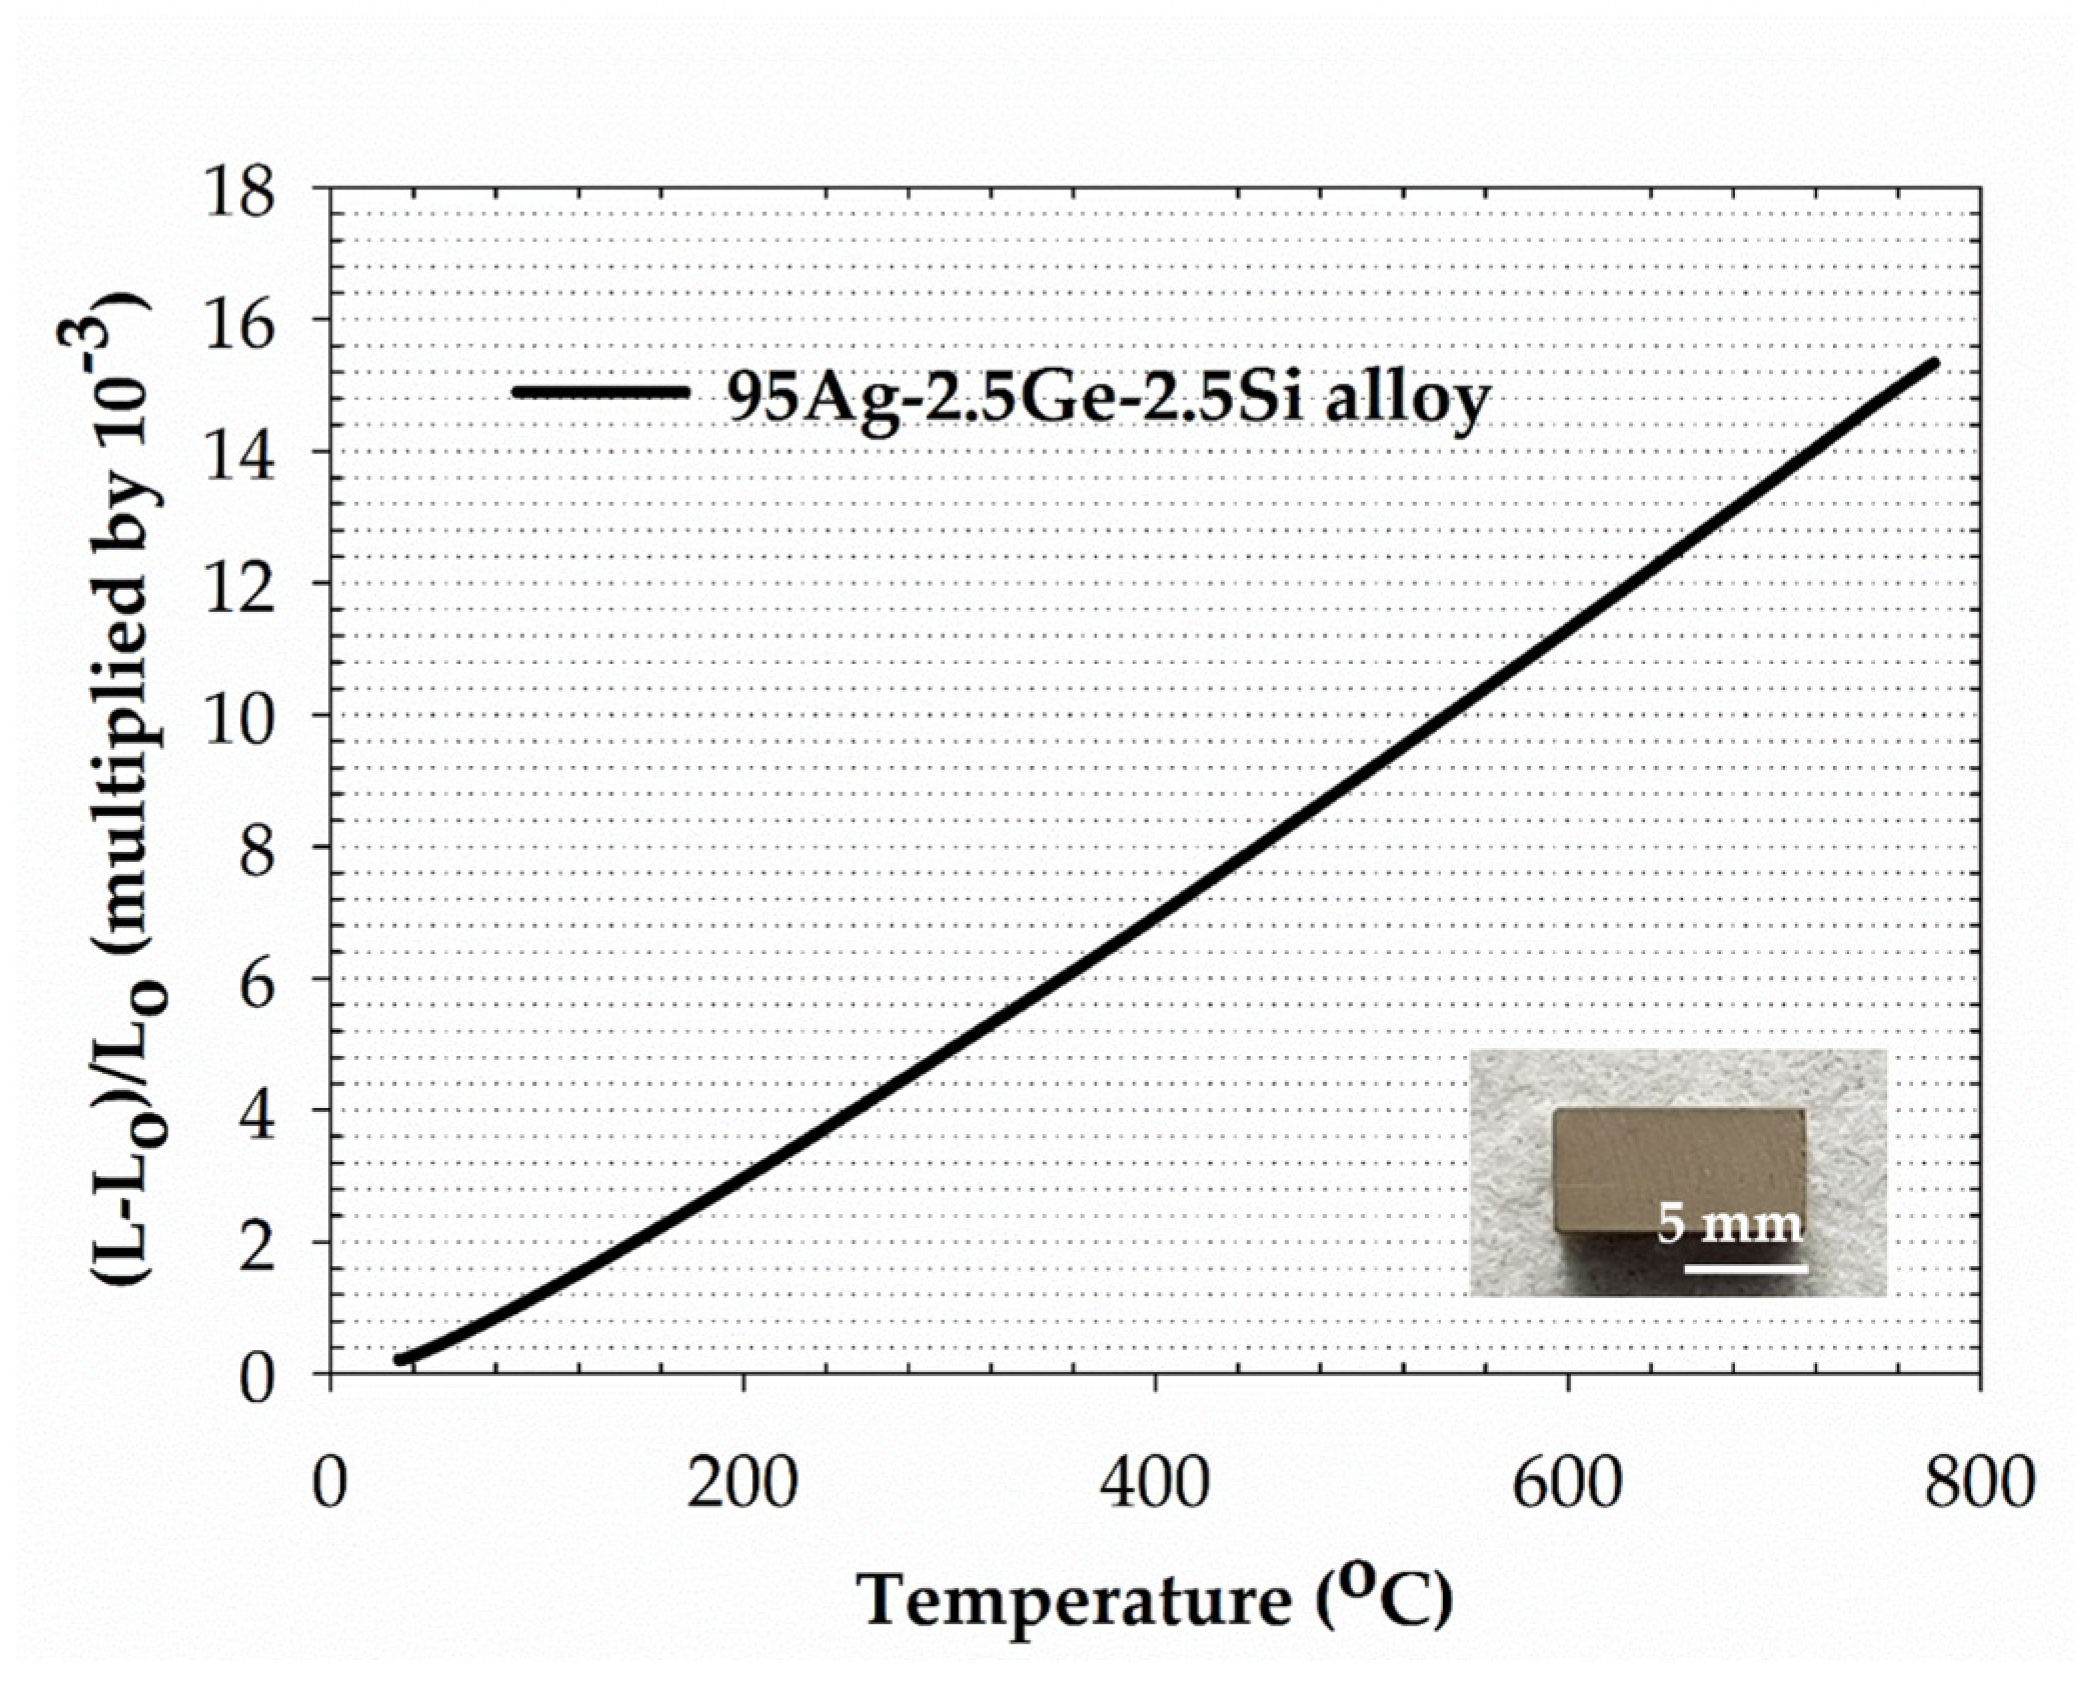
3.1. The Physical Characterization of the 95Ag-2.5Ge-2.5Si Filler

The average chemical composition of the 95Ag-2.5Ge-2.5Si filler is listed in Table 1, composed of 95.13 Ag, 2.35 Ge, and 2.48 Si (in wt %). There was only a minor deviation between actual and nominal composition, showing that the precise control of desired alloy proportions could be achieved in manufacturing. The melting behavior of the 95Ag-2.5Ge-2.5Si filler analyzed with DTA is demonstrated in Figure 1. During the heating stage, two endothermic peaks at around 830 °C and 890 °C correlated to the filler’s solidus and liquidus temperatures. When the specimen cooled back to RT, the corresponding exothermic peaks were close to those above. The results suggested that the brazing temperature should be above 890 °C; the filler could completely melt. Characterizing the melting behavior ensured the filler could be utilized at the IT-SOFC with a temperature range between 600 and 800 °C.
The behavior of the thermal expansion of 95Ag-2.5Ge-2.5Si filler is shown in Figure 2. According to the CTE definition below [47], the change rate of sample length with temperature could represent the average CTE. The Figure 2 curve was separated into several linear sections for CTE calculation, as listed in Table 2. The result indicated that the CTE value increased with temperature, which was around 22.7 ppm/K at the IT-SOFC operational temperature range. Compared to other brazing fillers, we could find that most fillers own higher CTE than that of the YSZ (10.8 ppm/K) or Crofer 22H (12.3 ppm/K) substrate, such as Ticusil (18.5 ppm/K, 20–500 °C) [48], Cusil-ABA (18.5 ppm/K, 20–500 °C) [49], Gold-ABA (16.1 ppm/K, 20–850 °C) [50], and Ag-2CuO (in mole %, 19.6 ppm/K, 25–800 °C) [28]. Even though the CTE mismatch between fillers and SOFC materials is significant, previous reports also indicated that the metal layer can mitigate the thermal strain effectively through a plastic deformation mechanism [19].
C T E = ( L L o ) L o × Δ T ( p p m / K )
Lo: the original length of the sample, LLo: the change in length, ΔT: the temperature gradient [47].

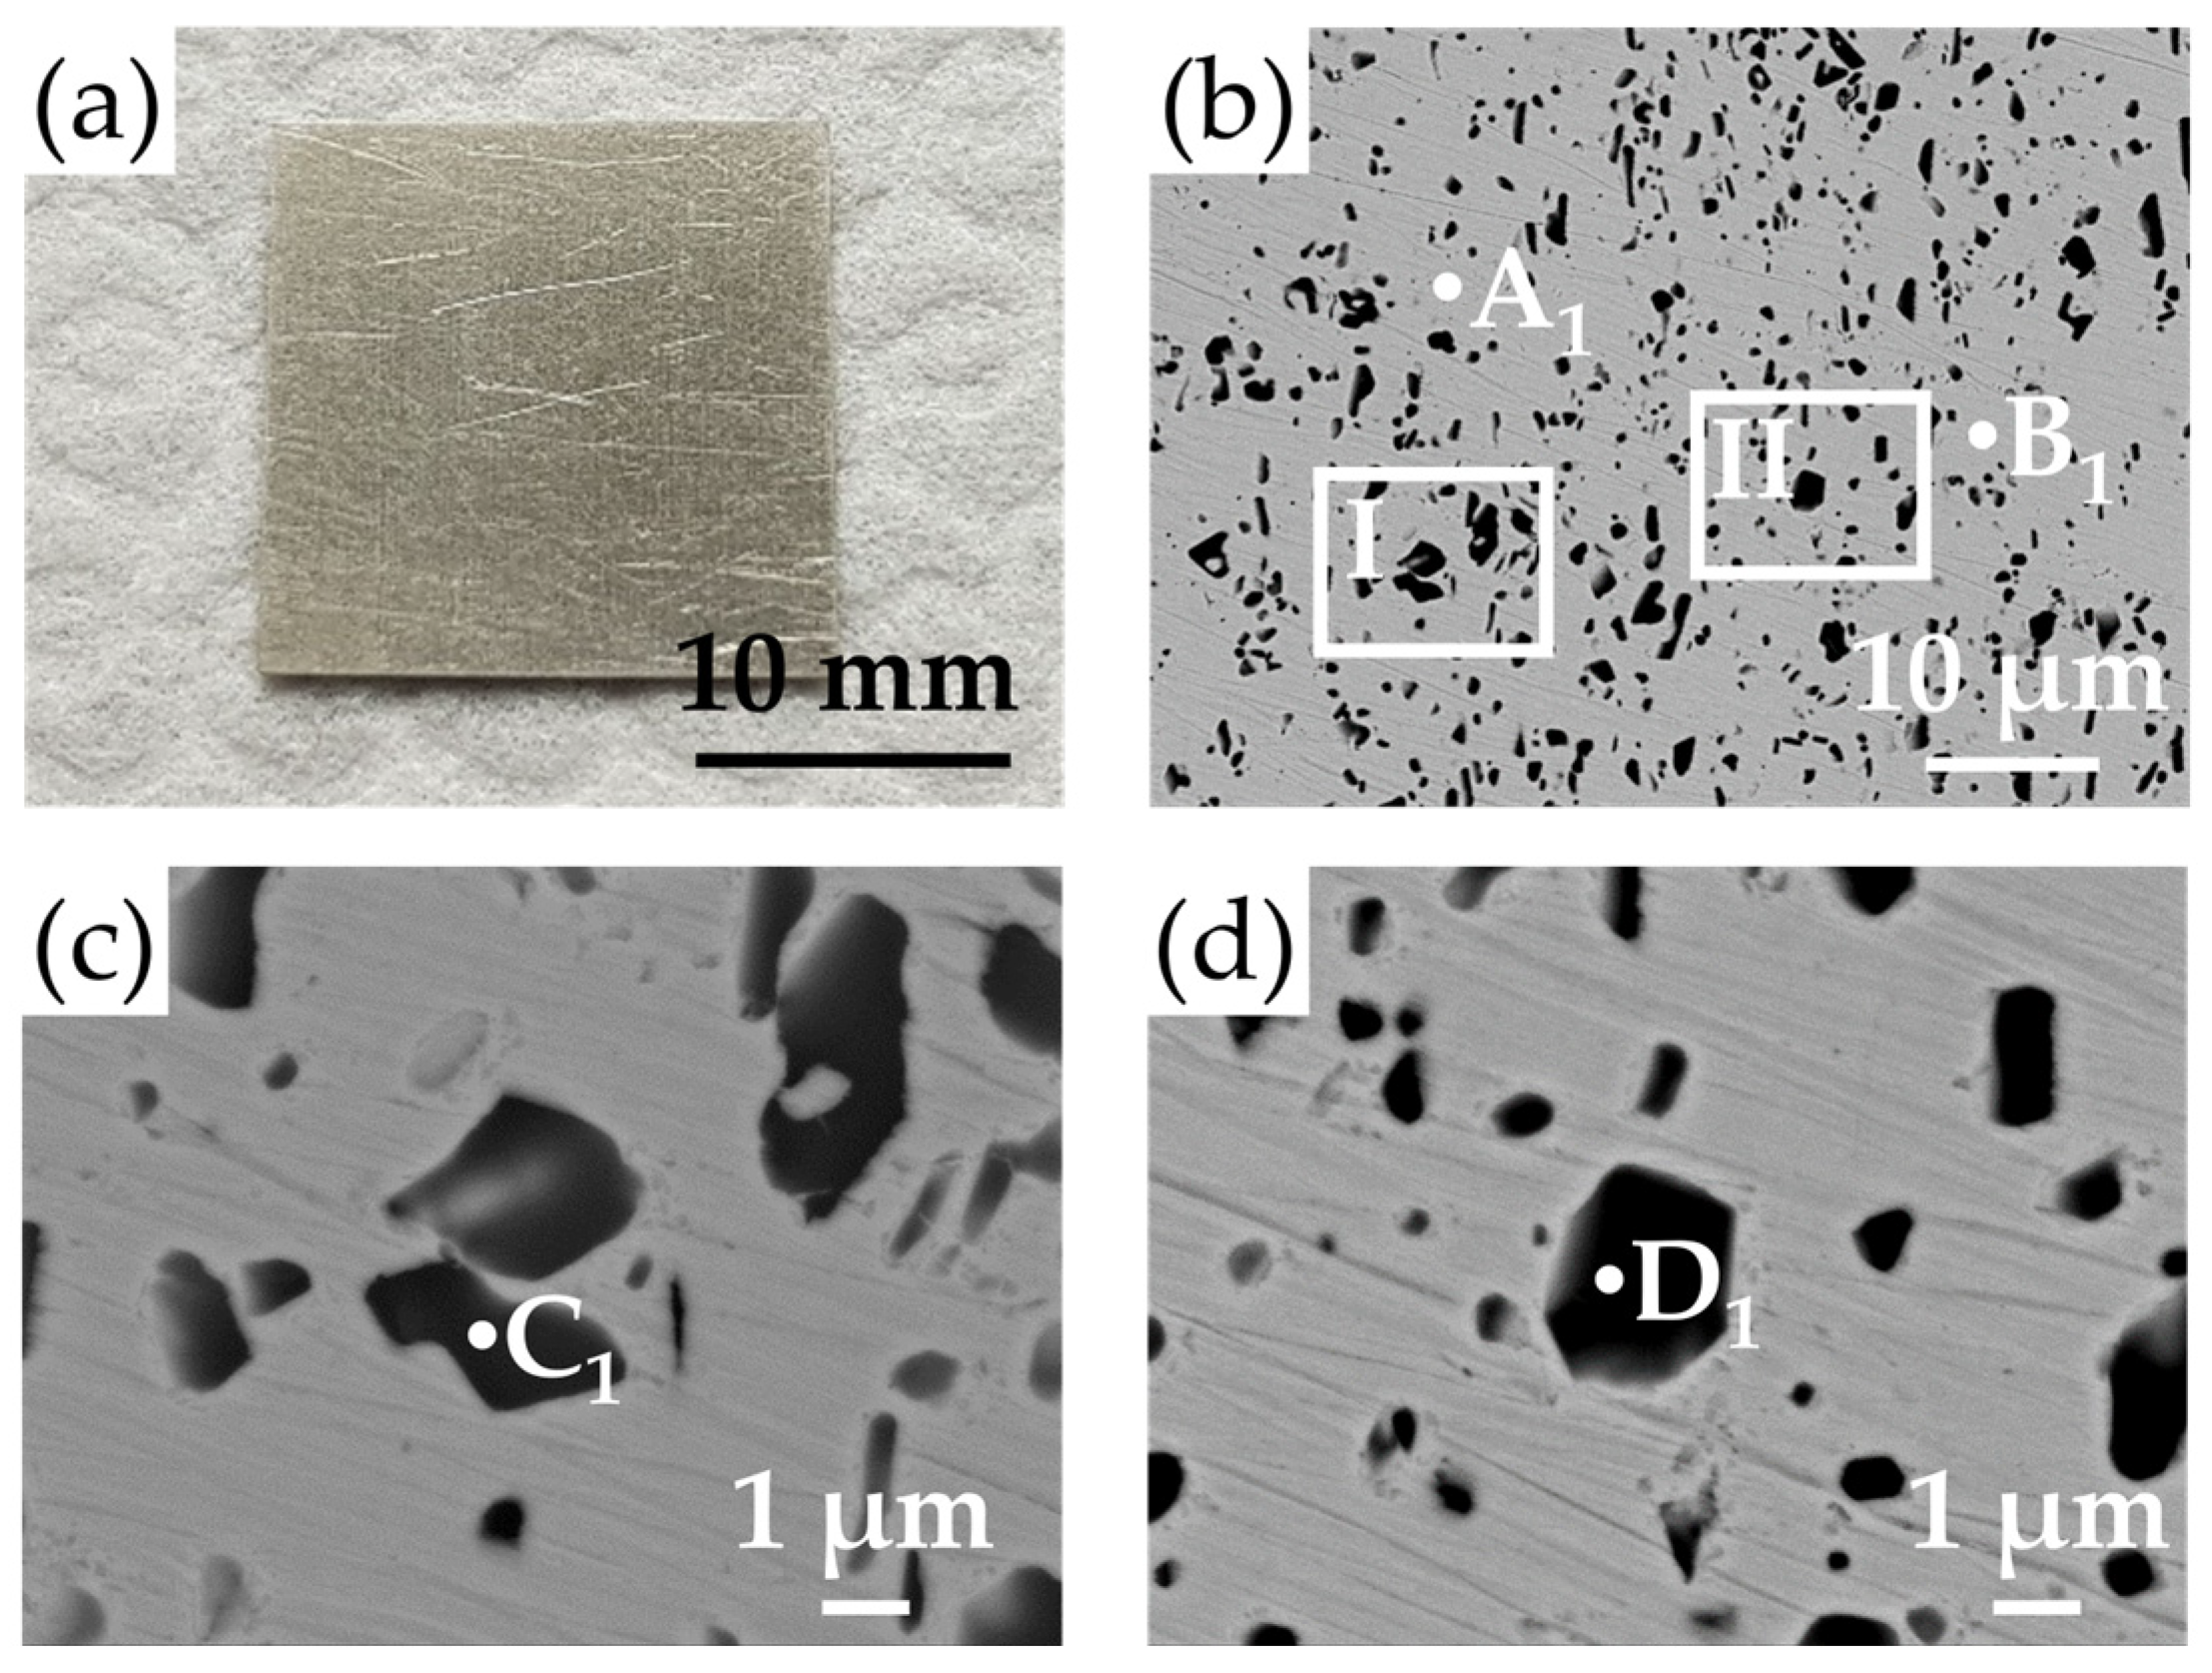
3.2. The Microstructure and Phase Identification of the 95Ag-2.5Ge-2.5Si Filler

Figure 3a shows the appearance of the 95Ag-2.5Ge-2.5Si filler foil prepared with rolling; each was cut into a dimension of L: 18 mm × W: 18 mm for subsequent brazing procedures. The backscattered electron images (BEIs) of the 95Ag-2.5Ge-2.5Si filler are illustrated in Figure 3b–d, and EPMA chemical analyses are concluded in Table 3. According to the image contrast in Figure 3b, the microstructure of 95Ag-2.5Ge-2.5Si filler mainly included two phases. From the EPMA results in Table 3, the matrix (points A1 and B1 in Figure 3b) was the Ag-rich phase, and the black precipitates (points C1 and D1 in Figure 3c,d) were the Si-rich phase. Referring to Ag-Si, Ag-Ge, and Ge-Si binary alloy phase diagrams [51,52,53], Si is hardly soluble with Ag. Still, Ag has limited solubility with Ge to form a binary solid solution. It could explain that the Ag-rich matrix in Figure 3b comprised an Ag-Ge solid solution. In addition, Ge and Si can be completely miscible in all proportions, so it was deduced that the Si-rich precipitates in Figure 3c,d mainly comprise a Ge-Si solid solution.

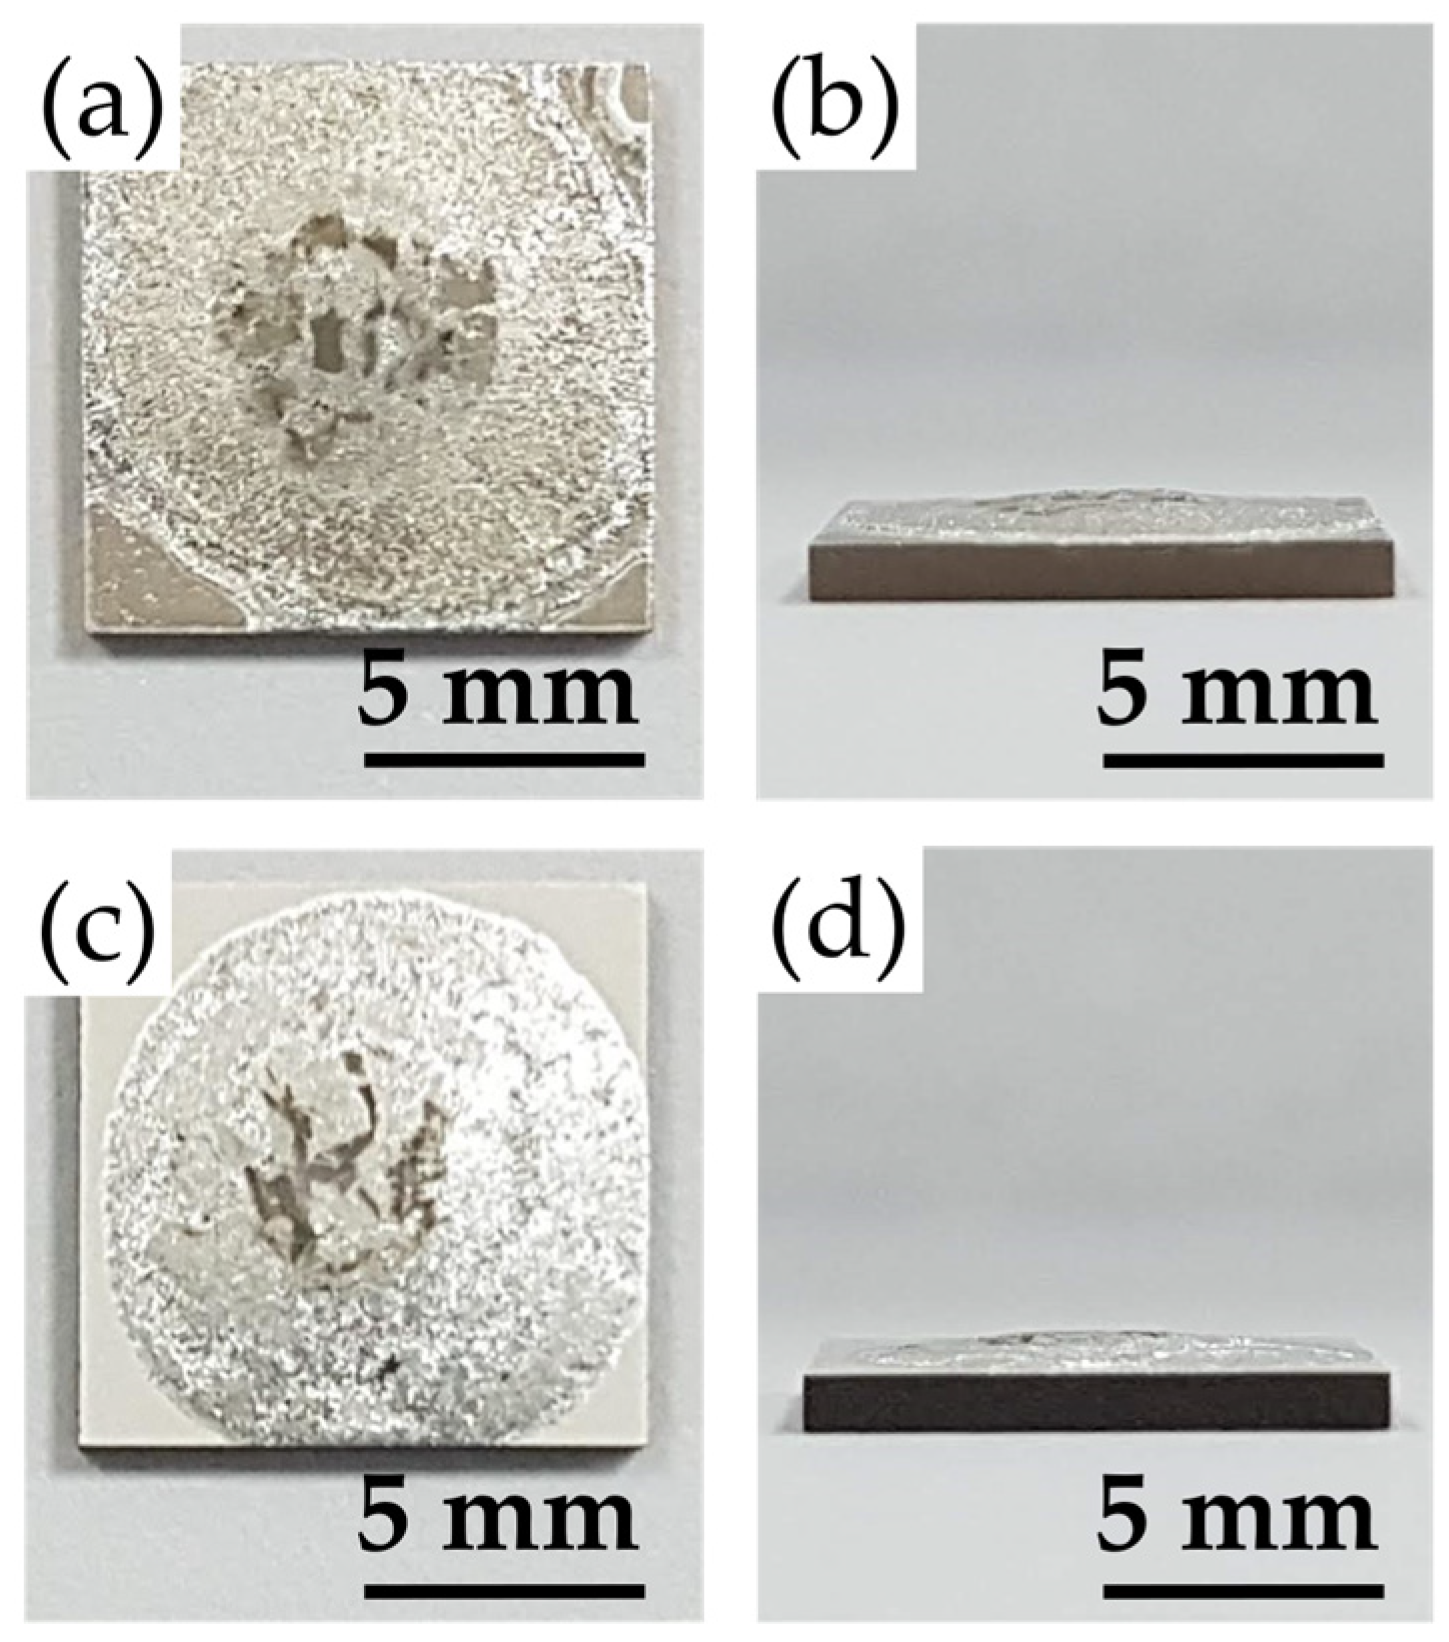
3.3. The Wetting Tests and Cross-Sectional Microstructure of As-Brazed Joints

The wetting results of 95Ag-2.5Ge-2.5Si beads on two metalized substrates are demonstrated in Figure 4. It was found that the spreading ability of the bead on the substrate could be improved through sputtering with metallic layers on the substrate (Figure 4a,c). From transverse views (Figure 4b,d), the contact angles of the beads on the metalized YSZ and Crofer 22H substrate were 12° and 18°, respectively.
Figure 5 shows the BEIs of vacuum-brazed YSZ/Crofer 22H joints, and EPMA chemical analyses of selected locations in Figure 5 are illustrated in Table 4. The results indicated that the microstructure of the braze-melt deviated from that of the original filler due to the dissolution and segregation of elements (Figure 5b). The matrix of the brazed zone was composed of an Ag-rich phase (point A2 in Figure 5b). In addition, a small amount of Cu/Si-rich (points B2 and C2 in Figure 5b) and Si-rich phases (point D2 in Figure 5b) was also found in the brazed zone. It is worth mentioning that these phases are all slightly oxidized.
At the YSZ/filler interface of the brazed joint, there was a reaction layer formed here, as illustrated in Figure 5c. According to EPMA results, the reaction layer consisted of two kinds of chemical species (points E2 and F2 in Figure 5c). The main phase of the E2 location was composed of a Ge-Si solid solution. The phase of point F2 mainly consisted of O, Si, and Ti elements and was regarded as a Si/Ti-rich oxide. As disclosed in the result, most Cu from metalized layers had been dissolved into the braze-melt, but Ti content was still located at the YSZ side after metallurgical reactions. It was convincing that Ti facilitated wetting with ceramics and contributed to forming a good bond. EDS mappings of the YSZ/filler interface in Figure 5c are shown in Figure 6. From Figure 6a,e,g, Ge and Si elements were segregated toward the YSZ side after a brazing cycle; the Ag matrix was left in the braze-melt. Figure 6b,h show that only metalized Ti was distributed at the YSZ surface. Figure 6c,d indicate that the Cr and Fe elements from the Crofer 22H substrate did not segregate toward the YSZ side. As for the YSZ substrate, the O, Y, and Zr elements’ distribution is illustrated in Figure 6f,i,j, respectively. Only the O element was partially dissolved into the braze-melt to react with the metalized Ti. The EDS results are consistent with the above EPMA analyses.
The filler/Crofer 22H interface of the brazed joint is illustrated in Figure 5d. The EPMA result showed that the reaction layer at the interface mainly consisted of Cr, Fe, and Si elements (point G2 in Figure 5d). Refer to Cr-Si and Fe-Si binary phase diagrams [54,55]; Si can be dissolved in Cr or Fe content within a specific ratio. It could be explained that the interfacial layer was composed of an Fe-Cr solid solution (i.e., Crofer 22H) alloyed with Si. EDS mappings of the filler/Crofer 22H interface in Figure 5d are shown in Figure 7. From Figure 7c,d,g, Cr and Fe elements from the Crofer 22H substrate were dissolved into the braze-melt, and Si was segregated toward the Crofer 22H side. In addition, according to Figure 7b,e,f,h–j, there were no significant reactions between other elements (Cu, Ge, O, Ti, Y, and Zr) and the Crofer 22H substrate. The EDS results correspond to the above EPMA analyses.
The Ti metalized layer can improve the reactivity of the 95Ag-2.5Ge-2.5Si filler with the YSZ ceramic through reactive wetting, which achieves the same performance as using Ag-based active filler [18,37]. However, previous literature showed that in Ag-Cu-Ti filler, some amount of Ti would be consumed to form an Fe-Ti compound at the steel side, which weakens the bonding with ceramics. In the study, we found that Si has a higher affinity toward steel, which could reduce the reaction between Ti and Fe. In addition, compared to Ag-CuO braze, there was no apparent void or crack formation at the filler/steel interface; it shows the advantage of brazing YSZ and steel using the 95Ag-2.5Ge-2.5Si filler.

3.4. The Microstructural Evolution and Gas Tightness of the Thermal-Aged Joints

Figure 8 shows the BEIs of the thermal-aged YSZ/Crofer 22H joint, and EPMA chemical analyses of selected locations in Figure 8 are illustrated in Table 5. The results indicated that the interfacial layer thickness increased, especially between the filler and Crofer 22H substrate. The braze-melt was still composed of an Ag-rich matrix (point A3 in Figure 8b). In addition, the original Cu/Si-rich phase in the braze-melt (points B2 and C2 in Figure 5b) was oxidized into CuO (point B3 in Figure 8b) and SiO2 (point C3 in Figure 8b), respectively, which were derived from oxidation after exposure to the air at 750 °C.
The YSZ/filler interface of the thermal-aged joint is illustrated in Figure 8c. The EPMA analysis of point D3 indicated that a SiO2 layer was formed at the interface after the thermal aging test. At the YSZ surface, the Si/Ti-rich oxide layer was still preserved (point E3 in Figure 8c). EDS mappings of the YSZ/filler interface in Figure 8c are shown in Figure 9. From Figure 9f–h, O, Si, and Ti elements were located at the interface, which is consistent with the EPMA analysis results. Moreover, the oxidation of Cu and Ge was also observed according to Figure 9b,e,f; as for the substrates’ elements, Cr, Fe, Y, and Zr, there was no apparent inter-diffusion that occurred here after the thermal aging at 750 °C (Figure 9c,d,i,j).
The filler/Crofer 22H interface of the thermal-aged joint is illustrated in Figure 8d. The EPMA results indicated that different chemical species (points F3, G3, and H3 in Figure 8d) formed at the interface. The composition of point F3 mainly consisted of Ag, Cr, and O elements, and the stoichiometric ratio among them was close to 1:1:2. As disclosed from previous studies [56,57], the oxidation of Ag and Cr will lead to the formation of a variety of Ag-Cr oxides, such as AgCrO2 and Ag2CrO4, at different temperature ranges. Therefore, the point F3 area was deduced to be an AgCrO2 oxide. The composition of point G3 mainly included Cr, Fe, and Si elements, and the EPMA result showed that oxidation nearly did not occur in the area. Therefore, the area could be considered an Fe-Cr solid solution alloyed with Si. In addition, it also showed that the original reaction layer (point G2 in Figure 5d) at the interface could maintain well even after the thermal aging test at 750 °C for 100 h. As for the point H3 area, the EPMA result indicated that a Cr-rich oxide was formed at the surface of the Crofer 22H substrate. EDS mappings of the filler/Crofer 22H interface in Figure 8d are shown in Figure 10. From Figure 10a,c,d,f,g, the distribution of the elements corresponds to the above EPMA analysis results. Furthermore, the same as the results from Figure 9, the Y and Zr elements from the YSZ substrate did not diffuse toward the Crofer 22H side (Figure 10i,j).
Figure 11 shows the pressure-drop curves of YSZ/Crofer 22H brazed joints under a pressure of 2 psig for aging tests at RT and 750 °C, respectively. For as-brazed joints, there is no apparent pressure decay during the test period (Figure 11a). We also analyzed the sample using a helium detector (UL200, INFICON, Bad Ragaz, Switzerland); the result indicated the leakage rate is around 1.2 × 10⁻⁵ mbar∙L/s (Supplementary Material S1). For thermal-aged joints, the intake pressure did not change significantly during the test (Figure 11b), so the leakage rate was estimated at around the 10−5 mbar∙L/s level.
From previous reports, the YSZ/steel joint with Ticusil filler showed a leakage rate of around 1.5 × 10⁻⁹ mbar∙L/s at RT and 2.7 × 10⁻⁷ mbar∙L/s after aging at 850 °C for 100 h in the air [19]. As for the air-brazed joint, an SOFC half-cell (CGO/YSZ/anode) and Crofer 22H steel were joined via a composite filler (Ag-CuO-LiAlSiO4), and the leakage rate was around 5.7 × 10⁻⁴ mbar∙L/s after aging at 800 °C for 300 h in an oxidizing or reducing atmosphere [28]. Weil et al. [26] joined an FeCrAlY alloy with YSZ via Ag-4CuO (in mole %) filler, and the leakage rate was about 10−5 mbar∙L/s after 750 °C for 800 h in an air or hydrogen environment. The gas-tightness results mentioned above were measured with different methods, i.e., helium detector, oxygen flux, and pressure-drop device, respectively.
Compared to the results mentioned above, the YSZ/Crofer 22H joint with 95Ag-2.5Ge-2.5Si filler also demonstrated excellent gas-tight stability, which can be attributed to good interfacial integrity after thermal aging (as disclosed in Figure 8c,d). In addition, the joint could withstand the thermal stress induced at the cooling stage of the test (from 750 °C to RT); hence, it is promising to utilize the 95Ag-2.5Ge-2.5Si filler for SOFC sealing application.

4. Conclusions

We successfully utilized the 95Ag-2.5Ge-2.5Si brazing filler for brazing YSZ and Crofer 22H stainless steel, and we can potentially apply this technique to IT-SOFC sealing in the future. Important conclusions are included below.
  • The microstructure of the filler is composed of Ag-rich and Si-rich phases. The melting range of the filler can be decreased to 830–890 °C through Ge and Si addition with a stoichiometric ratio of 2.5 wt %, which meets the requirement of IT-SOFC sealing. The correlation between alloy composition and liquidus temperature is consistent with the data from the Ag-Ge-Si ternary phase diagram. The total CTE increases with temperature and reaches around 22.7 ppm/K at IT-SOFC operational temperatures.
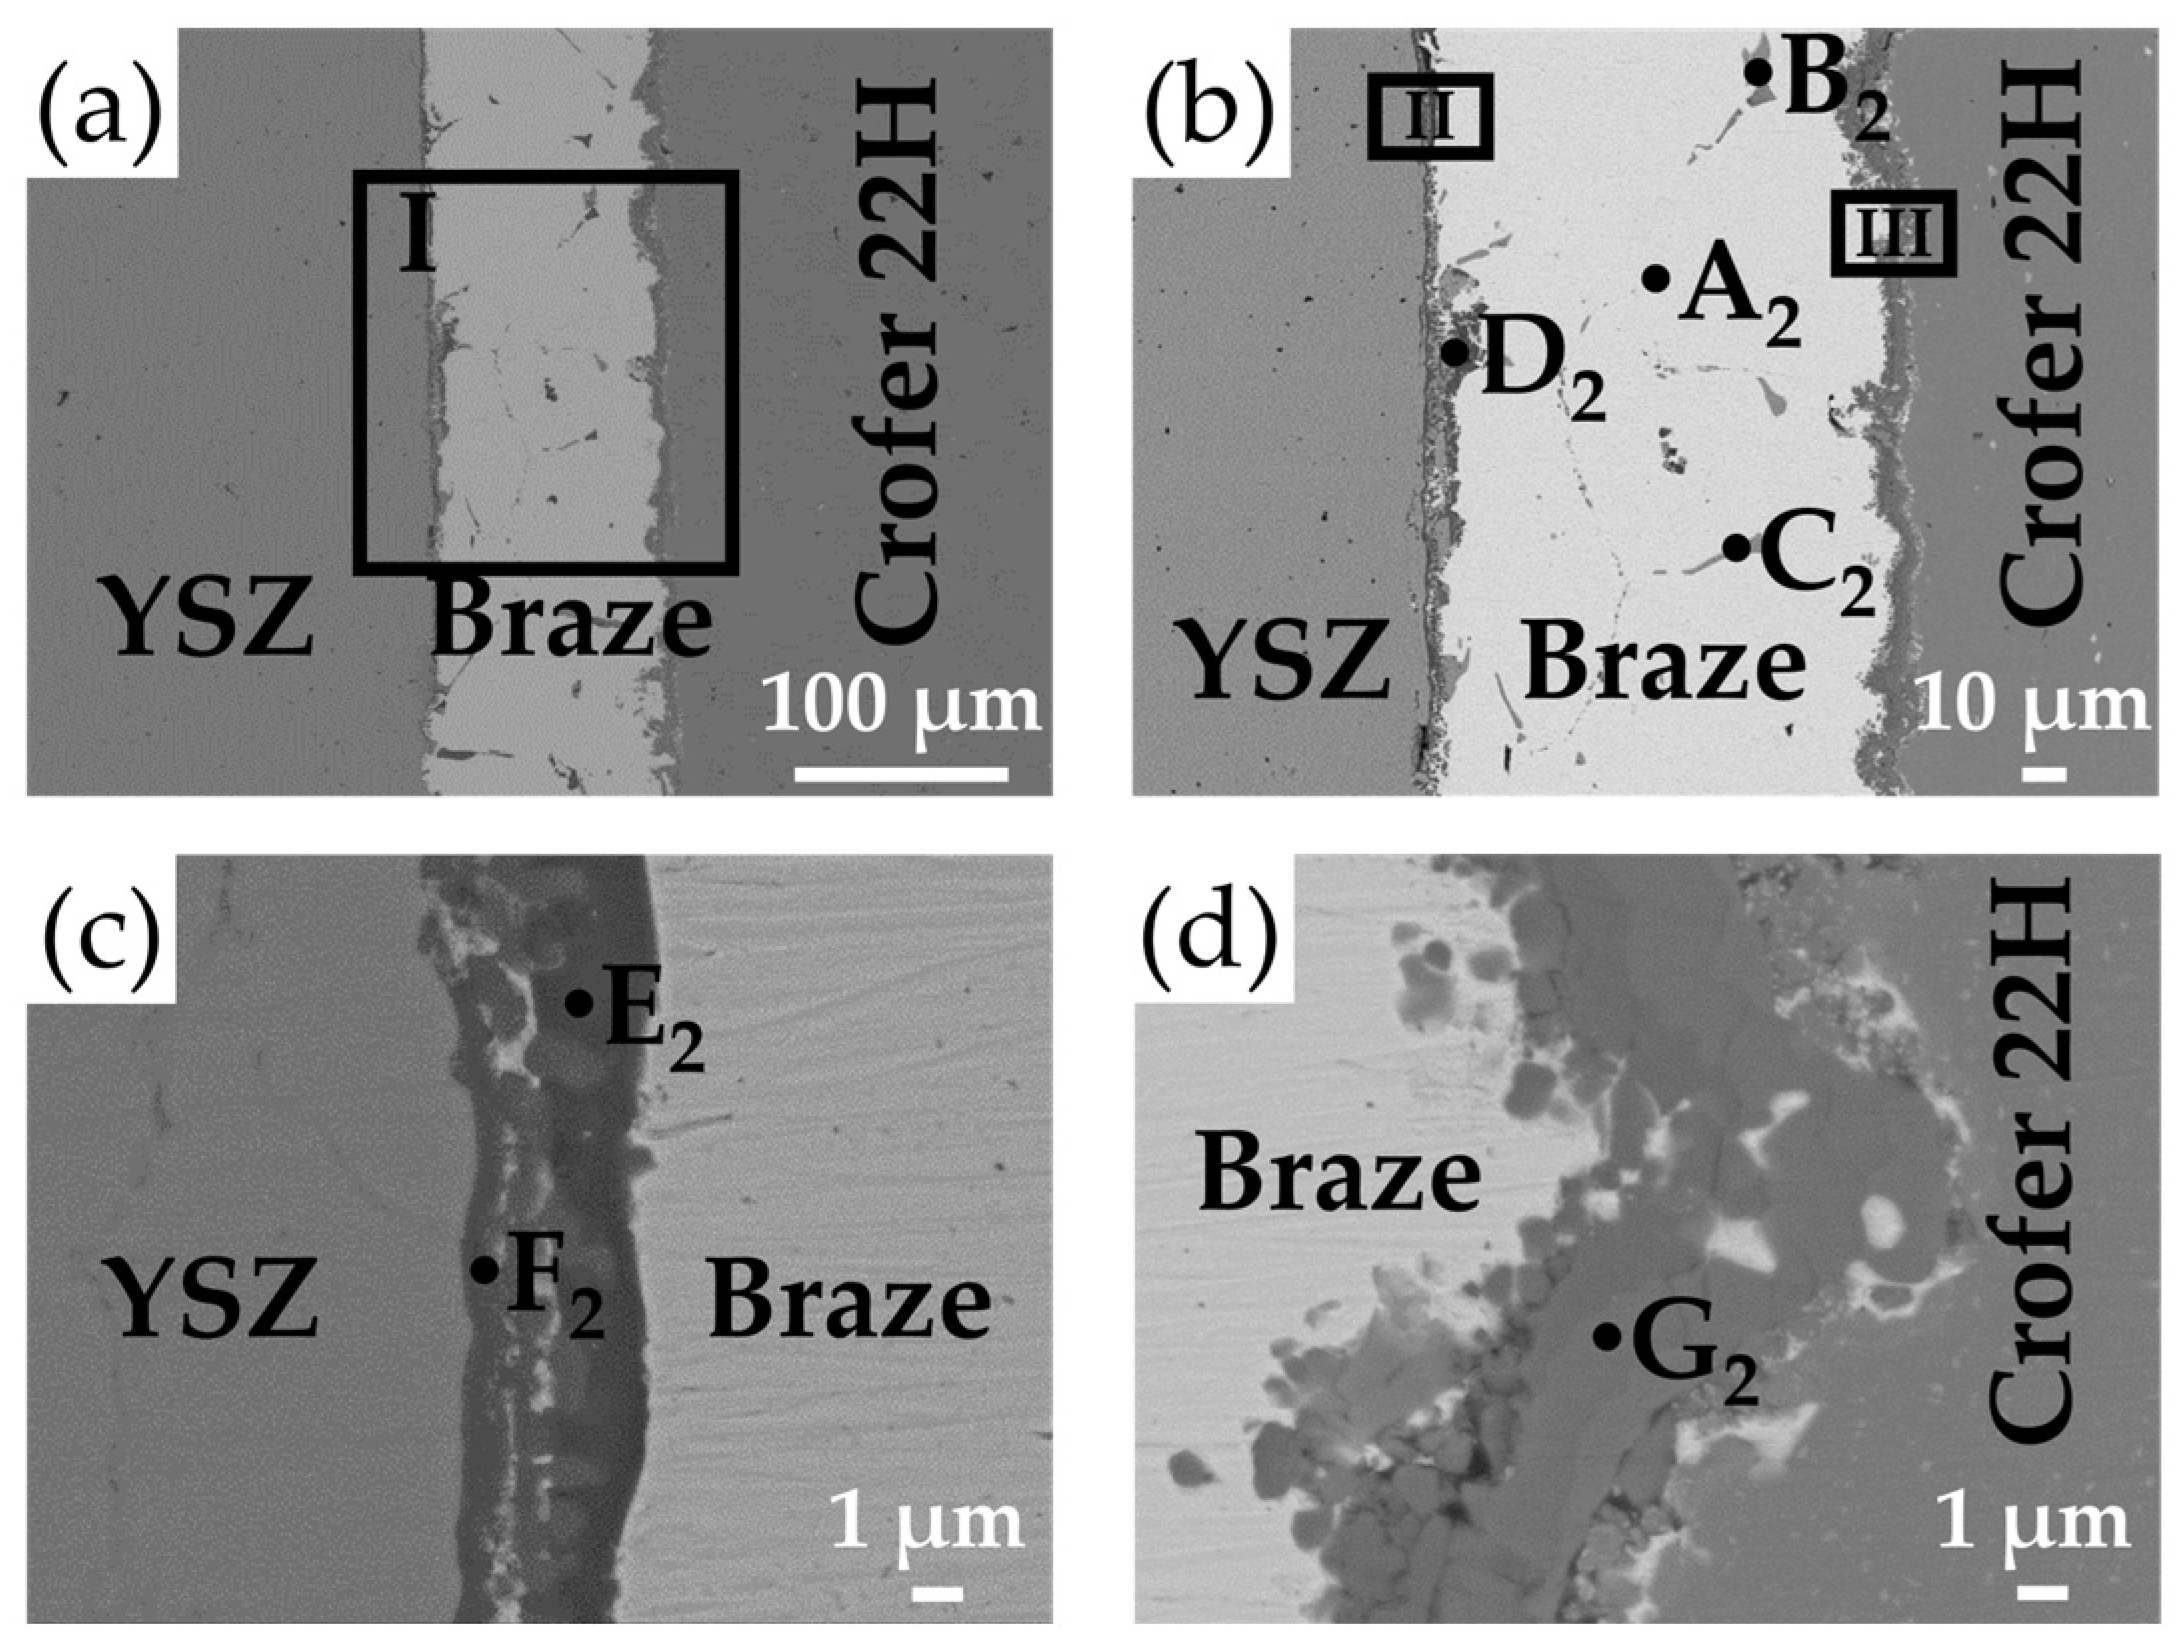
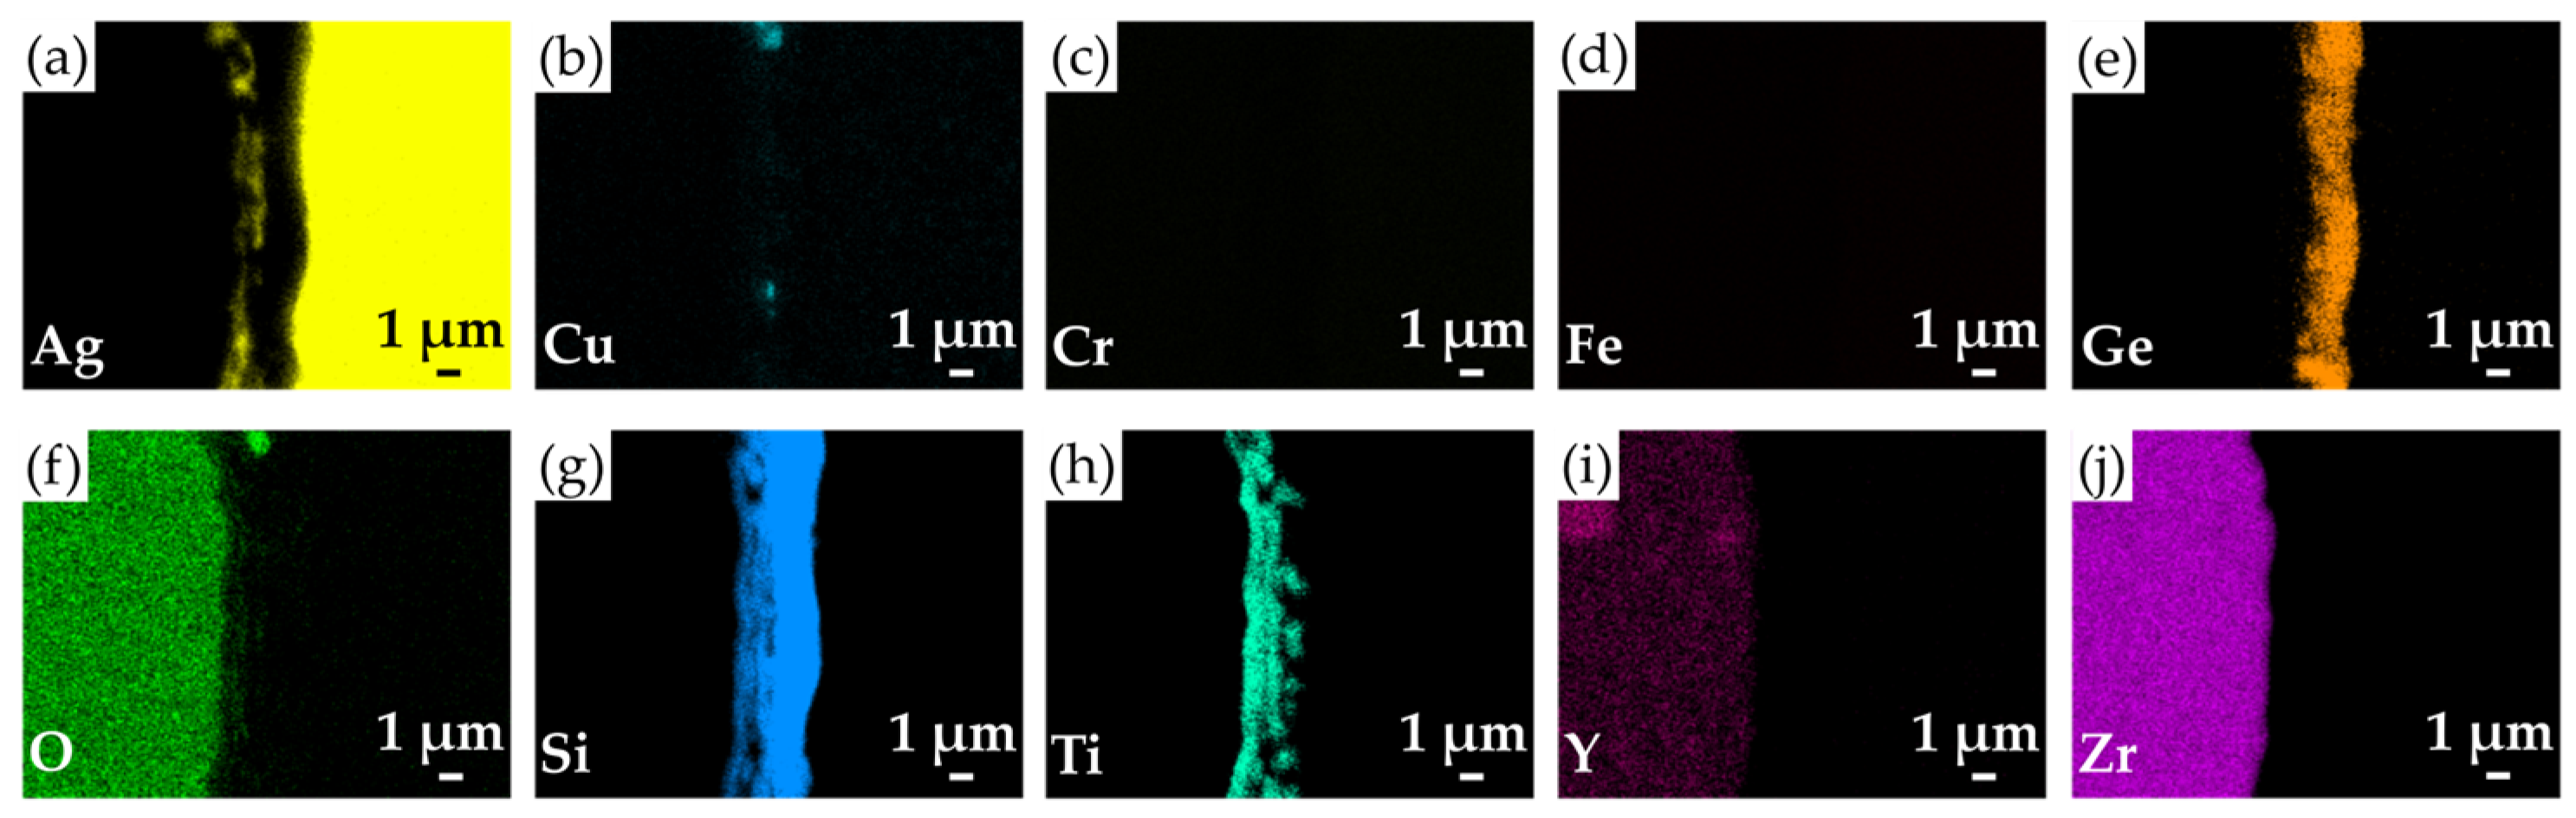
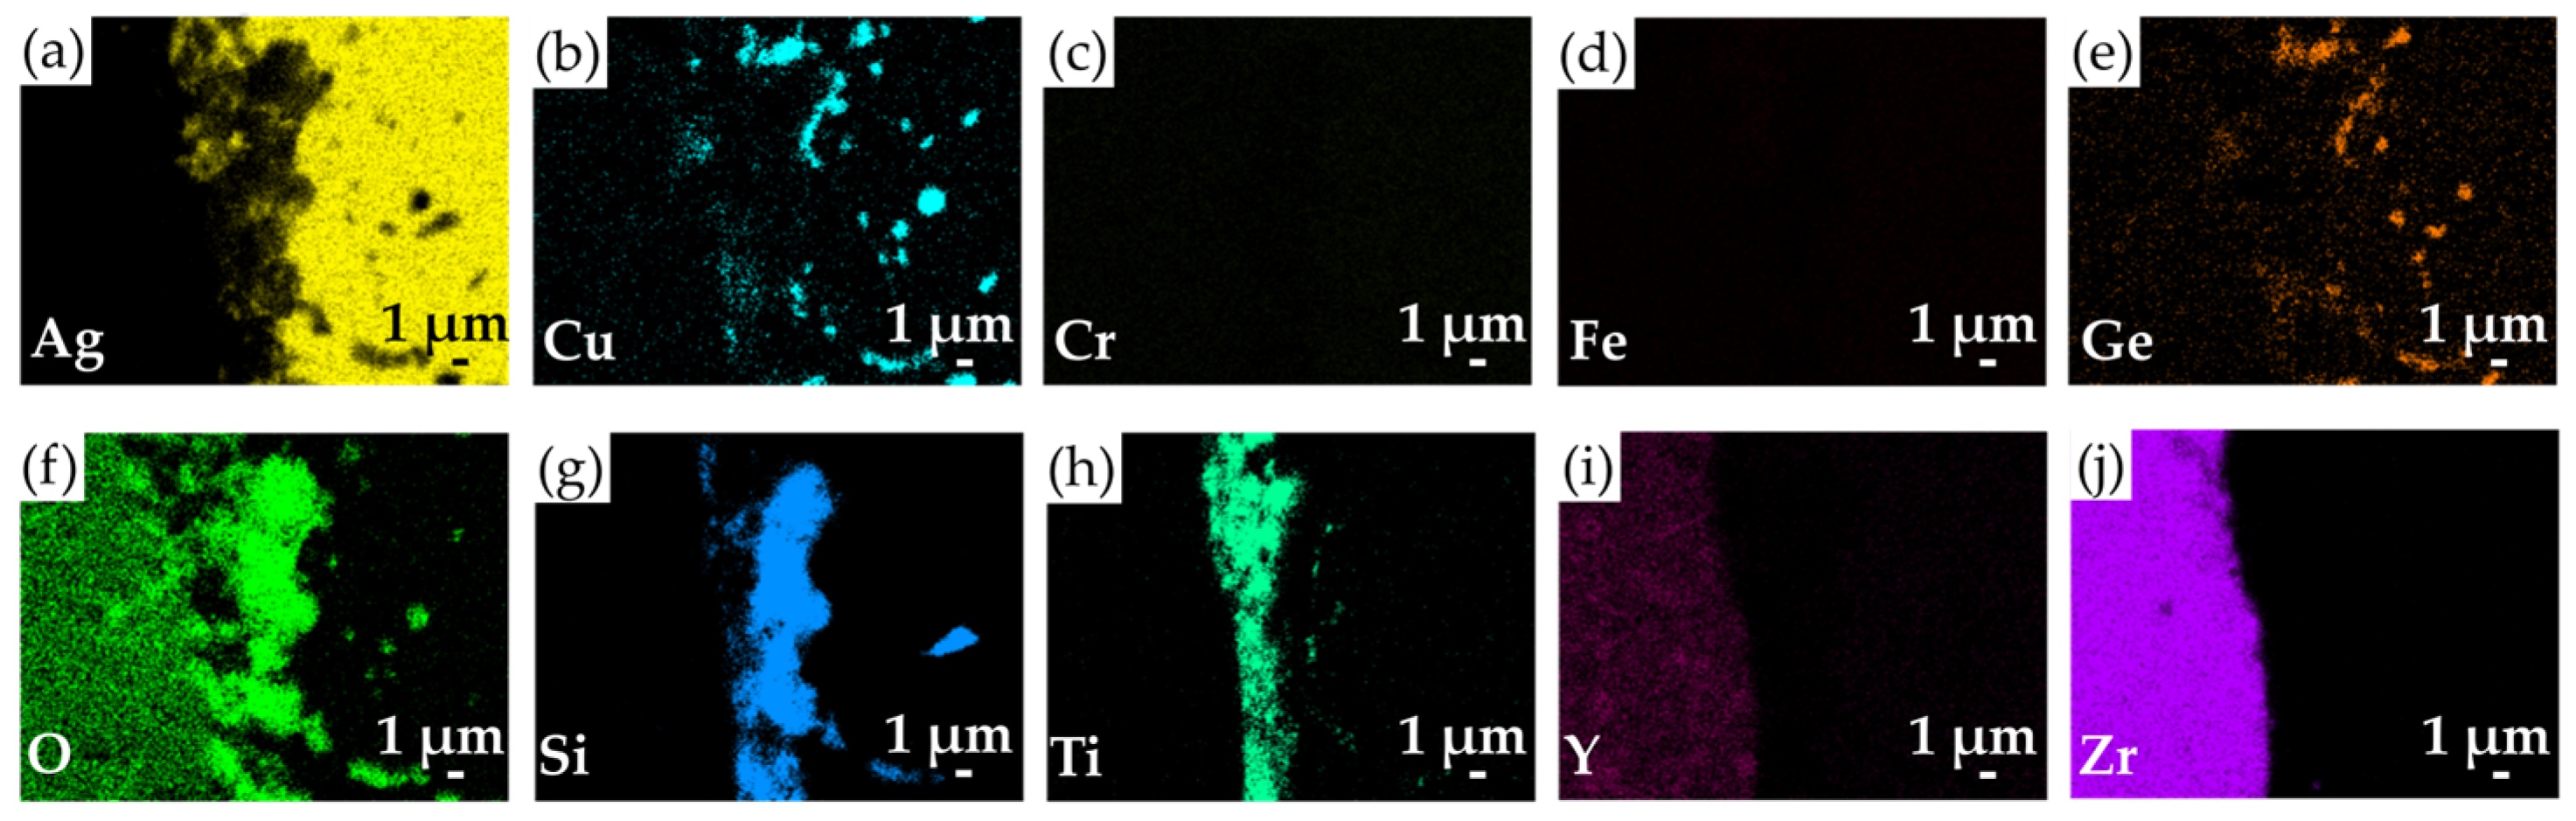
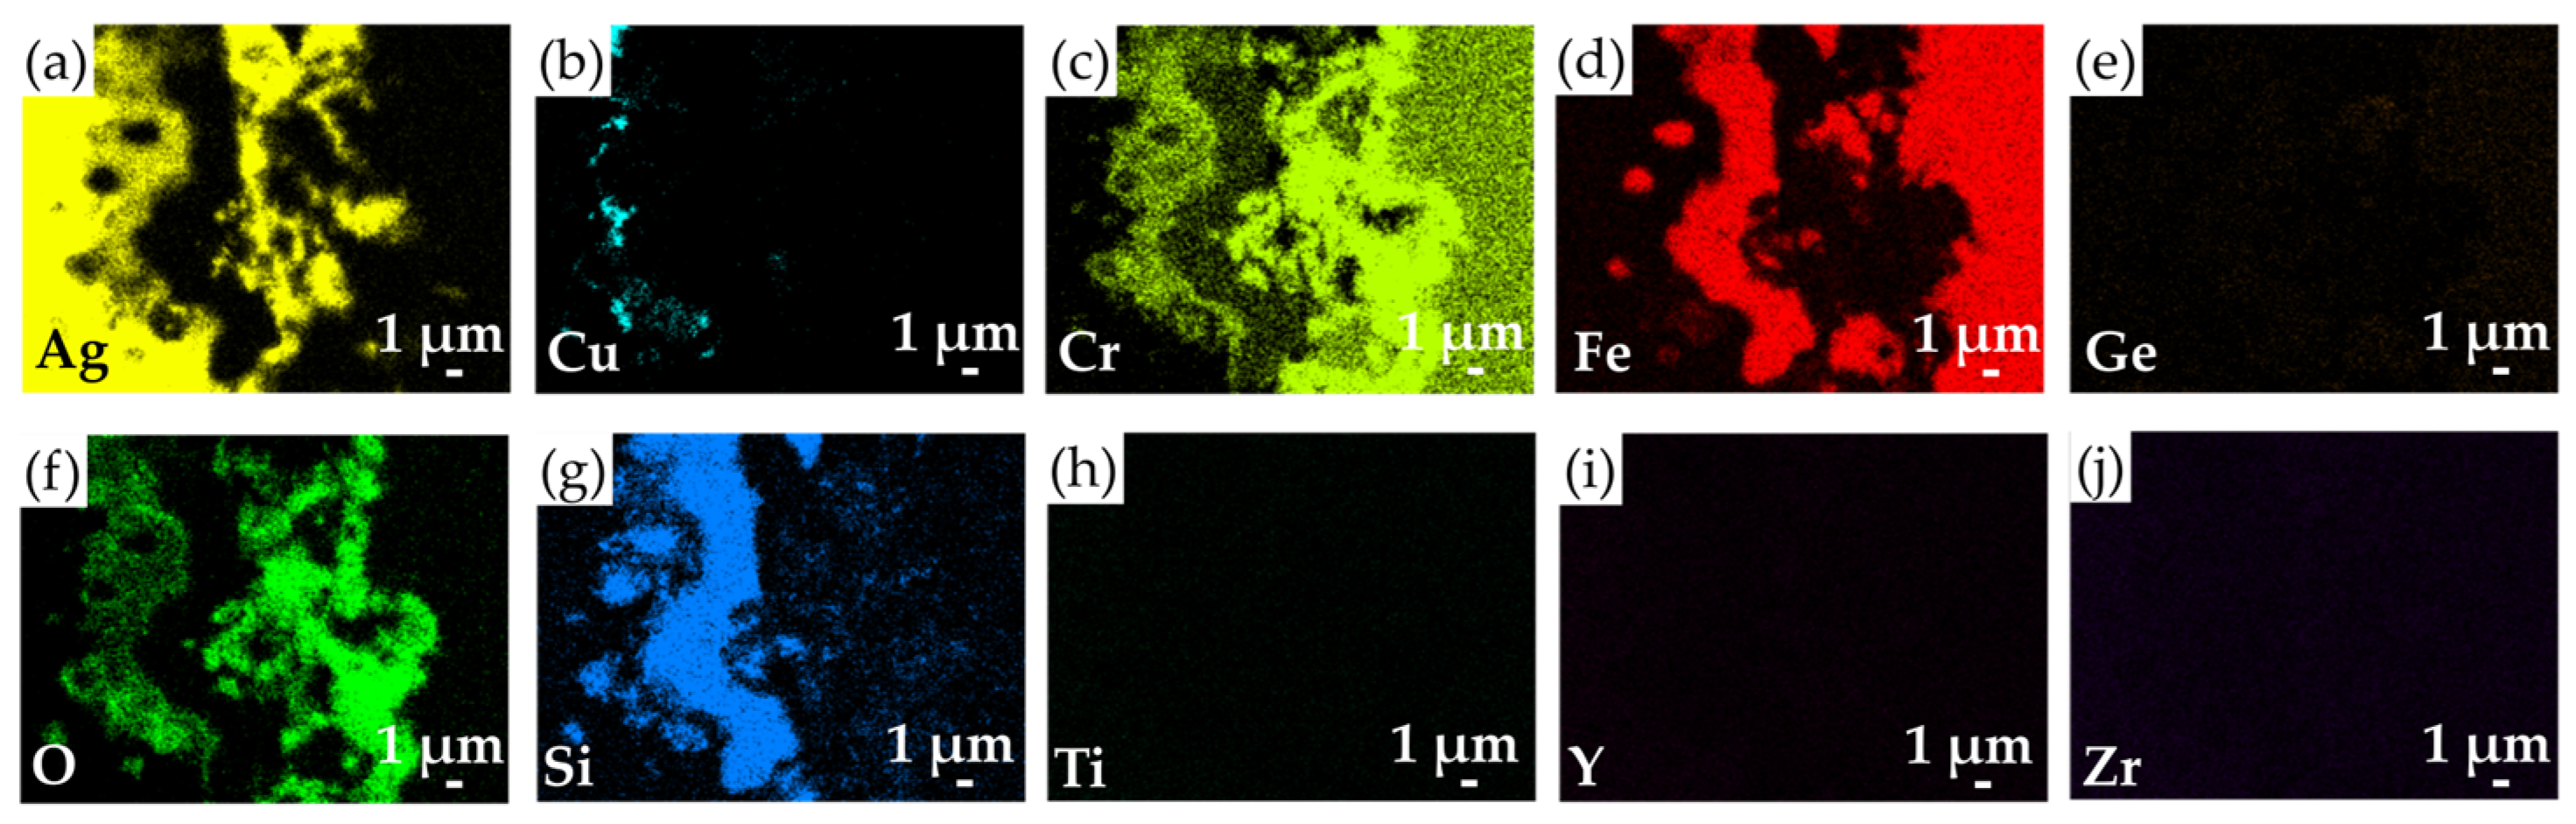
  • The wetting performance of the filler on parent materials can be improved through the metallization process with Ti, Cu, and Ag coating layers. From microstructural observations and EPMA quantitative chemical analyses, Si-rich and Si/Ti-rich oxide layers were found at the YSZ/filler interface of YSZ/Crofer 22H brazed joints. The excellent bonding with YSZ is attributed to the Ti reactive wetting. As for the filler/Crofer 22H interface, an Fe-Cr-Si alloying area was formed, which results from Si dissolution into an Fe-Cr solid solution.
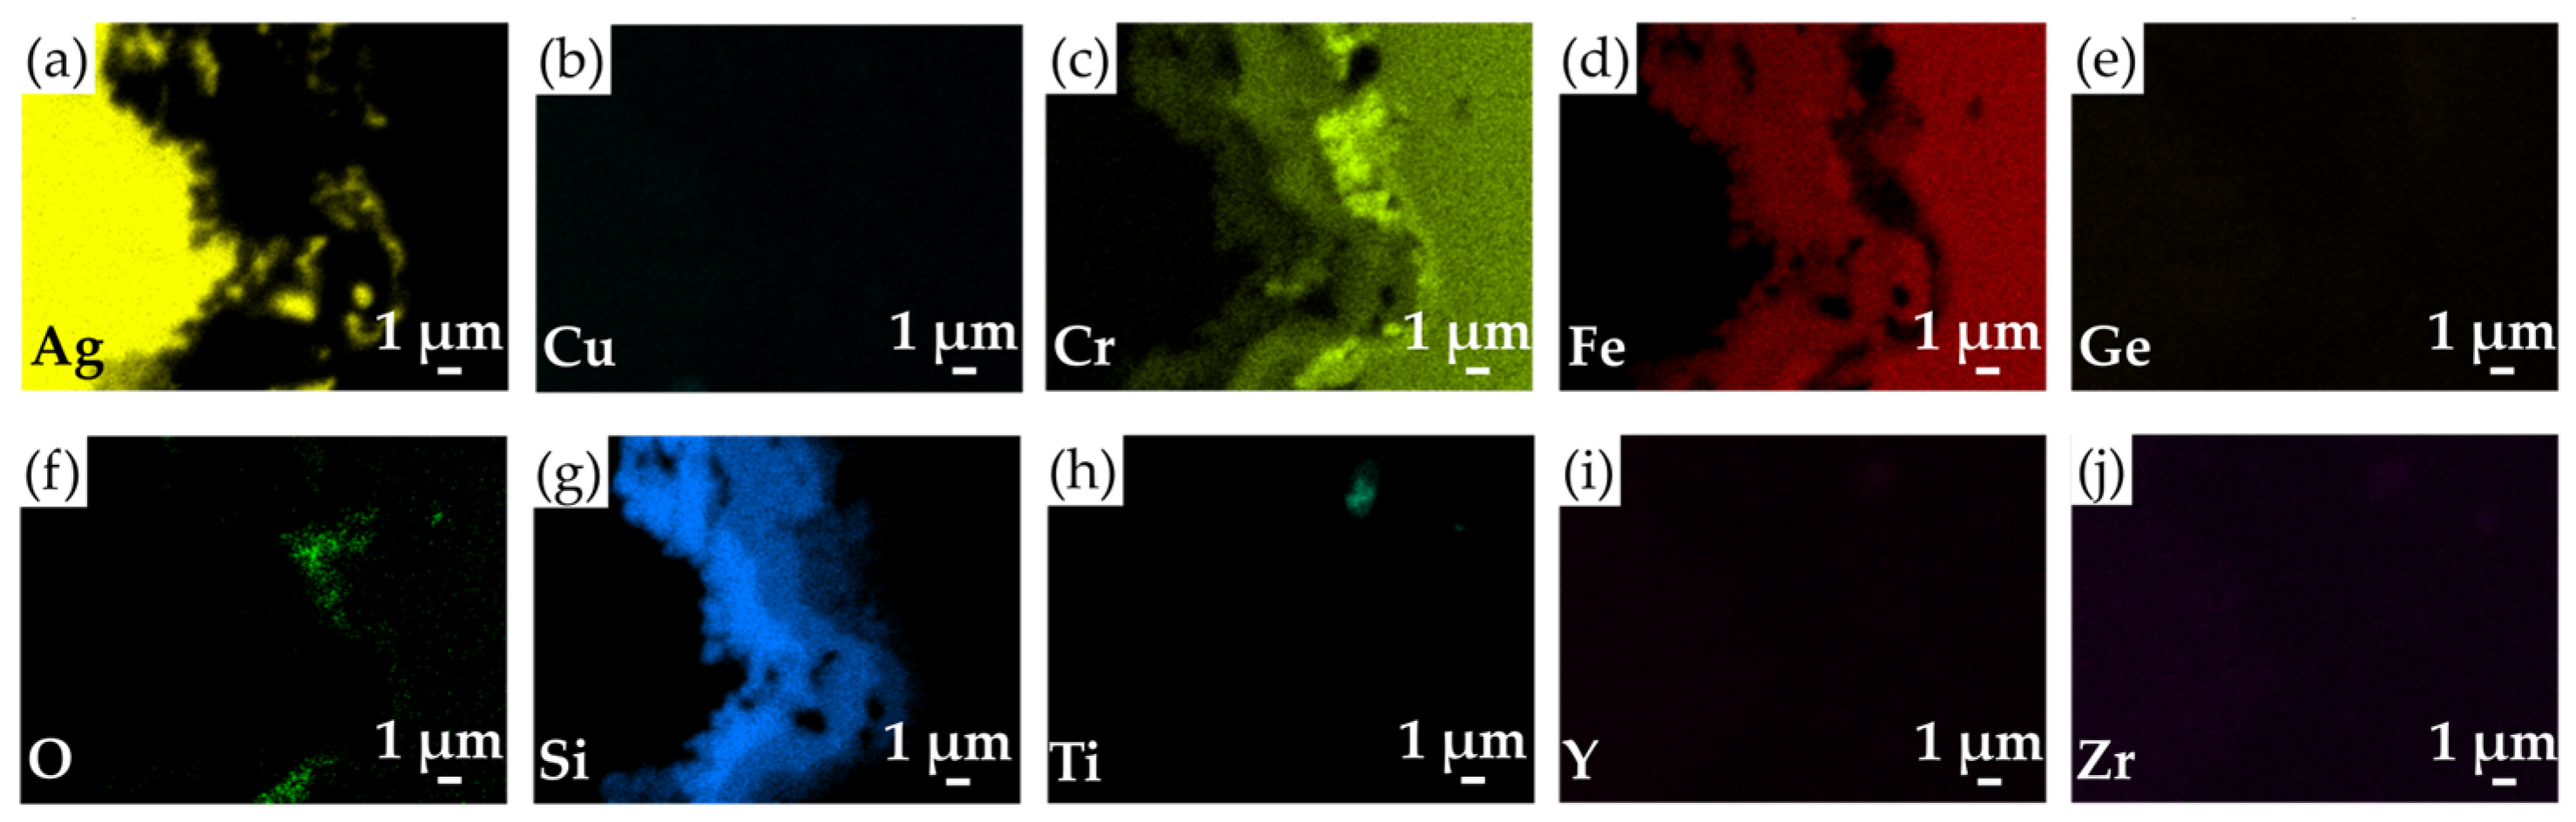
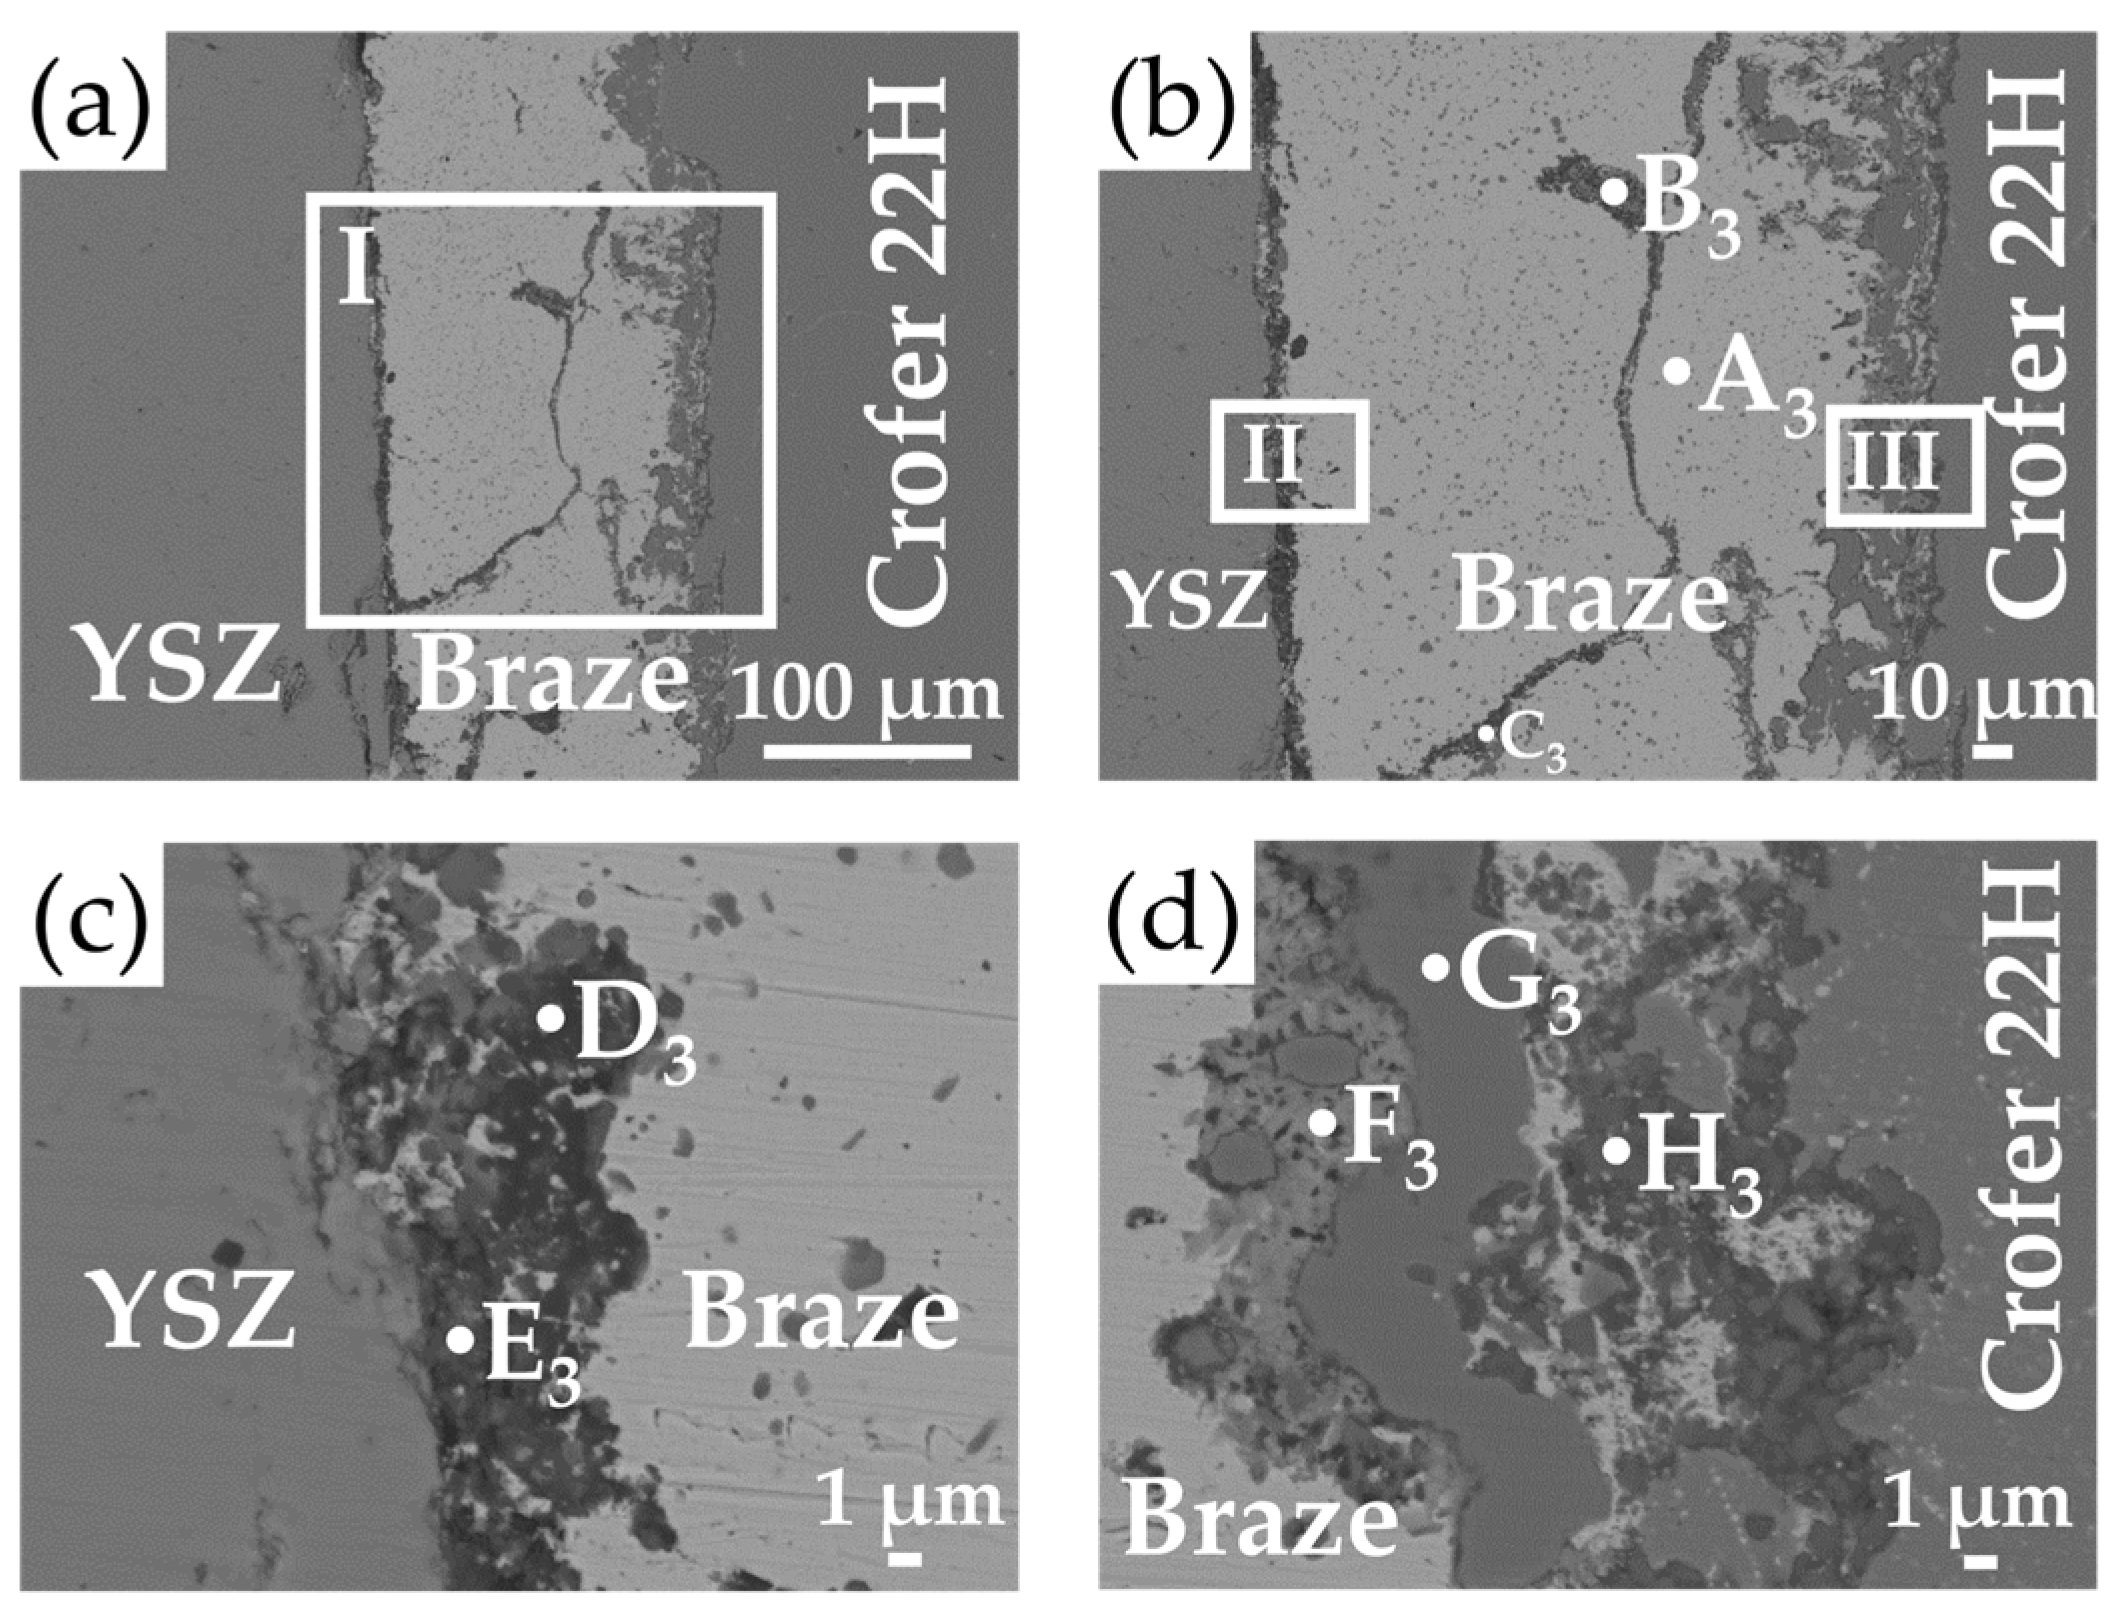
  • The microstructural evolution of the brazed joints occurred after exposure to air at 750 °C for 100 h. At the YSZ/filler interface, the Si-rich phase was oxidized into a SiO2 layer, and the Si/Ti-rich oxide layer was still well maintained. Similarly, the oxidation of Cu and Si contents could also be observed in the brazed zone. At the filler/Crofer 22H interface, Cr diffusion formed an AgCrO2 oxide and a Cr-rich oxide. In addition, the original Fe-Cr-Si alloy was preserved without suffering from oxidation.
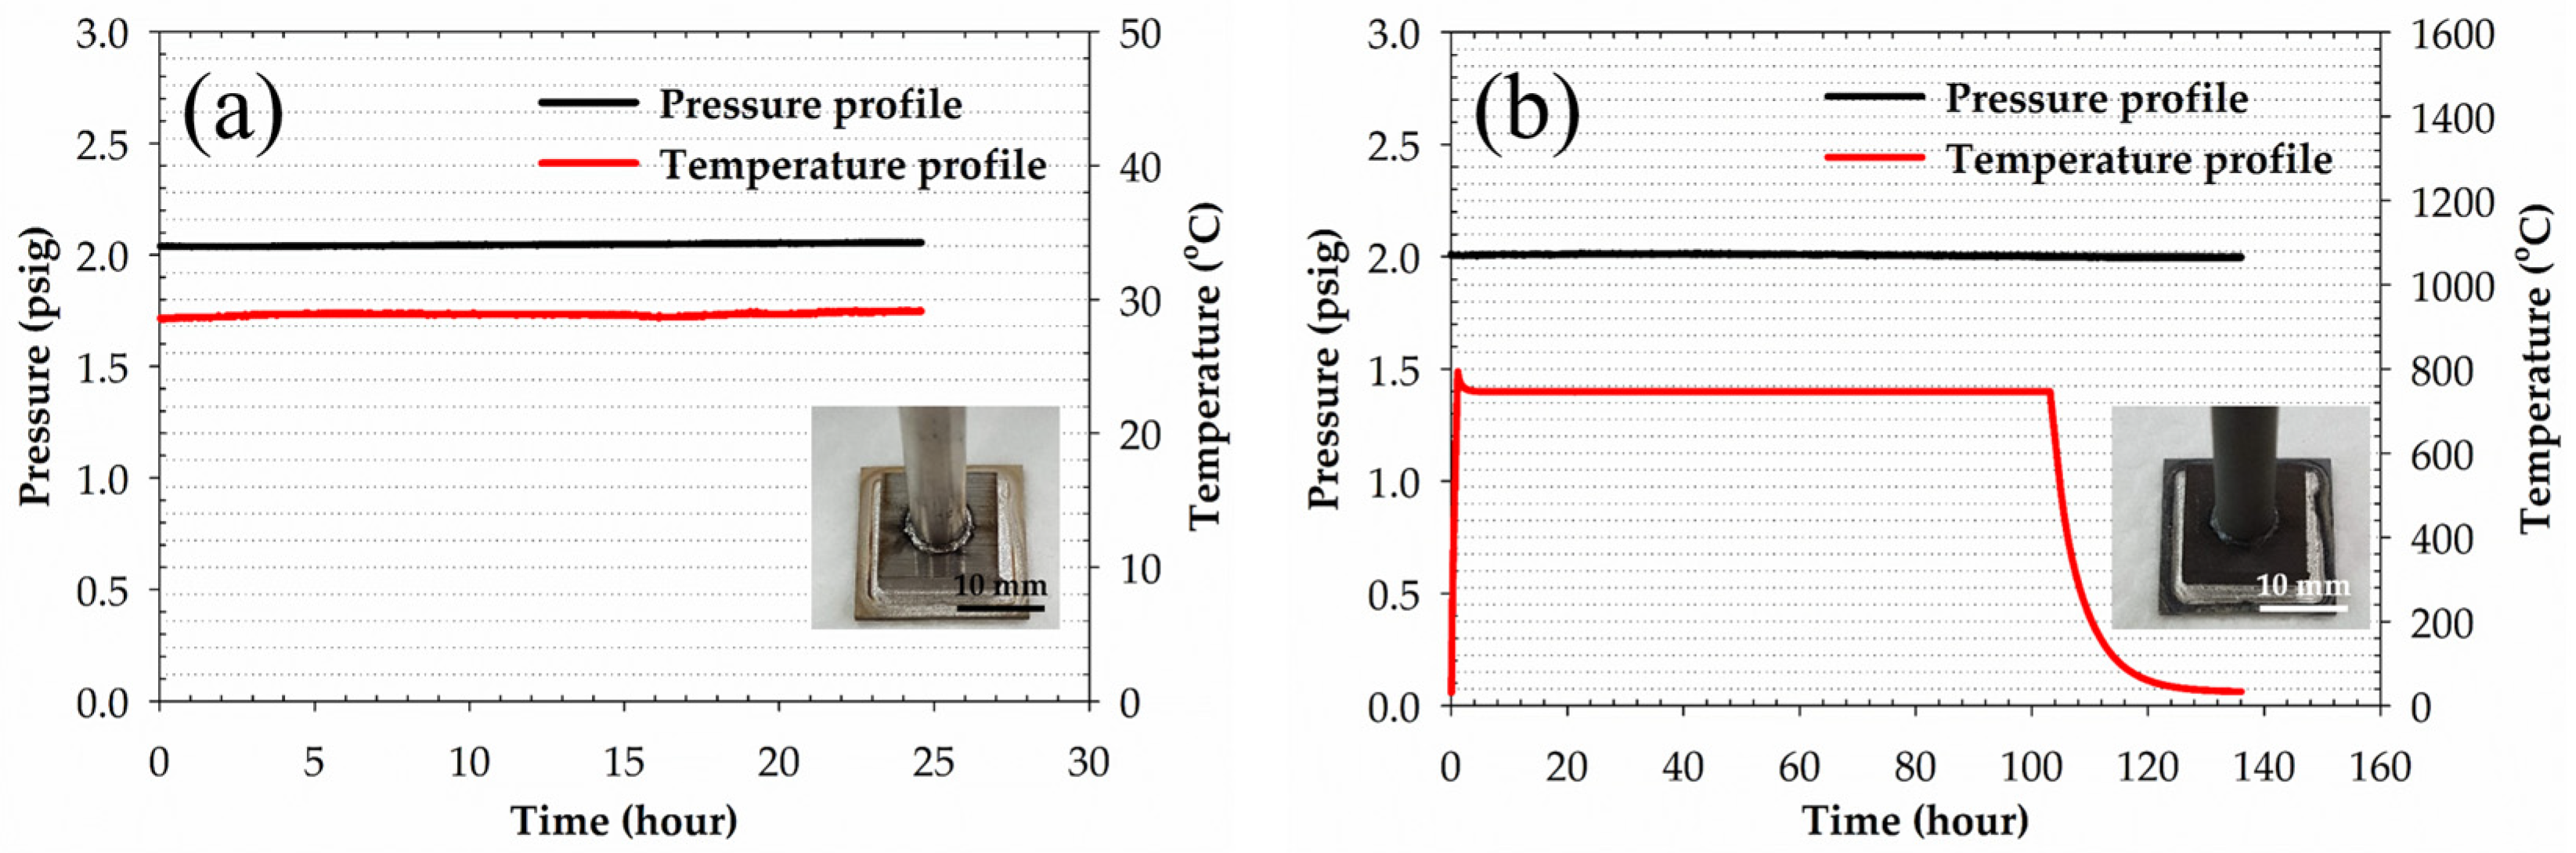
  • Although the 95Ag-2.5Ge-2.5Si filler owns higher CTE than that of YSZ and Crofer 22H substrates, the brazed joint still demonstrates excellent gas-tight properties and withstands the thermal stress induced at the cooling stage of the pressure-drop test. This is because the interfacial integrity of the joints can be maintained well even after being tested at elevated temperatures. The phenomenon is also consistent with that described in the previous report, i.e., the thermal strain can be mitigated through plastic deformation of the metal layer.

Supplementary Materials

The following supporting information can be downloaded at: https://www.mdpi.com/article/10.3390/met13111866/s1, Figure S1. The leakage test by a helium detector (UL200, INFICON, Switzerland); Table S1. The leakage rate of the brazed sample.

Author Contributions

Experiment, L.-W.H.; formal analysis, L.-W.H.; writing—original draft preparation, L.-W.H.; writing—review and editing, R.-K.S. and C.-K.L. All authors have read and agreed to the published version of the manuscript.

Funding

The research work is financially supported by the Project for the Development of Green Energy Applied Technologies, the Atomic Energy Council, Taiwan (Grant No. 112-2001-02-30-01), and the Ministry of Science and Technology, Taiwan (Contract No. MOST 109-2221-E-002-041-MY3).

Institutional Review Board Statement

Not applicable.

Informed Consent Statement

Not applicable.

Data Availability Statement

Data are contained within the article and supplementary materials.

Acknowledgments

Thanks to H.C. Lin and C.Y. Kao of Instrumentation Center, National Taiwan University, for EPMA analyses; M.C. Wu of the Department of Materials Science and Engineering, National Taiwan University, for sample preparation; and Y.N. Cheng and R.Y. Lee of the National Atomic Research Institute for supplying research resources.

Conflicts of Interest

The authors declare no conflict of interest. The funders had no role in the design of the study; in the collection, analyses, or interpretation of data; in the writing of the manuscript; or in the decision to publish the results.

References

  1. Hwang, J.; Maharjan, K.; Cho, H. A review of hydrogen utilization in power generation and transportation sectors: Achievements and future challenges. Int. J. Hydrogen Energy 2023, 48, 28629–28648. [Google Scholar]
  2. Song, K.E.; Schlegl, H.; Kang, H.; Choi, W.; Kim, J.H. Electrochemical characteristic of non-stoichiometric SmBa0.45Sr0.5Co2O5+d layered perovskite oxide system for IT-SOFC cathode. Int. J. Hydrogen Energy 2023, 48, 17664–17676. [Google Scholar]
  3. Han, Z.; Bai, J.; Chen, X.; Zhu, X.; Zhou, D. Novel cobalt-free Pr2Ni1−xNbxO4 (x = 0, 0.05, 0.10, and 0.15) perovskite as the cathode material for IT-SOFC. Int. J. Hydrogen Energy 2021, 46, 11894–11907. [Google Scholar]
  4. Schilm, J.; Rost, A.; Javed, H.; Poetschke, M. Stability of glass ceramic sealants in atmospheres with increased water contents. ECS Trans. 2023, 111, 2341–2350. [Google Scholar]
  5. Li, R.; Lu, Y.; Yu, Y.; Ren, X.; Ding, F.; Guan, C.; Wang, J. Investigation on long-term stability of vermiculite seals for reversible solid oxide cell. Molecules 2023, 28, 1462–1472. [Google Scholar] [PubMed]
  6. Cao, J.; Wang, Z.; Li, C.; Si, X.; Yang, B.; Guo, X.; Huang, Y.; Qi, J. Microstructure evolution and mechanical properties of Co coated AISI 441 ferritic stainless steel/YSZ reactive air brazed joint. Int. J. Hydrogen Energy 2021, 46, 8758–8766. [Google Scholar]
  7. Ritucci, I.; Agersted, K.; Zielke, P.; Wulff, A.C.; Khajavi, P.; Smeacetto, F.; Sabato, A.G.; Kiebach, R. A Ba-free sealing glass with a high coefficient of thermal expansion and excellent interface stability optimized for SOFC/SOEC stack applications. Int. J. Appl. Ceram. Technol. 2018, 15, 1011–1022. [Google Scholar]
  8. Li, R.; Peng, L.; Wang, X.; Yang, J.; Yan, D.; Pu, J.; Chi, B.; Li, J. Investigating the performance of Glass/Al2O3 composite seals in planar solid oxide fuel cells. Compos. Part B 2020, 192, 107984–107991. [Google Scholar]
  9. Wang, S.F.; Hsu, Y.F.; Liao, Y.L.; Yang, Y.J.; Jasinski, P. Physical and sealing properties of BaO-Al2O3-SiO2-CaO-V2O5 glasses for solid oxide fuel cell applications. Int. J. Hydrogen Energy 2022, 47, 10044–10055. [Google Scholar]
  10. Li, R.; Liang, X.; Wang, X.; Zeng, W.; Yang, J.; Yan, D.; Pu, J.; Chi, B.; Li, J. Improvement of sealing performance for Al2O3 fiber-reinforced compressive seals for intermediate temperature solid oxide fuel cell. Ceram. Int. 2019, 45, 21953–21959. [Google Scholar]
  11. Li, R.; Wang, X.; Peng, L.; Jiang, B.; Yang, J.; Yan, D.; Pu, J.; Chi, B.; Li, J. Thermal cycling stability of novel hexagonal boron nitride (h-BN)/glass compressive seals for planar intermediate temperature solid oxide fuel cells. J. Alloys Compd. 2020, 843, 155620–155626. [Google Scholar]
  12. Wang, Z.Q.; Li, C.; Si, X.Q.; Yang, B.; Huang, X.Y.; Qi, J.L.; Feng, J.C.; Cao, J. Brazing YSZ ceramics by a novel SiO2 nanoparticles modified Ag filler. Ceram. Int. 2020, 46, 16493–16501. [Google Scholar]
  13. Huang, L.W.; Liu, C.K.; Cheng, Y.N.; Lee, R.Y. Characterization of Ag-based filler for electrolyte/metallic-interconnect joint in metal-supported solid oxide fuel cells applications. ECS Trans. 2021, 103, 701–711. [Google Scholar]
  14. Yang, Z.W.; Xiong, Z.; Wang, J.L.; Wang, Y.; Wang, D.P. Microstructural evolution and high-temperature oxidation resistance of YSZ/Crofer 22H brazed joints using Ag-based filler for solid-oxide fuel cell applications. Mater. Charact. 2023, 200, 112888–112901. [Google Scholar]
  15. Singh, M.; Shpargel, T.P.; Asthana, R. Brazing of stainless steel to yttria-stabilized zirconia using gold-based brazes for solid oxide fuel cell applications. Int. J. Appl. Ceram. Technol. 2007, 4, 119–133. [Google Scholar]
  16. Lin, K.L.; Singh, M.; Asthana, R. TEM characterization of Au-based alloys to join YSZ to steel for SOFC applications. Mater. Charact. 2012, 63, 105–111. [Google Scholar]
  17. Lin, K.L.; Singh, M.; Asthana, R. Characterization of yttria-stabilized-zirconia/stainless steel joint interfaces with gold-based interlayers for solid oxide fuel cell applications. J. Eur. Ceram. Soc. 2014, 34, 355–372. [Google Scholar]
  18. Lin, K.L.; Singh, M.; Asthana, R.; Lin, C.H. Interfacial and mechanical characterization of yttria-stabilized zirconia (YSZ) to stainless steel joints fabricated using Ag–Cu–Ti interlayers. Ceram. Int. 2014, 40, 2063–2071. [Google Scholar]
  19. Lin, K.L.; Singh, M.; Asthana, R. Effect of short-term aging on interfacial and mechanical properties of yttria-stabilized zirconia (YSZ)/stainless steel joints. J. Eur. Ceram. Soc. 2015, 35, 1041–1053. [Google Scholar]
  20. Kiebach, R.; Engelbrecht, K.; Grahl-Madsen, L.; Sieborg, B.; Chen, M.; Hjelm, J.; Norrman, K.; Chatzichristodoulou, C.; Hendriksen, P.V. An Ag based brazing system with a tunable thermal expansion for the use as sealant for solid oxide cells. J. Power Sources 2016, 315, 339–350. [Google Scholar]
  21. Si, X.; Wang, X.; Li, C.; Lin, T.; Qi, J.; Cao, J. Joining 3YSZ electrolyte to AISI 441 interconnect using the Ag particle interlayer: Enhanced mechanical and aging properties. Crystals 2021, 11, 1573–1586. [Google Scholar]
  22. Wang, Z.; Li, C.; Cao, J.; Ritucci, I.; Khajavi, P.; Kiebach, R. Ag-SiO2—An optimized braze for robust joining of commercial coated stainless steel to ceramic solid oxide cells. Ceram. Int. 2022, 48, 32740–32747. [Google Scholar]
  23. Lee, S.; Kang, K.H.; Hong, H.S.; Yun, Y.; Ahn, J.H. Interfacial morphologies between NiO-YSZ fuel electrode/316 stainless steel as the interconnect material and B-Ni3 brazing alloy in a solid oxide fuel cell system. J. Alloys Compd. 2009, 488, L1–L5. [Google Scholar]
  24. Lee, S.; Kang, K.H.; Hong, H.S.; Yun, Y.; Woo, S.K. Microstructure and interfacial morphologies of brazed NiO-YSZ/316 stainless steel using B-Ni2 brazing alloy. Mater. Test 2010, 52, 257–262. [Google Scholar]
  25. Chung, D.Y.; Heo, Y.H.; Lee, S.B.; Lim, T.H.; Song, R.H.; Shin, D.R. Induction brazing for gas sealing of anode-supported tubular solid oxide fuel cells using the nickel-based brazing alloy modified by TiH2. Int. J. Hydrogen Energy 2011, 36, 1890–1896. [Google Scholar]
  26. Weil, K.S.; Kim, J.Y.; Hardy, J.S. Reactive air brazing: A novel method of sealing SOFCs and other solid-state electrochemical devices. Electrochem. Solid-State Lett. 2005, 8, A133–A136. [Google Scholar]
  27. Si, X.Q.; Cao, J.A.; Song, X.G.; Qu, Y.; Feng, J.C. Reactive air brazing of YSZ ceramic with novel Al2O3 nanoparticles reinforced Ag-CuO-Al2O3 composite filler: Microstructure and joint properties. Mater. Des. 2017, 114, 176–184. [Google Scholar]
  28. Si, X.; Cao, J.; Talic, B.; Ritucci, I.; Li, C.; Qi, J.L.; Feng, J.C.; Kiebach, R. A novel Ag-based sealant for solid oxide cells with a fully tunable thermal expansion. J. Alloys Compd. 2020, 831, 154608–154617. [Google Scholar]
  29. Sun, Z.; Zhang, L.X.; Li, X.; Zhang, S.S. Reactive air brazing of the YSZ/AISI 310s couples using a novel Ag-Nb2O5 sealant. Ceram. Int. 2020, 46, 5168–5174. [Google Scholar]
  30. Weil, K.S.; Coyle, C.A.; Darsell, J.T.; Xia, G.G.; Hardy, J.S. Effects of thermal cycling and thermal aging on the hermeticity and strength of silver-copper oxide air-brazed seals. J. Power Sources 2005, 152, 97–104. [Google Scholar]
  31. Schilm, J.; Rost, A.; Poenicke, A.; Kusnezoff, M.; Michaelis, A. Ceramic integration technologies for solid oxide fuel cells. Int. J. Appl. Ceram. Technol. 2012, 9, 688–699. [Google Scholar]
  32. Ponicke, A.; Schilm, J.; Kusnezoff, M.; Michaelis, A. Aging behavior of reactive air brazed seals for SOFC. Fuel Cells 2015, 15, 735–741. [Google Scholar]
  33. Si, X.; Cao, J.; Ritucci, I.; Talic, B.; Feng, J.; Kiebach, R. Enhancing the long-term stability of Ag-based seals for solid oxide fuel/electrolysis applications by simple interconnect aluminization. Int. J. Hydrogen Energy 2019, 44, 3063–3074. [Google Scholar]
  34. Wang, N.; Wang, D.P.; Yang, Z.W.; Wang, Y. Interfacial microstructure and mechanical properties of zirconia ceramic and niobium joints vacuum brazed with two Ag-based active filler metals. Ceram. Int. 2016, 42, 12815–12824. [Google Scholar]
  35. Zhang, X.; Xu, P.; Zhang, M.; Liu, G.; Xu, Z.; Yang, J.; Shao, H.; Qiao, G. Improving the wettability of Ag/ZrB2 system by Ti, Zr, and Hf addition: An insight from first-principle calculations. Appl. Surf. Sci. 2020, 517, 146201–146209. [Google Scholar]
  36. Guo, X.; Si, X.; Li, C.; Zhao, S.; Liu, Y.; Wang, Z.; He, Z.; Wang, X.; Cao, J. Active brazing of C/C composites and single crystal Ni-based superalloy: Interfacial microstructure and formation mechanism. J. Alloys Compd. 2021, 886, 161183–161196. [Google Scholar]
  37. Kobsiriphat, W.; Barnett, S. Ag–Cu–Ti braze materials for sealing SOFCs. J. Fuel Cell Sci. Technol. 2008, 5, 011002. [Google Scholar]
  38. Ahn, B. Recent advances in brazing fillers for joining of dissimilar materials. Metals 2021, 11, 1037–1060. [Google Scholar]
  39. Wang, Y.; Wei, Y.; Zheng, X.; Yang, Z. Interfacial structure and mechanical properties of ZrO2 ceramic and GH4169 alloy joint brazed with Ag-TiH2 composite filler. Mater. Charact. 2023, 197, 112696–112706. [Google Scholar]
  40. Tang, L.; Yao, D.; Xia, Y.; Liang, H.; Zeng, Y.P. Effect of interfacial microstructure evolution on the peeling strength and fracture of silicon nitride/oxygen-free copper foil joints brazed with Ag-Cu-TiH2 filler. J. Eur. Ceram. Soc. 2023, 43, 4374–4385. [Google Scholar]
  41. Hudycz, M. Titanium metallization coating deposited on AlN ceramics substrate by means friction surfacing process. Weld. Technol. Rev. 2020, 92, 35–44. [Google Scholar]
  42. Huang, L.W.; Shiue, R.K.; Liu, C.K.; Cheng, Y.N.; Lee, R.Y.; Tsay, L.W. Vacuum brazing of metalized YSZ and Crofer alloy using 72Ag-28Cu filler foil. Materials 2022, 15, 939–950. [Google Scholar] [PubMed]
  43. Asghari, M.; Beidokhti, B.; Beidokhti, S.M. Effect of the metallization method on properties of hybrid zirconia/Ti–6Al–4V joints. Mater. Chem. Phys. 2023, 296, 127212–127216. [Google Scholar]
  44. Villars, P. Ag-Ge-Si Phase Diagram. In Handbook of Ternary Alloy Phase Diagrams; ASM International: Materials Park, OH, USA, 1995; pp. 2444–2446. [Google Scholar]
  45. Huang, L.W.; Liu, C.K.; Cheng, Y.N.; Lee, R.Y. Brazing Material Composition and Manufacturing Method Thereof. Taiwan Patent No. I634220, 1 September 2018. [Google Scholar]
  46. Mannan, S. Plant Commissioning and Inspection. In Lees’ Loss Prevention in the Process Industries, 4th ed.; Butterworth-Heinemann: Oxford, UK, 2012; Chapter 19; p. 1794. [Google Scholar]
  47. Cassel, B.; Menard, K. Coefficient of Thermal Expansion Measurement Using the TMA 4000. In PerkinElmer Technical Manual; PerkinElmer: Shelton, CT, USA, 2013. [Google Scholar]
  48. Data sheet of Ticusil®, Morgan Advanced Materials, USA. Available online: https://www.morganbrazealloys.com/media/6985/wesgo_ticusil_technical-data-sheet-2018.pdf (accessed on 6 November 2023).
  49. Data sheet of Cusil-ABA®, Morgan Advanced Materials, USA. Available online: https://www.morganbrazealloys.com/media/6941/wesgo_cusil-aba_technical-data-sheet-2018.pdf (accessed on 6 November 2023).
  50. Data sheet of Gold-ABA®, Morgan Advanced Materials, USA. Available online: https://www.morganbrazealloys.com/media/6949/wesgo_gold-aba_technical-data-sheet-2018.pdf (accessed on 6 November 2023).
  51. Massalski, T.B. Ag-Si Phase Diagram. In Binary Alloy Phase Diagrams, 2nd ed.; ASM International: Materials Park, OH, USA, 1992; pp. 92–94. [Google Scholar]
  52. Massalski, T.B. Ag-Ge Phase Diagram. In Binary Alloy Phase Diagrams, 2nd ed.; ASM International: Materials Park, OH, USA, 1992; pp. 39–41. [Google Scholar]
  53. Massalski, T.B. Ge-Si Phase Diagram. In Binary Alloy Phase Diagrams, 2nd ed.; ASM International: Materials Park, OH, USA, 1992; pp. 2000–2001. [Google Scholar]
  54. Massalski, T.B. Cr-Si Phase Diagram. In Binary Alloy Phase Diagrams, 2nd ed.; ASM International: Materials Park, OH, USA, 1992; pp. 1333–1335. [Google Scholar]
  55. Massalski, T.B. Fe-Si Phase Diagram. In Binary Alloy Phase Diagrams, 2nd ed.; ASM International: Materials Park, OH, USA, 1992; pp. 1771–1772. [Google Scholar]
  56. Sofie, S.W.; Gannon, P.; Gorokhovsky, V. Silver–chromium oxide interactions in SOFC environments. J. Power Sources 2009, 191, 465–472. [Google Scholar]
  57. Zhou, L.; Mason, J.H.; Li, W.; Liu, X. Comprehensive review of chromium deposition and poisoning of solid oxide fuel cells (SOFCs) cathode materials. Renew. Sustain. Energy Rev. 2020, 134, 110320–110342. [Google Scholar]
Figure 1. The DTA curves of 95Ag-2.5Ge-2.5Si filler between RT and 1000 °C.
Metals 13 01866 g001
Figure 2. The thermal-expansion curve of 95Ag-2.5Ge-2.5Si filler between RT and 800 °C.
Metals 13 01866 g002
Figure 3. The 95Ag-2.5Ge-2.5Si filler foil: (a) as-prepared, (b) the BEI of the alloy microstructure, (c) the magnified BEI of area I in (b), (d) the magnified BEI of area II in (b).
Metals 13 01866 g003
Figure 4. The top and transverse images of 95Ag-2.5Ge-2.5Si beads on two metalized substrates after wetting tests (900 °C for 10 min): (a,b) on Ag/Cu/Ti/YSZ substrate, (c,d) on Ag/Crofer 22H substrate.
Metals 13 01866 g004
Figure 5. The BEIs of vacuum-brazed YSZ/Crofer 22H joints: (a) the BEI of the cross-sectional microstructure, (b) the magnified BEI of area I in (a), (c) the magnified BEI of area II in (b), (d) the magnified BEI of area III in (b).
Metals 13 01866 g005
Figure 6. The EDS mappings of the YSZ/filler interface in Figure 5c: (a) Ag, (b) Cu, (c) Cr, (d) Fe, (e) Ge, (f) O, (g) Si, (h) Ti, (i) Y, (j) Zr.
Metals 13 01866 g006
Figure 7. The EDS mappings of the filler/Crofer 22H interface in Figure 5d: (a) Ag, (b) Cu, (c) Cr, (d) Fe, (e) Ge, (f) O, (g) Si, (h) Ti, (i) Y, (j) Zr.
Metals 13 01866 g007
Figure 8. The BEIs of thermal-aged YSZ/Crofer 22H joints: (a) the BEI of the cross-sectional microstructure, (b) the magnified BEI of section I in (a), (c) the magnified BEI of area II in (b), (d) the magnified BEI of area III in (b).
Metals 13 01866 g008
Figure 9. The EDS mappings of the YSZ/filler interface in Figure 8c: (a) Ag, (b) Cu, (c) Cr, (d) Fe, (e) Ge, (f) O, (g) Si, (h) Ti, (i) Y, (j) Zr.
Metals 13 01866 g009
Figure 10. The EDS mappings of the filler/Crofer 22H interface in Figure 8d: (a) Ag, (b) Cu, (c) Cr, (d) Fe, (e) Ge, (f) O, (g) Si, (h) Ti, (i) Y, (j) Zr.
Metals 13 01866 g010
Figure 11. The pressure-drop curves of YSZ/Crofer 22H brazed joints under two psig: (a) at RT for 24 h, (b) thermal aged at 750 °C for 100 h.
Metals 13 01866 g011
Table 1. The ICP-MS quantitative chemical analysis of the 95Ag-2.5Ge-2.5Si filler.
Element/wt %AgGeSiOther Minor Elements
Average composition95.132.352.48≤0.04
Nominal composition95.002.502.50---
Table 2. The average CTE of the 95Ag-2.5Ge-2.5Si filler at different temperature ranges.
Temperature Range (°C)CTE (ppm/K)
33–20016.6
200–40020.0
400–56021.3
560–77722.7
Table 3. The EPMA chemical analyses of the 95Ag-2.5Ge-2.5Si filler in Figure 3.
Element/at%AgGeSiPossible Phase
A197.82.20.0Ag-rich
B197.42.50.1Ag-rich
C120.09.670.4Si-rich
D116.59.474.1Si-rich
Table 4. The EPMA chemical analyses of the YSZ/Crofer 22H brazed joint in Figure 5.
Element/at%AgCuCrFeGeOSiTiYZrPossible Phase
A296.60.90.00.01.70.40.30.00.00.0Ag-rich
B20.273.20.00.02.35.618.60.00.00.0Cu/Si-rich
C21.974.40.00.02.23.018.50.00.00.0Cu/Si-rich
D20.40.30.00.015.90.482.90.10.00.0Si-rich
E21.80.20.00.09.20.287.51.10.00.0Si-rich
F22.31.40.10.21.432.733.126.20.12.6Si/Ti-rich oxide
G20.10.116.847.20.10.034.90.00.00.0Fe-Cr s. s. alloyed with Si
Abbreviation: Solid solution (s. s.).
Table 5. The EPMA chemical analyses of the YSZ/Crofer 22H brazed joint in Figure 8.
Element/at%AgCuCrFeGeOSiTiYZrPossible Phase
A397.41.00.00.10.60.70.00.00.00.0Ag-rich
B30.744.60.10.24.648.50.80.10.00.0CuO
C33.12.40.00.11.665.626.50.50.00.0SiO2
D33.90.10.00.00.368.226.21.20.00.0SiO2
E34.9 3.1 0.2 0.5 0.7 52.2 12.1 24.8 0.0 1.5 Si/Ti-rich oxide
F327.97.221.50.90.441.00.30.00.00.0AgCrO2
G30.10.18.268.01.90.121.00.00.00.0Fe-Cr s. s. alloyed with Si
H30.90.441.23.30.451.90.60.00.00.0Cr-rich oxide
Abbreviation: Solid solution (s. s.).
Disclaimer/Publisher’s Note: The statements, opinions and data contained in all publications are solely those of the individual author(s) and contributor(s) and not of MDPI and/or the editor(s). MDPI and/or the editor(s) disclaim responsibility for any injury to people or property resulting from any ideas, methods, instructions or products referred to in the content.

