Article

Prediction of Mechanical Properties in the Sub-Critical Heat Affected Zone of AHSS Spot Welds Using Gleeble Thermal Simulator and Hollomon-Jaffe Model

by
Abdelbaset R. H. Midawi
1,*,
Oleksii Sherepenko
1,
Dileep Chandran Ramachandran
1,
Shima Akbarian
1,
Mohammad Shojaee
1,
Tingting Zhang
2,
Hassan Ghassemi-Armaki
3,
Michael Worswick
1 and
Elliot Biro
1
1
Centre for Advanced Materials Joining, Department of Mechanical and Mechatronics Engineering, University of Waterloo, 200 University Avenue West, Waterloo, ON N2L 3G1, Canada
2
General Motors, Advanced Materials Technology-Metallics & Joining, Warren, MI 48092, USA
3
General Motors R&D, Manufacturing Systems Research Laboratory, Warren, MI 48092, USA
*
Author to whom correspondence should be addressed.
Metals 2023, 13(11), 1822; https://doi.org/10.3390/met13111822
Submission received: 26 August 2023 / Revised: 26 September 2023 / Accepted: 17 October 2023 / Published: 29 October 2023

Abstract

:
Measuring the mechanical properties of weld Heat Affected Zone (HAZ) remains one of the main challenges in the failure analysis of spot-welded components. Due to the small size of the HAZ and variation in the temperature history, different peak temperatures and cooling rates impose a range of phase transformations across the resistance spot weld. Among the HAZ sub-regions, the sub-critical HAZ (SCHAZ), which experiences temperatures below AC1 (350–650 °C), usually shows a reduction in the hardness in most of the modern AHSS grades due to the martensite tempering phenomenon. SCHAZ softening may lead to strain localization during loading. Therefore, it is important to characterize the local properties of the SCHAZ region to accurately predict RSW failure. However, it is not feasible to extract standard mechanical test specimens out of the SCHAZ of the spot-welded structure due to its small size. In this work, the SCHAZ of the spot weld for two AHSS, 3G-980 and PHS-1500, was simulated using a Gleeble® (Dynamic Systems Inc., 323 NY-355, Poestenkill, NY 12140, USA) 3500 thermo-mechanical simulator. An in-situ high-speed IR thermal camera was used to measure the entire temperature field during the Gleeble heat-treatment process, which allowed for the visualization of the temperature distribution in the gauge area. The temperature and hardness data were fit to a Hollomon-Jaffe (HJ) model, which enables hardness prediction in the SCHAZ at any given temperature and time. Using the HJ model, a heat treatment schedule for each material was chosen to produce samples with hardness and microstructure matching the SCHAZ within actual spot weld coupons. Tensile specimens were machined from the coupons heat treated using simulated heat treatment schedules, and mechanical testing was performed. The results showed that the 3G-980 SCHAZ has a slight increase in yield strength and tensile strength, compared to the base metal, due to the formation of fine carbides within the microstructure. In contrast, the SCHAZ of PHS-1500 showed a significant reduction in the yield and tensile strength with yield point elongation behavior due to the reduction of the martensite phase and an increase in carbide formation due to the tempering process.

1. Introduction

Over the past decades, advanced high-strength steels (AHSS) have seen increased usage in car body manufacturing, producing lighter and safer vehicles [1,2]. AHSS is designed to provide high strength and good formability by controlling microstructural constituents using complex thermo-mechanical treatments [3,4]. AHSS sheets are usually joined using resistance spot welding (RSW), one of the predominant welding processes in car body manufacturing, in which two or more sheets are squeezed between water-cooled and copper-alloyed electrodes. Electric current flow between the electrodes heats the sheets and melts the metal at the sheet-sheet interface(s). Upon termination of the current flow, the sheets remain under compressive force between the electrodes until the molten metal cools, forming a solidified weld nugget [5,6,7]. The material surrounding the weld nugget is heated below the liquidus temperature and undergoes solid-state microstructural transformations during fast heating and subsequent rapid cooling [8]. This region of the weld is called the heat-affected zone (HAZ). It can be divided into sub-zones, depending on the experienced peak temperature: (i) the upper critical HAZ (UCHAZ), where the temperature during the welding cycle is high enough to transform the entire microstructure into austenite; (ii) the intercritical HAZ (ICHAZ) where the peak temperature during welding only allows a partial austenitic transformation; and lastly (iii) the subcritical HAZ (SCHAZ) where the peak temperature during welding is sufficient to cause microstructural changes to occur but the experienced temperature is too low to result in any austenitic transformations [9]. The post-welded mechanical properties of a joint are strongly dependent on local microstructures and mechanical properties within the weld [10]. The severity of mechanical property degradation is governed by several factors, such as the amount/rate of the heat input, chemical composition, and the initial microstructure [11,12,13]. The most critical zone in the RSW HAZ is the SCHAZ since this zone experiences temperatures in the range of (~350 °C) to near Ac1 temperature (~700 °C), which can lead to martensite tempering phenomenon in some AHSS alloys, such as dual-phase (DP)-600, DP-980, and martensitic (MS)-1200 [14].
Martensite tempering causes a reduction in the SCHAZ hardness when compared to the base material (BM) [15,16,17]. It has been reported that the degree of softening increases as the martensite volume fraction in the BM increases [18,19]. The tempering kinetics in AHSS have been investigated by many researchers over the last two decades. For instance, Hernandez et al. [20] studied the tempering kinetics and softening of different DP steels subjected to isothermal and non-isothermal tempering. Steels with high amounts of Mn, Cr, Mo, and Si resulted in as-welded SCHAZ structures with finer cementite and less martensite decomposition than found in the SCHAZ of steels with lean alloying contents. The observed changes in SCHAZ microstructure and hardness also affected the post-weld mechanical properties. Pouranvari et al. [21] found that the SCHAZ in MS1200 martensitic steels exhibited severe softening, which produced a locally under-matched zone across the weld. This softened zone led to a loss of joint strength, which was a function of the SCHAZ minimum hardness. More severe HAZ softening can decrease the mechanical properties (peak load) of joints that fail in pullout mode [22]. Hiroki et al. [23] found that when the hardness of the SCHAZ dropped below 80% of that of BM, the fracture location shifted from the BM to the softened HAZ, effectively decreasing the joint strength. However, it should be noted that HAZ softening was also found to improve joint performance. HAZ softening has been shown to promote pullout failure mode, increasing the joint’s load bearing and energy absorption capability [24,25,26]. Figure 1 presents data collected from the literature showing the influence of BM hardness and degree of HAZ softening on the failure mode of resistance spot welds. As seen from the graph, as the hardness of the BM increased, the degree of softening increased, and the pullout failure mode was promoted.
The new generations of AHSS, such as 3G-AHSS, have unique microstructural constituents due to their sophisticated manufacturing processes and alloying additions [32]. Some new generations of AHSS, such as quenched and partitioned (Q&P) AHSS, exhibit hardening phenomena in SCHAZ instead of softening. For instance, Q&P 980 AHSS SCHAZ exhibited about a 20% increase in hardness post-welding (see Figure 1) [33], which promoted an interfacial failure (IF) mode instead of pullout under tensile-shear loading [33]. Another study by Eftekharimilani et al. [29] on a similar grade (Q&P-980) showed neither softening nor hardening in the SCHAZ; when subjected to cross-tension testing, the reported failure mode was IF. Thus, such factors as welding schedule (heat input), loading mode, BM microstructure, and paint bake condition should also be considered to characterize the effect of HAZ on the failure mode. In addition, hardness measurements should be taken at fine spacings to accurately determine the minimum/maximum hardness across the weld since new studies have identified a zone around the weld nugget (halo ring) that could lead to strain localization and promote failure in the vicinity of fusion zone (FZ) boundary [19]. The BM microstructure and carbon content have been reported as crucial factors in determining the SCHAZ mechanical properties; the degree of softening/hardening is related to the martensite volume fraction and the chemical composition of the BM [17,25].
Despite the lack of research on the spot weld behavior of 3G-AHSS, such as Q&P and transformation-induced plasticity (TRIP)-aided bainitic ferritic (TBF) steels, rather interesting recent studies have reported HAZ hardening behavior in 3G-AHSS [33,34,35]. Therefore, HAZ softening or hardening phenomena depend on the BM chemical composition, initial microstructure, and the implemented welding schedule [36,37]. Figure 2 summarizes some of the available data from the literature, which shows the effect of BM hardness and carbon content on SCHAZ hardness; data points that lie below the dashed line represent softening in the SCHAZ, while the data points above the dashed line represent materials that showed hardening behavior upon welding. It is clear from the graph that SCHAZ softening is a common issue in resistance spot welded joints, which can be attributed to the amount of the martensite phase in the BM microstructure. As shown in Figure 2, the Q&P AHSS exhibited hardening in the SCHAZ, which could be attributed to the formation of fine carbide particles in the SCHAZ microstructure, as reported in recent literature [35,38]. It also noted that the TRIP AHSS does not show severe softening, which could be attributed to the low volume fraction of martensite in the initial microstructure.
As the SCHAZ mechanical properties and microstructure were seen to greatly influence joint failure mode, a considerable amount of research focused on the characterization of the SCHAZ mechanical properties. For instance, Tong et al. [40] used digital image correlation (DIC) techniques for strain measurement of miniature tensile bars extracted from resistance spot welded DP AHSS to characterize the strain localization in the FZ and HAZ. Although they were able to measure the flow stresses and strains up to necking for the FZ and HAZ, the method was not able to isolate the properties of each HAZ sub-zone from that of the adjacent areas. A hardness scaling approach was used to determine the constitutive properties of different HAZs to overcome this limitation. Researchers have scaled the BM stress-strain curve according to the local hardness measured in each HAZ [25,33,34,35]. However, the hardness-scaling approach was reported to lead to uncertainty in predicted RSW properties in recent investigations [21,36]. Indirect characterization of the stress-strain relationship of the HAZ regions was also considered in the available literature using thermo-mechanical simulators (Gleeble). For instance, Ghassemi-Armaki et al. [41] investigated HAZ softening in a martensitic AHSS using a Gleeble thermal-mechanical simulator to produce tensile coupons with various HAZ microstructures. The resulting tensile data were then used to inform finite-element (FE) models of the constitutive properties of the weld and HAZ. The results from tensile testing of the Gleeble coupons have been correlated well with the experimental hardness and failure mode of HAZ sub-zones [41]. Xue et al. [42] examined the local mechanical properties of the HAZ in fiber laser-welded Q&P980 AHSS. They gathered thermal welding cycle data during the laser welding process. Subsequently, the thermal cycles corresponding to each HAZ were employed to simulate the HAZ using the Gleeble thermal simulator, resulting in the generation of local mechanical property data. This dataset was then utilized to calibrate a Finite Element (FE) model specifically for laser tensile coupons. A similar study has been conducted by Wei et al. [43], the study focusing on the local properties of the HAZ in DP600 AHSS laser welds. In this research, the thermal cycles generated during the laser welding process were employed to simulate the HAZ. The Gleeble thermal simulation system was utilized for this purpose, allowing for a comprehensive investigation of the HAZ’s local properties in DP600 AHSS laser welds. Despite some discrepancies observed in matching the Gleeble coupons’ hardness with the experimental data, the local properties obtained were effectively employed to calibrate the (FE) model. Notably, the FE model successfully predicted the failure location, aligning with the actual laser-welded coupons. This agreement may be attributed to the phenomenon of strain localization occurring in the (SCHAZ) due to the softening [16,43].
Another study conducted by Biro et al. [44] used a Gleeble thermal simulator to understand the metallurgical transformations in the SCHAZ of martensitic AHSS resistance spot welds; the Gleeble thermal simulator was used to produce large coupons with similar local microstructures found in the SCHAZ. The study concluded that the error in estimating the mechanical properties of the SCHAZ using a Gleeble increases as the tempering temperature decreases. Rzayat et al. [31] sought to reproduce the different HAZ regions for martensitic AHSS (M1700) using the Gleeble thermal simulator. Conventional sub-size tensile test coupons were then produced out of the Gleeble samples. The data was used to inform the FE spot weld model and was able to predict the failure mode and strength for spot welds with different nugget sizes. A limited number of works have investigated the differences in morphologies and local properties of simulated Gleeble samples and RSW HAZ sub-zones. It is commonly assumed that a representative Gleeble microstructure is created upon the attainment of a matching local hardness value [45,46]. Therefore, more work is needed for comprehensive comparison between the overall properties of simulated and actual microstructures of RSW HAZ, especially for 3G-AHSS spot welded joints.
Considerable research has been conducted in the area of modeling tempering by employing curve fitting techniques to analyze the resultant alterations in mechanical properties. For instance, the semi-empirical modeling approach, which was initially developed independently by Johnson and Mehl, Avrami, and Kolmogorov often referred to as the JMAK model, has played a pivotal role in modeling steel tempering phenomena [47,48,49]. However, it’s important to note that the JMAK model was primarily utilized for predicting softening in DP and martensitic steel grades. With the emergence of new steel grades, such as the third generation, secondary hardening phenomena have been observed in the Sub-Critical Heat-Affected Zone (SCHAZ), which cannot be effectively predicted using the JMAK model [35,50].
Another semi-empirical model was developed by Hollomon-Jaffe [51], which takes into the account the effect of temperature and time by combining them into single parameter known as Hollomon-Jaffe (HJ) parameter. The HJ approach considers the chemical composition of the material by using a material constant, which is calculated based on the carbon content in the steel. Using the HJ model, the SCHAZ hardness can be predicted by graphing the tempering hardness against the HJ parameter for several temperatures and times, as described by the current authors in [35]. In the current study, the HJ model is adopted to predict the softening and hardening behaviour in the SCHAZ.
In this work, the SCHAZ of two grades of steel (an uncoated 3G-980AHSS and an Al-Si coated press-hardenable steel, PHS-1500) with a nominal gauge thickness of 1.4 was recreated using a Gleeble thermomechanical simulating apparatus. The press-hardenable steel was selected as a baseline material due to its high strength and extensive adoption within automotive structures. Moreover, this PHS grade is known to exhibit softening in the sub-critical heat-affected zone (SCHAZ) due to its fully martensitic base metal microstructure. The 3G-980 AHSS represents a new generation grade, with potential use in high-performance energy absorbing automotive structures, for which spot weld integrity is of critical importance. The current research examines the SCHAZ of this steel grade, particularly since these alloys are known to exhibit reduced levels of HAZ Softening. Special attention was given to the thermal profile during the heat treatment process of the Gleeble coupons using an in-situ infrared thermal imaging camera. The material was spot welded using an optimal welding schedule published elsewhere [52], and the hardness was measured through the cross-section to determine the minimum hardness in the SCHAZ. A series of iso-thermal simulations were used to simulate the SCHAZ microstructure and achieve the minimum hardness measured from the spot-welded coupons. In-situ IR thermal imaging was used to ensure the target temperature was achieved. Subsequently, the hardness measurements were utilized for the calibration of the HJ equation to accurately predict the SCHAZ hardness at any given temperature and time [51]. The microstructure and hardness of the Gleeble coupons were compared with the actual spot-welded samples to confirm the properties’ uniformity along the Gleeble specimen gauge length. Lastly, using the DIC technique with tensile testing, simulated miniature tensile coupons were tested to evaluate the mechanical properties of the SCHAZ.

2. Experimental Procedures

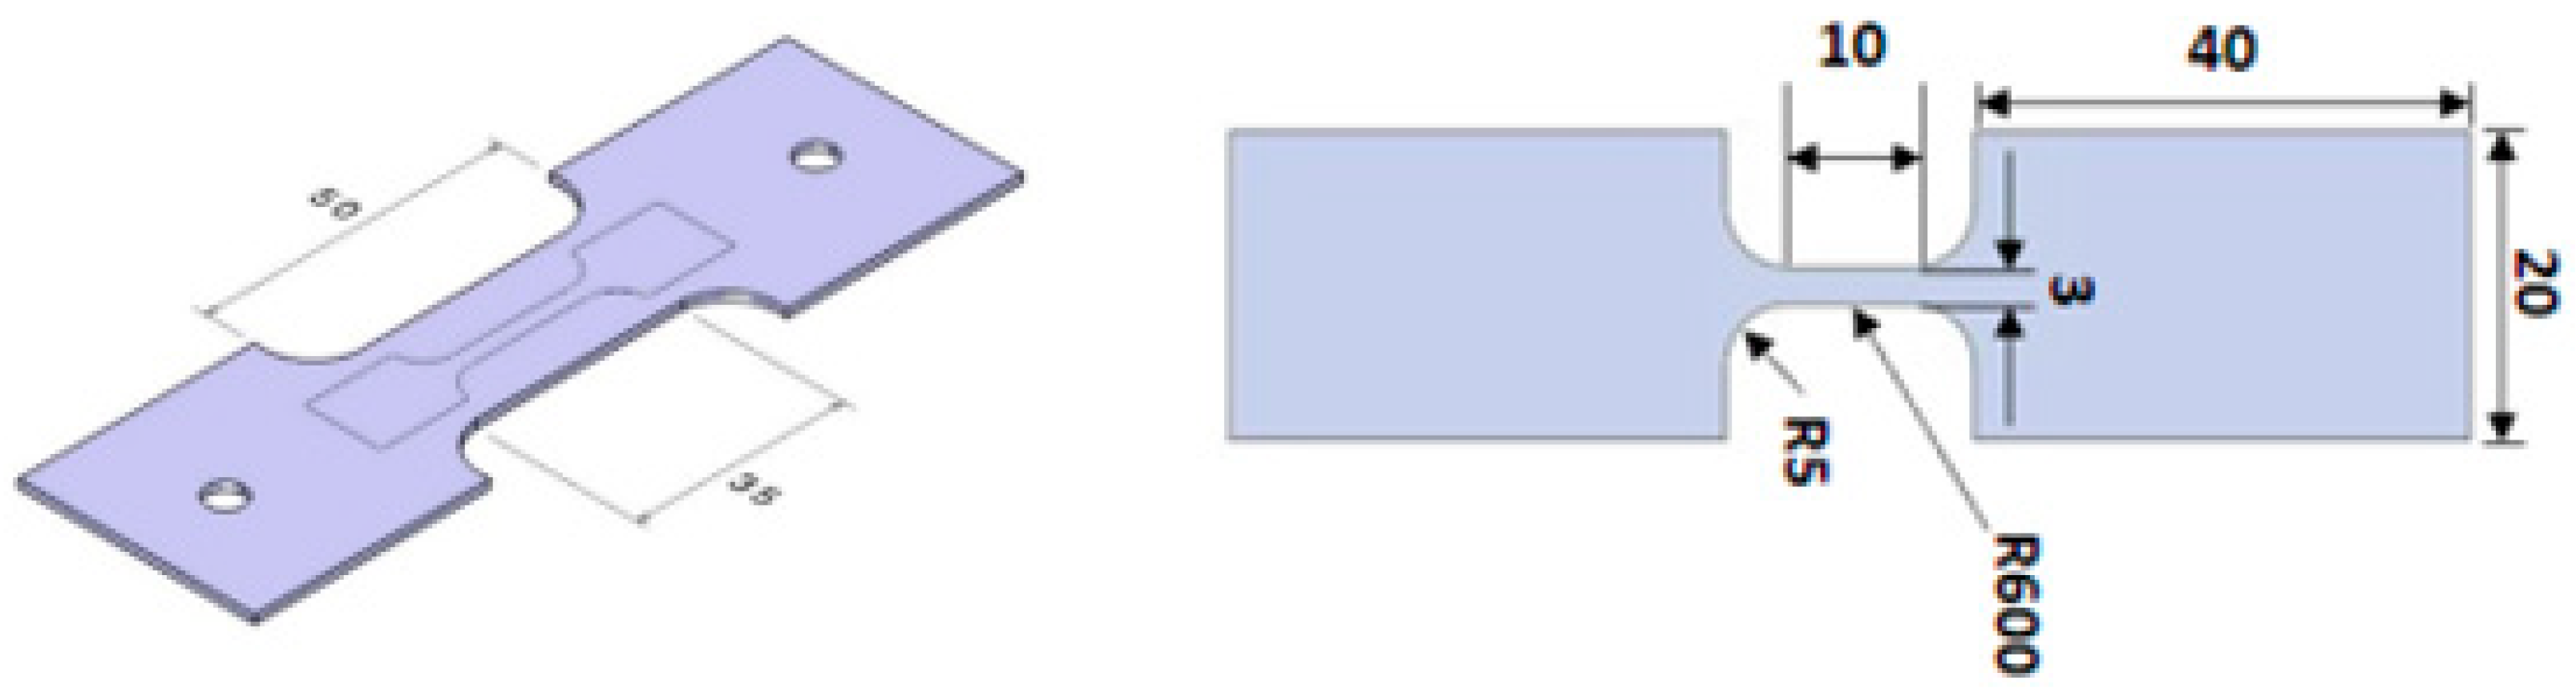
2.1. Material and Welding Process

This study investigated two AHSS materials: uncoated 3G-980 AHSS and Al-Si-coated PHS-1500. Both selected steels possessed a nominal gauge thickness of 1.4 mm. The chemical composition of the investigated material is shown in Table 1. Of particular note is the boron level in the PHS grade which is added to improve quench response and hardenability during die quenching operations.
The resistance spot welding (RSW) process was carried out using a medium-frequency direct current (MFDC) welder equipped with a Bosch weld controller. The welding parameters were developed according to the AWS D8.9 standard [53] to achieve the electrode face diameter weld size (FDWS); the optimization process of the welding lobes was developed in a previous study for the same materials [52]. The electrodes used in this study were a pair of 7 mm flat tips; the schematic diagram in Figure 3 below shows the welding parameters used in this study. The spot-welded samples were cross sectioned to evaluate the SCHAZ microstructure and hardness.

2.2. Gleeble Thermal Simulation Procedure

The rapid tempering heat treatments were performed using a Gleeble 3500 thermo-mechanical simulator. Three 0.25 mm thick Type K thermocouples, TC1, TC2, and TC3, were welded to each sample with a DSI capacitor discharge welder (see Figure 4a). Thermocouple TC1 was used to measure the sample temperature at the center; thermocouples TC2 and TC3 were placed at distances 7.5 and 15 mm from the center of the gauge, respectively, to measure the drop in the temperature. Samples were clamped in copper jaws with a maximum pre-clamping force of 400 N. After rapid conductive heating and isothermal soaking for a specific time, heat treated samples were quenched with water spray using a Gleeble High-Flow quenching system. The thermal history of a sample that was soaked for 60 s can be seen in Figure 4b. Subsequently, the Gleeble coupons were cleaned with compressed air, removing the leftover water from the sample surface. Two sets of Gleeble samples were used to compare the temperature history for two different gauge areas: 10 × 10 mm and 35 × 20 mm. An in-situ thermography IR camera (discussed below) was used to find an optimal gauge length that can be used to extract tensile samples from the heat-treated coupons.

2.3. Infrared Thermography

Infrared thermography was used to acquire the thermal history and temperature profile along the gauge length of the specimens in order to investigate the effect of specimen size on the uniformity of the temperature distribution. Two geometries, with gauge area dimensions of 10 × 10 mm and 35 × 20 mm, were examined at temperatures of 650 and 550 °C. A TELOPS fast infrared (IR) M350 thermal camera with 50 mm IR optics was used in conjunction with the Reveal IR software to acquire IR images during the test and post-process the collected data. To calibrate the thermal camera and account for sample surface oxidation during the test, a thermocouple was welded at the center of the calibration sample and compared to the IR-measured data. The emissivity coefficient was adjusted to match the temperature measured with the thermocouple and the IR camera reading. The same thermocouple was used to control the heating and cooling process of the sample. Sequences of images at a frequency of 500 Hz allowed an acceptable signal-to-noise ratio without oversaturating the image; the data were recorded after soaking the samples for ~30 s to visualize the sample temperature distribution.

2.4. Temperature Measurements during Gleeble Thermal Simulation

The temperature distributions in the Gleeble samples were measured at the soaking temperature of 650 °C at 60 s using the IR camera setup, and the two different coupon geometries were used to evaluate the temperature profile along the long axis of each sample. The IR images and the temperature profiles extracted from the IR camera are presented in Figure 5. As can be seen from the temperature profile measurement, a longer gauge length results in a lower temperature gradient across the sample gauge length. The cut-off distance (taken as the region of near-uniform temperature) for the large coupon reached 10 mm, whereas the cut-off distance for the smaller coupon was only 2 mm, which is inadequate to extract tensile samples for mechanical testing using standard tensile test methodologies. Therefore, the large coupon was used to extract specimens for the subsequent mechanical testing.

2.5. Sample Preparation and Mechanical Tests

The Gleeble processed specimens were cross sectioned to measure the hardness and characterize the microstructure along the coupon width and length in order to evaluate the sample uniformity within the cut-off length (as shown schematically in Figure 6). The specimens were then hot-mounted in conductive bakelite and prepared according to ASTM E3-11 standard [54]. The same preparation procedure was followed to prepare the spot-welded specimens. The microhardness was measured using an automated Clemex Vickers microhardness tester. The hardness tests were performed according to ASTM-E384 standard [55]; the hardness indentation load was 0.3 kgf, dwell time was set at 15 s, and the spacing between the indents was at least three times the indent diameter to avoid interaction between plastic zones. The microstructural characterization was conducted using a field emission scanning electron microscope (FESEM, UltraZeiss) after etching the polished specimens with 5% nital solution for 5 s and rinsing them with alcohol.
The tensile testing was performed on mini-tensile coupons extracted from the Gleeble processed specimens, as shown in Figure 7; the geometry of the coupon was developed and published in another study by the authors [56] to ensure the properties within the gauge length are homogeneous, a radius of 600 mm was machined at the center of the coupon to ensure that failure occurs at the center of the sample while preserving a uniaxial tensile stress state up to necking onset. The gauge of the mini-tensile specimens was 10 mm, which falls within the region where a representative hardness and microstructure of the SCHAZ of the spot-welded joints was achieved. An MTS tensile frame with a maximum load capacity of 100 kN at a constant crosshead speed (1 mm/min) was used for all uniaxial tensile tests in this study.

3. Results and Discussion

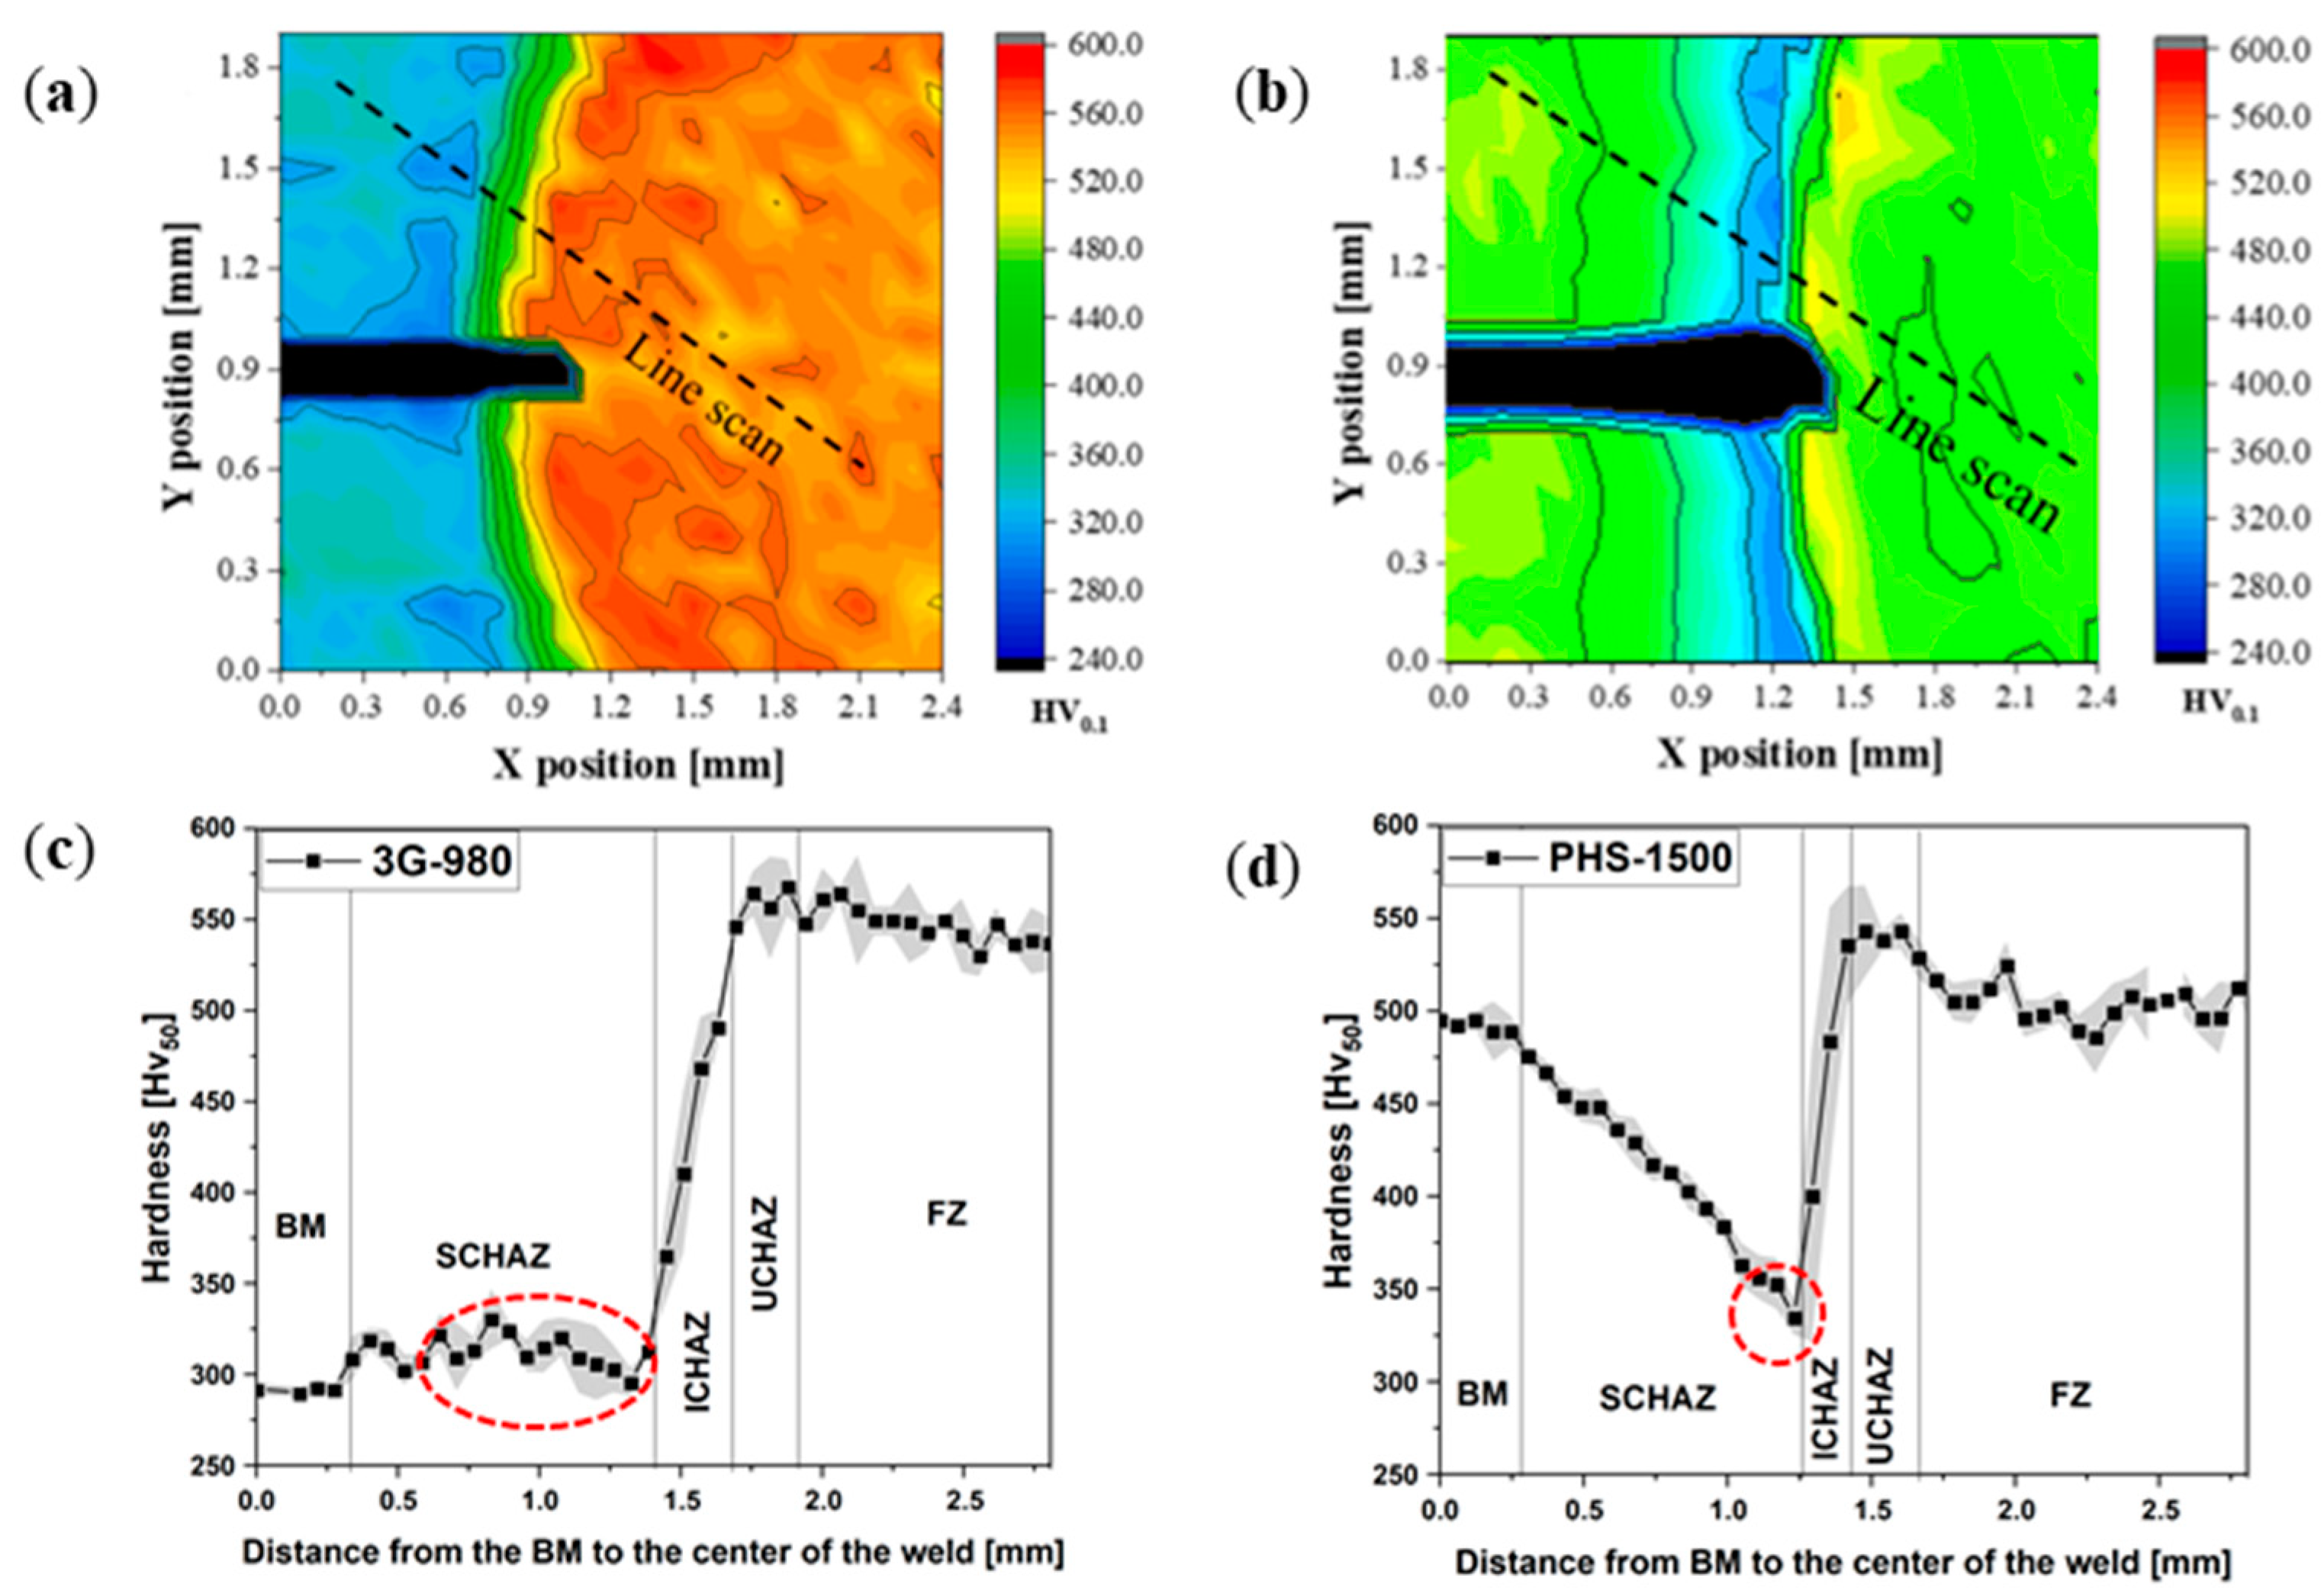
3.1. The Spot Weld Microhardness

The spot weld microhardness was measured along a line running from the BM towards the weld nugget center (FZ) to capture the minimum hardness in the HAZ. Three hardness profiles were measured, and the average hardness profile with confidence intervals (shown as a grey band) is shown in Figure 8. The average BM hardness is 293 HV. The hardness profile for the 3G-980 spot weld showed an increase in hardness within the SCHAZ, with a minimum hardness of 296 HV and a peak hardness of 330 HV, representing a 12% increase compared to the BM hardness. The maximum SCHAZ hardness was measured at approximately 1.0 mm away from the fusion line. This increase in the hardness can be attributed to the secondary hardening phenomenon (formation of fine carbides) which is in line with the data reported in the literature for a similar 3G-AHSS grade [35]. In contrast, severe softening was observed in the PHS-1500 SCHAZ; the minimum hardness measured in SCHAZ was 335 HV, representing a 38% reduction in the SCHAZ hardness compared to that of the BM. This drop in the PHS hardness has been reported in the literature and is attributed to martensite tempering [57,58].

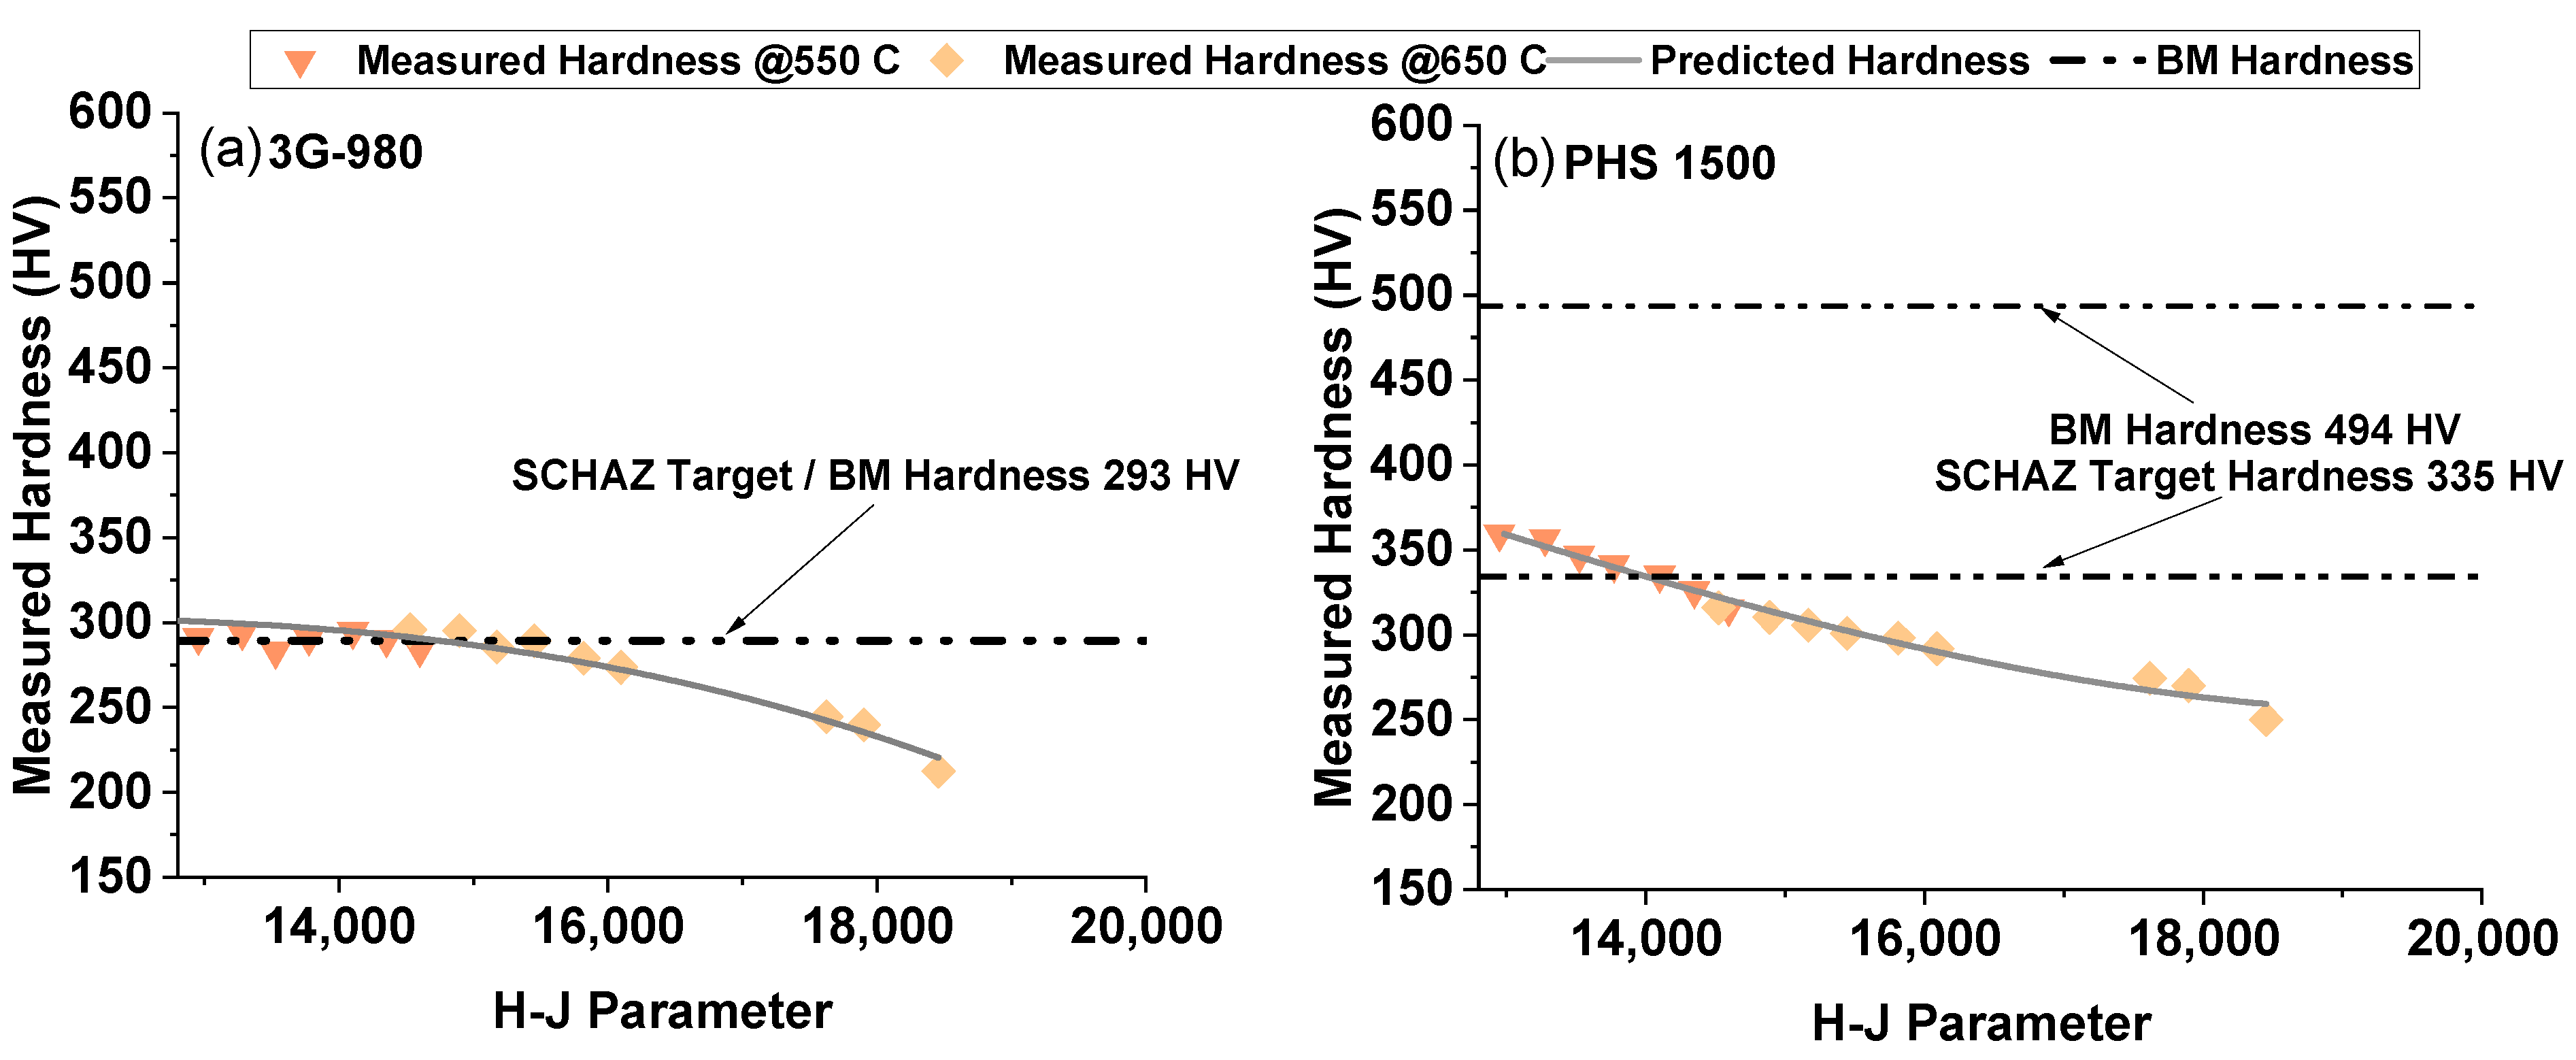
3.2. Gleeble Simulation and Hardness Prediction Using the Hollomon-Jaffe Model

A series of isothermal simulations were carried out using the Gleeble® 3500 thermal simulator to simulate the SCHAZ formed following soaking at temperatures of 550 °C to 650 °C for times ranging from 0.2 s to 60 min. The hardness was measured for all coupons to compare the results with the spot weld hardness data and to select the simulation condition that best matches the spot weld hardness within the SCHAZ. The HJ parameter was calculated for each heat-treated condition, as described in the article by Ramachandran et al. [35]. The hardness measurements and HJ parameters from the Gleeble processed specimens are plotted in Figure 9. The data was then fit to the third-degree polynomial given in Equation (1). The intercept was fixed to the value of the measured BM hardness and the resulting polynomial coefficients are presented in Table 2.
H V H J = a · H J 3 + b · H J 2 + c · H J + d
Figure 9 shows the hardness change with the HJ parameter (temperature and time); the dashed horizontal line shows the as-received material hardness. The hardness data for the 3G-980 material showed a consistent trend that matches the actual spot weld hardness (293 HV) with no softening at a temperature of 550 °C. When the temperature reached 650 °C (corresponding to the HJ parameter of 16,000), the tempering progression was such that the material started to soften appreciably and softening increased as specimen tempering time increased. For the PHS-1500 BM, the hardness was 495 HV, due to the fully martensitic microstructure; thus, the tempering progression was more severe in this alloy and the hardness dropped 27% when the material was exposed to the least severe tempering conditions used (550 °C for 0.2 s). As the holding time and temperature increased, tempering progression likewise increased until all the martensite was transformed, and the microstructure fully transitioned into tempered martensite. It is important to note that the spot-welding process has a very short welding time. However, in order to gain an understanding of the tempering kinetics and create a predictive model for hardness within the SCHAZ region, it was necessary to evaluate various tempering temperatures and times, as depicted in Figure 9 which necessitated examining the hardness variations up to 24 h to ensure the material has been fully tempered.
To evaluate the prediction model Equation (1), the hardness profiles along the length of the Gleeble processed samples were predicted for samples soaked at 650 °C for 60 s and 550 °C for 5 s. The hardness was measured along the gauge length axis for the Gleeble coupons and compared to the predicted hardness profiles for these conditions, as shown in Figure 10. The predicted and measured hardness profiles showed excellent agreement. Knowing the HJ model Equation (1) parameters provides a tool to estimate the hardness distribution in the Gleeble samples at any given time or temperature, which allows prediction of the effect of temperature variation on the hardness distribution within the Gleeble coupons.
It is expected to see some variation in the temperature along the Gleeble specimen heat-treated area; that variation may affect the resultant microstructure and any subsequent mechanical testing. Therefore, it would be beneficial to evaluate the effect of temperature variation on the hardness. Therefore, the temperature dropped from the target peak temperature of 550 °C and 650 °C by 10–20 °C. Subsequently, the model was used to predict the hardness variations compared to the baseline hardness. Figure 11a shows the measured baseline hardness data at 550 °C and 650 °C (black squares) for all tempering times considered; the red circles show the predicted hardness values for the temperature 10 °C lower than the baseline value; the blue triangles show the hardness change for peak temperature reduction by 20 °C. The resulting hardness of PHS1500 is sensitive to temperature change; therefore, a meticulous choice of sample geometry and heat treatment conditions are needed to fabricate mechanical test coupons from Gleeble samples to limit temperature variation within the sample. In addition, the temperature variation within the free span of the Gleeble specimen must be considered for both baseline temperatures. For 3G-980, no significant change in the hardness was observed at 550 °C. In contrast, heat treatment at 650 °C for times longer than 0.5 s caused hardness changes relative to the baseline. The variation in the hardness prediction between the baseline and the −10/−20 °C conditions was calculated for both alloys, and the data is organized in Figure 11b. The results showed that the variation in the hardness prediction due to temperature variation (up to 20 °C) below the target temperature could be neglected for the 3G-980 alloy since the variation was lower than 5% at both temperatures. The PHS1500 hardness prediction showed some variation at 550 °C; however, the maximum variation was bounded by 5%.
The selected Gleeble soaking time and temperatures that produced a representative hardness that matched the actual spot weld were chosen as the following: for 980-SCHAZ a peak temperature of 550 °C held for 0.5 s, and for PHS-1500 SCHAZ, the peak temperature was 550 °C, held for 5 s. At least 8 specimens were produced from each material to assess the repeatability of the hardness measurements and the tensile testing. The microhardness was measured along the gauge length (long direction) and along the width (width direction) to ensure the target hardness values were achieved at the center with a consistent trend that allowed the extraction of mechanical testing coupons. The results are presented in Figure 12; both materials showed a consistent hardness trend that matches the actual spot weld hardness measurements and remains within ±5% of the target hardness value. After undergoing heat treatment, the 3G-980 material demonstrates the potential to extend its usable gauge length to 35 mm, as indicated by the hardness profile. In contrast, the PHS-1500 specimen exhibits a shorter gauge length of 26 mm. This reduced gauge length can be attributed to its as-received fully martensitic microstructure, which displays heightened sensitivity to variations in temperature and time.
The bar chart in Figure 13 compares the hardness values within the processed Gleeble samples with the hardness of the BM and SCHAZ for both steel alloys. The 3G-980 SCHAZ showed a slight increase in hardness relative to the base metal due to the secondary hardening effect, as reported by the current authors in [35].

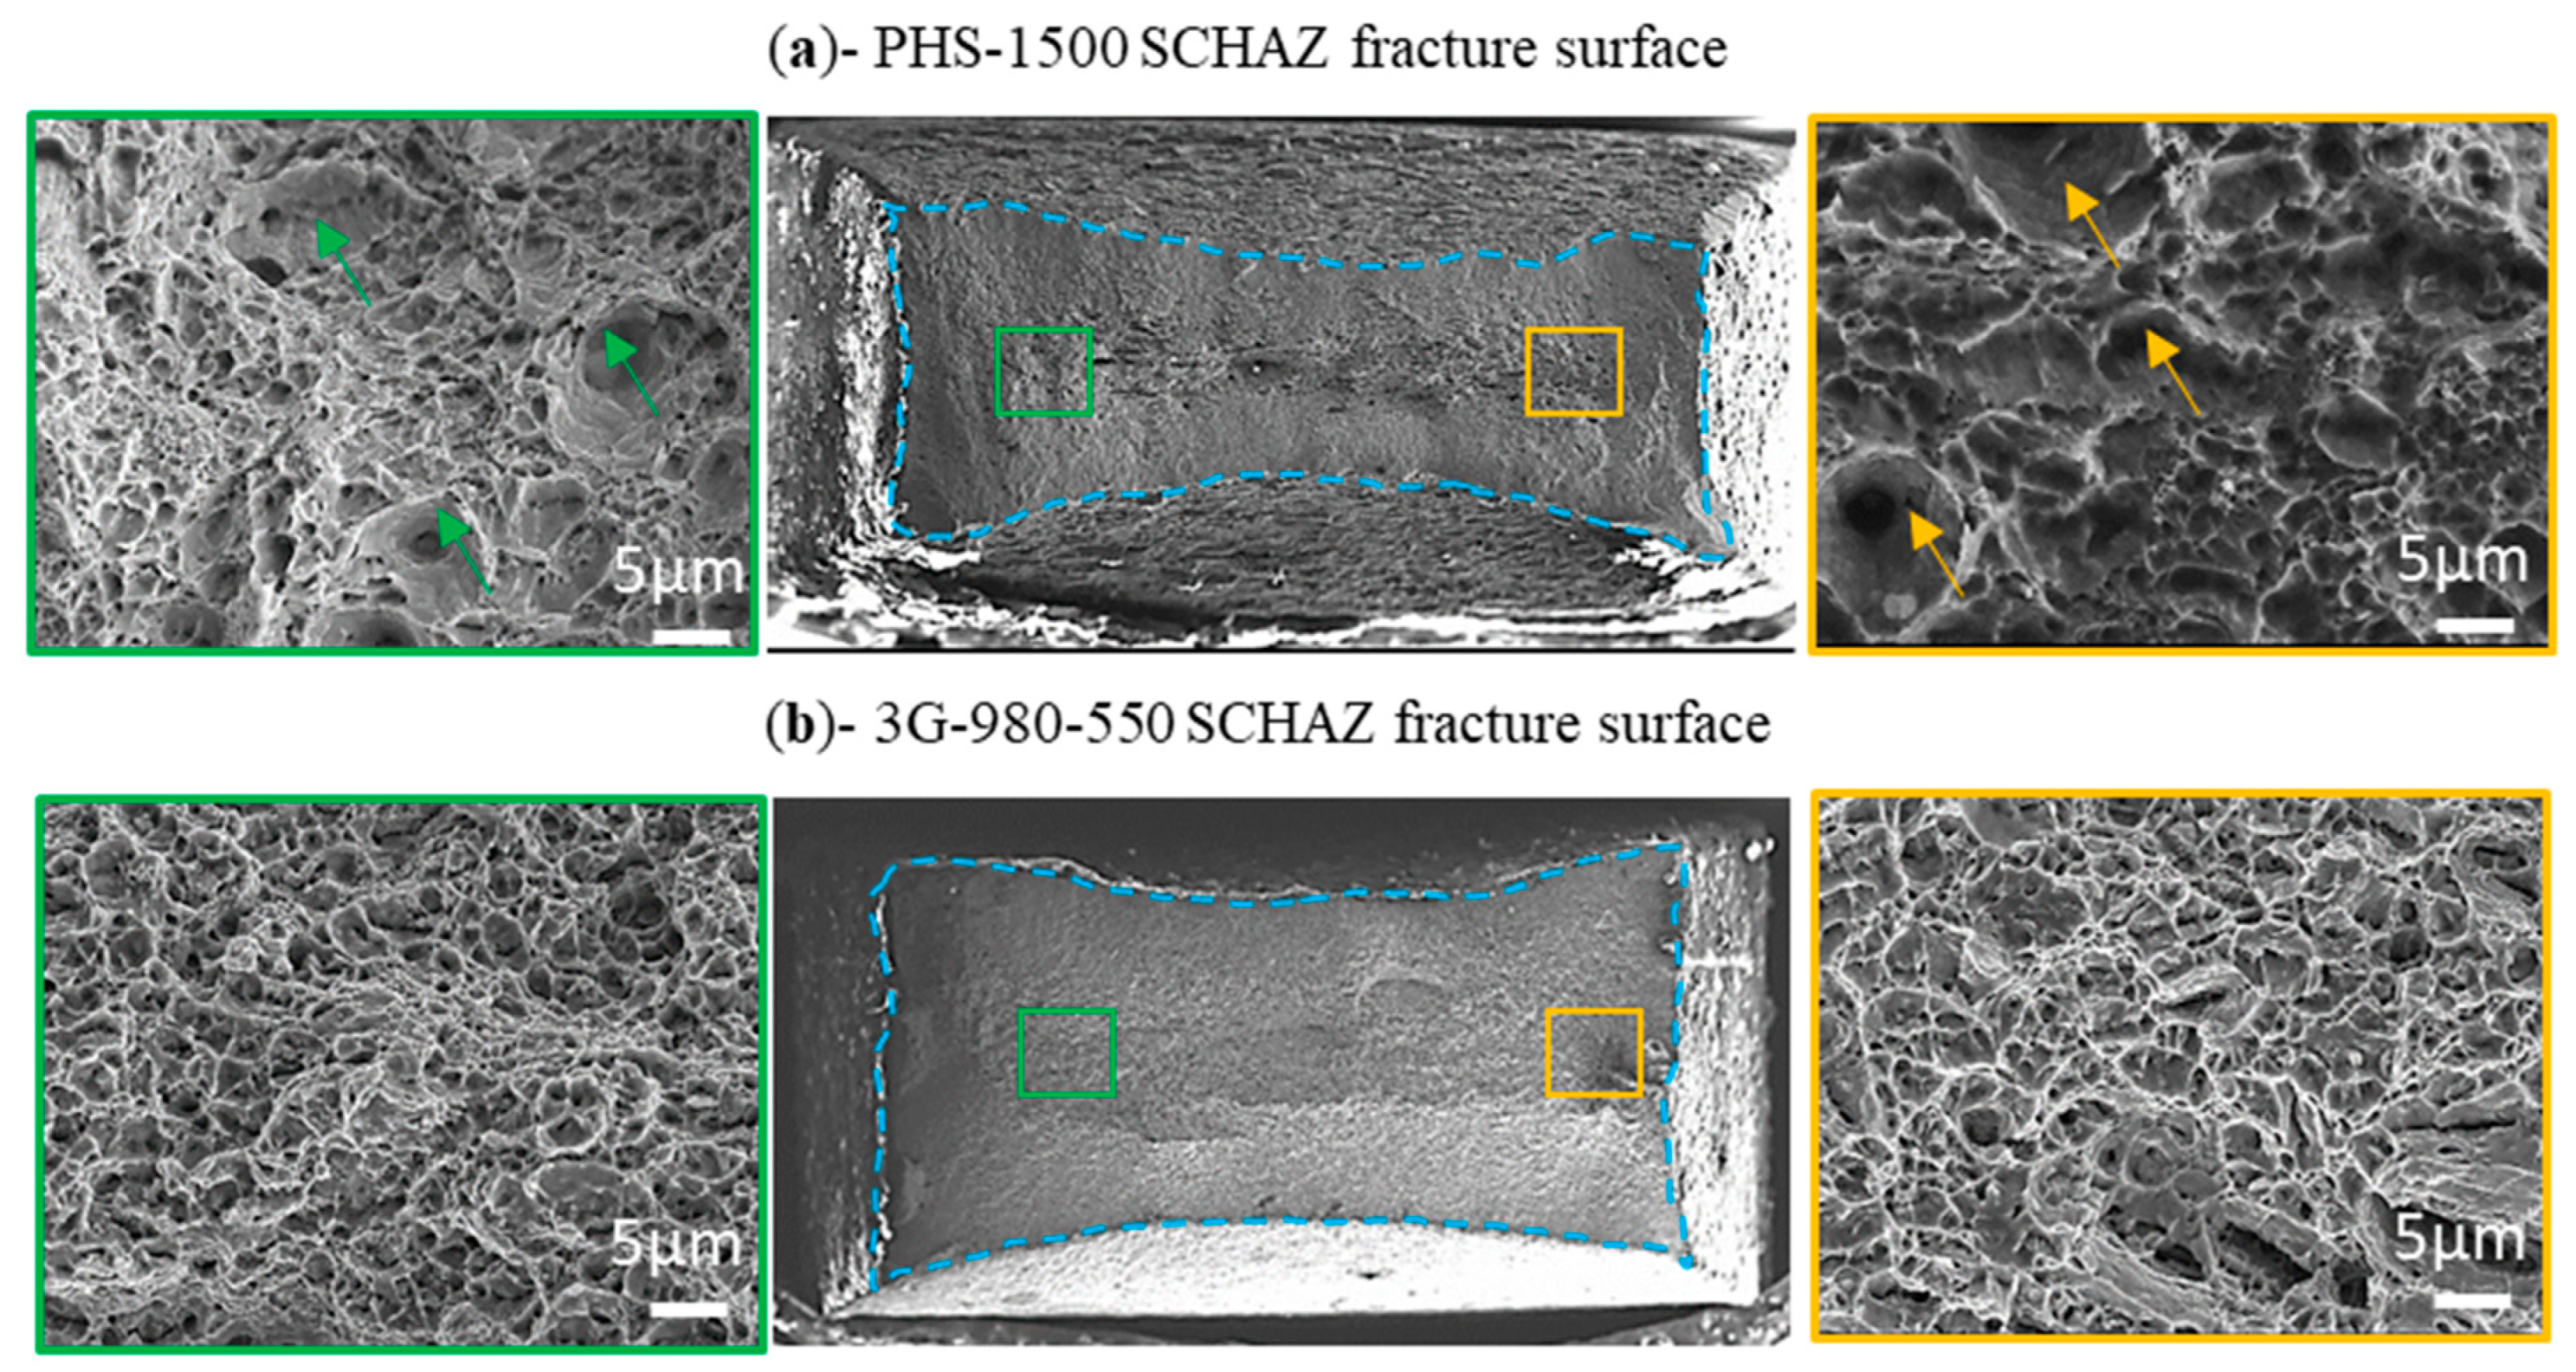
3.3. Microstructure Analysis

The microstructure of the BM and the SCHAZ are shown in Figure 14; the 3G-980 AHSS microstructure consists of multiple phases that include ferrite, martensite, tempered martensite, and retained austenite, the fraction of the martensite in the 3G-980 steel was measured at approximately 20%, while the retained austenite fraction was about 12%. The combination of the phases presented in the 3G-980 BM is due to the unique thermomechanical processing route that is used to produce 3G-AHSS. In contrast, due to the hot-stamping process, the PHS-1500 mainly consists of a single-phase martensitic microstructure with different morphologies. The tempering degree in the SCHAZ microstructure depends mainly on the volume fraction of the martensite phase available in the microstructure. Considering the low volume fraction of the martensite phase in the 3G-980 steel, no significant tempering effect was observed in the hardness data (as shown earlier in Figure 8). In fact, secondary hardening was observed in the SCHAZ of 3G-980 at a temperature range (350–550 °C), and the hardness increased by about 5% compared to the hardness of the BM. Ramachandran et al. [35] studied the secondary hardening phenomenon in the 3G-980 SCHAZ. They pointed out that the formation of hard nano-sized carbide particles within the 3G-980 SCHAZ, which is exposed to temperatures below AC1 is responsible for the observed secondary hardening behavior. Even though some martensite tempering was observed in both SEM micrographs of the 3G-980 SCHAZ (Figure 14c,e), and also reported in [35], the net effect of hardening due to the formation of fine carbide particles was prominent [35]. Looking at the SCHAZ of the PHS-1500 shown in the SEM micrograph (Figure 14d,f), both the spot weld and simulated specimens showed a predominantly tempered martensite microstructure with some martensite islands that have not decomposed. The difference between the PHS-1500 BM and the SCHAZ in terms of hardness was 38%.

3.4. Tensile Test Results

The tensile test results for the BM and Gleeble samples (simulated SCHAZ) of both materials are shown in Figure 15; the 3G-980 SCHAZ showed higher tensile strength and ductility than the 3G-980 BM. The improvement in the mechanical properties of the 3G-980-SCHAZ can be attributed to the nano-size carbide particles observed in the microstructure, which act as barriers to dislocation movement, as reported elsewhere for a similar 3G-AHSS material [35]. The PHS-1500 BM microstructure is fully martensitic, due to the hot-stamping process, and the tensile properties achieve the minimum strength requirements for this grade (1500 MPa). Due to the tempering effect in the PHS SCHAZ, the tensile test results showed a 39% reduction in tensile strength. The decomposition of the martensite to ferrite and cementite carbide led to a reduction in the martensite volume fraction in the microstructure, which has been reported in the literature as a contributor to the yield point elongation (YPE) phenomenon observed in the PHS SCHAZ stress-strain curve. The formation of YPE and its corresponding yield plateau and Lüders strain has been studied by many researchers [31,59,60]. The YPE in the PHS SCHAZ should be considered when a mesoscale modelling approach is used to simulate martensitic AHSS SCHAZ properties. The area under the stress-strain curve was measured for the SCHAZ specimens as a quantitative estimate representing the material toughness or the work per unit volume needed to fracture the material. The results are summarized in Figure 16; the 3G-980 SCHAZ material has almost double the toughness of the PHS-SCHAZ material. The high toughness of the 3G-980 material makes it a good candidate for use in components that require high energy absorption in the body-in-white structure.
The fracture surface of the tensile coupons is shown in the SEM micrographs (Figure 17); both surfaces consist predominantly of dimples; however, the size and distribution of dimples were different. The fracture surface for the PHS-1500 SCHAZ showed large size dimple, which nucleated through decohesion at a tempered martensite (ferrite+Fe3C carbides) and martensite interface, as indicated in the SEM micrographs below. In comparison, the 3G-980 SCHAZ fracture surface shows a very fine and high-density dimple size, indicating the fracture ductile nature, which supports the high energy absorption capability of the 3G-980 SCHAZ.

4. Conclusions

The SCHAZ microstructure was successfully simulated using a thermo-mechanical simulator (Gleeble) to achieve a microstructure and hardness comparable to the SCHAZ of an actual spot weld specimen. An infrared camera was used to measure the temperature field during the Gleeble simulation to ensure a sufficiently homogenous temperature distribution along the target zone was achieved. The Holloman-Jaffe model was used to predict the hardness profile along the Gleeble coupons and to evaluate the hardness sensitivity due to the temperature variation; the study showed local temperature variation of up to 20 °C will result in a hardness variation of ±5% of the target hardness value. The SEM analysis of the microstructure showed that the microstructure of the 3G-980 SCHAZ consists of multiple phases. In addition, the hardness measurements of the 3G-980 SCHAZ showed a slight increase compared to the BM due to the nano-size carbides formed in the SCHAZ, which led to the secondary hardening phenomena. The PHS-SCHAZ microstructure was mainly tempered martensite with some fresh martensite islands. The tensile testing results showed an increase of the 3G-980 tensile strength by 5%. In comparison, the PHS SCHAZ showed a 39% reduction in tensile strength compared to the BM. YPE behaviour was observed in the PHS-SCHAZ tensile curves, which should be considered when modelling the spot weld of this alloy.

Author Contributions

Conceptualization, investigation, and writing—original draft preparation, A.R.H.M.; methodology, data curation, and validation, O.S., D.C.R., M.S. and S.A.; formal analysis, writing—review and editing, E.B., M.W., T.Z. and H.G.-A.; project administration and supervision, M.W. and E.B.; funding acquisition, T.Z. and H.G.-A. All authors have read and agreed to the published version of the manuscript.

Funding

This work was funded by the Auto/Steel Partnership (A/SP) as part of an Industrial Welding Solutions project that aims to improve RSW quality in 3G AHSS. The authors would like to thank A/SP for the financial support and the ASP project team for the valuable technical discussion, particularly Eric McCarty of A/SP. The authors acknowledge the financial support from the Canadian Natural Sciences and Engineering Research Council (NSERC) through the alliance grant program and the Canadian Centre for Electron Microscopy (supported by NSERC and other Canadian government agencies).

Data Availability Statement

The data of this project is confidential, but can be made available upon request and after approval.

Conflicts of Interest

The authors declare no conflict of interest.

References

  1. Gan, Y.; Weng, Y.; Dong, H. Advanced Steels: The Recent Scenario in Steel Sceince and Techonlogy; Springer: Berlin/Heidelberg, Germany, 2011. [Google Scholar]
  2. Nanda, T.; Singh, V.; Singh, V.; Chakraborty, A.; Sharma, S. Third generation of advanced high-strength steels: Processing routes and properties. Proc. Inst. Mech. Eng. Part L J. Mater. Des. Appl. 2016, 233, 209–238. [Google Scholar] [CrossRef]
  3. Lebesi, D.M.; Tzia, C. The evolving use of advanced high-strength steel for automotive applications. Steel Mark. Dev. Inst. 2011, 42, 710–722. [Google Scholar] [CrossRef]
  4. Soleimani, M.; Kalhor, A.; Mirzadeh, H. Transformation-induced plasticity (TRIP) in advanced steels: A review. Mater. Sci. Eng. A 2020, 795, 140023. [Google Scholar] [CrossRef]
  5. Zhang, H.; Senkara, J. Resistance Welding: Fundamentals and Applications; CRC Press: Boca Raton, FL, USA, 2011. [Google Scholar]
  6. Kimchi, D.H. Menachem and Phillips, Resistance Spot Welding Fundametals and Applications for the Automotive Industry, 1st ed.; Morgan & Claypool Publishers: San Rafael, CA, USA, 2018. [Google Scholar] [CrossRef]
  7. Badkoobeh, F.; Nouri, A.; Hassannejad, H.; Mostaan, H. Microstructure and mechanical properties of resistance spot welded dual-phase steels with various silicon contents. Mater. Sci. Eng. A 2020, 790, 139703. [Google Scholar] [CrossRef]
  8. Razmpoosh, M.; DiGiovanni, C.; Zhou, Y.; Biro, E. Pathway to understand liquid metal embrittlement (LME) in Fe-Zn couple: From fundamentals toward application. Prog. Mater. Sci. 2021, 121, 100798. [Google Scholar] [CrossRef]
  9. Lu, Y.; Peer, A.; Abke, T.; Kimchi, M.; Zhang, W. Heat-affected Zone Softening of Resistance Spot-welded 3T Stack-ups of AHSS. In Proceedings of the Sheet Metal Welding Conference XVIII, Livonia, MI, USA, 17–18 October 2018; pp. 1–12. [Google Scholar]
  10. Pawar, S.; Singh, A.K.; Park, K.-S.; Choi, S.-H. Effect of welding current on the microstructural evolution and lap-shear performance of resistance spot-welded 340BH steel. Mater. Charact. 2023, 203, 113126. [Google Scholar] [CrossRef]
  11. Xia, M.; Biro, E.; Tian, Z.; Zhou, Y.N. Effects of heat input and martensite on HAZ softening in laser welding of dual phase steels. ISIJ Int. 2008, 48, 809–814. [Google Scholar] [CrossRef]
  12. Pouranvari, M. Effect of resistance spot welding parameters on the HAZ softening of DP980 ferrite-martensite dual phase steel welds. World Appl. Sci. J. 2011, 15, 1454–1458. [Google Scholar]
  13. Vignier, S.; Biro, E.; Hervé, M. Predicting the hardness profile across resistance spot welds in martensitic steels. Weld. World 2014, 58, 297–305. [Google Scholar] [CrossRef]
  14. Janardhan, G.; Dutta, K.; Mukhopadhyay, G. Influence of Work Hardening on Tensile and Fatigue Behavior of Resistance Spot-Welded Dual-Phase Steel. J. Mater. Eng. Perform. 2022, 32, 624–637. [Google Scholar] [CrossRef]
  15. Tamizi, M.; Pouranvari, M.; Movahedi, M. Welding metallurgy of martensitic advanced high strength steels during resistance spot welding. Sci. Technol. Weld. Join. 2016, 22, 327–335. [Google Scholar] [CrossRef]
  16. Zhang, Y.; Xu, W.; Zhang, G.; Tao, W.; Yang, S. Mechanical Behavior and Failure Mechanism of Q&P980 Steel During In Situ Post-Weld Heat Treatment (PWHT) Resistance Spot Welding. Met. Mater. Trans. A 2022, 53, 794–809. [Google Scholar] [CrossRef]
  17. Pawar, S.; Singh, A.K.; Kaushik, L.; Park, K.-S.; Shim, J.; Choi, S.-H. Characterizing local distribution of microstructural features and its correlation with microhardness in resistance spot welded ultra-low-carbon steel: Experimental and finite element characterization. Mater. Charact. 2022, 194, 112382. [Google Scholar] [CrossRef]
  18. Nayak, S.S.; Zhou, Y.; Hernandez, V.H.B.; Biro, E. Resistance spot welding of dual-phase steels: Heat affected zone softening and tensile properties. In Proceedings of the ASM Proceedings of the International Conference: Trends in Welding Research, Novelty, OH, USA, 4–8 June 2013; pp. 641–649. [Google Scholar]
  19. Jing, Y.; Xu, Y.; Wang, D.; Li, J.; Yu, Y.; Lu, L. Microstructural characterization and mechanical properties in resistance spot welding of Q&P980 steel involving “effective softening” at the fusion boundary. Mater. Charact. 2023, 202, 113041. [Google Scholar] [CrossRef]
  20. Hernandez, V.H.B.; Nayak, S.S.; Zhou, Y. Tempering of martensite in dual-phase steels and its effects on softening behavior. Met. Mater. Trans. A 2011, 42, 3115–3129. [Google Scholar] [CrossRef]
  21. Pouranvari, M.; Sobhani, S.; Goodarzi, F. Resistance spot welding of MS1200 martensitic advanced high strength steel: Microstructure-properties relationship. J. Manuf. Process 2018, 31, 867–874. [Google Scholar] [CrossRef]
  22. Pouranvari, M.; Marashi, S.P.H. Critical review of automotive steels spot welding: Process, structure and properties. Sci. Technol. Weld. Join. 2013, 18, 361–403. [Google Scholar] [CrossRef]
  23. Hiroki, F.; Kouichi, H.; Toru, O.; Hidetoshi, F. Effects of HAZ softening on the strength and elongation of resistance spot-welded joints in high-strength steel sheet in an in-plane tensile test. Weld. Int. 2018, 32, 513–525. [Google Scholar] [CrossRef]
  24. Pouranvari, M.; Marashi, S.; Safanama, D. Failure mode transition in AHSS resistance spot welds. Part II: Experimental investigation and model validation. Mater. Sci. Eng. A 2011, 528, 8344–8352. [Google Scholar] [CrossRef]
  25. Bharaj, A.S.; Kewati, A.; Shukla, S.; Gedam, S.; Kukde, R.; Verulkar, S. Study of resistant spot welding and its effect on the metallurgical and mechanical properties—A review. Mater. Today Proc. 2023. Available online: https://www.sciencedirect.com/science/article/pii/S2214785323025841?via%3Dihub (accessed on 16 October 2023).
  26. Jeon, W.-S.; Sharma, A.; Jung, J.P. Liquid Metal Embrittlement of Galvanized TRIP Steels in Resistance Spot Welding. Metals 2020, 10, 787. [Google Scholar] [CrossRef]
  27. Biro, E. Heat-Affected Zone Softening Kinetics in Dual-Phase and Martensitic Steels; McMaster University: Hamilton, ON, Canada, 2013. [Google Scholar]
  28. Hernandez, V.H.B. Effects of Martensite Tempering on HAZ-Softening and Tensile Properties of Resistance Spot Welded Dual-Phase Steels by. Ph.D. Thesis, University of Waterloo, Waterloo, Canada, 2010. Available online: https://uwspace.uwaterloo.ca/handle/10012/5565 (accessed on 16 October 2023).
  29. Eftekharimilani, P.; van der Aa, E.M.; Hermans, M.J.M.; Richardson, I.M. The microstructural evolution and elemental distribution of a 3rd generation 1 GPa advanced high strength steel during double pulse resistance spot welding. Weld. World 2017, 61, 691–701. [Google Scholar] [CrossRef]
  30. Biro, E.; Vignier, S.; Kaczynski, C.; Mcdermid, J.R.; Lucas, E.; Embury, J.D.; Zhou, Y.N. Predicting transient softening in the sub-critical heat-affected zone of dual-phase and martensitic steel welds. ISIJ Int. 2013, 53, 110–118. [Google Scholar] [CrossRef]
  31. Rezayat, H.; Ghassemi-Armaki, H.; Bhat, S.P.; Sriram, S.; Babu, S.S. Constitutive properties and plastic instabilities in the heat-affected zones of advanced high-strength steel spot welds. J. Mater. Sci. 2019, 54, 5825–5843. [Google Scholar] [CrossRef]
  32. Nadimi, N.; Yadegari, R.; Pouranvari, M. Resistance Spot Welding of Quenching and Partitioning (Q&P) Third-Generation Advanced High-Strength Steel: Process–Microstructure–Performance. Met. Mater. Trans. A Phys. Metall. Mater. Sci. 2022, 54, 577–589. [Google Scholar] [CrossRef]
  33. Luo, C.; Zhang, Y. Failure Mode Prediction of Resistance Spot Welded Quenching and Partitioning Steel. MATEC Web Conf. 2019, 269, 03002. [Google Scholar] [CrossRef]
  34. Lei, M.; Pan, H. Comparative study of resistance spot welding performance between cold-rolled DP980 and Q&P980 steels. Baosteel Tech. Res. 2012, 6, 2–5. [Google Scholar]
  35. Ramachandran, D.C.; Midawi, A.R.; Shojaee, M.; Sherepenko, O.; Ghassemi-Armaki, H.; Biro, E. A comprehensive evaluation of tempering kinetics on 3rd generation advanced high strength steels. Materialia 2022, 26, 101644. [Google Scholar] [CrossRef]
  36. Pan, B.; Sun, H.; Shang, S.-L.; Banu, M.; Wang, P.-C.; Carlson, B.E.; Liu, Z.-K.; Li, J. Understanding formation mechanisms of intermetallic compounds in dissimilar Al/steel joint processed by resistance spot welding. J. Manuf. Process 2022, 83, 212–222. [Google Scholar] [CrossRef]
  37. Karim, A.; Manladan, S.M.; Afroz, H.M.; Jin, W.; Krishna, T.; Ji, C.; Kim, D.B.; Park, Y.-D. Critical effect of heat input on joint quality in resistance element welding of Al and steel. J. Manuf. Process 2023, 95, 91–104. [Google Scholar] [CrossRef]
  38. Figueredo, B.; Ramachandran, D.C.; Macwan, A.; Biro, E. Failure behavior and mechanical properties in the resistance spot welding of quenched and partitioned (Q&P) steels. Weld. World 2021, 65, 2359–2369. [Google Scholar] [CrossRef]
  39. Biro, E.; McDermid, J.R.; Vignier, S.; Zhou, Y.N. Decoupling of the softening processes during rapid tempering of a martensitic steel. Mater. Sci. Eng. A 2014, 615, 395–404. [Google Scholar] [CrossRef]
  40. Tong, W.; Tao, H.; Zhang, N.; Jiang, X.; Marya, M.P.; Hector, L.G.; Gayden, X.Q. Deformation and fracture of miniature tensile bars with resistance-spot-weld microstructures. Met. Mater. Trans. A Phys. Metall. Mater. Sci. 2005, 36, 2651–2669. [Google Scholar] [CrossRef]
  41. Ghassemi-Armaki, H.; Biro, E.; Sadagopan, S. Advanced characterization of HAZ softening of AHSS for crash modeling. ISIJ Int. 2017, 57, 1451–1460. [Google Scholar] [CrossRef]
  42. Xue, J.; Guo, W.; Zhang, Y.; Xia, M.; Jia, Q.; Chi, J.; Shi, J.; Wu, Y.; Zhang, H. Local microstructure and mechanical characteristics of HAZ and tensile behavior of laser welded QP980 joints. Mater. Sci. Eng. A 2022, 854, 143862. [Google Scholar] [CrossRef]
  43. Wei, C.; Zhang, J.; Yang, S.; Tao, W.; Wu, F.; Xia, W. Experiment-based regional characterization of HAZ mechanical properties for laser welding. Int. J. Adv. Manuf. Technol. 2015, 78, 1629–1640. [Google Scholar] [CrossRef]
  44. Biro, E.; Ghassemi-Armaki, H. Transformations in the HAZ of Martensitic AHSS—Part 1: Physical Simulation of the Sub-Critical HAZ. In Proceedings of the Sheet Metal Welding Conference XVII, Livonia, MI, USA, 19–20 October 2016; pp. 1–14. [Google Scholar]
  45. Ma, Y.; Yu, Y.; Geng, P.; Ihara, R.; Maeda, K.; Suzuki, R.; Suga, T.; Ma, N. Fracture modeling of resistance spot welded ultra-high-strength steel considering the effect of liquid metal embrittlement crack. Mater. Des. 2021, 210, 110075. [Google Scholar] [CrossRef]
  46. Ma, Y.; Takikawa, A.; Nakanishi, J.; Doira, K.; Shimizu, T.; Lu, Y.; Ma, N. Measurement of local material properties and failure analysis of resistance spot welds of advanced high-strength steel sheets. Mater. Des. 2021, 201, 109505. [Google Scholar] [CrossRef]
  47. Ank, S.W.; Shiryayev, A.N. (Eds.) Probability Theory and Mathematical Statistics; Kluwer Academic Publishers: Alphen am Rhein, The Netherland, 1992. [Google Scholar]
  48. Publication, T.; Corporation, M. Reaction Kinetics in Processes of Nucleation and Growth. Trans. Metall. Soc. AIME 1939, 135, 1089. [Google Scholar]
  49. Avrami, M. Kinetics of Phase Change. II Transformation-Time Relations for Random Distribution of Nuclei. J. Chem. Phys. 1940, 8, 212–224. [Google Scholar] [CrossRef]
  50. Eftekharimilani, P.; Van Der Aa, E.M.; Hermans, M.J.M.; Richardson, I.M. Microstructural characterisation of double pulse resistance spot welded advanced high strength steel. Sci. Technol. Weld. Join. 2017, 22, 545–554. [Google Scholar] [CrossRef]
  51. Hollomon, J.H.; Jaffe, L.D. Hollomon Jaffe-Time-Temp Relations in Tempering Steel. Trans. Am. Inst. Miner. Met. Eng. 1945, 162, 223–249. [Google Scholar]
  52. Shojaee, M.; Midawi, A.; Barber, B.; Ghassemi-Armaki, H.; Worswick, M.; Biro, E. Mechanical properties and failure behavior of resistance spot welded third-generation advanced high strength steels. J. Manuf. Process 2021, 65, 364–372. [Google Scholar] [CrossRef]
  53. AWS: An American National Standard, Test Methods for Evaluting the Resistance Spot Welding Behavior of Automotive Sheet Steel Materials. 2012. Available online: https://pubs.aws.org/p/1067/d89m2012-test-methods-for-evaluating-the-resistance-spot-welding-behavior-of-automotive-sheet-steel-materials (accessed on 16 October 2023).
  54. ASTM, E3-11; Standard Guide for Preparation of Metallographic Specimens 1. ASTM: West Conshohocken, PA, USA, 2011. [CrossRef]
  55. ASTM International. E384 Standard Test Method for Microindentation Hardness of Materials; ASTM International: Materials Park, OH, USA, 2017; pp. 1–40. [Google Scholar]
  56. Midawi, A.R.H.; Tolton, C.; George, R.; Subramanian, M.; Skszek, T.; Butcher, C.; Worswick, M. Hot-forming of a 980 MPa third generation advanced high strength steel. IOP Conf. Ser. Mater. Sci. Eng. 2023, 1284, 012028. [Google Scholar] [CrossRef]
  57. Krauss, G. Tempering of Lath Martensite in Low and Medium Carbon Steels: Assessment and Challenges. Steel Res. Int. 2017, 88, 1700038. [Google Scholar] [CrossRef]
  58. Hou, J.S. Resistance Spot Welding and In-Process Heat Treatment of Hot Stamped Boron Steel; University of Waterloo: Waterloo, ON, USA, 2016. [Google Scholar]
  59. Rezayat, H.; Ghassemi-Armaki, H.; Bhat, S.P.; Sriram, S.; Babu, S.S. Uncertainties in Finite Element Analysis of Yield Point Phenomena in Advanced High-Strength Steel Spot Welds. J. Mater. Eng. Perform. 2020, 29, 1272–1281. [Google Scholar] [CrossRef]
  60. Scales, M.; Kornuta, J.; Switzner, N.; Veloo, P. Automated Calculation of Strain Hardening Parameters from Tensile Stress vs. Strain Data for Low Carbon Steel Exhibiting Yield Point Elongation. Exp. Tech. 2023. Available online: https://link.springer.com/article/10.1007/s40799-023-00626-4#citeas (accessed on 16 October 2023). [CrossRef]
Figure 1. Effect of BM hardness on the degree of softening and failure mode of resistance spot welds (data from [11,18,20,23,24,27,28,29,30,31]). Note: the positive values show softening and the negative values show hardening.
Metals 13 01822 g001
Figure 2. The degree of HAZ softening in different steel alloys with respect to BM hardness data from [11,12,13,15,20,23,27,28,31,33,39].
Metals 13 01822 g002
Figure 3. Schematic diagram showing the welding schedule for each material. (Note: this graph is not to scale).
Metals 13 01822 g003
Figure 4. (a) Gleeble specimen geometry showing the placement of the thermocouple, (b) Gleeble thermal profile for 3G-980 specimen treated at 650 °C for 60 s. The time-temperature profiles show the reduction of the programed temperature as moving away from the center of the Gleeble coupons.
Metals 13 01822 g004
Figure 5. (a) thermal images showing the temperature distribution for the two coupon geometries, and (b) corresponding temperature profiles along the gauge length of each coupon geometry using a larger coupon demonstrated a significant increase in the usable gauge length.
Metals 13 01822 g005
Figure 6. Schematic show the microhardness pattern orientations.
Metals 13 01822 g006
Figure 7. Schematic showing the location of the mini-tensile coupons cut from the middle of the Gleeble processed coupon. (All dimensions in mm).
Metals 13 01822 g007
Figure 8. Hardness maps and profiles across the spot weld encompassing the hardness of all RSW sub-zones (a,c) 3G-980 spot welded joint, and (b,d) PHS1500 spot welded joints. (The dash circles show the minimum SCHAZ and the hardening of the SCHAZ).
Metals 13 01822 g008
Figure 9. The hardness changes with the Hollomon-Jaffe parameter (temperature and time): (a) 3G-980, (b) PHS-1500. Note: the dash lines show the BM and the target SCHAZ hardness.
Metals 13 01822 g009
Figure 10. Measured and predicted hardness profiles from the center of the Gleeble coupons for both materials treated at different tempering temperatures and times (a) Coupons heat treated at 650 °C for 60 s, (b) coupons heat treated at 550 °C for 5 s.
Metals 13 01822 g010
Figure 11. The variation in the hardness of Gleeble specimen (a) the predicted hardness variation within 10–20 °C of the peak temperature; (b) predicted hardness versus the Hollomon-Jaffe parameter at different peak temperatures.
Metals 13 01822 g011
Figure 12. Hardness profiles for the selected SCHAZ conditions, (a) 3G-980 simulated at 550 °C for 0.5 s, (b) PHS-1500 simulated at 550 °C for 5 s. Note: the dash lines indicate the upper and lower hardness range (±5% of the target hardness value).
Metals 13 01822 g012
Figure 13. Bar charts comparing the average hardness of the spot weld and recreated Gleeble coupons of the SCHAZ region. BM hardness are also included for reference.
Metals 13 01822 g013
Figure 14. Secondary electron micrographs showing the, the microstructures of (a) and (b) investigated BM, (c) and (d) SCHAZ of the spot weld, (e) and (f) simulated Gleeble SCHAZ for 3G-980 and PHS-1500, respectively.
Metals 13 01822 g014
Figure 15. (a) Engineering stress-strain curves for the SCHAZ and BMs. (b) The bar chart shows the ultimate tensile strength and yield strength summary.
Metals 13 01822 g015
Figure 16. (a) SCHAZ engineering stress-strain with shaded area under the curves shows the energy required to break the specimens, (b) the bar chart shows the calculated energy per unit volume for the SCHAZ.
Metals 13 01822 g016
Figure 17. SCHAZ tensile test coupons fracture surface, (a) PHS-1500 SCHAZ fracture surface, (b) 3G-980-550 SCHAZ fracture. The arrows in the high magnification SEM images highlight the location of some dimples that were formed as a result of void coalescence representing ductile failure features.
Metals 13 01822 g017
Table 1. Chemical composition for the investigated materials in Wt%.
GradeCMnSiCrBFeCeq
3G-9800.2182.111.500.0190.0006Bal.0.64
PHS-15000.2191.150.2680.180.00292Bal.0.47
Table 2. Polynomial fit parameters for the investigated materials.
MaterialPolynomial CoefficientsAdjusted R2
abcd
3G-980−9.43626 × 10−112.1303 × 10⁻⁶−1.095 × 10−22900.99947
PHS-15001.33115 × 10−10−4.6159 × 10−62.715 × 10−2493.580.99976
Disclaimer/Publisher’s Note: The statements, opinions and data contained in all publications are solely those of the individual author(s) and contributor(s) and not of MDPI and/or the editor(s). MDPI and/or the editor(s) disclaim responsibility for any injury to people or property resulting from any ideas, methods, instructions or products referred to in the content.

