Article

A Combined Numerical–Analytical Study for Notched Fatigue Crack Initiation Assessment in TRIP Steel: A Local Strain and a Fracture Mechanics Approach

by
Peter I. Christodoulou
and
Alexis T. Kermanidis
*
Laboratory of Mechanics and Strength of Materials, Department of Mechanical Engineering, University of Thessaly, 38334 Volos, Greece
*
Author to whom correspondence should be addressed.
Metals 2023, 13(10), 1652; https://doi.org/10.3390/met13101652
Submission received: 31 August 2023 / Revised: 18 September 2023 / Accepted: 23 September 2023 / Published: 27 September 2023

Abstract

:
In the fatigue design of metallic components using the safe-life approach, fatigue crack initiation as a development of slip systems at the nanoscale, followed by microstructurally short crack growth, is critical for the onset of structural failure. The development of reliable analytical tools for the prediction of crack initiation, although very complex due to the inherent multiscale fatigue damage processes involved, is important for promoting a more sophisticated design but, more importantly, enhancing the safety in regard to fatigue. The assessment of fatigue crack initiation life at the root of a V-shaped notch is performed by implementing a local strain and a fracture mechanics concept. In the low cycle fatigue analysis, the finite element method is used to determine the local stress–strain response at the notch root, which takes into account elastoplastic material behavior. Fatigue crack initiation is treated as the onset of a short corner crack by incremental damage accumulation and failure of a material element volume at the notch root. The finite element results are compared against established methodologies such as the Neuber and strain energy density methods. In the fracture mechanics approach, fatigue crack initiation is treated as the onset and propagation of a corner crack to a finite short crack. Fatigue experiments in two different transformation-induced plasticity (TRIP) steels were conducted to evaluate the analytical predictions and to determine the physical parameters for the definition of crack initiation. The analytical results show that the finite element method may be successfully implemented with existing fatigue models for a more accurate determination of the local stress–strain behavior at the notch tip in order to improve the assessment of fatigue crack initiation life compared to the established analytical methodologies.

1. Introduction

Conducting a reliable assessment of fatigue crack initiation life in structural components containing stress raisers is a critical engineering problem for material selection and design optimization against fatigue failure. Major simplifications and empirical fatigue concepts are often used to simulate the complex nature of damage processes [1], while there is no adequate and consistent validation against experimental data to ensure the reliability of analytical predictions. Hence, most methodologies rely on predictions of the total fatigue life of notched specimens [2].
A common approach in the prediction of fatigue crack initiation is the assumption of low-cycle fatigue conditions. With that approach, the notch root fatigue damage is simulated with the damage of a macroscopic specimen subjected to similar cyclic plastic straining conditions [3]. For the determination of the notch stress–strain state involving local plasticity, Neuber’s rule [4] and the strain energy density (SED) criterion [5] are the most widely used empirical models. A review of these models was performed in [6], where the elastoplastic stress–strain behavior at notch roots under monotonic and cyclic loading was examined. According to [7], the SED model is more reliable compared to Neuber’ s rule when predicting elastic–plastic notch stresses and strains. On the other hand, Sharpe et al. [8] claimed that Neuber’s rule provides better results in cases where plane stress conditions are present. They suggested that estimations using the SED criterion and Neuber’ s rule will give lower and upper limits on the local strain, which can be used to bound an uncertainty field for the life prediction. When yielding at the notch takes place, more accurate results of the local notch response may be obtained with an finite element analysis (FEA) [9].
As the fraction of fatigue life in a component is higher when the crack is short, investigating the growth of short cracks initiating from a notch from is of practical significance, especially when the crack’s length is typically small compared to the plastic zone ahead of the notch. In many design situations, Linear Elastic Fracture Mechanics (LEFM) analyses allow for a direct comparison of fatigue crack growth behavior between engineering components and laboratory specimens using the stress intensity factor range, ΔK. Although this is an accepted methodology in the case of long cracks, for short cracks, limitations of continuum mechanics lead to the underestimation of the fatigue crack growth rate [10]. The limitations in LEFM or anisotropic material behavior of microstructurally short cracks requires more complex fatigue crack growth analyses due to the length of the crack being comparable to the microstructural scale of the material (e.g., grain size) or to the plastic zone size at the crack tip. An analytical model involving crystal plasticity based on the local stored energy at the crack tip for simulating short crack growth in a polycrystalline material was presented in [11]. For physically small cracks (typically smaller than 0.5 mm) with a length exceeding the microstructural scaling, limitations may occur when the short crack is embedded within the notch plasticity [12]. To overcome this, modified LEFM concepts can be used for short cracks embedded in the inelastic field induced by the presence of the notch. Characteristic paradigms are the correlative model by Leis [12] where a correlation of LEFM concept has been proposed when the crack is completely submerged in the notch tip plastic zone and, thus, bulk plasticity conditions dominate the growth behavior; the concept of El Haddad et al. [13] which introduces a threshold crack length as minimum for applicability of LEFM; or models based on the determination of short crack growth parameters (e.g., [14]). Modified J-integral solutions for short cracks were also extended to plastically strained notches of different severities [15]. As the crack closure is another important factor resulting in the anomaly of short crack growth behavior, thus influencing the crack initiation, the effective stress intensity factor range (ΔKeff) was used by Tanaka and Nakai to correlate the early stage of fatigue crack growth rate from a notch when the crack was short, with the long crack growth rate data [16], while in [17], a plasticity corrected stress intensity factor range was implemented to determine the extent of fatigue initiated physically short cracks growth emanating from notches.
The aforementioned methods, by being macroscopic, do not account for certain microstructural influences, which control the material’s plastic deformation behavior. For instance, the phase transformation effect contributes to the plastic straining under external loading and is an important parameter of the TRIP steel behavior concerning crack initiation. From the available research findings, it was shown that the transformation of RA in front of the crack tip, inside the monotonic plastic zone [18], acts in favor of suppressing the fatigue crack initiation and/or propagation through the plastic relaxation induced by the transformation effect [19]. Although such effects are important in crack initiation analyses, the complexity of satisfactorily combining damage mechanisms at a multiscale level (atomic/microscopic and macroscopic) is high.
Despite the above complexities involved in the simulation, the main problem is the strong sensitivity of the fatigue crack initiation phase on the local stress–strain values at the notch root, specifically in the presence of local plasticity. In [20], it was shown that a strong correlation exists between the applied notch stress range and the experimental fatigue life, leading to short or long crack initiation. Finite element simulations in combination with analytical/empirical theories have provided more reliable results of the local stress–strain behavior and, hence, the crack initiation estimation. In [21], an SWT-based model was developed to predict the fatigue crack initiation of an additively manufactured notched maraging steel under bending–torsion, while in [22], a finite element model in combination with a physically based model was implemented to predict crack initiation in a stent.
The objective behind the present study was to develop a suitable numerical–analytical methodology to estimate the fatigue life for crack initiation at a V-notch under cyclic loading. The methodology effectively combines classical fatigue theory with a numerical simulation in order to accurately determine the local cyclic stress/strain state at the notch root. In the methodology, both a local strain approach and a fracture mechanics concept were investigated for estimation of crack initiation. The analysis was performed on two different TRIP steels, materials for which a similar analysis is not reported in the recent literature, and the numerical results are compared against the experimental results of fatigue crack initiation on the steels under examination.

2. Materials and Methods

2.1. Materials

The materials used in the investigation were a hot-rolled and a cold-rolled Al-containing low alloy TRIP steel, in sheet form, with the thickness and chemical composition given in Table 1.
A thorough experimental investigation, including microstructural characterization, tensile, LCF, and HCF tests, for the two steels was performed in [23], where the microstructural characteristics and static and cyclic mechanical properties were evaluated.

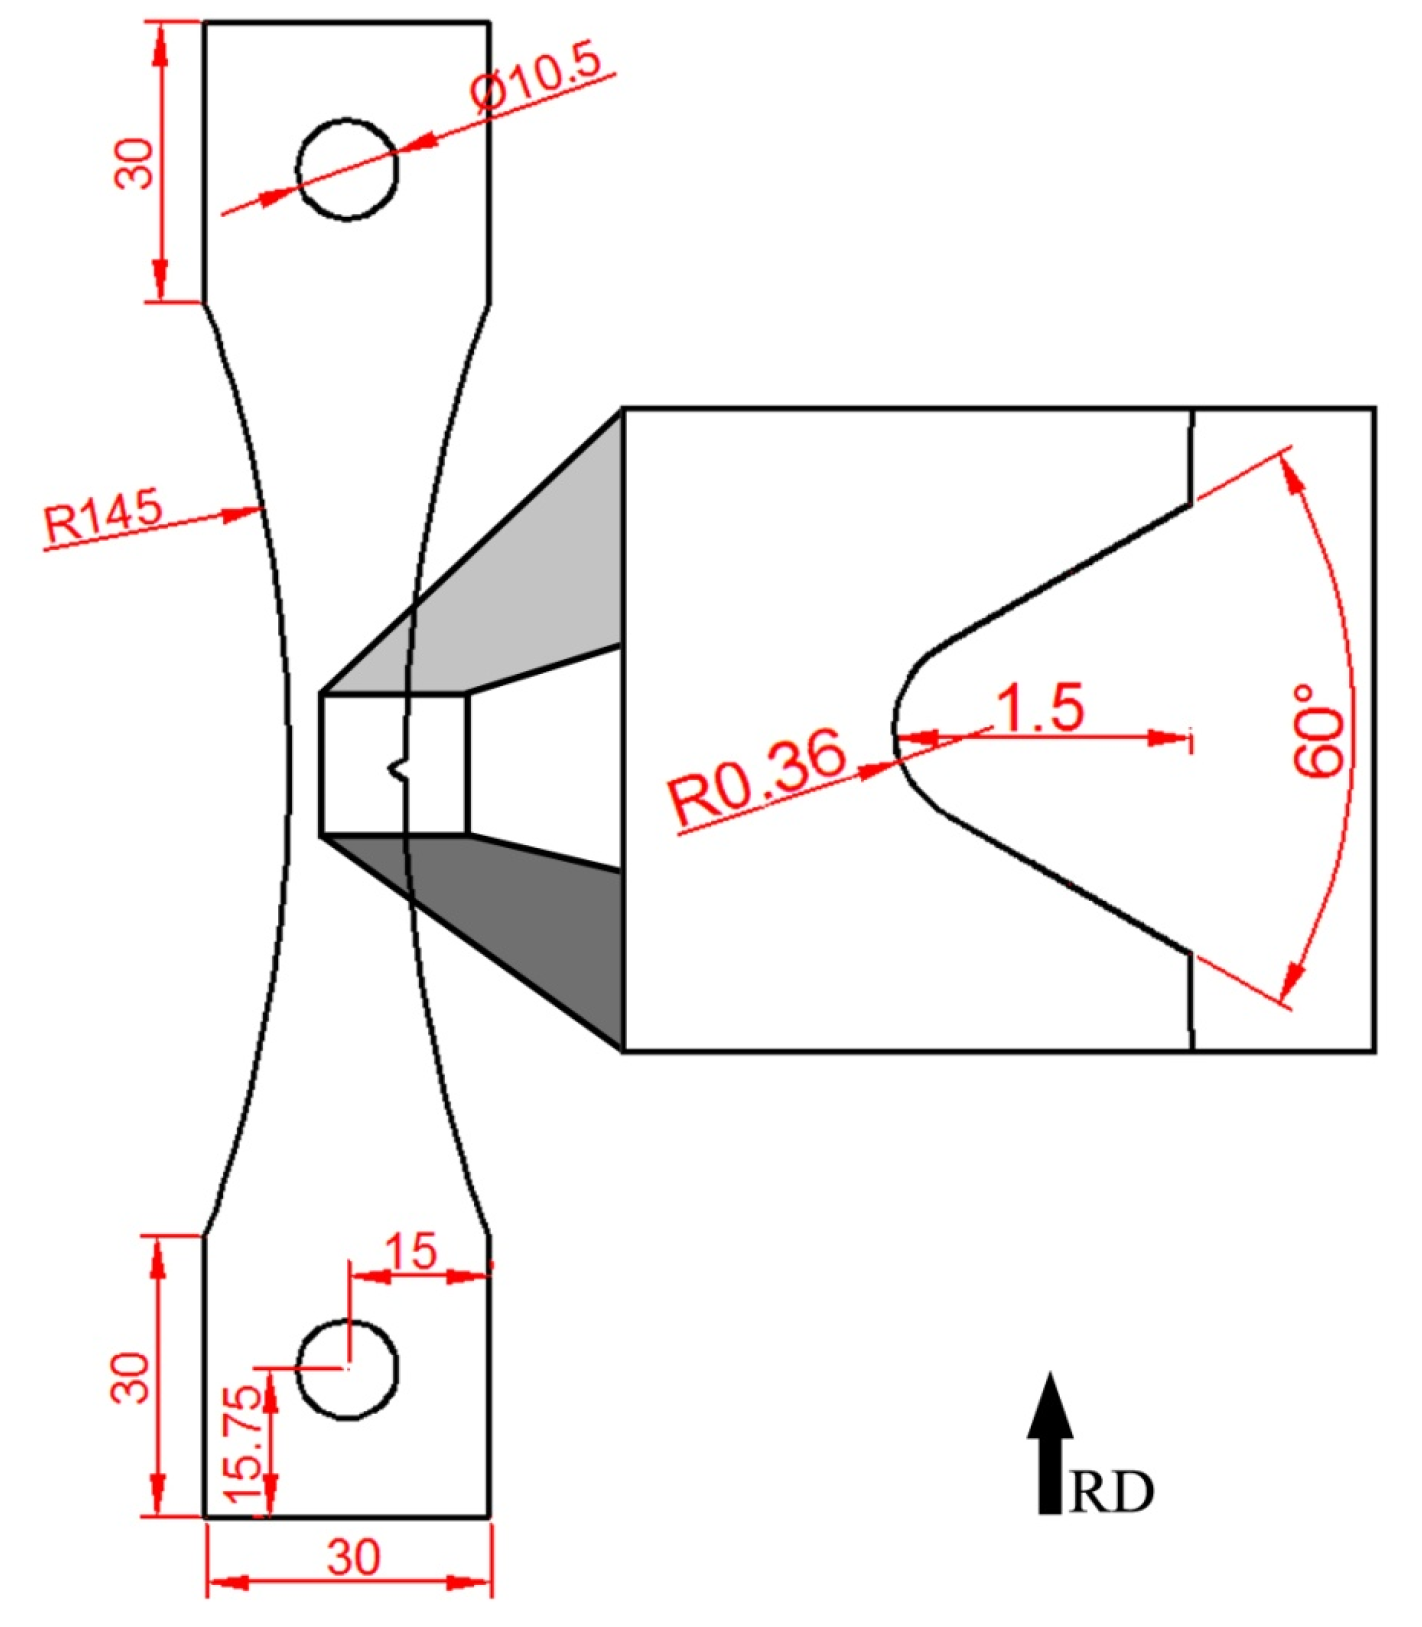
2.2. Mechanical Testing

Constant-amplitude high cycle fatigue tests were carried out using an INSTRON 8801 servo-hydraulic machine (Norwood, MA, US) with a 100 kN load capacity at σmax = 200 MPa, a stress ratio of R = 0.1, and a frequency of 25 Hz. Notched fatigue specimens with a single 60° V-shape notch were prepared according to ASTM E466, with the geometry shown in Figure 1. The notch configuration results in an elastic stress concentration factor value of Kt = 3.5, based on the Noda et al. approach [24].
The 60° V-shaped side notch was introduced in the samples by using the sinker Electrical Discharge Machining (EDM) method. The EDM method, as a non-deforming cutting process, has the advantage of avoiding any plastic deformation of the steel during the removal of material. Thus, no significant transformation effect (TRIP effect) at the notch root caused by the machining process was expected.
Fatigue crack initiation and propagation at the notch root was monitored using the replica technique. Careful preparation of the notch area was conducted in order to remove imperfections (burrs) from the machining process by grinding with fine #1000–4000# grit papers to ensure that no surface effects were induced upon crack initiation. The notched fatigue tests were interrupted at regular cycle intervals, and a small tensile load was applied to open the crack surfaces. Extreme care was taken when applying this tensile load in order not to exceed the test’s maximum force (Pmax), which could possibly introduce an overload in the loading history. Special replica foils of 0.1 mm in thickness and wetted with acetone were used to take replicas from both sides of the notch root and were examined in an optical microscope. Cyclic stressing was continued for a small interval of cycles, and the above procedure was repeated until a first crack was observed in the replica through the microscopic observation. When the first crack was observed, the procedure was continued by making the interruption intervals more frequent. The length of the fatigue crack was measured using the replica images taken from microscope and processed with image analysis software (ImageJ: Open Source, U.S. National Institutes of Health, Bethesda, MD, USA). It should be noted that a different series of fatigue crack initiation tests on the same materials were performed in [23], but, in this case, they were used to evaluate the difference in material behavior between the two steels.

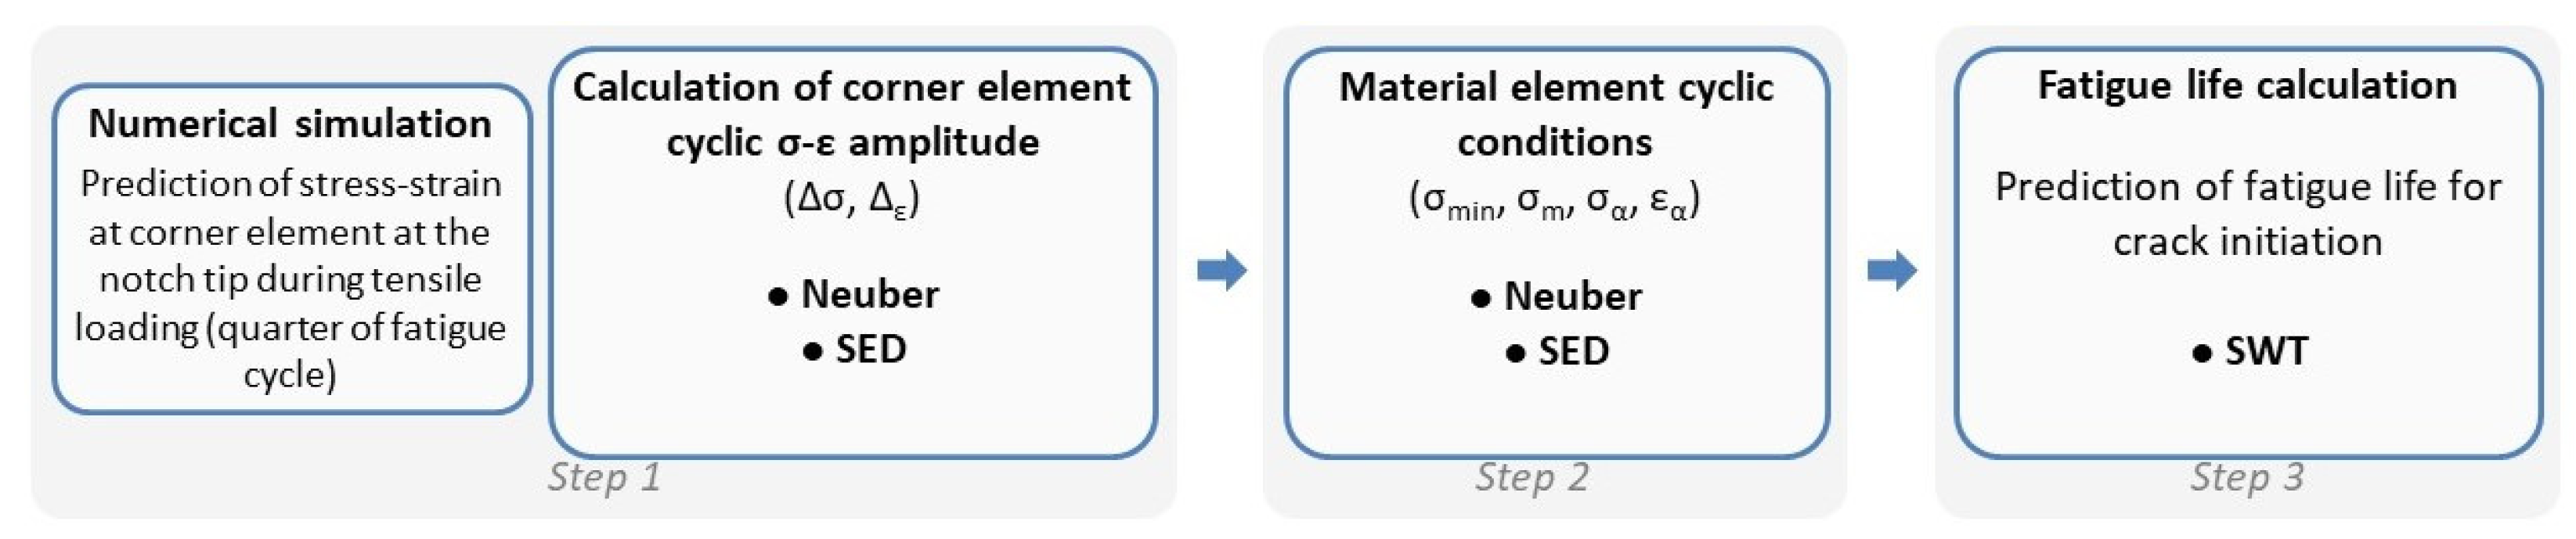
2.3. Fatigue Crack Initiation Analysis

2.3.1. Local Strain Approach

A local strain (LS) approach using the typical Neuber and strain energy density (SED) methods was implemented to relate the crack initiation life at the notch root to the crack initiation life of the smooth laboratory specimen. The principle behind the LS approach, which is depicted in Figure 2, is that a smooth specimen tested under cyclic strain control (LCF conditions) can simulate the fatigue damage at the notch root of an engineering component. An equivalent fatigue damage is assumed to occur at the notch root and in the smooth specimen when both are subjected to identical stress–strain histories (constant plastic strain range, Δεpm).
The LS approach uses the strain–life (ε-N) curve for the prediction of life cycles, and the estimation of crack initiation life is based on the criterion of the smooth specimen failure by assuming an equivalent strain state of the material volume in the notched specimen. This hypothesis contains specific shortcomings due to (i) the size effect involved, (ii) the fact that the material element volume is subjected to deformation constraints from the adjacent material, (iii) the deformation state in the material element is not strain controlled as in the case of the low cycle fatigue test. Strain triaxiality at the notch tip is not expected to be an influential factor in the fatigue behavior examined due to the selection of the corner element promoting plane stress conditions. This assumption, although introducing specific limitations in the analysis, is considered acceptable to approach this type of problem.

Assumptions

A fatigue analysis for the prediction of crack initiation life adopts certain hypotheses for simulating the involved damage mechanisms. Crack initiation at the notch tip is associated with failure of an elementary material volume (Figure 2) adjacent to the notch root. The material volume is subjected to low cycle fatigue conditions and is located at the corner of the notch tip, at the free surface of the specimen.
The criterion for selecting the specific element location and size is based on the fractographic observations that are discussed in Section 3.2. According to the experimental findings, cracks originate as corner cracks at the tip of the notch and then propagate radially before coalescence occurs into a single through-thickness crack. The assumption of the critical length of 250 μm width for the corner element satisfies the conditions of an isotropic, homogeneous medium for the implementation of fatigue life equations. That is because it significantly exceeds the material’s grain size, which, as determined from [23], is 9.47 μm. Using this concept, fatigue failure of the material element designates the initiation of a 250 μm corner crack at the tip of the notch on the outer specimen surface. Similar lengths have been observed by the experiments to lead to the transition of the initial corer crack to the through-thickness crack, as is later shown by the fractographic observations.

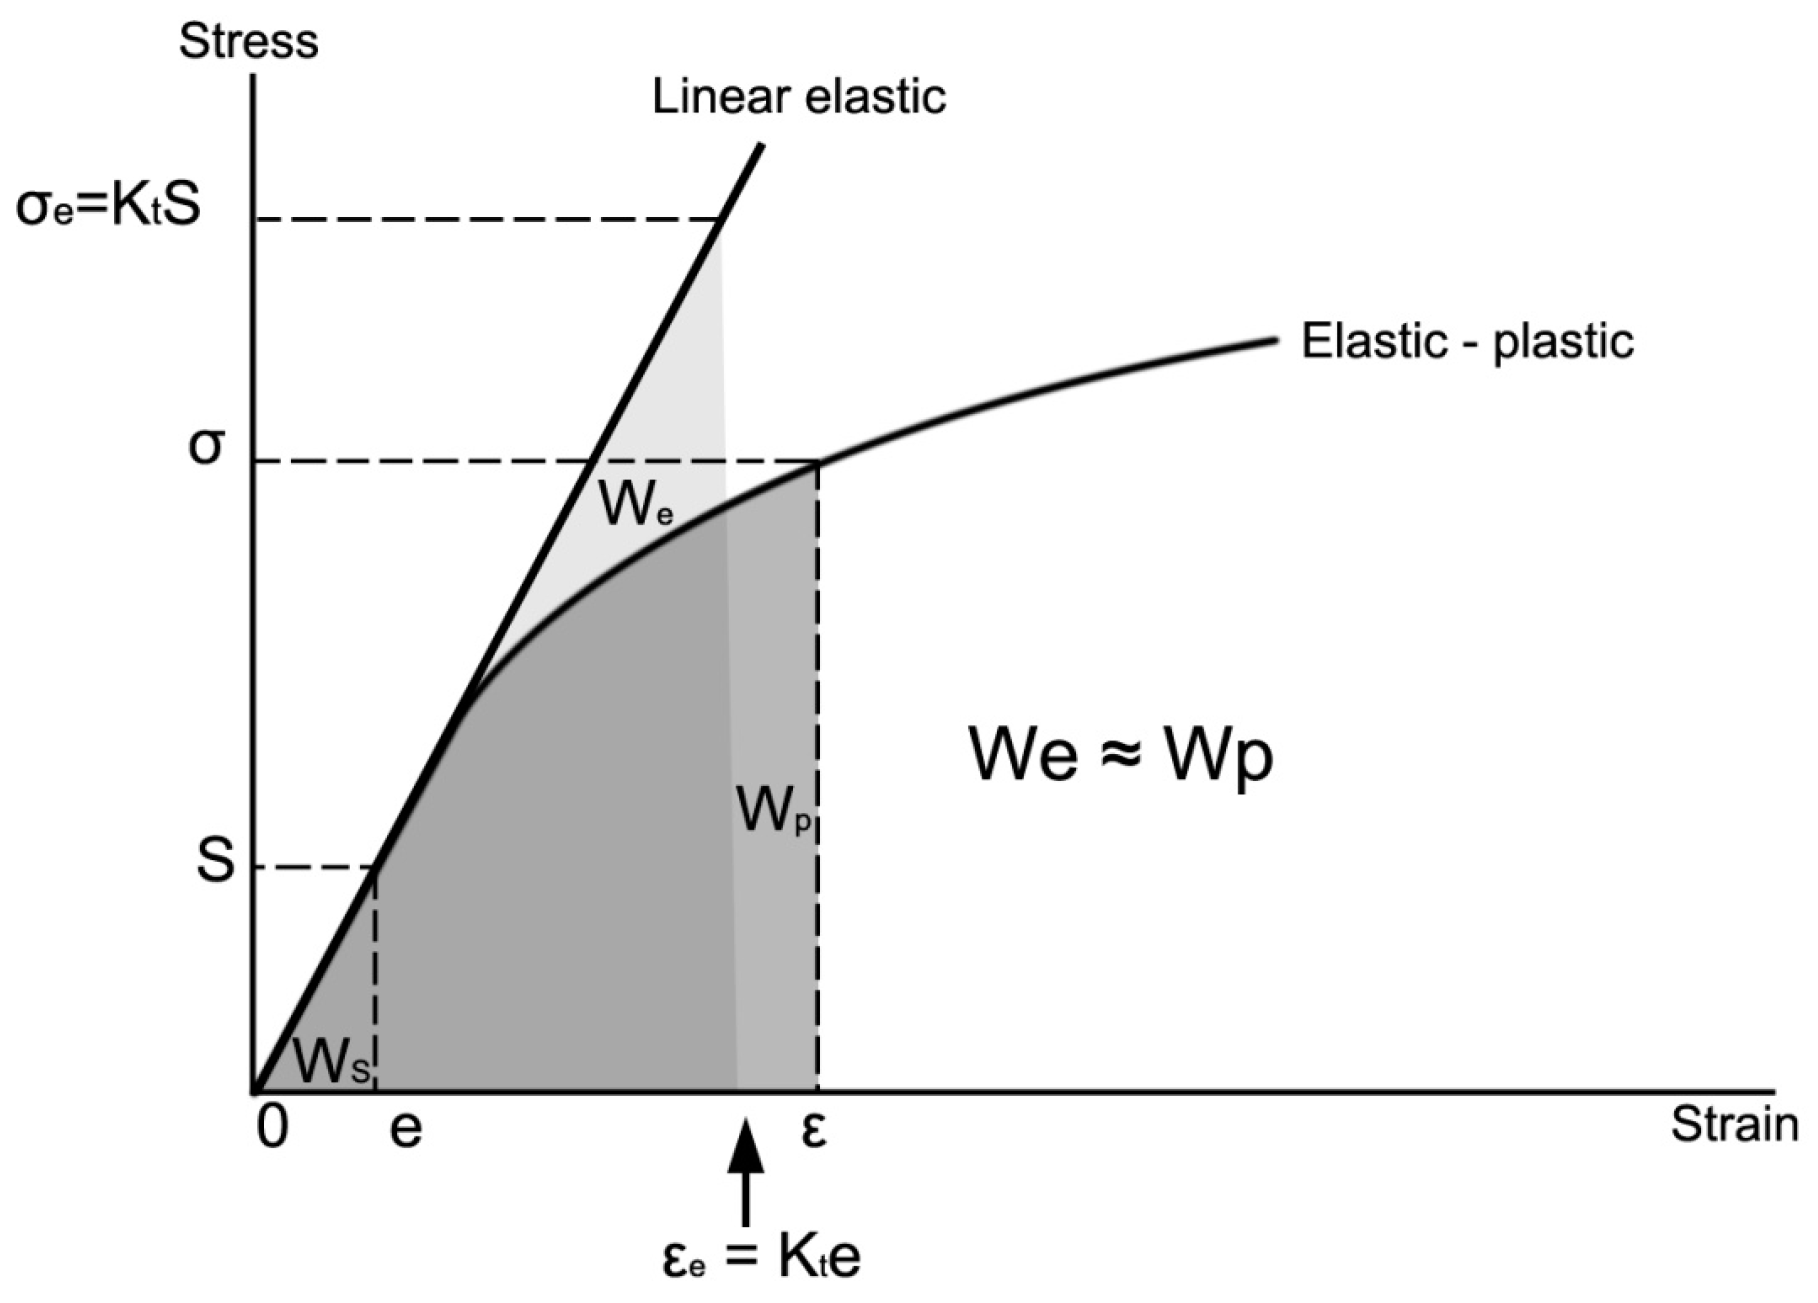
2.3.2. Analytical Methods

Neuber showed that, for a shear-strained prismatic body with an arbitrary nonlinear stress–strain law, the product of the notch stress and strain, σ and ε, can be estimated from theoretical stress concentration factor, Kt; the far-field applied stress range, S; and the elastic modulus of the material, E:
ε σ = K t S 2 E
Generally, this is rewritten in terms of stress and strain ranges for the case when the stress range remote to the notch is linear elastic:
Δ ε Δ σ = K t Δ S 2 E
Topper et al. [1] showed that smooth specimen fatigue data could be used to adequately predict the fatigue lives of notched members made from 2024 and 7075 aluminum alloys under fully reversed loading. They suggested the use of the fatigue notch factor, Kf, instead of the theoretical stress concentration factor, Kt, for cyclic loading, modifying Equations (1) and (2) as follows:
ε σ = K f S 2 E
Δ ε Δ σ = K f Δ S 2 E
Although Neuber’s rule was derived for monotonic loading, it was applied to fatigue loading by Manson and Hirschberg in [25], who suggested using the cyclic stress–strain curve (Equation (6)) instead of the monotonic curve given by the Ramberg–Osgood equation (Equation (5)):
ε = σ E + σ K 1 n
ε α = σ α E + σ α K 1 n
where K and K′ are the static and cyclic strength coefficient, n and n’ are the monotonic and cyclic strain hardening exponent, and εα and σα are the strain and stress amplitude, respectively. Thus, by simultaneously solving Equation (3) for maximum stress and strain (ε = εmax; σ = σmax) and Equation (5) for ε = εmax and σ = σmax, the notch root stress–strain at maximum loading can be estimated.
Modifying the Ramberg–Osgood relationship for cyclic loading by replacing the strain and stress amplitude with the strain and stress ranges, respectively, and assuming a Masing factor of 2 (symmetric deformation behavior in tension and compression), Equation (6) yields the following:
Δ ε = Δ σ E + 2 Δ σ 2 K 1 n
By simultaneously solving Equations (4) and (7), the cyclic notch stress and strain amplitudes can be estimated.
An alternate approximate method is the strain energy density (SED) criterion proposed by Molski and Glinka [5]. In this approach, it is assumed that the strain energy density at the notch root does not change significantly if the localized plasticity is surrounded by predominantly elastic material (Figure 3).
Based on this assumption, computation of the strain energy density at the notch root will yield identical results for either the elastic or the elastic–plastic material law. The SED criterion has the following form:
W e = W p     1 2 K t S 2 E = 0 ε σ ε d ε K t S 2 E = σ 2 E + 2 σ n + 1 σ K 1 n
where S is the gross-section nominal stress, and σ(ε) is the notch root stress as a function of ε. For a given nominal stress, S, the notch stress and strain during monotonic loading can be calculated simultaneously solving Equations (5) and (8).
With the use of Equation (5) for the maximum stress and strain (εmax and σmax) and Equation (7) for σ = σmax and S = Smax, the notch root stress–strain at maximum load can be calculated.
For cyclic loading, Equation (8) can be rewritten in terms of stress and strain ranges, while the material monotonic deformation properties (K and n) can be replaced by the cyclic deformation properties (K′ and n′), resulting in the following equation:
Δ σ 2 E + 4 Δ σ n + 1 Δ σ 2 K 1 n = K t S 2 E
By simultaneously solving Equations (5) and (9), the cyclic notch stress and strain amplitudes can be calculated.
The analytical expressions provided above consider the notch stress–strain response for completely reversed straining, R = εminmax = −1. In strain histories with a mean strain, usually mean stress relaxation occurs due to the presence of plastic deformation. To account for the mean stress effect in fatigue life prediction for the elastic strain component, the Smith–Watson and Topper parameter (SWT parameter) or the Morrow’s mean stress method is often used. The SWT parameter [26] was used in the present analysis in the strain–life equation as follows:
σ m a x ε α = σ f 2 E 2 N f 2 b + σ f ε f 2 N f b + c
where σmax = σm + σα and εα is the maximum stress and strain amplitude in the alternating strain history, σm is the mean stress, σf′, εf′, b, c are cyclic properties taken from [23] and Nf is the fatigue life. Equation (10) assumes that for different combinations of strain amplitude, εα and mean stress, σm, the product σmaxεα remains constant for a given fatigue life. If σmax is zero, then Equation (10) predicts infinite life, which implies that tensile loading must be present for fatigue fracture to occur.
Calculations of the local stress–strain history may be combined with an appropriate notched fatigue analysis in order to estimate fatigue crack initiation as the number of cycles required to initiate the crack at the location of interest (notch tip). In this approach, the calculated fatigue life is strongly dependent on the material element length and the associated strain values, which usually lack certain accuracy when elastoplastic material behavior is involved. For this purpose, a numerical analysis was performed in order to obtain a greater accuracy for strains at the position of the material element. A suitable finite element model was developed for the determination of the local maximum strains and stresses of a material element volume at the notch tip during a far-field loading. The criteria for the selection of the material volume length are analyzed in the following section. The numerical results are combined with the analytical methods of Neuber and SED and incorporated into the SWT model to obtain the critical number of cycles for fatigue crack initiation. The flowchart of the implemented methodology is presented in the diagram in Figure 4.
The monotonic and cyclic material properties, namely σy, n, K, n′, K′, σf′, b, εf′, c, and Kf, are taken from [23] and are used as input parameters in the analysis. The predicted fatigue lives in cycles for each material examined are presented in the next section.

2.4. Numerical Simulation of the Notch Stress–Strain Behavior

Finite Element Analysis

The finite element model used to obtain the representative local stress–strain behavior at the notch root was first presented in [23]. In that work, the elastoplastic stress–strain behavior of the material element was numerically simulated under an external monotonic loading using the Abaqus finite element (FE) software version 6.12-3. A maximum far-field tensile stress of 200 MPa was applied, corresponding to the quarter of a cycle in the fatigue-loading history. For the simulation, a 3D finite element model was constructed, and a step-loading analysis was performed (Figure 5).
The values of the Poisson’s ratio and Young’s Modulus used in the analysis are ν = 0.3 and E = 205.9 GPa, respectively. After yielding, nonlinear behavior is taken into account using an isotropic hardening behavior based on the calculated true stress–strain plastic curve data presented in [23]. For greater accuracy at the vicinity of the notch, a geometric nonlinearity was also taken into account.
The element width at the notch tip was set to 250 μm, which corresponds to the characteristic crack length considered for crack initiation in Section 3.1. A mesh optimization was performed in the present study by increasing the element size along with the increasing distance from the notch tip in order to reduce the computational time.
A mesh sensitivity validation was also performed with the use of finer mesh. The element width in the vicinity of the notch was reduced to 25 μm, and the monotonic simulation was repeated. The deviation of predicted notch stress–strain values with the finer mesh was lower than 4%, compared to the results of the 250 μm width. The latter findings suggest that a finer mesh will have a negligible effect on evaluation of results.

2.5. Fracture Mechanics Approach

Assumptions

In the LS approach described previously, crack initiation is considered as the onset of a 250 μm long crack due to the failure of a material volume at the notch tip, which is subjected to LCF conditions. A more detailed approach combining the LS approach with a fracture mechanics concept is attempted in this section and is presented as a case study for material (B). The fracture mechanics approach is based on the prediction of the number of cycles required for a physically short crack (not microstructurally short crack) to initiate at the root of the notch and propagate incrementally to the final length of 250 μm. It is considered that crack initiation is associated with the onset of a corner crack at the free edge of the notch (Figure 5) due to the fatigue failure of a material element at the free edge, as was experimentally observed (see Section 3.2). A more realistic approximation of fatigue crack initiation must consider that the occurring fatigue damage takes place at a smaller scale; therefore, the dimensions of the material element examined in the previous section are reduced to 50 μm × 50 μm. A simplified model is assumed, where, following the onset of crack initiation, the corner crack propagates under mode I until it reaches a final length of 250 μm. The calculation steps presented in Figure 4 are used to predict the number of cycles for failure of the corner element (crack initiation) of 50 μm. Afterwards, a fracture mechanics analysis is implemented to calculate the number of cycles for the growth of the crack until a final length of 250 μm from the notch tip (crack propagation).

3. Results

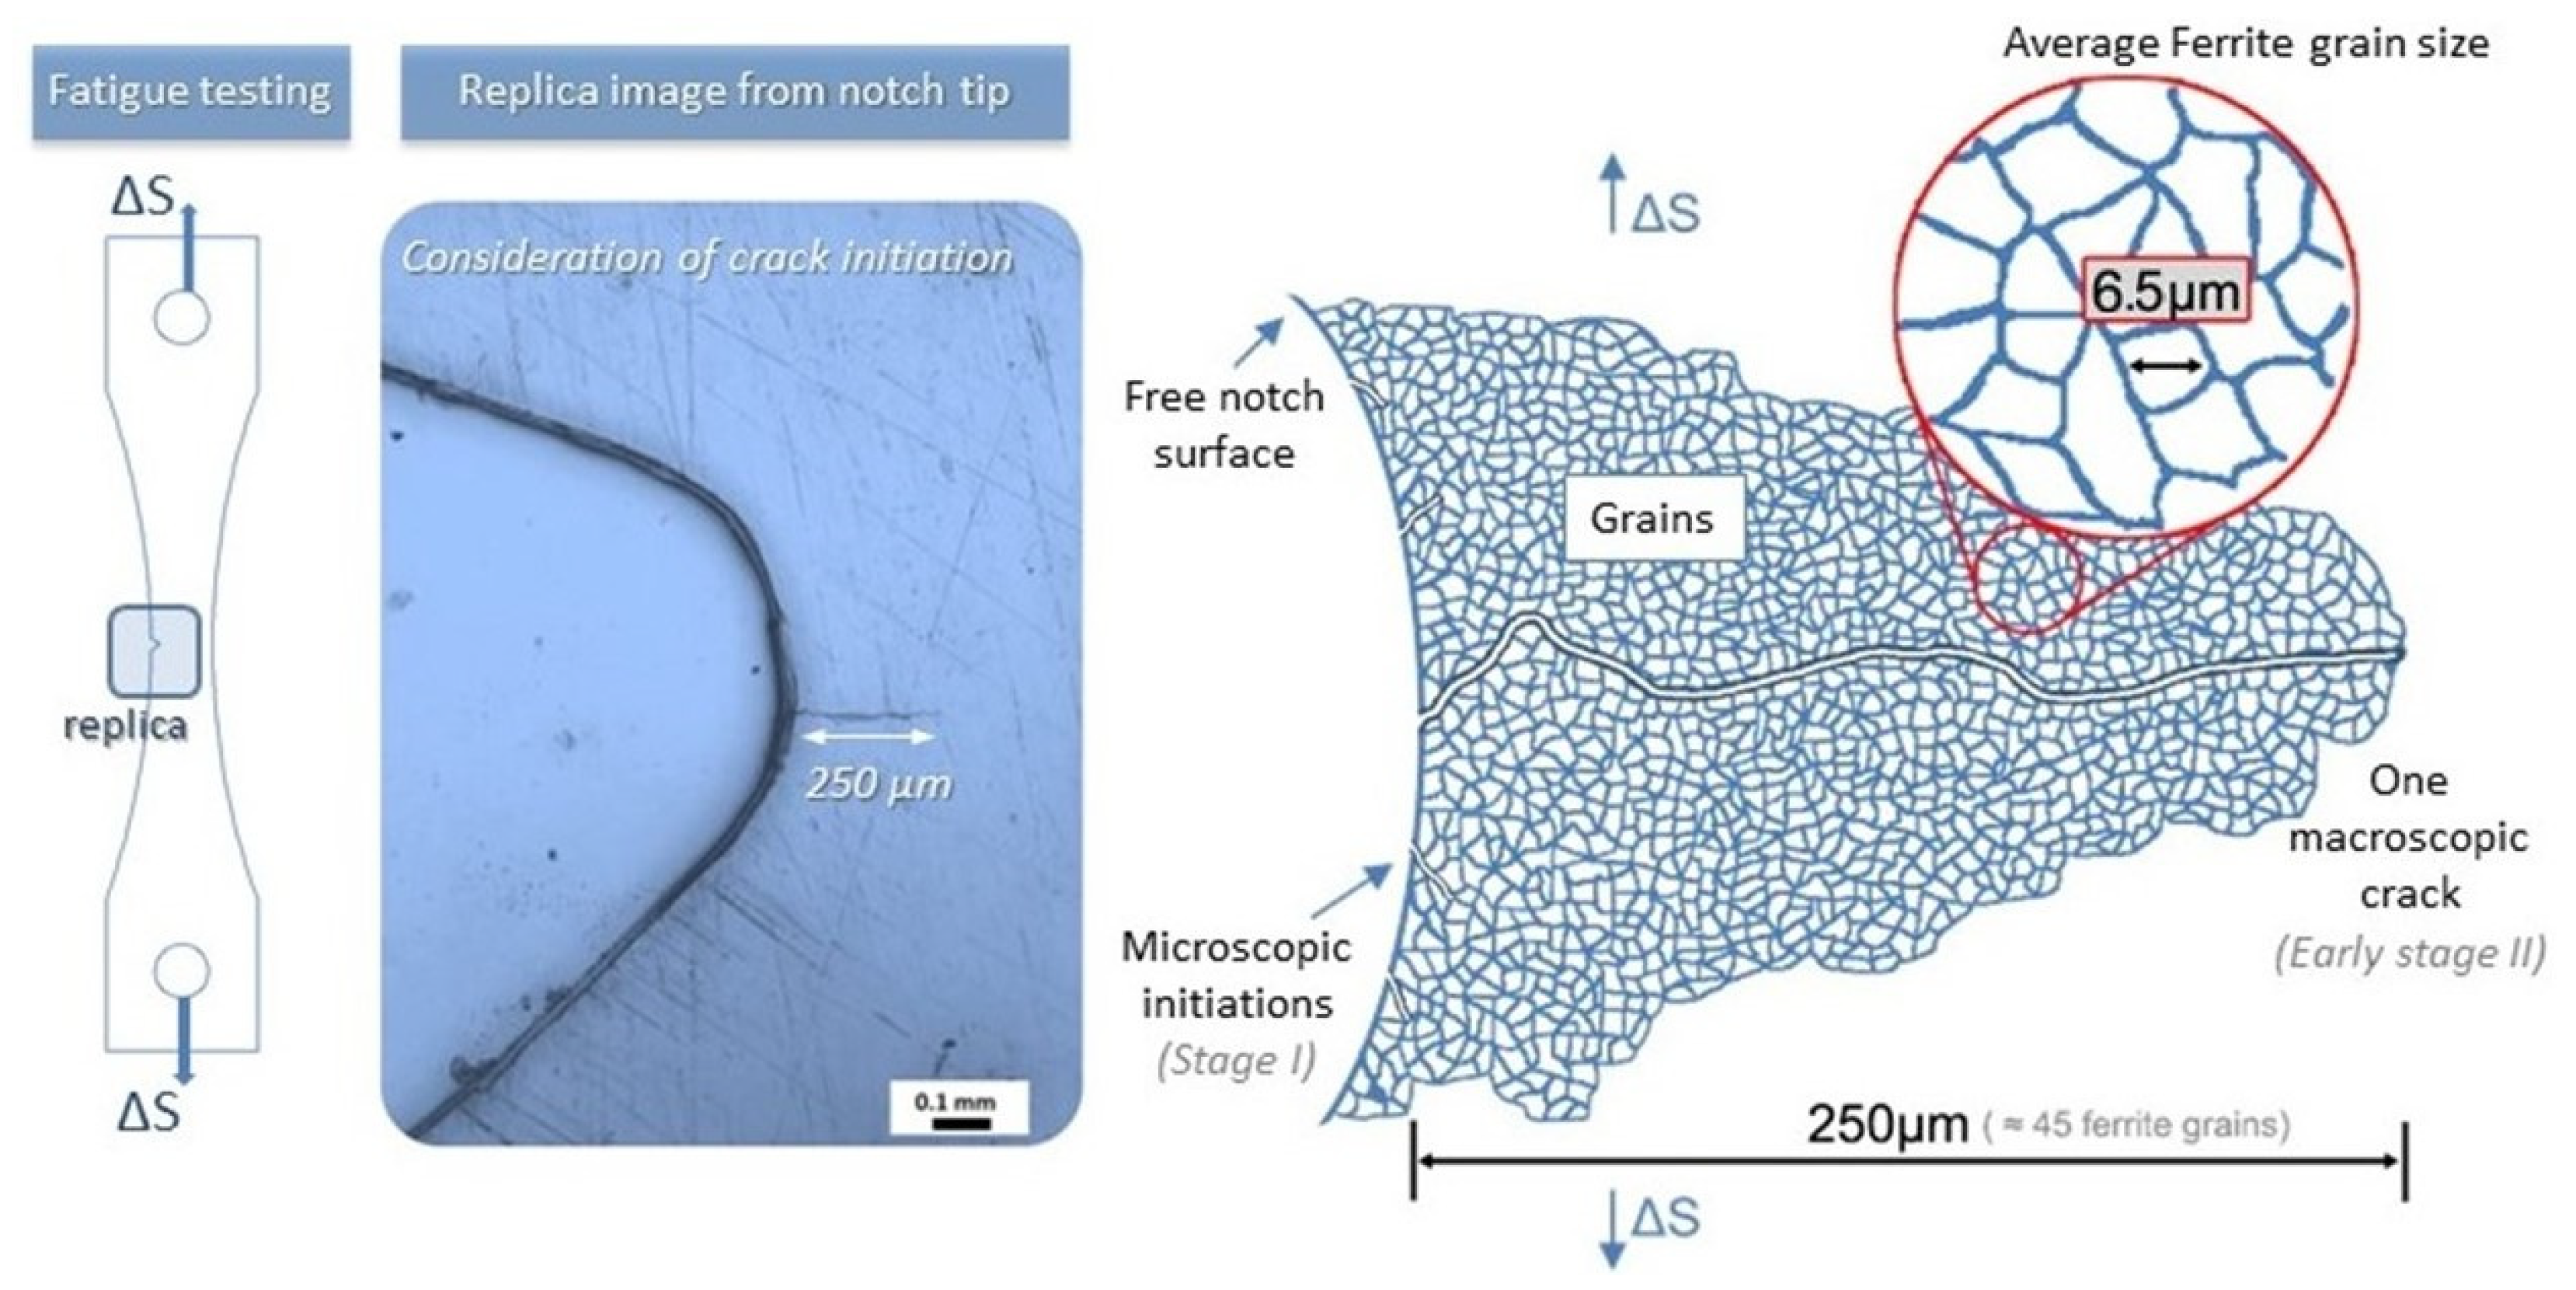
3.1. Fatigue Crack Initiation

The static and cyclic mechanical properties of the investigated materials (A) and (B), were evaluated in [23] and were used in the present study as input parameters in the proposed methodology. Fatigue crack initiation is considered to be the fatigue stage where the length of the growing crack at the notch root reaches 250 μm. With the length of 250 μm, the crack is significantly larger than the fictitious mean grain size of 6.5 μm, considering both materials A and B; therefore, the assumption of continuum mechanics is not violated (Figure 6). In [23], the average ferrite grain size was measured to be 3.62 μm and 9.47 μm for steels (A) and (B), respectively.
In the findings of Jacques et al. [27], in situ measurements of stress and strain partitioning in TRIP steels during monotonic loading revealed that a representative microstructural “element” typically involves ~100 grains, and, at that level of magnification, the average mechanical properties of the constituent phases are relevant.
The number of cycles corresponding to crack initiation life (Nini) for notched specimens is presented in Table 2 as the average number of cycles at which the first 250 μm crack at the free surface is detected. In Figure 7, the fatigue crack growth curves for materials (A) and (B) are displayed.
From the results of Table 2, it can be seen that steel (B) is the more damage tolerant material, with a fatigue life of 175,150 cycles, followed by steel (A), with 113,860 cycles before failure. Regarding the fatigue crack initiation stage, steel (B) exhibits a higher crack initiation resistance, which corresponds to a life of 108,970 cycles, while steel (A) has a crack initiation life of 66,040 cycles.
The difference in the crack initiation behavior of steels (A) and (B) is a material and microstructure-related problem, which was examined in [23] and was not the subject of investigation in the present study. The experimental results obtained here are in agreement with the fatigue crack initiation and fatigue life trends observed in [23].
In Figure 8, replica images showing the existence of cracks initiating at the notch tip are displayed for both materials for the case of a maximum stress of σmax = 200 MPa. A crack with a length of 254 μm was detected in steel (A) at 79,000 cycles, while the more damage-tolerant steel (B) showed a crack length of 233 μm at a life of 105,000 cycles (Figure 8b).
Crack initiation resistance is primarily associated with microstructural aspects controlling the start of cyclic slip or twinning mechanisms under cyclic strains, which is macroscopically associated with the materials fatigue limit [28]. In notched fatigue problems, it may also be relevant to the materials’ LCF behavior [27]. Additionally, the transformation mechanism due to the localized plastic strains at the root of the notch is also expected to have an impact on crack initiation [18,28]. For the above reasons, providing an explanation for the differences in crack initiation behavior of the TRIP steels requires a more rigorous investigation.

3.2. Fractographic Observations

Stereoscopic observations of the fracture surface of notched specimens revealed that fatigue cracks initiate at the free edge adjacent to the notch due to less constraint for the development of slip systems. The fractographic details of Figure 9 are characteristic of the majority of specimens examined. In Figure 9a, a specimen with typical fatigue segment characteristics, including the crack initiation section, fatigue crack growth regime, and fast fracture region, is shown. In the fracture surface of Figure 9b, the crack initiates at the free edge surface of the notch area and is advancing radially from the corner edge, towards the mid-thickness direction. The first crack was observed at one specimen surface, and after a certain number of cycles, a second crack on the other edge was observed, propagating through thickness and leading eventually to crack coalescence and the formation of a single through-thickness crack that propagates until the failure of the specimen. A characteristic example is shown in Figure 9b, where replica observations in steel (B), at 120,000 cycles revealed the existence of a 211 μm crack only at one side (side A) of the specimen. The above observations agree with the hypothesis used in the finite element analysis for crack initiation simulation, taking into account the corner crack element with a reference size of 250 μm at the free edge of the V-notch.

3.3. Analytical Results with LS Approach

In [23], a stepped load increment was applied up to a far-field tensile stress of 200 MPa, and the calculated stress–strain behavior of the corner element at the notch tip, as well as the distribution of normal stresses and strains in the loading direction, is reproduced and presented in Figure 10 for convenience. As shown in the results of Figure 10, local yielding at the notch tip takes place.
The maximum stresses and strains at the notch root can be calculated using the Neuber method or the SED criterion by simultaneously solving Equations (1) and (5) and Equations (5) and (8), respectively, for incremental monotonic loading.
In Figure 11, the analytical local stress–strain results obtained using the Neuber and SED method are compared with the numerical results obtained from the finite element model. By examining the results presented in Figure 11, it can be noticed that the analytical results underestimate the numerical findings. In material (A), for a maximum notch strain of 0.0034, the predicted notch stress with the Neuber or SED criterion is underestimated by 33.4% (FEA prediction = 676 MPa; Neuber/SED = 450 MPa), while for material (B), the difference is 33.5%.
As discussed earlier, Neuber’s rule may overestimate the notch root strains under multiaxial stress state conditions, while it seems to provide more reliable results for plane stress conditions. A comparison of the analytical approximations with the FE analysis showed that the Neuber method and the SED criterion provide almost identical results, which are conservative compared to the results of the FE model and, hence, may be better used as first estimations [9]. However, the underestimation of notch root strains by quite large margins was also reported elsewhere [9].

Fatigue Crack Initiation Assessment

The fatigue predictions from Table 3 are very sensitive to the calculated stress–strain history at the notch root. Small differences in notch stress–strain of the order of 5–6% may result in significant differences in the predicted fatigue life of the order of 34% in Table 3. The SED criterion predicts, in general, higher values of notch stress and strain compared to Neuber’s method, leading to more conservative fatigue life predictions. Both methods overestimate the experimental results. The plane stress conditions corresponding to the element examined in Figure 5 and Figure 10 do not seem to favor the prediction of the Neuber method here possibly due to other factors associated with the microstructure and TRIP effect. The above trend is in line with the observations presented in the literature, since Neuber’s rule considers the stress state to be uniaxial at the notch root, which leads to less conservative results.
A comparison of predictions using, in the fatigue analysis, the numerical notch stress–strain results, and the results from the Neuber or SED method are shown in Table 4, using the experimental findings as verification. The numerical results improve the fatigue analysis and bring the analytical solutions closer to the experimental results; however, a slight underestimation of the number of cycles for fatigue crack initiation is present.

3.4. Analytical Results with Fracture Mechanics Approach

3.4.1. Crack Initiation (Onset of 50 μm Crack at the Notch Tip)

A description of the finite element analysis carried out and the notch plastic zone analysis for the specimen geometry used is presented. In Figure 12a, the finite element model is presented with a finer mesh (25 μm element size) to expand the notch stress-strain analysis at a characteristic distance of 50 μm from the notch tip for a far field tensile stress of S = 200 MPa. In Figure 12b,c the distribution of local stress and strain with the distance from the notch tip for material (B) is shown. The maximum stress and strain calculated at a distance of 50 μm from the notch root are σyy = 630 MPa and εyy = 0.007128, showing a 4.5% percent increase in the maximum stress compared to the element of 250 μm. Using these values in the analytical model described in Section 2.3.2 and shown in Figure 4, the cycles for failure of the material element are 80,300 and 60,500 cycles, using the Neuber and SED criterion, respectively (Table 5).

3.4.2. Crack Propagation

In the case examined, the assumed crack length of 50 μm is significantly larger than the fictitious average grain size (6.5 μm in Figure 6), and, therefore, the problem does not fall within the microstructurally short crack regime. We considered the cyclic plastic zone at the tip of the crack based on the following analytical expression [29]:
r c y = 1 8 π Δ K σ y 0.2 2
where ΔΚ is the stress intensity factor range;  σ y 0.2  the cyclic yield strength; and the resulting plastic zone size is rcy = 17.65 μm, which is smaller compared to the considered crack length. On the other hand, the plastic zone at the notch root for a remote stress of 200 MPa is approximately 300 μm, taking into account the yield strength of 515 MPa [23] of steel (B) as and the result shown in Figure 12c, meaning that the stage of short crack propagation takes place inside the plasticity of the notch. In the work of Leis [12], a correlation of the LEFM concept was proposed for bulk plasticity conditions that dominate the growth behavior, e.g., the case of a crack completely submerged in the notch tip plastic zone. Since the notch inelastic field does not transmit the far field stress and stress cycle to the crack in the same manner as would an elastic field, it is reasonably assumed that, for a notched specimen subjected to a far field constant stress amplitude (load controlled), there is a material volume at the tip of the notch, with its deformation being displacement controlled (Figure 13).
Under this viewpoint, it is postulated by Leis [12] that the driving force for the above crack to grow in the notch inelastic field can be approximated by the following equation:
K m x = 1.12 ε m x E m π α
where “Kmx” is an equivalent stress intensity factor, εmx is the cyclically stable maximum strain in the material element at the depth of interest (in the absence of the crack), Em is the monotonic modulus, 1.12 is the free surface correction factor, and α is the length of the crack measured from the notch root. In Equation (12), the product εmx ∗ Em is primarily used to estimate a “pseudostress” in keeping with the linear elastic nature of LEFM. In [30], the application of Equation (12) in a pearlitic rail steel resulted in the accurate prediction of the cracking behavior for cracks as small as 50 μm.
Since the total fatigue crack would be fully embedded in the notch tip plastic zone propagating under LCF conditions, the parameter εmx of Equation (12) can be estimated as an average maximum strain within the length scale of 50 μm to 250 μm in Figure 12b. From Figure 12b, we can see that the average maximum strain at the ligament of 50 μm to 250 μm is εmx = 0.00417. Using Equation (12) with a maximum strain value of εmx = 0.00417, Em = 205.9 GPa, and the initial crack length based on the size of the corner element α = 0.00005 m, the calculated stress intensity factor is Kmx = 12.05 MPa√m.
The number of cycles for the crack to propagate from an initial length, αin = 50 μm, to a final length, αf = 250 μm (Figure 14), for a uniaxial; mode I problem under a stress ratio, R = 0.1; and a maximum far-field stress of σmax = 200 MPa can be calculated by integrating a Paris–Erdogan crack growth law [31]:
d α d N = C Δ K m = C Y Δ σ π α m N f = 1 C Y m Δ σ m π m 2 a f 1 m 2 a i n 1 m 2 1 m 2
In Equation (13), C and m are the Paris–Erdogan fatigue crack growth parameters; Y is the stress intensity factor correction; and af and ain are the final and initial crack length, respectively.
The parameters C = 1.81005 × 10⁻¹³ and m = 4.10051 for the steel (B) were taken from [32] and are used here under the assumption of being applicable to the short crack problem. The “pseudostress” amplitude is Δσ = 772 MPa, calculated from εmx ∗ Em for R = 0.1, and the correction factor was taken as Y = 1.12. Using the above values in Equation (13), the number of fatigue cycles for the crack to propagate to the critical length of 250 μm is 12,254 cycles. By adding the cycles calculated in Table 5 for the onset of crack initiation, we see that the total fatigue life for development of a 250 μm crack at the root of the notch is 92,554 and 72,754, with the Neuber and SED method, respectively (Table 6).

4. Discussion

Conducting a fatigue crack initiation assessment for a corner element at the notch root, taking into account that the sheet steel materials have a thickness of under 2 mm, allows for the consideration of a uniaxial loading scenario for the material element under examination. It should be noted that, in the TRIP steels examined, possible phase transformation effects [33] under cyclic loading at the notch tip, which may promote local strain hardening of the material or produce certain crack closure mechanisms, were not taken into account in the analysis. RA transformation is microstructurally accompanied by volume expansion [34] and may cause a certain stress relaxation at the tip of a stress raiser due to the elastic surrounding material, thus extending the fatigue life prior to crack initiation. Additionally, phase transformation at the crack tip has been shown to be beneficial for fatigue crack growth in numerous studies [34]. The main mechanism contributing to the retardation of crack growth is the stress relaxation imposed by the phase transformation during the volume change [34].
Furthermore, while the material element at the free edge is subjected to uniaxial loading (σx, σz = 0), as the damage progressively grows towards the mid-thickness and away from the notch influence, plane strain conditions are expected, and therefore the RA transformation rate can be influenced by the stress triaxiality. Stress triaxiality effects can influence RA transformation and, hence, the associated mechanical behavior of TRIP steels.
By comparing the results of Table 6, focusing on steel (B), it can be seen that, by using the numerical results within the fracture mechanics approach, a good correlation with experimental data is obtained, but a slight underestimation of the fatigue crack initiation life is observed compared to the analysis involving the numerical simulation with the LS approach.

5. Conclusions

A coupled numerical–analytical methodology was implemented for the assessment of fatigue crack initiation life in TRIP steel, using a V-notched specimen. Fatigue crack initiation has been defined as the number of fatigue cycles required for the development of a short fatigue corner crack with finite length based on experimental fractographic observations. Depending on the definition of the finite short crack length, the prediction of crack initiation life is very sensitive to the local stress–strain field in the close vicinity of the notch. The results indicate that incorporating the numerical solution using the finite element method may lead to a more accurate determination of the stress–strain response at the free edge, the corner location of the notch tip, with regard to using solely established empirical–analytical solutions. Experimental observations of fatigue crack initiation in two different TRIP steels confirmed that fatigue crack initiation occurs as a corner crack and develops progressively as a through-thickness crack. The analytical findings of the present study highlight the importance of the introduction of an appropriate finite element analysis in fatigue methods for a more accurate determination of the local notch stress–strain behavior and, accordingly, a more reliable assessment of fatigue crack initiation life of steel components. Furthermore, the finite element method combined with a fracture mechanics approach for the assessment of crack initiation at the notch root is a promising option to extend the analysis by also including fatigue crack growth mechanisms that may influence the rate of short crack growth, typical for the fatigue crack growth behavior in TRIP steels (e.g., phase transformation effects).

Author Contributions

P.I.C. developed the methodology of the research, carried out the experiments, and validated the results. He also set up the finite element model and produced the numerical results, performed the comparisons between experimental and analytical results, and participated in the writing and editing of the article. A.T.K. supervised the overall concept and methodology of the performed research. He worked on the analysis and discussion of results and contributed to the writing, review, and editing of the article. All authors have read and agreed to the published version of the manuscript.

Funding

This research received no external funding.

Data Availability Statement

Research data can be available upon request.

Conflicts of Interest

The authors declare no conflict of interest.

References

  1. Topper, T.; Wetzel, R.; Morrow, J. Neuber’s rule applied to fatigue of notched specimens. J. Mater. 1969, 4, 200–209. [Google Scholar]
  2. Shuai, Z.; Zhu, S.-P.; He, J.-C.; Liao, D.; Correia, J.; Macek, W.; Branco, R.; Wang, Q. Fatigue life prediction of notched components under size effect using strain energy reformulated critical distance theory. Int. J. Fatigue 2023, 175, 107805. [Google Scholar] [CrossRef]
  3. Murthy, A.R.; Vishnuvardhan, S.; Anjusha, K.V.; Gandhi, P.; Singh, P.K. Prediction of fatigue crack initiation life in SA312 Type 304LN, austenitic stainless steel straight pipes with notch. Nucl. Eng. Technol. 2022, 54, 1588–1596. [Google Scholar] [CrossRef]
  4. Neuber, H. Theory of Stress Concentration for Shear-Strained Prismatical Bodies with Arbitrary Nonlinear Stress-Strain Law. J. Appl. Mech. 1961, 28, 544–550. [Google Scholar] [CrossRef]
  5. Molski, K.; Glinka, G. A method of elastic-plastic stress and strain calculation at a notch root. Mater. Sci. Eng. 1981, 50, 93–100. [Google Scholar] [CrossRef]
  6. Fatemi, A.; Zeng, Z. Elasto-plastic stress and strain behaviour at notch roots under monotonic and cyclic loadings. J. Strain Anal. Eng. Des. 2001, 36, 287–300. [Google Scholar]
  7. Glinka, G.; Ott, W.; Nowack, H. Elastoplastic Plane Strain Analysis of Stresses and Strains at the Notch Root. J. Eng. Mater. Technol. 1988, 110, 195–204. [Google Scholar] [CrossRef]
  8. Sharpe, J.W.N.; Yang, C.H.; Tregoning, R.L. An Evaluation of the Neuber and Glinka Relations for Monotonic Loading. J. Appl. Mech. 1992, 59, S50–S56. [Google Scholar] [CrossRef]
  9. Mowbray, D.F.; McConnelee, J.E. Applications of Finite Element Stress Analysis and Stress-Strain Properties in Determining Notch Fatigue Specimen Deformation and Life. Astm. Stp. 1971, 519, 151–169. [Google Scholar]
  10. Suresh, S.; Ritchie, R.O. Propagation of short fatigue cracks. Int. Mater. Rev. 1984, 29, 445–475. [Google Scholar] [CrossRef]
  11. MacLachlan, D.W.; Karamitros, V.; Dunne, F.P. Mechanistic modelling of fatigue nucleation and short crack growth in polycrystalline alloys. J. Mech. Phys. Solids 2023, 177, 105314. [Google Scholar] [CrossRef]
  12. Leis, B.N. Displacement controlled fatigue crack growth in inelastic notch fields: Implications for short cracks. Eng. Fract. Mech. 1985, 22, 279–293. [Google Scholar] [CrossRef]
  13. El Haddad, M.H.; Smith, K.N.; Topper, T.H. A Strain Based Intensity Factor Solution for Short Fatigue Cracks Initiating from Notches. In Fracture Mechanics: Proceedings of the Eleventh National Symposium on Fracture Mechanics: Part I, ASTM STP 677; Smith, C.W., Ed.; Virginia Polytechnic Institute and State University: Blacksburg, VA, USA, 1979; pp. 274–289. [Google Scholar]
  14. Natkowski, E.; Durmaz, A.R.; Sonnweber-Ribic, P.; Münstermann, S. Fatigue lifetime prediction with a validated micromechanical short crack model for the ferritic steel EN 1.4003. Int. J. Fatigue 2021, 152, 106418. [Google Scholar] [CrossRef]
  15. Zhu, X.-K. Effects of large plastic deformation and residual stress on the path independence of J-integral for cracks in ductile materials. Eng. Fract. Mech. 2023, 277, 108945. [Google Scholar] [CrossRef]
  16. Tanaka, K.; Nakai, Y. Propagation and non-propagation of short fatigue cracks at a sharp notch. Fatigue Fract. Eng. Mater. Struct. 1983, 6, 315–327. [Google Scholar] [CrossRef]
  17. Meng, L.; Yang, M.; Chen, X.; Hu, Y.; Feng, M. Physically short fatigue crack growth from notch described by plasticity-corrected stress intensity factor. Int. J. Mech. Sci. 2020, 176, 105544. [Google Scholar] [CrossRef]
  18. Cheng, X.; Petrov, R.; Zhao, L.; Janssen, M. Fatigue crack growth in TRIP steel under positive R-ratios. Eng. Fract. Mech. 2008, 75, 739–749. [Google Scholar] [CrossRef]
  19. Nam, S.W.; Chang, Y.W.; Lee, S.B.; Kim, N.J. Fatigue Strength of Formable Ultra High-Strength TRIP-Aided Steels with Bainitic Ferrite Matrix. Key Eng. Mater. 2007, 345, 247–250. [Google Scholar]
  20. Braun, M.; Fischer, C.; Baumgartner, J.; Hecht, M.; Varfolomeev, I. Fatigue Crack Initiation and Propagation Relation of Notched Specimens with Welded Joint Characteristics. Metals 2022, 12, 615. [Google Scholar] [CrossRef]
  21. Branco, R.; Prates, P.A.; Costa, J.D.; Ferreira, J.A.M.; Capela, C.; Berto, F. Notch fatigue analysis and crack initiation life estimation of maraging steel fabricated by laser beam powder bed fusion under multiaxial loading. Int. J. Fatigue 2021, 153, 106468. [Google Scholar] [CrossRef]
  22. Dogahe, K.J.; Kurz, I.; Binkele, P.; Schmauder, S.; Mlikota, M.; Bozic, Z. Physically-based modelling of the fatigue crack initiation life of stent components under cyclic loading employing the Finite-Element-Method (FEM). Int. J. Fatigue 2023, 171, 107594. [Google Scholar] [CrossRef]
  23. Christodoulou, P.I.; Kermanidis, A.T.; Krizan, D. Fatigue behavior and retained austenite transformation of Al-containing TRIP steels. Int. J. Fatigue 2016, 91, 220–231. [Google Scholar] [CrossRef]
  24. Noda, N.A.; Nisitani, H. Stress concentration of a strip with a single edge notch. Eng. Fract. Mech. 1987, 28, 223–238. [Google Scholar]
  25. Manson, S.; Hirschberg, M. Crack initiation and propagation in notched fatigue specimens. In Proceedings of the First International Conference on Fracture, Sendai, Japan, 12–17 September 1966. [Google Scholar]
  26. Smith, K.N.; Watson, P.; Topper, T.H. A stress-strain function for the fatigue of metals. J. Mater. 1970, 4, 767–778. [Google Scholar]
  27. Jacques, P.J.; Furnémont, Q.; Lani, F.; Pardoen, T.; Delannay, F. Multiscale mechanics of TRIP-assisted multiphase steels: I. Characterization and mechanical testing. Acta Mater. 2007, 55, 3681–3693. [Google Scholar] [CrossRef]
  28. Wang, K.; Song, K.; Xin, R.; Zhao, L.; Xu, L. Cyclic microstructure analysis, crack propagation and life prediction of Inconel 750H considering the slip fracture energy. Int. J. Plast. 2023, 167, 103660. [Google Scholar] [CrossRef]
  29. Dugdale, D.S. Yielding of steel sheets containing slits. J. Mech. Phys. Solids 1960, 8, 100–104. [Google Scholar] [CrossRef]
  30. Leis, B.N. Microcrack initiation and growth in a pearlitic steel–Experiment and analysis. In Proceedings of the 15th National Fracture Symposium, College Park, MD, USA, 7–9 July 1982. [Google Scholar]
  31. Paris, P.; Erdogan, F. A critical analysis of crack propagation laws. J. Fluids Eng. 1963, 85, 528–533. [Google Scholar] [CrossRef]
  32. Gonidakis, S. The Effect of Heat Treatment Procedure in Fracture Behavior of Aluminum Containing TRIP Steel. Master’s Thesis, Department of Mechanical Engineering, University of Thessaly, Volos, Greece, 2017. [Google Scholar]
  33. Gui, Y.; An, D.; Han, F.; Lu, X.; Kang, G.; Zhang, X. Multiple-mechanism and microstructure-based crystal plasticity modeling for cyclic shear deformation of TRIP steel. Int. J. Mech. Sci. 2022, 222, 107269. [Google Scholar] [CrossRef]
  34. Olson, G.B. Transformation Plasticity and Toughening. Le J. De Phys. IV 1996, 6, C1-407–C1-418. [Google Scholar] [CrossRef]
Figure 1. Geometry of fatigue test specimen and detail of V-notch (dimensions in mm).
Metals 13 01652 g001
Figure 2. LS approach showing material element ahead of the notch tip subjected to LCF conditions.
Metals 13 01652 g002
Figure 3. Graphical representation of the SED criterion.
Metals 13 01652 g003
Figure 4. Flowchart of the steps used in the fatigue analysis for the prediction of fatigue life corresponding to crack initiation.
Metals 13 01652 g004
Figure 5. Finite element model to simulate the notch stress–strain behavior, showing corner element and meshing at the vicinity of the notch.
Metals 13 01652 g005
Figure 6. Schematic representation of stages I (shear mode) and II (tensile mode) considered in the present study for the assumption of crack initiation.
Metals 13 01652 g006
Figure 7. Fatigue crack growth curves of the examined TRIP steels (σmax = 200 MPa).
Metals 13 01652 g007
Figure 8. Replica images from notch tip at (a) 79,000 cycles for steel (A) and (b) 105,000 cycles for steel (B). Loading axis is in the horizontal direction.
Metals 13 01652 g008
Figure 9. (a) Stereoscopic image from fracture surface of notched steel (A) (Nf = 122,420 cycles at σmax = 200 MPa; the 250 μm crack detected at 87,700 cycles). (b) Lateral replica images in steel (B) at 110,000 cycles showing the onset of an edge surface crack (Nf = 188,800 cycles at σmax = 200 MPa).
Metals 13 01652 g009
Figure 10. Normal stress and strain distribution at the vicinity of the notch for (a) steel (A) and (b) steel (B) (taken from [23]).
Metals 13 01652 g010
Figure 11. Notch root strains from FEA, Neuber’s rule, and SED criterion under monotonic tensile loading for (a) material (A) and (b) material (B).
Metals 13 01652 g011
Figure 12. (a) Normal strain distribution in material (B) with finer mesh (25 μm element size), (b) maximum strain, and (c) maximum stress distribution vs. distance from notch tip for a remote stress of 200 MPa.
Metals 13 01652 g012
Figure 13. Displacement control of crack contained within notch plastic zone.
Metals 13 01652 g013
Figure 14. Initial and final crack length for the growth of the short crack.
Metals 13 01652 g014
Table 1. State and chemical composition (wt.%) of TRIP steels.
SteelConditionThickness
(mm)
CMnAlSiP
(A)Hot rolled1.750.181.611.450.7-
(B)Cold-rolled1.450.2021.991.070.350.009
Table 2. Fatigue crack initiation with EDM method (σmax = 200 MPa).
SteelNf (Cycles)Nini (Cycles)
(A)87,300113,86053,08066,040
140,42079,000
(B)168,860175,150106,060108,970
181,450111,870
Table 3. Estimated fatigue life for the formation of a 250 μm crack using FEA results.
(A)(B)
NeuberSEDNeuberSED
Notch stress amplitude, σα (MPa) a290312.5275.5285
Notch strain amplitude, εα a0.001410.001530.001490.00156
Notch mean stress, σm (MPa)385.7363.2327.4317.9
Numerical solution of maximum notch stress (FE), σmax (MPa) 676676603603
Product of εασmax0.95251.03110.89640.9417
Estimated fatigue life, Nf (cycles) b53,80037,890104,50077,500
a Calculated with Equations (4) and (7) for Neuber and Equations (7) and (9) for SED criterion. b Solved with Equation (10).
Table 4. Comparison of estimated fatigue life for crack initiation with experimental data.
(A)(B)
MethodNeuberSEDNeuberSED
Estimated fatigue life without FE calculations, Nf (cycles) a180,000130,000650,000560,000
Estimated fatigue life with FE calculations, Nf (cycles)53,80037,890104,50077,500
Experimental investigation, Nini (cycles)66,040 108,970
a Calculated with Equations (3), (5) and (8) implemented in Equation (10).
Table 5. Estimated fatigue life considering onset for crack initiation at 50 μm for steel (B).
MethodNeuberSED
Estimated fatigue life with FE calculations, Nf (cycles)80,30060,500
Table 6. Predicted fatigue life for the formation of a 250 μm crack in material (B).
MethodNeuberSED
Predicted Fatigue Life with FE Calculations, for Failure of a 50 μm Element, Nini (Cycles)80,30060,500
Crack advancement from 50 μm to 250 μm, Nprop (cycles)12,254
Total fatigue life, Nf (cycles)92,55472,754
Experimental investigation, Nini (cycles)108,970
Disclaimer/Publisher’s Note: The statements, opinions and data contained in all publications are solely those of the individual author(s) and contributor(s) and not of MDPI and/or the editor(s). MDPI and/or the editor(s) disclaim responsibility for any injury to people or property resulting from any ideas, methods, instructions or products referred to in the content.

