Article

Microstructural Characterization of Spheroidal Graphite Irons: A Study of the Effect of Preconditioning Treatment

1
Department of Metallurgical and Materials Engineering (DEMM), University of Porto, R. Dr. Roberto Frias, 4200-465 Porto, Portugal
2
LAETA/INEGI, Institute of Science and Innovation in Mechanical and Industrial Engineering, R. Dr. Roberto Frias, 4200-465 Porto, Portugal
3
Innovation Department, Elkem Silicon Products (ESP), Fiskåveien 100, 4621 Kristiansand, Norway
4
Department of Physics, Norwegian University of Science and Technology (NTNU), Høgskoleringen 5, 7491 Trondheim, Norway
*
Authors to whom correspondence should be addressed.
Metals 2023, 13(1), 5; https://doi.org/10.3390/met13010005
Submission received: 7 November 2022 / Revised: 9 December 2022 / Accepted: 16 December 2022 / Published: 20 December 2022
(This article belongs to the Special Issue Advanced Techniques for Metallurgical Characterization)

Abstract

:
The effect of preconditioning treatments on the control and improvement of spheroidal graphite iron (SGI) microstructure was evaluated. In the melt, 0.15% of Zr-(Ca, Al) FeSi preconditioner was added into different conditions. Four samples were produced for this investigation: (1) in the first melt, there was no addition of a preconditioner for comparative purposes; (2) in the second melt, the preconditioner was added at the cold charge; (3) in the third melt, the preconditioner was added before the last cold charge; and (4) in the fourth melt, the preconditioner was added at tapping from the furnace. Microstructural characterization was conducted to understand the effect of the treatment on the SGI. Optical microscopy results show that preconditioning treatment increases graphite’s nodule density, ferrite content, and nodularity. Scanning electron microscopy (SEM), energy dispersive energy (EDS), and electron backscatter diffraction (EBSD) analysis were used to identify the types of microparticles present in the graphite nodules. Some complex microparticles were identified as AlMg2.5Si2.5N6, MgS, and CaS. The microstructural characteristics of the matrix, such as grain size, crystallographic orientation, and misorientation, were also evaluated by the EBSD. The addition of the preconditioning at tapping results in a higher ferrite fraction, smaller grain size, misorientation, and hardness values. This work suggests that the different preconditioning practice has a crucial effect on the microstructural characteristics of the SGI. This knowledge is vital, allowing the microstructure tailoring to enhance the mechanical properties of SGI to obtain the best performance of these materials.

1. Introduction

Spheroidal graphite iron (SGI) is widely used in various industries, such as automotive, sanitation water systems, and wind turbine structures, as it exhibits several advantages, such as it can be twisted, bent, or deformed without fracturing, due to its high-yield strength and fracture toughness with greater elongation when compared to lamellar cast iron [1,2]. In fact, a global iron casting growth rate of 6.4% is expected by 2030 [2]. For this reason, any optimization of resources that might improve the production route will have a vast economic and environmental impact.
In cast iron, carbon precipitates as graphite, and in spheroidal graphite irons, the preferred form of graphite is in the form of spheroids. However, this process will be affected by the nature and treatment given to the melt, such as its graphitization potential, preconditioning, nodularization, inoculation treatment, and cooling rate [3].
During the production of spheroidal graphite iron, many microparticles are formed, and some of them can be nuclei for graphite. However, the nucleation formation of graphite still needs to be better understood. Several authors reported the nature of graphite nucleation. Skaland et al. [4] proposed that a hexagonal double-layer silicate formed during inoculation on Mg-bearing microparticles is the actual substrate for graphite. Other proposals made by Igarashi et al. [5], and Qing et al. [6], suggest that the nuclei are composed of a multiphase particle with a MgO core enveloped by MgS and by a complex nitride (Mg, Si, Al)N. Laffont et al. also reported a similar complex nucleus [7].
These nitrides were also reported and identified by transmission electron microscopy (TEM) in SGI by Solberg and Onsøien [8]. The authors identified the Mg2.5AlSi2.5N6, which can also be written as the stoichiometric compound (AlN)6(Mg3N2)5(Si3N4)5 as nuclei for graphite. In addition, TiC, (Ti, Zr)-CN, and MgSiN2 have also been reported to be nuclei of graphite nodules by Alonso et al. [9,10].
It is known that the particles generated during the MgFeSi treatment and inoculation play an essential role in the nucleation level of a cast iron melt. However, during liquid melt processing, using poor-quality raw materials, such as contaminated steel scrap, cheaper galvanized steel scrap, or synthetic pig iron [11], excessive superheating or prolonged holding times can deteriorate the nucleation level of graphite to the point that usual alloy additions do not work correctly. In this context, preconditioner alloys have been developed to increase the reaction to alloy addition, such as MgFeSi treatment in SGI and inoculation [11,12]. It is well known that preconditioners are a cheap way to make the production process less dependent on the melting history [11,12].
Recent publications [13,14,15] have shown that efficient preconditioning influences the microstructure of SGI by increasing the volumetric nodule density of graphite and nodularity. Preconditioning also produces a more uniform size distribution of the graphite particles and decreases the chill solidification [11,14].
Microstructural characterization of cast iron is essential to select the preconditioning treatment that will influence the graphite shape and distribution, metal matrix microstructure, casting processing, and cooling condition.
This work aimed to study the effect of the time of addition of 0.15% of Zr-(Ca, Al) FeSi preconditioner on the nucleation of graphite in SGI microstructure. Different treatments were performed, and four melts were produced for this investigation: (1) in the first melt, there is no addition of a preconditioner for comparison purposes; (2) in the second melt, the preconditioner was added at the charge; (3) in the third melt, the preconditioner was added before the last cold charge; and (4) in the fourth melt, the preconditioner was added at tapping from the furnace to the treatment ladle. Microstructural and mechanical characterization was conducted to evaluate the effect of the different treatments in the SGI.

2. Materials and Methods

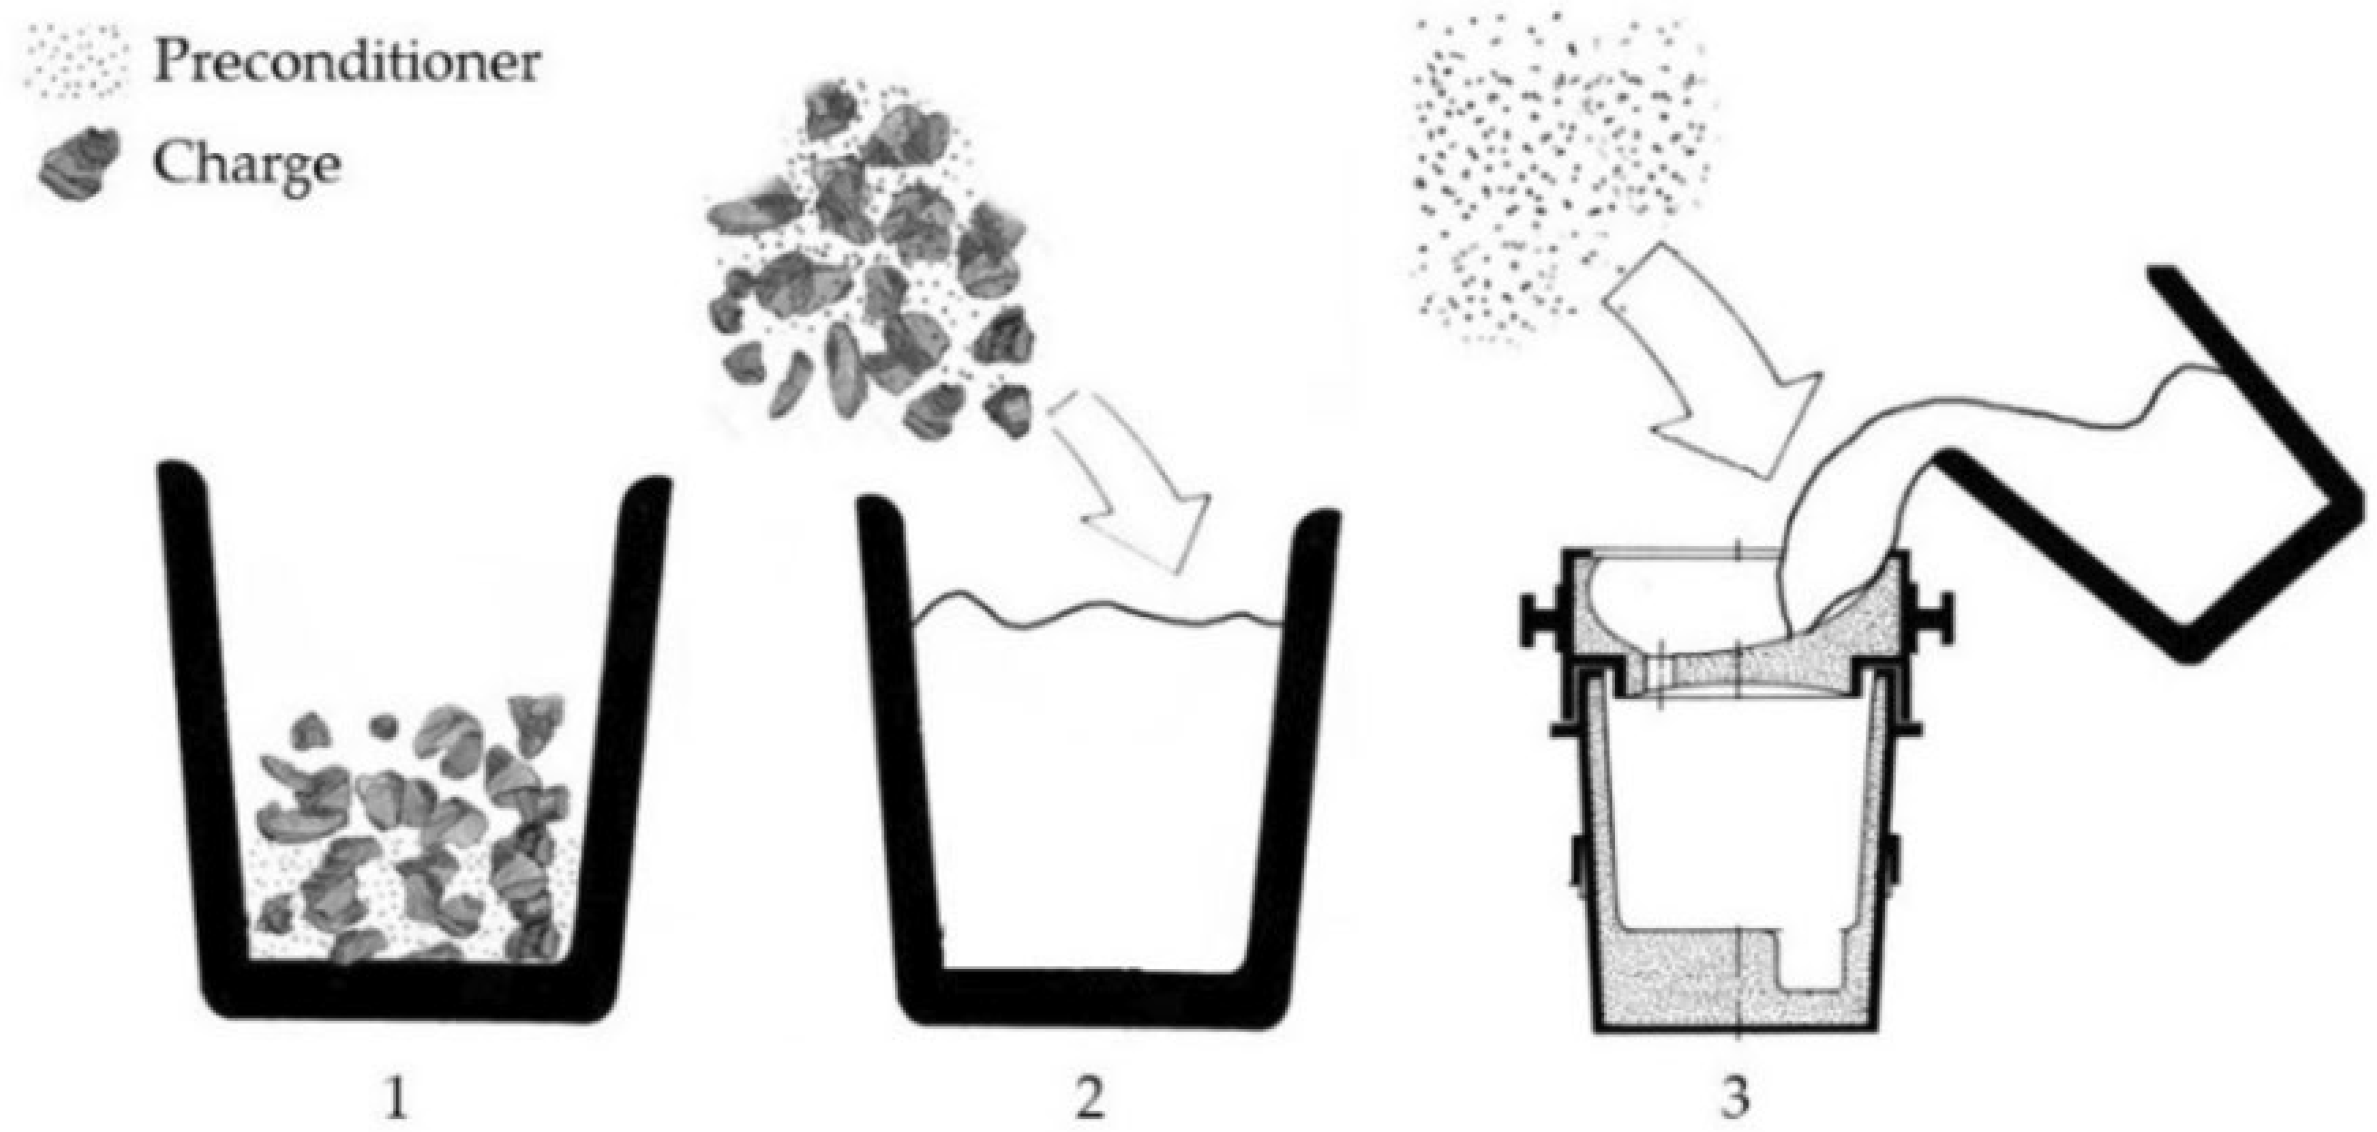
2.1. Molten Metal Processing

All melts were preconditioned using 0.15% of Zr-(Ca, Al)-FeSi, treated with 1.1% of MgFeSi, rare earth free, and size range between 1 and 10 mm; no inoculation was made on these melts. The chemical composition of the treatment alloys can be seen in Table 1.
Alloying element corrections were made by adding high-purity graphite (99.9% C), FeMn (75% Mn), FeS, and Si-metal to the induction furnace. Different treatments were performed to identify the effect of the point at which the preconditioning should be added to improve graphite nucleation (density, nodularity, and size distribution). For this purpose, four melts were produced with 275 kg of low alloyed cast iron returns: (1) in the first melt, there is no addition of a preconditioner for comparison purposes (no preconditioning—noPUn); (2) in the second melt, the preconditioner was added at the charge (charge preconditioning—CPUn); (3) in the third melt, the preconditioner was added before the last cold charge (last cold charge preconditioning—LCPUn); and (4) in the fourth melt, the preconditioner was added at tapping, before MgFeSi treatment (tapping preconditioning—TPUn), according to Figure 1 and summarized in Table 2.
The particle size of preconditioners varies depending on the time of their addition. For the CPUn and LCPUn, the grain size of the preconditioner was 0–10 mm, to allow a slow dissolution of the preconditioner, avoiding the fading of the preconditioner effect. In TPUn, the dissolution must occur in a short time. Therefore, smaller grain sizes of 0.7–2 mm were used.
The bulk chemical composition of each sample was obtained by analyzing the chill coins in a spark optical emission spectrometer (ARL ispark 8860, (Thermo Fisher Scientific, Hillsboro, OR, USA)). To determine the bulk concentration of O, N, and C more accurately, a part of the chill coins was also analyzed using combustion techniques. A LECO ON836 (LECO, Geleen, The Netherlands) was employed for N and O, and a LECO ON844 was employed for C. The treated iron was held for 1 min before being poured into the horizontal tensile bars (cylinders of 30 mm diameter) at a temperature of 1385 °C. The final chemical composition of each sample is given in Table 3.

2.2. Optical Microscopy Characterization

Optical microscopy (OM) was performed to evaluate the effect of the preconditioning treatment on the morphology, size, and distribution of graphite.
The 30 mm diameter bars were used, and conventional metallurgical preparation techniques prepared the samples. The etching was performed with Nital 2%. Microstructural characterization was performed in an OM using DM4000 equipment (Leica Microsystems, Wetzlar, Germany), and the image analysis quantification was done through the Leica Application Suite software (Leica Microsystems, Wetzlar, Germany). This image quantification analysis was conducted to evaluate the nodule count or nodule density (Graphite Min Length < 5 µm), nodule size, spheroidal graphite morphology, and phase quantifications on an area of 7.4 mm2.
To evaluate the effect of preconditioning on graphite nodules and matrix grain sizes, the values were adjusted to one or more log-normal or gaussian distributions according to Equations (1) and (2), respectively [16,17].
y 1 = n m a x σ 2 π exp 1 2 ( ln x ln μ o   σ ) 2
y 2 = n m a x σ 2 π exp 1 2 ( x μ o σ ) 2
where y1 is the standard log-normal distribution, y2 is a standard Gaussian distribution, x is the value (diameter or grain size) measure, nmax is the maximum number density, μo is the mean value, and σ is the standard deviation.
The ISO-945 standard was used to characterize the graphite morphology, classifying the graphite particles into six different classes. Classes V and VI are indistinct nodular graphite and regular nodular graphite. In spheroidal graphite iron, a class with a regular nodular shape is more desirable because it enormously increases the mechanical properties [18,19].

2.3. SEM/EDS/EBSD Characterization

The microstructural characterization to evaluate the matrix and the microparticles in the graphite nodules was performed by SEM. The sample preparation for this characterization was done through the conventional metallographic preparation, finishing with colloidal silica (0.05 µm) for 1 h for each sample.
The elemental chemical composition of the microparticles was initially determined by energy-scattering X-ray spectroscopy (EDS). SEM and EDS characterizations were performed by environmental scanning electron microscope (ESEM), a high-resolution Thermo Fisher Scientific QUANTA 400 FEG SEM (Thermo Fisher Scientific, Hillsboro, OR, USA) coupled with an EDS (EDAX Genesis X4M, EDAX Inc. (Ametek, Mahwah, NJ, USA).
The standardless quantification method made EDS measurements at an accelerating voltage of 15 keV. The results obtained by this method provide a fast quantification with automatic background subtraction, matrix correction, and normalization to 100% for all the elements in the peak identification list. It analyzed the main elements in the graphite nuclei and estimated the type of compounds that can act as nuclei for graphite. Note that all chemical compositions of the microparticles will be expressed in at%.
The phase identification was also performed using the Kikuchi patterns obtained by Electron Backscatter Diffraction (EBSD ((EDAX Inc. (Ametek, Mahwah, NJ, USA)) technique.
The matrix was also characterized to evaluate the effect of preconditioning treatment. Different maps of EBSD were acquired to characterize the grain size, phase, crystallographic orientation, and kernel average misorientation of the matrix. The crystallographic orientation was characterized by inverse polar figure (IPF) maps. The Kernel Average Misorientation (KAM) parameter quantified the average disorientation. This parameter quantifies the average misorientation around a measurement point concerning a defined set of nearest neighboring points [20]. It uses TSL OIM Analysis 5.2 2007 EDAX Inc. (Ametek, Mahwah, NJ, USA) software for this analysis.

2.4. Hardness Tests

Hardness tests were made to evaluate microstructural changes in the matrix due to different preconditioner treatments. The mechanical behaviour of the SGI samples was assessed by Brinell hardness and Vickers microhardness maps.
Samples were prepared according to the national standard EN ISO 6506-1-2009, Brinell Hardness Test for Metal—Part 1: Test Method. The hardness of each sample was determined on a Brinell hardness tester with a 2.5 mm diameter steel ball by applying a load of 187.5 kg for 10 s. Under the same test conditions for each sample, 5–10 points were measured, and their weighted average was calculated and reported. The Brinell hardness values of the test specimens were obtained using DuraVision G5 20 equipment (EMCOTEST, Kuchl, Austria).
Vickers microhardness maps were performed with a 0.49 N load (HV0.05), according to the standard EN ISO 6507-1-2011, Metallic materials—Vickers Hardness Test for Metal—Part 1: Test Method, using Duramin-1 Struers equipment (Duramin-1; Struers A/S, Ballerup, Denmark). Indentation matrices obtained the hardness maps up to 9 rows per 12 columns. The scheme of the matrices across the interface is represented in Figure 2.

3. Results and Discussion

The success of preconditioning and the effect of the different treatments used in this investigation were evaluated through the analysis of the microstructural and mechanical characterizations of the samples. Different techniques were used to investigate the other microstructural characteristics of the samples and to correlate this with the hardness evolution. Initially, an analysis was carried out at a macro to microstructural level with a large observation area using optical microscopy and hardness, followed by a study using electron microscopy and microhardness. This study aimed to understand to what extent different treatments could affect the matrix and aspects such as crystal orientation that play a crucial role in the final properties of a component.

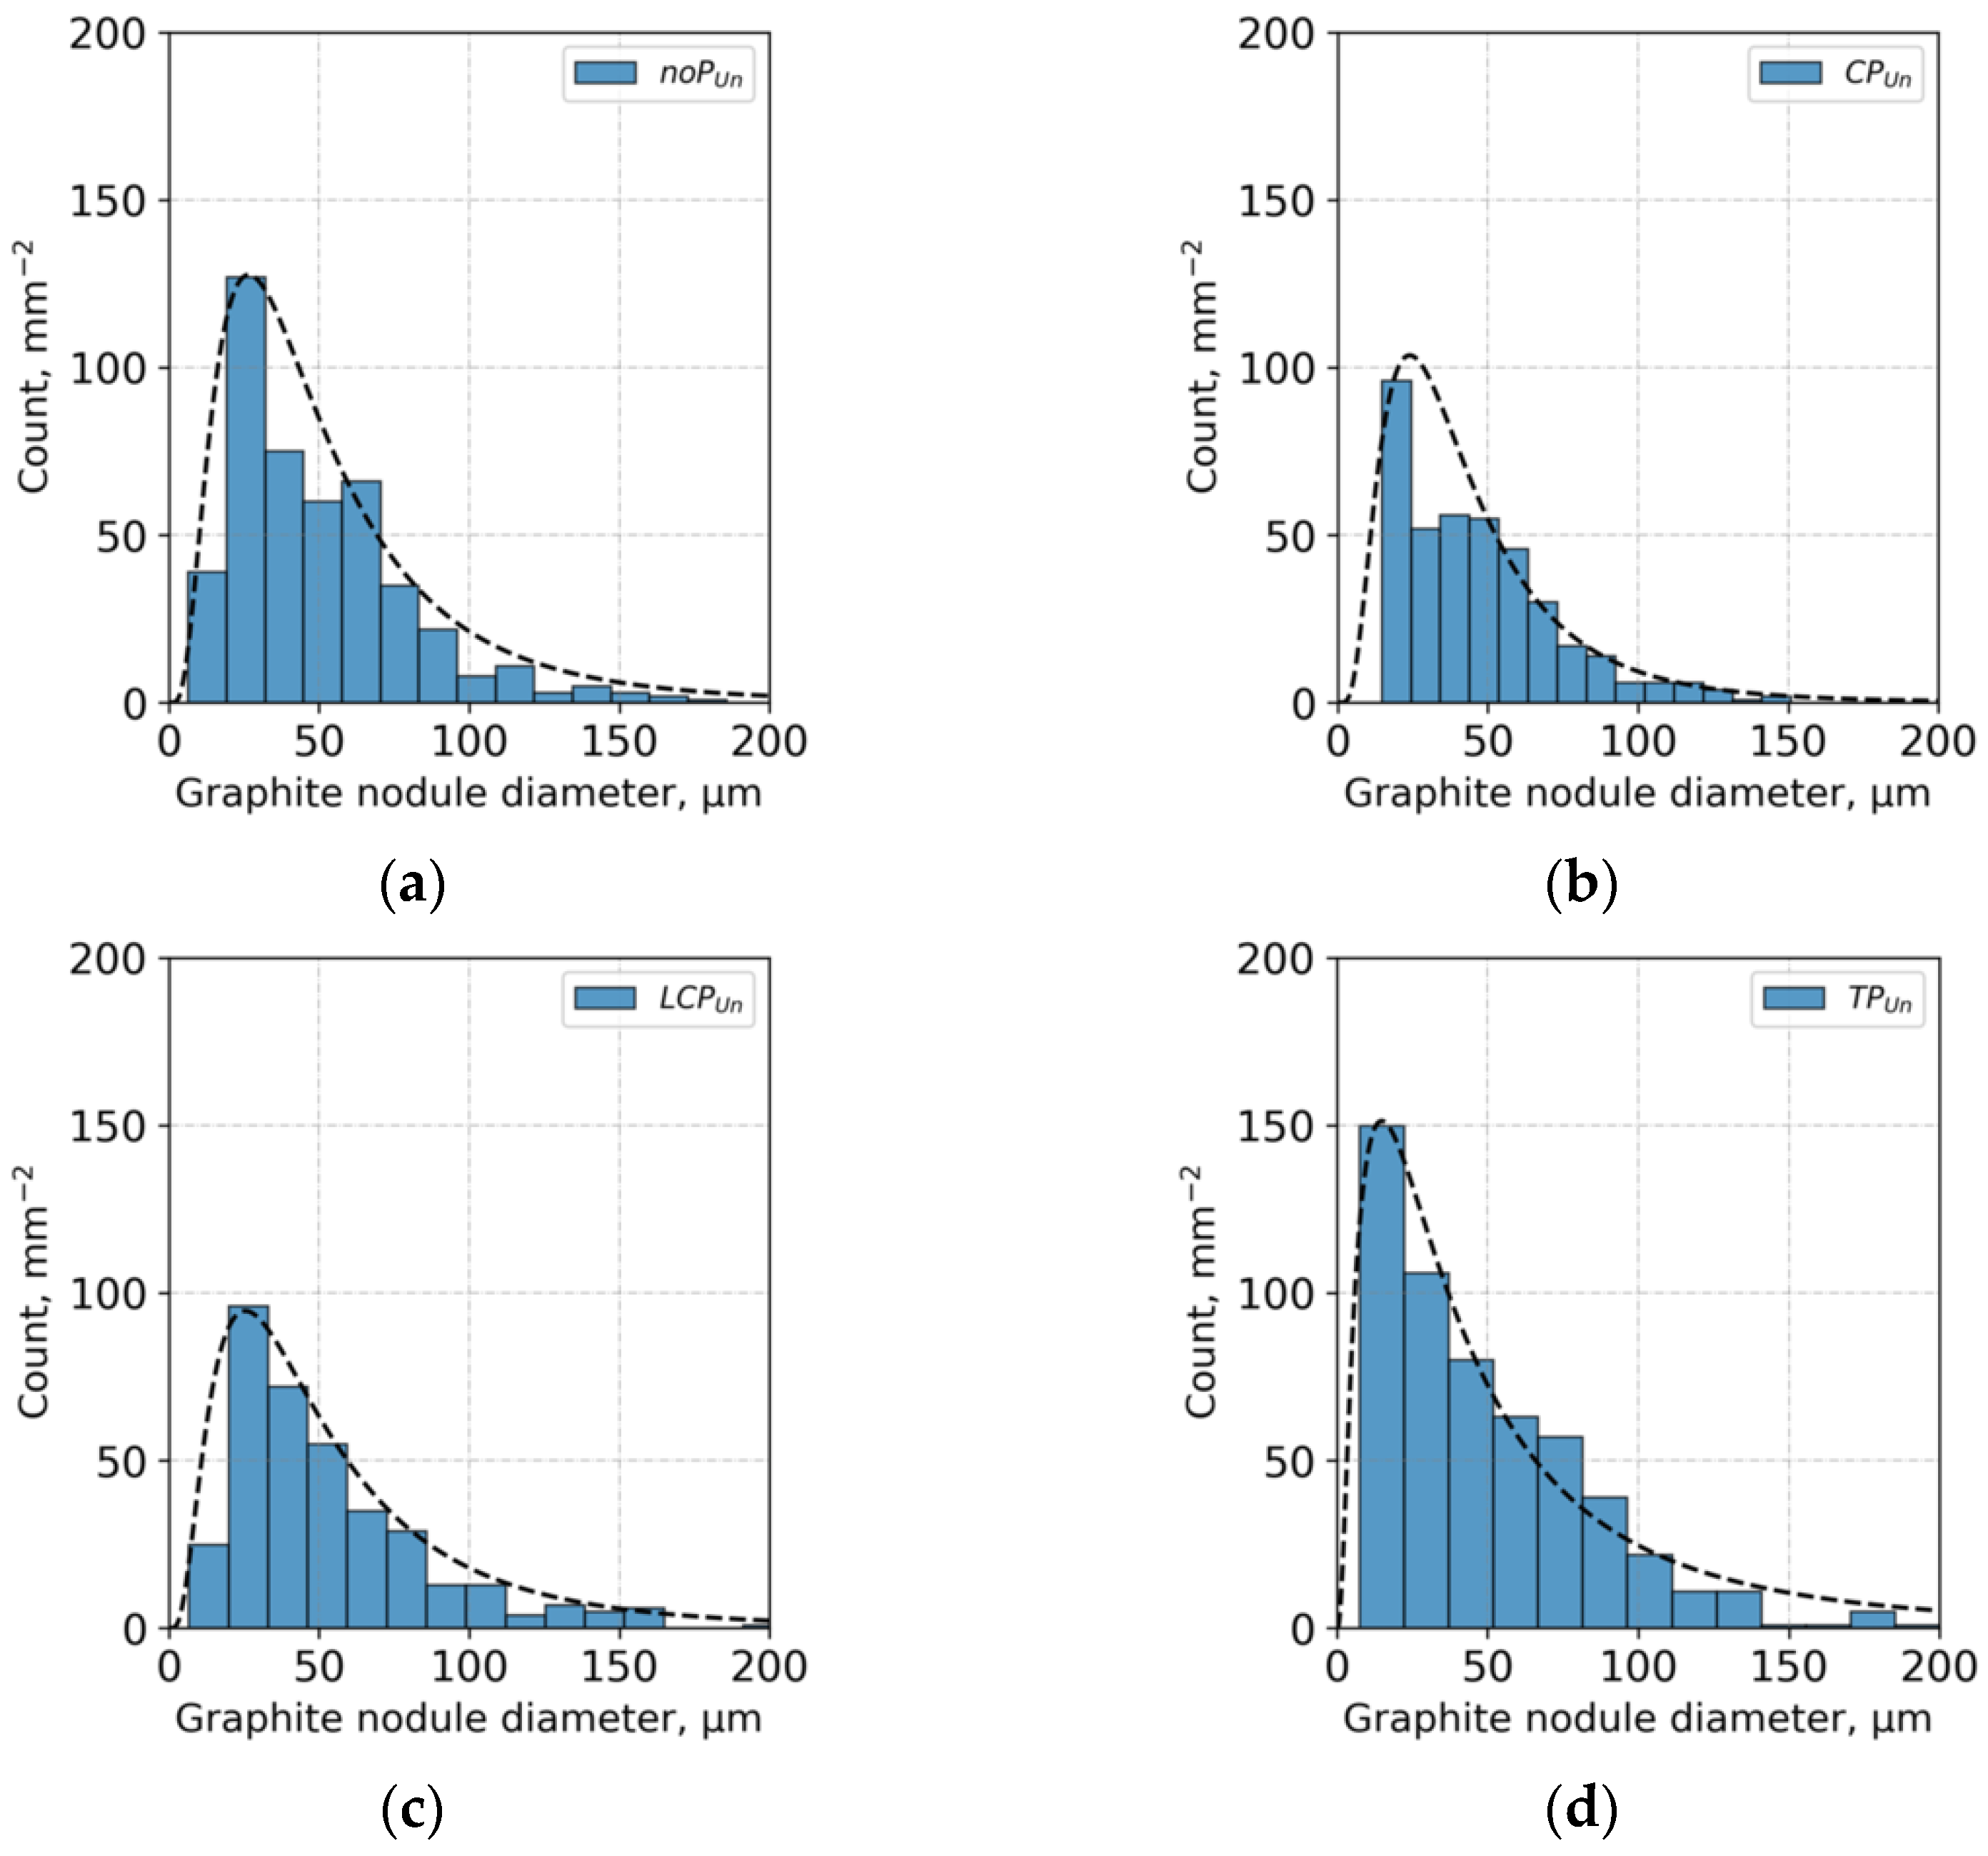
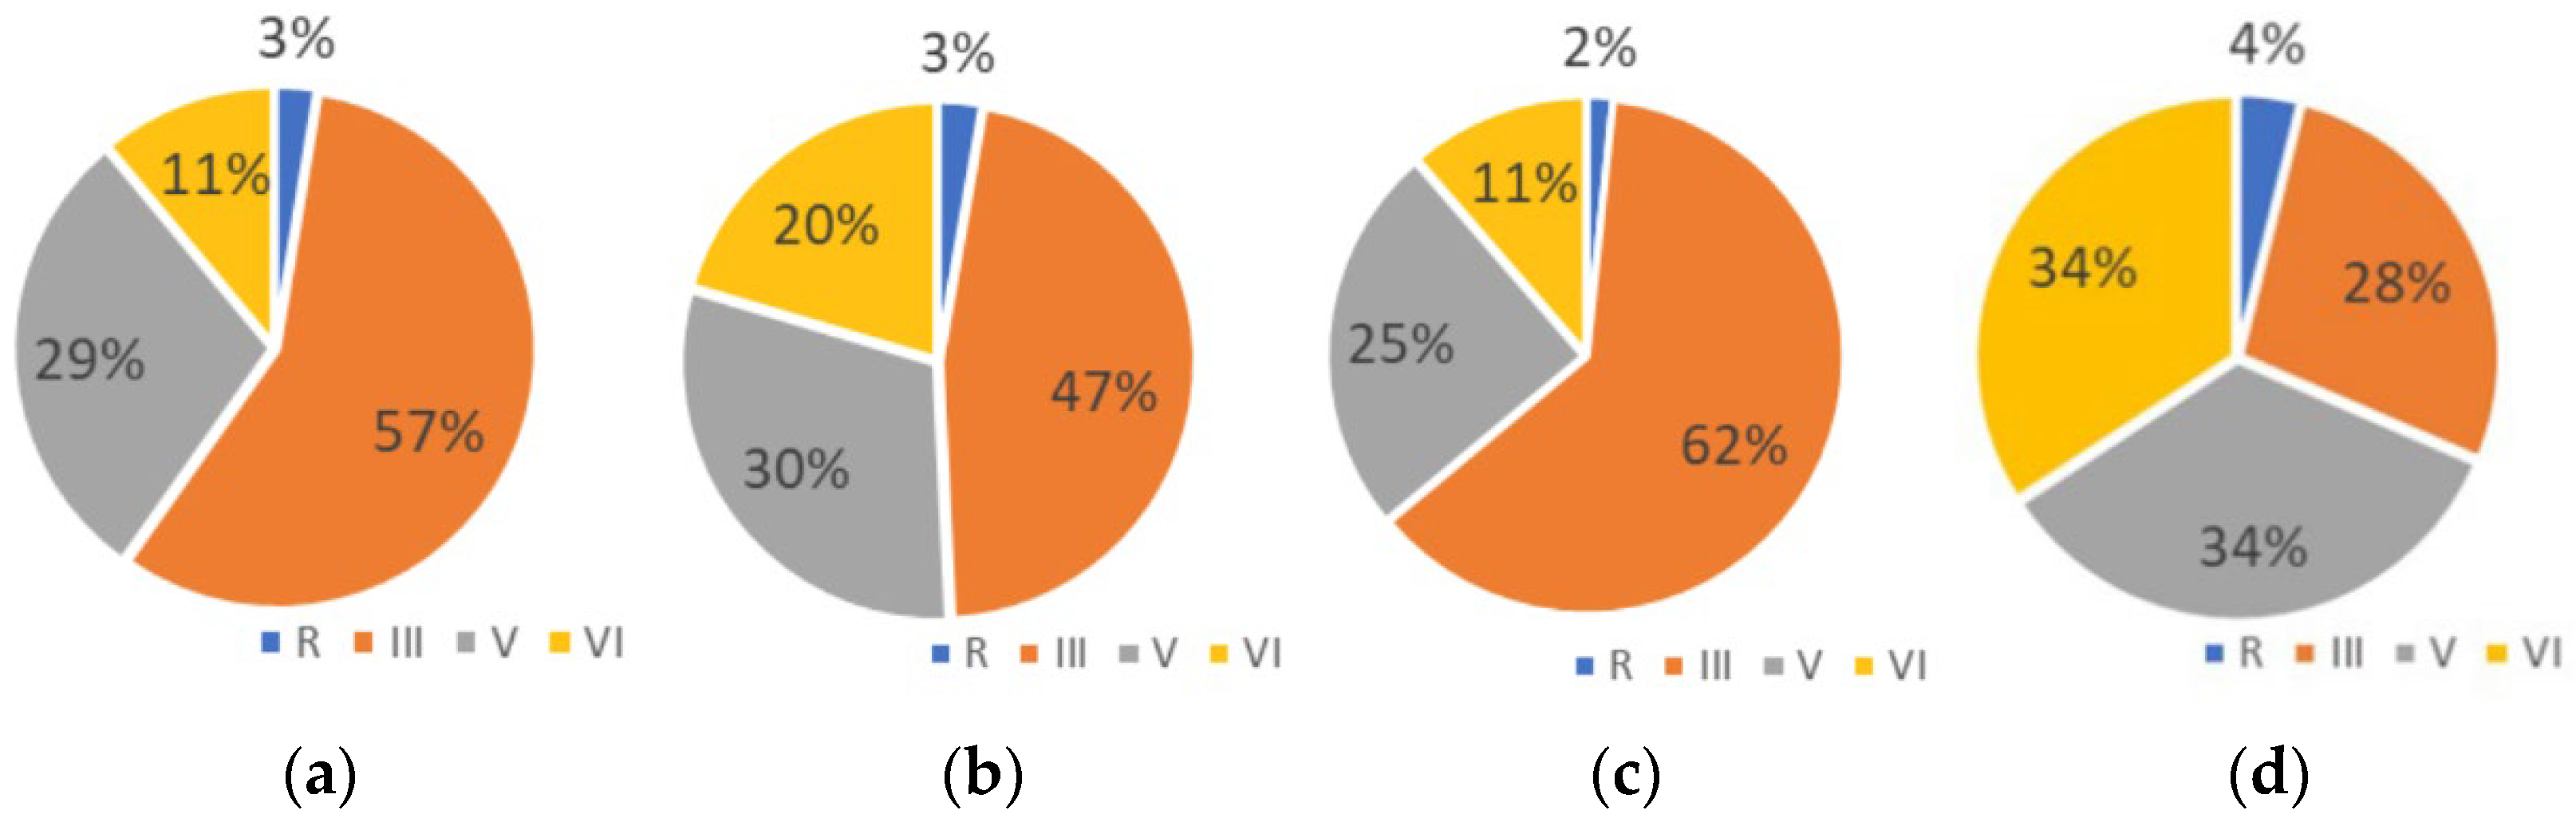
3.1. Optical Microscopy Characterization

Figure 3 shows the images of the samples in unetched and etched conditions for the different treatments. The distribution of the graphite nodules’ diameters (maximum length) and log-normal distributions are present in Figure 4. In the images of unetched samples, the various treatments seem to influence the morphology of the graphite nodules. There is a slight influence of the treatment on the average nodule size based on the diameter distributions. The distributions in Figure 4 show differences for the four treatments performed. From the diameter of the nodules, despite the average size being very close, it is possible to observe that the TPUn samples have the smallest size. For this sample, the distribution curve is narrower. The results obtained in the quantification of the image analysis are shown in Table 4, such as the nodule size, nodule count, and phase analysis results. In the phase analysis, the smaller particles observed in the matrix, with a different gray color from the remaining phases (pearlite and graphite), were called carbides or microparticles.
The results of Table 4 show that preconditioning influences the microstructure characteristics of the matrix. The ferrite and graphite fraction increase with the preconditioner addition time closer to MgFeSi treatment, as seen by the TPUn sample. This sample has the highest ferrite percentage, which explains the lowest Brinell hardness value (165 ± 3 HBW 2.5/187.5). OM performed phase analyses, which are based on determining different gray scales. Some errors might be associated with the values obtained mainly for fractions of these smaller particles that could be carbides corresponding to tiny areas identified in the samples. The noPUn exhibit the highest hardness value that can be explained by the fraction of the smaller particles dispersed at the matrix.
Another essential parameter evaluated was the morphology of the graphite particles. Figure 5 shows the results obtained for the different samples regarding the morphology of the graphite nodules. In these graphs, it is possible to observe that the percentage of nodules present in the samples has a class reference according to the standard ISO-945. The sample TPUn has the highest percentage of classes V and VI, which correspond to the nodules with regular morphology. The addition at tapping seems effective in obtaining graphite with a more regular morphology (classes V and VI), which is the preferred form for this type of material, and are considered nodules.

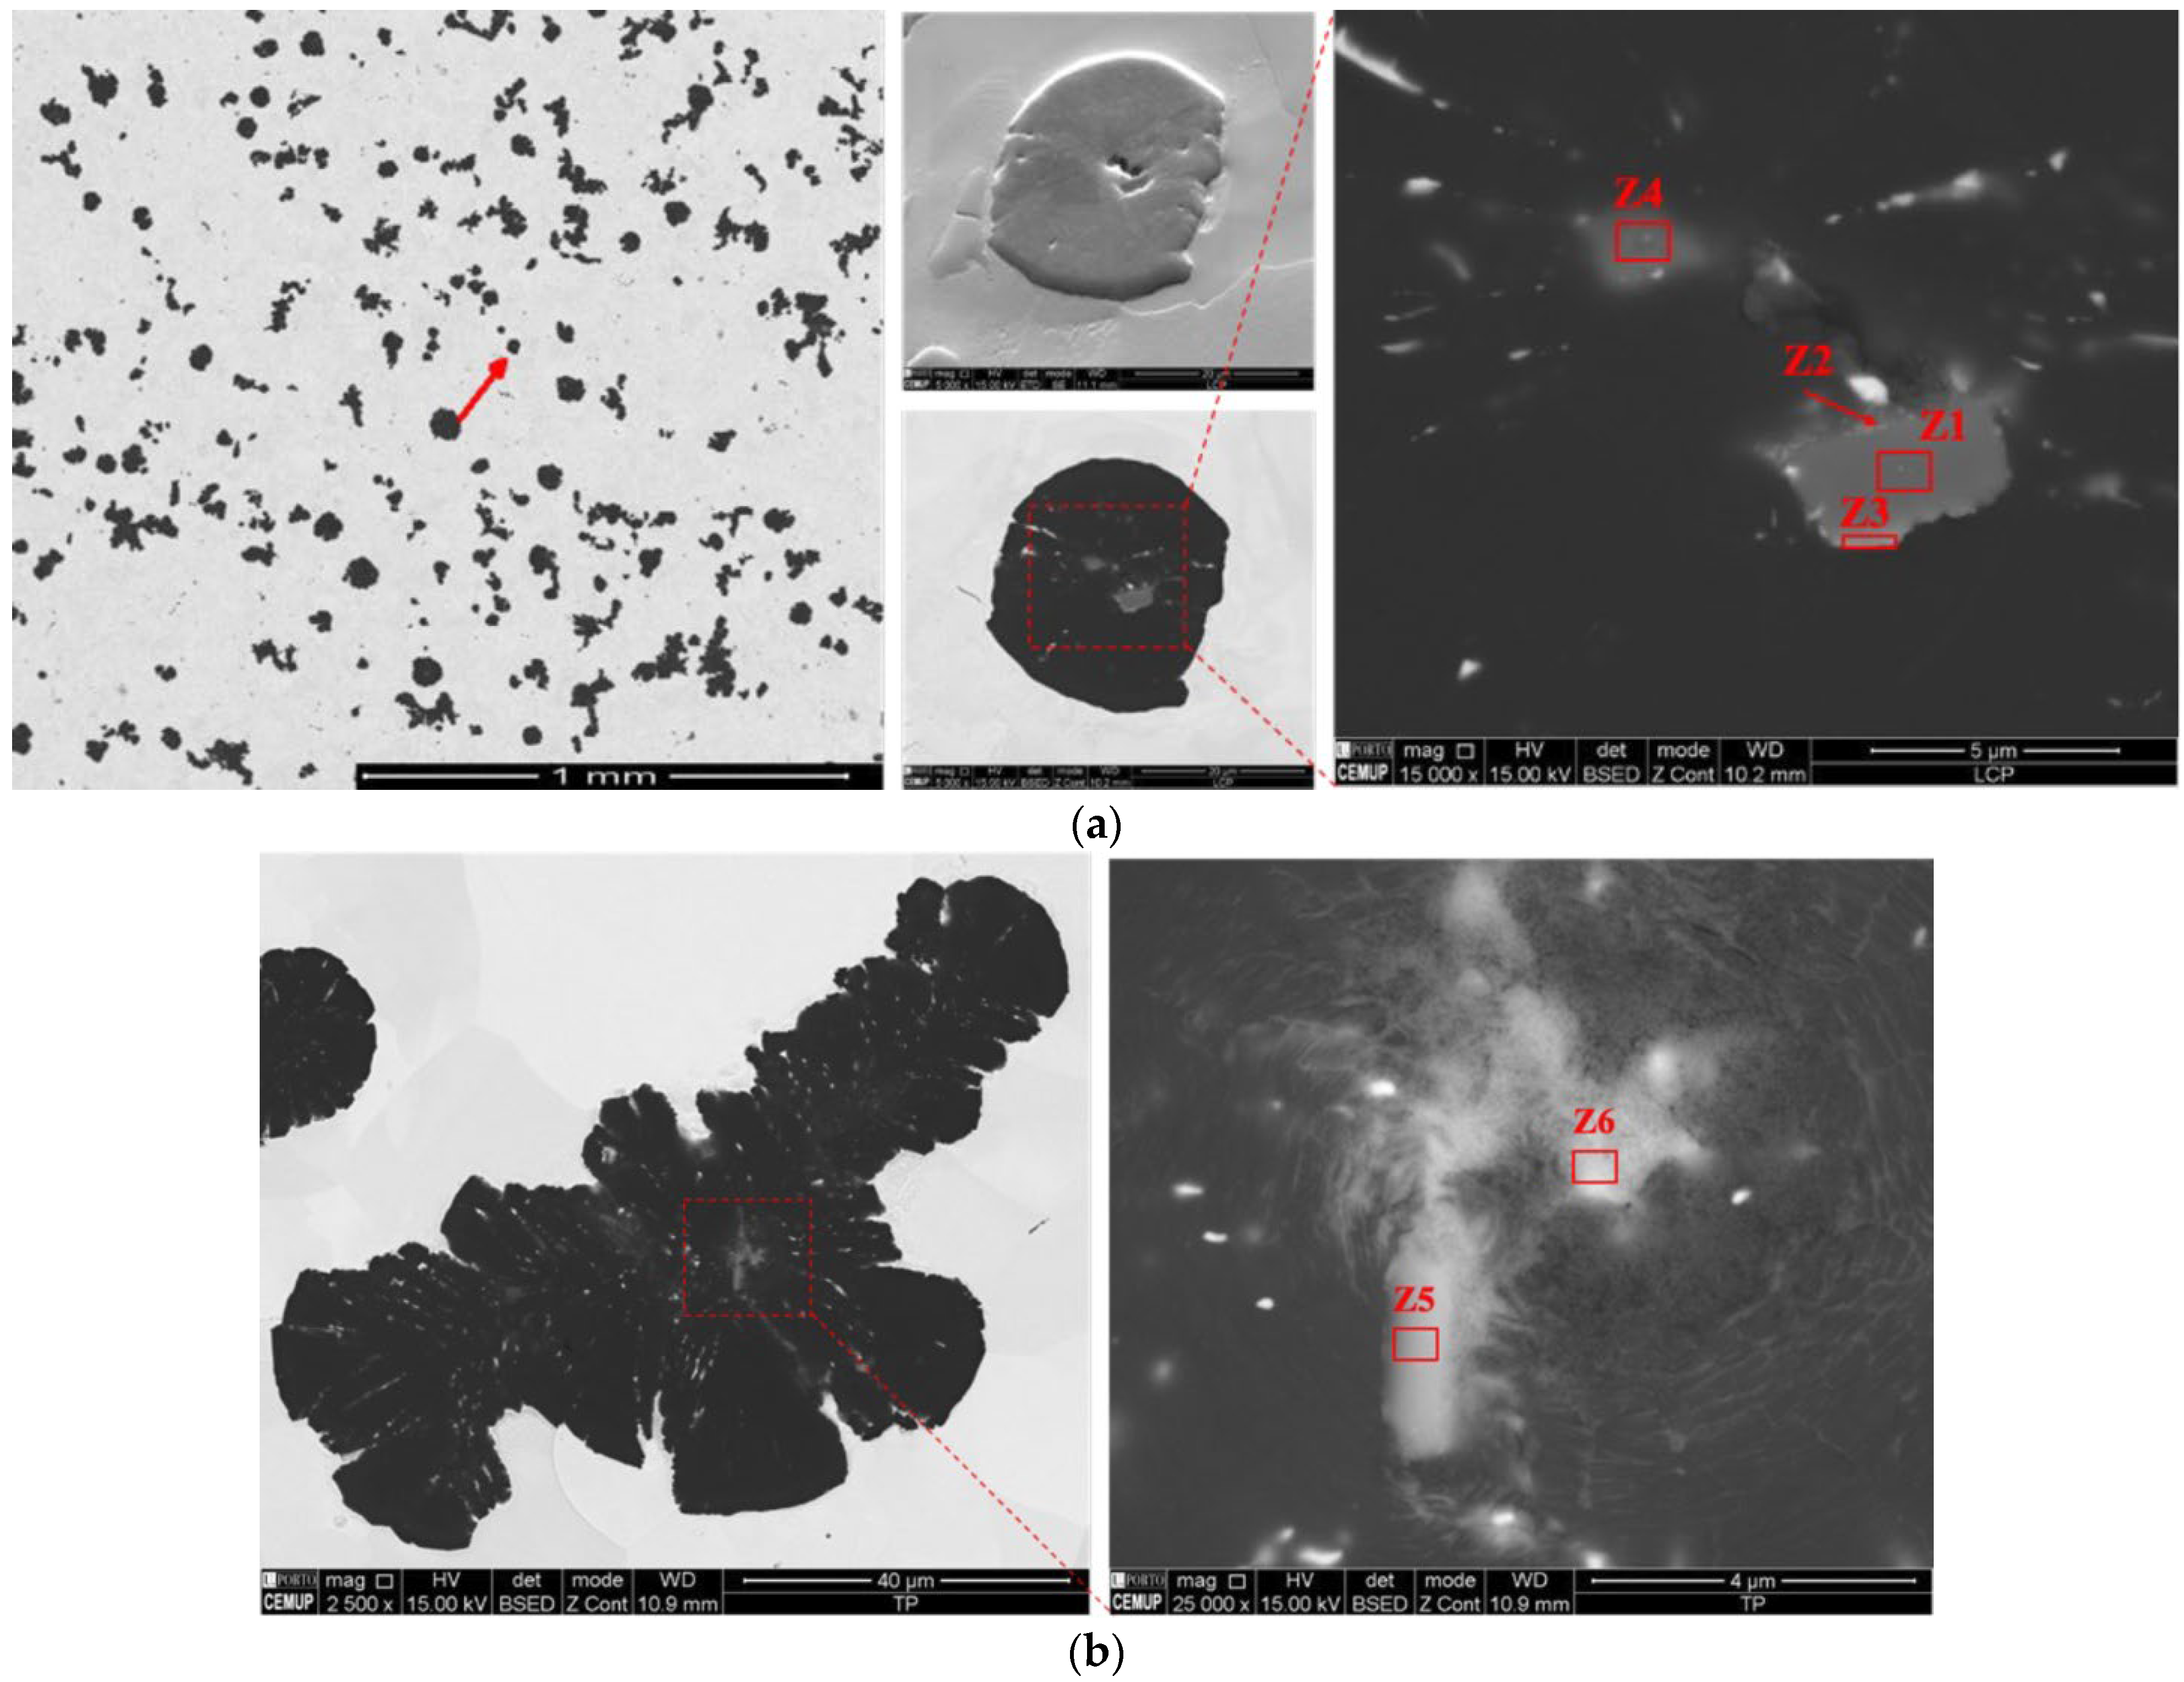
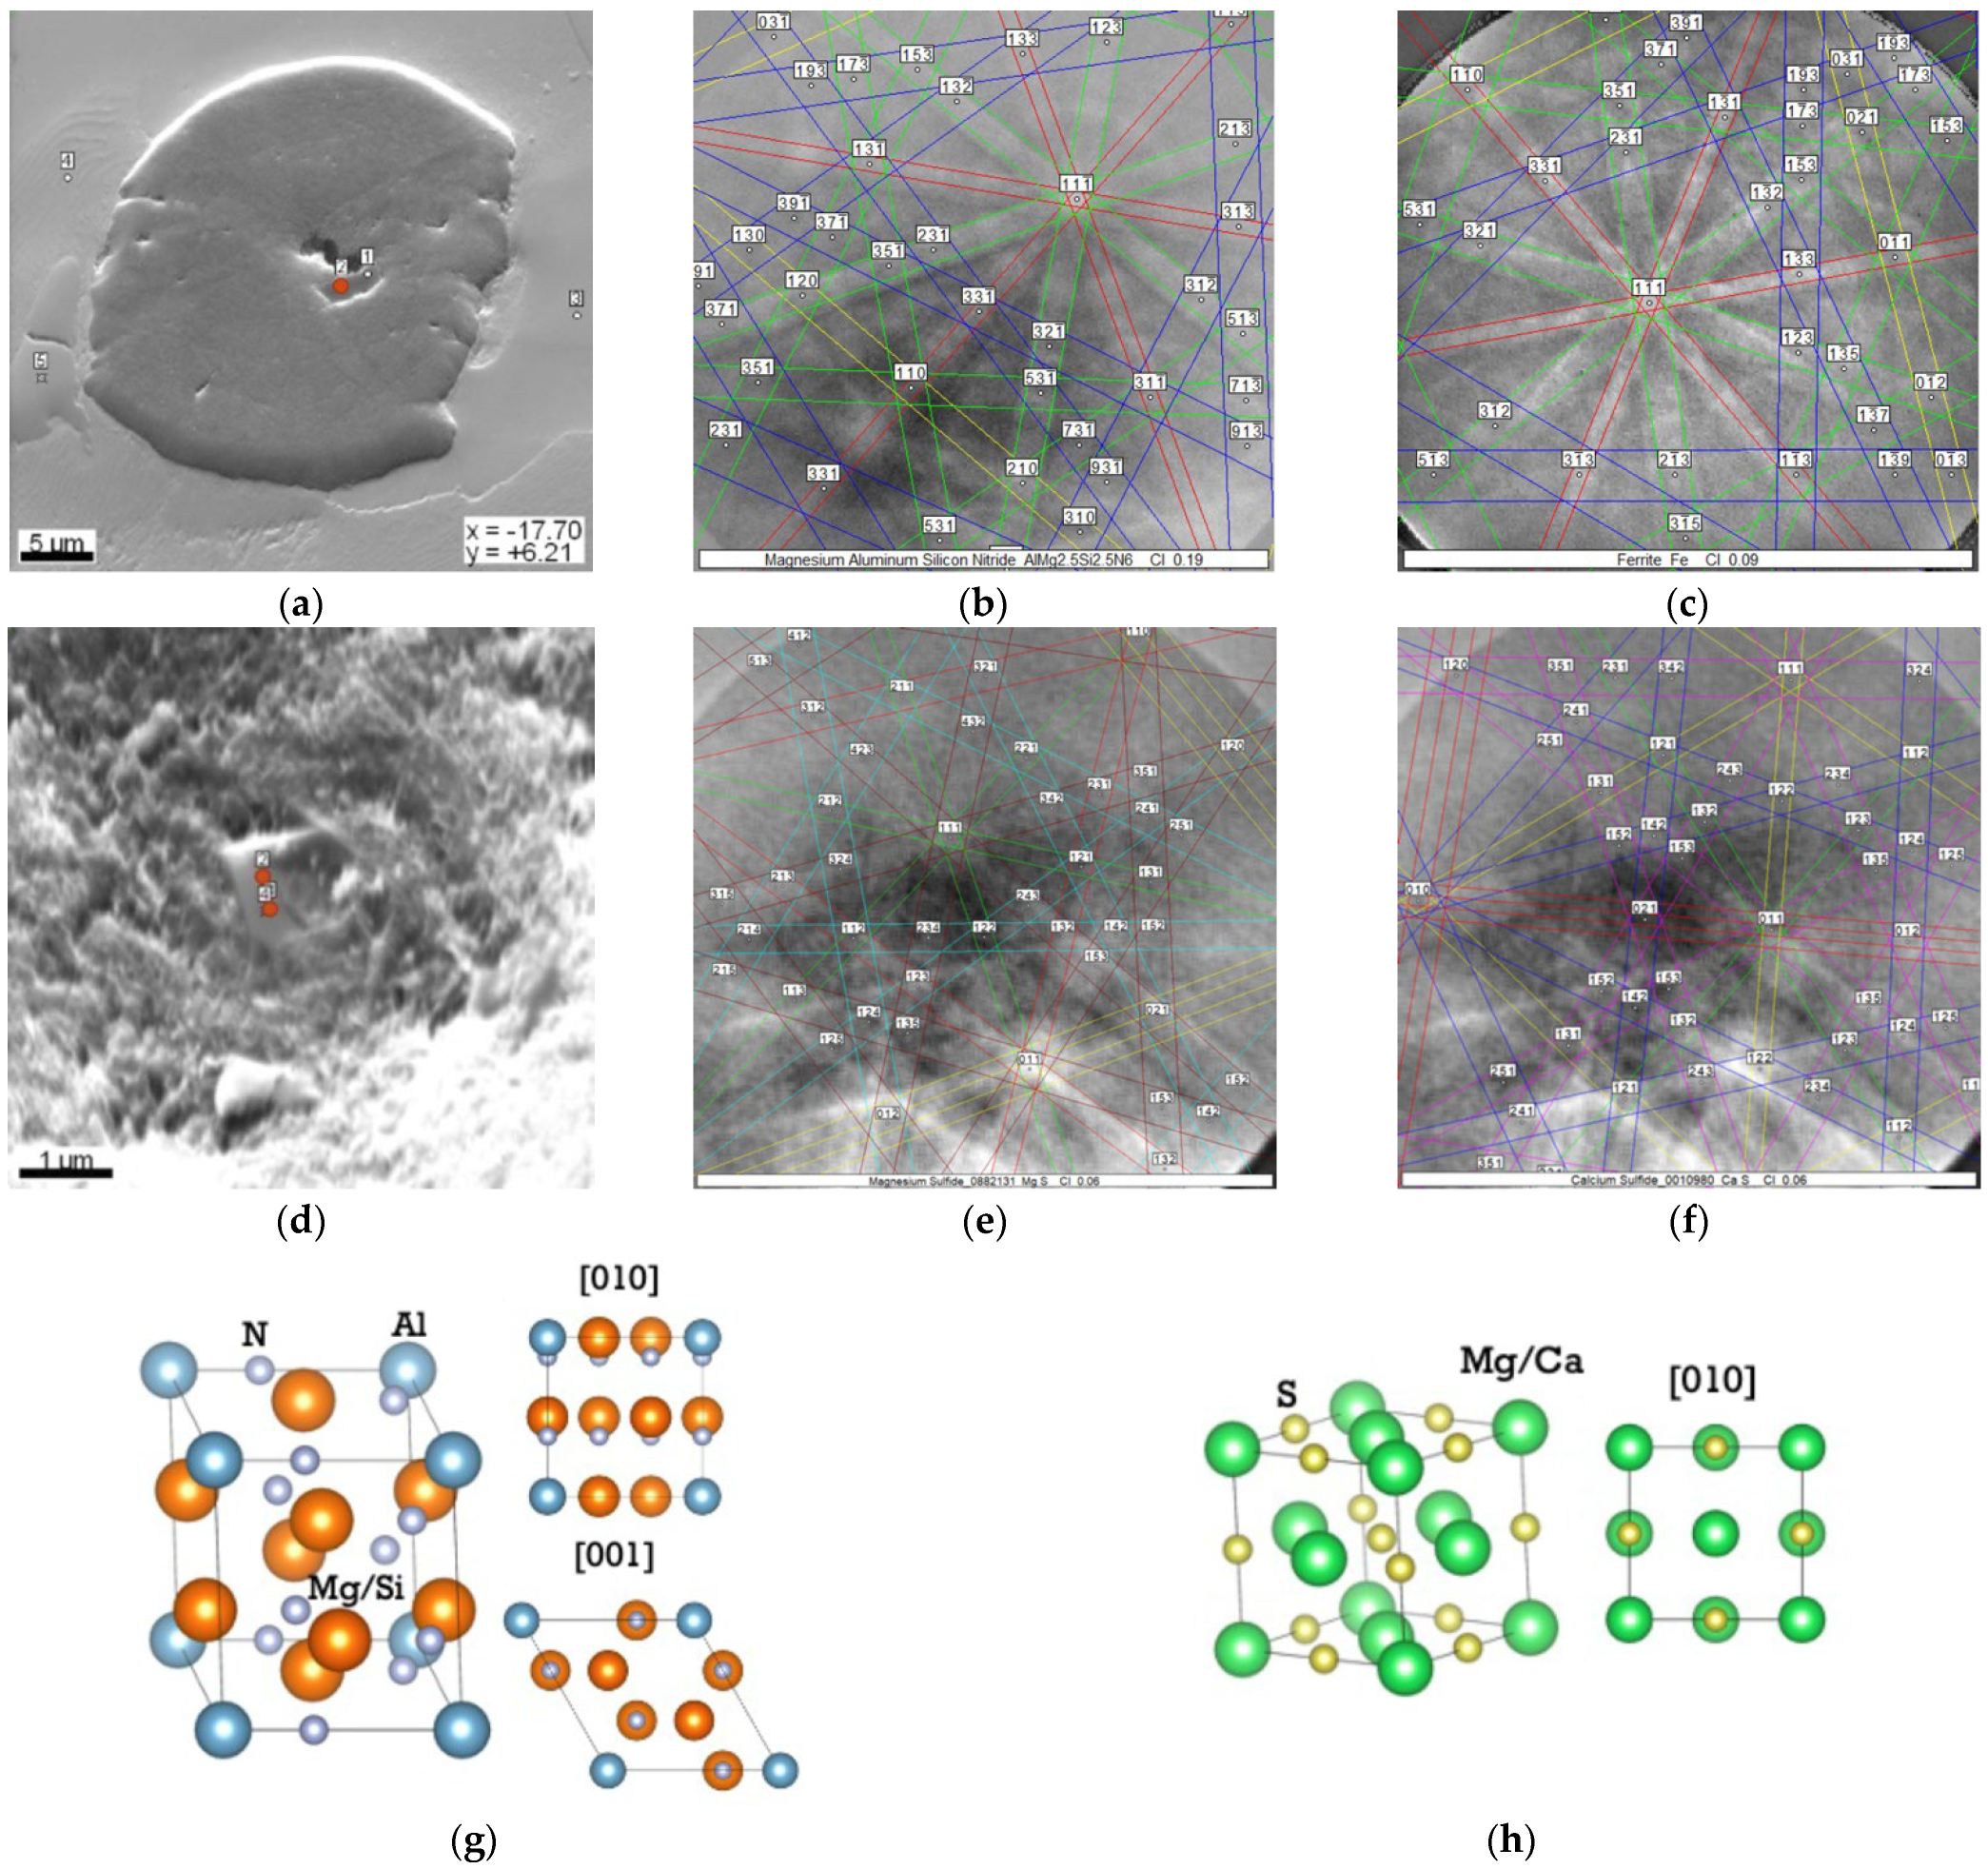
3.2. SEM/EDS/EBSD Microparticles Characterization

There is a strong suggestion that the nucleation of a cast iron melt can occur on microparticles generated during the MgFeSi and preconditioning treatment. The microparticles were analyzed by EDS and SEM images. Figure 6 shows some examples of microparticles observed in the different samples. In these images, it is possible to observe an example of the same type of microparticles in the matrix and the graphite nodules. The chemical composition and shape of these microparticles were similar for all samples. These microparticles are observed dispersed in the matrix but also are located at the center of graphite nodules.
The SEM and EDS analyses were performed in the microparticles at the center of the graphite nodules to identify the present phase. Figure 7 shows the SEM images of two samples and examples of microparticles seen in the center of the graphite nodules. Table 5 shows the results for each analyzed region marked in Figure 7. It is essential to point out that the EDS technique has a higher interaction volume than the analyzed area. Therefore, this analysis only allows for identifying elements in an enveloping volume. Combining these results with the main identified element phase diagrams allows the identification of phases. In some regions, mainly in the case of the Z1 and Z5, the identification performed in previous studies [10,11,12,13,21,22,23,24] was crucial for helping in the selection of the main elements for phase evaluation.
Figure 7a shows microparticles complexed with many elements. The SEM images combined with the analysis of the elemental chemical composition by EDS and the phase diagrams allowed us to indicate the possible phases of the microparticles observed in the graphite nodules of Figure 7. Based on the EDS results combined with phase diagrams and similar results in previous work [5,6,7,8,9,10,11,12,13,21,22,23,24,25], the microparticles observed in this particular graphite nodule could be Mg-Si-Al-N, Mg-S, Nb-Ti-C, and (Ti, Zr)-CN [5,6,8,25]. In Figure 7b, the two regions exhibit EDS results that suggest the presence of (Mg, Si, Al)NO in the Z5 region and (Mg, Ca)S in the Z6 region. Alonso et al. and Qing et al. also reported a similar nucleus [5,6,25], where the authors state that nitrides can grow into Mg-Ca or Mg-Ca-La complex sulfides that can nucleate into Mg oxides or oxysulfides. However, these works report different amounts of Al content. Although most show a value of 3 at%, for example, Alonso et al. [10] report a low Al of 1.8 at%, the presence of (Mg, Si, Al)N may have a structure of (Mg, Si)N2 with orthorhombic lattice, and Solberg and Onsøien [8] identified for a higher amount of Al of 6.9 at%. As for (Mg, Ca)-S, the EDS results accord to that and can be observed in Table 5, showing a higher concentration of Mg and S, which indicates that this nucleus seems to be formed mainly by an Mg sulfide with Ca sulfide incorporated, since both have the same crystal structure.
In order to precisely identify the microparticles, the crystallographic orientation information was obtained by EBSD analysis. Diffraction patterns with a small interaction volume and high resolution were acquired due to the low penetration depth (less than 50 nm) [26].
Figure 8 shows the indexation of Kikuchi patterns of the microparticles presented in Figure 7.
The EBSD technique identified complex compounds of (Mg, Ca)-S with a=b=c 5.21 Å (space group, Fm3m) and AlMg2.5Si2.5N6 with a = b = 5.44 Å and c = 4.82 Å (space group, P31m) in the middle of the graphite nodules according to [4,5,8]. The indexation of MgS and CaS is observed for the Kikuchi patterns obtained, which confirms that this inclusion is a compound, where the CaS crystal adopts the same cubic lattice structure as MgS, replacing Mg atoms with Ca during the inclusion formation. Similar results are observed for MgO, CaO, or (Ti, Zr)-CN. For this reason, the identification of the microparticles was combined SEM/EDS results and EBSD. Based on all EBSD analyses and SEM/EDS results, Table 6 summarizes the identified phases in all samples.
Most analyzed nuclei exhibited two or three different inclusions: Mg-sulfides or Mg-Ca-oxysulfides, Mg-oxides, Ti,Zr-carbonitrides, and Mg-Si-Al nitrides. The characterization of the nitride particles was performed for all samples, obtaining the same identification for all the nitrides analyzed, which suggests that the preconditioners have a small influence on the chemical composition or shape of the microparticles.

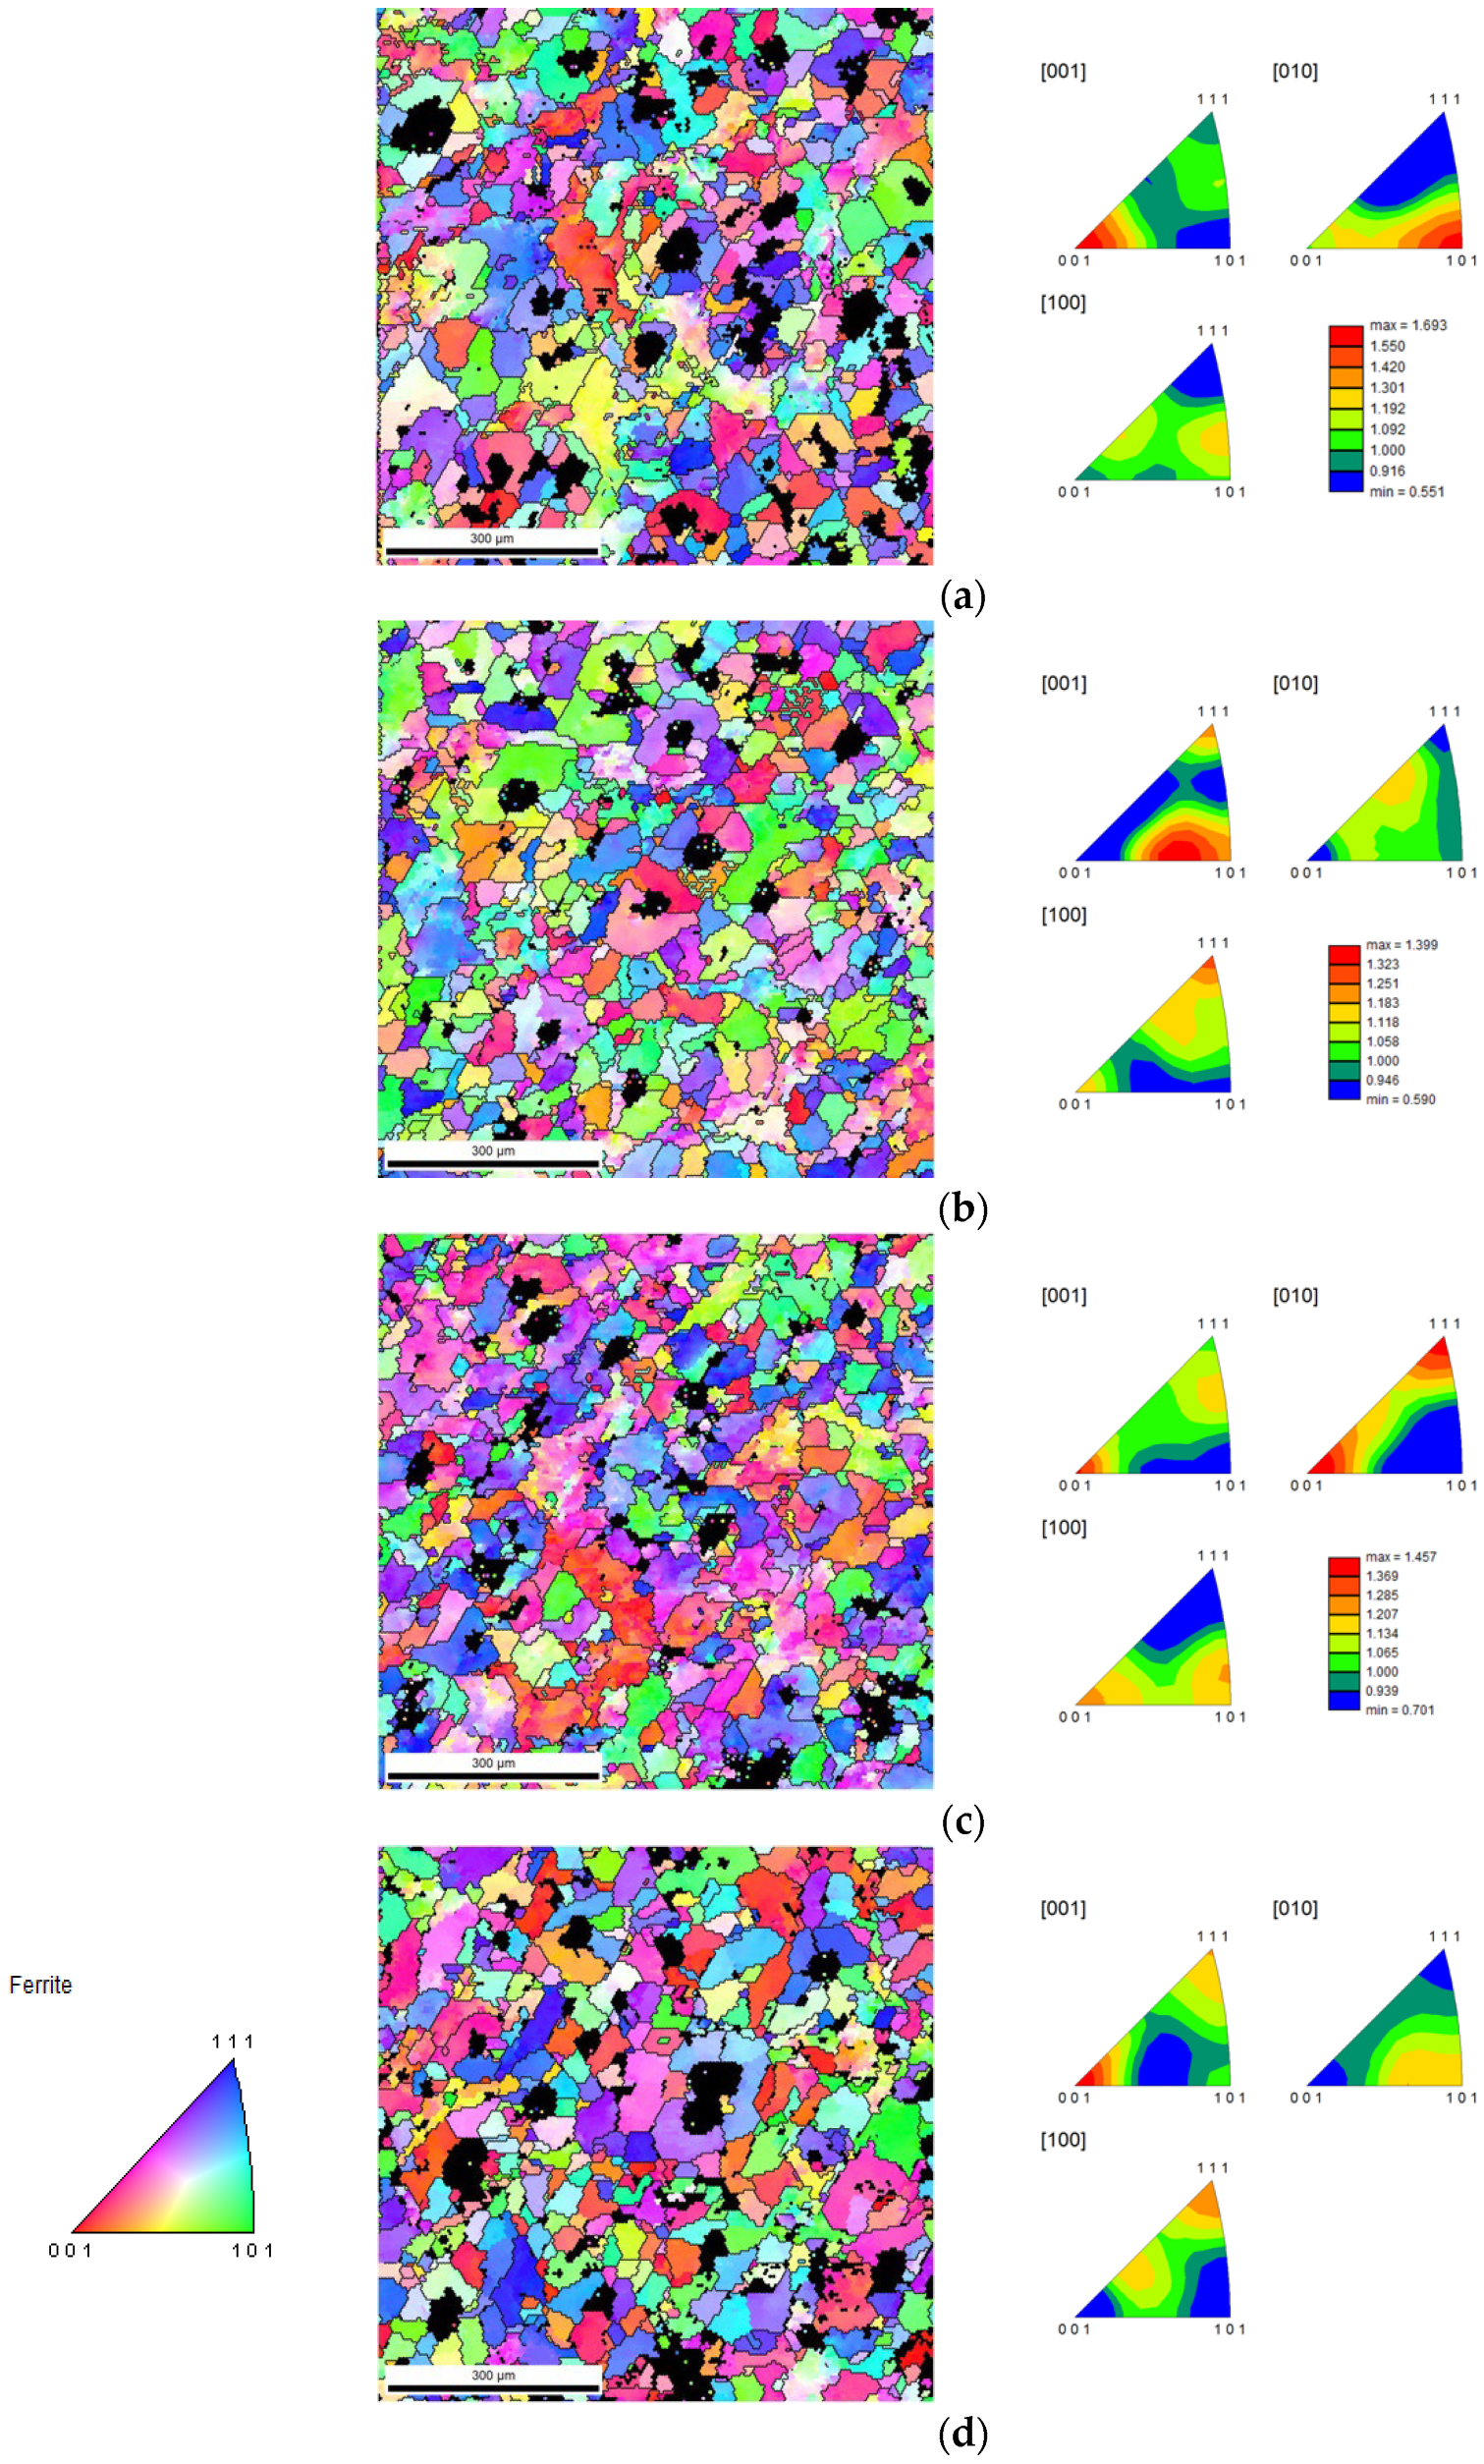
3.3. SEM/EDS/EBSD Matrix Characterization

The influence of the different treatment processes on the matrix of the SGI was also evaluated by EBSD techniques. Unique color grain maps evaluated the grain size of the matrix. These maps and SEM images are presented in Figure 9. The grain size distribution for each sample and the log-normal distribution of grain size can be observed in Figure 10. Based on these results, despite the average grain size of the ferrite matrix of the samples being similar, differences can be observed in the distribution for the different treatments. Although the samples noPUn and LCPUn can have a similar distribution, the sample TPUn has a slightly smaller mean ferrite matrix grain size and a grain size distribution closer to a normal distribution.
Regarding crystallographic orientation, the inverse pole figure maps were analyzed in the [001] direction, and the inverse pole figures can be observed in Figure 11 for the different treatments.
Although none of the samples showed preferential orientation (texture), the maps and IPF figures reveal strong orientations in the conditions analyzed. For example, the CPUn sample has more green grains than the LCPUn sample, suggesting they have [001]<101> orientation. Based on the inverse pole figures, the change in crystallographic orientation in the samples is evident. For the ferrite matrix, it is possible to observe that for the different crystallographic directions, there are different maximum intensities for each sample. For example, for the TPUn sample, in the [001] direction, the maximum intensity is observed for the <001> planes, whereas for the CPUn sample, it is in <101> planes for the same direction. This is indicative of the preconditioner treatment, as its particle size can affect the formation and crystallographic orientation of the ferrite matrix grains. These changes may also be affected by the presence and nature of the different microparticles located in the matrix, which can affect the crystalline orientation of the matrix. The various treatments can influence the number and type of microparticles present in the matrix. KAM maps enable an understanding of local lattice distortions, localized deformation, and high dislocation density, which cause stored strain energy in the grain [20], which can lead to the detriment of some mechanical properties.
Based on KAM maps, shown in Figure 12, it is possible to detect some significant differences between samples.
CPUn and LCPUn samples present a matrix showing extensive regions of greater misorientation (red regions correspond to 5° of misorientation angle). The noPUn sample presents some heterogeneous high misorientation areas. The areas that show greater misorientation are regions that may correspond to the matrix with the presence of carbides or microparticles. These regions can result from a significant accumulation of dislocations due to the obstacles to their movement, increasing the grain’s misorientation. This microstructure feature will influence the properties of the material. The TPUn sample exhibits the microstructure with a lower average misorientation angle, which means a beneficial mechanical property of the casting.
The interface between graphite and ferrite corresponds to areas of low misorientation, which means regions with slight disorientation in the lattice. Furthermore, the density of dislocations can pile up at the ferrite–cementite interface during pearlite transformation [27]. Regarding the effect of the preconditioning treatment, the TPUn sample has the lowest average misorientation. This can be related to the lower fraction of carbides, and a higher fraction of ferrite observed for these samples, as in Table 4. The differences in the angle of misorientation of the ferrite matrix observed for each treatment can also be associated with the microparticles’ presence. A higher density of microparticles dispersed into ferrite can promote a higher density of dislocation that can increase the average misorientation angle.
The microstructural characterization result suggests significant differences in the size and morphology of the graphite nodules, the grain size distribution of the ferrite, as well as the crystalline orientation and misorientation of the ferrite matrix for the different treatments performed. These characteristics have a direct influence on the mechanical behavior of the SGI, and as such, it was necessary to investigate the microhardness of these samples.

3.4. Hardness Evolution

The hardness values of the samples are summarized in Table 4, and the Vickers microhardness distribution maps of each sample produced are presented in Figure 13.
Vickers microhardness evolution matrices maps show significant changes when preconditioning is applied at different moments. Based on the hardness maps, the noPUn and LCPUn samples present regions with higher hardness values. This is in agreement with the mean values presented in Table 4. This may be associated with the higher percentage of observed pearlite and carbides and regions with high misorientation related to a high concentration of dislocations. The TPUn sample has a more uniform hardness distribution and a lower hardness value. This can be explained due to the high fraction of ferrite and the low value of carbides observed.
The hardness results are according to the microstructural characterization. The TPUn sample revealed a more uniform hardness distribution and lower average hardness. The lower average angle of misorientation can explain this, as already mentioned. The lower fraction of the carbides and microparticles in the matrix observed by OM analyses or pearlite fraction can induce the formation of a softer matrix. On the contrary, the higher hardness observed for the samples noPUn and LCPUn can be associated with the high misorientation angles observed at some regions of the matrix. A higher density of accumulated dislocations can characterize these regions due to the presence of second-phase particles that increase the mechanical properties of these regions. It is essential to point out that the grain size of the ferrite matrix for all samples is similar, and the differences in the hardness cannot be attributed to the microstructural feature.
These results show that the hardness value distribution maps are the same evolution as the KAM maps in Figure 12. The samples with more uniform KAM maps and smaller misorientation angle values present more hardness values. In comparison, the samples with more crystalline disorientation have higher hardness values and harder matrix regions. This heterogeneity in the microstructure reflected in the properties shows that a detailed characterization of the microstructure is important to understand how processing can influence the final nodular cast iron component.

4. Conclusions

The effect of preconditioning on the microstructure of uninoculated SGI was studied using characterization techniques such as optical microscopy and scanning electron microscopy. The preconditioning used was Zr-(Ca,Al) FeSi, which was added at three different moments: preconditioning at a charge (CPUn), preconditioning at the last cold charge (LCPUn), and preconditioning at tapping (TPUn). For comparative purposes, a standard melt was produced without adding the preconditioning (noPUn). In this context, four different preconditioning treatments were defined, and their effect on other microstructural characteristics in the matrix and on the characteristics of graphite nodules was evaluated.
OM characterization suggests that different preconditioning treatments influence the morphology of graphite nodules and the ferrite fraction, affecting the SGI mechanical properties. The addition at tapping seems effective in obtaining graphite with a more regular morphology (classes V and VI).
The addition of preconditioning at tapping increases the graphite’s nodule count density, ferrite content, and nodularity with an increase of 23% of the graphite’s nodules of class VI.
The microparticles were identified through the combination of SEM/EDS and EBSD, and the results show that these microparticles consist of some complex compounds made of Mg-Ca-O, Mg-Ca-S, Ti-Zr-C-N, and Mg-Al-Si-N. However, there is no significant difference in the type of inclusions in the samples produced by different treatments.
EBSD was also used to evaluate the effect of different preconditioning treatments on the microstructure of the SGI matrix. Although the samples’ average grain size of the ferrite matrix is similar, differences in grain size distribution can be observed for the different treatments.
The crystallographic orientation of the ferrite matrix is affected by the preconditioning treatment. This is related to the microparticles, and the second phase present in the matrix will influence the grain orientation. The KAM results revealed that the preconditioning treatment leads to a decrease in matrix disorientation. The addition of preconditioning in tapping is observed in the lowest average disorientation values.
The hardness results confirmed that the microstructural observations revealed a smoother matrix for the sample produced with the addition of preconditioning in the tapping. This may be related to the distribution of the microparticles across the matrix.

Author Contributions

Conceptualization, L.M., C.H. and E.O.; methodology, C.S.R. and L.M.; validation, C.S.R., S.S. and L.M.; investigation, A.P. and S.S.; writing—original draft preparation A.P.; writing—review and editing, S.S., C.S.R. and L.M.; project coordination, L.M., funding acquisition, L.M. and E.O.; supervision, C.S.R., S.S. and L.M. All authors have read and agreed to the published version of the manuscript.

Funding

This research received no external funding.

Institutional Review Board Statement

Not applicable.

Informed Consent Statement

Not applicable.

Data Availability Statement

Not applicable.

Acknowledgments

The authors are grateful to CEMUP—Centro de Materiais da Universidade do Porto for microscopy assistance. The authors would also like to acknowledge ELKEM company and Gro Eide for supporting and funding this research.

Conflicts of Interest

The authors declare no conflict of interest.

References

  1. Walton, C.F.; Opar, T.J. Chapter 6: Section C: Mechanical properties of ductile iron. In Iron Casting Handbook Covering Data on Grey, Malleable and Ductile Iron; Iron Casting Society Inc.: New York, NY, USA, 1981. [Google Scholar]
  2. Grand View Research. Iron Casting Market Size, Share and Trends Analysis Report by Product (Gray, Ductile, Malleable), By Application (Automotive, Machinery and Tools, Railways), By Region, And Segment Forecasts, 2022–2030. Available online: https://www.grandviewresearch.com/industry-analysis/iron-casting-market-report (accessed on 16 September 2022).
  3. Alonso, G.; Stefanescu, D.M.; Larranaga, P.; Suarez, R. Graphite nucleation in compacted graphite cast iron. Int. J. Met. 2020, 14, 1162–1171. [Google Scholar] [CrossRef]
  4. Skaland, T.; Grong, Ø.; Grong, T. A model for the graphite formation in ductile cast iron: Part I. Inoculation mechanisms. Metall. Mater. Trans. A 1993, 24, 2321–2345. [Google Scholar] [CrossRef]
  5. Igarashi, Y.; Okada, S. Observation and analysis of the nucleus of spheroidal graphite in magnesium-treated ductile iron. Int. J. Cast Met. Res. 1998, 11, 83–88. [Google Scholar] [CrossRef]
  6. Qing, J.; Lekakh, S.; Xu, M.; Field, D. Formation of complex nuclei in graphite nodules of cast iron. Carbon 2020, 171, 276–288. [Google Scholar] [CrossRef]
  7. Laffont, L.; Pugliara, A.; Hungría, T.; Lacaze, J. STEM observation of a multiphase nucleus of spheroidal graphite. J. Mater. Res. Technol. 2020, 9, 4665–4671. [Google Scholar] [CrossRef]
  8. Solberg, J.; Onsøien, M. Nuclei for heterogeneous formation of graphite spheroids in ductile cast iron. Mater. Sci. Technol. 2001, 17, 1238–1242. [Google Scholar] [CrossRef]
  9. Alonso, G.; Larrañaga, P.; Stefanescu, D.M.; De la Fuente, E.; Natxiondo, A.; Suarez, R. Kinetics of Nucleation and Growth of Graphite at Different Stages of Solidification for Spheroidal Graphite Iron. Int. J. Metalcast. 2017, 11, 14–26. [Google Scholar] [CrossRef]
  10. Alonso, G.; Tokarski, T.; Stefanescu, D.M.; Górny, M.; Cios, G.; Suarez, R. On the crystallography of the Mg–Si–Al nitride nuclei and of the graphite/nitride interface in spheroidal graphite iron. Carbon 2022, 199, 170–180. [Google Scholar] [CrossRef]
  11. Juretzko, F.R.; Dix, L.P.; Ruxanda, R.; Stefanescu, D.M. Precondition of ductile iron melts for light weight castings—Effect on mechanical properties and microstructure. AFS Trans. 2004, 112, 4–14. [Google Scholar]
  12. Riposan, I.; Chisamera, M.; Stan, S.; Toboc, P.; Ecob, C.; White, D. Al, Zr–FeSi preconditioning of grey cast irons. Mater. Sci. Technol. 2008, 24, 579–584. [Google Scholar] [CrossRef]
  13. Javaid, A.; Thompson, J.; Davis, K.G.; Sahoo, M. Effect of microstructure on the mechanical properties of thin-wall ductile iron castings. AFS Trans. 2001, 1009, 1–18. [Google Scholar]
  14. Nadeem Bhat, M.; Afzal Khan, D.M.; Singh, K.K. Effect of preconditioning and inoculation on graphite nodule count and their size distribution in Spheroidal Graphite (SG) cast iron: A study to minimise rejection of castings due to shrinkage porosity. Int. J. Metalcast. 2019, 13, 89–97. [Google Scholar] [CrossRef]
  15. Mojisola, T.; Seidu, S.O.; Olubambi, P.A.; Adediran, A.A. Effect of preconditioning on the microstructure and mechanical properties of ductile cast iron. Mater. Today Proc. 2022, 62, S23–S29. [Google Scholar] [CrossRef]
  16. Michels, L.; Pires, A.; Ribeiro, C.; Kroka, B.; Hoel, E.; Ott, E.; Hartung, C. Effect of holding time on populations of microparticles in spheroidal graphite irons. Metall. Mater. Trans. B 2022, 53, 836–847. [Google Scholar] [CrossRef]
  17. Lifshits, M.A. Gaussian distributions and random variables. In Gaussian Random Functions. Mathematics and Its Applications; Springer: Dordrecht, The Netherlands, 1995; Volume 322. [Google Scholar]
  18. Gomes, O.F.M.; Paciornik, S. Automatic classification of the shape of graphite particles in cast iron. Microsc. Microanal. 2003, 9, 756–757. [Google Scholar] [CrossRef] [Green Version]
  19. Bai, J.; Xu, H.; Wang, Y.; Chen, X.; Zhang, X.; Cao, W.; Xu, Y. Microstructures and mechanical properties of ductile cast iron with different crystallizer inner diameters. Crystals 2022, 12, 413. [Google Scholar] [CrossRef]
  20. Saraf, L. Kernel average misorientation confidence index correlation from FIB sliced Ni-Fe-Cr alloy surface. Microsc. Microanal. 2011, 17, 424–425. [Google Scholar] [CrossRef] [Green Version]
  21. Jacobs, M.H.; Law, T.J.; Melford, D.A.; Stowell, M.J. Basic processes controlling the nucleation of graphite nodules in chill cast iron. Met. Technol. 1974, 1, 490–500. [Google Scholar] [CrossRef]
  22. Nakae, H.; Igarashi, Y. Influence of sulfur on heterogeneous nucleus of spheroidal graphite. Mater. Trans. 2020, 43, 2826–2831. [Google Scholar] [CrossRef] [Green Version]
  23. Stefanescu, D.M.; Crisan, A.; Alonso, G.; Larranaga, P.; Suarez, R. Growth of spheroidal graphite on nitride nuclei: Disregistry and crystallinity during early growth. Metall. Mater. Trans. A 2019, 50, 1763–1772. [Google Scholar] [CrossRef]
  24. Stefanescu, D.M.; Alonso, G.; Suarez, R. Recent developments in understanding nucleation and crystallization of spheroidal graphite in iron-carbon-silicon alloys. Metals 2020, 10, 221. [Google Scholar] [CrossRef] [Green Version]
  25. Alonso, G.; Stefanescu, D.M.; de La Fuente, E.; Larranaga, P.; Suarez, R. The influence of trace elements on the nature of the nuclei of the graphite in ductile iron. Mater. Sci. Forum 2018, 925, 78–85. [Google Scholar] [CrossRef]
  26. Siekanieca, D.; Kopycinski, D. Phase analysis and crystallographic orientation of high chromium cast iron grain using EBSD technique. J. Cast. Mater. Eng. 2017, 1, 15–19. [Google Scholar] [CrossRef] [Green Version]
  27. Stefanus, H.; Kubota, S.; Gong, W.; Kawasaki, T.; Gao, S. Neutron diffraction monitoring of ductile cast iron under cyclic tension–compression. Acta Mater. 2020, 196, 584–594. [Google Scholar] [CrossRef]
Figure 1. Illustration of the different preconditioning treatments: (1) preconditioning at charge (CPUn), (2) preconditioning at last cold charge (LCPUn) (3) preconditioning at tapping (TPUn).
Metals 13 00005 g001
Figure 2. The matrix for the Vickers microhardness test showing the indentation position (♦).
Metals 13 00005 g002
Figure 3. Optical microscopy images of samples unetched and etched of (a) noPUn, (b) CPUn, (c) LCPUn, and (d) TPUn samples.
Metals 13 00005 g003aMetals 13 00005 g003b
Figure 4. Distribution of nodules’ diameters of (a) noPUn, (b) CPUn, (c) LCPUn, and (d) TPUn samples; (e) Log-normal distribution of nodules diameters for each treatment.
Metals 13 00005 g004aMetals 13 00005 g004b
Figure 5. Graphite nodules classification by area (%) according to the classification of ISO-945 standard for each sample: (a) noPUn, (b) CPUn, (c) LCPUn and (d) TPUn, where III—Class III, V—Class V, VI—Class VI and R—remain classes.
Metals 13 00005 g005
Figure 6. SEM images of (a) noPUn, (b) CPUn, (c) LCPUn, and (d) TPUn samples showing examples of microparticles observed.
Metals 13 00005 g006
Figure 7. SEM images of (a) LCPUn and (b) TPUn samples showing complex non-metallic inclusion detected inside graphite nodules.
Metals 13 00005 g007
Figure 8. EBSD analysis of microparticles was present in SEM images of Figure 7. The secondary electron images (a,d) show the EBSD point of analysis, the (b,df) the Kikuchi pattern indexed as AlMg2.5Si2.5N6, (c) ferrite matrix, and MgS or CaS and (g,h) the lattice structure of the complex microparticle phases indexed.
Metals 13 00005 g008
Figure 9. SEM images and unique grain color maps of (a) noPUn, (b) CPUn, (c) LCPUn, and (d) TPUn.
Metals 13 00005 g009
Figure 10. Grain size distributions of (a) noPUn, (b) CPUn, (c) LCPUn, and (d) TPUn; (e) Log-normal distribution of grain size for each treatment.
Metals 13 00005 g010
Figure 11. Inverse pole figure (IFP) maps in [001] direction superimposed with image quality images and inverse pole figures for each sample: (a) noPUn, (b) CPUn, (c) LCPUn, and (d) TPUn.
Metals 13 00005 g011
Figure 12. Kernel misorientation map (KAM) superimposed with image quality for each sample: (a) noPUn, (b) CPUn, (c) LCPUn, and (d) TPUn.
Metals 13 00005 g012
Figure 13. OM image and hardness distribution maps of the samples: (a) noPUn, (b) CPUn, (c) LCPUn, and (d) TPUn.
Metals 13 00005 g013
Table 1. Chemical composition (wt.%) of Mg-Ferrosilicon and preconditioner used. Fe is balance.
AlloyCaAlZrMgSi
Mg–Ferrosilicon1.5–2.00.0–0.8_5.75–6.2544–48
Zr-(Ca, Al) Preconditioner0.6–1.93.0–5.03.0–5.0_62–69
Table 2. Summarized sample identification.
Sample IDNomenclature
noPUnNo preconditioning
CPUnCharge preconditioning
LCPUnLast Cold charge preconditioning
TPUnTapping preconditioning
Table 3. Chemical composition (wt.%) of the samples.
Sample IDC *SiPCE 1MnMgCuSO * [ppm]N * [ppm]
noPUn3.552.420.024.360.210.040.020.0096.0049.00
CPUn3.462.450.024.280.200.050.020.0083.0052.00
LCPUn3.512.480.024.340.200.040.020.00917.9049.00
TPUn3.532.470.024.360.200.050.020.0098.4948.80
1 CE = equivalent carbon calculated according to the equation: CE = %C + (%Si + %P)/3. * bulk concentration of O, N, and C also used combustion techniques.
Table 4. Results of image analysis quantification and Brinell hardness results.
SamplenoPUnCPUnLCPUnTPUn
Graphite nodule size (µm)44444842
Graphite particle count (mm−2)134151122200
%Ferrite36.6641.2751.0255.59
%Pearlite36.6640.8425.1225.49
%Graphite9.4810.2310.8412.67
%Carbides or microparticles10.077.6613.026.25
HBW 2.5/187.5177 ± 6172 ± 8175 ± 6165 ± 3
Table 5. EDS chemical composition (at%) of the zones identified in Figure 7.
ZoneMgOSCaNAlSiTiCFeNbMain Elements
Z112.62.5--13.20.915.8-54.50.5-Mg-Si-Al-N
Z215.12.0--18.92.718.03.040.3--Ti-Zr-C-N
Z37.02.4--19.50.57.012.548.6-2.5Nb-Ti-C
Z411.91.913.3-----73.0--Mg-O-S
Z517.22.9--31.65.320.4-22.6--Mg-Si-Al-N-O
Z66.2-3.70.7-----89.4-Mg-Ca-S
Table 6. Summary of the compounds found and identified in the graphite nodules in each sample.
noPUnCPUnLCPUnTPUn
AlMg2.5Si2.5N6
Mg-Ca-O
Mg-Ca-S
AlMg2.5Si2.5N6
Mg-Si-Al-O-N
AlMg2.5Si2.5N6
Mg-Ca-O
Mg-Si-Al-O-N
Ti-Zr-C-N
MgS
AlMg2.5Si2.5N6
MgO
MgS
Mg-Ca-S
Disclaimer/Publisher’s Note: The statements, opinions and data contained in all publications are solely those of the individual author(s) and contributor(s) and not of MDPI and/or the editor(s). MDPI and/or the editor(s) disclaim responsibility for any injury to people or property resulting from any ideas, methods, instructions or products referred to in the content.

