Article

Effect of Stress Ratio and Evaluation of Crack Sizes on Very-High-Cycle-Fatigue Crack Propagation Life Prediction of Carburized Cr-Ni Steel

1
School of Materials Science and Engineering, Inner Mongolia University of Technology, Hohhot 010051, China
2
School of Mechanical Engineering, Inner Mongolia University of Technology, Hohhot 010051, China
*
Author to whom correspondence should be addressed.
Metals 2022, 12(9), 1485; https://doi.org/10.3390/met12091485
Submission received: 17 August 2022 / Revised: 5 September 2022 / Accepted: 6 September 2022 / Published: 8 September 2022
(This article belongs to the Special Issue Fracture Mechanism and Fatigue Behaviour of Metallic Materials)

Abstract

:
Carburized Cr-Ni steel is widely used in the manufacture of components in many fields due to excellent performance, of which the service life has been a concern. In order to investigate the high-cycle-fatigue and very-high-cycle-fatigue properties of carburized Cr-Ni gear steel, axial loading fatigue tests were performed by QBG-100 with stress ratios of −1, 0 and 0.3. The Generalized Pareto distribution was used to evaluate the inclusion size of carburized Cr-Ni gear steel. Based on the stress ratio and the evaluated crack size, a new fatigue life prediction model for carburized Cr-Ni gear steels was constructed. The results show that the S–N characteristics of carburized Cr-Ni gear steel represent the continuously descending tendency. Based on the long crack propagation threshold and the instability propagation threshold of carburized Cr-Ni gear steel, the sizes of FGA, fisheye and surface smooth area (SSA) can be evaluated, respectively. In addition, the maximum size of surface and interior inclusion of carburized Cr-Ni gear steel are 17.50 μm and 6.46 μm with a cumulative probability of 99.9%. By validating the new established model, the prediction result is acceptable according to the good consistency between the predicted life and the experimental life.

1. Introduction

Gear steels are widely used for the manufacturing of core parts in the fields of the automobile industry, military weapons, engineering machinery and aerospace due to their excellent mechanical properties and fatigue resistance in combination with their good hardenability [1,2]. With the rapid development of technology in various countries, higher requirements for the safety and stability of mechanical equipment have been put forward in service life. For the consideration of economy, efficiency and energy, parts made of gear steel usually need to bear a loading of more than 107 cycles [3]. However, the low/high-cycle-fatigue (LCF/HCF) theory and analysis methods cannot be applicable for the fatigue life prediction of mechanical products or components manufactured by gear steels in the very-high-cycle-fatigue (VHCF) region [4,5,6]. Therefore, in order to ensure the long-term safety and stability of mechanical parts, it is necessary to further investigate the fatigue behavior and relevant fatigue life evaluation methods of gear steel in the VHCF region.
In order to improve the mechanical property of gear steel, carburizing [7,8], nitriding [9] or shot peening [10] are usually used to strengthen the surface of steel. Nonetheless, a small number of studies have indicated that surface strengthening cannot obviously improve the interior fatigue performance of gear steel. With an increase in fatigue life and a decrease in stress amplitude, the fatigue crack source of gear steel gradually transitions from surface to interior, and the interior non-metallic inclusion produced by metallurgy becomes the main crack source of gear steel [11,12,13,14,15]. The damage mechanism of VHCF is very different from that of LCF/HCF [16,17,18], which has aroused the interest of many scholars. Some studies have shown that fisheyes formed by crack propagation are often seen on fracture surfaces as a typical feature of interior failure. Sometimes a rough area appears around the inclusion, which was called the fine granular area (FGA) by Sakai [19]. The formation of the FGA is thought to be the result of grain refinement based on stress concentration at the inclusions, which is different from the grain boundary fracture mechanism based on grain boundary intrusion and grain boundary extrusion [20]. It has been confirmed by many scholars that the formation of the FGA consumes more than 90% of the fatigue life of the gear steels [21,22]. Therefore, the FGA plays an important role for life prediction in the VHCF regime.
With the higher demand for the long-term effectiveness of components, the fatigue performance of the VHCF regime for gear steels has attracted the attention of domestic and foreign scholars, and some fatigue strength or life prediction models have been proposed. Based on the dislocation theory, Tanaka and Mura [23,24] established a fatigue crack initiation model considering defects and microstructure characteristics. Based on the Basquin equation, Liu et al. [25] proposed a model including Vickers hardness and inclusion size to predict the fatigue life of high-strength steel in very-high-cycle systems. Hou et al. [26] constructed a fatigue life prediction model considering the average stress and stress ratio based on Kachanov’s damage law [27]. Based on the cumulative damage method, Deng et al. [28] proposed a fatigue life prediction model of Inclusion-FGA-Fisheye failure under different stress ratios. Benedetti et al. [29] established a new multi-axial fatigue criterion based on the theory of critical distances and defect sensitivity, which in turn led to a more accurate prediction of the multi-axial plain and notch fatigue strength of thick-walled ductile iron with multi-axial flat and tangent. Surprisingly, although the effect of different factors (such as inclusion size, FGA size, fisheye size, stress amplitude, etc.) on the fatigue performance of gear steel has been studied, more models invariably neglect the utility of the stress intensity factor in the fatigue failure process, and thus fail to characterize the stress field strength near the elastic crack tip under external forces. In addition, numerical software, such as ANSYS and ABAQUS, which have achieved excellent performance in the field of physical field analysis of structures or fluids, have been widely used in fatigue life prediction one after another. Mazlan et al. [30] achieved life prediction with good agreement with the test results at room temperature and high temperature by importing the tensile strength, ultimate strength, modulus of elasticity and life cycle of aluminum as valid parameters into the ANSYS Workbench. However, the life prediction of alloy steels based on numerical simulations is still strongly limited considering the stochastic nature of crack feature sizes such as inclusions and the complexity of failure mechanisms. In conclusion, few studies have clearly established a fatigue life assessment method involving both crack characteristic sizes and a stress intensity factor threshold.
The scope of this study here concerns the fatigue failure analysis of carburized Cr-Ni steels due to crack propagation in the VHCF regime and prediction of the VHCF life of carburized alloy steels under uni-axial loading at multiple stress ratios. The QBG-100 high-frequency fatigue test machine with a frequency of about 95 Hz was used to conduct a VHCF test on carburized gear steel at R = −1, 0 and 0.3. After the test, the crack characteristics of the gear steel were studied according to the experimental results. The inclusion size was evaluated based on the Generalized Pareto (GP) distribution, and the FGA size, fisheye size and surface smooth area (SSA) size were evaluated by the stress intensity factor threshold. Based on the stress ratio and evaluation of crack sizes, a life prediction model of carburized Cr-Ni gear steel in the VHCF regime was established. With the objective of improving the accuracy of fatigue failure analysis and the life prediction of carburized Cr-Ni steels in actual engineering practice, the theoretical framework proposed based on the VHCF regime is of great value and serves as an effective reference for fatigue reliability studies.

2. Materials and Methods

2.1. Material and Specimen

In this paper, all fatigue tests were performed in accordance with the Chinese national standard GB/T3075. The chosen material was Cr-Ni gear steel with nominal chemical composition of 3.65Ni, 1.65Cr, 0.60Mn, 0.37Si, 0.16C, 0.035S, 0.035P and other Fe. The cylindrical material was machined as a standard hourglass specimen, and the geometric shape and dimensional parameters are shown in Figure 1. The total length, minimum cross-sectional diameter and radius of the middle arc of the specimen are 152 mm, 4.5 mm and 60 mm, respectively. In order to minimize the influence of surface scratch left by machining on the fatigue test, the middle arc part of each specimen was sequentially polished along the axis of the specimen with sandpapers of 360–2400#, to ensure that the surface roughness (Ra) of the specimen reached 0.32 [31]. Further, the fatigue specimens were carburized in a vacuum furnace at 930 °C for 8 h. They were then quenched in oil after the furnace temperature was reduced to 860 °C for half an hour. Finally, they were tempered at 170 °C for 3 h, air cooling.

2.2. Microstructure and Mechanical Properties

The fatigue specimen was taken out and cut along the minimum section perpendicular to the axis of the specimen with a cutting machine. Then, the cutting section was sequentially polished with sandpapers of 360–2000# until the surface reached the mirror face. Subsequently, the metallographic specimen was etched at room temperature for 90 s with an ethanol-nitric acid etch solution. Finally, a scanning electron microscope (SEM) (Thermo Fisher Scientific, Waltham, MA, USA) was used to observe the microstructure on the surface of the corroded metallographic specimen, as shown in Figure 2. According to Figure 2a, the microstructure of the carburizing layer and the matrix are quite different. Austenites and acicular martensites are the main microstructures in the carburizing layer, while low carbon lath martensite is the main microstructure in the matrix. In addition, the non-metallic inclusion can be found in both the carburizing layer and matrix.
Based on the method of continuous stiffness measurement, a nano indenter G200 (Shanghai NTI Co., Ltd., Shanghai, China) was used to measure the micro-hardness of the carburized layer and matrix region of the fatigue specimen. The relationship between the Vickers hardness (HV) and the distance from the surface depth (x) is shown in Figure 3. It can be seen that the HV for the specimen surface was the largest, about 990 kgf/mm2. The Vickers hardness decreases with increases in the depth from the surface of the specimen, and tends to be stable when x reaches 1200 μm. As a result, the depth of the carburizing layer of the fatigue specimen was about 1200 μm, and the HV of matrix was about 613 kgf/mm2. According to linear fitting, the relationship between HV and x is expressed as:
{ H V = 995.64 0.32 x x < 1200   μ m H V = 613 x 1200   μ m
The WDW-100 tensile tester (Shanghai Bairoe Test Instrument Co., Ltd., Shanghai, China) was used to tensile strength test at room temperature with a stretching rate of 5 mm/min. Finally, the measured tensile strength (σb) of carburized Cr-Ni gear steel was about 1780 MPa.

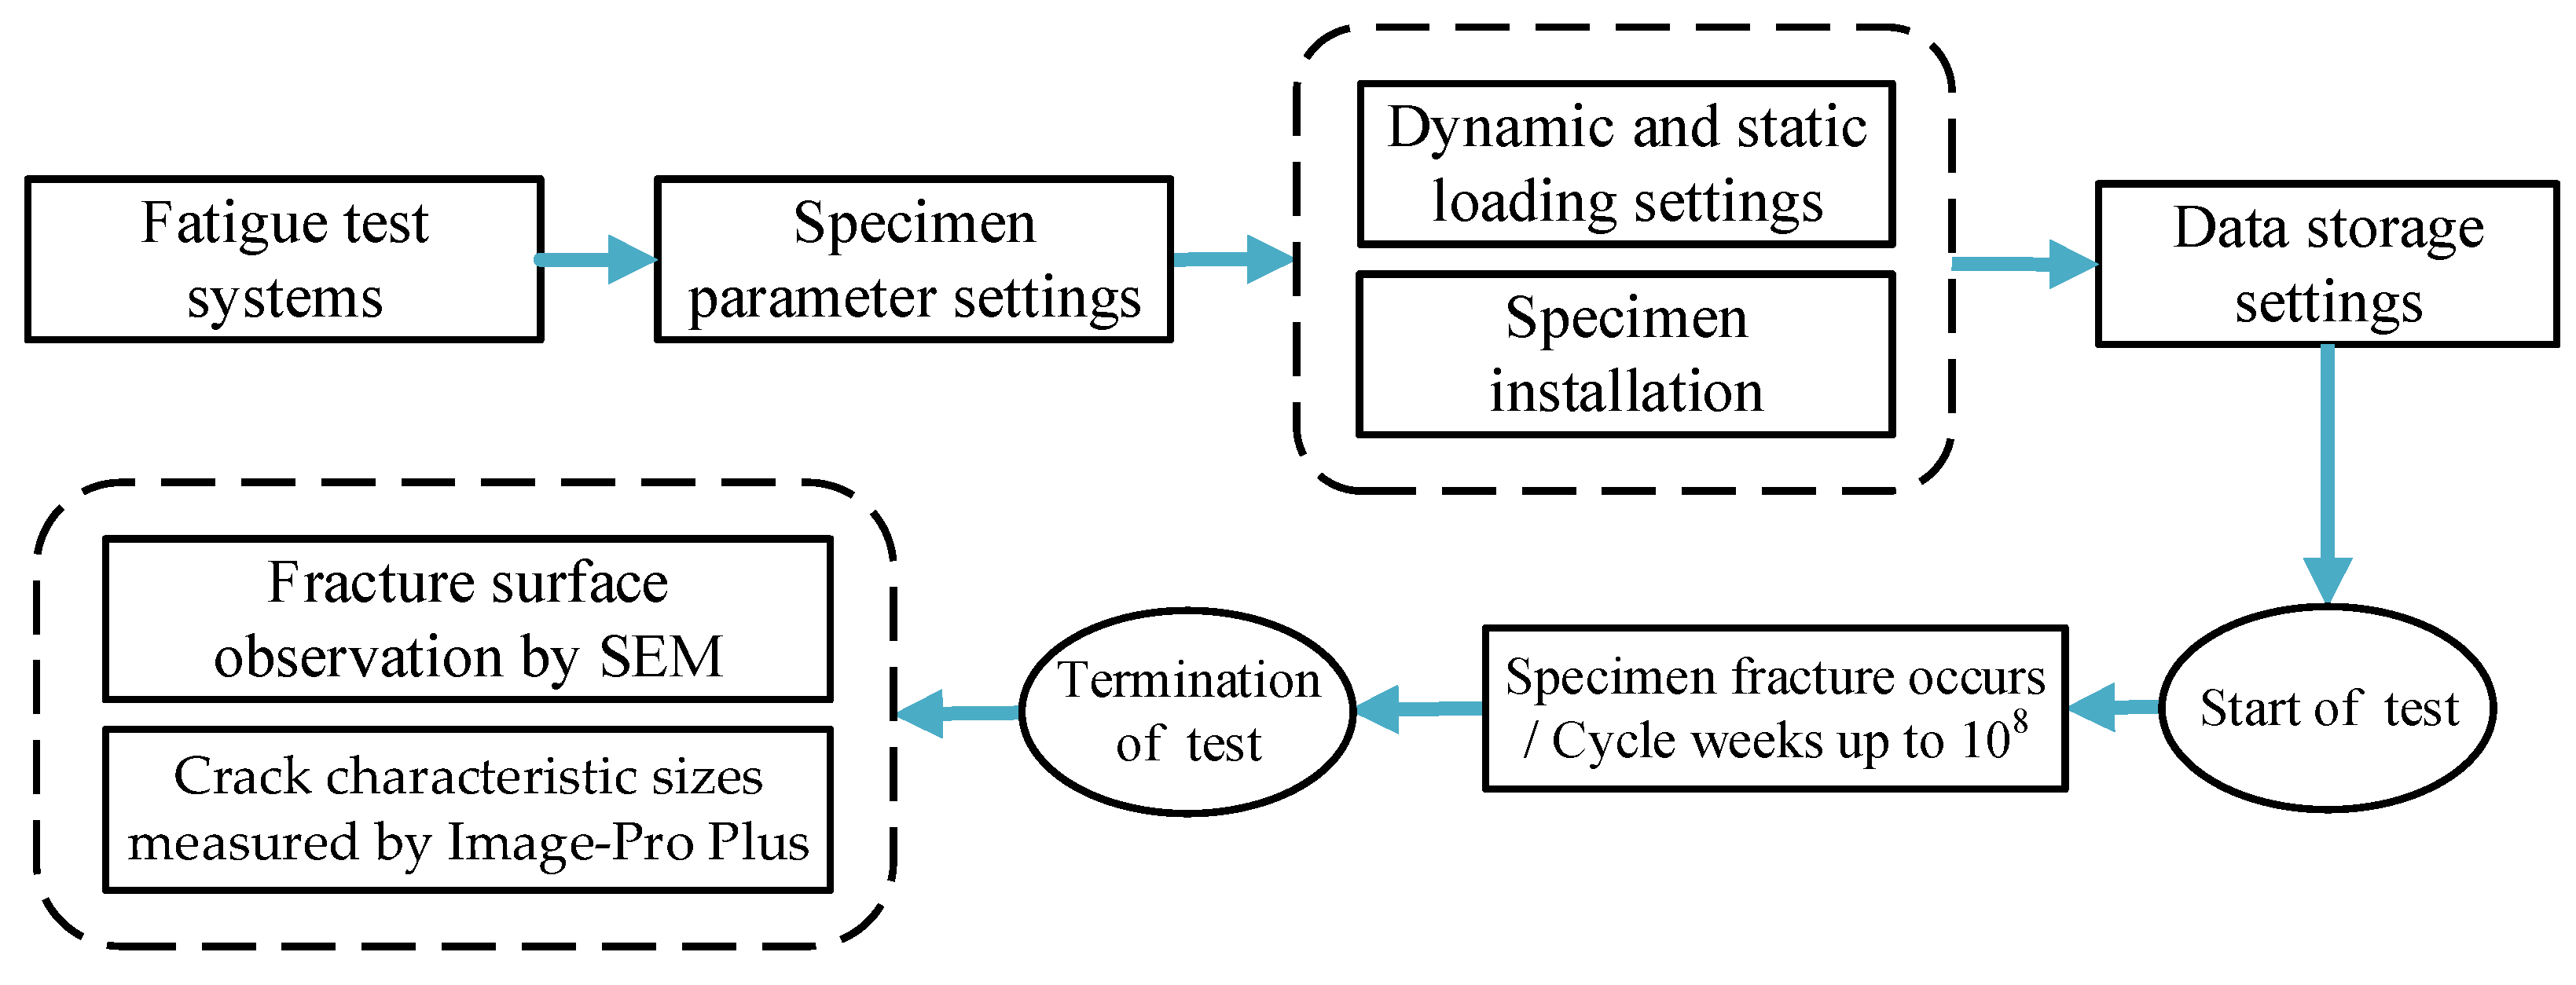
2.3. Fatigue Testing Method

The general flow chart of the fatigue test is shown in Figure 4. The VHCF test was carried out on the fatigue specimens at room temperature by using an axially loaded high-frequency fatigue tester (QBG-100) (Changchun Qian Bang Test Equipment Co., Ltd., Changchun, China). The test frequency was about 95 Hz and the stress ratios were −1, 0 and 0.3. When the specimen was completely fractured or the number of cycles reached 108 cycles, the test was terminated. Finally, a total of 46 effective data were obtained. After the fatigue test, the fracture surfaces of all fatigue failure specimens were observed by SEM. The crack characteristic sizes, including inclusion, FGA, fisheye and surface smooth area (SSA), were measured by the post-processing software of Image-Pro Plus (version 6.0, Media Cybernetics Inc, Rockville, MD, USA).

3. Results and Discussion

3.1. Fatigue S–N Characteristics

The relationships between the stress amplitude and fatigue life of carburized Cr-Ni gear steel at R = −1, 0 and 0.3 are plotted in Figure 5. As can be seen from Figure 5, the S–N curve presents “single shape” at R = −1, while the S–N curve presents “step or duplex shape” at R = 0 and 0.3. The fatigue strength decreases with increases in fatigue life, and there is no traditional fatigue limit. Fatigue cracks in both short-life and long-life specimens are derived from non-metallic inclusions. Furthermore, the method of fatigue test is based on the principle of electromagnetic resonance. For both surface and interior failure, the operating frequency of specimen is almost the same during the test. As a result, the structural response of different failure modes is the same. Then, the early crack characteristic size is very limited, while the fracture is very rapid when the crack extends to a certain extent, regardless of the failure mode. This also means that the influence of the failure mode and the failure process on the structural response is negligible. In this paper, based on the crack direction and inclusion’s location observed by SEM, it can be roughly divided into surface failure and interior failure, as shown in Figure 6a,e. FGA are found around the inclusion for the interior failure with fatigue life higher than 5 × 10⁵ cycles. Based on the traditional defining method of the surface fatigue limit of alloy materials, the surface fatigue limits (σW-S) at R = 0 and 0.3 are 600 MPa and 473 MPa, respectively. In this paper, the fatigue strength with 108 cycles is defined as the fatigue limit of carburized Cr-Ni gear steel, so the fatigue limits of carburized Cr-Ni gear steel with stress ratios of −1, 0 and 0.3 are 580 MPa, 490 MPa and 374 MPa, respectively. Obviously, the fatigue limit of carburized Cr-Ni gear steel decreases with increases in the stress ratio.

3.2. Typical Fracture Observation

As mentioned above, the fatigue failure of the specimen is all induced by non-metallic inclusion, as shown in Figure 6. Combining the crack initiation location and failure fracture morphology, fatigue failure modes can be divided into surface failure and interior failure, which can be further divided into interior failure with FGA and interior failure without FGA.
For interior failure, it can be seen from Figure 6a,c that fisheye around inclusion is a common phenomenon. By magnifying the crack source image, it was found that FGA could be found around the inclusion on the fracture surface of the specimen with a fatigue life higher than 5 × 10⁵ cycles, as shown in Figure 6d, whereas there was no FGA on the fracture surface of the specimen with a fatigue life lower than 5 × 10⁵ cycles, as shown in Figure 6b. By analyzing the fracture morphology, the fracture surface of FGA is rough with fine grains inside (Figure 6d), while the fisheye outside FGA is relatively flat with some tearing ridges and river ridges (Figure 6c). The fracture surface outside the fisheye is rougher with more river lines and some dimples (Figure 6a). In summary, the interior fatigue failure process without FGA can be divided into three stages: (i) inclusion, (ii) fisheye and (iii) transient zone, as shown in Figure 6a. In contrast, the fatigue failure process with FGA is divided into four stages: (i) inclusion, (ii) fine granular area, (iii) fisheye and (iv) transient zone, as shown in Figure 6c.
For surface failure, the stress concentration around the inclusion will induce crack propagation under the combined actions of applied loading and high surface hardness. A smooth region centered on the inclusion can be observed on the surface of fatigue failure fracture, which is called the surface smooth area (SSA). Fatigue cracks propagate rapidly outside the SSA, forming an elliptical rough area composed of radial cracks, which is called the surface rough area (SRA), as shown in Figure 6e,f.

3.3. Evaluation of Crack Sizes of FGA, Fisheye and SSA

It is necessary to study the stress intensity factors for crack characteristic regions to further clarify the fatigue properties of materials. From the viewpoint of small crack fracture mechanics, the stress intensity factor ranges at the crack tip can be evaluated by using a model proposed by Murakami [32]. Accordingly, the range of the stress intensity factor for interior non-metallic inclusions, FGA and fisheye, ΔKinc, ΔKFGA and ΔKfisheye, can be uniformly defined as:
Δ K inc ,   FGA   or   fisheye = 2 π Δ σ π R inc ,   FGA   or   fisheye
where Δσ represents the range of the applied stress, and Rinc, FGA or fisheye represents the radius of inclusions, FGA or fisheye.
Similarly, the range of the stress intensity factor corresponding to surface inclusion and SSA, ΔKinc-s and ΔKSSA, can be defined as [33]
Δ K inc - s   or   SSA = Δ σ π R inc - s   or   SSA
Based on the above equation, the relations of ΔKinc, ΔKinc-s, ΔKFGA, ΔKfisheye and ΔKSSA with Nf are shown in Figure 7. The values of ΔKinc tend to decrease with increases in the fatigue life, whereas the values of ΔKFGA and ΔKfisheye have nothing to do with the fatigue life. As can be seen from Figure 7b, when the stress ratio is −1, the value of ΔKFGA is 6.42–8.03 MPa∙m1/2, with an average value of 7.33 MPa∙m1/2, as shown by the black dotted line. When the stress ratio is 0, the value of ΔKFGA is 5.99–6.46 MPa∙m1/2, with an average value of 6.31 MPa∙m1/2, as shown in the red dotted line. When the stress ratio is 0.3, the value of ΔKFGA is 4.59–4.70 MPa∙m1/2, with an average value of 4.64 MPa∙m1/2, as shown in the blue dotted line. As can be seen from Figure 7c, when the stress ratio is −1, the value of ΔKfisheye ranges 33.52–39.84 MPa∙m1/2, with an average value of 36.77 MPa∙m1/2, as shown in the black dotted line. When the stress ratio is 0, the value of ΔKSSA is 26.53–28.48 MPa∙m1/2, and the value of ΔKfisheye is 25.98–29.30 MPa∙m1/2. The mean values are very similar, and are about 27.72 MPa∙m1/2, as shown by the red dotted line. When the stress ratio is 0.3, the value of ΔKSSA is 15.86–16.74 MPa∙m1/2, and the value of ΔKfisheye is 15.89–16.37 MPa∙m1/2. The mean values are very similar, and are about 16.19 MPa∙m1/2, as shown by the blue dotted line. In addition, ΔKFGA is defined as the interior long crack propagation threshold of carburized Cr-Ni gear steel, and ΔKfisheye or SSA is defined as the interior crack instability propagation threshold of carburized Cr-Ni gear steel.
Since ΔKFGA, ΔKfisheye and ΔKSSA are independent of the fatigue life of carburized Cr-Ni gear steel and show horizontal fitting lines, the sizes of FGA, fisheye and SSA can be evaluated by means of the internal long crack propagation threshold and the instability propagation threshold of carburized Cr-Ni gear steel, respectively. Namely:
R FGA   and   or   fisheye = π ( Δ K FGA   or   fisheye 4 σ a ) 2
R SSA = 1 π ( Δ K SSA 2 σ a ) 2
where σa is the stress amplitude, and ΔK’ represents the average value of the interior long crack propagation threshold and the instability propagation threshold.

3.4. Evaluation of Inclusion Size

The inclusion sizes at each fracture surface of the fatigue specimens can be obtained by SEM, and the inclusion sizes are independent random variables. Thus, based on the GP distribution, the cumulative distribution function the inclusion size is [34]
F ( R inc   or   inc - s ) = 1 [ 1 + ξ ( R inc   or   inc - s μ τ ) ] 1 ξ
where τ, μ and ξ represent scale parameters, threshold parameters and shape parameters, respectively. With a given probability, the inclusion size can be expressed as
R inc   or   inc - s = μ τ ξ ( 1 ( 1 F ( R inc   or   inc - s ) ) ξ )
Based on the genetic algorithm and the inclusion sizes measured, the values of τ, μ and ξ of GP distribution are 19.08, 7.60 and −1.92 for interior failure and are 8.52, 3.83 and −3.23 for surface failure, correspondingly. Therefore, the cumulative probability of inclusion size can be established according to the GP distribution function, as shown in Figure 8. The inclusion size can be well evaluated by GP distribution, and Zhao et al. [35] also had the same conclusion. If the inclusion size with a cumulative probability of 99.9%, represented by Rinc or inc-s,99.9%, is defined as the maximum inclusion size for carburized Cr-Ni gear steel, then the maximum inclusion size is 17.50 μm for interior failure and is 6.46 μm for surface failure.

3.5. Fatigue Crack Growth Life Assessment

Based on the Paris rule, the prediction model of the crack propagation rate is shown as follows [36]
d a d N = C ( Δ K ) m
where a is the crack length, N is the fatigue life and C and m are material constants.
To consider the effect of the stress ratio, a new parameter of (ΔK+)1-α(Kmax)α [37] is used to replace the stress intensity factor range, ΔK, where ΔK+ is the positive part of the stress intensity factor range and Kmax is the maximum value of the stress intensity factor. In addition, the crack closure/opening coefficient, U(U = 0.55 + 0.33R + 0.12R2 [38]), is introduced to modify the equation, so the crack growth propagation model can be rewritten as
d a d N = C ( U ( Δ K + ) 1 α ( K max ) α ) m
where Kmax can be expressed as
K max = { 2 π σ max π R inc Interior   failure σ max π R inc - s Surface   failure
The relationship between ΔK+ and ΔK’max can be written as
Δ K + = { ( 1 R ) K max R 0 K max R < 0
Based on integrating from inclusion size to critical crack size (Rc), a fatigue life prediction model can be obtained:
N pre = 2 R inc   or   inc - s C ( m 2 ) ( U ( K max ) α ( Δ K + ) 1 α ) - m [ 1 ( R inc   or   inc - s   R c ) m 2 1 ]
For surface failure, it is considered that fatigue failure occurs when cracks expand to the maximum size of the SSA. Therefore, Rc in Equation (12) is taken as RSSA. A life prediction model of carburized Cr-Ni gear steel for the inclusion-SSA-SRA failure is obtained
N pre = 2 R inc - s C ( m 2 ) ( ( 0.55 + 0.33 R + 0.12 R 2 ) ( ( 1 R ) σ a 2 π R inc - s ) ) - m [ 1 ( R inc - s   R SSA ) m 2 1 ]
For interior failure without FGA, it is considered that fatigue failure occurs when cracks expand to the maximum size of the fisheye. Therefore, Rc in Equation (12) is taken as Rfisheye. Thus, a life prediction model of carburized Cr-Ni gear steel for the inclusion-fisheye failure can be obtained
N pre = 2 R inc C ( m 2 ) ( ( 0.55 + 0.33 R + 0.12 R 2 ) ( ( 1 R ) σ a 2 π R inc ) ) - m [ 1 ( R inc   R fisheye ) m 2 1 ]
For interior failure with FGA, the formation process of FGA consumes more than 90% of the life. Therefore, the FGA size is an important parameter to evaluate the fatigue life. In this paper, the life of FGA is approximately equal to the whole life of the fatigue specimen. Rc in Equation (12) is taken as RFGA, so a life prediction model of carburized Cr-Ni gear steel for the inclusion-FGA-fisheye failure can be obtained
N pre = 2 R inc C ( m 2 ) ( ( 0.55 + 0.33 R + 0.12 R 2 ) ( ( 1 R ) σ a 2 π R inc ) ) - m [ 1 ( R inc   R FGA ) m 2 1 ]
Based on the experimental data and least square method, C, m and α can be obtained, as shown in Table 1. The final fatigue life prediction results are shown in Figure 9. Life prediction results have a good agreement with experimental life, and most of the points fall between the upper factor-of-five and lower factor-of-three lines. Therefore, the life prediction method of carburized Cr-Ni gear steel within HCF and VHCF is reasonable.

3.6. Modification of Fatigue Life Prediction Model

In fact, it is impossible to obtain the size of each crack characteristic before the fatigue failure occurs. Therefore, SSA, FGA and fisheye sizes can be evaluated by Equations (4) and (5), and the maximum inclusion size can be obtained by Equation (7), so the modified fatigue life prediction model of carburized Cr-Ni gear steel can be expressed as
N pre = { 2 R inc - s , 99 . 9 % C ( m 2 ) ( U ( ( 1 R ) σ a 2 π R inc - s , 99 . 9 % ) ) - m [ 1 ( 4 π σ a 2 R inc - s , , 99 . 9 %   ( Δ K SSA ) 2 ) m 2 1 ]   Surface   failure 2 R inc , 99 . 9 % C ( m 2 ) ( U ( ( 1 R ) σ a 2 π R inc , 99 . 9 % ) ) - m [ 1 ( 16 σ a 2 R inc , 99 . 9 %   π ( Δ K fisheye ) 2 ) m 2 1 ]   Interior   failure   without   FGA 2 R inc , 99 . 9 % C ( m 2 ) ( U ( ( 1 R ) σ a 2 π R inc , 99 . 9 % ) ) - m [ 1 ( 16 σ a 2 R inc , 99 . 9 %   π ( Δ K FGA ) 2 ) m 2 1 ]   Interior   failure   with   FGA
Based on the maximum size of inclusion and the stress intensity factor threshold of internal long crack propagation and the instability propagation, the predicted life of Cr-Ni gear steel can be obtained, as shown in Figure 10. It can be seen that the predicted fatigue life is very accurate compared with experimental data based on a factor of three line. In other words, the fatigue life prediction model based on the stress ratio and evaluation of crack sizes can well evaluate the fatigue life of carburized Cr-Ni gear steel.

4. Conclusions

The HCF and VHCF properties of carburized Cr-Ni alloy steel at R = −1, 0 and 0.3 were studied by using a high-frequency fatigue tester (QBG-100). A fatigue life prediction model of carburized Cr-Ni gear steel was proposed in this paper. The main findings of this paper were as follows:
  • The S–N curve of carburized Cr-Ni gear steel shows a continuous downward tendency. Fatigue failure modes of carburized Cr-Ni alloy steel at R = −1, 0 and 0.3 are divided into surface failure, interior failure with FGA and interior failure without FGA.
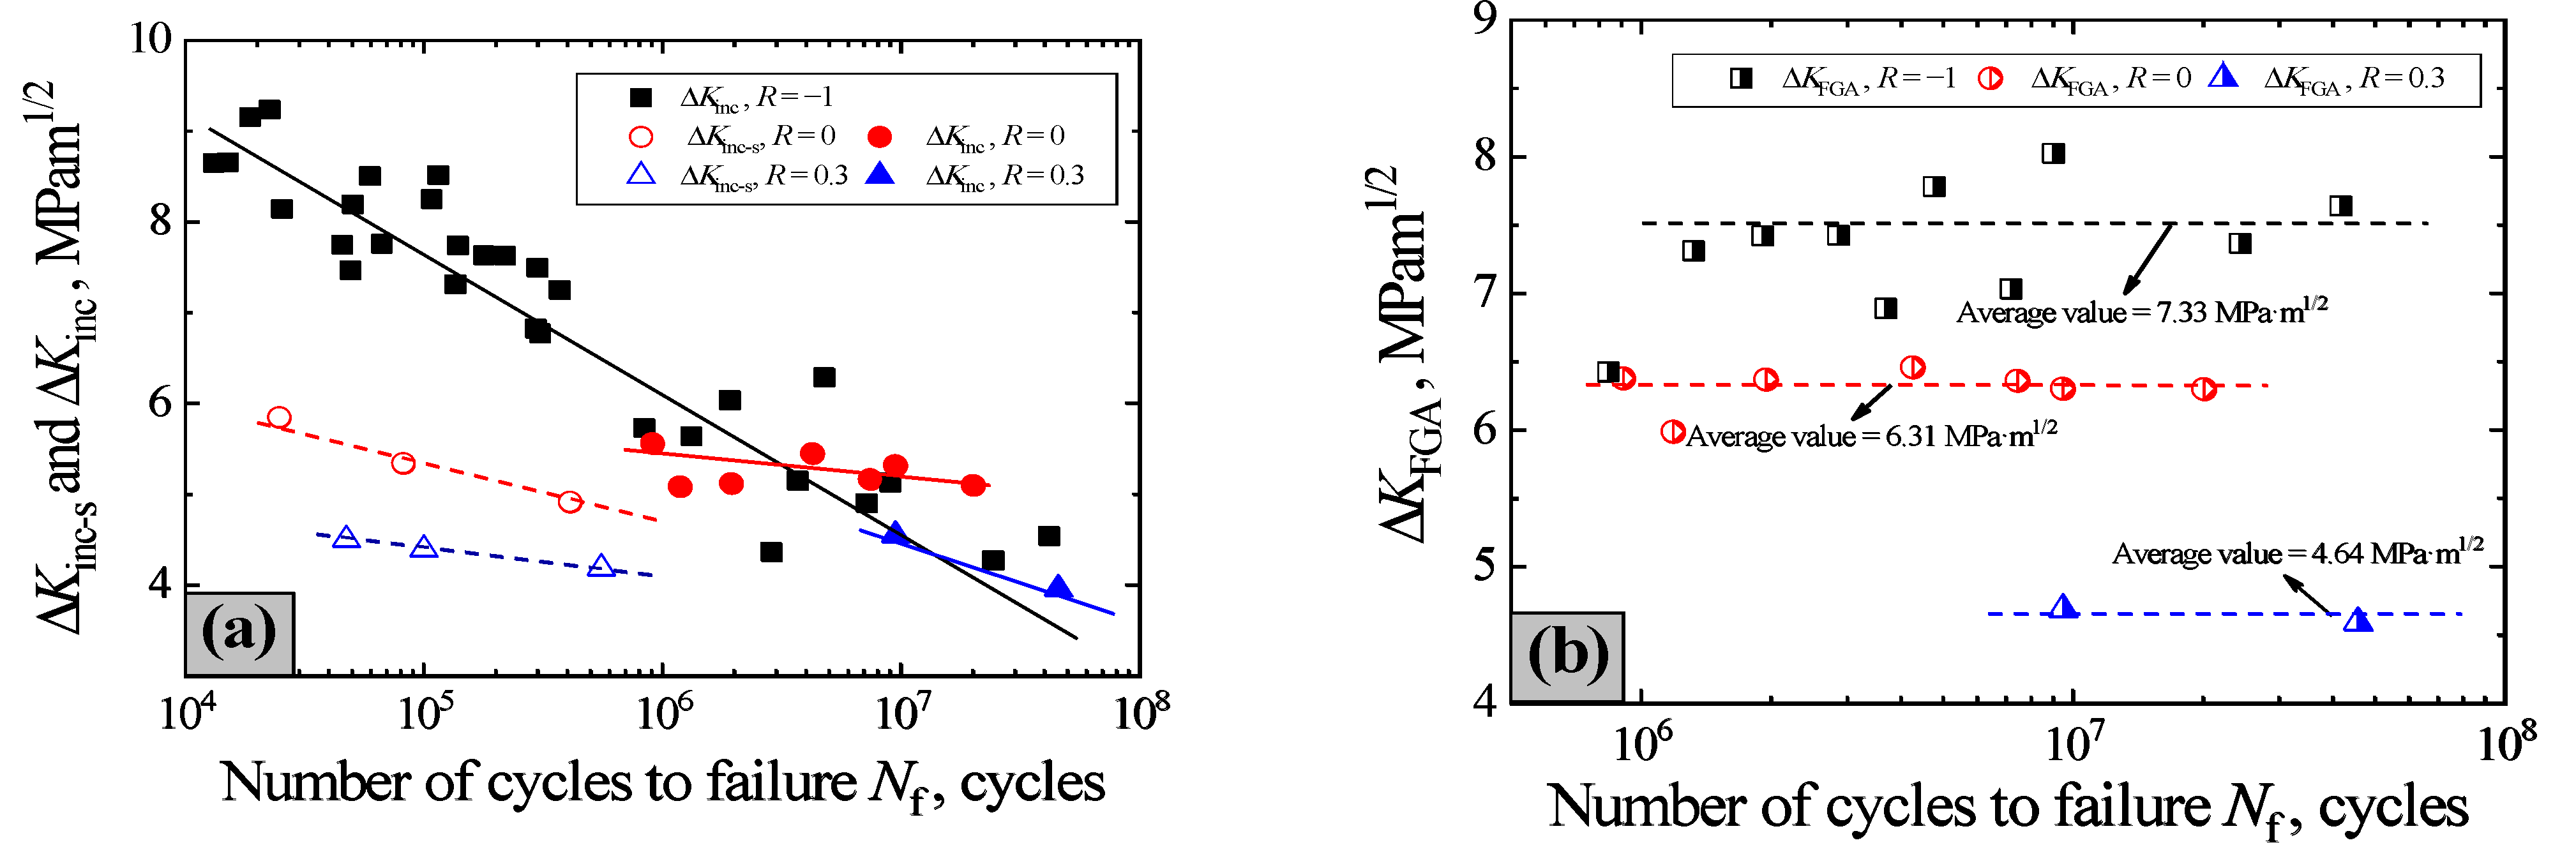
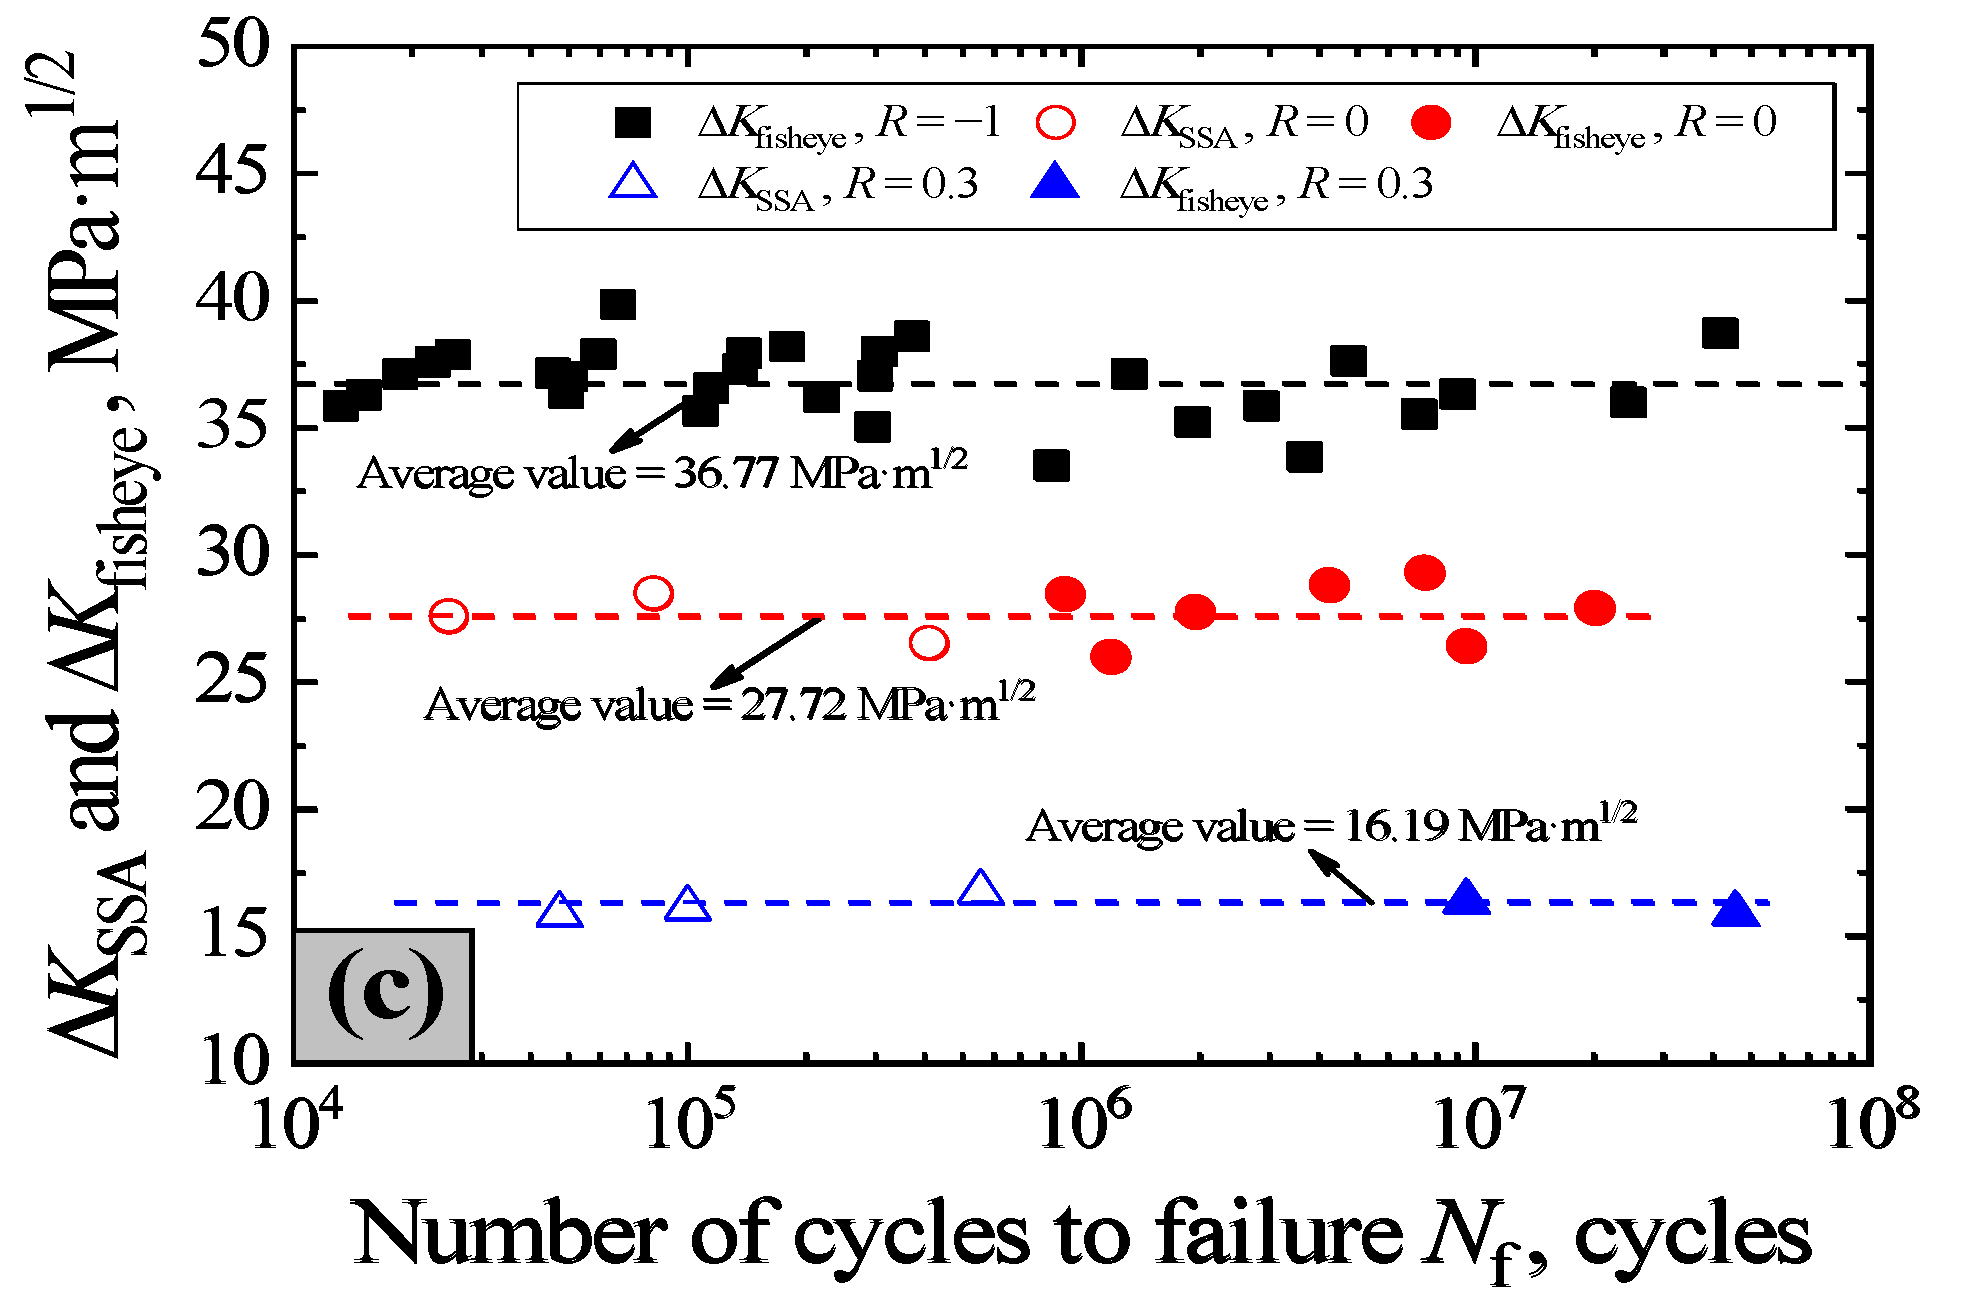
  • Based on the stress intensity factor of the internal long crack propagation threshold and the instability propagation threshold of carburized Cr-Ni gear steel, the evaluation sizes of FGA, fisheye and SSA can be obtained, respectively.
  • By using the Generalized Pareto distribution, the inclusion size was evaluated, and the maximum inclusion sizes of interior failure and surface failure were 17.50 μm and 6.46 μm, respectively, at a cumulative probability of 99.9%.
  • Based on the stress ratio and evaluation of crack sizes, a new prediction model of the fatigue failure life of carburized Cr-Ni gear steel was proposed, and the prediction result was good.
Current research has focused on the very-high-cycle-fatigue performance of carburized alloys at room temperature. The specific effect of the stress ratio on small cracks is still more controversial, and further elucidation of the failure mechanism in this direction is essential. In addition, metal fatigue under high temperature effects exhibits very different failure modes and fracture mechanisms compared to room temperature. In view of the fact that a wide range of parts are subjected to high temperature conditions, it is necessary to make an in-depth study in this field in conjunction with engineering practice.

Author Contributions

F.C. conceived and designed the experiment; Y.G. and B.L. performed the experiments; H.Y. observed the fracture surfaces; H.D. analyzed and processed the data; Y.G. and H.D. wrote the paper. All authors have read and agreed to the published version of the manuscript.

Funding

The authors gratefully appreciate the financial support granted by the Inner Mongolia Science and technology plan project (No. 2022YFSJ0019), Natural Science Foundation of Inner Mongolia (No. 2021LHMS05009 and No. 2022MS05014), Basic scientific research business expenses of universities directly under the Inner Mongolia Autonomous Region (No. JY20220233), Higher Education Research Project of Inner Mongolia (No. NJZY21306) and Foundation Sciences Research Project of the Inner Mongolia University of Technology (No. ZY202005).

Data Availability Statement

Not applicable.

Acknowledgments

Thanks to Kang Heming, Li Mingkai and Li Yongping in Inner Mongolia University of Technology for their technical supports in this research work.

Conflicts of Interest

The authors declare no conflict of interest.

References

  1. Wang, Z.Y.; Xing, Z.G.; Wang, H.D.; Shan, D.B.; Huang, Y.F.; Xu, Z.H.; Xie, F.K. The relationship between inclusions characteristic parameters and bending fatigue performance of 20Cr2Ni4A gear steel. Int. J. Fatigue 2021, 155, 106594. [Google Scholar] [CrossRef]
  2. Wang, Y.H.; Yang, Z.N.; Zhang, F.C.; Qin, Y.M.; Wang, X.B.; Lv, B. Microstructures and properties of a novel carburizing nano-bainitic bearing steel. Mat. Sci. Eng. Struct. 2020, 777, 139086. [Google Scholar] [CrossRef]
  3. Marines, I.; Bin, X.; Bathias, C. An understanding of very high cycle fatigue of metals. Int. J. Fatigue 2003, 25, 1101–1107. [Google Scholar] [CrossRef]
  4. Sun, R.; Li, W.; Zhang, Y.C.; Wang, P.; Ji, B.; Sakai, T. Microstructure related failure mechanism of selective laser melted GH4169 with interior fatigue cracking. Mater. Lett. 2022, 308, 131284. [Google Scholar] [CrossRef]
  5. Li, Z.; Zhou, S.; Yang, C.; Yong, Q. High/very high cycle fatigue behaviors of medium carbon pearlitic wheel steels and the effects of microstructure and non-metallic inclusions. Mater. Sci. Eng. A 2019, 764, 138208. [Google Scholar] [CrossRef]
  6. Paolino, D.S.; Tridello, A.; Fiocchi, J.; Biffi, C.A.; Chiandussi, G.; Rossetto, M.; Tuissi, A. VHCF response up to 109 cycles of SLM AlSi10Mg specimens built in a vertical direction. Appl. Sci. 2019, 9, 2954. [Google Scholar] [CrossRef]
  7. Chen, W.; He, X.F.; Yu, W.C.; Wang, M.Q.; Yao, K.F. Microstructure, Hardness, and Tensile Properties of Vacuum Carburizing Gear Steel. Metals 2021, 11, 300. [Google Scholar] [CrossRef]
  8. Cheng, P.F.; Li, Y.K.; Yu, W.C.; Yang, S.P.; Hu, F.Z.; Shi, J.; Wang, M.Q.; Li, L. Comparison of Very High Cycle Fatigue Properties of 18CrNiMo7-6 Steel after Carburizing and Pseudo-carburizing. J. Mater. Eng. Perform. 2020, 29, 8340–8347. [Google Scholar] [CrossRef]
  9. Sun, Z.D.; Hou, D.B.; Li, W. Effect of Carburizing and Nitriding on Fatigue Properties of 18Cr2Ni4WA Steel in Very High Cycle Fatigue Regime. ACSM 2021, 45, 207–2150. [Google Scholar] [CrossRef]
  10. Yan, H.Z.; Zhu, P.F.; Chen, Z.; Zhang, H.; Zhang, Y.; Zhang, Y. Effect of shot peening on the surface properties and wear behavior of heavy-duty-axle gear steels. J. Mater. Res. Technol. 2021, 17, 22–32. [Google Scholar] [CrossRef]
  11. Shi, Z.Y.; Li, J.J.; Zhang, X.D.; Shang, C.J.; Cao, W.Q. Influence Mechanisms of Inclusion Types on Rotating Bending Fatigue Properties of SAE52100 Bearing Steel. Materials 2022, 15, 5037. [Google Scholar] [CrossRef] [PubMed]
  12. Gu, C.; Liu, W.Q.; Lian, J.h.; Bao, Y.P. In-depth analysis of the fatigue mechanism induced by inclusions for high-strength bearing steels. Int. J. Miner. Metall. Mater. 2021, 28, 826–834. [Google Scholar] [CrossRef]
  13. Xiao, W.; Bao, Y.-p.; Gu, C.; Wang, M.; Liu, Y.; Huang, Y.-s.; Sun, G.-T. Ultrahigh cycle fatigue fracture mechanism of high-quality bearing steel obtained through different deoxidation methods. Int. J. Miner. Metall. Mater. 2021, 28, 804–815. [Google Scholar] [CrossRef]
  14. Gu, C.; Lian, J.; Bao, Y.; Münstermann, S. Microstructure-based fatigue modelling with residual stresses: Prediction of the microcrack initiation around inclusions. Mater. Sci. Eng. A 2019, 751, 133–141. [Google Scholar] [CrossRef]
  15. Vantadori, S.; Ronchei, C.; Scorza, D.; Zanichelli, A.; Araújo, L.C.; Araújo, J.A. Influence of non-metallic inclusions on the high cycle fatigue strength of steels. Int. J. Fatigue 2022, 154, 106553. [Google Scholar] [CrossRef]
  16. Pyttel, B.; Schwerdt, D.; Berger, C. Very high cycle fatigue–Is there a fatigue limit? Int. J. Fatigue 2011, 33, 49–58. [Google Scholar] [CrossRef]
  17. Hong, Y.; Lei, Z.; Sun, C.; Zhao, A. Propensities of crack interior initiation and early growth for very-high-cycle fatigue of high strength steels. Int. J. Fatigue 2014, 58, 144–151. [Google Scholar] [CrossRef]
  18. Stanzl-Tschegg, S. Very high cycle fatigue measuring techniques. Int. J. Fatigue 2014, 60, 2–17. [Google Scholar] [CrossRef]
  19. Sakai, T.; Oguma, N.; Morikawa, A. Microscopic and nanoscopic observations of metallurgical structures around inclusions at interior crack initiation site for a bearing steel in very high-cycle fatigue. Fatigue Fract. Eng. Mater. Struct. 2015, 38, 1305–1314. [Google Scholar] [CrossRef]
  20. Chlupova, A.; Sulak, I.; Babinsky, T.; Polak, J. Intergranular fatigue crack initiation in polycrystalline copper. Mater. Sci. Eng. A 2022, 848, 143357. [Google Scholar] [CrossRef]
  21. Tanaka, K.; Akiniwa, Y. Fatigue crack propagation behaviour derived from S-N data in very high cycle regime. Fatigue Fract. Eng. Mater. Struct. 2002, 25, 775–784. [Google Scholar] [CrossRef]
  22. Wang, Q.Y.; Berard, J.Y.; Rathery, S.; Bathias, C. High-cycle fatigue crack initiation and propagation behaviour of high-strength spring steel wires. Fatigue Fract. Eng. Mater. Struct. 2003, 22, 673–677. [Google Scholar] [CrossRef]
  23. Tanaka, K.; Mura, T. A Dislocation Model for Fatigue Crack Initiation. J. Appl. Mech. 1981, 48, 97–103. [Google Scholar] [CrossRef]
  24. Tanaka, K.; Mura, T. A theory of fatigue crack initiation at inclusions. Metall. Trans. A 1982, 13, 117–123. [Google Scholar] [CrossRef]
  25. Liu, Y.B.; Li, Y.D.; Li, S.X.; Yang, A.G. Prediction of the S-N curves of high-strength steels in the very high cycle fatigue regime. Int. J. Fatigue 2010, 32, 1351–1357. [Google Scholar] [CrossRef]
  26. Hou, S.Q.; Xu, J.Q. Relationship among S-N curves corresponding to different mean stresses or stress ratios. J. Zhejiang Univ.-Sci. A 2015, 16, 885–893. [Google Scholar] [CrossRef]
  27. Kachanov, M.L.; Krajcinovic, D. Introduction to Continuum Damage Mechanics. J. Appl. Mech. 1987, 54, 481. [Google Scholar] [CrossRef]
  28. Deng, H.L.; Liu, B.; Guo, Y.; Guo, Y.P.; Yu, H. Effect of local equivalent stress on fatigue life prediction of carburized Cr-Ni alloy steel based on evaluation of maximum crack sizes. Eng. Fract. Mech. 2021, 248, 107718. [Google Scholar] [CrossRef]
  29. Benedetti, M.; Santus, C.; Raghavendra, S.; Lusuardi, D.; Zanini, F.; Carmignato, S. Multiaxial plain and notch fatigue strength of thick-walled ductile cast iron EN-GJS-600-3: Combining multiaxial fatigue criteria, theory of critical distances, and defect sensitivity. Int. J. Fatigue 2022, 156, 106703. [Google Scholar] [CrossRef]
  30. Mazlan, S.; Yidris, N.; Koloor, S.; Petru, M. Experimental and Numerical Analysis of Fatigue Life of Aluminum Al 2024-T351 at Elevated Temperature. Metals 2020, 10, 1581. [Google Scholar] [CrossRef]
  31. Wang, C.; Liu, Y.; Nikitin, A.; Wang, Q.; Zhou, M. A general scenario of fish-eye crack initiation on the life of high-strength steels in the very high-cycle fatigue regime. Fatigue Fract. Eng. Mater. Struct. 2019, 42, 2183–2194. [Google Scholar] [CrossRef]
  32. Murakami, Y.; Kodama, S.; Konuma, S. Quantitative evaluation of effect of nonmetallic inclusions on fatigue strength of high strength steel. Int. J. Fatigue 1989, 11, 291–298. [Google Scholar] [CrossRef]
  33. Marines-Garcia, I.; Paris, P.C.; Tada, H.; Bathias, C. Fatigue crack growth from small to long cracks in very-high-cycle fatigue with surface and internal “fish-eye” failures for ferrite-perlitic low carbon steel SAE 8620. Mater. Sci. Eng. A 2007, 468, 120–128. [Google Scholar] [CrossRef]
  34. Atkinson, H.V.; Shi, G. Characterization of inclusions in clean steels: A review including the statistics of extremes methods. Prog. Mater. Sci. 2003, 48, 457–520. [Google Scholar] [CrossRef]
  35. Zhao, Y.X.; Zhao, A.G. Maximum Inclusion Size Evaluation and Fatigue Strength Analysis of 40Cr Structural Steel. Mater. Design Process. Commun. 2022, 2022, 163. [Google Scholar] [CrossRef]
  36. Paris, P. A critical analysis of crack propagation laws. J. Basic. Eng. 1963, 85, 528–533. [Google Scholar] [CrossRef]
  37. Kujawski, D. A fatigue crack driving force parameter with load ratio effects. Int. J. Fatigue 2001, 23, 239–246. [Google Scholar] [CrossRef]
  38. Schijve, J. Some formulas for the crack opening stress level. Eng. Fract. Mech. 1981, 14, 461–465. [Google Scholar] [CrossRef] [Green Version]
Figure 1. The dimensions and shape of fatigue specimen (unit: mm).
Metals 12 01485 g001
Figure 2. Microstructure of carburized Cr-Ni gear steel: (a) microstructure in carburized layer, (b) microstructure in matrix and inclusion.
Metals 12 01485 g002
Figure 3. The relationship between the Vickers hardness (HV) and the distance from the surface depth.
Metals 12 01485 g003
Figure 4. The flow chart of fatigue test.
Metals 12 01485 g004
Figure 5. S–N curve of carburized Cr-Ni gear steel.
Metals 12 01485 g005
Figure 6. Observation of typical fracture surfaces: (a,b) interior failure without FGA, (c,d) interior failure with FGA and (e,f) surface failure. (a) Fisheye (σa= 800 MPa, Nf = 370,800 cycles, R = −1). (b) Inclusion without FGA (σa= 800 MPa, Nf = 370,800 cycles, R = −1). (c) Fisheye (σa = 700 MPa, Nf = 4,768,700 cycles, R = −1). (d) Inclusion with FGA (σa= 700 MPa, Nf = 4,768,700 cycles, R = −1). (e) Surface-induced failure (σa = 650 MPa, Nf = 82,100 cycles, R = 0). (f) Inclusion. (σa = 650 MPa, Nf = 82,100 cycles, R = 0).
Metals 12 01485 g006aMetals 12 01485 g006b
Figure 7. Relationship between ΔK and Nf: (a) relationship between ΔKinc-s, ΔKinc and Nf; (b) relationship between ΔKFGA and Nf; and (c) relationship between ΔKSSA, ΔKfisheye and Nf.
Metals 12 01485 g007aMetals 12 01485 g007b
Figure 8. GP distribution of inclusion size: (a) interior inclusion size and (b) surface inclusion size.
Metals 12 01485 g008
Figure 9. Comparison of predicted life and experimental life.
Metals 12 01485 g009
Figure 10. Comparison of predicted life and experimental life after model modification.
Metals 12 01485 g010
Table 1. Best-fit value for identified parameters (C, m and α) in Equation (15).
Interior Failure without FGA
(R = −1)
Interior Failure with FGA
(R = −1)
Surface Failure (R = 0)Interior Failure with FGA (R = 0)Surface Failure (R = 0.3)Interior Failure with FGA
(R = 0.3)
C1.13 × 10−118.97 × 10−131.44 × 10−207.90 × 10−201.28 × 10−124.65 × 10⁻¹⁷
m5.911.1221.8914.8531.406.78
α0.500.500.500.50−2.250.38
Publisher’s Note: MDPI stays neutral with regard to jurisdictional claims in published maps and institutional affiliations.

