Article

Dynamic Prediction Model of Silicon Content in Molten Iron Based on Comprehensive Characterization of Furnace Temperature

1
Hebei Engineering Research Center for the Intelligentization of Iron Ore Optimization and Ironmaking Raw Materials Preparation Processes, North China University of Science and Technology, Tangshan 063210, China
2
College of Science, North China University of Science and Technology, Tangshan 063210, China
3
Hebei Key Laboratory of Data Science and Application, North China University of Science and Technology, Tangshan 063210, China
4
The Key Laboratory of Engineering Computing in Tangshan City, North China University of Science and Technology, Tangshan 063210, China
5
Tangshan Intelligent Industry and Image Processing Technology Innovation Center, North China University of Science and Technology, Tangshan 063210, China
6
College of Metallurgy and Energy, North China University of Science and Technology, Tangshan 063210, China
*
Author to whom correspondence should be addressed.
Metals 2022, 12(9), 1403; https://doi.org/10.3390/met12091403
Submission received: 26 June 2022 / Revised: 17 August 2022 / Accepted: 18 August 2022 / Published: 24 August 2022
(This article belongs to the Special Issue Big Data of Steel and Low Carbon Intelligent Smelting)

Abstract

:
The silicon content of the molten iron is an important indicator of the furnace temperature trend in blast furnace smelting. In view of the multi-scale, non-linear, large time lag and strong coupling characteristics of the blast furnace smelting process, a dynamic prediction model for the silicon content of molten iron is established based on the analysis of comprehensive furnace temperature characterization data. The isolated forest algorithm is used to detect anomalies and analyze the causes of the anomalies in conjunction with the blast furnace mechanism. The maximum correlation-minimum redundancy mutual information feature selection method is used to reduce the dimensionality of the furnace temperature characterization data. The grey correlation analysis with balanced proximity is used to obtain the correlation between the furnace temperature characterization parameters and the silicon content of the molten iron at different time lags and to integrate the furnace temperature characterization data set. The GRA-FCM model is used to divide the parameter set of the integrated furnace temperature characterization and construct a parameter directed network from multiple control parameters to multiple state parameters. The GWO-SVR model is used to predict the state parameters of each delay step by step to achieve dynamic prediction of the silicon content of the molten iron. Finally, the control parameters are adjusted backwards according to the prediction results of the state parameters and the silicon content of the molten iron and expert experience to achieve accurate control of the furnace temperature. Starting from the actual production situation of a blast furnace, the characteristic parameters are divided into control parameters and state parameters. This model establishes a multi-step dynamic prediction and closed-loop control model of “control parameters-state parameters-silicon content in hot metal-control parameters”.

1. Introduction

Blast furnace ironmaking is a complex metallurgical process, combining a variety of characteristics of a hybrid process industry. In particular, there are many uncertainties, as weather and dust can cause inaccurate data detection. Data coupling is serious and often a state variable is influenced by multiple control variables. The reaction process is complex, and blast furnace iron making is a complex smelting process of solid, liquid and gas co-existence, with non-linearity and strong time lag [1,2,3]. The furnace temperature is an important indicator in blast furnace smelting. A high furnace temperature will lead to a decrease in iron product grade, increase energy consumption of the blast furnace and affect the service life of the blast furnace. However, too low a furnace temperature can also cause major accidents in the blast furnace, resulting in economic losses [4,5]. Furnace temperature is divided into chemical temperature and physical temperature, where the chemical temperature is often expressed in terms of the silicon content in the iron. As the furnace temperature rises, the silicon content in the molten iron gradually increases, and the silicon content of the molten iron is approximately linearly related to the temperature [6,7]. In practice, workers often judge the thermal operating conditions of the blast furnace by the silicon content of the molten iron.
Ordinary mathematical models have difficulties accurately simulating the complex operating state of blast furnaces. In recent years, with the sharp increase in blast furnace production data, the data-driven intelligent prediction model of furnace temperature has become the focus of many scholars’ research. Chen Jianhua et al. proposed an operational optimisation control method for the iron quality of the blast furnace smelting process by optimising the tonne iron production cost index, case inference techniques and the empirical knowledge of the blast furnace manager [8]. Jiang Chaohui et al. proposed a blast furnace iron silicon content prediction method based on the migration of optimal working conditions to address the problem of frequent fluctuations of process variables and the large time lag characteristics of the smelting process [9]. Yin Linzi et al. addressed the problem of iron silicon content data records and the A k-means++ clustering algorithm-based method for iron silicon content data optimization was proposed to address difficulties such as unbalanced data records and difficulty in making reasonable correlations with input variables [10]. In short, these studies are based on the historical data of the blast furnace to improve the algorithm [11,12,13,14]. However, the blast furnace is a complex smelting system with discrete addition, continuous smelting and discrete output, so the static prediction model has difficulties meeting the actual production needs of the factory. If the algorithmic process can simulate different stages of blast furnace production, dynamic prediction of the silicon content of the hot metal will be achieved.
In this paper, a dynamic prediction model of silicon content in molten iron based on comprehensive characterization of furnace temperature is established. Firstly, the anomalies in the blast furnace data are removed in order to retain the anomalies caused by non-equipment factors such as collapsed or suspended material as far as possible. Combined with the blast furnace operation mechanism, this paper comprehensively analyzes the furnace temperature data, and selectively eliminates the abnormal data of the blast furnace. Secondly, the characteristic parameters of the blast furnace are coupled with time-delay. In order to obtain the coupling relationship between the furnace temperature characterization parameters, a method for dividing the furnace temperature characterization parameter set is proposed in this paper. Through correlation analysis, we obtained the correlation coefficients between the furnace temperature characterization parameters at different time delays, and divided the furnace temperature characterization parameter set. A dynamic prediction model is established to predict the characterization parameters on the optimal path step by step to achieve the dynamic prediction of the silicon content of the molten iron. We adjust the control parameters according to the predicted results, and finally control the furnace temperature within the ideal range. The blast furnace dynamic control system is shown in Figure 1. The feeder system, the air supply system, the blowing system, and the gas treatment system transmit real-time data to the intelligent prediction system in turn, wherein the real-time data includes control parameters and state parameters. Through calculation, the intelligent prediction system predicts the value of the unknown state parameter, and adjusts the control parameters in the air supply system and the blowing system according to the prediction result.

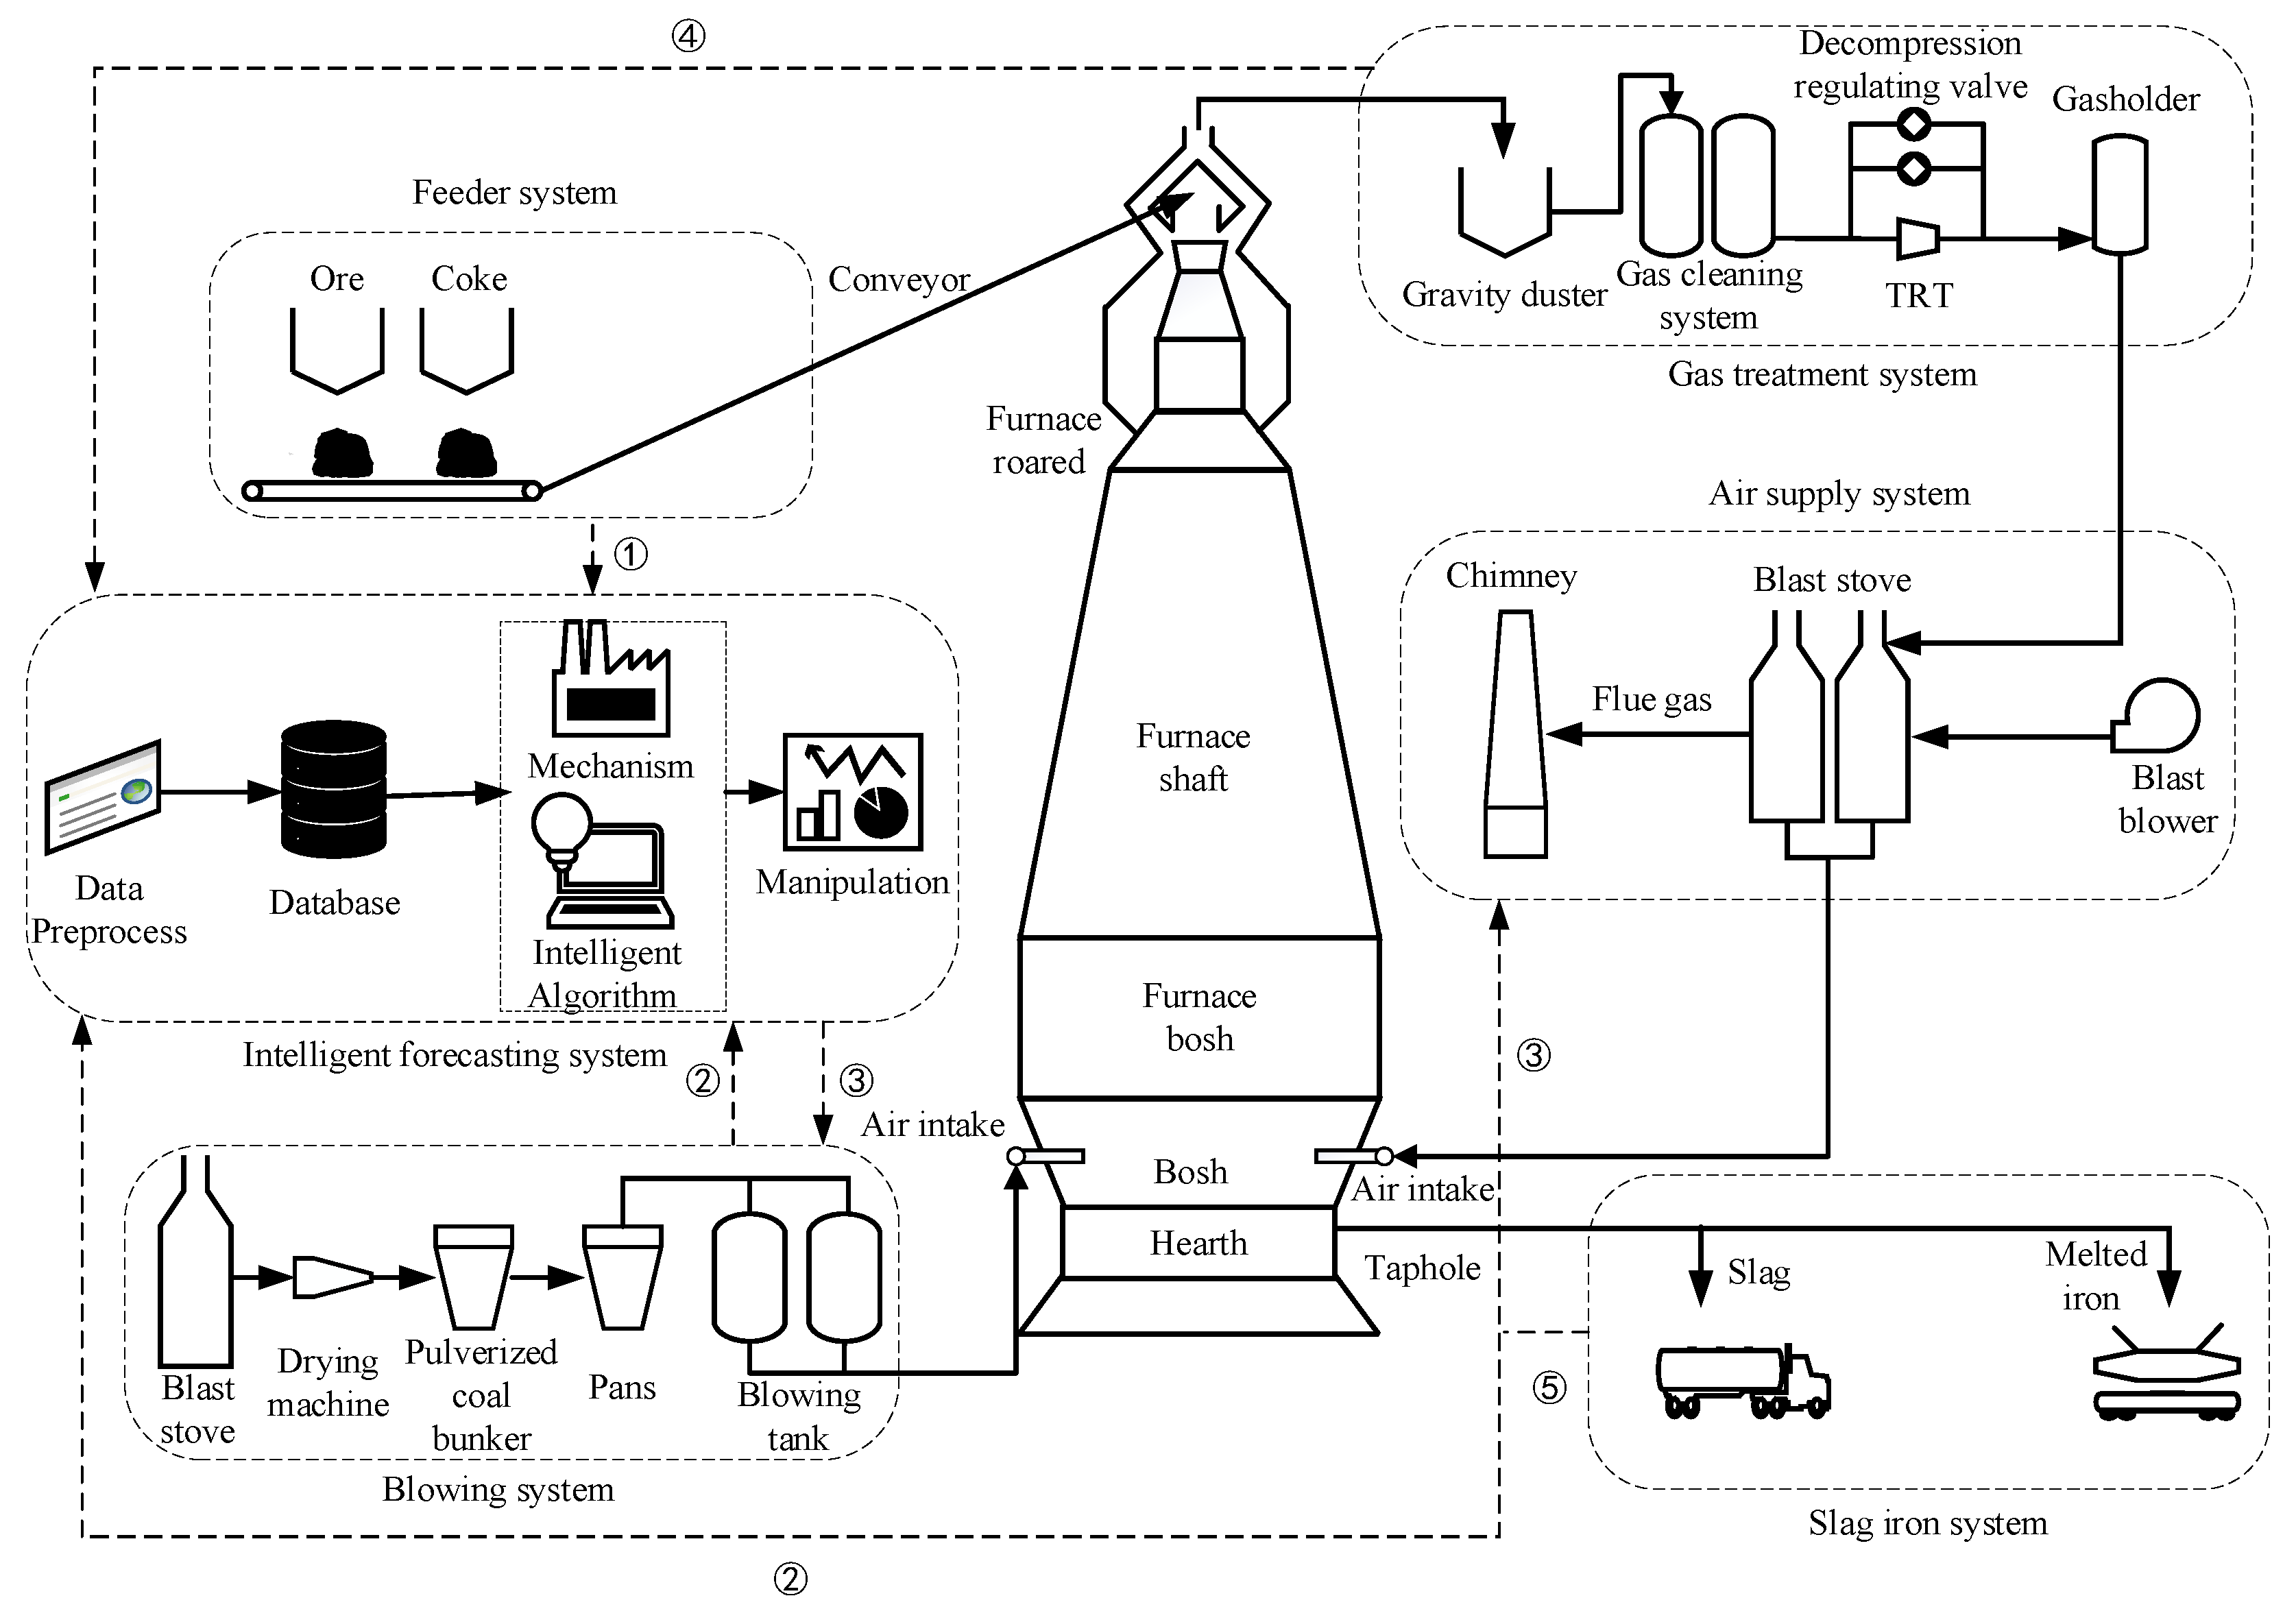
2. Mechanistic Research

2.1. Relevant Response Studies

2.1.1. Silicon Content of Iron

The silicon in the blast furnace is mainly derived from SiO2 in the coke ash, which accounts for about 70% of the coke [15]. In addition, SiO2 in pulverized coal and gangue in ore is also an important source of silicon in the furnace. Gangue will become molten slag at high temperature, and SiO2 in slag, pulverized coal and coke exists in free state, so under high temperature conditions SiO2 reacts with elemental C and element iron in coke in a reduction reaction equation (Equations (1)–(3)) as:
SiO 2 + 2 C = [ Si ] + 2 CO
K = f Si w [ Si ] · p CO 2 a C · a SiO 2
SiO 2 + 2 C + Fe = [ FeSi ] + 2 CO
K is the thermodynamic equilibrium constant, f S i the activity coefficient of Si in the iron, p CO 2 is the partial CO 2 pressure in the furnace, Pa, a C is the activity of C in the iron, w [ Si ] is the concentration of silicon content in molten iron, and a SiO 2 is the activity of Si in the slag.
SiO2 can also be reduced by iron carbide (Fe3C) (Formula (4)):
SiO 2 + 2 [ Fe 3 C ] = [ FeSi ] + 5 Fe + 2 CO
When the temperature increases, the K value increases, and w [ Si ] also increases. It can be seen that the increase in furnace temperature facilitates the reduction in SiO2 in coke ash. The silicon content of the molten iron is positively correlated with the furnace temperature [16].

2.1.2. Theoretical Combustion Temperature

The theoretical combustion temperature is mainly related to the coke, the humidity of the blast, and the temperature of the blast [17]. It is generally estimated using Equation (5):
T = Q 1 + Q 2 + Q 3 Q 4 V × c p g  
Q 1 is the heat absorbed by the decomposition of the blown material and the moisture in the furnace, Q 2 is the heat released by the burning of the coke at the air outlet, Q 3 is the heat released by the generation of CO from the C in the furnace, Q 4 is the blast temperature, V is the amount of gas in the furnace cylinder, and c p g is the specific heat capacity of the gas.

2.1.3. Breathability Index

The permeability index is used to measure the permeability of the charge, the higher the index, the lower the resistance to the passage of gas through the charge [18,19,20]. The permeability index is often used to detect blast furnace conditions such as overhanging to charge, crumbling charge and gas loss and is calculated using the Formula (6) as:
T = Q P 1 P 2 = Q Δ P  
Q represents the blast flow rate, Δ P represents the full differential pressure of the air volume, and P 1 , P 2 represents the hot air pressure and top air pressure, respectively.

2.1.4. The Reduction Behavior of H2

H 2 plays an important role in blast furnace smelting as a reducing agent. Taking 570 °C as the boundary, the reduction reaction formula of H2 to iron oxide is (Equations (7)–(11)):
Above 570 °C:
3 Fe 2 O 3 + H 2 = 2 Fe 3 O 4 + H 2 O
Fe 3 O 4 + H 2 = 3 FeO + H 2 O
FeO + H 2 = Fe + H 2 O
Below 570 °C:
Fe 3 O 4 + 4 H 2 = 3 Fe + 4 H 2 O
3 Fe 2 O 3 + H 2 = 2 Fe 3 O 4 + H 2 O
The study found that with the increase in the H 2 ratio in the furnace, the silicon content in the molten iron showed a downward trend [21].

2.2. Classification of the Furnace Parameters

Blast furnace parameters are divided into status parameters and control parameters. The status parameters reflect the operating condition of the blast furnace, mainly including the amount of gas in the belly of the furnace, permeability index, oxygen enrichment rate, top pressure, etc. The control parameters are the parameters needed to regulate the status of the blast furnace, mainly including hot air pressure, cold air flow, blast humidity and oxygen enrichment flow, etc. [22,23,24,25]. In the blast furnace smelting process, workers observe the changes of state parameters to judge the operation state of the blast furnace. Then, workers adjust corresponding control parameters to realize real-time control of the blast furnace temperature.
The blast furnace consists of five major operating systems: the fabric system; the pulverized coal blowing system; the hot air system; the blast furnace gas handling system; and the iron discharge system [26,27,28,29]. The control parameters are mainly distributed in the pulverized coal blowing system, the air supply system, and the operation of the blast furnace is often controlled in real time by adjusting the pulverized coal blowing system and the air supply system. In the event of serious deviations in furnace temperature, a combination of fabric systems is used for comprehensive control. For example, by changing the speed and distribution of the ore and coke charge, the coke ratio and the permeability of the charge column in the furnace are controlled, thus achieving a rise or fall in furnace temperature.

2.3. Coupling of Furnace Temperature Parameters

Furnace temperature is influenced by several control parameters of the blast furnace and there is a certain coupling with these control parameters. The main control parameters include: coal injection; hot air flow; oxygen enrichment flow; roof pressure; blast air humidity; blast air temperature; CO2 content of the roof gas as well as coke ash and Sulphur content [30,31,32,33]. When increasing the blast air humidity, the water blown into the blast furnace will undergo a heat absorption reaction to produce hydrogen and oxygen, lowering the furnace temperature. When increasing the amount of coal blast, the pulverized coal will first undergo a heat absorption reaction to lower the theoretical combustion temperature in the furnace. However, as the charge drops, the pulverized coal sprayed into the furnace at high temperatures will burn and exothermically increase the furnace temperature, so the effect of coal spraying on the furnace temperature has a large time lag. Increasing the blast temperature can increase the furnace temperature by blowing heat directly into the furnace cylinder, so the time lag of the blast temperature on the furnace temperature is less. The blast temperature control parameter allows for faster real time control of the furnace temperature than the coal injection control parameter. Increasing the oxygen enrichment flow rate increases the burn rate of the blown fuel, reduces the N2 content of the gas and increases the concentration of CO gas in the furnace, promoting indirect reactions and thus increasing the furnace temperature.

2.4. Parameter Regulation
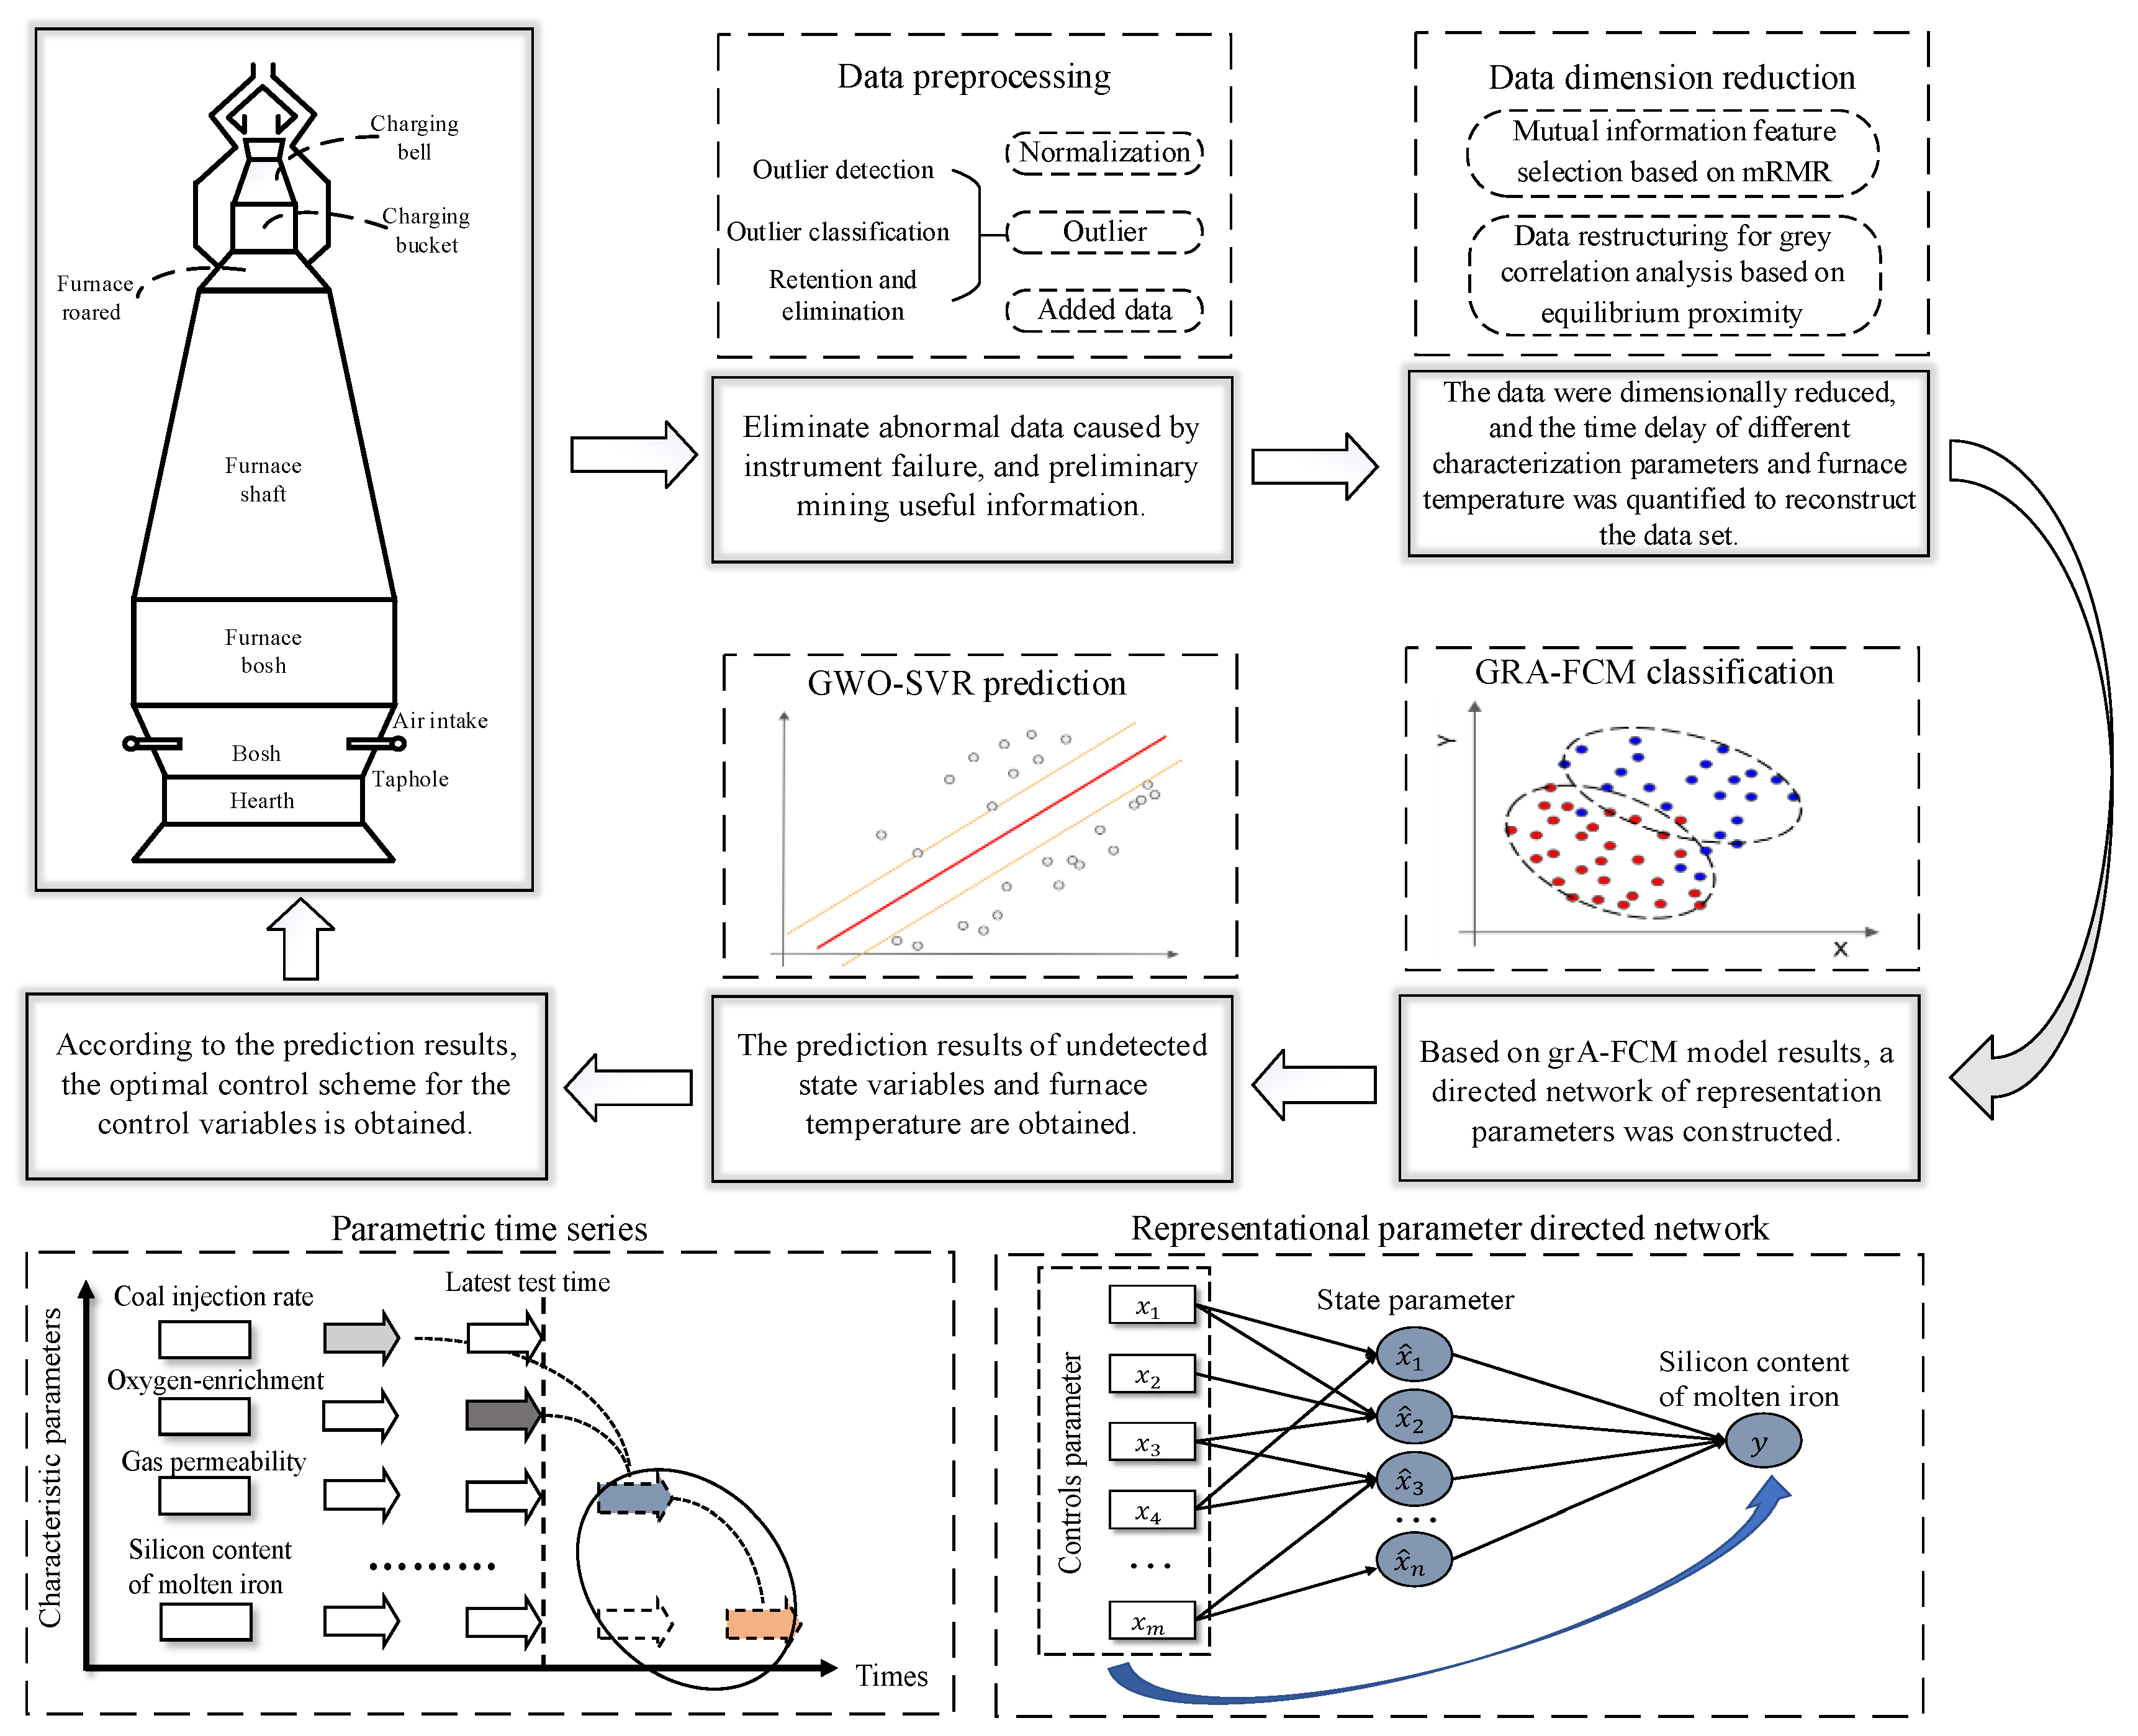
From the economic efficiency of smelting and the effectiveness of regulation, the order of the control parameters chosen to regulate the furnace temperature is: coal injection; oxygen-rich flow; blast temperature; blast humidity; coke load; coke ash, etc. [34,35]. Among them, the coal injection volume, oxygen enrichment flow and blast temperature are often carried out simultaneously, and this is due to the fact that increasing the coal injection volume leads to a lower replacement ratio in the furnace, which can significantly affect the smelting efficiency of the blast furnace [36]. By increasing the oxygen enrichment flow rate and the blast temperature the initial heat loss from the coal injection in the furnace can be supplemented and the gas burns rate increased, thus improving the effect of the initial coal injection operation on the theoretical combustion temperature.
The operating status of the blast furnace is judged by observing the changes in the status parameters and the corresponding control parameters are regulated in real time. For example, when the furnace temperature tends to heat up, the permeability index and oxygen enrichment rate in the status parameters will drop, and the charging speed of the charge will decrease while the air pressure will gradually increase. In this case, the coal injection quantity of the control parameters can be reduced first, and at the same time, the oxygen enrichment flow rate and the blast temperature can be adjusted according to the different furnace temperature to the hot condition in combination with several control parameters. Such is the existence of the phenomenon of slow decline in the furnace charge, you can reduce the amount of coal injection and, at the same time, the oxygen flow increases. When the material speed is normal and the furnace temperature is high, you can properly adjust the coke load. In addition, if some of the control parameters are adjusted out of their normal setting range, the same must be combined with other multiple control parameters for comprehensive adjustment, so that the status parameters and furnace temperature return back to the normal level.

3. Model Building

3.1. Data Pre-Processing

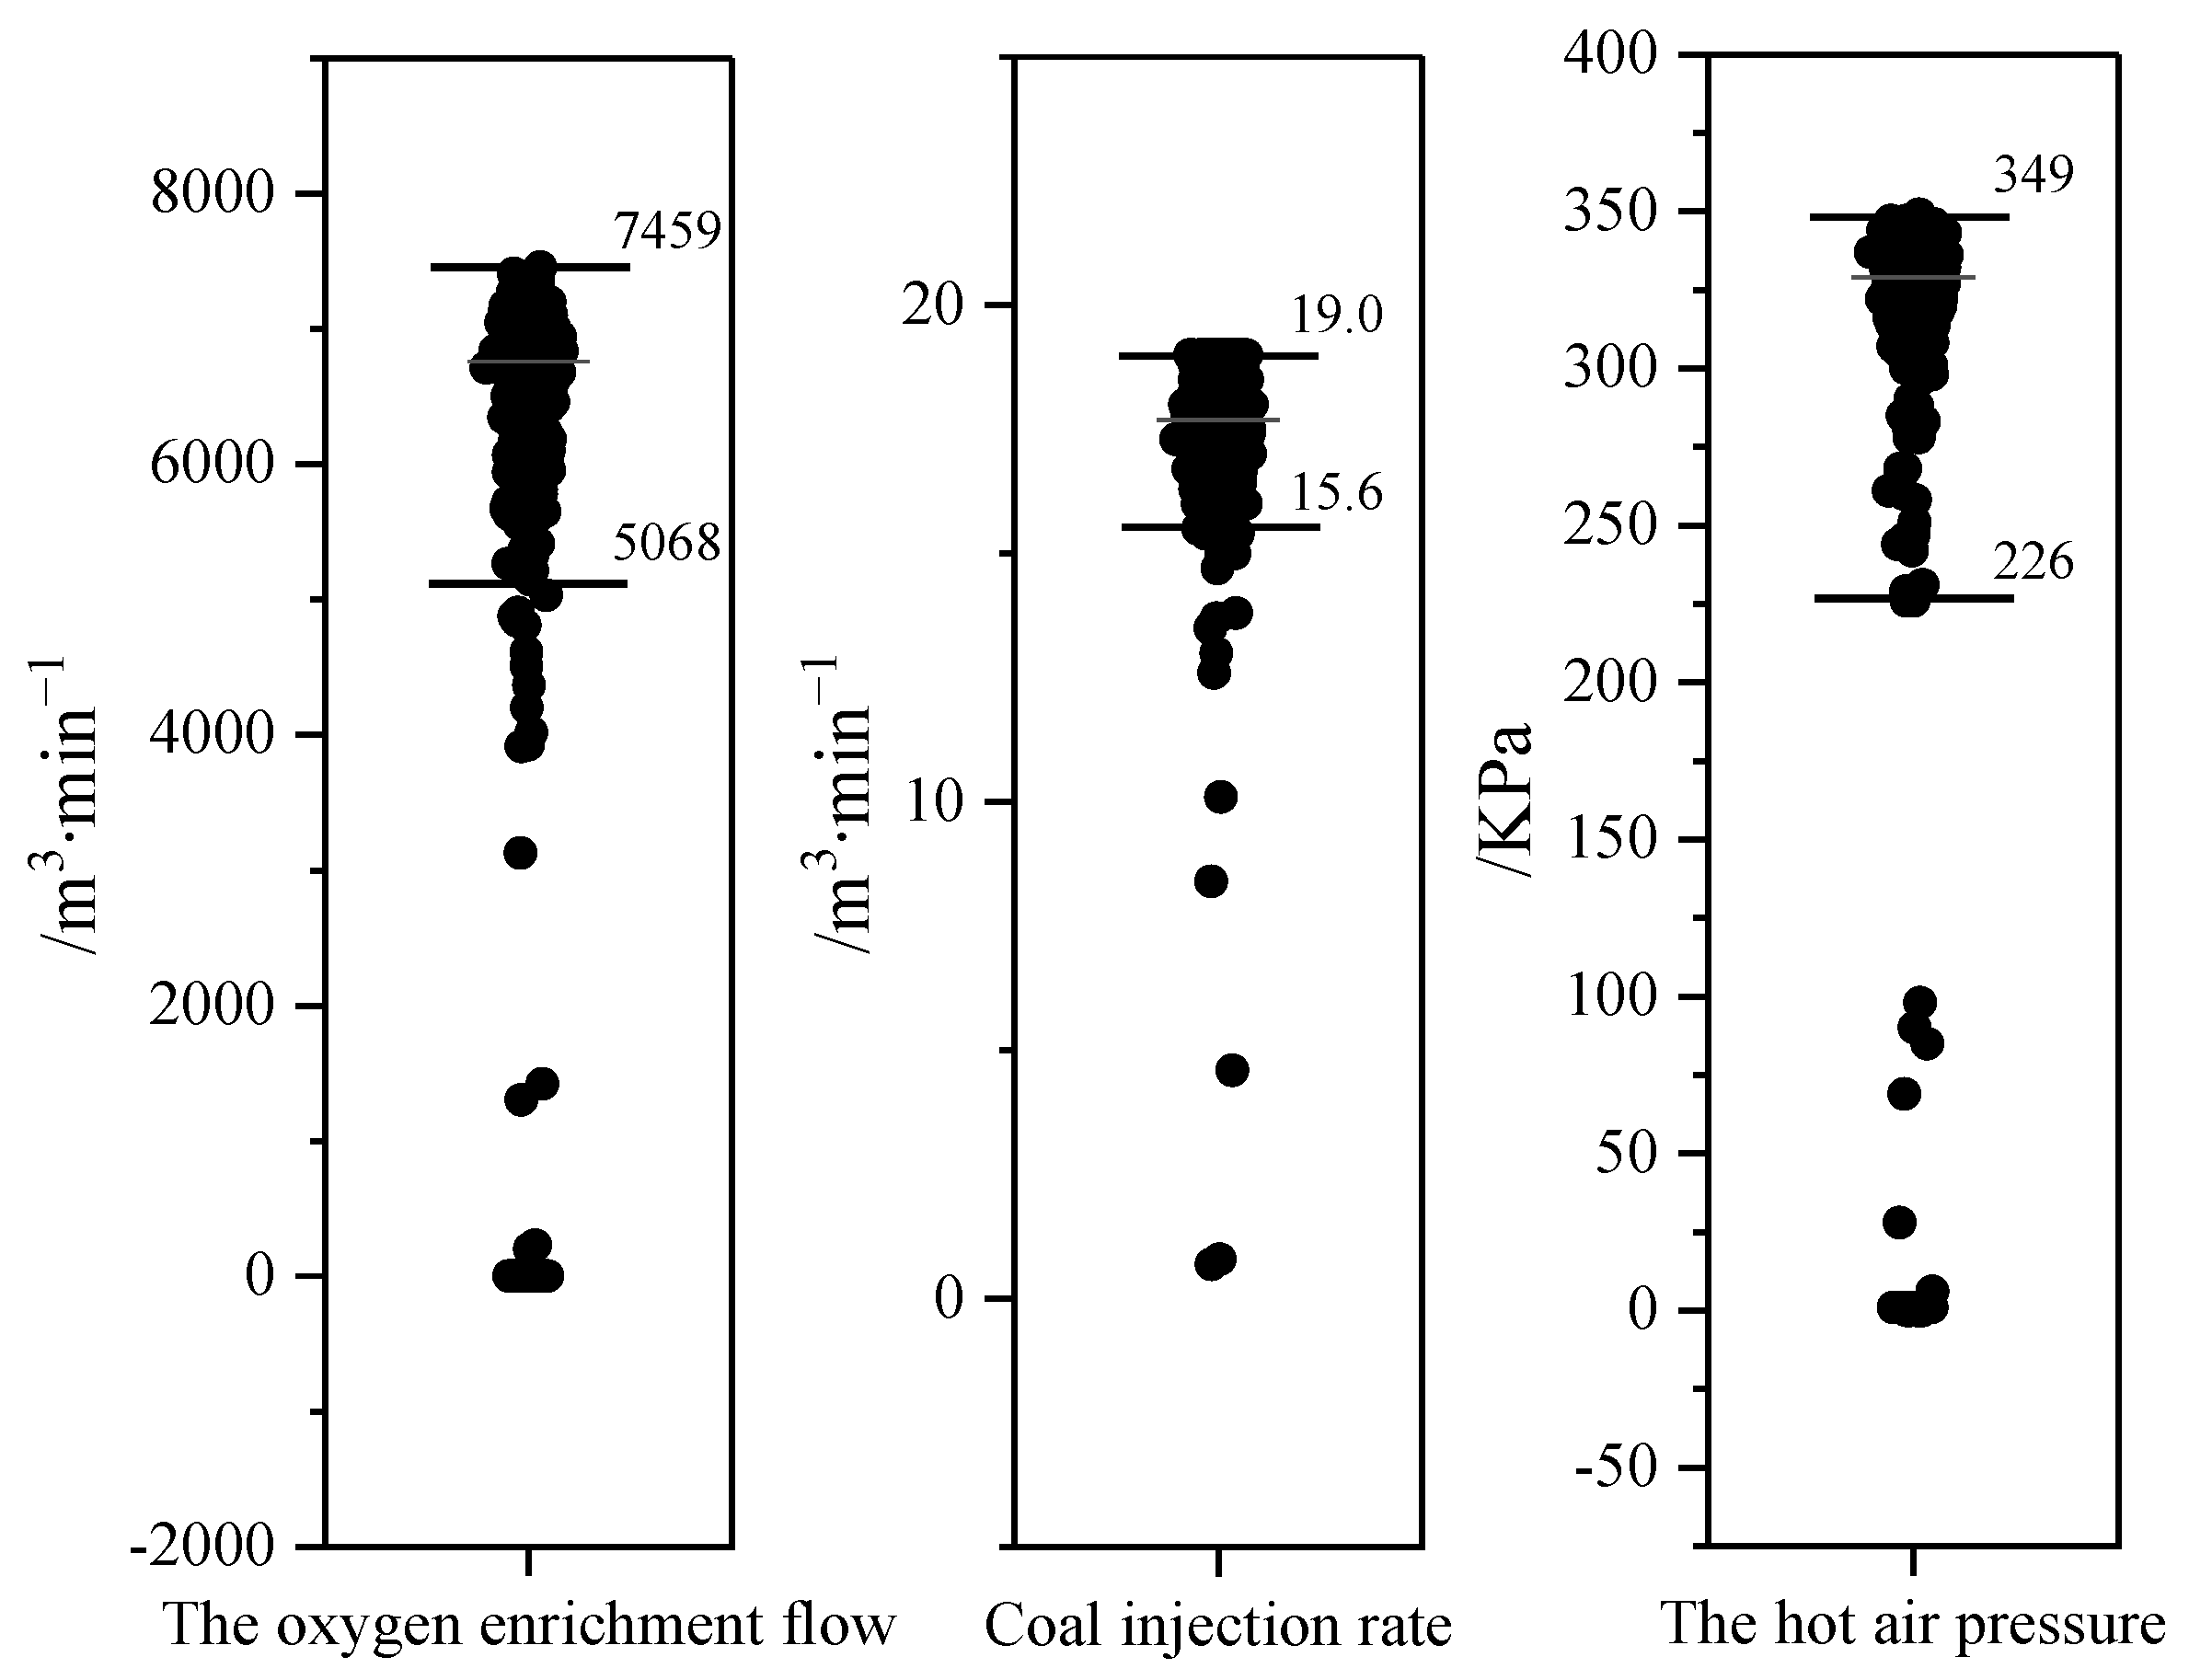
3.1.1. Data Deletion

There are two types of anomalies in the blast furnace characterization parameters: one is caused by a fault in the blast furnace testing instrument and the other by an abnormal blast furnace operation. For this reason, the blast furnace data outliers are handled as follows.
Step 1: Outlier detection. The isolation forest algorithm was used to detect outliers in the blast furnace sample set. A binary tree is constructed by randomly partitioning the blast furnace data interval, with each leaf node being a data node and the path length of the leaf node to the root node reflecting the degree of outlier of that node [37]. A forest is assembled and the outlier scores in the characterization parameters are calculated, which are given by (Formulas (12)–(14)).
s ( x , n ) = 2 E ( h ( x ) ) c ( n )  
c ( n ) = { 2 H ( n 1 ) 2 ( n 1 ) n , n > 2 1 , n = 2 0 , n < 2  
H ( k ) = ln ( k ) + 0.5772  
where: s ( x , n ) is the outlier score of node x , c ( n ) is the average path length of the tree, E ( h ( x ) ) is the average number of steps required to separate data points, H ( k ) is the value of the reconciliation function and 0.5772 is the Euler constant.
The value range of s ( x , n ) is between 0 and 1, and the higher the value, the more likely it is to be an anomaly. The abnormal data is judged by setting the threshold value.
Step 2: Classification of anomalies. The characterization parameters of the blast furnace are analyzed comprehensively and the anomalies are discerned in conjunction with the blast furnace operating mechanism.
Step 3: Outlier retention and rejection. Outliers caused by faults in the blast furnace testing instrument are rejected and outliers caused by abnormal blast furnace operation are retained.

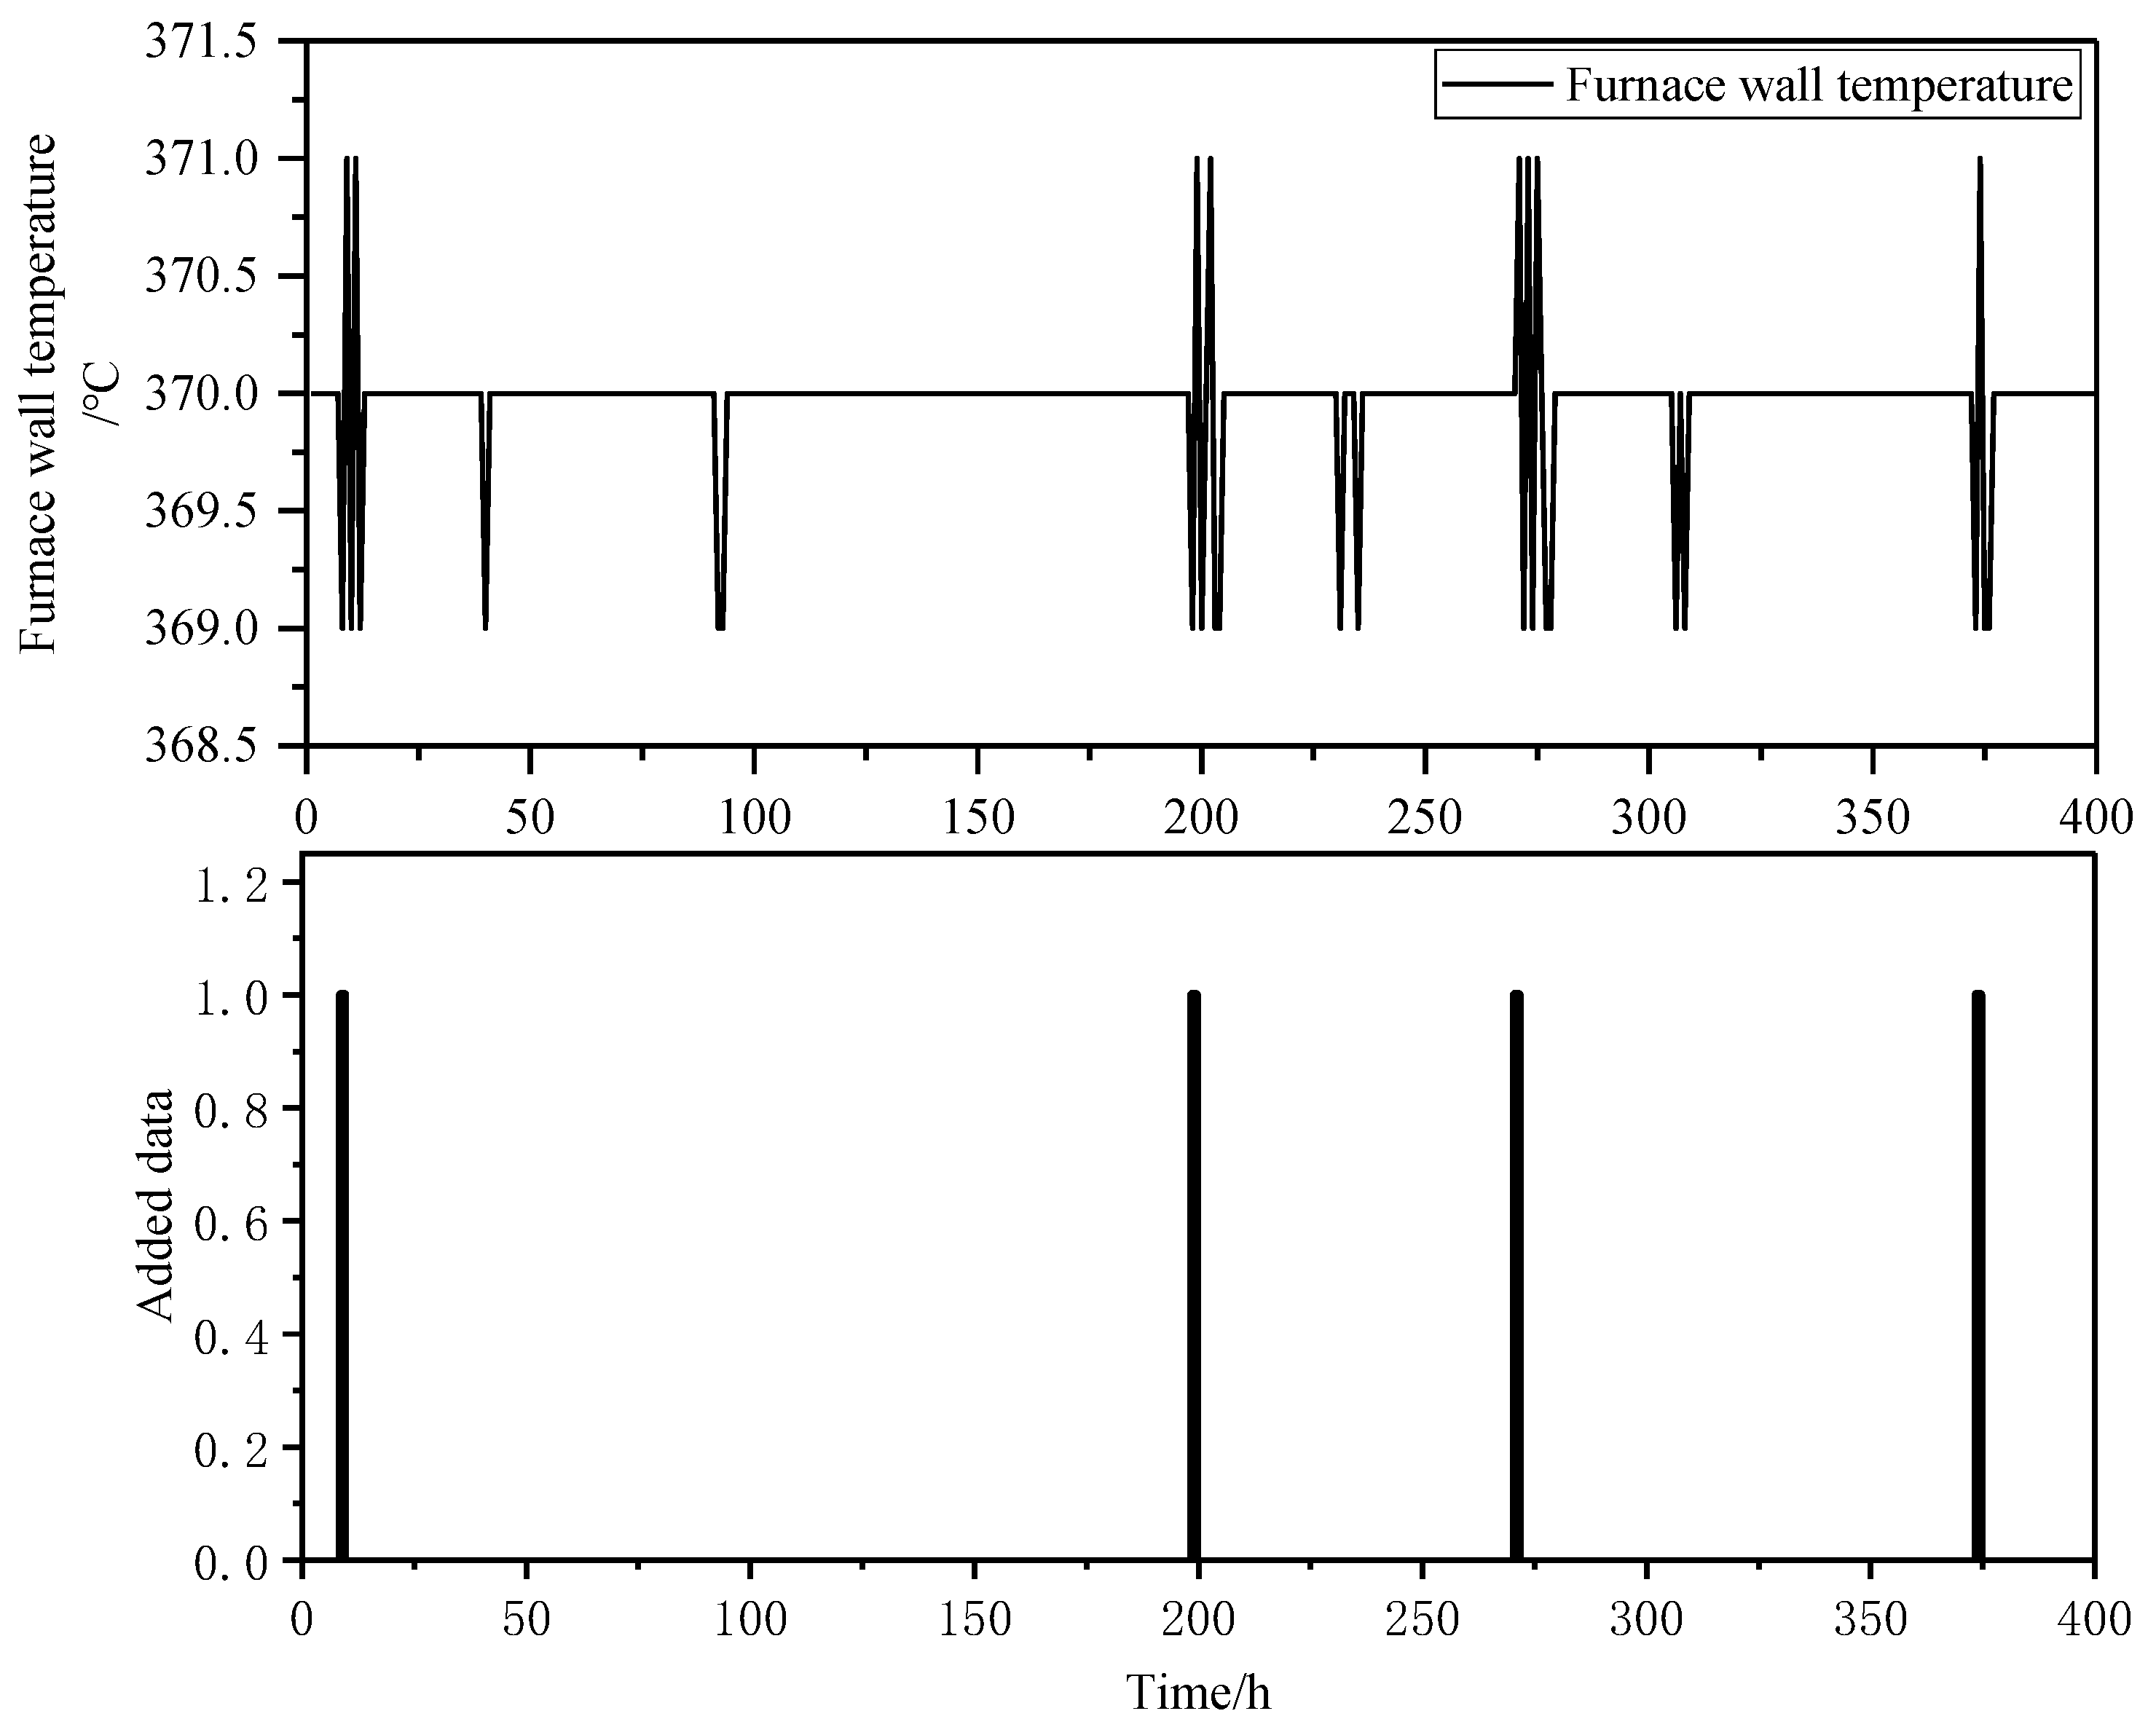
3.1.2. Data Addition

In blast furnace production, slag shedding occurs from time to time. If the slag shedding is not detected early and the heat is replenished in time, it can easily result in a cooler furnace condition. For this reason, the detection of the point at which the slag peel comes off is essential for furnace temperature prediction. When the temperature of the cooling wall rises, the temperature of the corresponding electric couples also rises, and once the temperature exceeds the set threshold, the system assumes that a “slag skin” has fallen off.

3.2. Data Reduction and Restructuring

The model prediction error is large due to the large number of blast furnace parameters and their large time lag. The correlation analysis algorithm can obtain the correlation coefficients between the characterization parameters and the time series of silicon content of iron at different time delays, and restructure the data according to the correlation coefficients, thus reducing the impact of time lag on the prediction accuracy of the model.

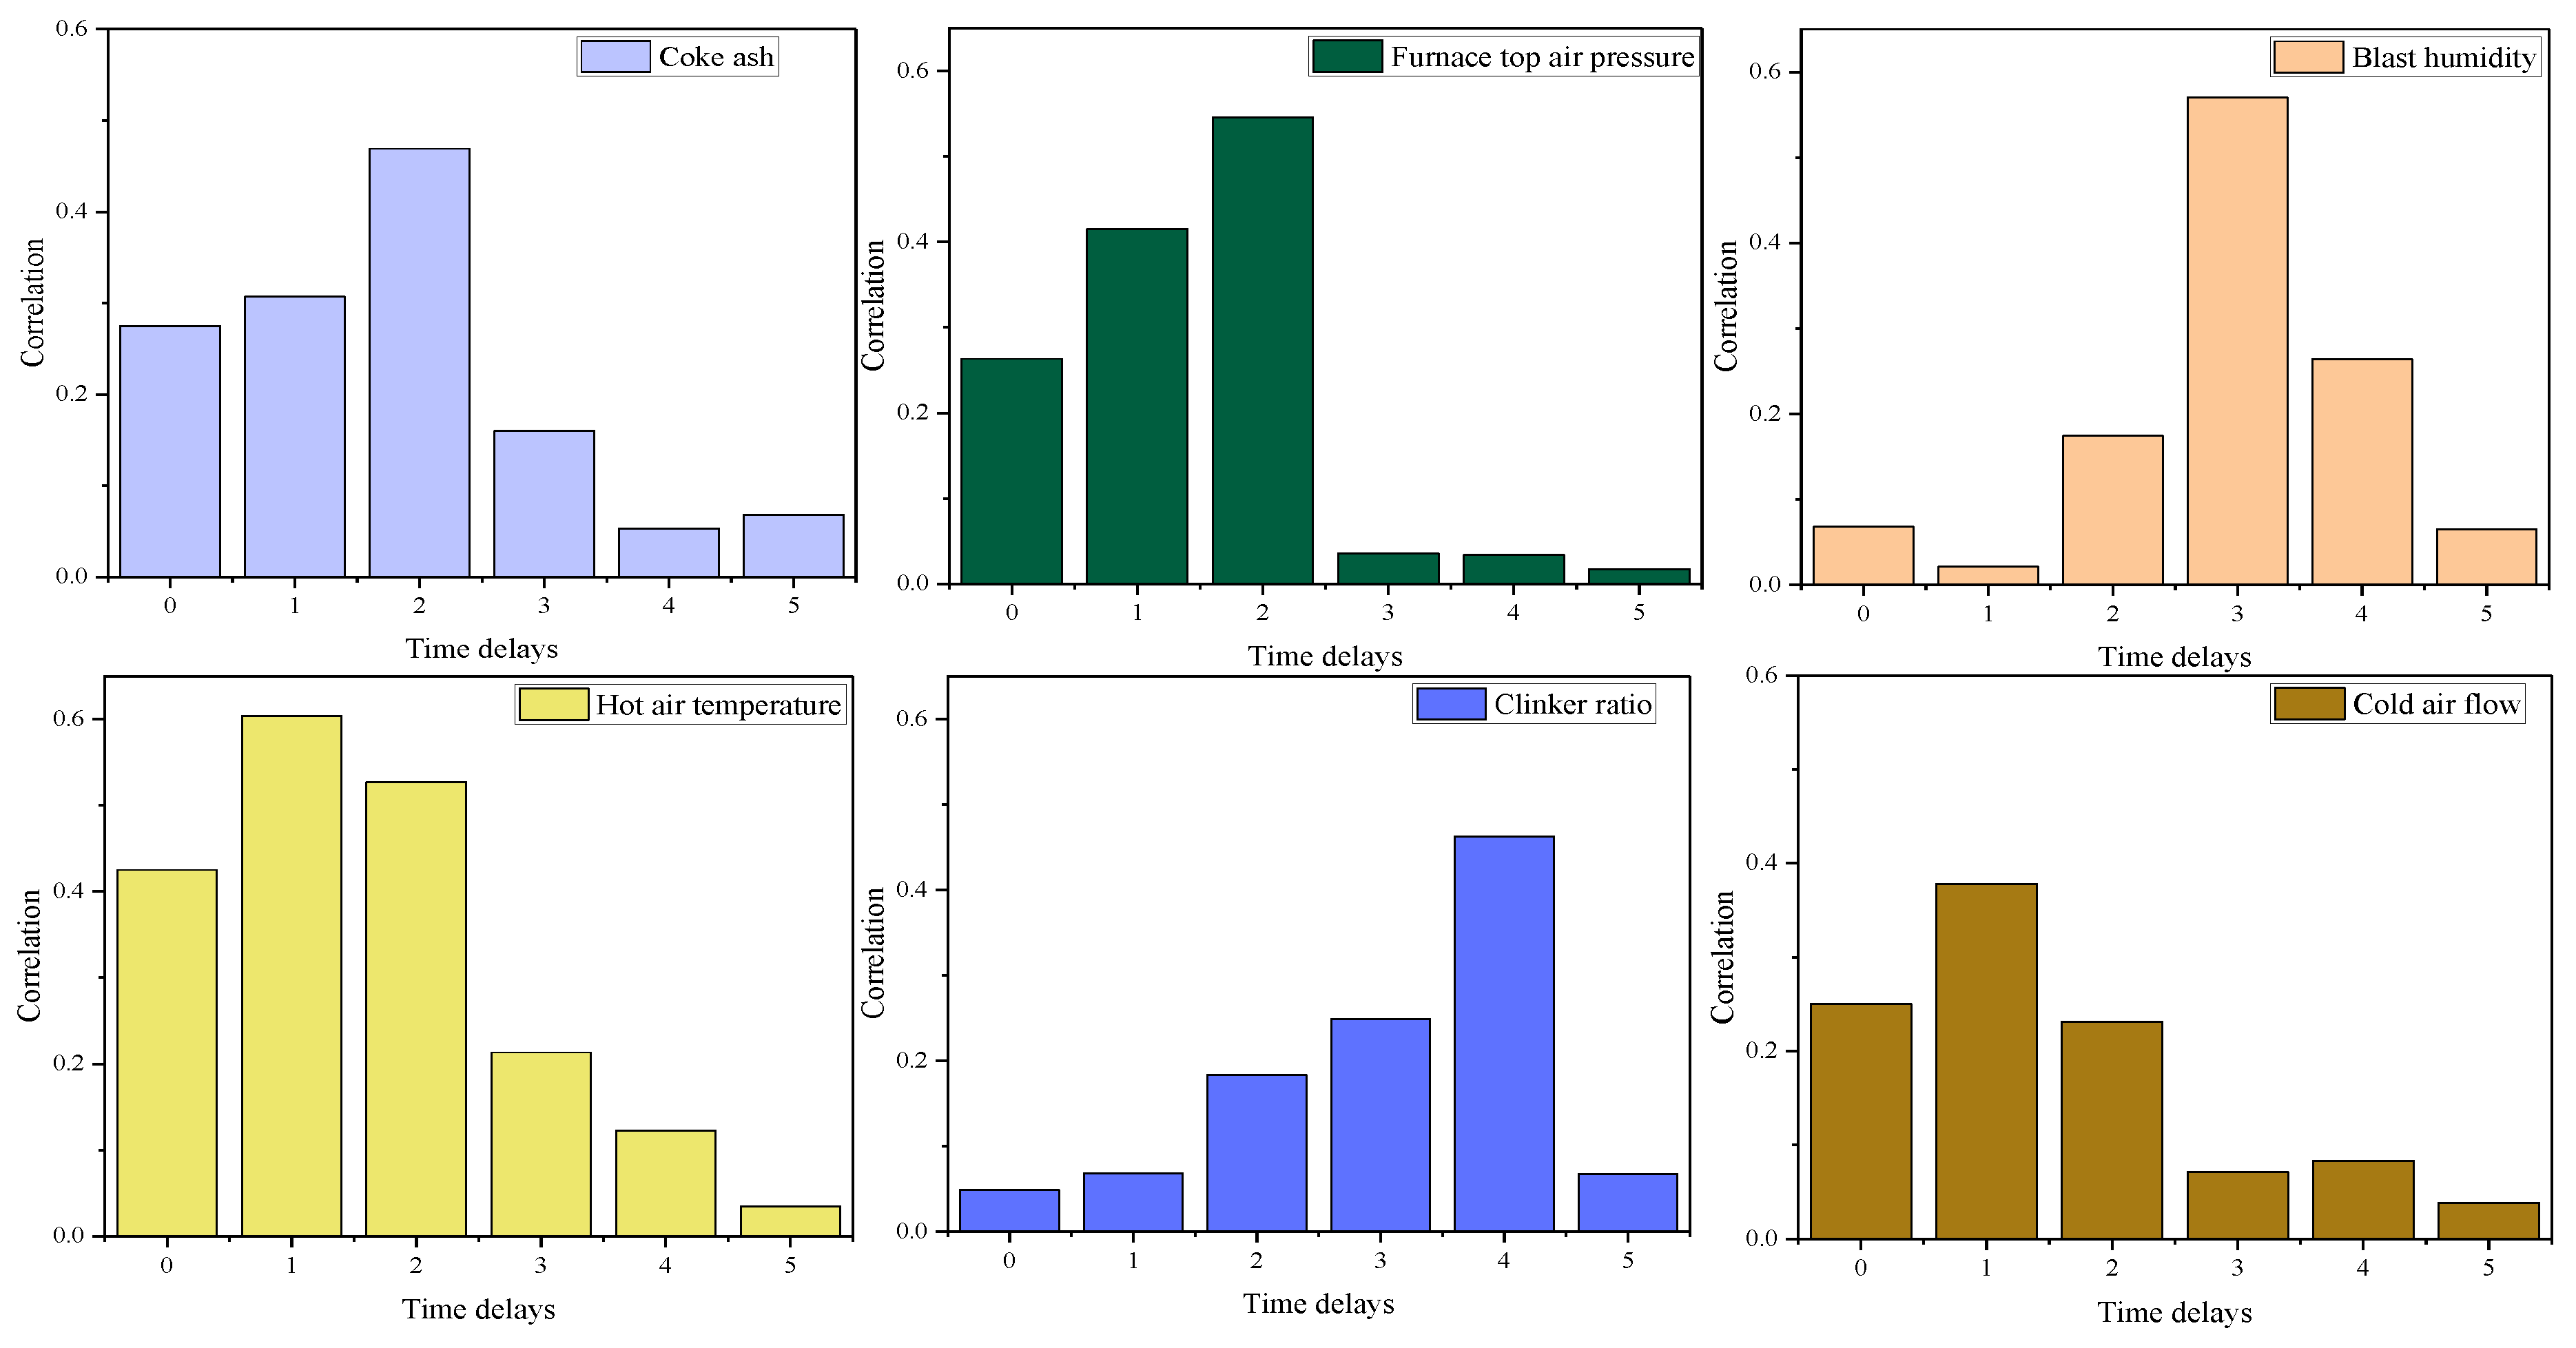
3.2.1. Mutual Information Feature Selection Based on Maximum Correlation-Minimum Redundancy

Common data dimensionality reduction algorithms such as principal component analysis can re-fit the data, resulting in the loss of parameter labels. In order to retain important features and eliminate redundant features, a mutual information algorithm is used to select important features of the furnace temperature characterization data. By calculating the common information between two parameters, the correlation on each characterization parameter and the furnace temperature is mined. Depending on the input data, the mutual information calculation is divided into two types of Equations (15) and (16).
I ( X , Y ) = x = 1 n y = 1 n P X Y ( x , y ) l o g P X Y ( x , y ) P X ( x ) P Y ( y )  
where: P X Y ( x , y ) is the joint probability value at X = x and Y = y .
I ( X , Y ) = x = 1 n y = 1 n P X Y ( x , y ) l o g P X Y ( x , y ) P X ( x ) P Y ( y ) d x d y
where: P X ( x ) and P Y ( y ) are the probability density functions of X and Y , respectively, P X Y ( x , y )   is the joint probability density function of X and Y , and n is the number of samples.
Equations (15) and (16) are applicable to discrete and continuous data, respectively, and the furnace temperature characterisation is continuous and should use Equation (16). However, in practice, it has been found that it takes longer and is less effective than calculating the mutual information in integral form. For this reason, this paper uses Equation (15) for the selection of the mutual information characteristics of the furnace temperature characterisation data by setting different ranges for the interval division of the individual characterisation parameters and discretising the continuous values.
The conventional way of selecting mutually informative features is to rank the calculation results and to select the T features with large mutual information as the main influencing parameters. However, in order to achieve subsequent dynamic prediction of furnace temperature, the strong coupling between the state and control parameters needs to be preserved while eliminating redundant data. To this end, this paper proposes a feature selection method based on parameter set partitioning. First, T features are selected from M characterization parameters to establish a subset of characterization parameters, and then C M T subsets are calculated by Equations (17)–(19) to select the subset of characterization parameters with the smallest redundancy between state parameters and control parameters and the largest coupling between state parameters and control parameter data, i.e., maximum correlation–minimum redundancy (mRMR) selection [38].
Q = 1 C W 2 i = 1 W 1 j = 1 W I ( x i , x j ) + 1 C Z 2 i = 1 Z 1 j = 1 Z I ( x i , x j )
T = w + z
P = 1 T i = 1 T I ( x i , y )
where: T is the number of features selected, w and z are the number of control parameters and the number of state parameters in the selected features, x i and x j represent the two selected features, respectively, y represents the silicon content of molten iron, C W 2 and C Z 2 represent the number of subsets of two features selected from W control parameters and Z state parameters, respectively, Q is the average value of the mutual information between the state parameters and the control parameters, p is the average value of the mutual information between the selected features and the silicon content of the iron.
By this method, the subset of C M T features with the largest p value and the smallest Q value is selected as the best feature selection result.

3.2.2. Data Restructuring for Grey Correlation Analysis Based on Equilibrium Proximity

Blast furnace ironmaking has a large time lag, as exemplified by the melt loss reaction. The melt loss reaction index SLC represents the amount of carbon consumed by the melt loss reaction in the lower part of the blast furnace and the conventional melt loss reaction index is calculated by Formulas (20) and (21).
SLC =   R P × DRR ×   C Fe
where R P   is the O/Fe ratio in the loading batch, C Fe is the Fe content of the iron, and SLC is the amount of carbon consumed by the melting reaction in the lower part of the blast furnace.
DRR = ( C out C ot ) × Roc × 1 / ( O out O i n )
where Roc is the ratio of the molarity of oxygen to carbon, C out is the carbon content in the roof gas, C ot is the vaporized carbon before the air outlet, O out is the oxygen content in the roof gas, O i n is the oxygen content entering the blast furnace from the air outlet, and DRR is the direct reduction degree.
However, it is not very meaningful to use the carbon content of the gas at the top of the furnace at the same time minus the carbon content of the vapor before the air outlet. Only by obtaining the time interval between the arrival of the same batch of pre-vented carbon at the top of the furnace can the melt loss reaction index be calculated more accurately, as can the calculation of O out and O i n .
The grey relational analysis (GRA) is used to analyze the time series of the characterization parameters and the silicon content of the iron at different time delays, to quantify the lag time between each characterization parameter and the silicon content of the iron, to deal with the problem of inaccurate prediction of the silicon content of the iron due to the time lag of the furnace temperature data by comparing the correlation between each characterization parameter and the silicon content of the iron at different time delays, and to re-arrange the furnace temperature data according to the principle of maximum correlation. Let X i = { x i ( k ) | k K } . Formulas (22) and (23) for calculating grey correlation degree is:
γ ( x l ( k ) , x i ( k ) ) = min i   min k ( | x l ( k ) x i ( k ) | ) + δ max i   max k ( | x l ( k ) x i ( k ) | ) | x l ( k ) x i ( k ) | + δ   max i   max k ( | x l ( k ) x i ( k ) | )
γ ( X l , X i ) = 1 n k = 1 n γ ( x l ( k ) , x i ( k ) )
where: γ ( x 0 ( k ) , x i ( k ) ) is the number of grey correlation coefficients and γ ( X 0 , X i ) is the correlation between the l-th parameter series and the i-th parameter series.
As traditional grey correlation analysis has a tendency to localize point correlations when performing overall proximity detection, this paper introduces grey correlation entropy to improve grey correlation analysis using equilibrium proximity as a measure of similarity between vectors [39,40]. Equations (24)–(27) for equilibrium proximity is.
B ( X l , X i ) = γ ( X l , X i ) · B ( R i )
B ( R i ) = H ( x i ) H m
H ( x i ) = k = 1 n p i ( k ) · ln p i ( k )
p i ( k ) = γ ( x l ( k ) , x i ( k ) ) k = 1 n γ ( x l ( k ) , x i ( k ) )
where: p i ( k ) is the grey correlation density of the i -th parameter sequence at the kth, H ( x i ) is the grey correlation entropy of the i -th parameter sequence, B ( R i ) is the entropy correlation of the i -th parameter sequence, and B ( X l , X i ) the equilibrium proximity of the reference sequence X l and the comparison sequence X i .

3.3. Representation Parameter Network Construction

In the complex smelting process of a blast furnace, a change in one control parameter often leads to a change in several state parameters. At the same time one state parameter is influenced by several control parameters. The traditional hard clustering algorithm has only two subordinate degrees of zero and one, which means it is difficult to describe the complex coupling relationship between blast furnace parameters. We propose a fuzzy c-means clustering parameter dataset partition method based on balanced proximity grey relational analysis (GRA-FCM). The grey correlation analysis is used to obtain the correlation between each control parameter and different state parameters, combined with part of the idea of fuzzy c-mean clustering, i.e., fixing the state parameters as class centroids and dividing the set of control parameters. This model preserves the affiliation with each control parameter reaching different clustering centers while obtaining the set of control parameters with greater influence on different state parameters. The model is then combined with the ironmaking mechanism to set reasonable thresholds to achieve the model partitioning of multiple control parameters to multiple state parameters. This classification is more in line with the actual operation of the blast furnace. For example, the study of the ironmaking mechanism shows that increasing the coal injection quantity in the control parameters has a greater influence on the gas quantity and permeability index of the furnace belly in the state parameters. Therefore, the threshold value needs to be set smaller than the subordination of the coal injection volume-furnace gas volume and the coal injection volume-permeability index.
The set of control parameters that are in the same class as or close to the state parameters are identified and a multi-control parameter-multi-state parameter directional network of characterization parameters is constructed. The network reflects the strong coupling of the furnace temperature characterization parameters. When a control parameter changes, one or more of the state parameters connected to it in the directed network also change.

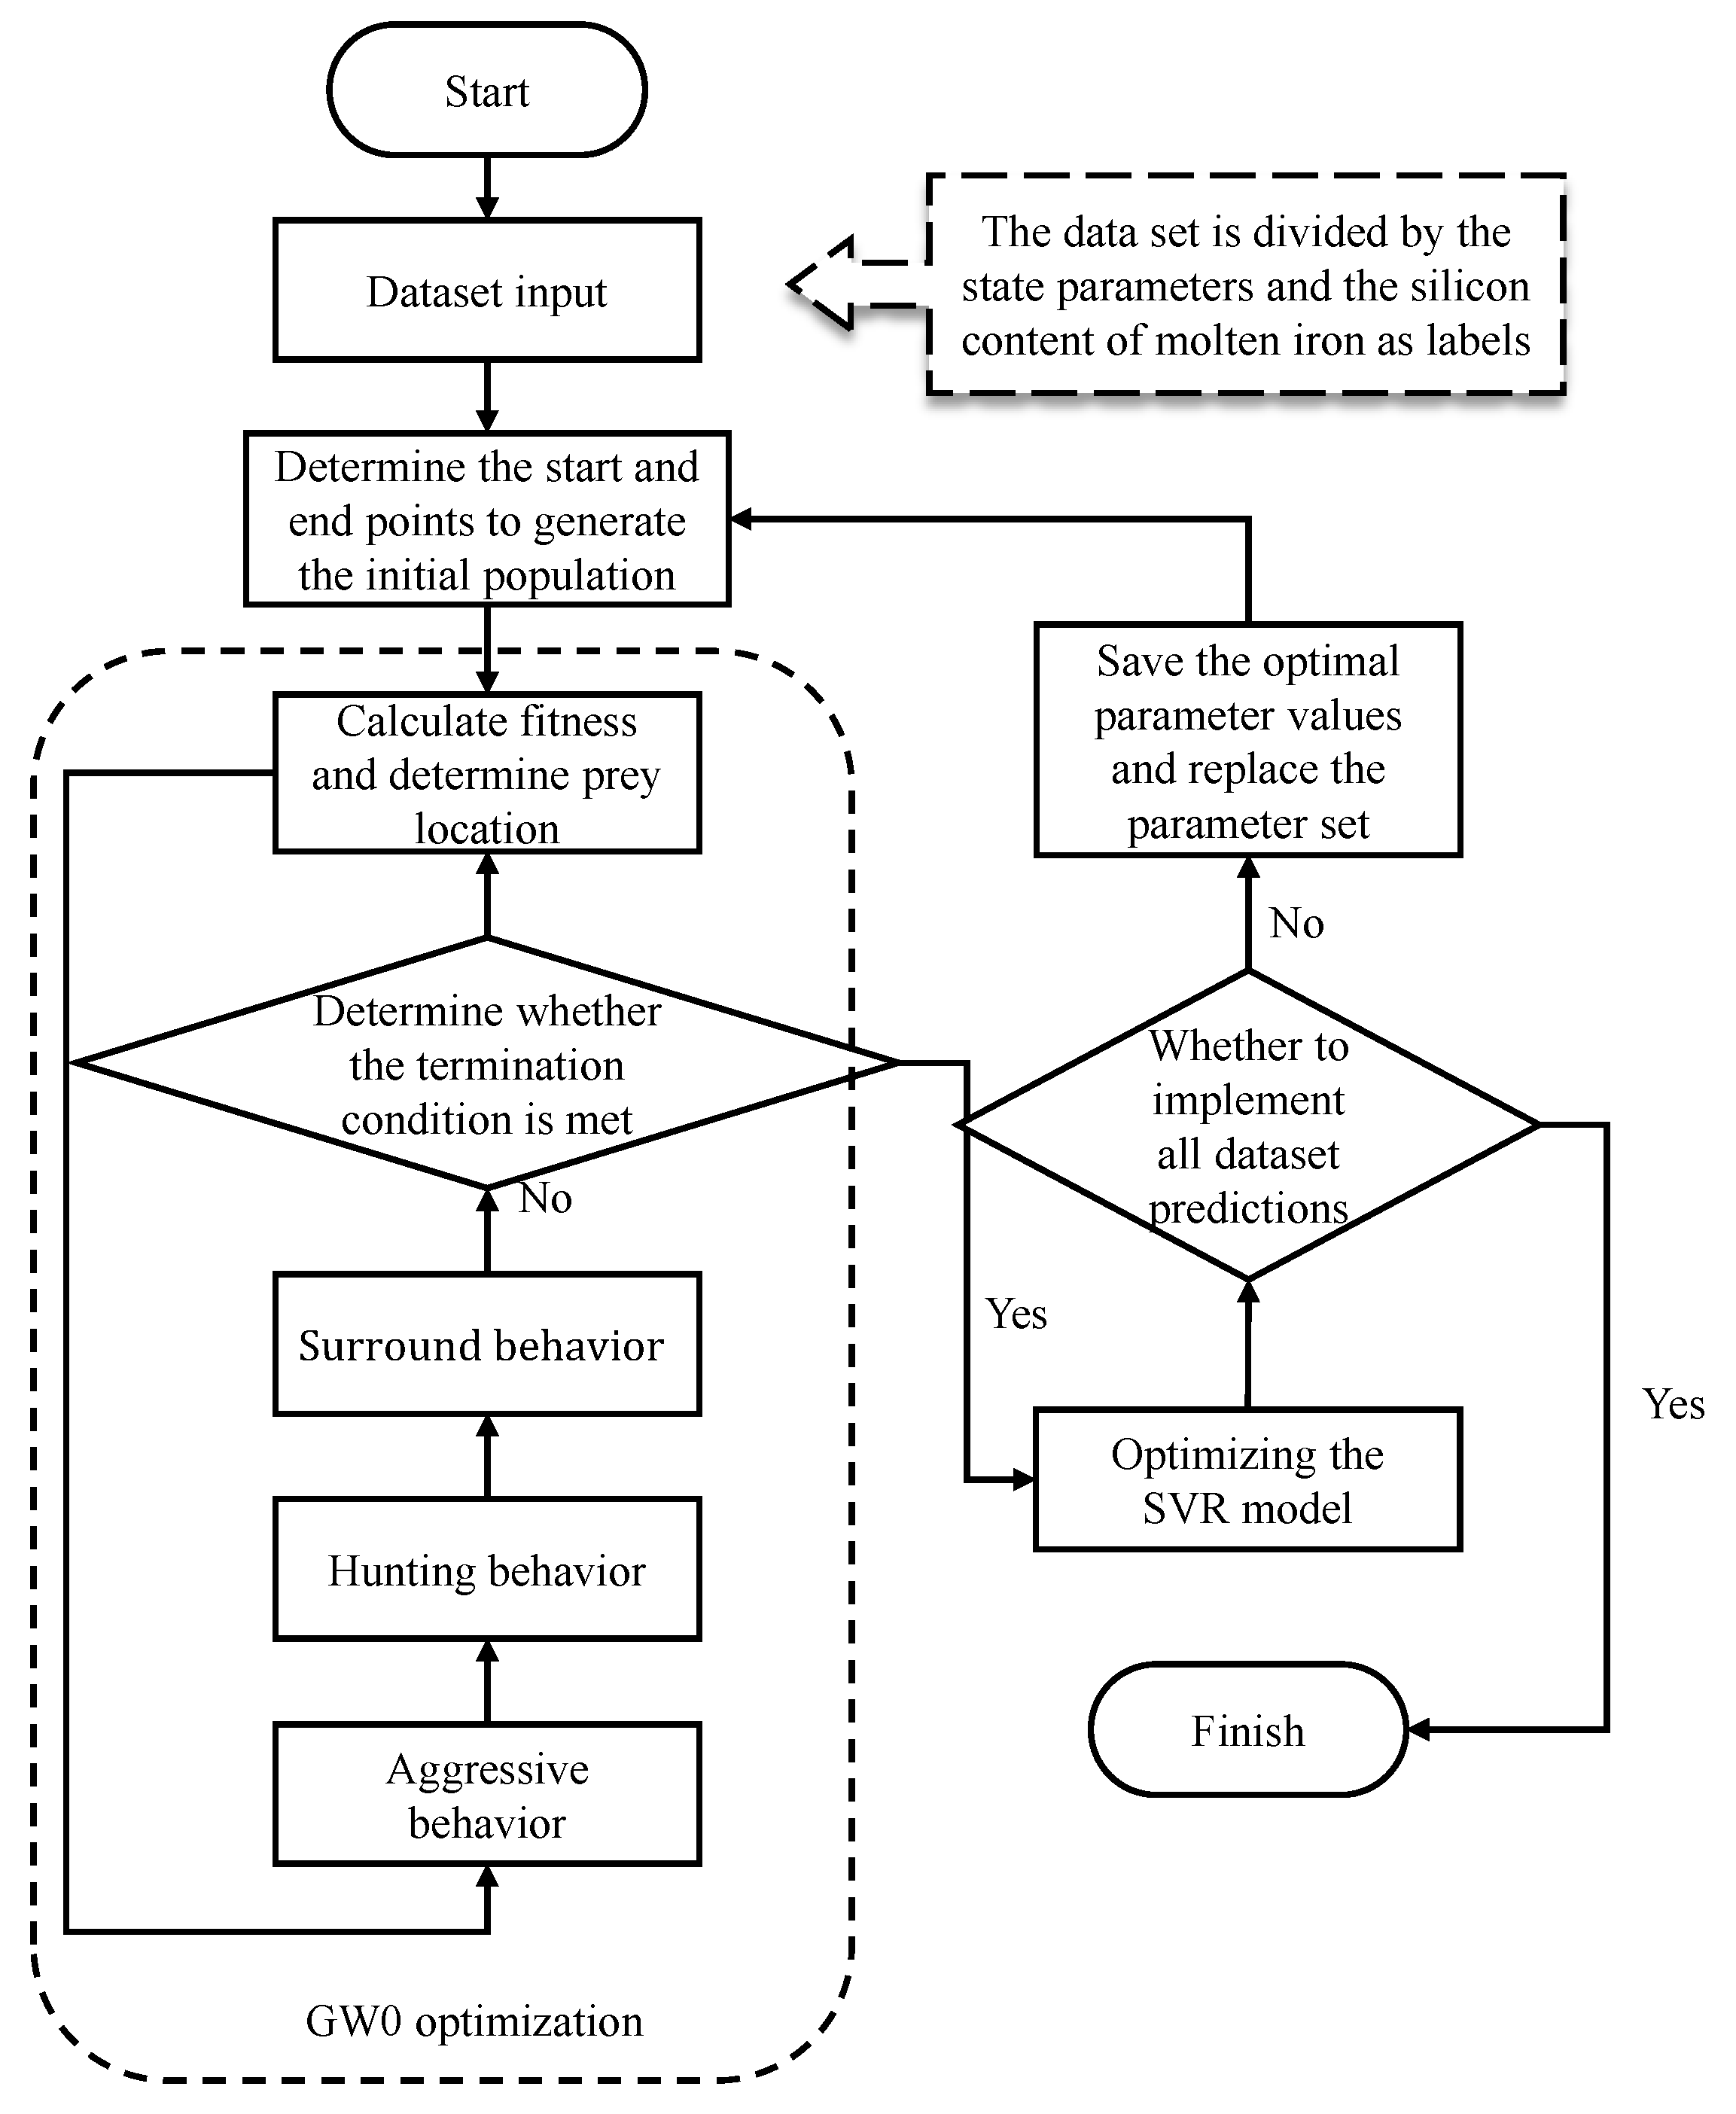
3.4. Dynamic Furnace Temperature Prediction

In production, workers adjust the control parameters by means of charge addition, pulverized coal blowing and hot air blasting, and in turn judge the furnace operating conditions based on the blast furnace status parameters. However, the combustion of fuels such as coke and pulverized coal takes time, which means that the blast furnace status parameters do not reflect the influence of the control parameters on the furnace conditions in a timely manner. If the condition parameters could be predicted earlier, this would greatly alleviate the time lag in the data. Based on this, this paper uses the Support Vector Regression (SVR) regression prediction model to obtain the predicted values of each state variable based on a directed network of characterization parameters, with the control parameters as the sample set input and the state parameters as the output. The prediction performance of the SVR model is greatly influenced by the penalty factor C, the kernel parameter g and the insensitivity loss factor ε. The global optimization capability of the traditional parameter optimization method is poor. For this reason, we establish an SVR prediction model, optimized based on the gray wolf optimization algorithm(GWO-SVR). The flow chart of GWO-SVR prediction model is shown in Figure 2.
Compared to the traditional furnace temperature prediction model based on historical data, this dynamic furnace temperature prediction model is highly feasible and in line with the actual blast furnace production situation. When applying the furnace temperature prediction model to production, blast furnace condition parameters are not available in time as control parameters such as charge and pulverized coal are added. If the prediction is made using the state parameter data onto the previous batch, it will lead to a decrease in the accuracy of the furnace temperature prediction. This model can simulate the operating conditions of the furnace in a more scientific way by making step-by-step dynamic predictions of the condition parameters, thus achieving dynamic and accurate furnace temperature prediction.

3.5. Real-Time Regulation of Control Parameters

The ultimate goal of dynamic furnace temperature prediction is to use the prediction results to make early corrections to furnace temperature control parameters such as air pressure, charge and coal injection to ensure stable and abundant furnace temperature and efficient production of the blast furnace. The expert system is combined with a big data-driven dynamic furnace temperature prediction to establish a recommended model of furnace temperature control parameters. The specific steps are to set the furnace temperature control sequence according to the expert experience: coal injection-oxygen enrichment flow-blast temperature-blast humidity-coke load-coke ash. With the dynamic prediction of the furnace temperature as a reference, the state parameters are controlled within a reasonable range in line with the experience of the experts, and the most economical and effective parameter regulation is obtained by changing different control parameters to simulate the influence on the state parameters and the furnace temperature trend.
The data analysis and control model for the integrated furnace temperature characterization is shown in Figure 3.

4. Analysis of Results

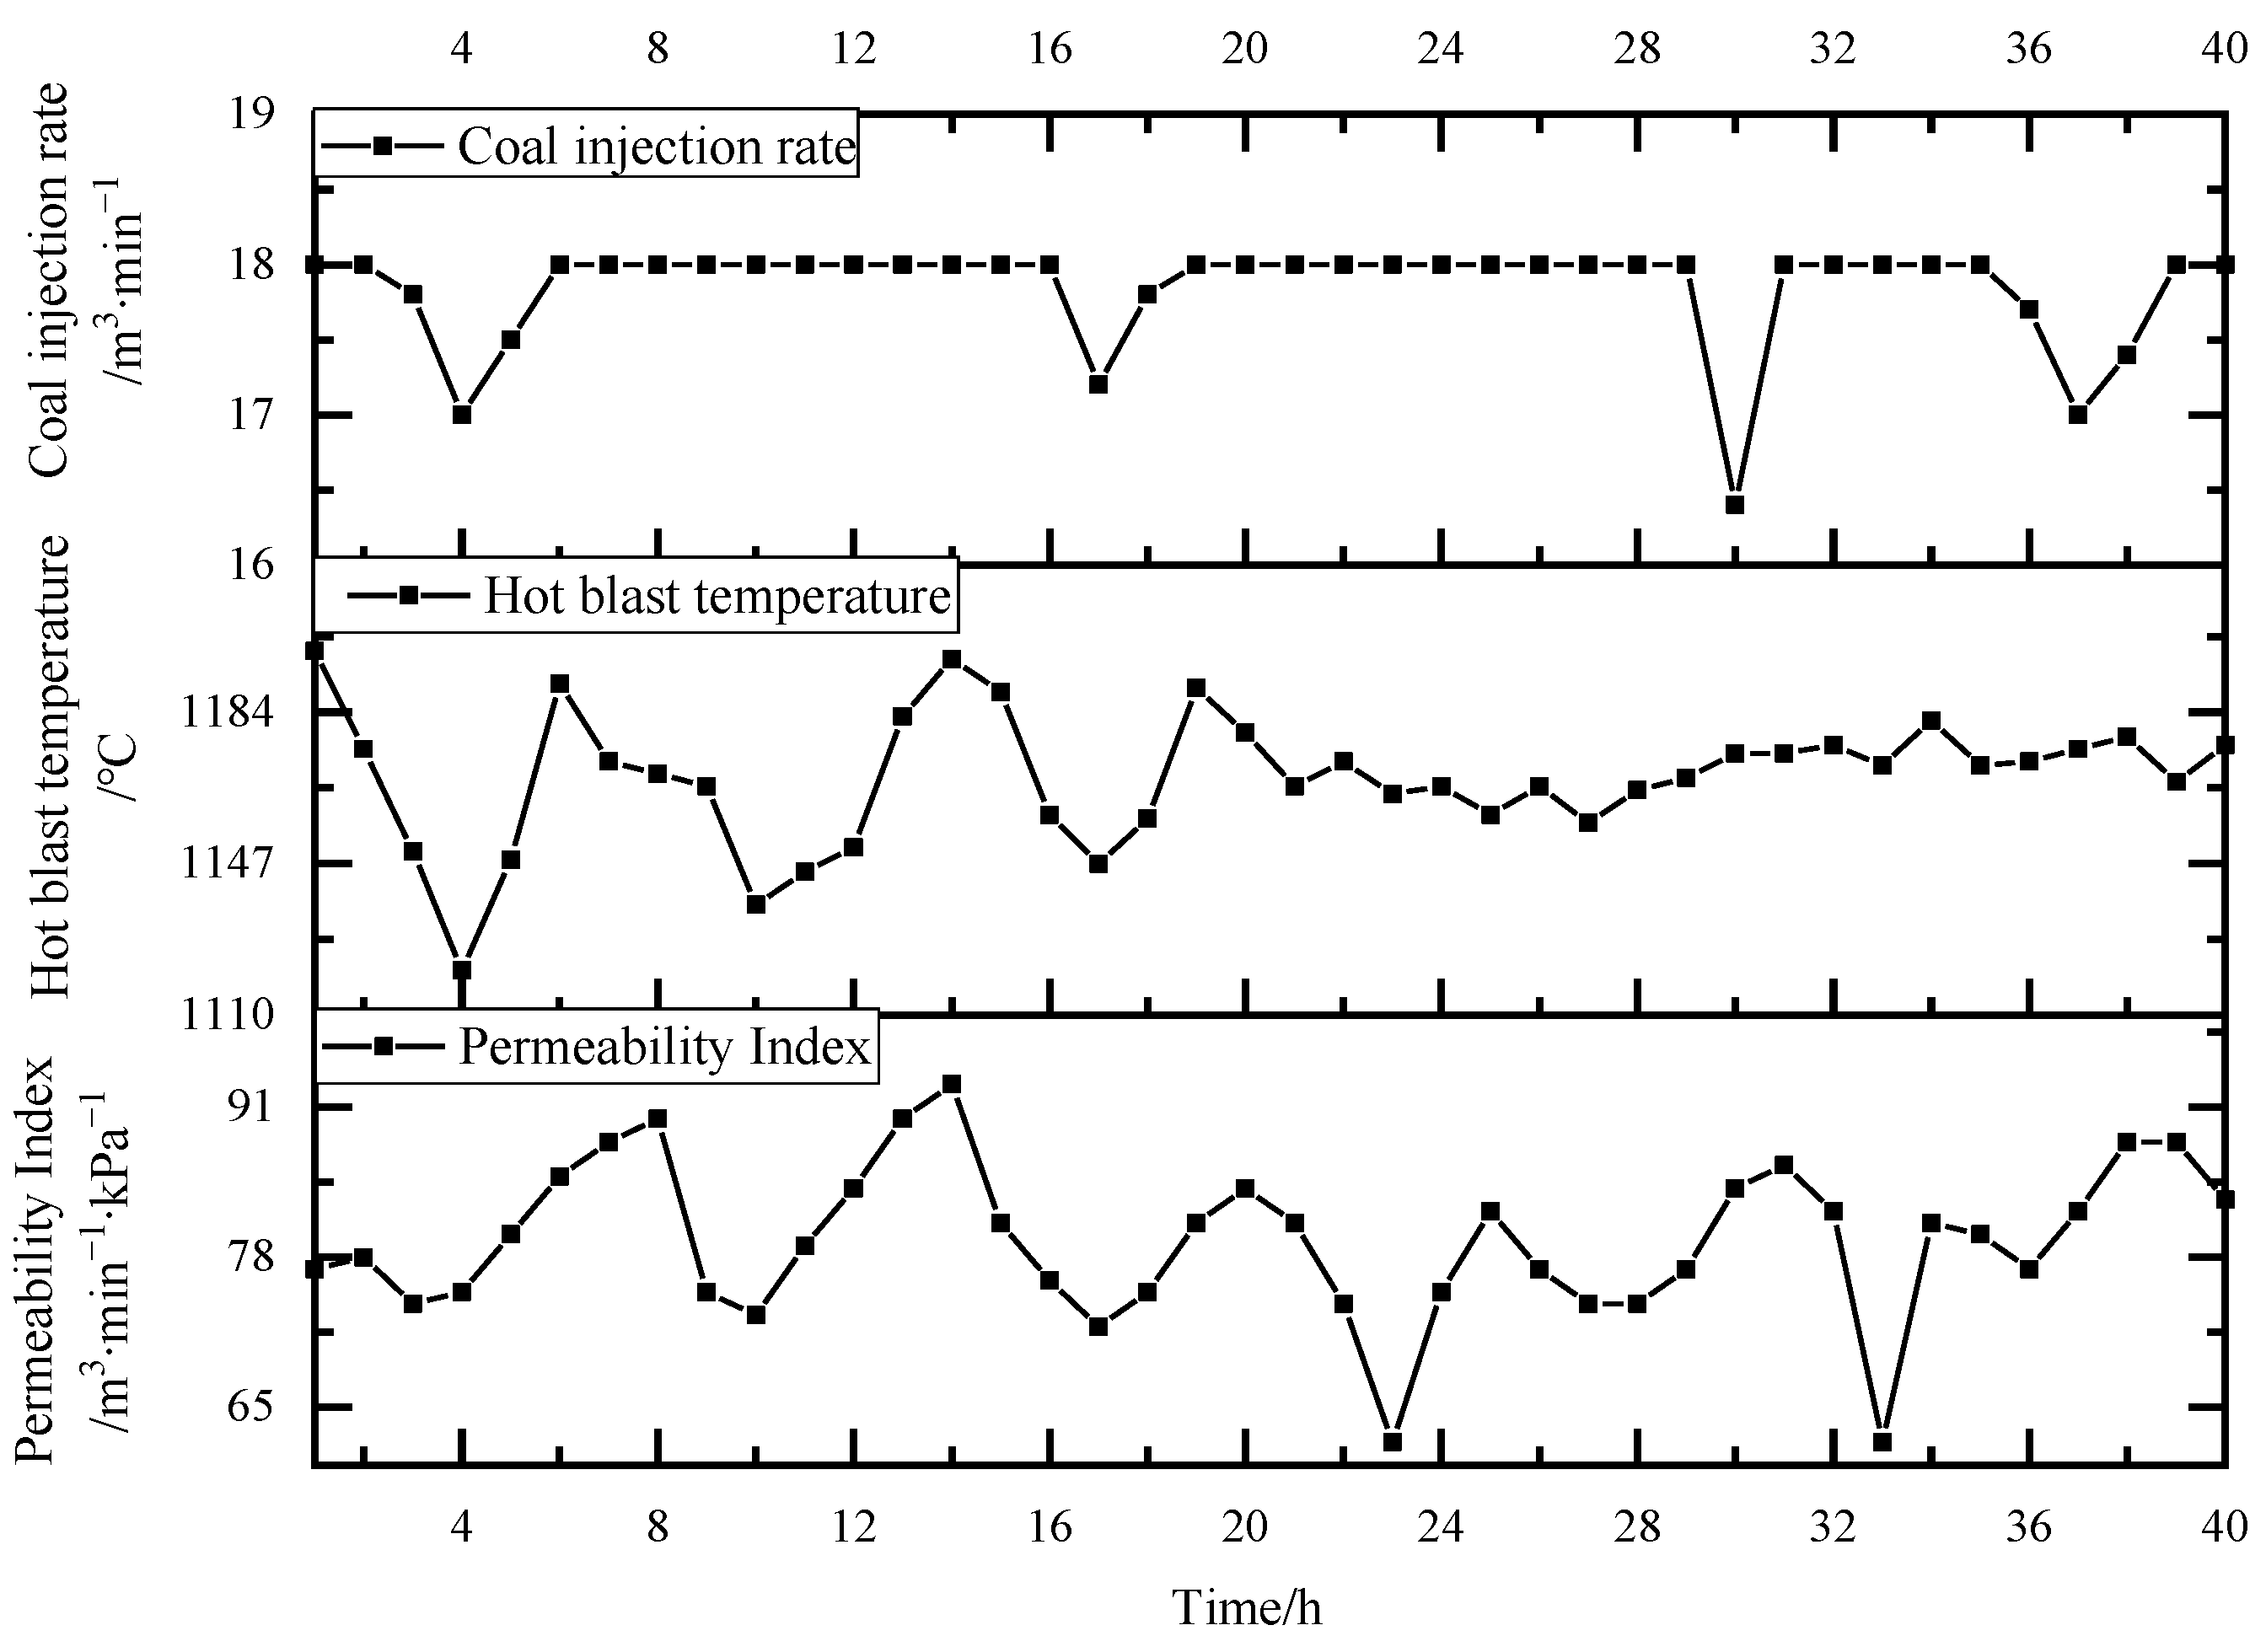
4.1. Data Processing

The data in this study come from the actual production of a blast furnace in an iron factory. The blast furnace has a volume of 580 m3, 18 hot blast nozzles, and a daily output of molten iron of about 1400 tons. The time period of blast furnace pig iron smelting is 1.33 h, and the ratio of sinter to pellet into the furnace is 5:3. Raw material chemical composition, and Table 1 shows the coke ash content, and Table 2 shows the Coke ash analysis:
Outlier handling is implemented by the Python programming language. We use the IsolationForest algorithm library in the sklearn.ensemble package to detect outliers in a steel furnace temperature data set. By adjusting multiple parameters such as behavior, max_samples, contamination, etc., the data set is divided, the binary tree is built, and the score of outliers is calculated. Finally, we combined the blast furnace operation mechanism to identify the abnormal situation. Take coal injection volume, hot blast temperature and permeability index as examples. The time delay analysis shows that the time delay between the hot blast temperature and the permeability index is about three, and the time delay between the coal injection volume and the permeability index is about four. We analyze the operation mechanism of the blast furnace. When the coal injection volume decreases, the blast furnace permeability index increases, and when the hot blast temperature increases, the blast furnace permeability index decreases. In order to facilitate readers to have a clearer understanding of the changing trends of coal injection volume, hot blast temperature, and air permeability index, only the data from 1 to 40 heats are selected for display in Figure 4. (The hot blast temperature in this paper refers to the average value of the hot blast temperature blown in from the hot-blast stove.) As can be seen from Figure 4, the permeability index has four anomalies in the 8th, 14th, 23th, and 33rd furnace times. Starting from the third furnace times, the amount of coal injection and the temperature of the hot air in the blast furnace began to decrease, which led to an increase in the permeability index. Therefore, we keep two outliers in the eight furnace times and 14th furnace times. However, the decrease in the air permeability index of the 33rd furnace times was not caused by the increase in the coal injection amount and the hot blast temperature, so we eliminated the abnormal points of the air permeability index of the 33rd furnace times.
The isolated forest algorithm was used to determine the normal value range of each characterization parameter. Figure 5 shows that the data had better applicability when the coal injection rate was controlled between 15.6 and 19.0, the hot air pressure was controlled between 226 and 349, and the oxygen enrichment flow was controlled between 5068 and 7459. The anomalous data in each characterization parameter were classified in conjunction with the furnace temperature to cool to hot phenomenon, and finally the data due to anomalies in blast furnace operation (about 3/7 of the anomalous data) were retained.
Figure 6 shows the time point analysis of the “slag skin” shedding based on the cooling wall temperature. The furnace wall temperature data detection points are divided into 10 areas, and most of them are concentrated in the hearth. Each area is further divided into four directions: east, west, northwest. It can be seen that the cooling wall temperature fluctuates eight times within 400 furnace cycles. Among them, in the eight, 196th, 275th, and 376th furnace times, the furnace wall temperature fluctuated briefly and greatly. Analysis of the reasons, in the “slag skin” off, the furnace wall temperature fluctuations occur for the first time, the furnace charge increases, the furnace temperature and the furnace wall temperature decreases. After that, the timely replenishment of fuel to the furnace is made to make the furnace temperature increase, so that the furnace wall temperature increases. When the furnace temperature is higher than the set value, we reduce the fuel added and the furnace wall temperature fluctuations return to normal state. Therefore, it is believed that in these four fluctuations “slag skin” is more likely to fall off, and we will record it. In the 50th, 91th, 234th, 310th furnace times in the furnace wall temperature fluctuations are smaller and analysis shows that this may be caused by instrument detection failure, and is therefore not worthy of consideration.
The maximum correlation-minimum redundancy mutual information method is used to select the characteristics of the furnace temperature characterization parameters. By ranking the correlation between the parameters and the furnace temperature, 17 parameters are selected from 39 characterization parameters such as blast humidity, furnace belly gas volume, oxygen enrichment rate, coal injection volume, hot air pressure and blast temperature, including 12 control parameters such as hot air pressure, cold air flow rate, blast humidity and oxygen enrichment flow rate, as well as the furnace belly gas volume, and the five state parameters such as gas volume, gas permeability index, oxygen enrichment rate, etc. The grey correlation analysis algorithm with balanced proximity was used to analyze the correlation between the characterization parameters and the silicon content of the molten iron at different time delays, and Figure 7 shows that the cold air pressure and hot blast temperature have the highest correlation with the silicon content of the molten iron at time delay 1. The coke ash and top air temperature have the highest correlation with the silicon content of the molten iron at time delay 2, and the blast humidity has the highest correlation with the silicon content of the molten iron at time delay 3. In this way, the correlation coefficients of all control parameters with the silicon content of the molten iron are obtained.

4.2. Parameter Set Division

Matlab was used to divide the 12 control parameters and the five state parameters into GRA-FCM. Table 3 shows the results of the GRA analysis of the state parameters and the control parameters. It can be seen that the analysis results are basically in line with the influence of each control parameter on the state parameters in blast furnace production. The time-delayed order of the characterization parameters in relation to the silicon content of the molten iron is combined to construct a directed diagram of the furnace temperature characterization parameters. Among them, the oxygen enrichment flow rate, hot blast temperature, coal injection volume and blast air humidity have a large influence on the furnace belly gas index, so these four control parameters are used as input data for predicting the furnace belly gas index. In addition, the oxygen-enriched flow control parameter is also used as data input for the prediction of the oxygen-enriched rate state parameter, indicating that a change in one control parameter can affect the direction of several state parameters.

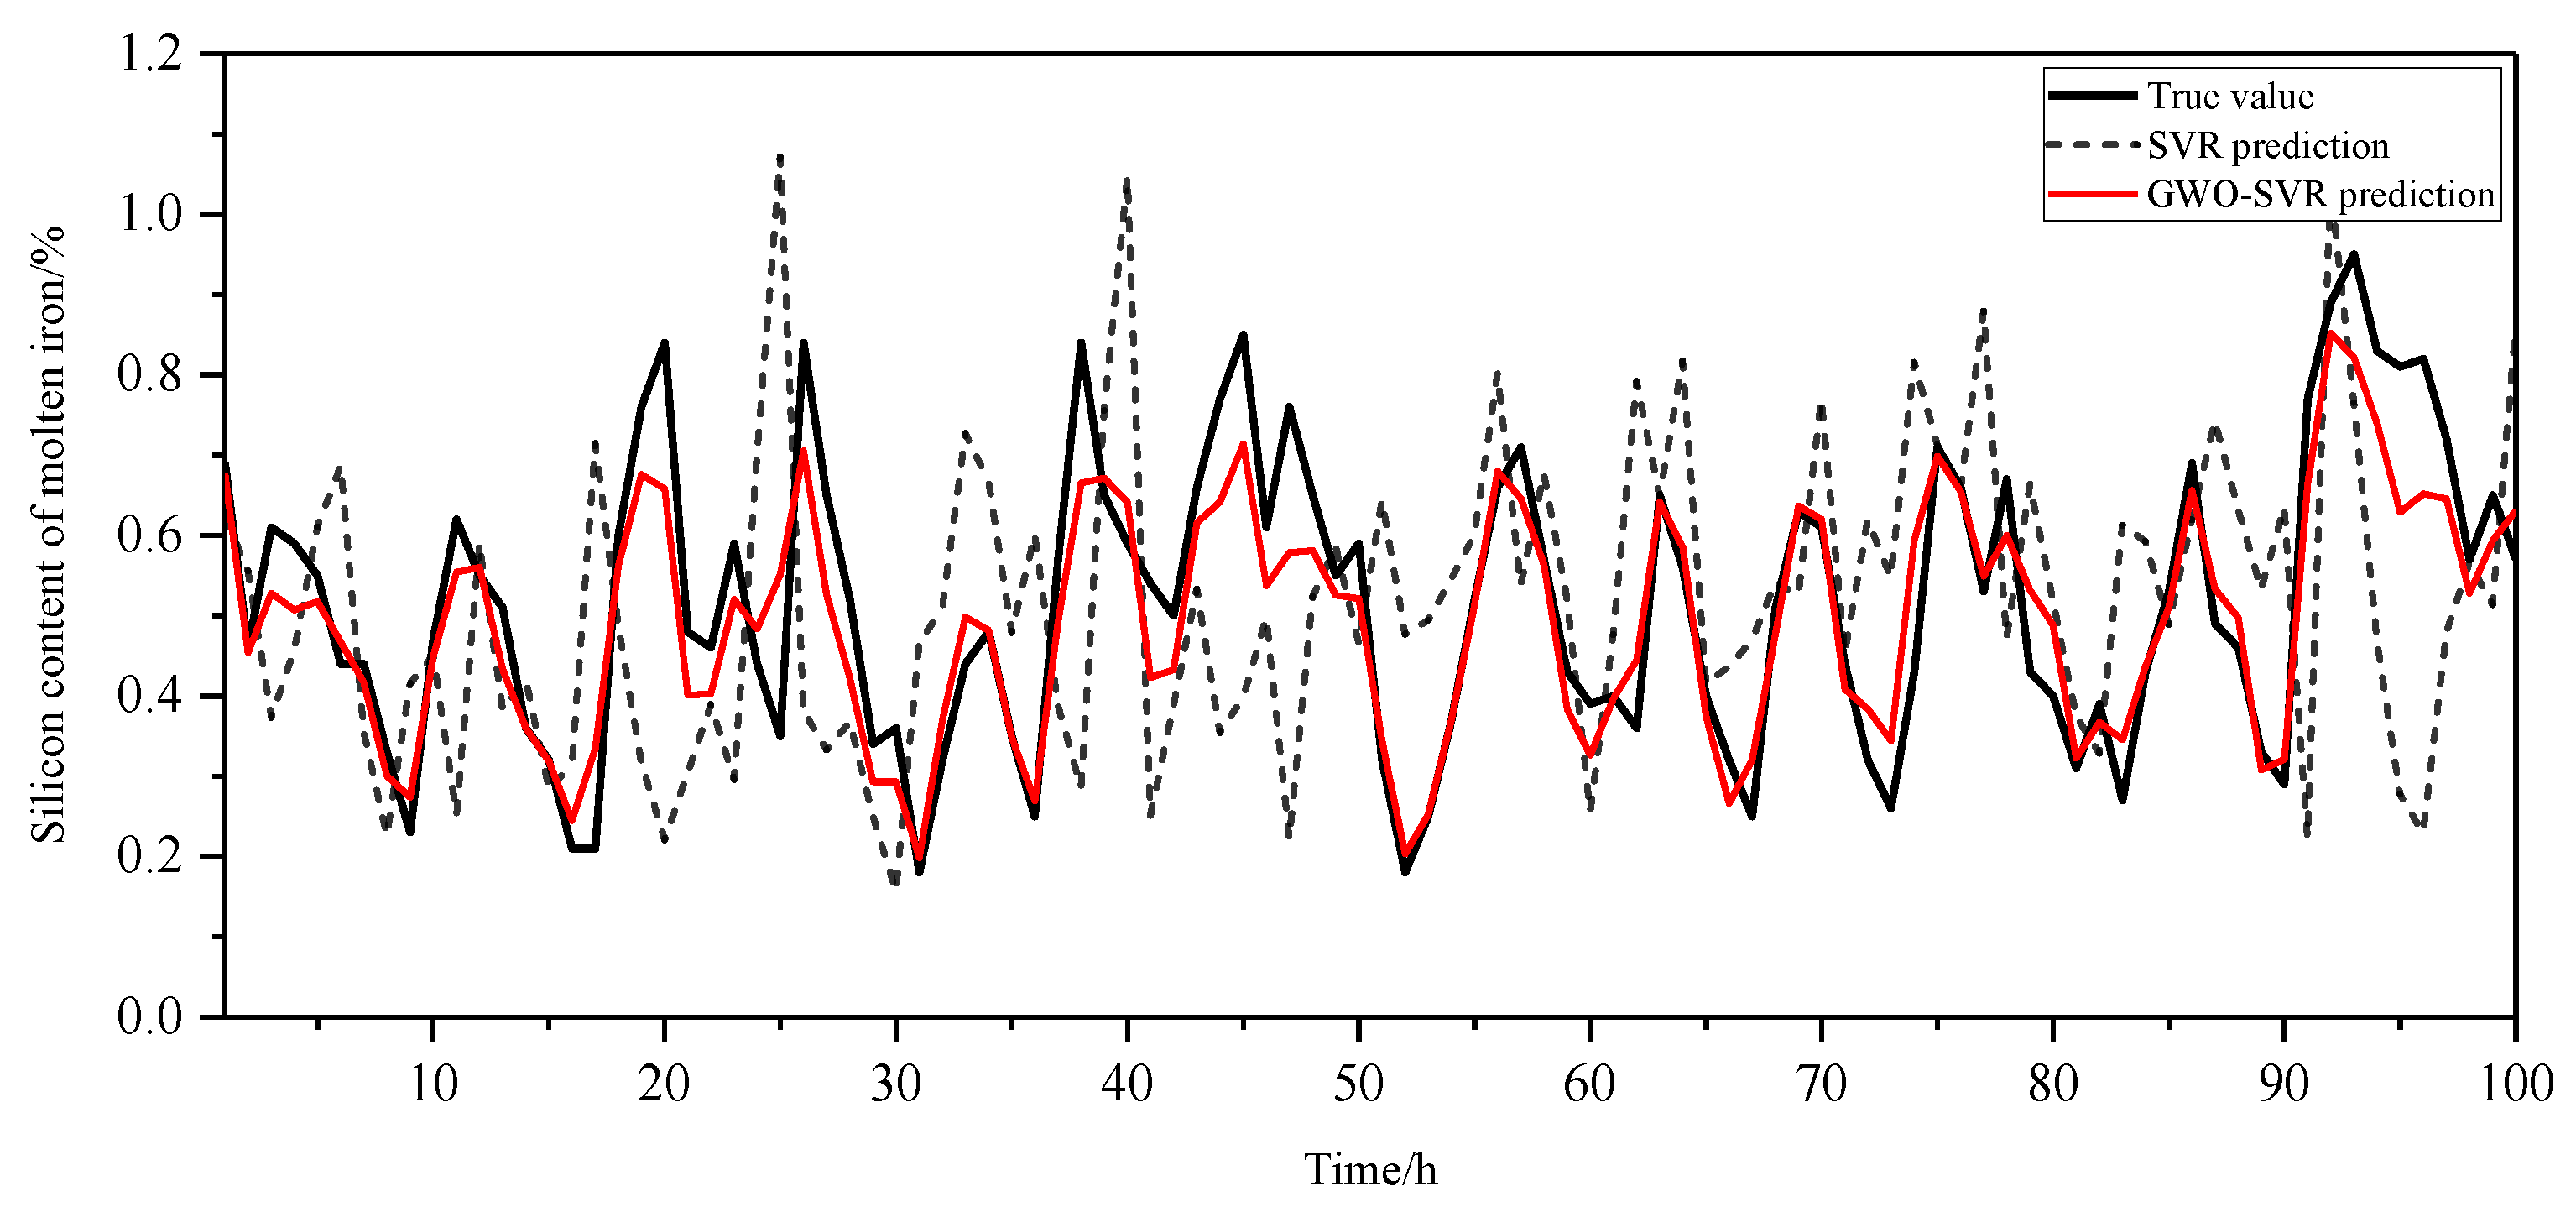
4.3. Dynamic Prediction of Silicon Content in Iron

The GWO-SVR model is used to predict each state variable in turn, and the prediction results are substituted into the input data of the iron silicon content prediction, and finally the dynamic prediction of iron silicon content is achieved. Figure 8 illustrates the iterative process of the GWO algorithm, where the model leveled off in fitness after 24 iterations. As can be seen in Figure 9, the GWO-SVR model predicts the silicon content of the iron closer to the real value than the SVR model. Furthermore, the advantage of this dynamic prediction of molten iron silicon content is that early prediction and control of molten iron silicon content can be achieved by state parameter prediction when only control parameters and partial state parameters are available. This operation is more in line with the actual production situation of the blast furnace, that is, the workers adjust the control parameters through the change of state parameters, which helps the blast furnace conditions to be stable and forward.
Three evaluation metrics, root mean square error (RMSE), mean absolute error (MAE) and mean absolute percentage error (MAPE), were introduced to analyze the prediction results of Figure 9, as shown in Table 4, based on the GWO-SVR in all three error evaluation results and are smaller than the traditional SVR model.

4.4. Real-Time Regulation of Control Parameters

The furnace temperature control parameters are regulated in real time according to the predicted silicon content of the molten iron. Table 5 shows that for every 1% increase in coal injection, the silicon content of the molten iron increases by approximately 2.8%. For every 50 increase in hot blast temperature, the silicon content of the molten iron increases by approximately 2.1%; for every 1% increase in coke ash, the silicon content of the molten iron increases by approximately 1.6%, and for every 1% increase in oxygen enrichment flow, the silicon content of the molten iron increases by approximately 1.2%. The degree of influence of different control parameters on the silicon of the iron is measured by the control variable method and the furnace temperature control sequence is set according to the expert experience. Using the furnace temperature dynamics prediction as a reference, the state parameters are controlled within a reasonable range in accordance with the expert experience.

5. Conclusions

(1) The model selects 17 main characterization parameters affecting furnace temperature from 39 parameters through the maximum correlation–minimum redundancy mutual information feature selection method. The gray correlation analysis of equilibrium proximity was used to quantify the correlation between the characterization parameters and the silicon content of the molten iron under different time delays, and the main furnace temperature characterization parameter set with the best influence time was established.
(2) The GRA-FCM model is used to establish a blast furnace data dynamic network from 12 control parameters to five state parameters. The GWO-SVR model was used to predict the control parameters in different clusters, step by step, to achieve dynamic prediction of the silicon content of the iron water. The results show that the RMSE, MAE and MAPE prediction errors of the GWO-SVR model are 0.0994, 0.0747 and 0.1252, respectively, and are all smaller than those of the conventional SVR model. Combining the dynamic prediction model with expert experience, the influence of control parameters on the silicon content of molten iron was further studied. For every 1% increase in coke ash content, the silicon content in molten iron increases by 1.6% on average.
(3) A multi-step dynamic prediction and closed-loop control model of “control parameters-state parameters-silicon content in molten iron-control parameters” has been established from the actual production situation of the blast furnace. In future studies, the cost of regulation of each control parameter will be combined with intelligent algorithms to establish a recommended model for control parameters.

Author Contributions

Conceptualization, Z.C. and A.Y.; methodology, Z.C.; software, Z.C. and L.W.; validation, Z.C., A.Y. and Y.H.; formal analysis, Z.C.; investigation, Z.C.; resources, Z.C.; data curation, Z.C.; writing—original draft preparation, Z.C.; writing—review and editing, Z.C.; visualization, Z.C.; supervision, A.Y. and Y.H.; project administration, Z.C.; funding acquisition, Z.C. All authors have read and agreed to the published version of the manuscript.

Funding

This research was funded by the National Natural Science Foundation of China (NO.52074126).

Data Availability Statement

Not applicable.

Acknowledgments

Thanks to the Hebei Engineering Research Center for the Intelligentization of Iron Ore Optimization and Ironmaking Raw Materials Preparation Processes for training and educating, Thanks to my teacher Yang Aimin for his careful guidance, and thanks to classmates in my team for their companionship.

Conflicts of Interest

The authors declare no conflict of interest.

References

  1. Dai, Y.; Li, J.; Shi, C.; Yan, W. Dephosphorization of high silicon hot metal based on double slag converter steelmaking technology. Ironmak. Steelmak. 2021, 48, 447–456. [Google Scholar] [CrossRef]
  2. Liu, J.Y.; Zhang, W. Blast furnace temperature prediction based on RBF neural network and genetic algorithm. Electron. Meas. Technol. 2018, 41, 42–45. [Google Scholar]
  3. Zhu, X.Z.; Zhang, H.W.; Yang, C.J. MWPCA blast furnace anomaly monitoring algorithm based on Gaussian mixture model. CIESC J. 2021, 72, 1539–1548. [Google Scholar]
  4. Li, J.; Wei, X.; Hua, C.; Yang, Y.; Zhang, L. Double-hyperplane fuzzy classifier design for tendency prediction of silicon content in molten iron. Fuzzy Sets Syst. 2022, 426, 163–175. [Google Scholar] [CrossRef]
  5. Song, J.H.; Yang, C.J.; Zhou, Z. Application of improved EMD-EIman neural network to predict silicon content in hot metal. CIESC J. 2016, 67, 729–735. [Google Scholar]
  6. Chen, W.; Kong, F.; Wang, B.; Li, Y. Application of grey relational analysis and extreme learning machine method for predicting silicon content of molten iron in blast furnace. Ironmak. Steelmak. 2019, 46, 974–979. [Google Scholar] [CrossRef]
  7. Su, X.; Sun, S.; Zhang, S.; Yin, Y.; Xiao, W. Improved multi-layer online sequential extreme learning machine and its application for hot metal silicon content. J. Frankl. Inst. 2020, 357, 12588–12608. [Google Scholar] [CrossRef]
  8. Chen, J.H.; Zhou, P. Operational Optimization Control of Molten lron Quality in Blast Furnace lronmaking Process. Control. Eng. China 2020, 27, 1136–1141. [Google Scholar]
  9. Jiang, Z.H.; Xu, C.; Gui, W.H.; Jiang, K. Prediction Method of Hot Metal Silicon Content in Blast Furnace Based on Optimal Smelting Condition Migration. Acta Autom. Sin. 2022, 48, 194–206. [Google Scholar]
  10. Yin, L.Z.; Guan, Y.Y.; Jiang, Z.H.; Xu, X.M. Optimal method of selecting silicon content data in blast furnace hot metal based on k-meanS++. CIESC J. 2020, 71, 3661–3670. [Google Scholar]
  11. Sun, J.; Cui, T.T.; Liu, X.Y.; Xu, B. Prediction of Silicon Content in Blast Furnace Hot Metal by PSO-GA Optimized ELM. Mach. Des. Manuf. 2022, 03, 228–232. [Google Scholar]
  12. Cui, B.; Chen, W.; Wang, B.X.; Wu, P.F.; Chen, Y. Prediction of silicon content in hot metal of blast furnace based on grey correlation analysis and extreme learning machine. Metall. Ind. Autom. 2022, 46, 54–62. [Google Scholar]
  13. Zhang, X.S.; Xu, X.Y.; Pan, F. Application of ET-BAS algorithm in furnace temperature predictive control. Transducer Microsyst. Technol. 2021, 40, 157–160. [Google Scholar]
  14. Zhai, N.J.; Zhou, X.F.; Li, S.; Shi, H.B. Prediction method of furnace temperature based on transfer learning and knowledge distillation. Comput. Integr. Manuf. Syst. 2022, 28, 1860–1869. [Google Scholar]
  15. Huang, C.L.; Tang, Y.L.; Zhang, X.F.; Chu, Y.Z. Prediction and Simulation of Silicon Content in Blast Furnace for PCA and PSO-ELM. Comput. Simul. 2020, 37, 398–402. [Google Scholar]
  16. Cui, T.T. Research on Prediction Model of Silicon Content in Blast Frnace Hot Metal; North China University of Science and Technology: Qinhuangdao, China, 2020. [Google Scholar]
  17. Han, Y.; Li, J.; Yang, X.L.; Liu, W.X.; Zhang, Y.Z. Dynamic Prediction Research of Silicon Content in Hot Metal Driven by Big Data in Blast Furnace Smelting Process under Hadoop Cloud Platform. Complexity 2018, 2018, 8079697. [Google Scholar] [CrossRef]
  18. Wang, X.D.; Hao, L.Y. Analysis of modern ironmaking technology and low-carbon development direction. China Metall. 2021, 31, 1–5. [Google Scholar]
  19. Zhou, P.; Liu, J.J. Prediction of blast furnace hot metal quality interval based on stacking. Control. Decis. 2021, 36, 335–344. [Google Scholar]
  20. Yin, L.Z.; Li, L.; Jiang, Z.H. Prediction of silicon content in hot metal using neural network and rough set theory. J. Iron Steel Res. 2019, 31, 689–695. [Google Scholar]
  21. Li, L.Y. Research on Hydrogen Utilization in Dr Shaft Furnace and Temperature Field; Yanshan University: Qinhuangdao, China, 2016. [Google Scholar]
  22. Jiang, Z.H.; Dong, M.L.; Gui, W.H.; Yang, C.H.; Xie, Y.F. Two-dimensional Prediction for Silicon Content of Hot Metal of Blast Furnace Based on Bootstrap. Acta Autom. Sin. 2016, 42, 715–723. [Google Scholar]
  23. Fang, Y.; Zhao, X.; Zhang, P.; Liu, L.; Wang, S.Y. Prediction modeling of silicon content in liquid iron based on multiple kernel extreme learning machineand improved grey wolf optimizer. Control. Theory Appl. 2020, 37, 1644–1654. [Google Scholar]
  24. Zhou, P.; Liu, J.P.; Liang, M.Y.; Zhang, R.Y. KPLS Robust Reconstruction Error Based Monitoring and Anomaly Identification of Fuel Ratio in Blast Furnace Ironmaking. Acta Autom. Sin. 2021, 47, 1661–1671. [Google Scholar]
  25. Zhao, N.; Wang, Y.Y.; Yang, F.; Yang, W.X. Application of principal component analysis and least squares support vector machine model inprediction of sulfur and silicon content in molten iron. Metall. Anal. 2020, 40, 1–6. [Google Scholar]
  26. Liu, X.; Zhang, W.J.; Shi, Q.; Zhou, L. Operation Parameters Optimization of Blast Furnaces Based on Data Mining and Cleaning. J. Northeast. Univ. (Nat. Sci.) 2020, 41, 1153–1160. [Google Scholar]
  27. Liu, S.; Liu, F.L.; Liu, E.H.; Lv, Q.; Shi, Q. Optimization of blast furnace parameters based on big data technology and process experience. Iron Steel 2019, 54, 16–26. [Google Scholar]
  28. Li, Z.N.; Chu, M.S.; Liu, Z.G.; Ruan, G.J.; Li, B.F. Effect of the large blast furnace charging parameters on gas flow. J. Mater. Metall. 2019, 18, 7–13. [Google Scholar]
  29. Liu, J.J.; Zhou, P.; Wen, L. Root mean square error probability weighted integrated learning based modeling for molten ironquality in blast furnace ironmaking. Control. Theory Appl. 2020, 37, 987–998. [Google Scholar]
  30. Wen, B.; Wu, S.; Zhou, H.; Gu, K. A BP neural network based mathematical model for predicting Si content in hot metal from COREXprocess. J. Iron Steel Res. 2018, 30, 776–781. [Google Scholar]
  31. Zhuang, T.; Yang, C.J. Silicon content forecasting method for hot metal based on Elman-Adaboost strong predictor. Metall. Ind. Autom. 2017, 41, 1–6. [Google Scholar]
  32. Yang, K. Modeling Silicon Content Inmolten Iron of Blast Furnace Based on Neural Network; Yanshan University: Qinhuangdao, China, 2016. [Google Scholar]
  33. Diniz, A.P.M.; Côco, K.F.; Gomes, F.S.V.; Salles, J.L.F. Forecasting Model of Silicon Content in Molten Iron Using Wavelet Decomposition and Artificial Neural Networks. Metals 2021, 11, 1001. [Google Scholar] [CrossRef]
  34. Roe, D.R.; Brooks, B.R. Improving the speed of volumetric density map generation via cubic spline interpolation. J. Mol. Graph. Model. 2021, 104, 107832. [Google Scholar] [CrossRef] [PubMed]
  35. Jiang, Y.; Zhou, P.; Yu, G. Multivariate Molten Iron Quality Modeling Based on Improved Incremental Random Vector Functional-link Networks. IFAC Pap. 2018, 51, 290–294. [Google Scholar] [CrossRef]
  36. Guan, X. Prediction of hot metal silicon content in blast furnace based on extreme learning machine andflower pollinate algorithm. Electron. Meas. Technol. 2020, 43, 77–80. [Google Scholar]
  37. Xu, D.; Lu, Y.X.; Xiao, Y.; Zhao, Y.; Cai, X.W.; Ding, L. Identification of abnormal line loss for a distribution power network based on an isolation forest algorithm. Power Syst. Prot. Control. 2021, 49, 12–18. [Google Scholar]
  38. Zhao, Y.N.; Ye, L. A Numerical Weather Prediction Feature Selection Approach Based on Minimal-redundancy-maximal-relevance Strategy for Short-term Regional Wind Power Prediction. Proc. CSEE 2015, 35, 5985–5994. [Google Scholar]
  39. Chen, M.J.; Zhang, W.D. Point-of-interest recommendation algorithm based on grey relational analysis and temporalspatial preference feature. Syst. Eng. Electron. 2022, 44, 1934–1941. [Google Scholar]
  40. Pan, Y.H.; Zhou, P.; Yan, Y.; Agrawal, A.; Wang, Y.H. New insights into the methods for predicting ground surface roughness in the age of digitalisation. Precis. Eng. 2021, 67, 393–418. [Google Scholar] [CrossRef]
Figure 1. Blast furnace dynamic control system.
Metals 12 01403 g001
Figure 2. GWO-SVR prediction model.
Metals 12 01403 g002
Figure 3. Data analysis and control model for comprehensive characterization of furnace temperature.
Metals 12 01403 g003
Figure 4. Outlier judgment.
Metals 12 01403 g004
Figure 5. Parameter Normal value range.
Metals 12 01403 g005
Figure 6. Analysis of slagging time point based on cooling wall temperature.
Metals 12 01403 g006
Figure 7. Correlation analysis of partial control parameters and silicon content in molten iron at different time delays.
Metals 12 01403 g007
Figure 8. Iterative process of GWO algorithm.
Metals 12 01403 g008
Figure 9. Comparison of GWO-SVR and SVR forecasts.
Metals 12 01403 g009
Table 1. Chemical composition of raw materials.
IngredientFeOMgOCaOSiO2TFe
Sinter9.654.215.784.9656.23
pellets2.331.352.459.6557.26
Table 2. Coke ash analysis.
IngredientMgOCaOSiO2AL2O3
coke0.415.3629.1539.62
Table 3. Correlation coefficient between state parameters and control parameters.
ParametersFurnace Belly Gas VolumeBreathability IndexFurnace Top PressureTheoretical Combustion TemperatureOxygen Enrichment Rate
Coal injection volume0.64320.36870.26590.42150.4184
Hot blast temperature0.53700.28750.10400.63210.2521
Oxygen-enriched flow0.42480.47690.23500.27420.5387
Clinker ratio0.17530.18550.12580.09520.0561
Coke sulphur content0.04700.13320.12700.20640.2107
Coke ash0.49850.26230.04210.31680.3270
Nitrogen flow0.21580.29540.26930.16830.1646
Cold air flow0.39650.46370.32160.02640.1196
Hot air flow0.41250.53670.42700.43210.2942
Blast humidity0.47270.26890.16950.56370.1855
Blast temperature0.33520.22620.20640.63410.2320
Coke load0.32770.13730.12420.40740.3211
Table 4. Error comparison analysis.
RMSEMAEMAPE
SVR model0.18590.14730.2636
GWO-SVR model0.09940.07470.1252
Table 5. Influence of control parameters on silicon content in hot metal.
Control ParametersParameter VariationsMolten Iron [Si]Control ParametersParameter VariationsMolten Iron [Si]
Coal injection volume ± 1 % ± 2.8 % Nitrogen flow ± 1 % ± 0.6 %
Hot blast temperature ± 50 °C ± 2.1 % Cold air flow ± 1 % ± 0.9 %
Oxygen-enriched flow ± 1 % ± 1.2 % Hot air flow ± 1 % ± 1.3 %
Clinker ratio ± 1 % ± 1.3 % Blast humidity ± 1 % ± 1.9 %
Coke sulphur content ± 1 % ± 1.0 % Blast temperature ± 50 °C ± 1.5 %
Coke ash ± 1 % ± 1.6 % Coke load ± 1 % ± 1.1 %
Publisher’s Note: MDPI stays neutral with regard to jurisdictional claims in published maps and institutional affiliations.

