Article

A New Computational Method for Predicting Ductile Failure of 304L Stainless Steel

1
Department of Reliability Assessment, Korea Institute of Machinery and Materials, Daejeon 34103, Korea
2
Department of Naval Architecture and Ocean Engineering, Pusan National University, Busan 46241, Korea
3
Hydrogen Ship Technology Center, Pusan National University, Busan 46241, Korea
*
Authors to whom correspondence should be addressed.
Metals 2022, 12(8), 1309; https://doi.org/10.3390/met12081309
Submission received: 29 June 2022 / Revised: 25 July 2022 / Accepted: 27 July 2022 / Published: 4 August 2022
(This article belongs to the Topic Numerical Modeling on Metallic Materials)

Abstract

:
Austenitic stainless steel is useful for storing and transporting liquefied natural gas (LNG) at temperatures below −163 °C due to its superior low-temperature applications. This study develops a computational method for the failure prediction of 304L stainless steel sheet to utilize its usability as a design code for industrial purposes. To consider material degradation in a phenomenological way during the numerical calculation, the combined Swift–Voce equation was adopted to describe the nonlinear constitutive behavior beyond ultimate tensile strength. Due to the stress state-dependent fracture characteristics of ductile metal, a modified Mohr–Coulomb fracture criterion was adopted using stress triaxiality and Lode angle parameter. The numerical formulation of the elastoplastic-damage coupled constitutive model with fracture locus was implemented in the ABAQUS user-defined subroutine UMAT. To identify the material and damage parameters of constitutive models, a series of material tests were conducted considering various stress states. It has been verified that the numerical simulation results obtained by the proposed failure prediction methodology show good agreement with the experimental results for plastic behavior and fractured configuration.

1. Introduction

Austenitic stainless steel is recognized as a functional material in various industries due to its excellent strength, toughness, and superior corrosion resistance even in low-temperature environments [1,2,3]. In particular, 304L austenitic stainless steel, which is generally known as 18/8 steel, is useful for storing and transporting liquefied natural gas (LNG) at temperatures below −163 °C due to its superior low-temperature applications. Zheng et al. (2018) reported that the mechanical strength of low-temperature treated 304 stainless steel was increased up to 2.7 times compared to conventional as-received samples [4]. Mallick et al. (2017) reported that 10–20% low-temperature (−196 °C) deformation leads to a higher level of strength (1306–1589 MPa) owing to the formation of a higher volume fraction of strain-induced martensite [5]. Singh et al. (2018) reported that the low-temperature mechanical strength was increased to 1200 MPa, which is much more than test results under ambient conditions. In addition, in low-temperature treatment, the micro-hardness was increased from 208 VHN to 520 VHN, which is more than double that of the as-received sample [6]. Oh et al. (2018) reported the low-temperature fatigue strength of 304 stainless steel was significantly improved compared to the ambient fatigue strength [7]. Thanks to these valuable studies, it has been established that 304(L) austenitic stainless steel is the optimal material in low-temperature applications because an enhanced mechanical performance was observed in terms such as strength, hardness, and fatigue strength at low temperatures.
Due to its superior low-temperature mechanical performance, 304L stainless steel is adopted as the main material for LNG carrier cargo holds. The primary barrier is corrugated because it undergoes repeated thermal shrinkage and contraction during operation in the LNG loading and unloading processes [8,9,10,11]. Therefore, some researchers have focused on the deformation and pressure resistance of 304L stainless steel-made corrugated membranes in experimental approaches. Kim et al. (2011) reported the pressure levels that induced the collapse of the corrugated walls via plastic buckling were six and twelve bar for the large and small corrugated containers, respectively [12]. Lee et al. (2015) reported the pressure-resisting capability of 304L-made stainless steel plate. The maximum deformation of the weakest corrugation was measured with respect to an applied exterior pressure and the pressure at the start of buckling failure was chosen as the pressure-resisting capability of the corrugations [13]. Jeong et al. (2021) reported the pressure-resisting capabilities of a 304L stainless steel corrugated membrane under hydrodynamic load [14]. Those research outcomes have helped improve the shape of the corrugated membrane. However, most evaluations of the pressure resistance performance and the deformation of the primary barrier of the LNG CCS were all conducted at room temperature. This is because it is very difficult to build a pressure test environment for large structures in low-temperature environments. Even so, it is important to evaluate the primary barrier in low-temperature environments, which is the main operating condition of 304L stainless steel primary barriers.
If difficulties are encountered in the experimental evaluation of low-temperature performance, failure evaluation techniques based on computational methods can be an excellent alternative. Evaluating the failure of ductile materials requires predicting the elastoplastic behavior and occurrence of failure. Among failure prediction approaches, the phenomenological failure model is defined as failure occurrence when the stress or strain of an element reaches a specific value. The strain-based failure model is more suitable than the stress-based failure model for dealing with structures undergoing severe plastic deformation and has proven quite useful in collision and failure problems [15,16,17,18,19,20,21,22].
Early studies to predict ductile failure explained the relationship between stress triaxiality and equivalent plastic strain [23,24,25,26]. In addition, it was found that the Lode angle, defined as the third invariant of the deviation stress tensor, also affects ductile failure [27,28,29,30]. The Mohr–Coulomb criterion is based on the maximum shear stress and is mainly used to determine the failure of rock, soil, and concrete. To eliminate the shortcoming of the absence of pressure dependency, Bai and Wierzbicki (2010) developed a modified Mohr–Coulomb criterion that is transformed from a local representation in terms of shear stress and normal stress to a mixed strain–stress representation of stress triaxiality, Lode angle parameter, and equivalent plastic strain for monotonic loading conditions [28]. The MMC criterion can predict the crack initiation point and the direction of crack propagation and its usefulness has already been verified in many previous studies [31,32,33,34,35,36,37].
Several studies have been conducted to predict the ductile fracturing of 304L stainless steel. Othmen et al. (2020) carried the prediction of the onset of rupture of austenitic stainless steel during its forming process [38]. Various fracture criteria, implemented in the finite element code Abaqus/Implicit via a user subroutine USDFLD, have been investigated. Pham and Iwamoto (2018) proposed the numerical fracture prediction of 304 stainless steel with the modified Johnson–Cook damage model [39]. Kim et al. (2013) proposed a viscoplastic model for 304L stainless steel considering the pre-strain and temperature effects [40]. These studies accurately predicted the occurrence of fractures and crack propagation but provided limited failure predictions due to their lack of consideration for various ranges of stress states.
Thus, the present study proposes the failure prediction methodology of 1.2 t 304L stainless steel sheet. An elastoplastic-damage coupled constitutive equation was developed to establish the failure criterion for the primary barrier and to propose a failure analysis technique. To establish the phenomenological ductile failure criterion for 304L stainless steel sheet, a series of material tests were performed considering various stress states. A modified Mohr–Coulomb model was adopted to formulate ductile fracture criteria in accordance with the stress triaxiality and Lode angle of ductile materials. Numerical analysis with the completed ductile fracture criterion shows good agreement with experimental results.

2. Phenomenological Ductile Fracture Criteria

2.1. Characterization of Stress State

For a certain stress state { σ 1 ,   σ 2 ,   σ 3 } of an isotropic material, the stress tensor can be expressed as hydrostatic and deviatoric parts. The three main invariants of the stress tensor can be expressed as follow.
σ = s + p I
I 1 = t r [ σ ]
J 2 = ( 1 2 s : s )
J 3 = d e t [ s ]
where s , p is the deviatoric stress tensor and hydrostatic stress, respectively. I is the second-order identity tensor. From principal stress space, von-Mises yield surface circumscribes three-dimensional cylinder orthogonal to deviatoric plane ( π -plane). To indicate a certain stress state on the deviatoric plane, a cylindrical coordinate system can be used to define the Lode angle from the hydrostatic stress and principal stress directions. The Lode angle can be defined as the angle of the principal stress axis on the deviatoric plane. The Lode angle is related to the normalized third invariant as follows [28].
ξ = c o s ( 3 θ ) = ( r q ) 3      ( 0 θ π / 3 )
r = [ 27 2 ( σ 1 p ) ( σ 2 p ) ( σ 3 p ) ] 1 / 3 = [ 27 2 det [ s ] ] 1 / 3 = [ 27 2 J 3 ] 1 / 3
θ = 1 3 a r c c o s ( 27 2 J 3 [ 3 J 2 ] 3 / 2 )
where ξ , r is the normalized third invariant and the third invariant, respectively. θ is the Lode angle expressed as stress invariants. Stress triaxiality is expressed as the ratio of hydrostatic stress ( O O ¯ ) and equivalent stress ( O P ¯ ) as follows.
η = p q = 2 3 c o t ( arctan O P ¯ O O ¯ )
where q is the equivalent stress. From a viewpoint of principal stress coordinates, stress triaxiality represents the dominance of the hydrostatic stress in a certain stress state. The normalized Lode angle can be expressed as follows through the modified Haigh–Westergaard coordinate system [41].
θ ¯ = 1 6 θ π       ( 1 θ ¯ 1 )
In the planar stress condition, it is possible to convert a three-dimensional stress space into two dimensions.

2.2. Modified Mohr–Coulomb Model

Bai and Wierzbicki (2010) modified and extended Mohr–Coulomb (MC) fracture criterion to describe ductile fracture of isotropic crack-free solids in terms of equivalent plastic strain [28]. The Mohr–Coulomb fracture criterion has been widely used in rock and soil mechanics [42,43]. This criterion states that fracture occurs at a certain plane when the linear combination of shear and normal stress reaches a critical value [44]. Bai and Wierzbicki (2010) assumed that the behavior of ductile materials can be described by the von-Mises yield condition and hardening power law [28]. The modified Mohr–Coulomb (MMC) fracture model can be expressed as follows in terms of the stress triaxialiy and the normalized Lode angle.
ε ¯ i p ( η ,   θ ¯ ) = { A c 2 [ c 3 + 3 2 3 ( 1 c 3 ) ( s e c ( θ ¯ π 6 ) 1 ) ] × [ 1 + c 1 2 3 c o s ( θ ¯ π 6 ) + c 1 ( η + 1 3 s i n ( θ ¯ π 6 ) ) ] } 1 n .
where A , n are material parameters of swift equation, and c i ( i = 1 ,   2 ,   3 ) is fracture parameters. Three fracture parameters need to be calibrated from experimental results. In this study, with the following condition satisfied, the damage accumulation of the element is initiated.
0 ε ¯ i p d ε ¯ p ε ¯ i p ( η ,   θ ¯ ) = 1
where ε ¯ i p is equivalent plastic strain at damage initiation, and ε ¯ p is equivalent plastic strain.

3. Elastoplastic-Damage Coupled Constitutive Model

3.1. Hardening Function

In this study, the Swift-Voce equation was adopted as a hardening function that expresses the isotropic hardening behavior according to the equivalent plastic strain for general ductile metal materials [41,45,46]. Swift-Voce equation can be described as follow.
σ y ( ε ¯ p ) = α k s + ( 1 α ) k v k
k s = A ( ε 0 + ε ¯ p ) n
k v = σ y 0 + Q ( 1 e x p ( β ε ¯ p ) )
where k s , k v , and α is Swift equation, Voce equation, and weight parameter, respectively. A , ε 0 , n , σ y 0 , Q , β is material parameters for Swift-Voce equation. Some ductile materials show yield plateau after yielding. Considering yield plateau strain ( ε p l a t ), Swift-Voce equation can be described as follow.
k s = { A ( ε 0 ) n A ( ε 0 + ε ¯ p ε p l a t ) n                         ε ¯ p ε p l a t ε ¯ p > ε p l a t
k v = { σ y 0 Q { 1 e x p [ β ( ε ¯ p ε p l a t ) ] }         ε ¯ p ε p l a t ε ¯ p > ε p l a t

3.2. Damage Evolution Rules

In the present study, ductile materials undergo damage after damage initiation. For the isotropic hardening ductile material, damage manifests itself in two forms; softening of yield stress and degradation of elastic modulus as shown in Figure 1. Lemaitre (1985) explained that damage to the material affects the cross-sectional area due to the growth of pores and micro-cracks inside the material, leading to a decrease in the modulus of elasticity [47]. In this study, in order to define the phenomenological fracture, the damage variable is simply expressed in terms of the equivalent plastic strain rate as follows.
D = { 0 ( ε ¯ p < ε ¯ i p ) D s × ε ¯ ˙ p ( ε ¯ i p ε ¯ p < ε ¯ f p ) D c ( ε ¯ f p ε ¯ p )
where D s , D c is damage accumulation control parameter and critical damage, respectively. Damage accumulation control parameter adjusts the degree of damage accumulation. Critical damage defines the thresholds for damage. ε ¯ i p and ε ¯ f p represents equivalent plastic strain at damage initiation and fracture, respectively.

3.3. Constitutive Model

In this study, an elastoplastic-damage coupled constitutive model is proposed to predict the damage of ductile material. The total strain tensor and strain rate tensor can be decomposed into elastic part and plastic part as follows.
ε = ε e + ε p
ε ˙ = ε ˙ e + ε ˙ p
Using the concept of effective area and stress of damaged material proposed by Lemaitre (1985) [47], the general Hooke’s law can be expressed as follows.
σ = ( 1 D ) D : ε e
where σ , D represents the stress tensor and the stiffness tensor for isotropic materials, respectively. D is damage variable. Deviatoric stress and hydrostatic stress are as follows, respectively.
s = ( 1 D ) 2 G ε d e
p = ( 1 D ) K ε v e
where ε d e , ε v e is deviatoric strain tensor and volumetric strain, respectively. G and K represent shear modulus and volume modulus, respectively. Under the constant loading direction, the effect of kinematic hardening can be ignored. The yield function according to the von-Mises yield criterion is as follows.
Φ = q ( 1 D ) σ y ( ε ¯ p )
q = 3 J 2 = 3 2 s : s = 3 2 s
where q is the von-Mises equivalent stress expressed as the deviatoric stress, and σ y ( ε ¯ p ) represents the isotropic hardening function expressing according to the equivalent plastic strain. According to the Prandtl-Reuss plastic law, flow rule is defined as follows [48].
ε ˙ p = γ ˙ Φ σ = γ ˙ 3 2 s s
where ε ˙ p , γ ˙ is the plastic strain rate and the plastic multiplier, respectively. Plastic strain rate is expressed as Prandtl-Reuss flow vector and plastic multiplier. Equivalent plastic strain rate is defined as follows.
ε ¯ ˙ p = 2 3 ε ˙ p : ε ˙ p = 2 3 ε ˙ p = γ ˙
According to Equation (25), the equivalent plastic strain rate is the same as the plastic multiplier. The loading/unloading conditions of the constitutive model is as follows.
Φ 0 ,     γ ˙ 0 ,     γ ˙ Φ = 0

3.4. Numerical Implementation Algorithm

In order to formulate the proposed elastoplastic-damage coupled constitutive model with fracture locus, ABAQUS/STANDARD, a commercial finite element analysis software, was adopted. ABAQUS with subroutine UMAT (user subroutine to define a material’s mechanical behavior) provides the user to define material properties and provides values calculated at the integration point of each element.
In this study, the elastoplastic-damage coupled constitutive model was formulated with a fully implicit backward Euler integration scheme. A return mapping scheme with elasticity prediction and plastic correction was adopted. When the total strain increment ( Δ ε ) according to the time interval [ t n , t n + 1 ] is determined at each integration point, the subroutine UMAT calculates unknown variables σ n + 1 , ε n + 1 p , D n + 1 , t n + 1 using the known variables σ n , ε n p , D n , t n [48,49]. When the total strain increment is determined, the trial stress and strain components can be expressed as follows.
ε n + 1 e   t r i a l = ε n e + Δ ε
ε ¯ n + 1 p   t r i a l = ε ¯ n p
D n + 1 t r i a l = D n
s n + 1 t r i a l = ( 1 D n ) 2 G ε v   n + 1 e   t r i a l
p n + 1 t r i a l = ( 1 D n ) K ε v   n + 1 e   t r i a l
The corresponding trial yield function and trial equivalent stress are as follows.
Φ t r i a l = q n + 1 t r i a l ( 1 D n ) σ y ( ε ¯ n p )
q n + 1 t r i a l = 3 J 2 ( s n + 1 t r i a l ) = 3 2 s n + 1 t r i a l : s n + 1 t r i a l = 3 2 s n + 1 t r i a l
When the trial yield function is Φ t r i a l 0 , the trial stress exists within the yield function, so it is regarded as an elastic region in which plastic increment does not occur. The state variables are updated as Equations (28)–(32) and the stress is updated as follows.
σ n + 1 = s n + 1 t r i a l + p n + 1 t r i a l I
If the trial yield function is resulted in Φ t r i a l > 0 , plastic correction is required according to the incremental calculation of the equivalent plastic strain. First, strain and damage parameters can be defined by the Backward Euler method as follows.
ε n + 1 e   = ε n + 1 e   t r i a l ε n + 1 p = ε n + 1 e   t r i a l Δ γ 3 2 s n + 1 s n + 1
ε ¯ n + 1 p = ε ¯ n p + Δ γ
D n + 1 = D n + D s Δ γ
ε d   n + 1 e   = ε d   n + 1 e   t r i a l Δ γ 3 2 s n + 1 s n + 1
ε v   n + 1 e   = ε v   n + 1 e   t r i a l
According to the definition of the strain tensor in the next step shown in Equation (36), deviatoric strain tensor and the volumetric strain of the next step are defined in Equations (39)–(40). The deviatoric stress and the hydrostatic stress are defined as follows.
s n + 1 = ( 1 D n + 1 ) 2 G ε d   n + 1 e   t r i a l ( 1 D n + 1 ) 2 G Δ γ 3 2 s n + 1 s n + 1
p n + 1 = ( 1 D n + 1 ) K ε v   n + 1 e
In order to represent the plastically corrected yield function at t n + 1 , the deviatoric stress of the next step shown in Equation (43) must be calculated. This can be expressed as Equation (43) using the trial deviatoric stress shown in Equation (33), and because the trial deviation stress is proportional to the deviatoric stress of the next step, it can be summarized as Equation (44).
s n + 1 = 1 D n + 1 1 D n s n + 1 t r i a l ( 1 D n + 1 ) 2 G Δ γ 3 2 s n + 1 s n + 1
s n + 1 = ( 1 D n + 1 ) ( 1 1 D n 3 G Δ γ q n + 1 t r i a l ) s n + 1 t r i a l
The yield function in the next step is defined as follows because it must satisfy the consistency condition.
Φ n + 1 = q n + 1 ( 1 D n + 1 ) σ y ( ε ¯ n p + Δ γ )
q n + 1 = ( 1 D n + 1 ) ( 1 1 D n q n + 1 t r i a l 3 G Δ γ )
The yield function can be expressed as a function of the plastic multiplier and the damage of the next step, and the return mapping method must be performed to calculate the plastic multiplier and the damage of the next step.
With Equation (38), Equation (45) can be simplified as Equation (47). The plastic multiplier is calculated through the Newton-Raphson method. The simplified yield function does not require the process of estimating the initial value of the plastic multiplier [48] in calculating the damage energy release rate like Lemaitre’s damage composition equation.
Φ n + 1 = 1 1 D n q n + 1 t r i a l 3 G Δ γ σ y ( ε ¯ n p + Δ γ )
σ n + 1 = s n + 1 + p n + 1 I
When all stress and state variables are updated, the yield function of the next step reaches an elastic region as a value close to zero. In finite element analysis, in order to calculate the tangent stiffness matrix of each element, a consistent tangent modulus of the material reaching the last updated plastic region is required. Through the relationship between stress and strain tensor, the consistent tangent modulus ( D e p ) of the elastoplastic region is defined as follows [48].
D e p σ n + 1 ε n + 1 e   t r i a l
σ n + 1 = [ D e Δ γ 6 G 2 q n + 1 t r i a l I d ] : ε n + 1 e   t r i a l
D e = 2 G I d + ( K 2 3 G ) I I
I d = I s 1 3 I I
I s = I i j k l = 1 2 ( δ i k δ j l + δ i l δ j k )
where I s and I d represent the fourth symmetric identity tensor and the deviatoric projection tensor, respectively, and δ i j is Krönecker delta. D e is the consistent tangent modulus derived through Hooke’s law in the elastic region where plastic correction was not performed. D e p can be expressed as follows by partial unification of Equation (50).
D e p = D e Δ γ 6 G 2 q n + 1 t r i a l I d 6 G 2 q n + 1 t r i a l ε d   n + 1 e   t r i a l Δ γ ε n + 1 e   t r i a l + Δ γ 6 G 2 ( q n + 1 t r i a l ) 2 ε d   n + 1 e   t r i a l q n + 1 t r i a l ε n + 1 e   t r i a l .  
D e p = D e Δ γ 6 G 2 q n + 1 t r i a l I d + 6 G 2 ( Δ γ q n + 1 t r i a l 1 3 G + d σ y d ε ¯ p | ε ¯ n p + Δ γ ) s n + 1 t r i a l s n + 1 t r i a l s n + 1 t r i a l s n + 1 t r i a l .  
D e p = 2 G ( 1 Δ γ 6 G 2 q n + 1 t r i a l ) I d + 6 G 2 ( Δ γ q n + 1 t r i a l 1 3 G + d σ y d ε ¯ p | ε ¯ n p + Δ γ ) s n + 1 t r i a l s n + 1 t r i a l s n + 1 t r i a l s n + 1 t r i a l + K I I .  

4. Comparison with Experimental Results
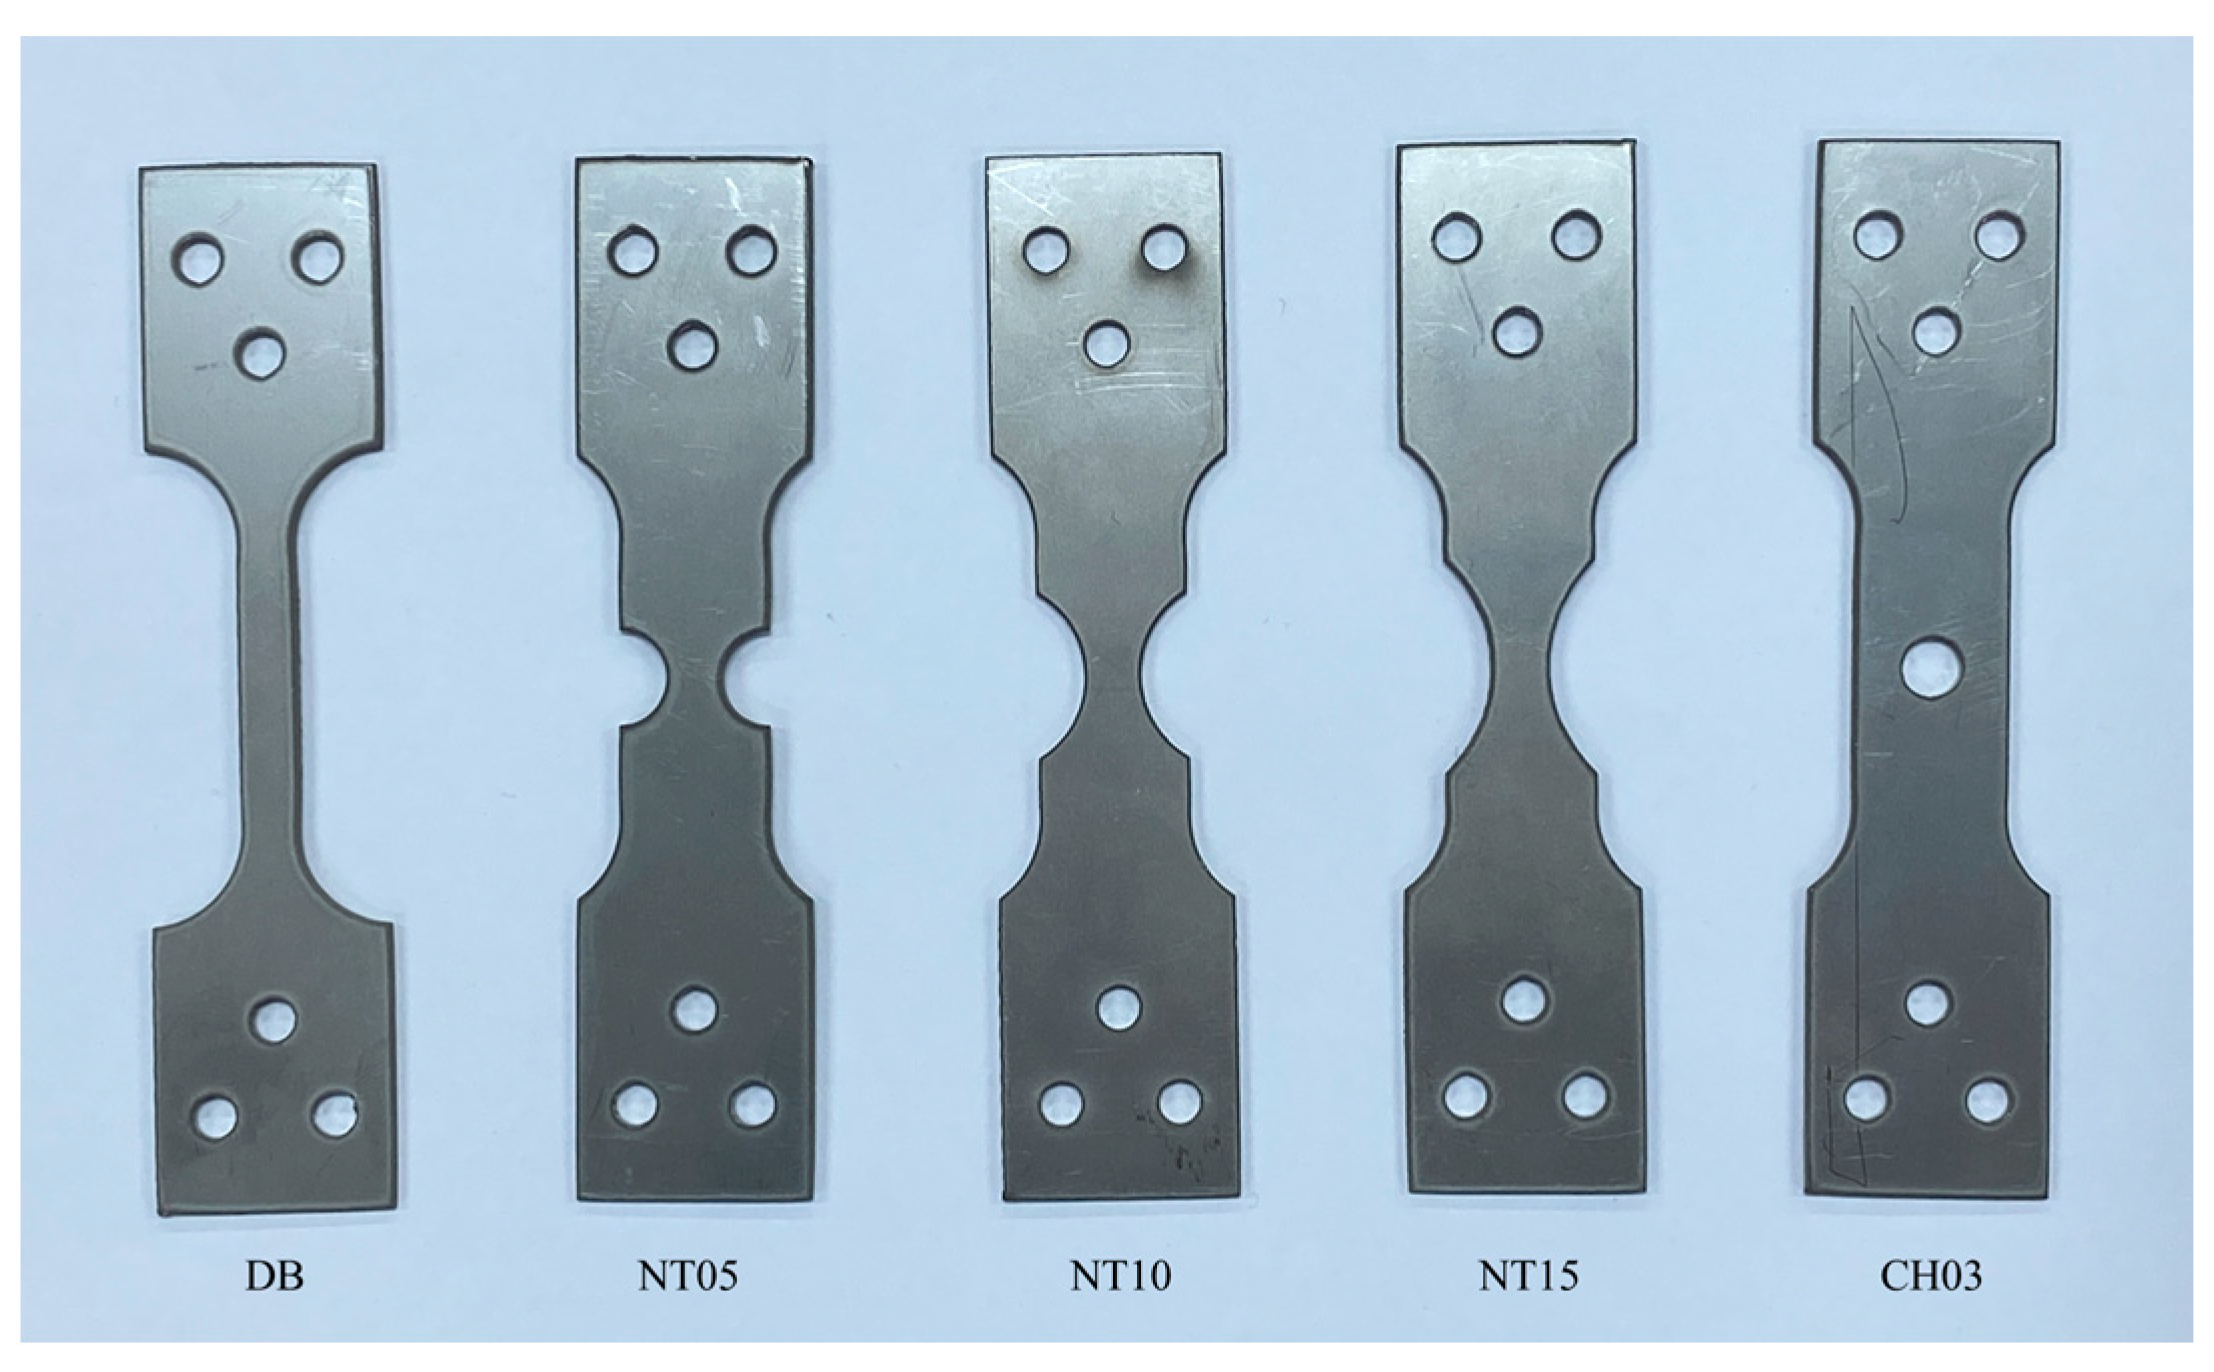
4.1. Specimen

In order to perform the failure analysis of the primary barrier of Mark-III type LNG CCS, a series of material tests were performed on the same material applied to the primary barrier. 304L stainless steel was collected from 3500 mm × 1271 mm × 1.2 t of STS304L, and the chemical composition is presented in Table 1. As shown in Figure 2, five types of tensile specimen were prepared. The DB specimen, which means dogbone type tensile specimen, was fabricated to obtain the flow stress of 304L stainless steel. The width is 6 mm and the length of the reduced area is 30 mm. For NT05, NT10, and NT15 specimens, the radius of curvature of the notch in the middle was 5 mm, 10 mm, and 15 mm to obtain high-stress triaxiality. The minimum width at the center of the NT specimen is 6 mm. The CH03 specimen has a radius of curvature of 3 mm in the center hole. The central width of the NT and CH specimens is equal to 16 mm. The total length of all specimens is 110 mm, and the length and rolling direction of the specimens are the same.

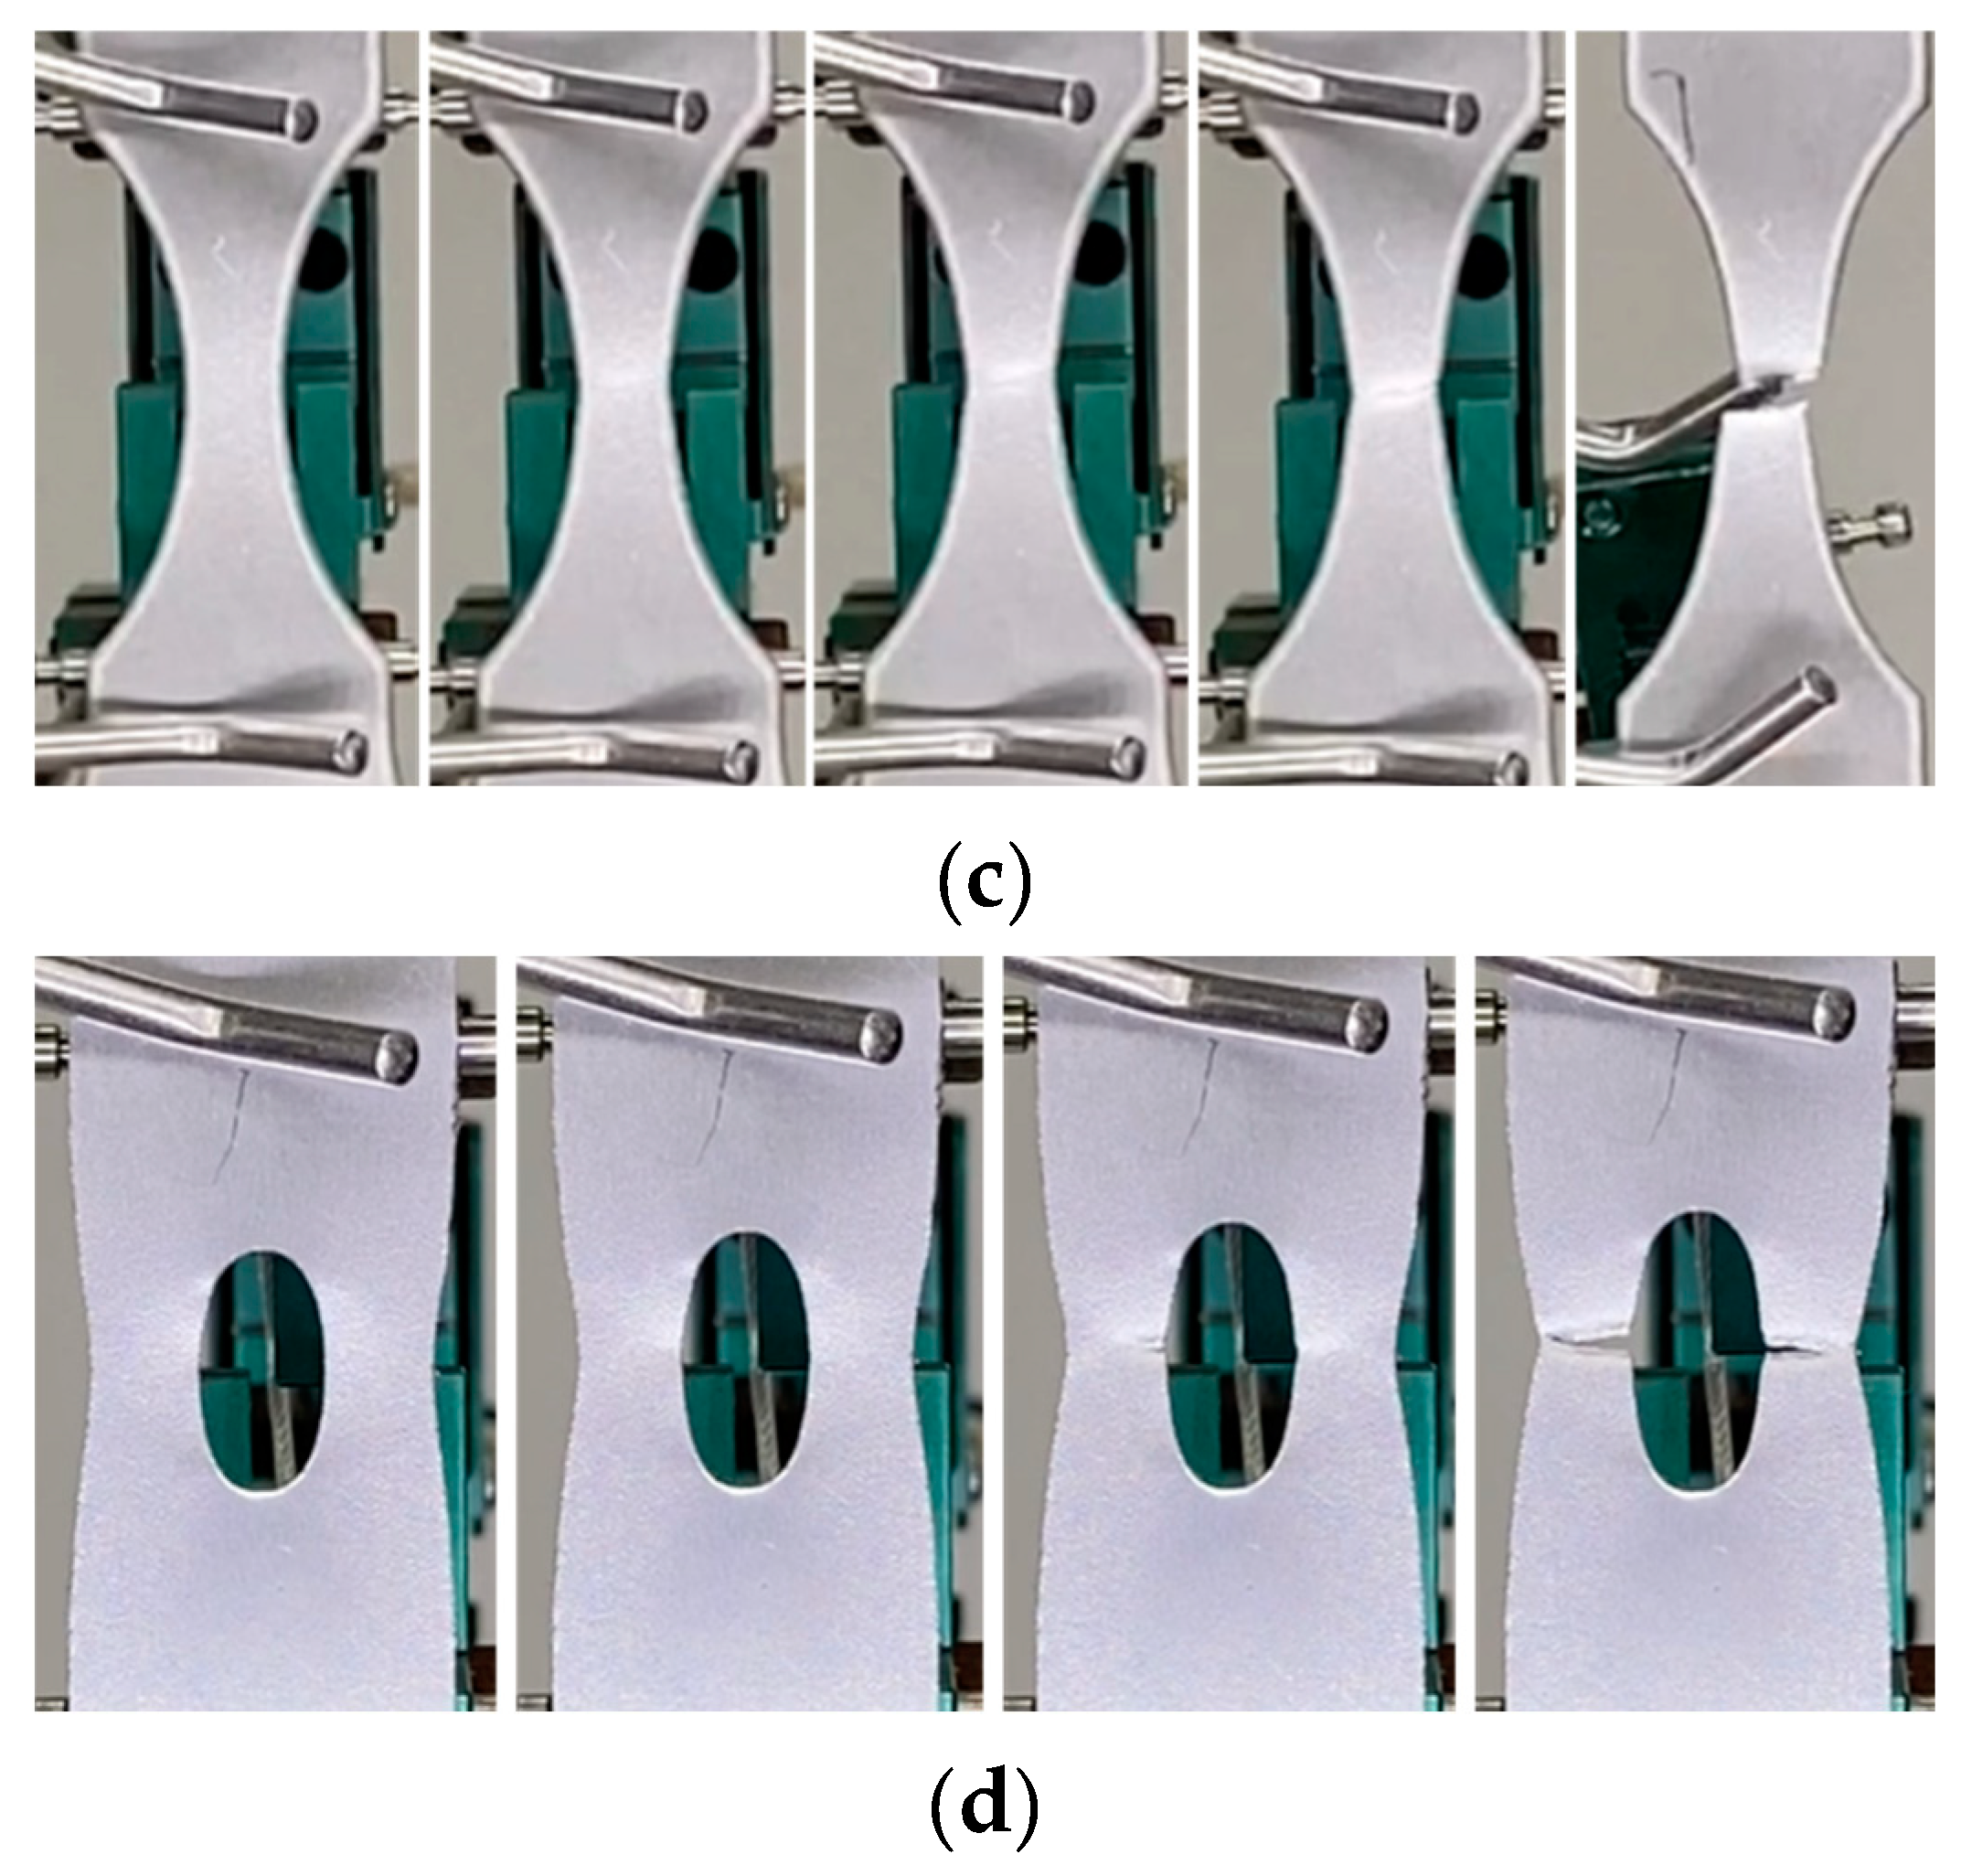
4.2. Experimental Set-Up

In this study, a universal testing machine was adopted to perform material testing. The maximum load capacity of UTM is 50 kN, and the speed of the crosshead can be controlled from 0.001 to 400.0 mm/min. In this study, the speed of the crosshead was controlled at 1.5 mm/min so that the initial strain rate for the DB specimen was 0.001/s. The displacement of all specimens was measured using an extensometer, and the gauge length was set to 25 mm. All material tests were performed at room temperature (13 °C). To verify repeatability, all tests were repeated three times and the results were shown as an average value.

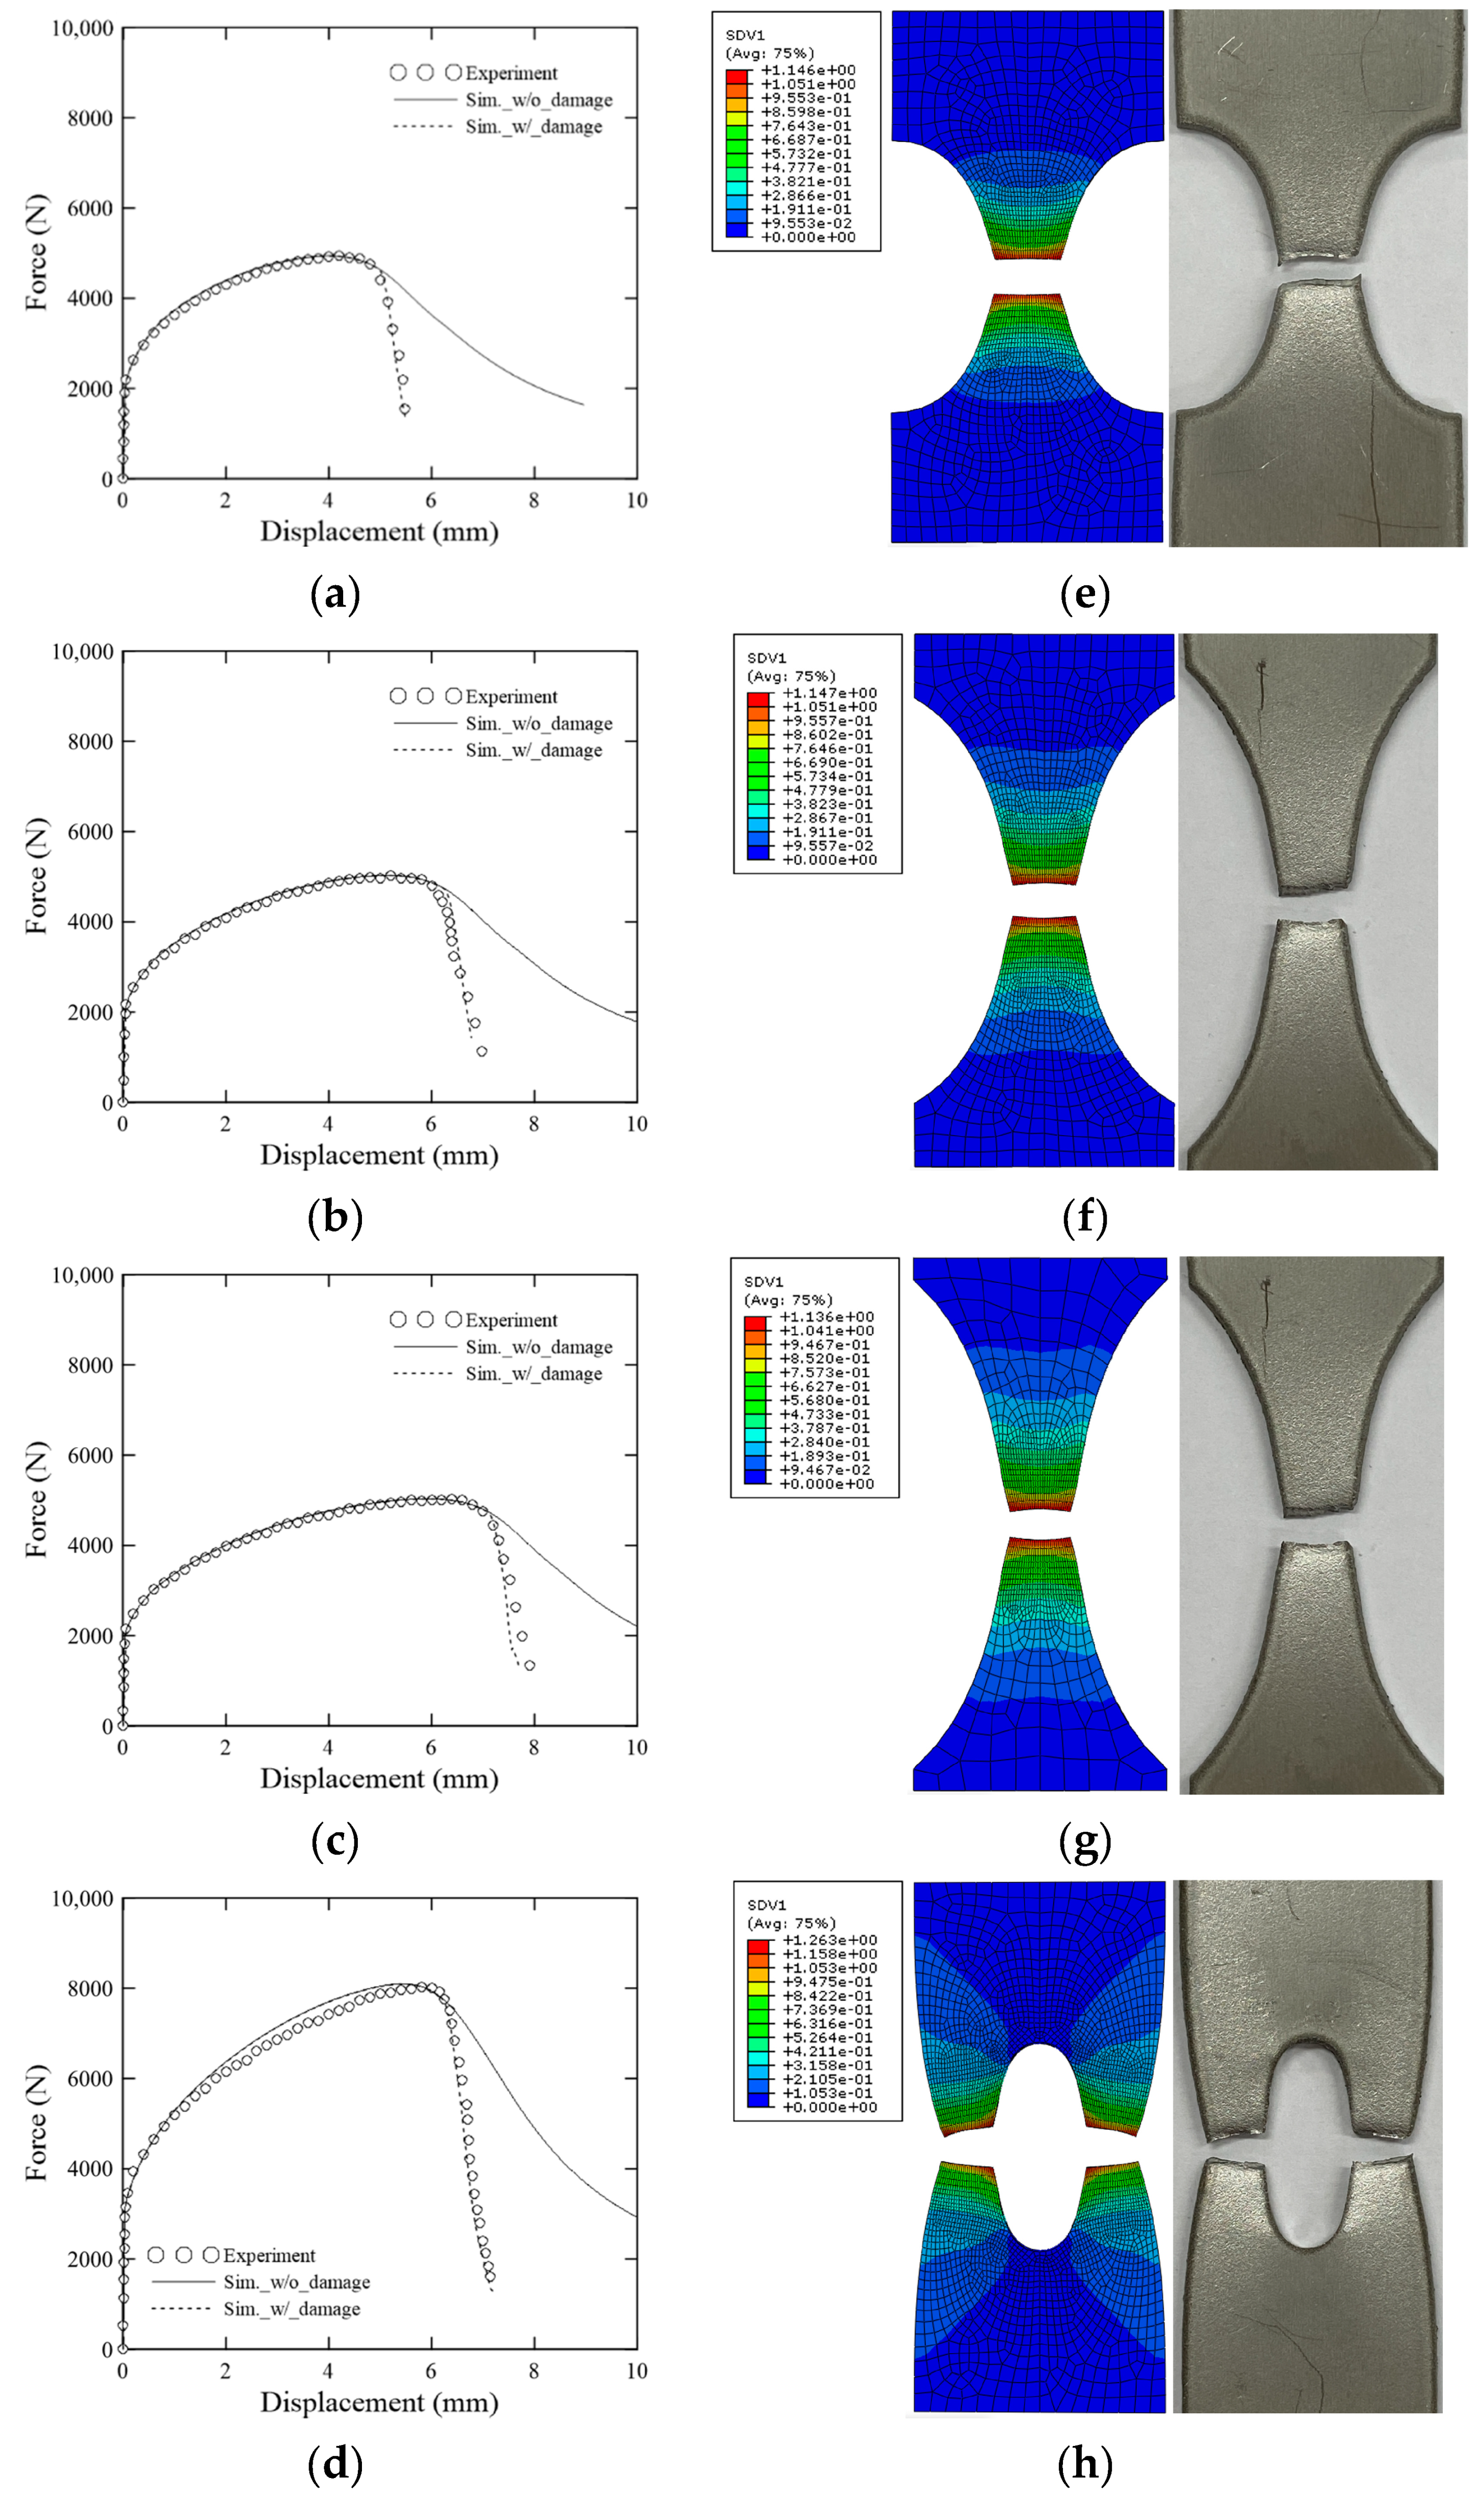
4.3. Experimental Results

Figure 3a shows the results of the tensile test of the DB specimen at room temperature in terms of engineering stress and strain relationship. The elongation of the DB specimen was 0.7464, the 0.2% offset yield strength was 282 MPa, and the tensile strength was 679 MPa. The experimental result of the DB specimen was adopted only as a flow stress calculation. Figure 3b shows the force–displacement relationships of all specimens performed at room temperature. The smaller notch radius of the NT specimen increased the stress triaxiality and resulted in rapid failure. The CH03 specimen had a higher load because of the larger cross-sectional area at the center of the specimen.
In order to observe the failure pattern of each specimen, the picture just before failure in the material test is shown in Figure 4. In the NT specimen, localized necking was observed in the center of the specimen, after which fracture progression was observed in the outer direction of the specimen. The CH03 specimen also begins to crack on both sides of the center hole and propagates outward. The fracture angle of all STS304L specimens was observed irregularly and it was judged that there was no tendency. As the purpose of the material test is to establish the ductile fracture criteria, no examination of the fracture surface of the specimen was conducted, nor was the effect of the notch radius on the material behavior analyzed through experimental results.

5. Calibration of Ductile Fracture Model

5.1. FE Model

In order to establish a ductile fracture model, the equivalent plastic strain at the fracture location is required during material testing. Bao-Wierzbicki (2004) proposed the procedure of comparing experimental results with detailed numerical simulations because it is difficult to obtain experimentally [50]. This procedure is very useful and easy to predict in evaluating the failure of a structure through a commercial finite element analysis program. With recent technological advances, many researchers are adopting a method of obtaining the strain contour of a material using a digital image correction technique without comparing numerical simulation and experimental results [31,51,52]. In this study, in order to evaluate the effectiveness of the proposed elastoplastic-damage coupled constitutive model, the DIC method is not adopted, and the equivalent plastic strain is obtained by comparing the experimental results and the numerical analysis results, and the ductile fracture model is formulated.
Parallel numerical simulations of all material tests were carried out using commercial finite element code ABAQUS/Standard. Material specimen modeling was performed as shown in Figure 5. Although all specimens had symmetry conditions in the thickness direction, width direction, and length direction, no symmetric model (1:1 modeling) was considered for the failure prediction. The modeling range was to be included from the center point of the specimen to 25 mm. Since the length of the reduced section of the DB specimen exceeded 25 mm, the entire specimen was modeled only for the DB specimen. Displacement control was performed by applying coupling constraints as reference points to the upper and lower surfaces of the finite element analysis model.
Eight-node brick element with reduced integration (C3D8R) was adopted for the finite element analysis model. When the ductile material undergoes plastic deformation and enters the necking range, the cross-sectional area decreases and the stress in the thickness direction cannot be ignored. Therefore, for precise prediction, the FE model was established using solid elements, not shell elements. The element size of the region of interest of each element was selected as 200 µm, and the number of elements in the thickness direction of the specimen was 6. To simulate the specimen’s fracture pattern, it is necessary to select a smaller element size [53,54,55]. However, this requires considerable computation cost, and it was difficult to observe a regular fracture pattern in the material test of 304L stainless steel.

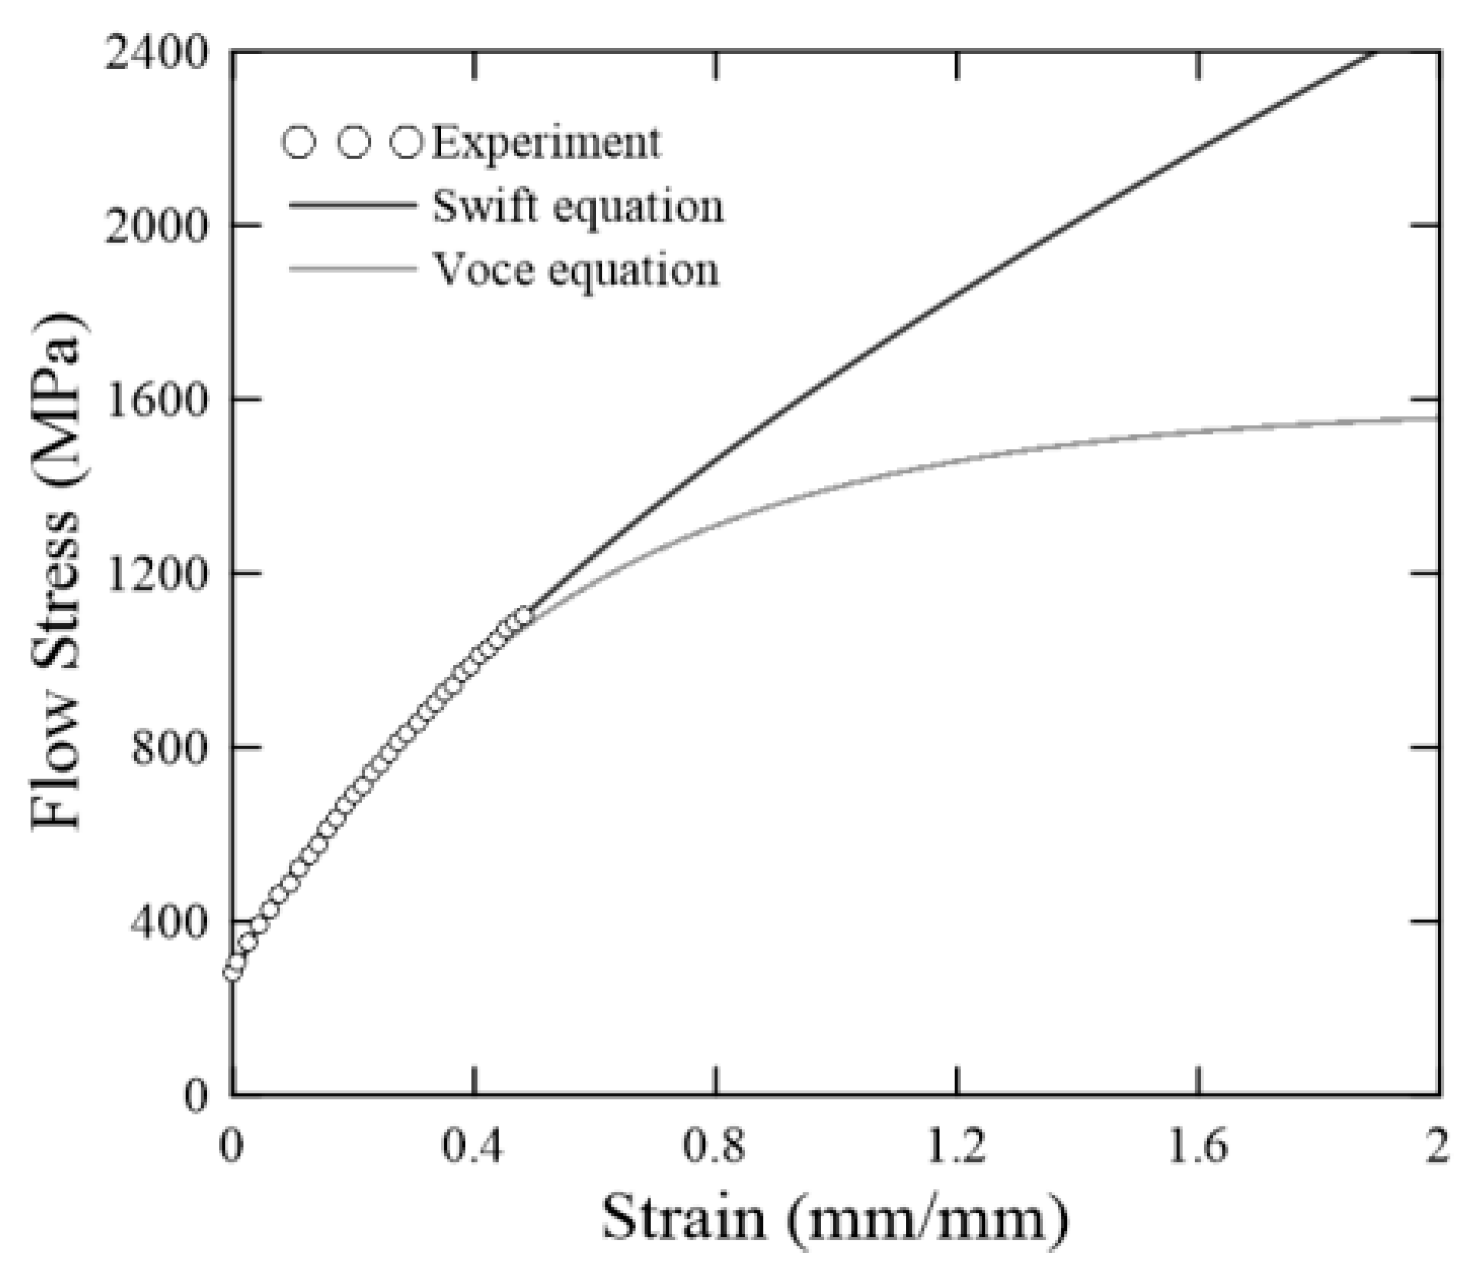
5.2. Calculation of Flow Stress

Flow stress is calculated through the experimental results of 304L stainless steel. The engineering stress-strain relation obtained through the tensile test was converted into a true stress-strain relation, which was expressed by the Swift-Voce equation, a hardening function of the constitutive model proposed in this study. The experimental results and hardening equation fitting results are shown in Figure 6. Material parameters of 304L stainless steel are listed in Table 2.
The Swift equation and Voce equation just estimate the post-necking behavior. The necessity of stress correction was reviewed by comparing the experimental results and the finite element analysis results applying flow stress. Figure 7 shows the comparison between the analysis result and the experimental result applying hardening equations. Through the flow stress calculated by the Swift equation, it was shown that the mechanical behavior of all specimens was well simulated. No yield plateau was observed in the tensile test at room temperature for 304L stainless steel, and failure occurred immediately after reaching the tensile strength.

5.3. Loading Path to Failure

To calibrate the ductile fracture model, the loading history at the predicted point of failure was investigated. In this study, when damage was initiated in the material test, the position of the largest equivalent plastic strain of the FE model was regarded as the predicted point of failure. The position of the highest equivalent plastic strain for the FE model is shown in Figure 8. This phenomenon can be observed at the same location in the experimental results shown in Figure 4.
As the equivalent plastic strain increases, the stress state is shown in Figure 9. If the growth of the equivalent plastic strain grows with a uniform stress triaxiality and Lode angle parameter, the fracture model can be easily calibrated. However, the stress triaxiality and Lode angle parameter of most ductile materials constantly fluctuate. Therefore, to consider the history of stress triaxiality and Lode angle parameter that appears as the specimen is deformed, and to reduce the sensitivity to fluctuations, the average value was introduced as follows.
η a v = 1 ε ¯ i p 0 ε ¯ i p η ( ε ¯ p ) d ε ¯ p
θ ¯ a v = 1 ε ¯ i p 0 ε ¯ i p θ ¯ ( ε ¯ p ) d ε ¯ p
where η a v , θ ¯ a v are average stress triaxiality and average normalized Lode angle, respectively. ε ¯ i p is the equivalent plastic strain at damage initiation and ε ¯ p is the equivalent plastic strain of the element. The average stress triaxiality, average normalized Lode angle, and equivalent plastic strain at damage initiation according to the specimen are listed in Table 3.

5.4. Determination of Fracture Parameters

The fracture parameters of the modified Mohr–Coulomb fracture model were determined using the average stress triaxiality, average normalized Lode angle, and equivalent plastic strain at damage initiation for each specimen shown in Table 3. Fracture parameters were selected as the value with the least error from experimental data among fracture loci. The finally determined fracture parameters are summarized in Table 4. Figure 10 shows the 3D modified Mohr–Coulomb fracture locus of 304L stainless steel projected on the η ε ¯ p plane and θ ¯ ε ¯ p plane.

6. Prediction of Ductile Fracture

A ductile fracture simulation was performed to verify that the completed fracture locus was valid. The analysis model and boundary conditions are the same as those shown in chapter 5.1 FE model. Damage accumulation control parameter ( D s ) and critical damage ( D c ), which are damage parameters related to damage evolution, were set to 2.0 and 0.9, respectively. Figure 11a–d shows the comparison of the experimental results and analysis results for each test piece. In the deformed configuration shown in Figure 11e–h, the simulation results are shown after removing the element whose critical damage reached 0.9. All of the simulations show good agreement with experimental results.

7. Conclusions

In the present study, the failure prediction methodology was numerically developed to predict the ductile fracture of 304L stainless steel sheet. First of all, an elastoplastic constitutive model for a 304L stainless steel sheet was developed. To describe the constitutive behavior after diffuse necking, the combined Swift-Voce equation was adopted as a hardening function. The modified Mohr–Coulomb criterion based on the equivalent plastic strain was also adopted to describe the sudden fracture of the 304L stainless steel sheet. Numerical formulation of the elastoplastic-damage coupled constitutive model with fracture locus was implemented into ABAQUS user-defined subroutine UMAT.
To identify elastoplastic behavior and establish ductile fracture criterion, a series of material tests considering various stress states was performed. Five types of specimens were processed with 1.2 t 304L stainless steel, the raw material of the primary barrier of Mark-III type LNG CCS. Due to the ductility of 304L stainless steel, a considerable deformation occurred, and then a fracture was reached. After localized necking, fracture propagation was observed from the center point of the specimen. Since the modified Mohr–Coulomb model defines ductile fracture based on equivalent plastic strain, the equivalent plastic strain was obtained by comparing numerical analysis and experimental results in parallel. As plastic deformation accumulates, the stress triaxiality and Lode angle parameters fluctuate. To correct this problem, the average stress triaxiality and average Lode angle parameters were introduced. The modified Mohr–Coulomb fracture locus of 304L stainless steel was determined based on the material test results. Numerical analysis with ductile fracture criterion shows good agreement with experimental results.
The stainless steel exhibits outstanding mechanical performance in terms of the yield and tensile strength under cryogenic temperatures rather than at room temperature. However, ductility at a cryogenic temperature significantly decreases compared to room temperature. A fairly optimistic fracture analysis was performed based on fracture criteria based on equivalent plastic strain to the actual conditions in a LNG cargo tank. Therefore, the fracture criterion based on the experimental results at room temperature considered in this study is a fairly optimistic failure assessment result. Further studies will include failure prediction of the primary barrier of Mark-III type LNG CCS using the proposed numerical methodology in this study.

Author Contributions

Conceptualization, M.-S.K. and J.-M.L.; Data curation, M.-S.K., H.-T.K., Y.-H.C., J.-H.K. and S.-K.K.; Formal analysis, H.-T.K. and Y.-H.C.; Investigation, M.-S.K., H.-T.K., Y.-H.C., J.-H.K. and S.-K.K.; Methodology, M.-S.K.; Project administration, J.-M.L.; Supervision, J.-M.L.; Validation, H.-T.K., Y.-H.C., J.-H.K. and S.-K.K.; Writing—original draft, M.-S.K.; Writing—review & editing, J.-H.K., S.-K.K. and J.-M.L. All authors have read and agreed to the published version of the manuscript.

Funding

This work was supported by the Materials/Parts Technology Development Program (20017575, Development of Applicability Evaluation Technology for Cryogenic Insulation Material and Storage Vessel considering Operating Condition of Hydrogen Commercial Vehicle) funded By the Ministry of Trade, Industry & Energy (MOTIE, Korea). This work was supported by the R&D Platform Establishment of Eco-Friendly Hydrogen Propulsion Ship Program (No. 20006644) funded by the Ministry of Trade, Industry & Energy (MOTIE, Korea). This research was supported by the Development and demonstration of the on-board marine debris disposal modules program of the Korea Institute of Marine Science & Technology Promotion (KIMST) funded by the Ministry of Oceans and Fisheries (KIMST-20220494).

Institutional Review Board Statement

Not applicable.

Informed Consent Statement

Not applicable.

Data Availability Statement

The data presented in this study are available on request from corresponding author.

Conflicts of Interest

The authors declare no conflict of interest.

References

  1. Jia, S.; Tan, Q.; Ye, J.; Zhu, Z.; Jiang, Z. Experiments on dynamic mechanical properties of austenitic stainless steel S30408 and S31608. J. Constr. Steel Res. 2021, 179, 106556. [Google Scholar] [CrossRef]
  2. Kim, J.-H.; Park, W.-S.; Chun, M.-S.; Kim, J.-J.; Bae, J.-H.; Kim, M.-H.; Lee, J.-M. Effect of pre-straining on low-temperature mechanical behavior of AISI 304L. Mater. Sci. Eng. A 2012, 543, 50–57. [Google Scholar] [CrossRef]
  3. Kim, S.-K.; Lee, C.-S.; Kim, J.-H.; Kim, M.-H.; Lee, J.-M. Computational evaluation of resistance of fracture capacity for SUS304L of liquefied natural gas insulation system under cryogenic temperatures using ABAQUS user-defined material subroutine. Mater. Des. 2013, 50, 522–532. [Google Scholar] [CrossRef]
  4. Zheng, C.; Liu, C.; Ren, M.; Jiang, H.; Li, L. Microstructure and mechanical behavior of an AISI 304 austenitic stainless steel prepared by cold- or cryogenic-rolling and annealing. Mater. Sci. Eng. A 2018, 724, 260–268. [Google Scholar] [CrossRef]
  5. Mallick, P.; Tewary, N.; Ghosh, S.; Chattopadhyay, P. Effect of cryogenic deformation on microstructure and mechanical properties of 304 austenitic stainless steel. Mater. Charact. 2017, 133, 77–86. [Google Scholar] [CrossRef]
  6. Singh, R.; Sachan, D.; Verma, R.; Goel, S.; Jayaganthan, R.; Kumar, A. Mechanical behavior of 304 austenitic stainless steel processed by cryogenic rolling. Mater. Today Proc. 2018, 5, 16880–16886. [Google Scholar] [CrossRef]
  7. Oh, D.-J.; Kim, N.-K.; Song, S.-W.; Kim, Y.-D.; Kim, M.-H. Investigation of fatigue performance for new membrane-type LNG CCS at cryogenic temperature. Mar. Struct. 2018, 62, 90–105. [Google Scholar] [CrossRef]
  8. Park, S.Y.; Kim, W.T.; Choi, J.H.; On, S.Y.; Kim, S.S. Effects of process-induced residual stress and geometric characteristics on pressure-resisting capability of corrugation in primary barriers of liquefied natural gas carriers. Ocean Eng. 2021, 237, 109613. [Google Scholar] [CrossRef]
  9. Kim, J.-H.; Kim, S.-K.; Kim, M.-H.; Lee, J.-M. Numerical model to predict deformation of corrugated austenitic stainless steel sheet under cryogenic temperatures for design of liquefied natural gas insulation system. Mater. Des. 2014, 57, 26–39. [Google Scholar] [CrossRef]
  10. Kim, M.-S.; Kwon, S.-B.; Kim, S.-K.; Kim, J.-H.; Lee, J.-S.M. Impact failure analysis of corrugated steel plate in LNG containment cargo system. J. Constr. Steel Res. 2019, 156, 287–301. [Google Scholar] [CrossRef]
  11. Kim, M.-S.; Kim, J.-H.; Kim, S.-K.; Lee, J.-M. Experimental Investigation of Structural Response of Corrugated Steel Sheet Subjected to Repeated Impact Loading: Performance of LNG Cargo Containment System. Appl. Sci. 2019, 9, 1558. [Google Scholar] [CrossRef] [Green Version]
  12. Kim, B.C.; Yoon, S.H.; Gil Lee, D. Pressure resistance of the corrugated stainless steel membranes of LNG carriers. Ocean Eng. 2011, 38, 592–608. [Google Scholar] [CrossRef]
  13. Lee, D.; Kim, K.H.; Choi, I.; Gil Lee, D. Pressure-resisting capability of the knot area of the primary barrier for a LNG containment system. Ocean Eng. 2015, 95, 128–133. [Google Scholar] [CrossRef]
  14. Jeong, Y.-J.; Kim, H.-T.; Kim, S.-K.; Kim, J.-H.; Kim, Y.-T.; Heo, W.-S.; Lee, J.-M. Evaluation of the pressure-resisting capability of membrane-type corrugated sheet under hydrodynamic load. Thin-Walled Struct. 2021, 162, 107388. [Google Scholar] [CrossRef]
  15. Deng, X.; Wang, B. Peridynamic modeling of dynamic damage of polymer bonded explosive. Comput. Mater. Sci. 2020, 173, 109405. [Google Scholar] [CrossRef]
  16. Depraetere, R.; De Waele, W.; Hertelé, S. Fully-coupled continuum damage model for simulation of plasticity dominated hydrogen embrittlement mechanisms. Comput. Mater. Sci. 2021, 200, 110857. [Google Scholar] [CrossRef]
  17. Varandas, L.F.; Catalanotti, G.; Melro, A.R.; Falzon, B.G. On the importance of nesting considerations for accurate computational damage modelling in 2D woven composite materials. Comput. Mater. Sci. 2020, 172, 109323. [Google Scholar] [CrossRef]
  18. Paredes, M.; Wierzbicki, T.; Zelenak, P. Prediction of crack initiation and propagation in X70 pipeline steels. Eng. Fract. Mech. 2016, 168, 92–111. [Google Scholar] [CrossRef]
  19. Björklund, O.; Larsson, R.; Nilsson, L. Failure of high strength steel sheets: Experiments and modelling. J. Mater. Process. Technol. 2013, 213, 1103–1117. [Google Scholar] [CrossRef] [Green Version]
  20. Kim, S.-K.; Kim, J.-H.; Kim, J.-H.; Lee, J.-M. Numerical Model for Mechanical Nonlinearities of High Manganese Steel Based on the Elastoplastic Damage Model. Metals 2018, 8, 680. [Google Scholar] [CrossRef] [Green Version]
  21. Baltic, S.; Magnien, J.; Gänser, H.-P.; Antretter, T.; Hammer, R. Coupled damage variable based on fracture locus: Modelling and calibration. Int. J. Plast. 2019, 126, 102623. [Google Scholar] [CrossRef]
  22. Charoensuk, K.; Panich, S.; Uthaisangsuk, V. Damage initiation and fracture loci for advanced high strength steel sheets taking into account anisotropic behaviour. J. Mater. Process. Technol. 2017, 248, 218–235. [Google Scholar] [CrossRef]
  23. Hancock, J.W.; Mackenzie, A.C. On the mechanisms of ductile failure in high-strength steels subjected to multi-axial stress-states. J. Mech. Phys. Solids 1976, 24, 147–160. [Google Scholar] [CrossRef]
  24. Theocaris, P.S. Failure criteria for isotropic bodies revisited. Eng. Fract. Mech. 1995, 51, 239–255, 257–264. [Google Scholar] [CrossRef]
  25. Schiffmann, R.; Bleck, W.; Dahl, W. The influence of strain history on ductile failure of steel. Comput. Mater. Sci. 1998, 13, 142–147. [Google Scholar] [CrossRef]
  26. Schliiter, N.; Grimpe, F.; Bleck, W.; Dahl, W. Modelling of the damage in ductile steels. Comput. Mater. Sci. 1996, 7, 27–33. [Google Scholar] [CrossRef]
  27. Bai, Y.; Wierzbicki, T. A new model of metal plasticity and fracture with pressure and Lode dependence. Int. J. Plast. 2008, 24, 1071–1096. [Google Scholar] [CrossRef]
  28. Bai, Y.; Wierzbicki, T. Application of extended Mohr–Coulomb criterion to ductile fracture. Int. J. Fract. 2010, 161, 1–20. [Google Scholar] [CrossRef]
  29. Kim, S.-K.; Lee, C.-S.; Kim, J.-H.; Kim, M.-H.; Noh, B.-J.; Matsumoto, T.; Lee, J.-M. Estimation of Fatigue Crack Growth Rate for 7% Nickel Steel under Room and Cryogenic Temperatures Using Damage-Coupled Finite Element Analysis. Metals 2015, 5, 603–627. [Google Scholar] [CrossRef] [Green Version]
  30. Kim, S.-K.; Kang, K.-Y.; Kim, M.-S.; Lee, J.-M. Low-Temperature Mechanical Behavior of Super Duplex Stainless Steel with Sigma Precipitation. Metals 2015, 5, 1732–1745. [Google Scholar] [CrossRef] [Green Version]
  31. Paredes, M.; Grolleau, V.; Wierzbicki, T. On ductile fracture of 316L stainless steels at room and cryogenic temperature level: An engineering approach to determine material parameters. Materialia 2020, 10, 100624. [Google Scholar] [CrossRef]
  32. Dunand, M.; Mohr, D. On the predictive capabilities of the shear modified Gurson and the modified Mohr–Coulomb fracture models over a wide range of stress triaxialities and Lode angles. J. Mech. Phys. Solids 2011, 59, 1374–1394. [Google Scholar] [CrossRef]
  33. Luo, M.; Dunand, M.; Mohr, D. Experiments and modeling of anisotropic aluminum extrusions under multi-axial loading—Part II: Ductile fracture. Int. J. Plast. 2012, 32–33, 36–58. [Google Scholar] [CrossRef]
  34. Chen, X.; Shi, M.F.; Shih, H.-C.; Luo, M.; Wierzbicki, T. AHSS Shear Fracture Predictions Based on a Recently Developed Fracture Criterion. SAE Int. J. Mater. Manuf. 2010, 3, 723–731. [Google Scholar] [CrossRef]
  35. Granum, H.; Morin, D.; Børvik, T.; Hopperstad, O.S. Calibration of the modified Mohr-Coulomb fracture model by use of localization analyses for three tempers of an AA6016 aluminium alloy. Int. J. Mech. Sci. 2021, 192, 106122. [Google Scholar] [CrossRef]
  36. Quach, H.; Kim, J.-J.; Nguyen, D.-T.; Kim, Y.-S. Uncoupled ductile fracture criterion considering secondary void band behaviors for failure prediction in sheet metal forming. Int. J. Mech. Sci. 2020, 169, 105297. [Google Scholar] [CrossRef]
  37. Qian, L.-Y.; Fang, G.; Zeng, P. Modeling of the ductile fracture during the sheet forming of aluminum alloy considering non-associated constitutive characteristic. Int. J. Mech. Sci. 2017, 126, 55–66. [Google Scholar] [CrossRef]
  38. Ben Othmen, K.; Haddar, N.; Jegat, A.; Manach, P.-Y.; Elleuch, K. Ductile fracture of AISI 304L stainless steel sheet in stretching. Int. J. Mech. Sci. 2020, 172, 105404. [Google Scholar] [CrossRef]
  39. Pham, H.; Iwamoto, T. An evaluation of fracture properties of type-304 austenitic stainless steel at high deformation rate using the small punch test. Int. J. Mech. Sci. 2018, 144, 249–261. [Google Scholar] [CrossRef]
  40. Kim, J.-H.; Lee, C.-S.; Kim, M.-H.; Lee, J.-M. Prestrain-dependent viscoplastic damage model for austenitic stainless steel and implementation to ABAQUS user-defined material subroutine. Comput. Mater. Sci. 2013, 67, 273–281. [Google Scholar] [CrossRef]
  41. Mohr, D.; Marcadet, S.J. Micromechanically-motivated phenomenological Hosford–Coulomb model for predicting ductile fracture initiation at low stress triaxialities. Int. J. Solids Struct. 2015, 67–68, 40–55. [Google Scholar] [CrossRef]
  42. Palchik, V. Application of Mohr–Coulomb failure theory to very porous sandy shales. Int. J. Rock Mech. Min. Sci. 2006, 43, 1153–1162. [Google Scholar] [CrossRef]
  43. Zhao, J. Applicability of Mohr–Coulomb and Hoek–Brown strength criteria to the dynamic strength of brittle rock. Int. J. Rock Mech. Min. Sci. 2000, 37, 1115–1121. [Google Scholar] [CrossRef]
  44. Kofiani, K.; Nonn, A.; Wierzbicki, T. New calibration method for high and low triaxiality and validation on SENT specimens of API X70. Int. J. Press. Vessel. Pip. 2013, 111–112, 187–201. [Google Scholar] [CrossRef]
  45. Swift, H.W. Plastic Instability under Plane Stress. J. Mech. Phys. Solids 1952, 1, 1–18. [Google Scholar] [CrossRef]
  46. Voce, E. The relationship between stress and strain for homogeneous deformation. J. Inst. Met. 1948, 74, 537–562. [Google Scholar]
  47. Lemaitre, J. A continuous damage mechanics model for ductile fracture. J. Eng. Mater. Technol. 1985, 107, 83–89. [Google Scholar] [CrossRef]
  48. Neto, E.A.; de Eduardo, S.; Perić, D.; Owen, D.R.J. Computational Methods for Plasticity: Theory and Applications; Wiley: Chichester, UK, 2008; ISBN 9780470694527. [Google Scholar]
  49. Lian, J.; Wu, J.; Münstermann, S. Evaluation of the cold formability of high-strength low-alloy steel plates with the modified Bai–Wierzbicki damage model. Int. J. Damage Mech. 2015, 24, 383–417. [Google Scholar] [CrossRef]
  50. Bao, Y.; Wierzbicki, T. On fracture locus in the equivalent strain and stress triaxiality space. Int. J. Mech. Sci. 2004, 46, 81–98. [Google Scholar] [CrossRef]
  51. Sancho, A.; Cox, M.; Cartwright, T.; Davies, C.; Hooper, P.; Dear, J. An experimental methodology to characterise post-necking behaviour and quantify ductile damage accumulation in isotropic materials. Int. J. Solids Struct. 2019, 176–177, 191–206. [Google Scholar] [CrossRef]
  52. Lou, Y.; Huh, H. Extension of a shear-controlled ductile fracture model considering the stress triaxiality and the Lode parameter. Int. J. Solids Struct. 2013, 50, 447–455. [Google Scholar] [CrossRef] [Green Version]
  53. Xue, Z.; Pontin, M.; Zok, F.; Hutchinson, J. Calibration procedures for a computational model of ductile fracture. Eng. Fract. Mech. 2010, 77, 492–509. [Google Scholar] [CrossRef] [Green Version]
  54. Erice, B.; Gálvez, F. A coupled elastoplastic-damage constitutive model with Lode angle dependent failure criterion. Int. J. Solids Struct. 2014, 51, 93–110. [Google Scholar] [CrossRef] [Green Version]
  55. Kubík, P.; Šebek, F.; Hůlka, J.; Petruška, J. Calibration of ductile fracture criteria at negative stress triaxiality. Int. J. Mech. Sci. 2016, 108–109, 90–103. [Google Scholar] [CrossRef]
Figure 1. Stress-strain relationship with damage accumulation. With damage accumulation, critical equivalent plastic strain provokes damage initiation. After the onset of damage initiation, elastic modulus and strength are dramatically decreased.
Metals 12 01309 g001
Figure 2. Material test specimens of 304L stainless steel sheet. DB specimen is used to acquire flow stress of 304L stainless steel, which has 6 mm width and 30 mm the length of reduced area. Other specimens are to identify the fracture strain. NT specimens have the radius of curvature of the notch to obtain high-stress triaxiality. The CH specimen has a radius of curvature of 3 mm in the center hole.
Metals 12 01309 g002
Figure 3. (a) Engineering stress–strain relationship at room temperature for DB specimen and (b) force–displacement relation. Given that the DB and NT specimens have the same minimum width, the maximum strength is almost the same. The smaller notch radius of the NT specimen caused increased stress triaxiality and rapid failure.
Metals 12 01309 g003
Figure 4. Ductile fracture configuration of 304L stainless steel: (a) NT05 specimen, (b) NT10 specimen, (c) NT15 specimen, and (d) CH03 specimen. Localized necking was clearly observed. The CH specimen showed a localized neck followed by crack propagation.
Metals 12 01309 g004aMetals 12 01309 g004b
Figure 5. Finite element model for material test of 304L stainless steel. In order to accurately predict the ductile fracture at the failure location of all specimens, the element size was differentiated. In the region of interest, the element size was selected as 200 µm, and the number of elements in the thickness direction of the specimen was 6. To reduce computational cost, a coarse mesh was made outside the region of interest.
Metals 12 01309 g005
Figure 6. Flow stress of 304L stainless steel. Experimental results with engineering stress-strain relation are valid until the onset of the diffuse neck. In the domain of diffuse neck, the true stress is estimated through Swift equation and Voce equation.
Metals 12 01309 g006
Figure 7. Comparison between experimental and simulation results of 304L stainless steel: (a) NT05 specimen, (b) NT10 specimen, (c) NT15 specimen, and (d) CH03 specimen. The flow stress using the Voce equation showed a strength drop before reaching the maximum strength. The flow stress calculation using the Swift equation is most appropriate.
Metals 12 01309 g007aMetals 12 01309 g007b
Figure 8. Equivalent plastic strain contour at damage initiation; (a) NT05 specimen, (b) NT10 specimen, (c) NT 15 specimen, and (d) CH03 specimen. In the NT specimen, when the stiffness drop occurred rapidly, the maximum equivalent plastic strain appeared at the center of the specimen. In the CH specimen, the maximum equivalent plastic strain was observed in the direction of the hole diameter due to symmetric structure of specimen. A decrease in thickness was observed in the numerical analysis model of all specimens.
Metals 12 01309 g008
Figure 9. Equivalent plastic strain in accordance with (a) stress triaxiality and (b) Lode angle parameter. Black line white dot indicates equivalent plastic strain at damage initiation. As plastic strain accumulates, the stress triaxiality and Lode angle parameters were continuously changed.
Metals 12 01309 g009
Figure 10. Fracture loci of the modified Mohr–Coulomb fracture model in accordance with (a) stress triaxiality and (b) Lode angle parameter of 304L stainless steel.
Metals 12 01309 g010
Figure 11. Comparison of force–displacement curve of (a) NT05, (b) NT10, (c) NT15, and (d) CH03 specimens and deformed configuration of (e) NT05, (f) NT10, (g) NT15, and (h) CH03 between experimental and simulation results (SDV1: equivalent plastic strain). With the Modified Mohr–Coulomb fracture criterion satisfied, crack propagation of the specimen occurs and complete failure follows. The fractured configurations between the numerical analysis and experiments are almost consistent.
Metals 12 01309 g011
Table 1. Chemical composition of 304L stainless steel.
CSiMnPSCrNi
0.01520.3791.1300.02270.001718.65310.178
Table 2. Material parameters of 304L stainless steel. In this study, 304L stainless steel did not show a yield plateau, so the yield plateau was set to zero.
Swift equation
part
A ε 0 n ε p l a t
1610.00.04960.60.0
Voce equation
part
α σ y 0 Q β
1.0282.01300.01.95
Table 3. Average stress triaxiality, average normalized Lode angle, and equivalent plastic strain at damage initiation of 304L stainless steel. The average values were derived considering the loading history.
SpecimenAverage Stress
Triaxiality, η a v
Average Normalized Lode Angle, θ ¯ a v Equivalent Plastic Strain at
Damage Initiation, ε ¯ i p
NT050.4420.6650.987
NT100.3990.7990.900
NT150.3950.8171.053
CH030.3430.9361.262
Table 4. Fracture parameters of the modified Mohr–Coulomb fracture model for 304L stainless steel sheet.
Fracture
parameter
c 1 c 2 c 3
0.0169611.05
Publisher’s Note: MDPI stays neutral with regard to jurisdictional claims in published maps and institutional affiliations.

