Article

Dynamic Ferrite Formation and Evolution above the Ae3 Temperature during Plate Rolling Simulation of an API X80 Steel

by
Francisco Romário de S. Machado
1,
João C. Ferreira
1,
Maria Veronica G. Rodrigues
1,
Marcos Natan da S. Lima
2,
Rodrigo de C. Paes Loureiro
2,
Fulvio Siciliano
3,
Eden S. Silva
1,
Gedeon S. Reis
1,
Regina C. de Sousa
4,
Clodualdo Aranas, Jr.
5,
Hamilton F. Gomes de Abreu
2 and
Samuel Filgueiras Rodrigues
1,*
1
Graduate Program in Materials Engineering, Federal Institute of Maranhão, São Luís 65075-441, Brazil
2
Materials Characterization Laboratory (LACAM), Department of Metallurgical and Materials Engineering, Federal University of Ceará, Campus Do Pici, Bloco 729, Fortaleza 60020-181, Brazil
3
Market Development, Dynamic Systems Inc., 323 NY 355, Poestenkill, NY 12140, USA
4
Department of Physics, Federal University of Maranhão–UFMA, Av. dos Portugueses, University City, 1966, Bacanga, São Luís 65080-805, Brazil
5
Mechanical Engineering Department, University of New Brunswick, Fredericton, NB E3B 5A3, Canada
*
Author to whom correspondence should be addressed.
Metals 2022, 12(8), 1239; https://doi.org/10.3390/met12081239
Submission received: 26 June 2022 / Revised: 11 July 2022 / Accepted: 18 July 2022 / Published: 22 July 2022

Abstract

:
Thermo-mechanically controlled rolling is a technique used to produce steel strips and plates. One of the steels widely used in the production of heavy plates for application in oil and gas pipelines is API X80. The hot rolling process of this family of steels consists of applying deformation passes at high temperatures, mainly above Ae3, inside the austenite phase field. It has been shown that during deformation, the phenomenon of dynamic transformation (DT) of austenite into ferrite leads to lower hot deformation resistance within the stable austenite region. In this investigation, hot torsion simulations of an industrial rolling process under continuous cooling conditions were used to monitor the formation of ferrite by DT. Stress–strain flow curves and equivalent mean flow stresses followed by sample characterization via optical and electron microscopy showed the inevitable formation of ferrite above the Ae3. The employed 10-pass deformation schedule was divided into 5 roughing and 5 finishing passes, thereby promoting an increased volume fraction of ferrite and decreased critical strain for the onset of DT and dynamic recrystallization (DRX). A microstructural analysis confirmed the formation of ferrite from the first roughing strain until the last finishing pass. The volume fraction of DT ferrite increased due to strain accumulation, an increased number of deformation passes and as the temperature approached the Ae3, leading to a characteristic torsion texture at the end of the simulation.

1. Introduction

Dynamic transformation (DT) is defined as a phase transformation that occurs during deformation. In steels, austenite can dynamically transform into ferrite at temperatures above the Ae3 transformation temperature and throughout the austenitic phase field [1,2,3,4,5,6]. The first investigation of this phenomenon was done by Matsumura, Yada and co-authors in the 1980s [7,8]. In their study, the authors detected the formation of ferritic grains in a carbon steel above the Ae3 when strain was applied. In 2000, these results were confirmed in an in situ X-ray diffraction study [9].
Basabe et al. [10,11] conducted torsion tests on Nb-microalloyed steels and demonstrated that the dynamically formed ferrite was primarily nucleated in the form of Widmanstätten plates with similar crystallographic orientations. The plates later coalesced into polygonal ferrite upon continued application of strain. The temperature was found to have an inverse effect until the midway (highest Gibbs energy value difference between austenite and ferrite) between the Ae3 and delta-ferrite first formation, favoring the transformation of ferrite after this point due to the decrease of the Gibbs energy barrier [12,13]. In contrast, at high temperatures, static and dynamic softening phenomena acted to reduce the dislocation density of the material which prevented DT. When the temperature decreased and approached the Ae3 line, the dislocation density increased in the deformed austenite, promoting the driving force for DT which increased the volume fraction of ferrite [14,15,16,17,18].
After applying the deformation pass, ferrite plates formed and coalesced into polygonal grains. However, if the material was kept for a time at the test temperature above Ae3, the dynamically transformed metastable ferrite retransformed into austenite, which is the most stable constituent at this temperature range [19,20]. This retransformation process was thermally activated and occurred by diffusional mechanisms [21,22]. A deeper investigation of this phenomenon is relevant to broaden our understanding of deformation-induced ferrite formation and to determine the amount of DT ferrite required to influence mechanical properties during the industrial rolling process of high-strength-low-alloy (HSLA) steels like the ones applied in oil and gas transport pipelines.
In order to monitor the formation of ferrite by DT, hot torsion tests were performed under continuous cooling conditions, simulating controlled thermomechanical processing of industrial rolling of an API X80 steel. The results of this work represent an advance in the study of DT under the rolling process of an API X80 steel in which the final microstructure and texture are influenced by thermomechanical processing parameters such as the number of deformation passes and temperatures.

2. Materials and Methods

In this work, steel plates of linepipe grade API X80 were used. The chemical composition of the material was obtained by optical emission spectrometry, PDA 7000 (Shimadzu, Kyoto, Japan). The Ae3 transformation temperature was determined using JMatPro® software. Table 1 displays these results.
The plate rolling simulation was performed using a hot torsion testing machine. The tests took place as follows. The material was heated to 1200 °C with a heating rate of 2 °C/s. It was then kept at this temperature for 5 min for material solubilization. The specimens were heated by means of infrared radiation in a furnace mounted directly on the testing machine. The temperature was controlled using a Alumel-Chromel thermocouple K-type fixed in holes drilled near the twisted surface. When the solubilization period was completed, the material was cooled to a temperature of 1100 °C at rate of 2 °C/s. The steel was maintained for 60 s at this temperature before the application of the first roughing (R1) pass with a strain of 0.3 and a strain rate of 1 s−1. The instantaneous torque and rotation angle were read and recorded while the specimen was under strain by a software interfacing the hot torsion machine which undertakes parametric tests such as temperature, holding time, limit of strain and strain-rate.
The interval between passes was 10 s. Another four roughing passes (R2, R3, R4 and R5) were applied at temperatures of 1080, 1060, 1040 and 1020 °C, respectively, and strain 0.2 and a strain rate of 1 s−1. The finishing passes (F1, F2, F3, F4 and F5) were applied at temperatures of 960, 945, 930, 915 and 900 °C with time between passes of 10 s and the same strain and strain rate as in the four last roughing deformations. Note that all simulations were carried out inside the austenite phase field, and the last strain of the finishing stage was 70 °C above the Ae3 temperature. After passes 1, 3 and 5 of both the roughing (R) and finishing (F) stages, the material underwent ultra-rapid cooling by a continuous flow of water on the specimens in order to preserve the microstructure for further analysis. Figure 1 illustrates the thermomechanical processing simulation process.
For the microstructural analyses, quenched samples were longitudinally sectioned and mounted in a conductive resin to provide cross-sections and allow observations of the changes in grain shape that accompanied the strain. To avoid the maximum variation of the cooling rate from the outer surface to the centerline of the torsion samples, as well as the influence of oxidation on the surface, the microstructural analyses were made 100 μm below the outer surface of the specimen. The samples were prepared using standard metallographic procedures, including grinding (#120 to #1200 SiC papers) followed by mechanical polishing using 6-, 3-, and 1-μm diamond paste and, finally, a 0.02-μm colloidal silica suspension. The polished specimens were then etched with a 3% nital solution for approximately 15–20 s and treated with a 10% aqueous sodium metabisulfite (Na2S2O5) solution to improve the contrast between ferrite and martensite.
The initial microstructural analysis was carried out using optical microscopy (OM). Scanning electron microscopy (SEM) and electron-backscatter diffraction (EBSD) techniques were used to obtain more detailed information about the microstructure. SEM images were obtained using a field emission gun scanning electron microscope (FEGSEM), the FEI Quanta FEG 450 (ThermoFisher, Hillsboro, OR, USA). Microtexture analyses were performed using the Channel 5 (Oxford Instruments HKL, Hobro, Denmark) and ATEX data processing software package (ATEX, Metz, France) [23]. ODFs were determined from EBSD maps through the statistical Kernel density estimation method and plotted at constant Euler angles of φ2 = 45°. As a reference in the latter analysis, the crystal and sample reference system were set as X//anti-shear direction (SD), Y//shear normal direction (SN), and Z//transverse direction (TD).

3. Results and Discussion

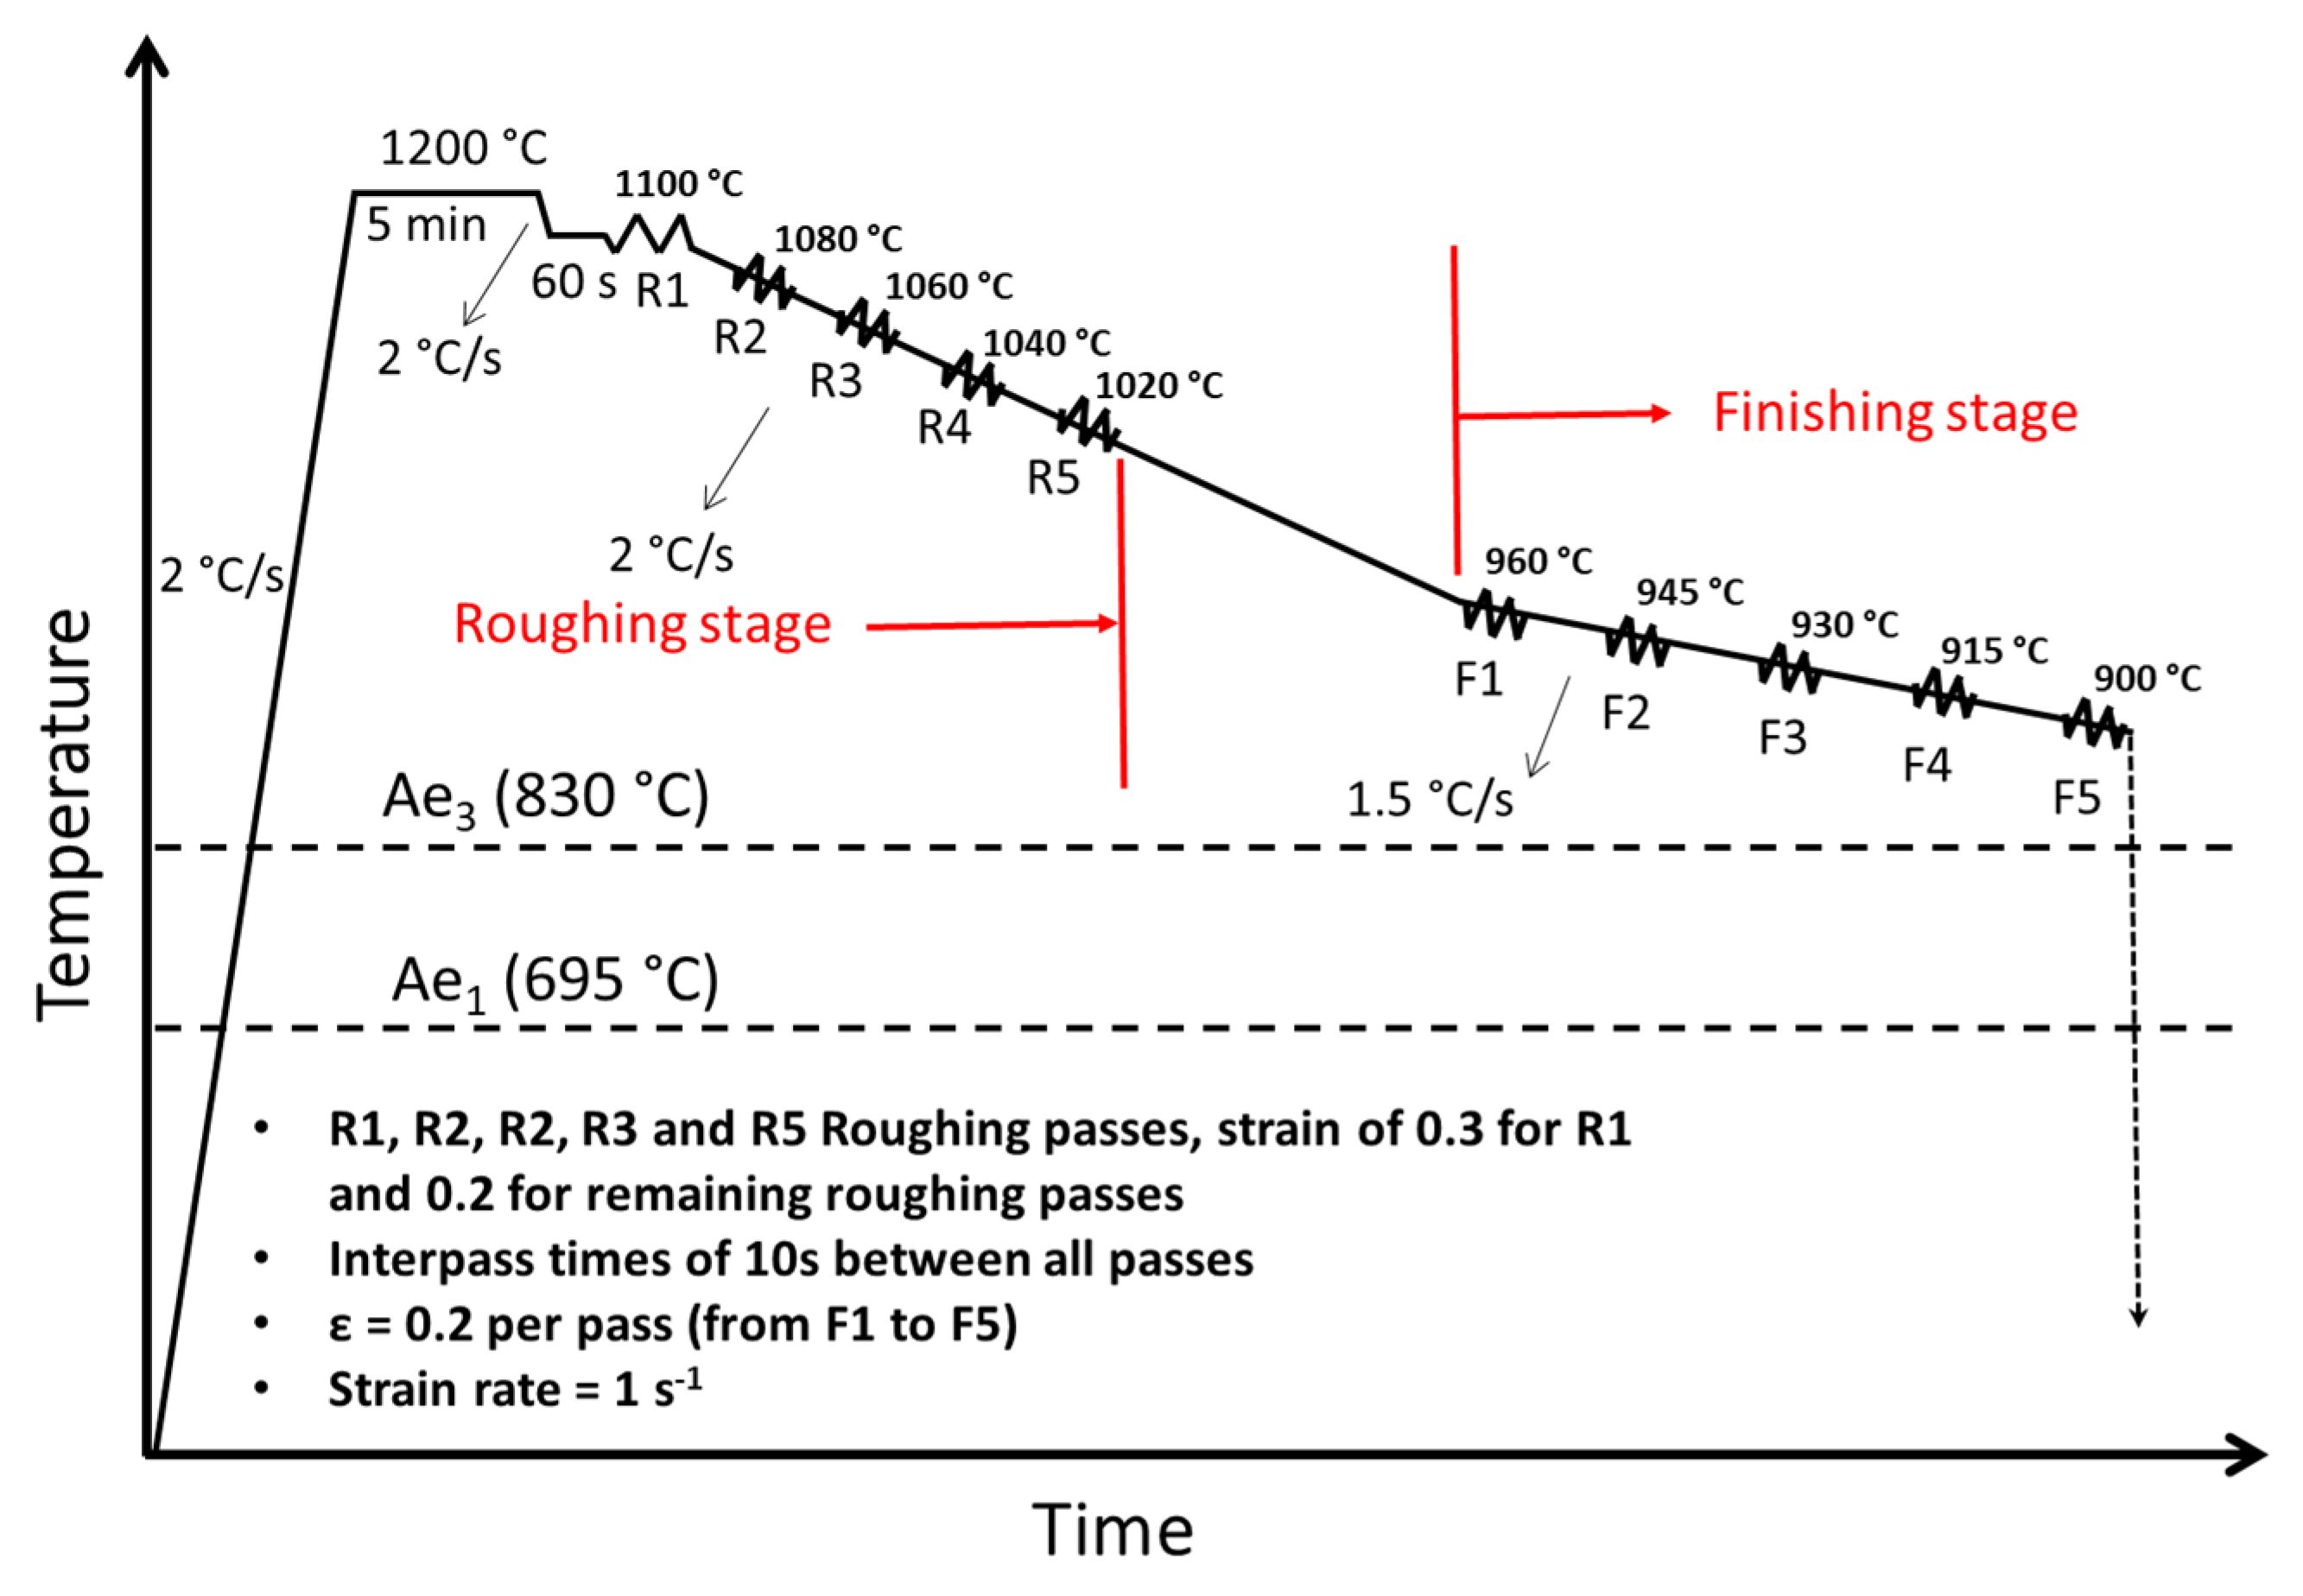
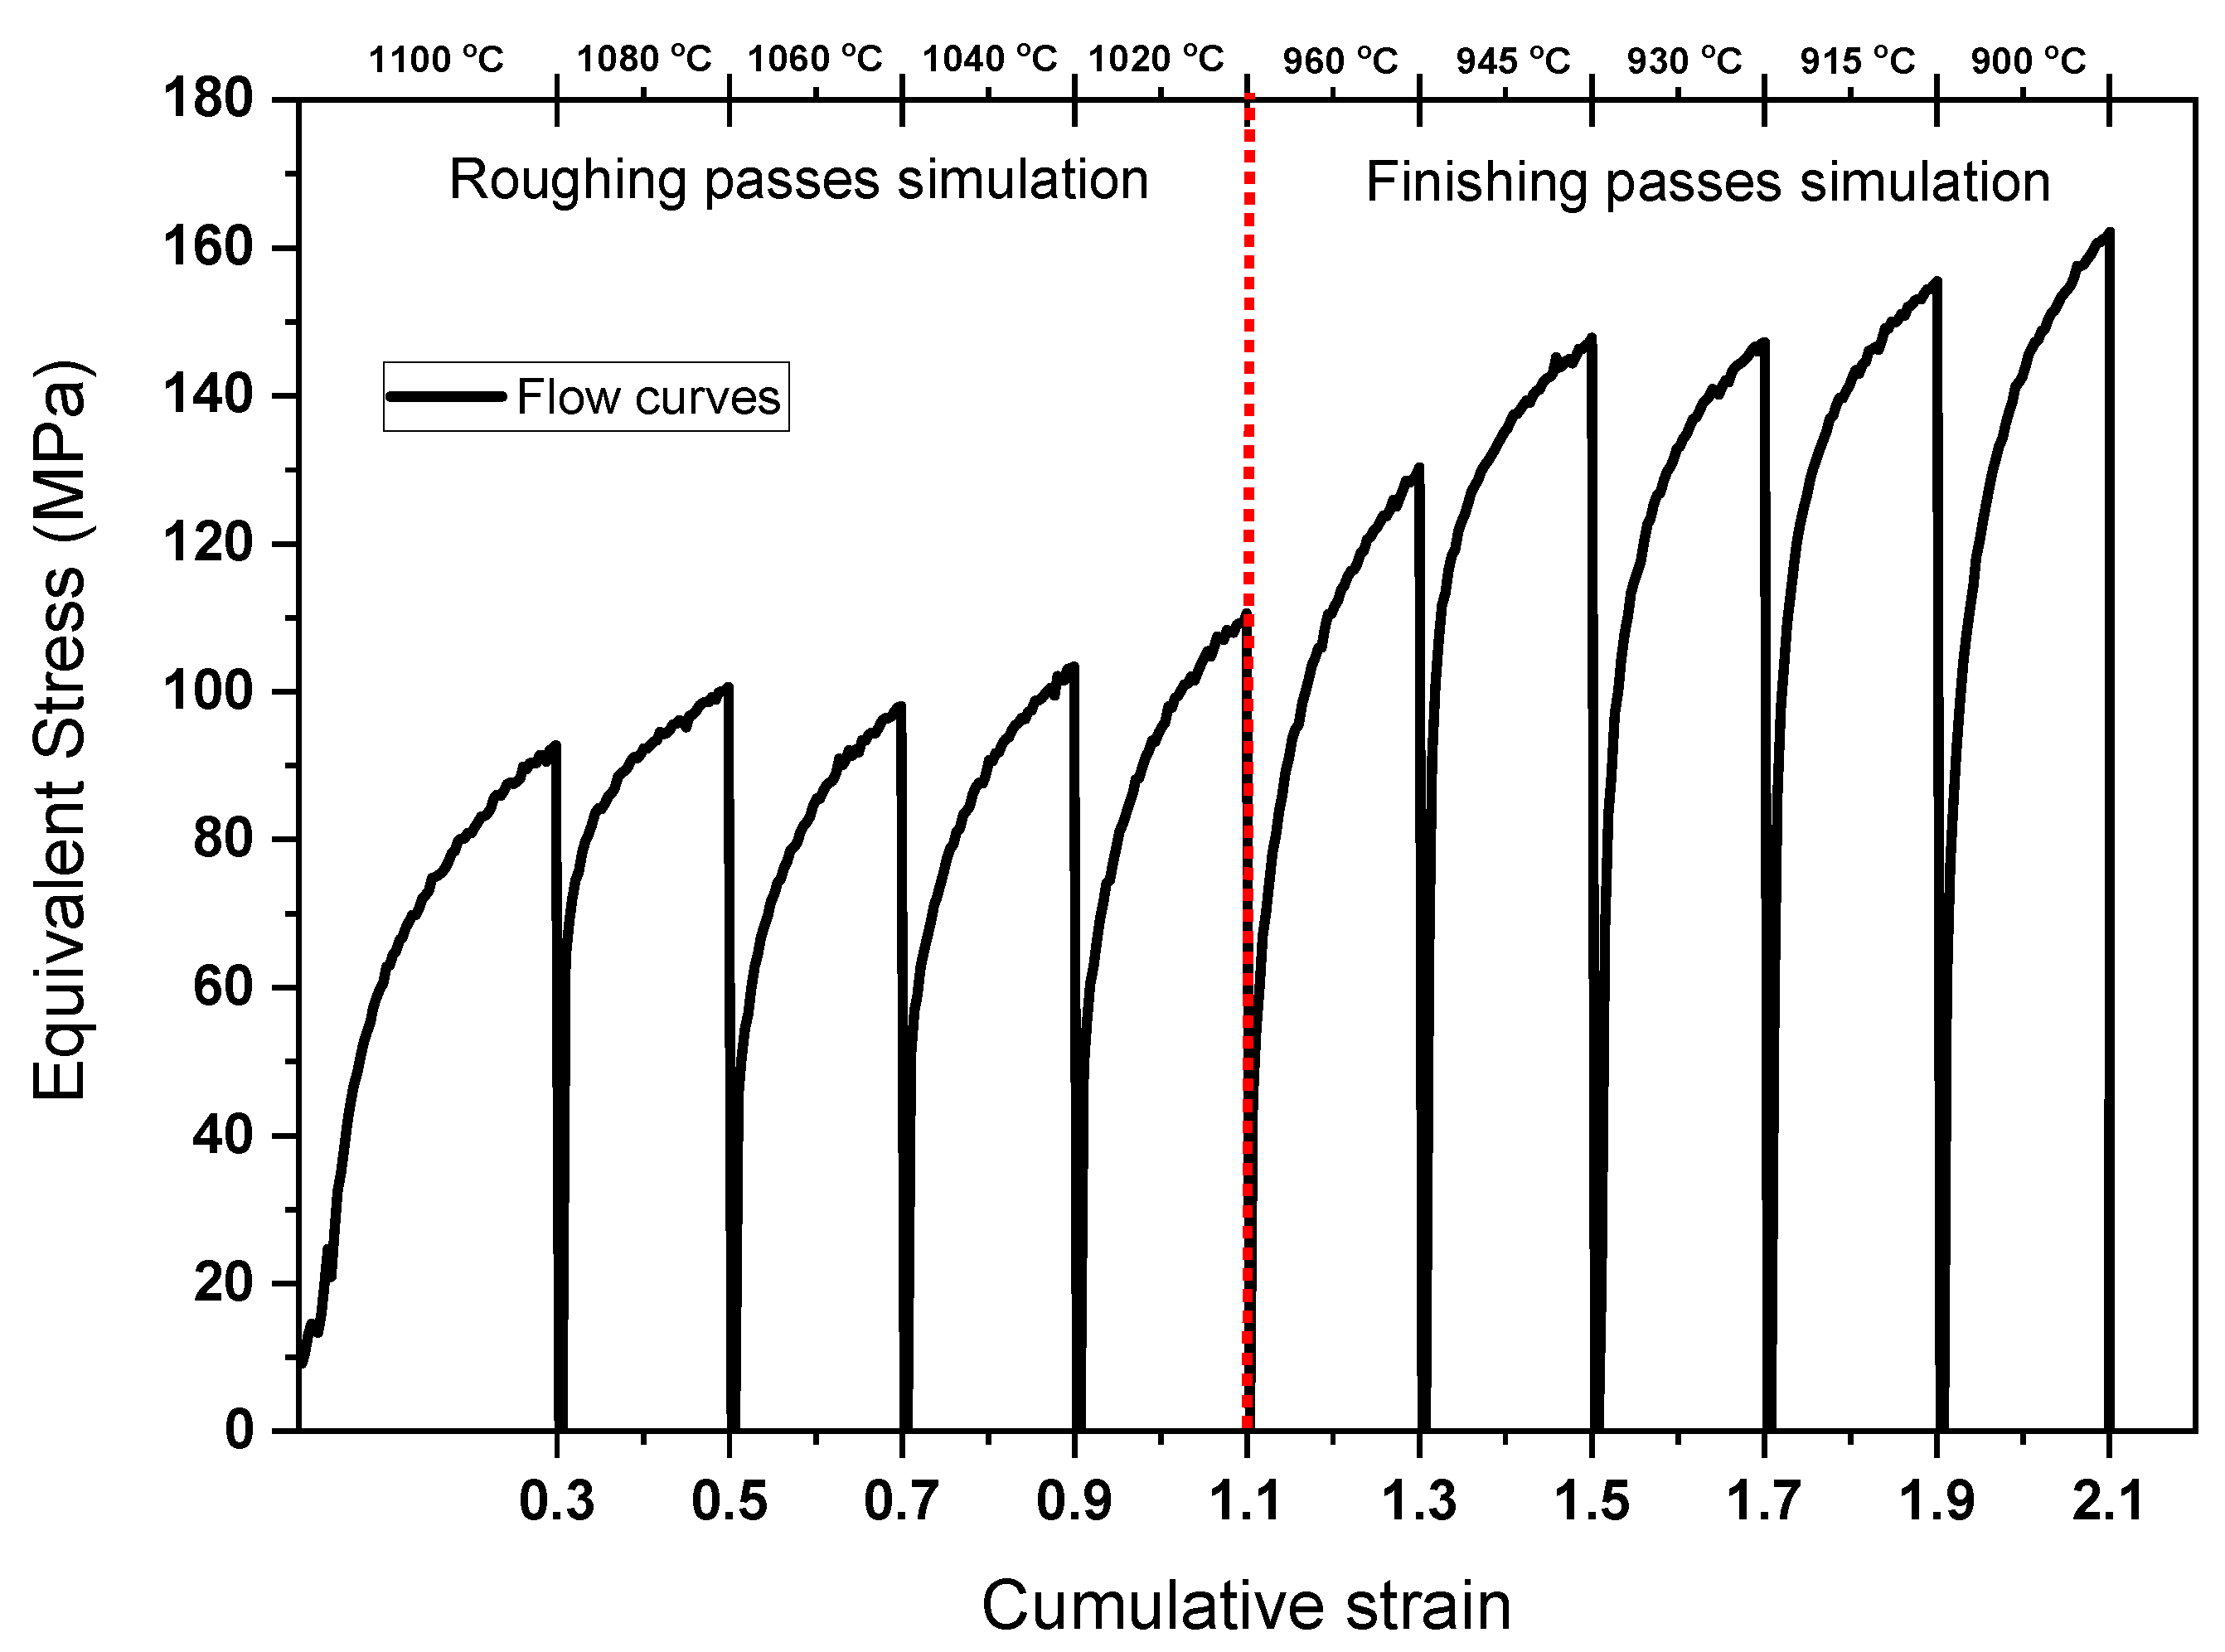
3.1. Flow Curves from the Plate Rolling Simulation

The stress–strain curves obtained from the five-pass simulations related to roughing passes, together with the five-deformation regarding the finishing stage of the thermomechanical process, are illustrated in Figure 2.
To evaluate the effect of DT on the softening process, the peak stresses in each pass were determined and the average increase rate with temperature was calculated. For instance, from the R1 to the R2 pass, the stress peaks were 92 MPa and 100 MPa, while the temperature decreased from 1100 to 1080 °C, respectively. This represents a variation of 8 MPa with a difference of 20 °C, which is equivalent to 0.4 MPa/°C. The same methodology was applied to the following deformation passes. The R3 pass resulted in a lower peak than the previous passes. This suggests that the softening mechanisms exceeded the hardening of the material. This occurred due to the strain accumulation in the R1 and R2 deformations which required less strain to initiate the occurrence of DT in the subsequent pass [24,25]. Also, the high temperatures associated with deformation promoted dynamic and metadynamic softening mechanisms such as recovery and recrystallization concurrently with DT [1,26].
Although the R3 to the R5 roughing passes showed a tendency to increase the stress peaks due to the drop in temperature, this was less intense than the two previous passes due to DT. The increasing stress rate with temperature was about 0.3 MPa/°C, i.e., slightly lower than the initial trend between the R1 and R2 strains. According to Rodrigues et al. [14,22,24], this occurs because of the partial transformation of austenite into ferrite, leading to more pronounced softening behavior in the last roughing passes.
Between the fifth roughing pass at 1020 °C and the first finishing pass at 960 °C, there was a time interval of 90 s. During this time, diffusive mechanisms acted and the ferrite was retransformed into stable austenite [1,4,6,19]. Static recovery and recrystallization phenomena were also favored during this time interval. As the austenite had a higher deformation resistance compared to the ferrite phase, the applied stress to deform the material in F1 was higher than the last rouging pass [27,28,29]. From the F1 to the F2, there was a sharp increase in the peaks of flow curves which led to a stress variation rate of 1.2 MPa/°C due to the work hardening rate of the amount of retransformed austenite [25,30]. For the F3 pass, an effect like that of the R3 roughing pass could be observed, where a load reduction occurred, which was associated with the accumulated strain energy in the material that also favored less strain on the DT.
For the rest of the finishing passes, the stress levels increased with strain at a stress variation rate of 0.5 MPa/°C. However, this increase was smaller than expected when only recovery and recrystallization were involved. This indicated that dynamic transformation had occurred because the ferritic phase is softer than deformed austenite, and as the temperature approached the Ae3 line, where the difference between the Gibbs free energies of austenite and ferrite is the least [12,31].

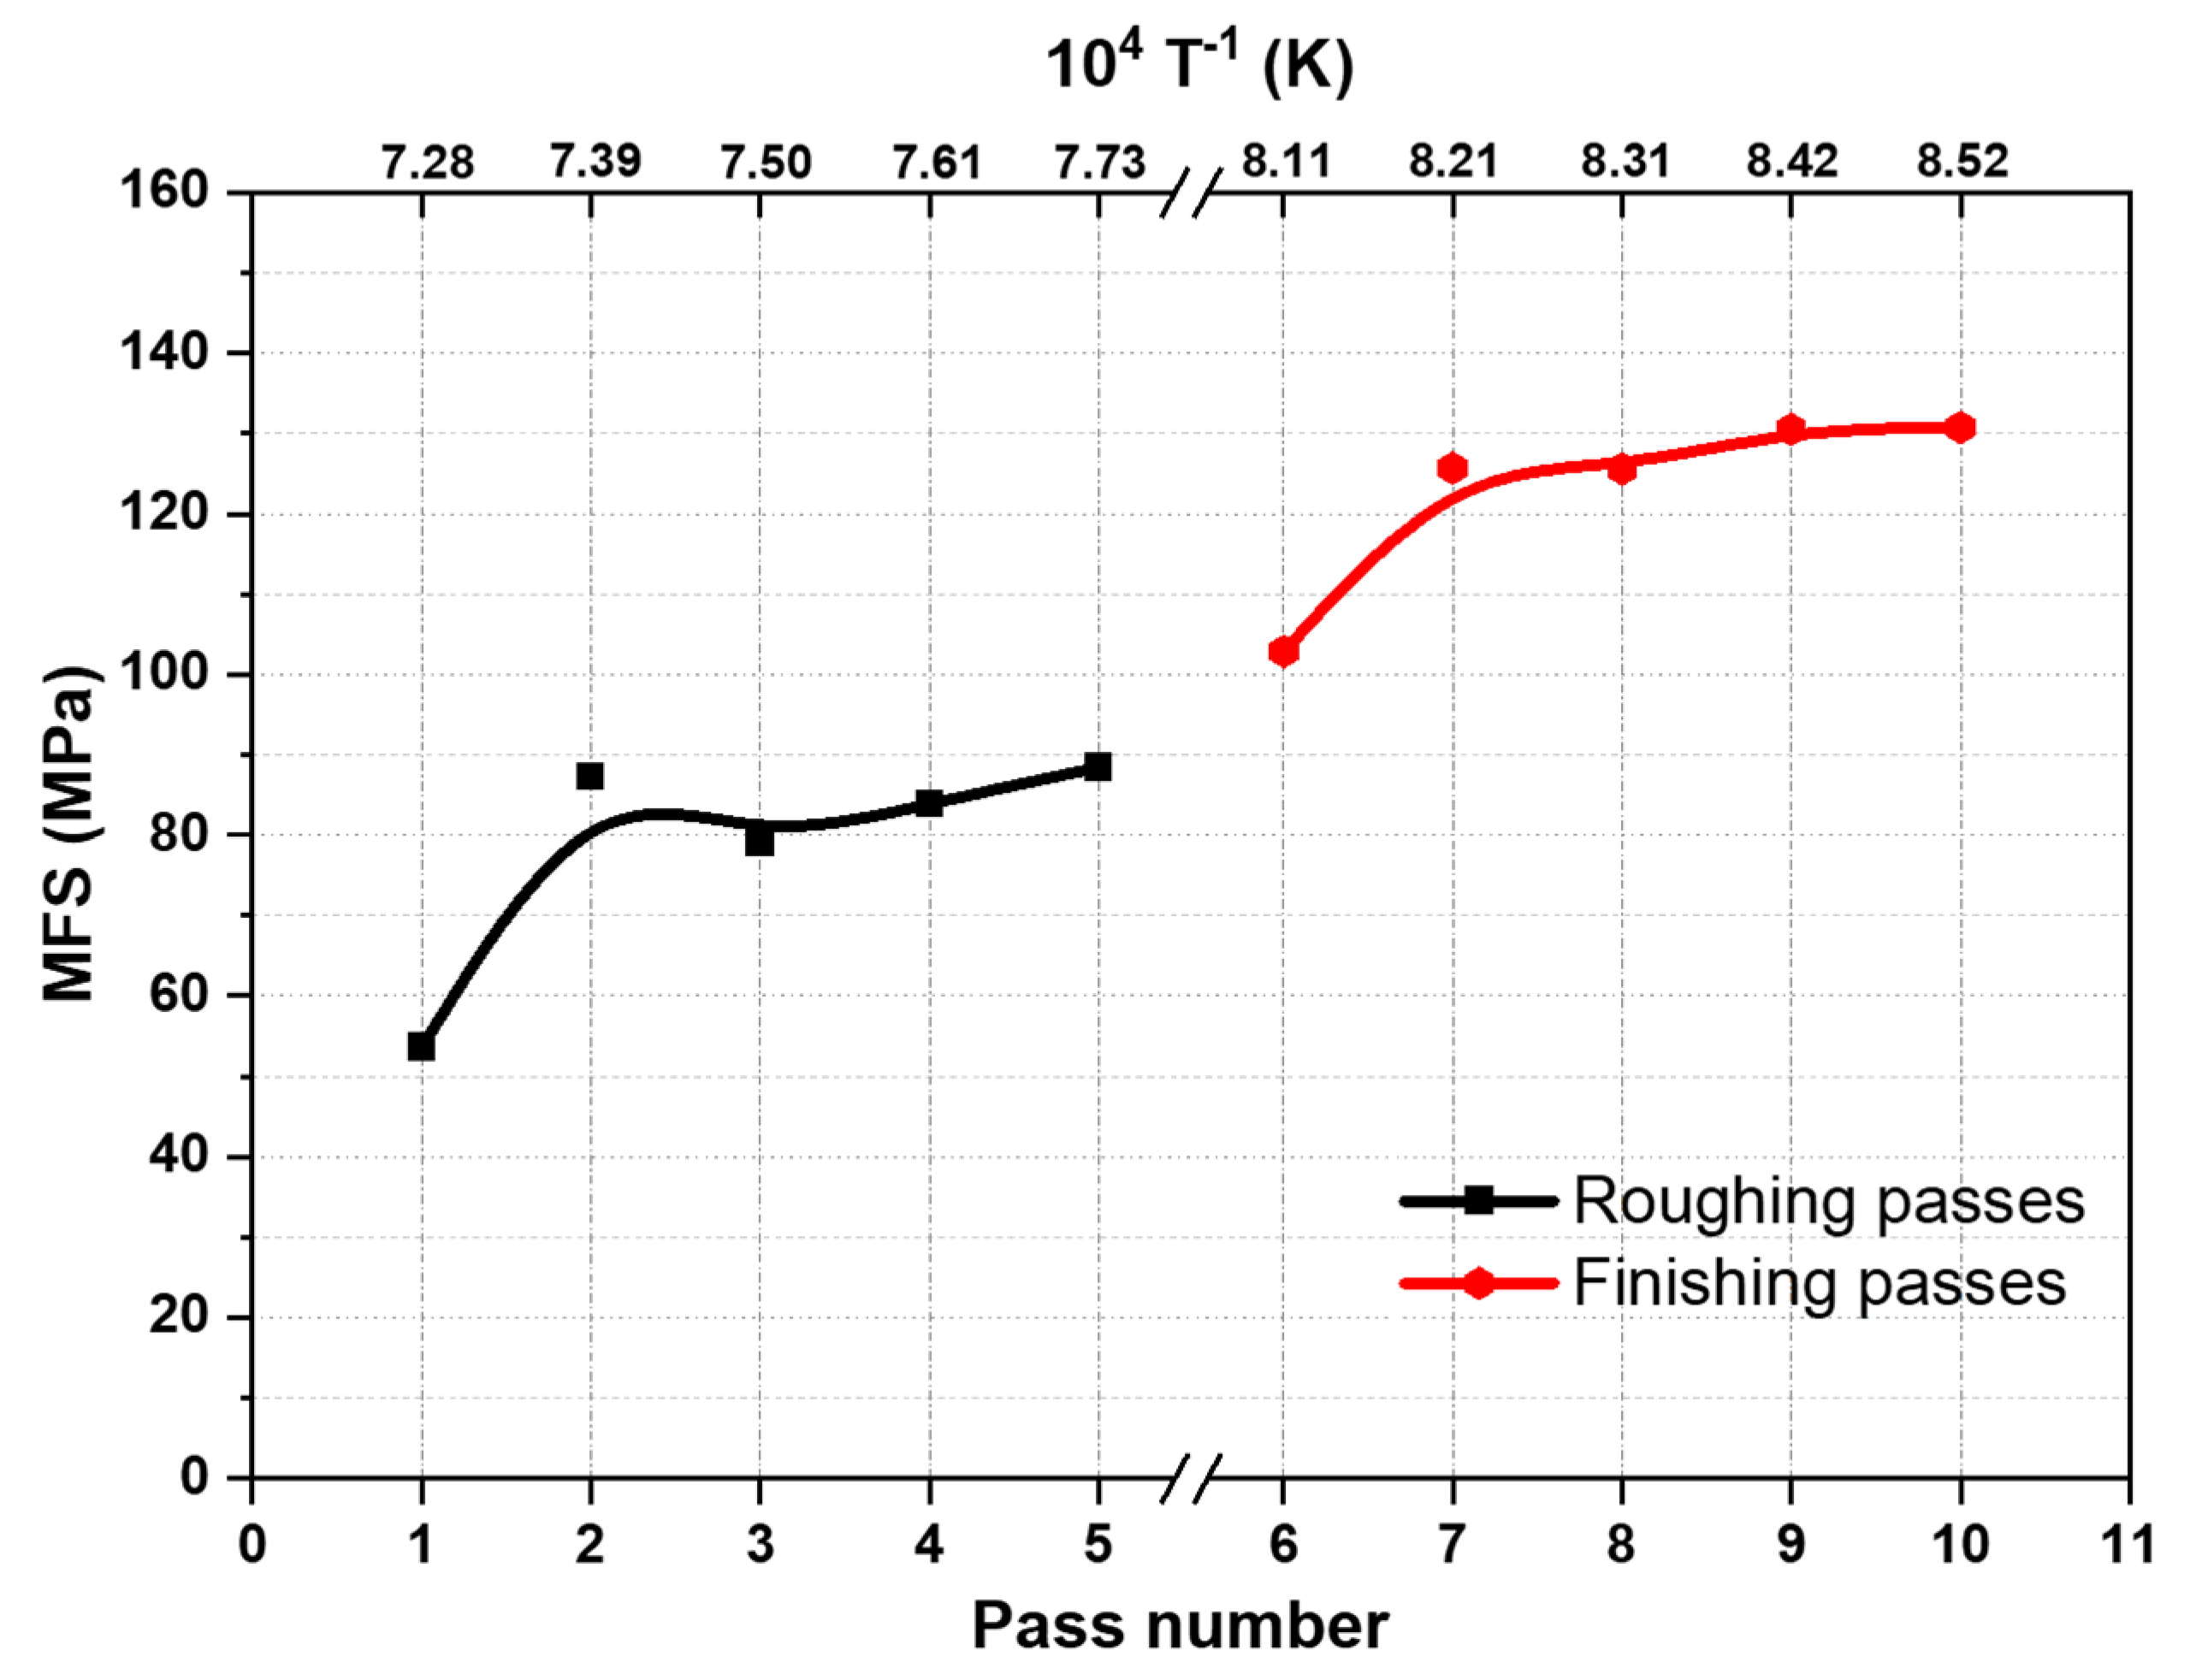
3.2. Mean Flow Stresses in the Thermomechanical Simulation

The Mean Flow Stresses (MFS) chart obtained from the stress–strain curves is a tool to evaluate the effect of dynamic transformations on stress levels. Each value acquired from an individual curve was computed from the area under the flow curve according to the following Equation (1).
M F S = 1 ε f ε i i f ( σ e q d ε )
where σeq is the equivalent stress and (εf − εi) is the equivalent strain applied in each pass. The results of the MFS values in the curves of the roughing and finishing stages for API X80 steel are shown in Figure 3.
The strain accumulation was responsible for the sharp increase in the MFS from the first to the second roughing passes, as well as from the first to the second finishing passes of the simulations. This is consistent with the behavior of the stress–strain curves, shown in Figure 2. Other authors [4,32] have mentioned that the material stores energy with increasing strain passes, and that alloying elements also contribute to retarding the retransformation of ferrite into stable austenite between passes due to pinning and/or solute drag effects [31,32]. The MFS presented a slight decrease from the second to the third rouging passes and remained approximately constant from the F6 to the F7 pass. According to these observations, the increase in the subsequent passes was very smooth until the last pass of each stage. This behavior indicated that ferrite had formed in each pass. Since ferrite is softer than austenite, it indicates that the volume fraction of the former phase also increased as the temperature approached the Ae3 line. It is worth mention that this phase softening mechanism also coexists with dynamic and/or meta-dynamic recrystallization. This is supported by the double differentiation methodology presented in the following section.

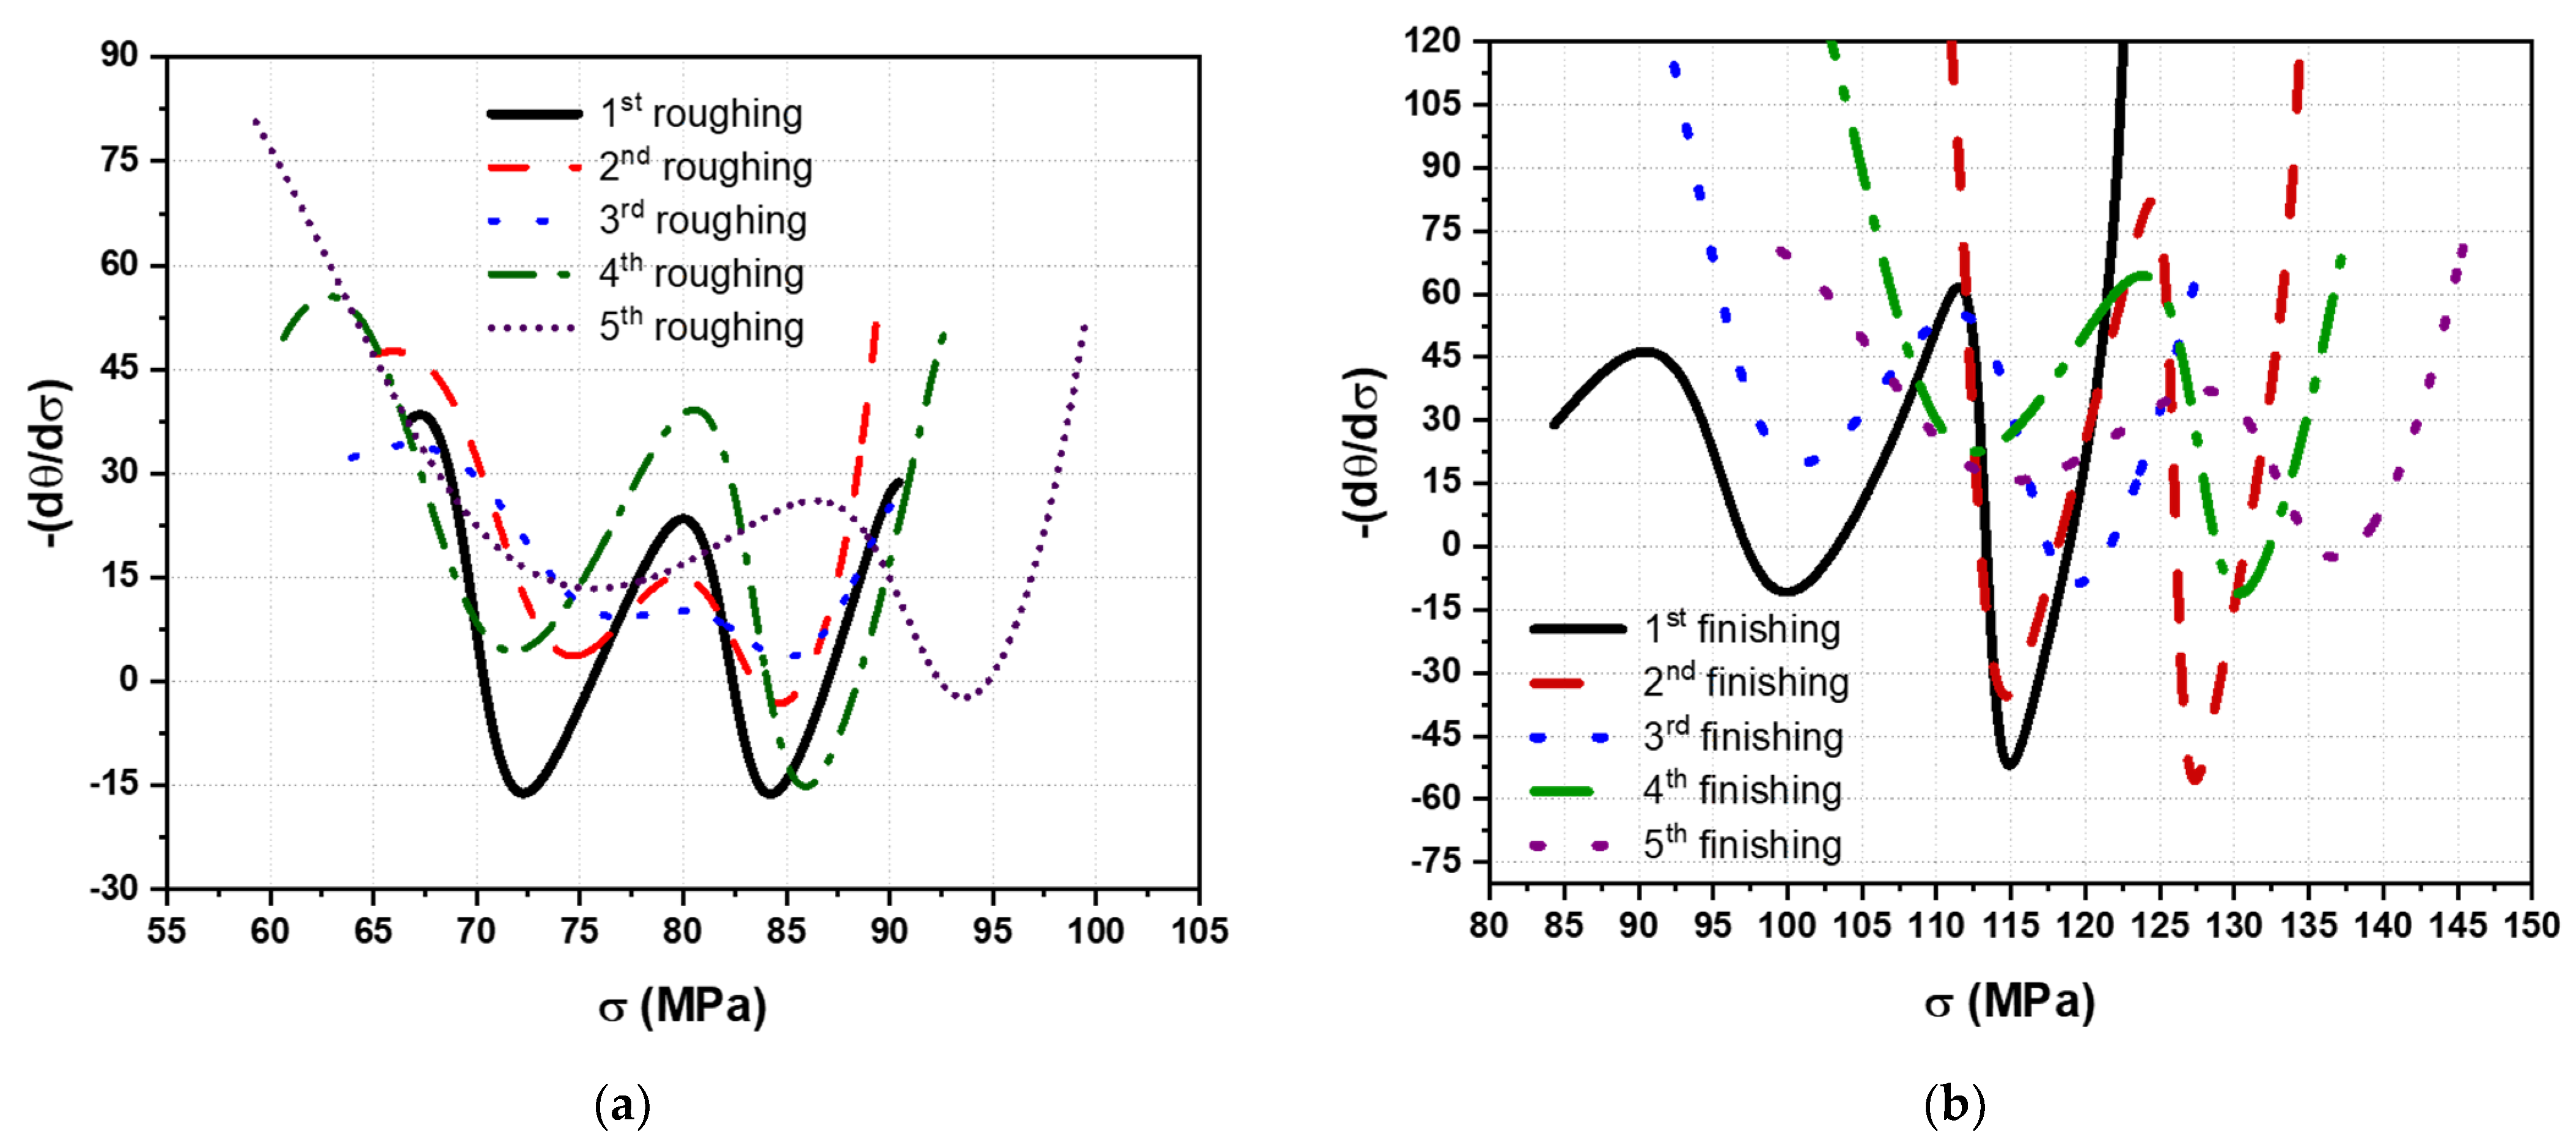
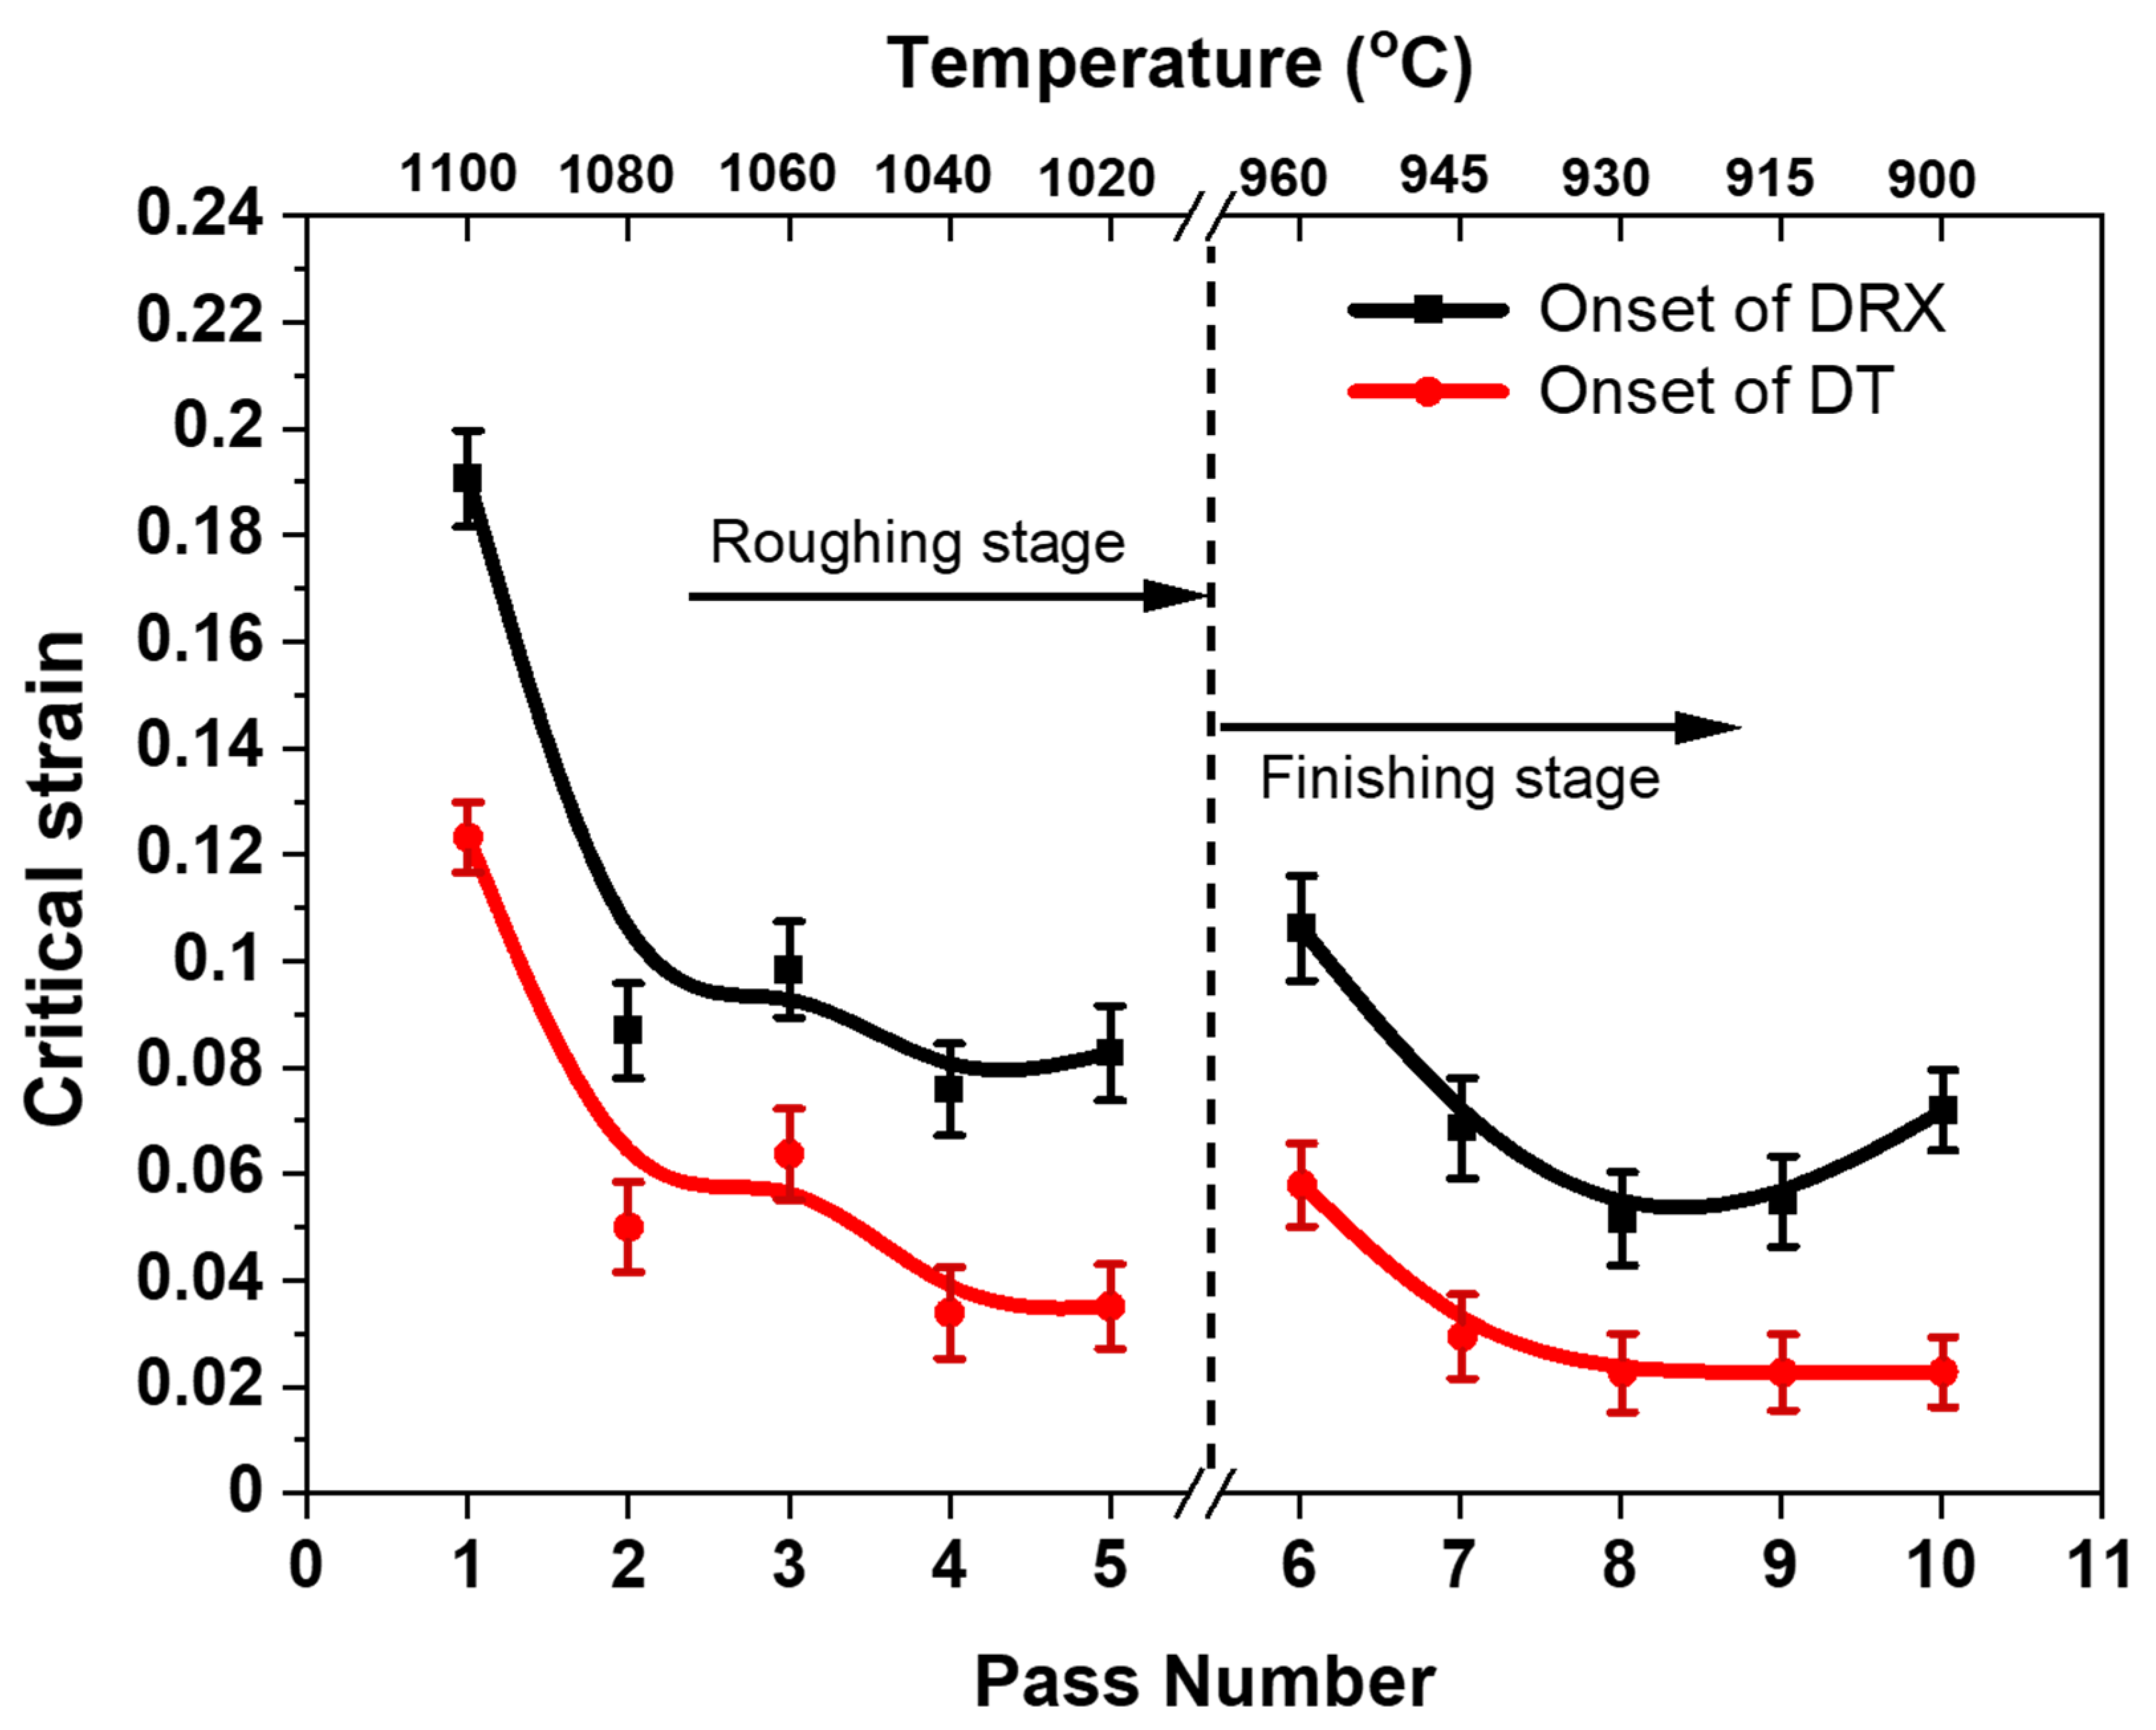
3.3. Determination of the Critical Strains for the Initiation of DT and DRX

As the behavior of the flow curves and MFSs indicated that the softening mechanisms of DT and DRX acted during thermomechanical process simulations, further analytical analyses were necessary to clarify this point. Here, the methodology of the double differentiation on the stress–strain curves proposed by Poliak and Jonas were employed [33]. Programming code of the first and second derivative calculation from the flow curves that were fitted from the 0.2% offset yield stress up to the peak stress using a ninth order polynomial (higher order is necessary in some cases) was created in the Matlab software (MathWorks, Natick, MA, USA). More details about this procedure can be found in previous publications [14,17,19,22].
Previous researchers have shown by means of microstructural characterization that the first presented minimum in the (−dθ/dσ) versus (σ) charts is associated with the beginning of DT while the second minimum determines the onset of DRX [4,5]. The second derivative curves obtained from the flow curves related to the roughing and finishing stages of the simulation are presented in Figure 4a,b, respectively.
After finding the stresses of the two minima in Figure 4, these were correlated to their respective strains in the flow curves. The quantity of strains (named as critical strain) where DT and DRX initiated were then plotted with their corresponding pass number; see Figure 5. Note that the roughing and finishing stages of the simulation are highlighted in the chart, as are the temperatures of the employed deformations. For all passes, the critical strain for the onset of DT was lower than that of the DRX, which reflects the first and second minima of the second derivate curve. Both the DT and DRX critical strains (0.12 and 0.19) were higher in the first pass of the roughing stage and decreased as the number of passes increased, reaching values of approximately 0.04 and 0.09, respectively.
A similar trend can be observed in the finishing stage; however, the critical strains of the DT and DRX in the first finishing pass of the overall simulation were much lower compared to the first pass of the roughing. This was due to the possible amount of ferrite that may have been produced in previous passes coming from the roughing stage. Also, for the F1 pass, the slight increase in critical strain was related to the recovery and static recrystallization of the material, a process that occurred due to the 90-s delay after the application of the fifth roughing pass. Furthermore, a partial fraction of ferrite retransformed into stable austinite during this interval. From the F2 to the F5 passes, certain critical strains for DT decreased with increasing pass number. As reported in the literature, stain accumulation is a driving force for DT, as the austenite suffers work hardening and the decrease of the processing temperatures lowers the total energy barrier for DT [1,5,12,24]. Therefore, lower strain is required to transform austenite into ferrite under such circumstances.

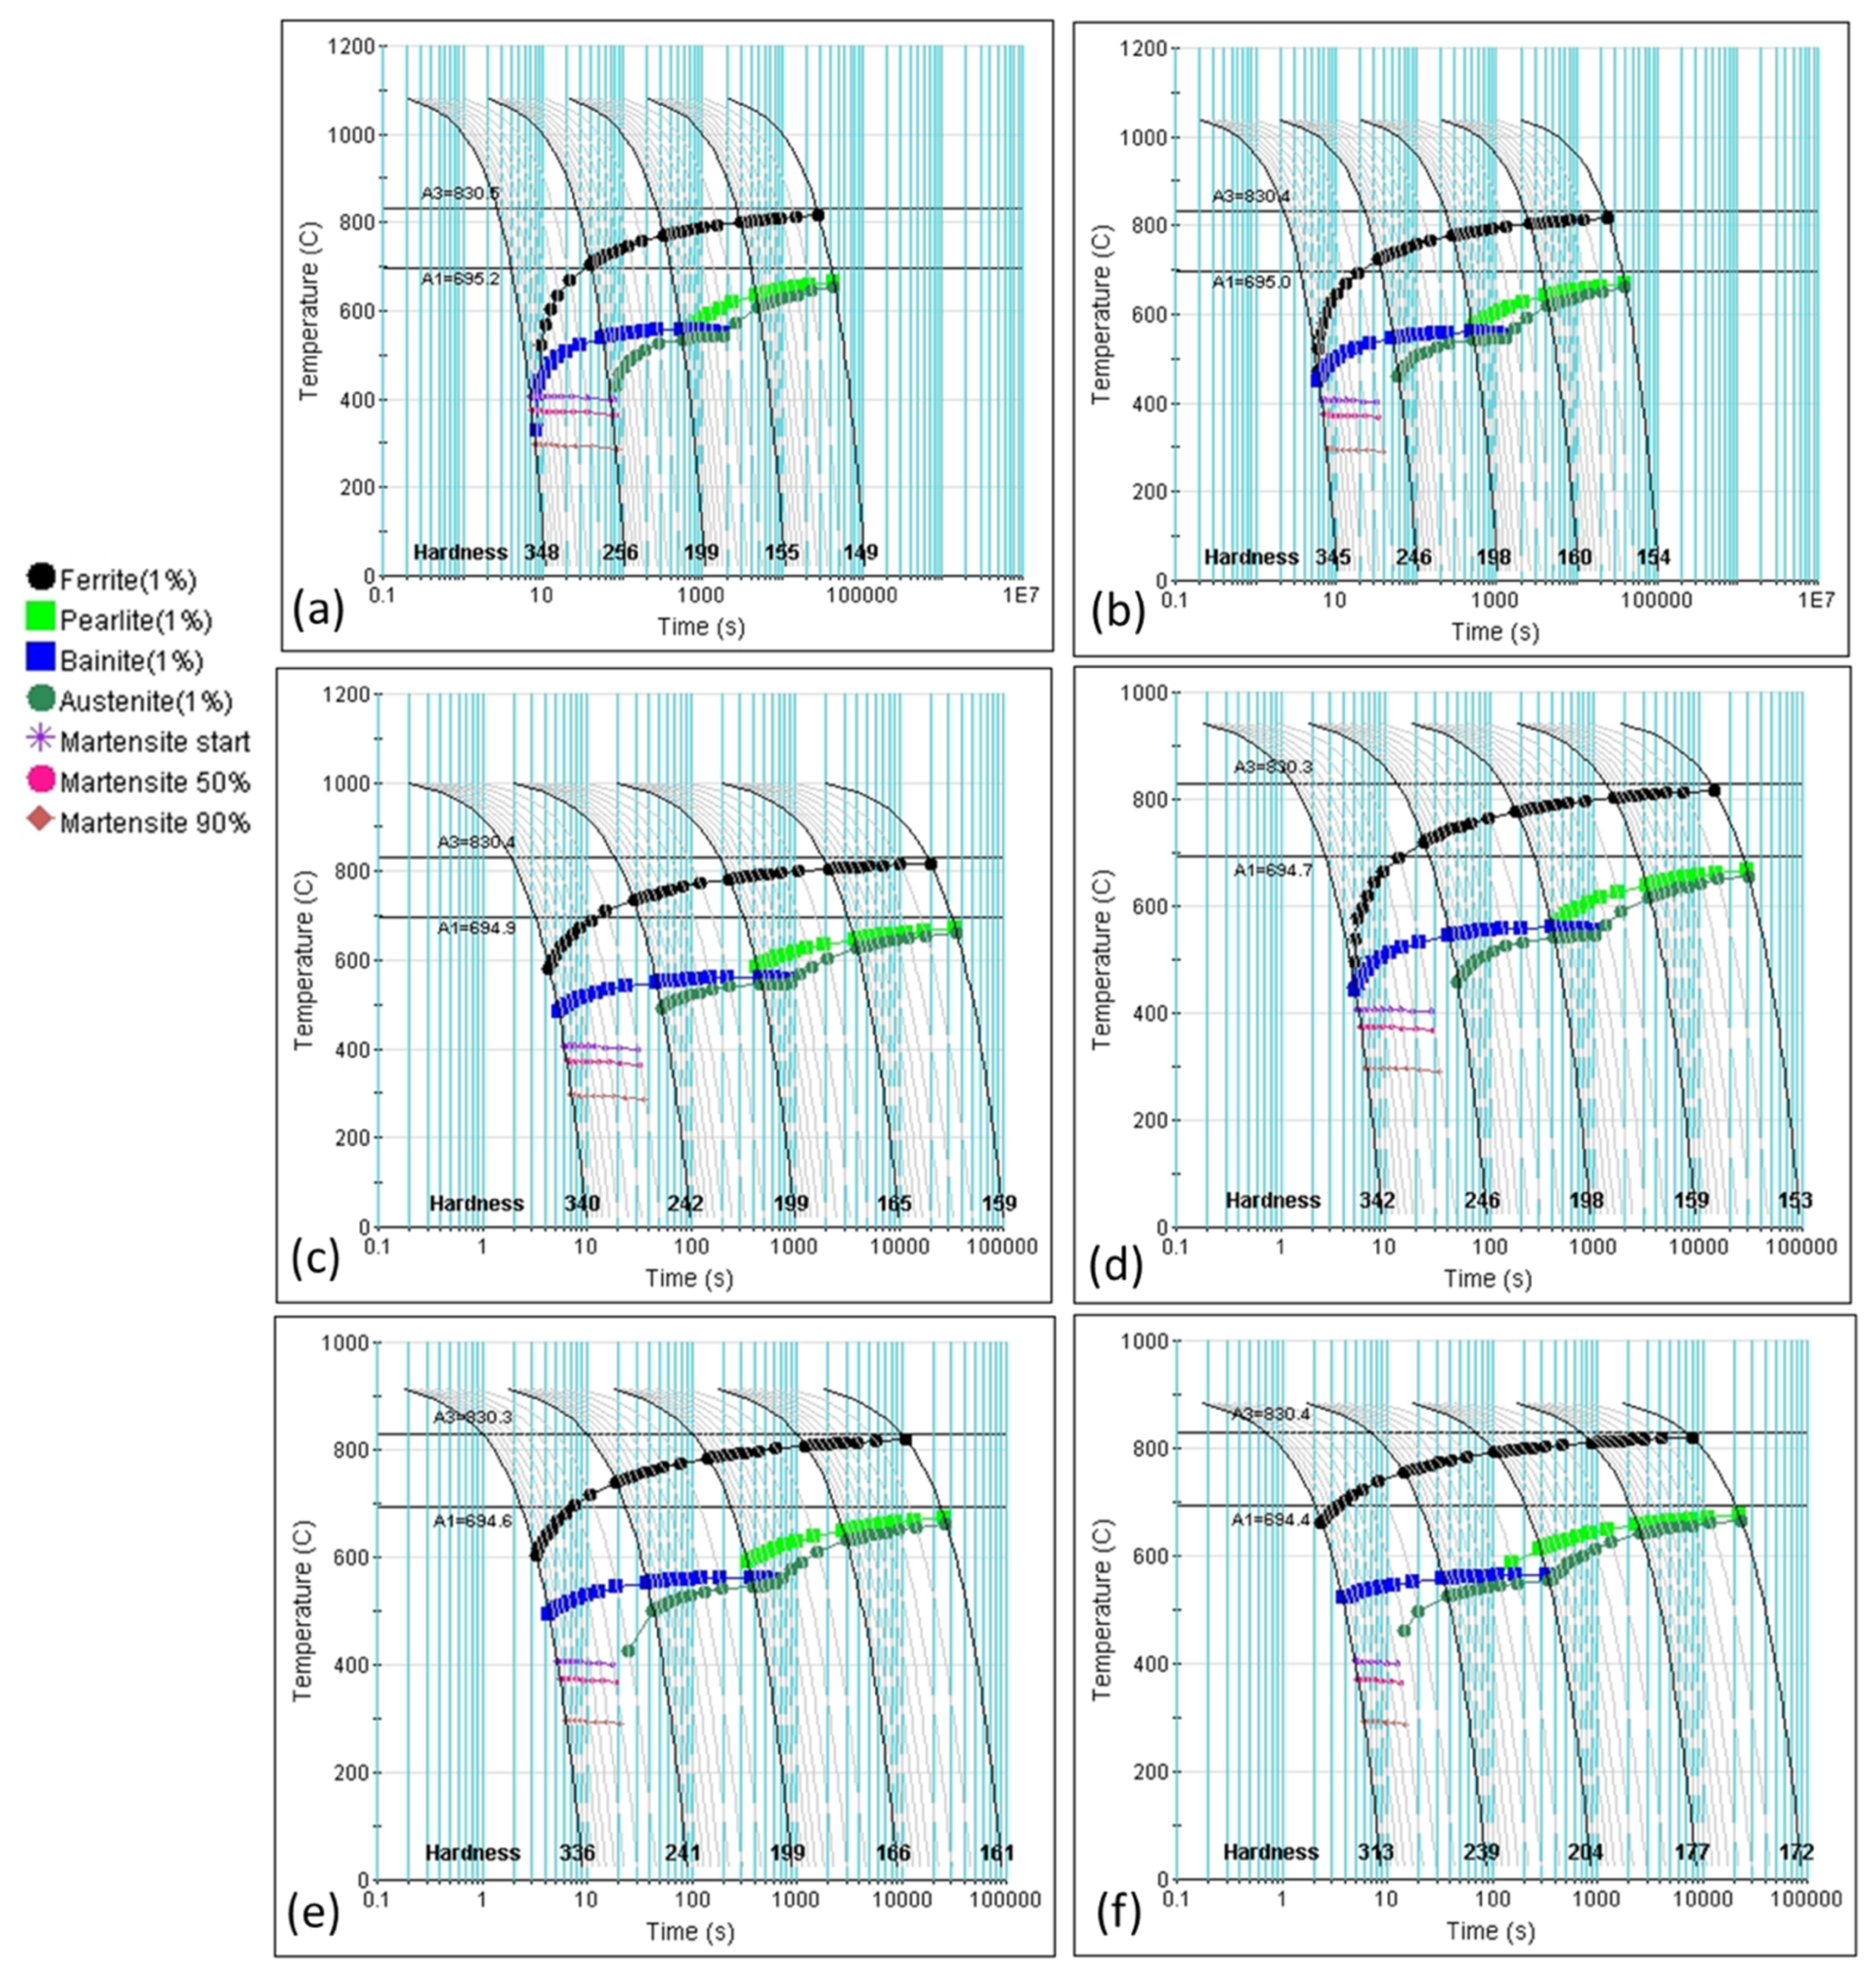
3.4. Continuous Cooling Transformation Curves Related to Some Roughing and Finishing Passes

In order to make sure that ferrite had not formed during the fast cooling from the test temperatures above the Ae3, continuous cooling transformation (CCT) diagrams were plotted. The measured grain sizes after each strain were considered. Based on these results, a fast water quenching process was considered to avoid ferrite formation during cooling. As such, the only ferrite that remained was that formed dynamically above Ae3. CCT plots are depicted in Figure 6. These charts were generated using the Fe Alloys module in the JMatPro software 11.2 (Sente Software, Guildford, UK).
The diagrams were calculated considering the parameters of the R1, R3, R5 roughing passes and F1, F3, F5 passes of the finishing stages. Their respective tested temperatures were 1100, 1060, 1020, 960, 930 and 900 °C; see Figure 6a–f. The samples presented average grans sizes of about 75, 60, 35, 53, 31 and 17 μm, respectively. According to Rodrigues et al. [3], in experiments performed in a Gleeble 3800 system (Dynamic Systems, New York, NY, USA) in hot torsion mode, water quenching promoted ultra-fast cooling over the surface of the specimens, reaching rates of the order of 500 °C/s, indicating that in a very short interval, the temperature dropped to room temperature.
An analysis of the CCT curves shows that the time required to start the formation of the ferrite phase due to cooling varied from 10 s at 1100 °C (see Figure 6a) to 2 s at 900 °C (see Figure 6f), depending on the temperature at which the cooling process started. In this way, the applied cooling rates in the simulation were sufficient to prevent ferrite formation because the maximum interval to reach room temperature was 0.8 s. The cooling conditions imposed on the material support the hypothesis that phase transformation had not occurred by a diffusion process during quenching. Therefore, the ferritic phase present in the material was due solely to dynamic transformation.

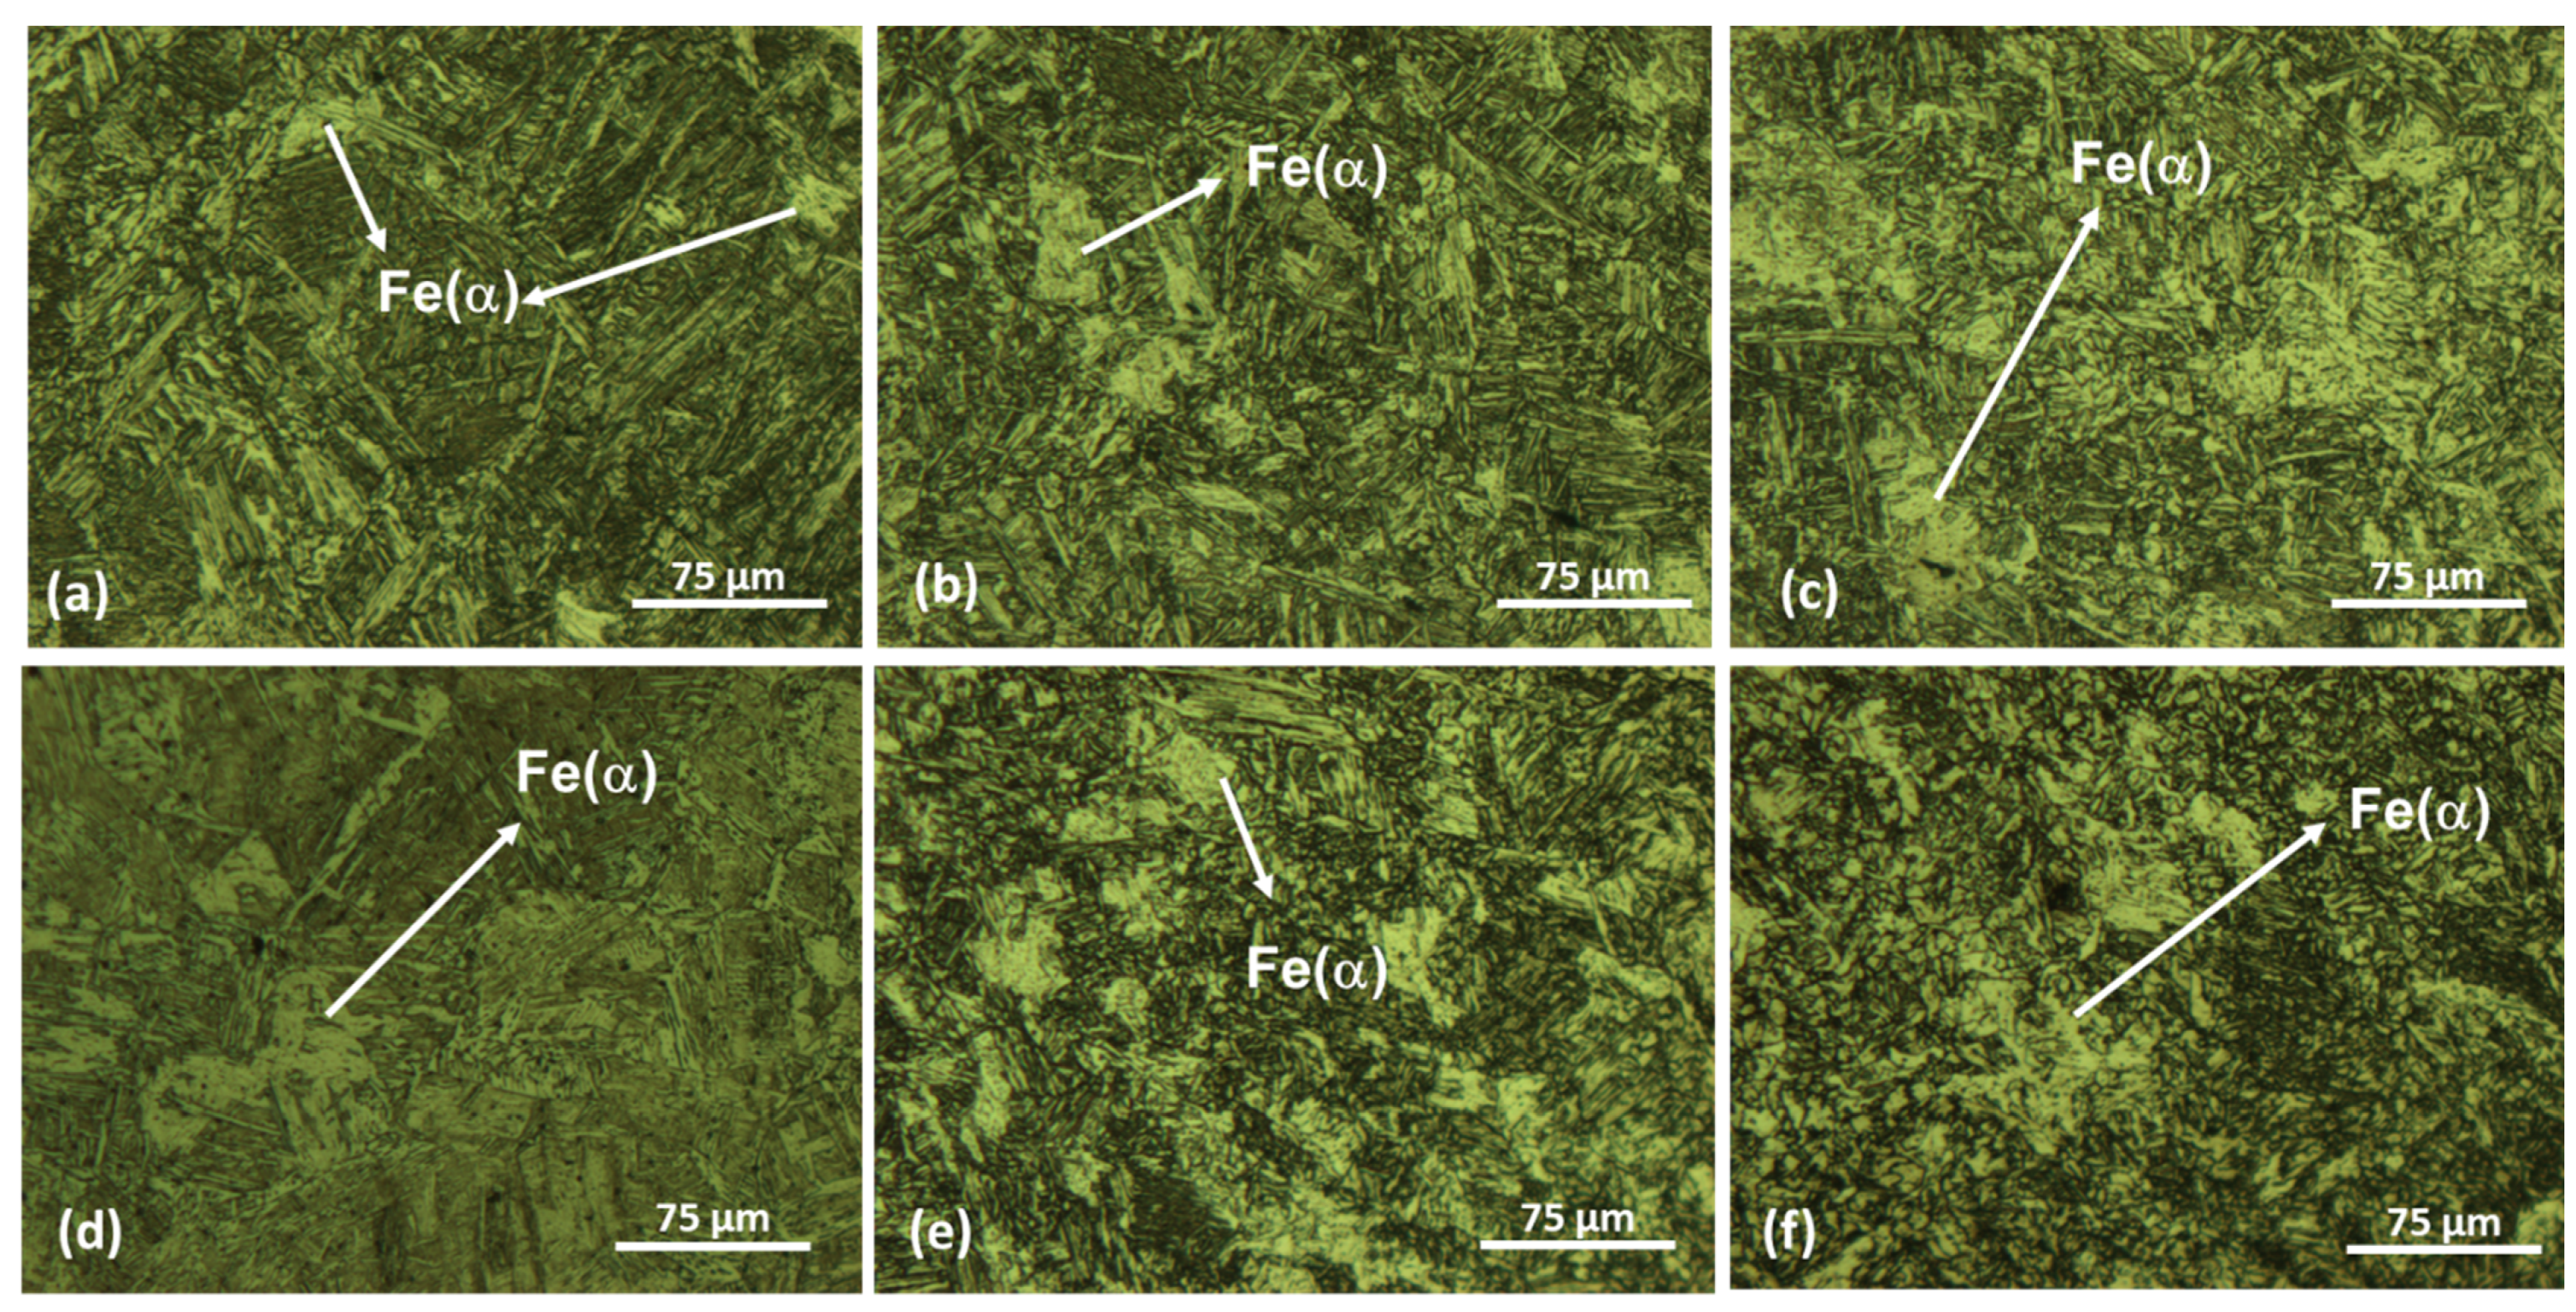
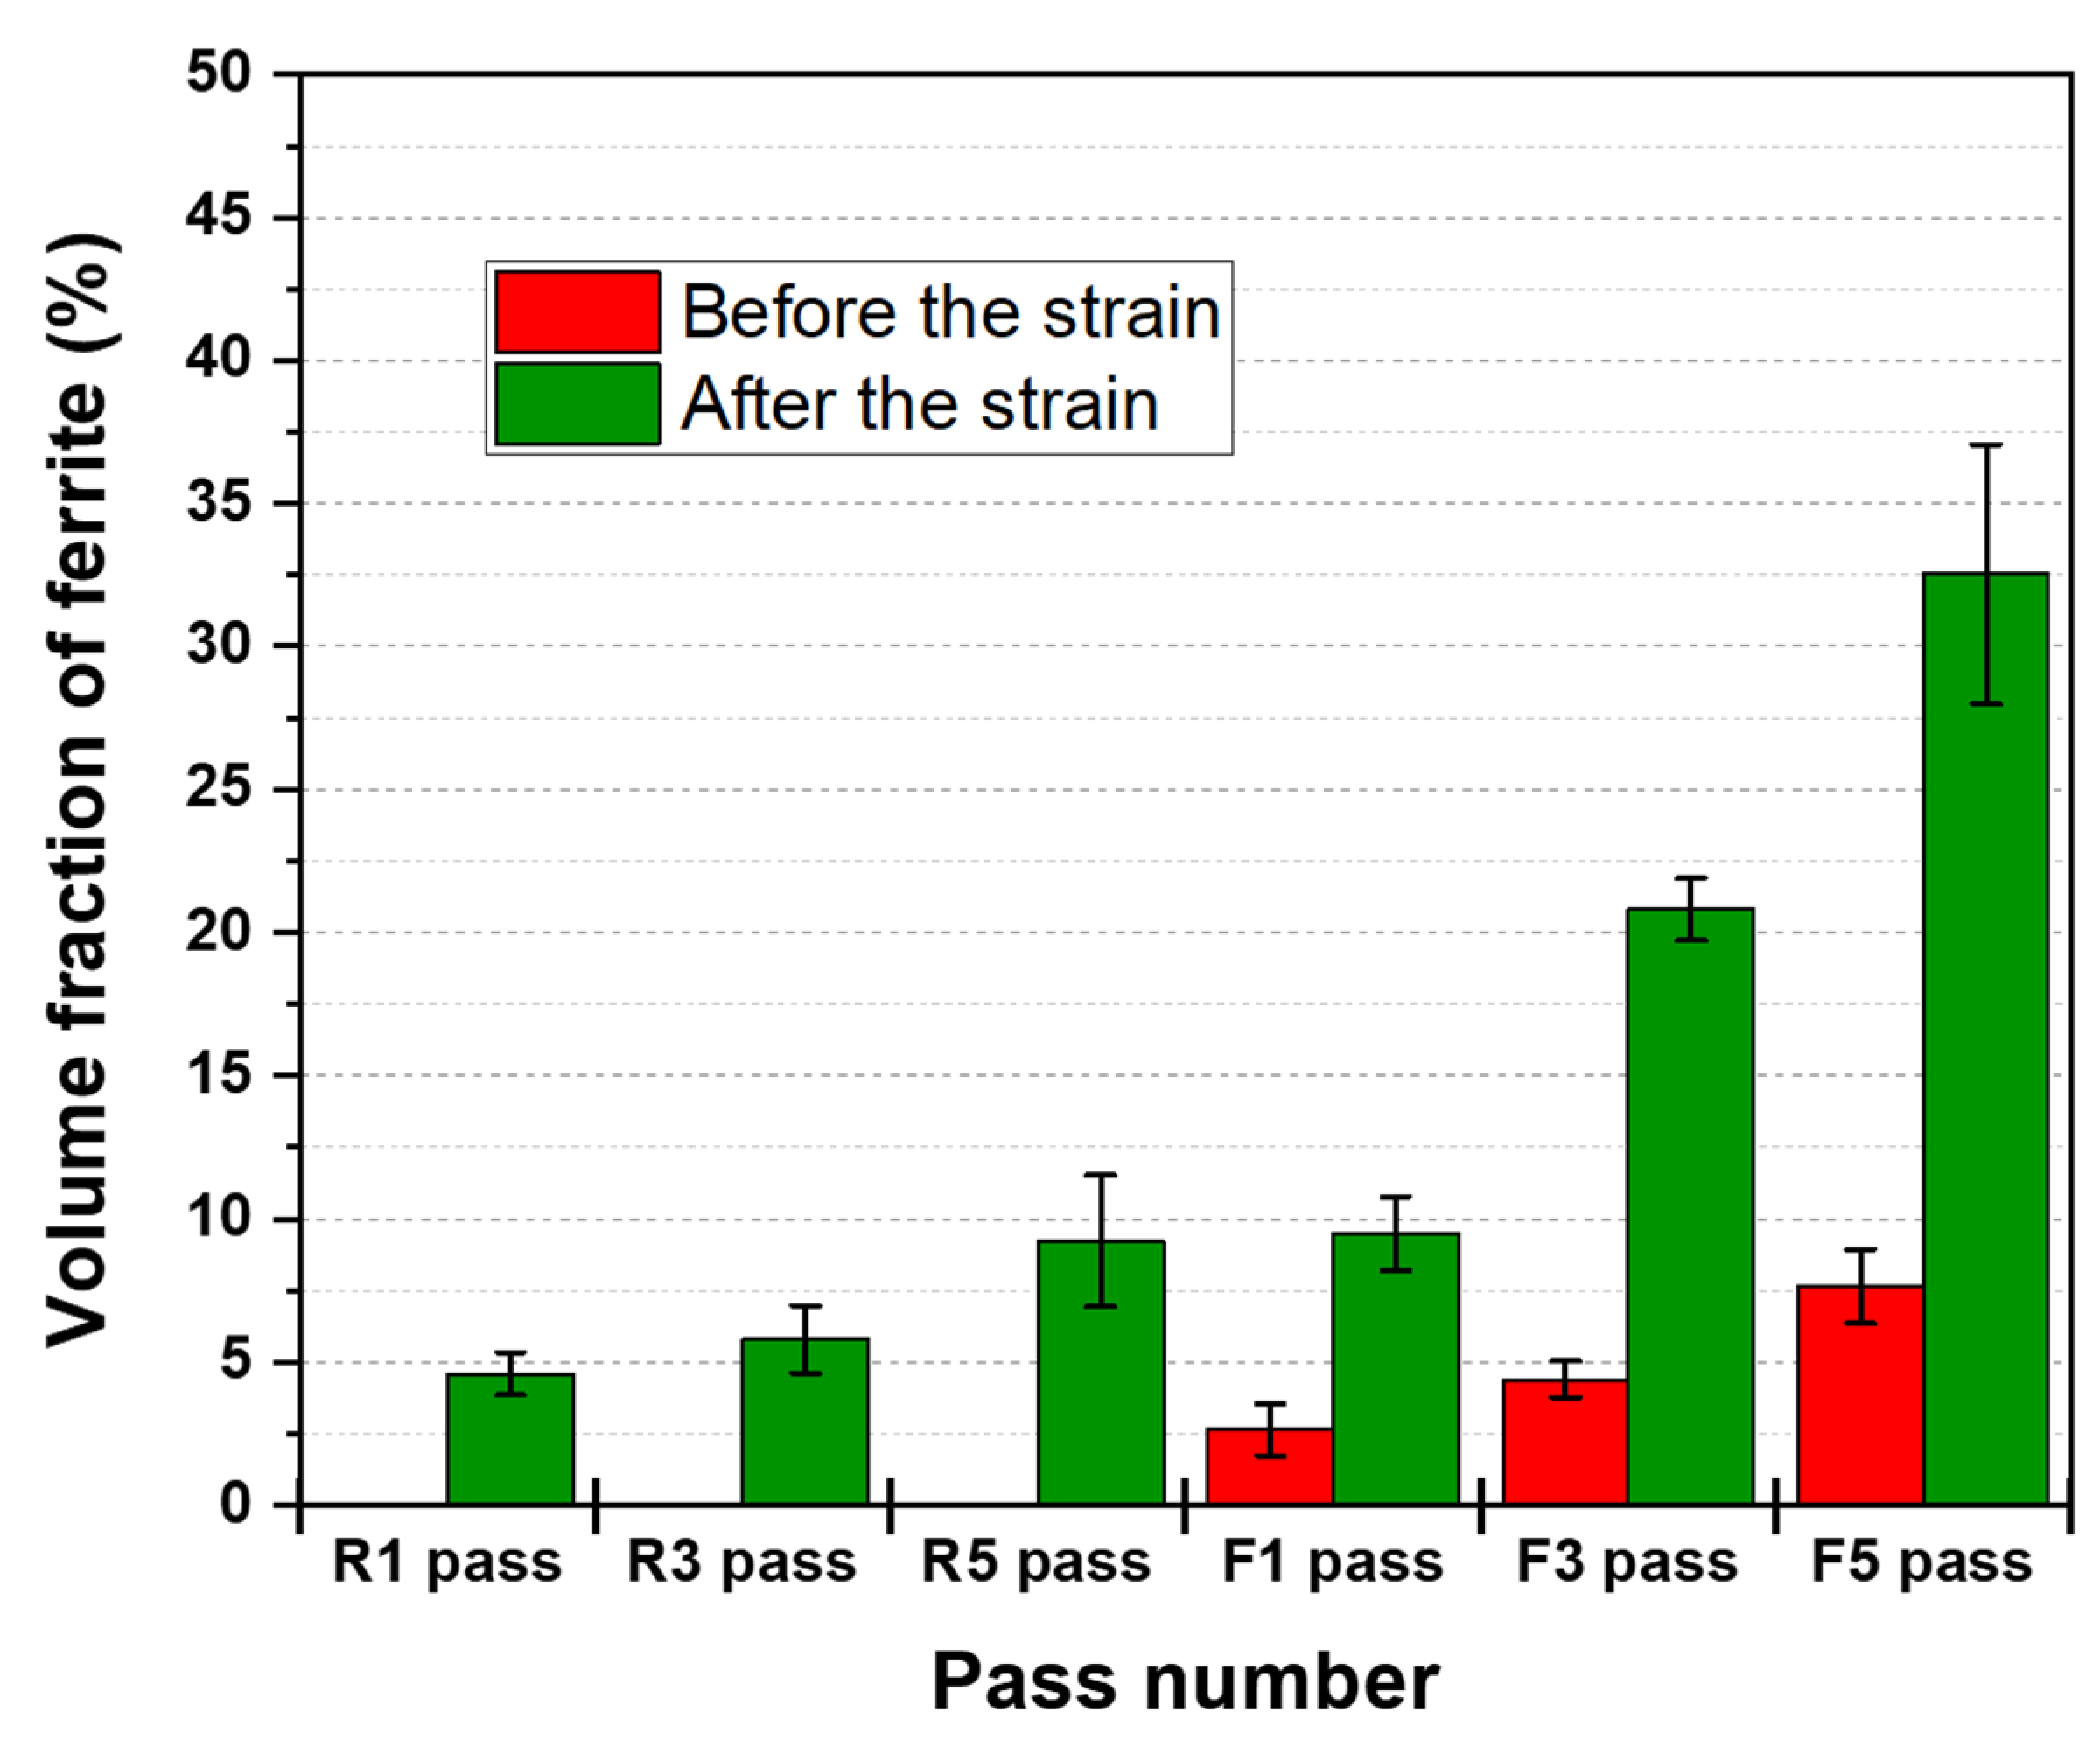
3.5. Microstructural Analysis and Calculated Volume Fraction of Ferrite

Image analysis is an important method for the characterization of materials. In the study of dynamic transformations (DT), it constitutes a powerful technique for visualizing the formed phases and calculating their volumetric fractions. The optical microscopy results are depicted in Figure 7. Images that correspond to samples quenched after the R1, R3 and R5 of the roughing strains and the F1, F2 and F5 passes of the finishing stage simulations are shown in Figure 7a–f, respectively. The brighter areas are DT ferrite while the darker regions are martensite (austenite at elevated temperature, which was transformed during quenching). The arrows indicate ferrite (Fe(α)) islands surrounded by austenite (α). It can be noted that optical images were chosen for volume fraction measurements of the phases where a quantity of 10 to 15 images per sample were used; these results are presented later.
In Figure 7a, it can be seen that a small amount of ferrite was present right after the first roughing deformation at 1100 °C, and that this quantity appeared to increase as the number of passes is increased; see Figure 7b–f. A higher number of passes means more strain accumulation and work-hardening of the remaining austenite, which increased the driving force for DT.
The cumulatively calculated volume fraction of dynamically transformed ferrite determined from the OM images after the R1, R3, R5, F1, F3 and F5 passes and before the commence of the F1, F3 and F5 strains are displayed in Figure 8.
The first roughing deformation at 1100 °C produced a volume fraction of ferrite of approximate 5%; after the third and fifth at 1060 and 1020 °C, these figures increased to approximately 6% and 9.2%, respectively. During the 90-s interval from the roughing to the finishing stages in which the temperature dropped from 1020 to 960 °C, the volume fraction of ferrite reduced to 2.6% by diffusional retransformation above the Ae3. The first pass of the finishing stage at 960 °C raised the quantity of ferrite to 9.5%. According to the tendency of the presented behavior regarding the formation of ferrite, the F2 pass, that was not measured here, would have produced about 15% ferrite which would have reduced to 4.5% after the 10s interval but before the initiation of the F3 pass. The third finishing strain at 930 °C increased the ferrite phase fraction to approximately 21%. Before the last finishing deformation at 900 °C, the quantity of ferrite was reduced to 7.7% but increased to 32.5% after the application of the F5 finishing strain of 0.2. This behavior is consistent with previous research, where it was demonstrated that the volume fraction of ferrite increased during the plate rolling process in HSLA linepipe steels [5,22,24,32].
Figure 9 shows the SEM microstructure of the torsion specimens sectioned transversely after the first (Figure 9a) and fifth (Figure 9b) roughing passes, as well as after the first (Figure 9c) and fifth (Figure 9d) passes of the finishing stage of the thermomechanical simulation. It has already been shown that DT ferrite first forms as Widmanstätten ferrite plates at the critical strain and coalesces into polygonal shapes as the strain is continued after the critical strain. Ferrite structures are highlighted in the images. It can be noted that most of the presented ferrite was in the form of polygonal shapes. This means that this phase had already passed through coalescence while under strain. From a qualitative evaluation, it is clear that the last passes produced more DT ferrite due to strain accumulation and as the temperature approached the Ae3 line.

3.6. Electron Backscatter Diffraction (EBSD) Characterization

It is well known that it is quite difficult to separate body-centered cubic (BCC) ferrite from the previous austenite transformed into body-centered tetragonal (BCT) martensite during quenching in EBSD, which may lead to errors in phase fraction measurements. One way to mitigate this drawback is to employ the methodology of Kernel Average Misorientation (KAM). Chadha et al. [34,35] used the KAM technique to quantify the internal misorientation of grains for the characterization of DT ferrite in an as-cast medium-carbon low-alloy steel. In their work, they considered up to the third nearest neighbor to calculate the internal misorientation between grains and distinguish BCT from BCC structures. Here, the same procedure was used with a threshold angle of 5°, in which the fraction lower than 2° misorientation was considered as the ferrite phase and from 2° to 5° was considered as martensite (previous austenite). Other researchers have applied the same methodology to distinguish BCC from BCT in EBSD [34,35,36]. The KAM maps for the samples quenched after both the last roughing (R5 pass) and finishing (F5 pass) strains are presented in Figure 10a,b, respectively.
Qualitatively, it can be seen that there was more ferrite after the last finishing pass than the last roughing strain during the thermomechanical simulation. The blue and green colors indicating ferrite (misorientation <2°) occupy more space after the F5 pass, while the yellow to orange colors of martensite and of untransformed austenite are much more pronounced after the R5 pass. These results agree with the OM analyses and volume fraction calculation shown in Section 3.5.
It is well established that only the best-oriented grains are prone to be transformed into ferrite due to DT during strain [20,21]. This orientation is calculated in terms of the Schmid factor, that gives the parameters of activated slip systems of grains associated with the rolling direction. The maximum calculated value to favor the transformation of austenite into ferrite during deformation is 0.5. Figure 11a,b show the Schmid factor maps of the deformed samples after the R5 roughing and F5 finishing passes, respectively. The F5 strain shows the greater fraction of softer grains with a higher Schmid factor that were easily dynamically transformed from austenite, compared to the R5 pass containing a higher fraction of harder grains (low Schmid factor). This is an indication that the API X80 steel increased its volume fraction of DT ferrite from the roughing to the last pass of the finishing simulation.

3.7. Orientation Image Maps (OIM) and Orientation Distribution Function (ODF) Analyses

The orientation image maps (OIMs) of the deformed specimens after strain accumulation of 1.1 (fifth roughing pass) and 2.1 (fifth finishing pass) obtained by EBSD are depicted in Figure 12a,b, respectively. These figures reveal that by increasing the amount of strain accumulation and, consequently, the volume fraction of ferrite, a gradual orientation gradient developed within the grains. In these pictures, it is possible to clearly distinguish the different morphologies of the produced DT ferrites after the roughing and finishing stages. After roughing, the structure presented with more martensite (untransformed austenite) packages and ferrite in the form of films or blocks between the martensite (untransformed austenite) laths; see Figure 12a. After the fifth finishing pass, the morphology of the structure predominantly comprised polygonal ferrite and small packages of martensite (untransformed austenite).
To reveal the textural evolution of the torsion-processed samples after the roughing and finishing stages in the applied thermomechanical process simulation, ODF analyses were performed. As the results were generated from torsion which involves shear, the ODFs were plotted with triclinic symmetry. It was then verified that the material presented a texture with monoclinic symmetry 0–180° that was further mirrored at 180–360°. It has been reported that the orientation distribution for BCC metals after torsion tests is characterized by two partial characteristic fibers: {hkl} <111> and {110} <uvw> [37,38,39]. For reference and comparison, the positions of the main ideal torsional texture components in the BCC metals in the φ2 = 45° ODF section are displayed in Figure 13, and their respective textures can be consulted in the literature [37,38].
The ODF sections of the tested samples after the R5 and F5 passes, based on EBSD data, are shown in Figure 14a,b, respectively. After the roughing simulation, the preferable crystallographic orientation presented relative moderate intensities around the main components J ( 110 ) [ 1 1 ¯ 2 ] , J ¯ ( 1 ¯ 1 ¯ 0 ) [ 1 ¯ 1 2 ¯ ] and a lower intensity around component F ( 110 ) [ 001 ] ; see Figure 14a. It has been shown that the two J components formed first at lower strains, and consequently, showed the lowest rotation rates [37].
As the strain accumulation increased until the last pass of the finishing part of the simulation, the components J ( 110 ) [ 1 1 ¯ 2 ] and J ¯ ( 1 ¯ 1 ¯ 0 ) [ 1 ¯ 1 2 ¯ ] became more intense, and shear components D 1 ( 1 ¯ 1 ¯ 2 ) [ 111 ] and D 2 ( 11 2 ¯ ) [ 111 ] were developed with lower and higher intensities, respectively. Furthermore, the intensity of F ( 110 ) [ 001 ] increased due to the higher strain accumulation. These results are in accordance with those reported by Baczynski and Jonas [38]. After the last pass, the results indicated that the hot rolling process by means of torsion simulation led to the development of typical shear textures in the API X80 steel, showing that dynamic transformation does not harm the crystallographic structure of the material [40].

4. Conclusions

In the present research, an API X80 steel was subjected to a specific plate rolling simulation process in a hot torsion machine. The main goal was to investigate the influence of the roughing and finishing passes under a continuous cooling condition at a fixed duration between each pass of 10 s, which is close to that used in realistic industrial processes. The performance and analysis of this thermomechanical process simulation led to the following conclusions:
  • The plastic flow curve and MFS revealed the occurrence of dynamic softening during the thermomechanical processing of the studied material. This softening was noticed by the reduction in the peaks of the stresses as the strain accumulation increased, favoring the DT of ferrite from the work hardened austenite plus dynamic recovery and recrystallization.
  • The critical strains for the onset of dynamic transformation showed a decrease in the values as the pass number increased for both the roughing and finishing stages. This reduction was associated with the work hardening of the deformed austenite which increased the driving force of the phase transformation, leading to lower strains initiating the DT.
  • The calculated CCT diagrams constitute an excellent tool to confirm that the employed quenching in this simulation was fast enough to avoid the formation of ferrite by cooling and, therefore, the ferritic phase present in the microstructure of the samples was generated by DT during strain above the Ae3 temperature.
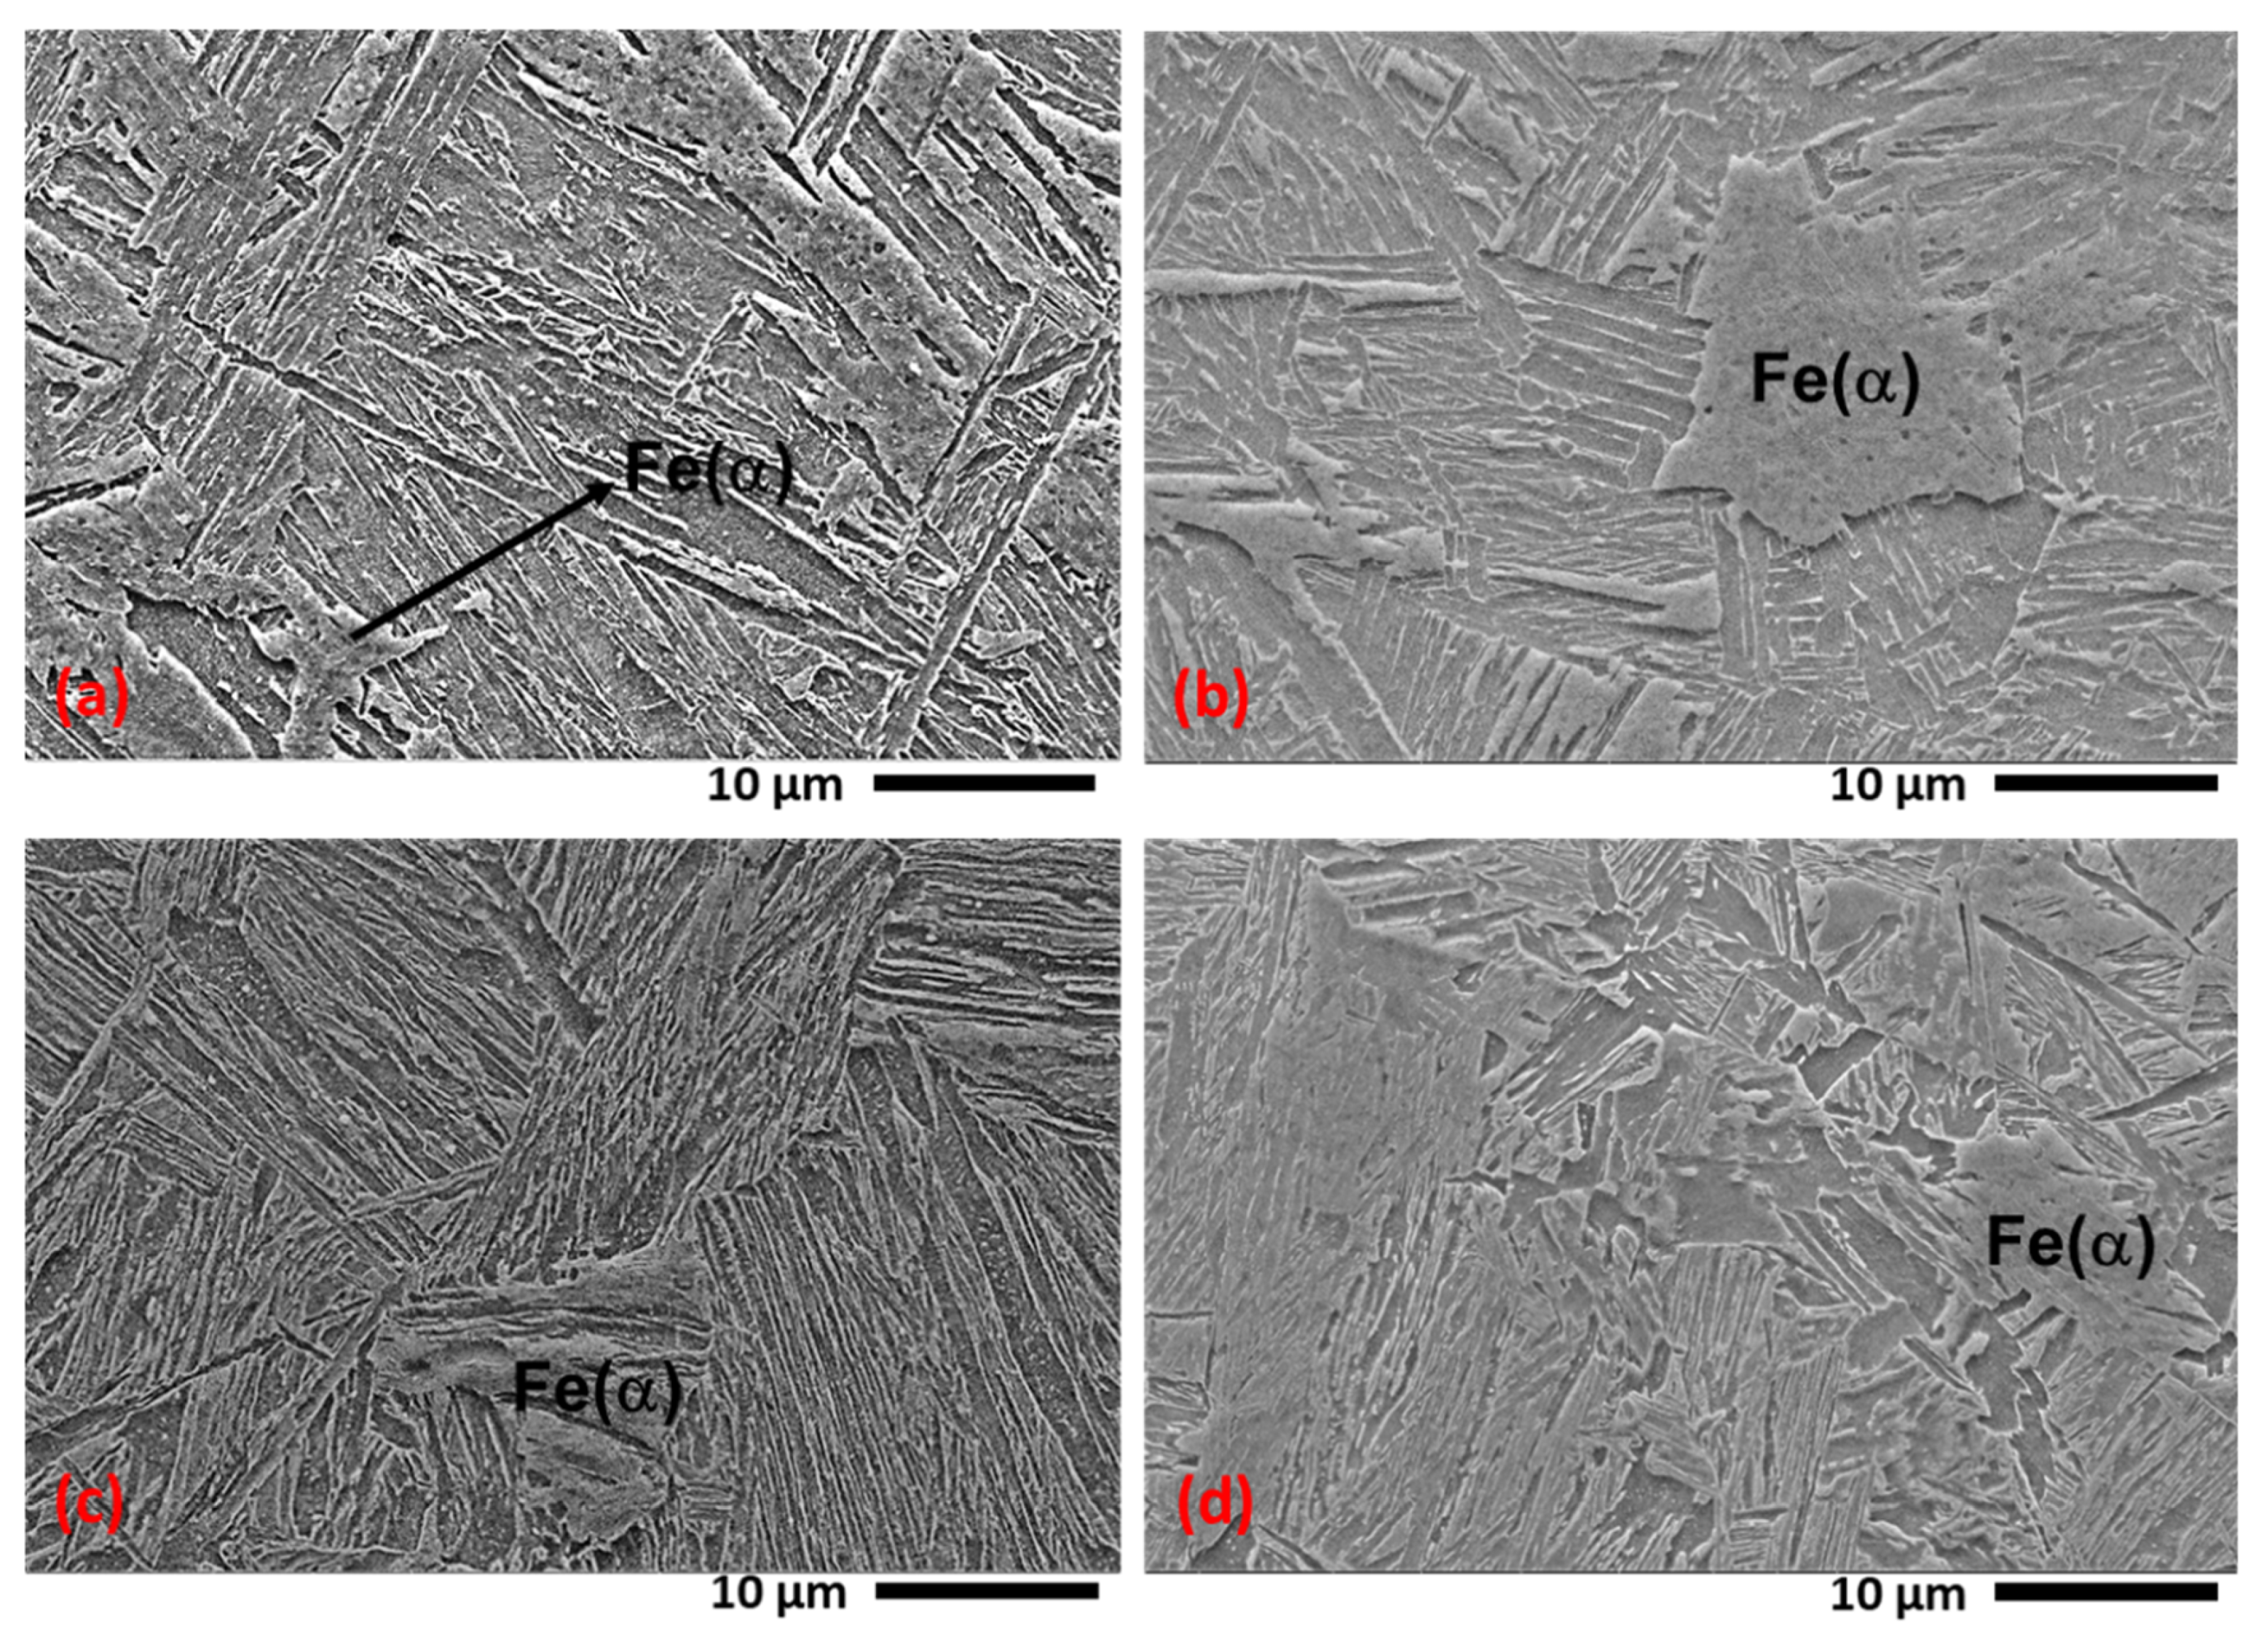
  • The microstructural analysis confirmed that DT ferrite was formed in a lower volume fraction from the first roughing pass and increased as the pass number increased. The SEM analysis confirmed the presence of coalesced polygonal structures of ferrite in the roughing and finishing stages of the thermomechanical process.
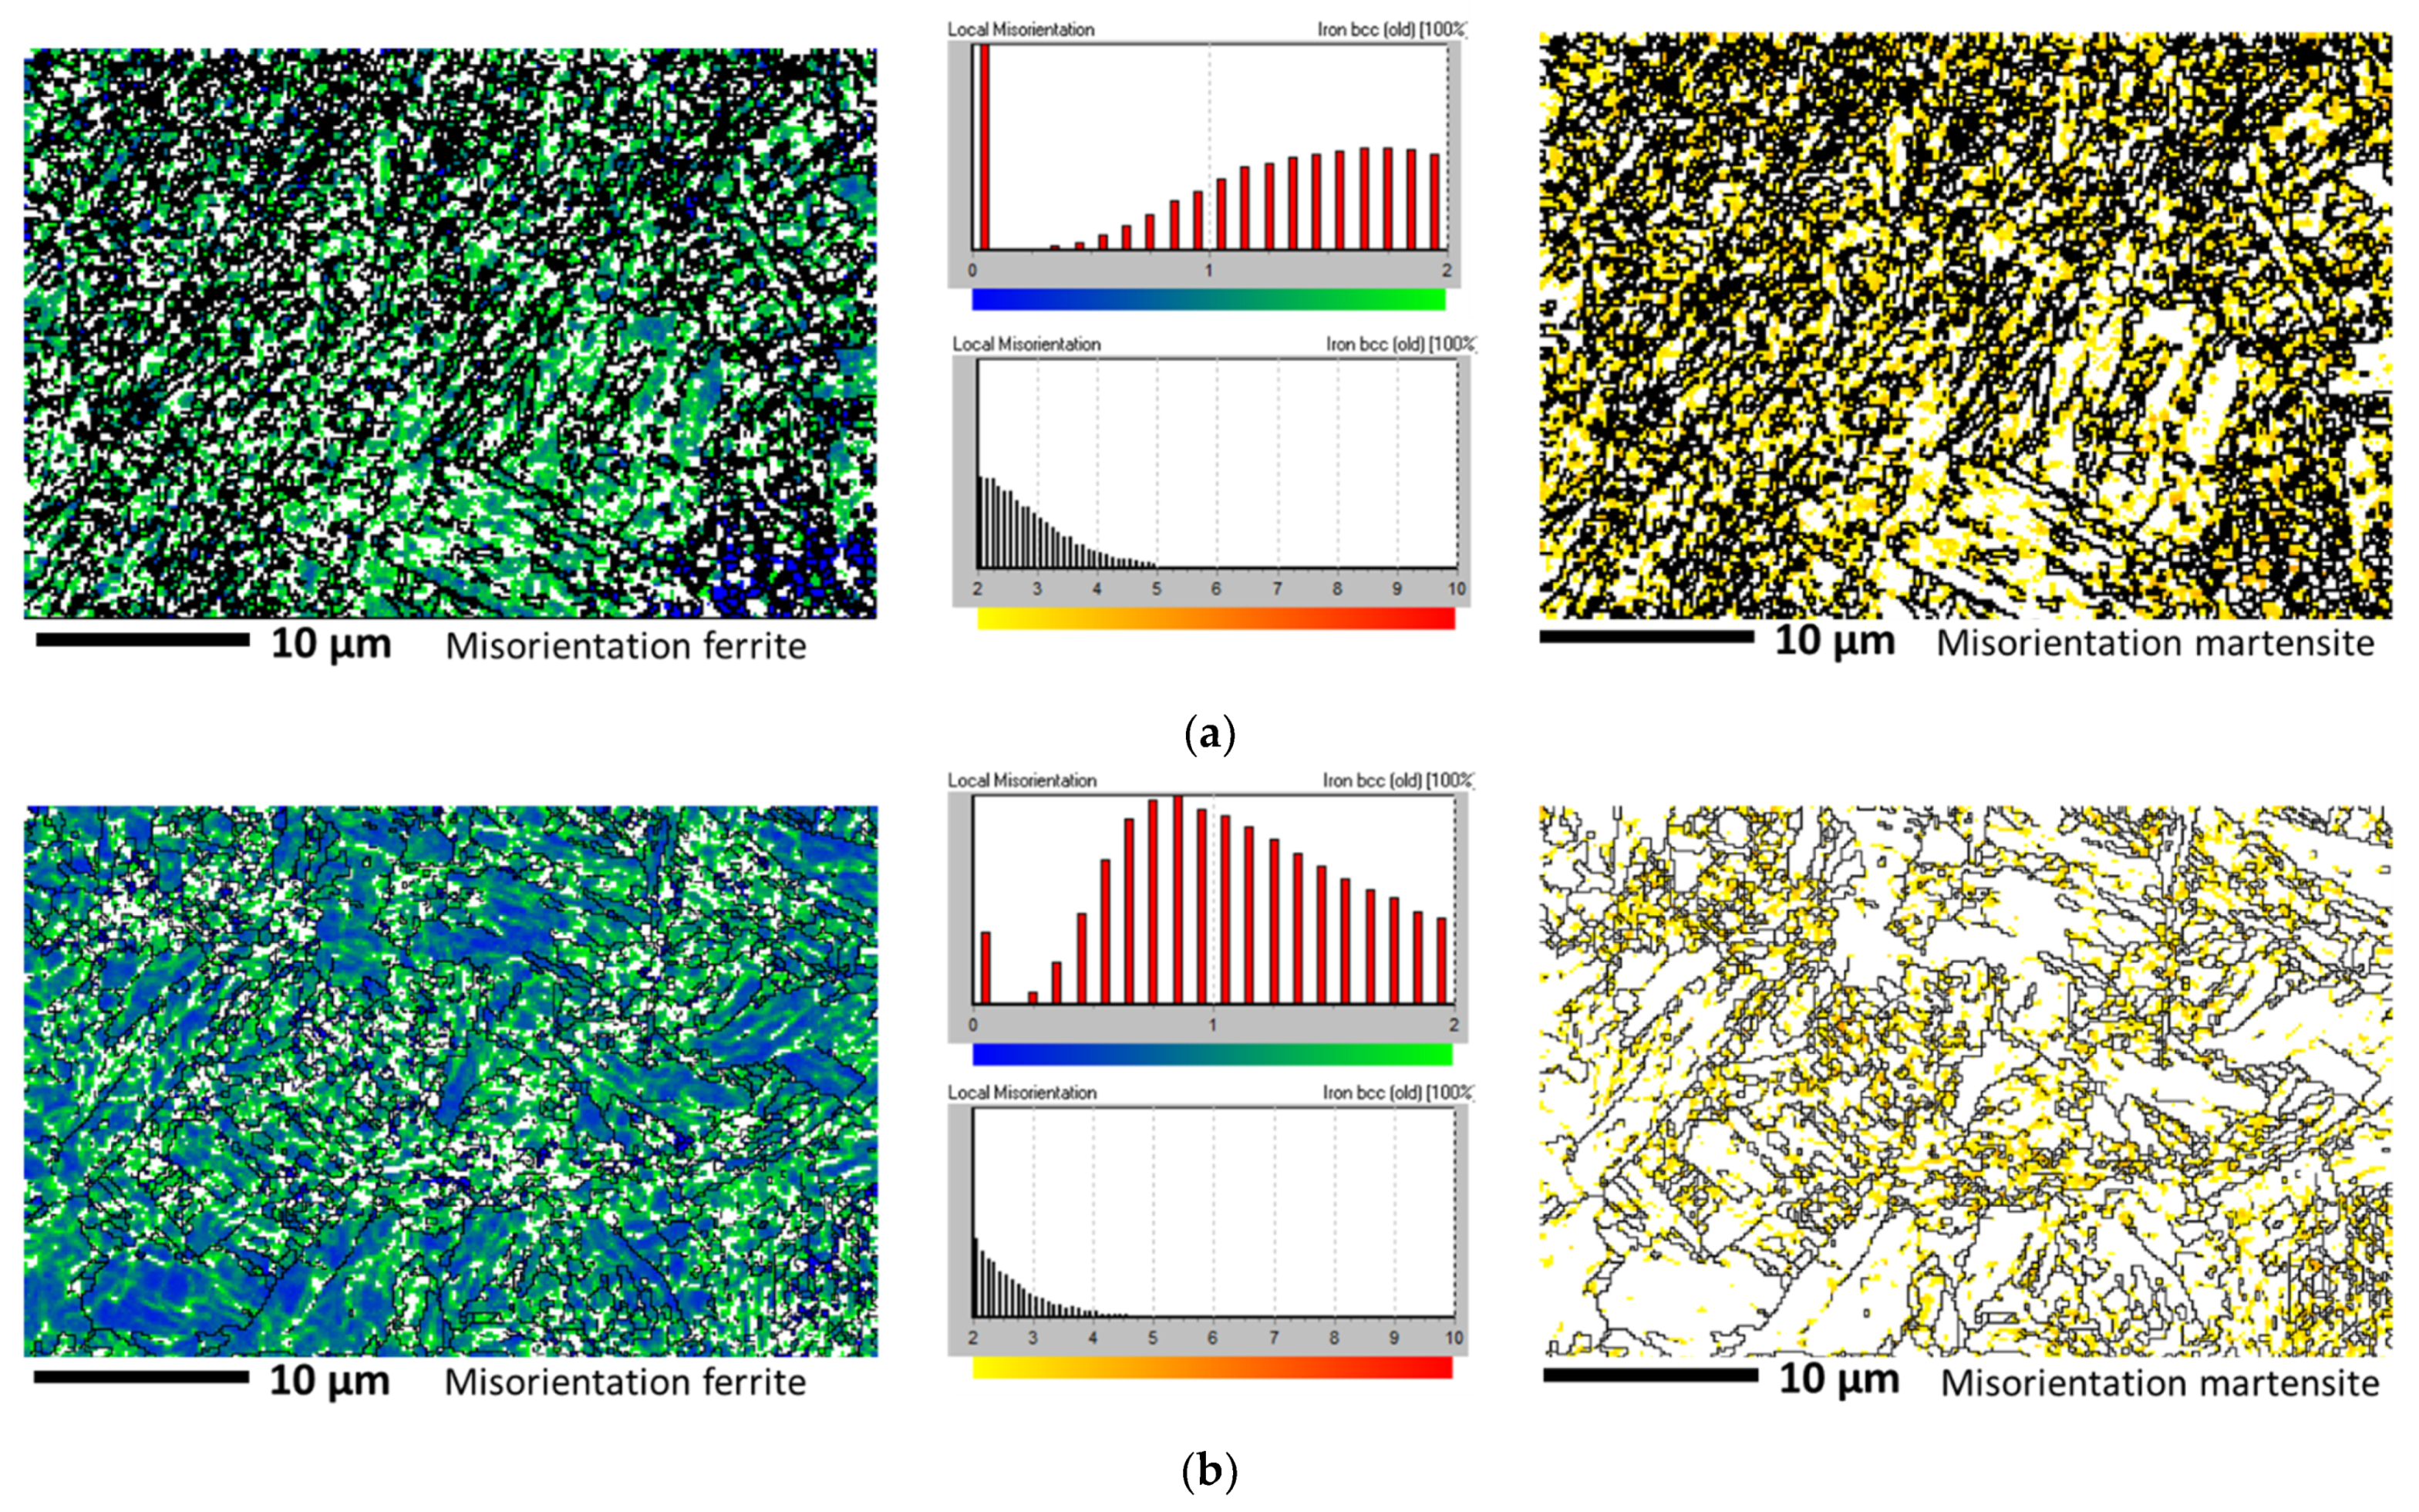
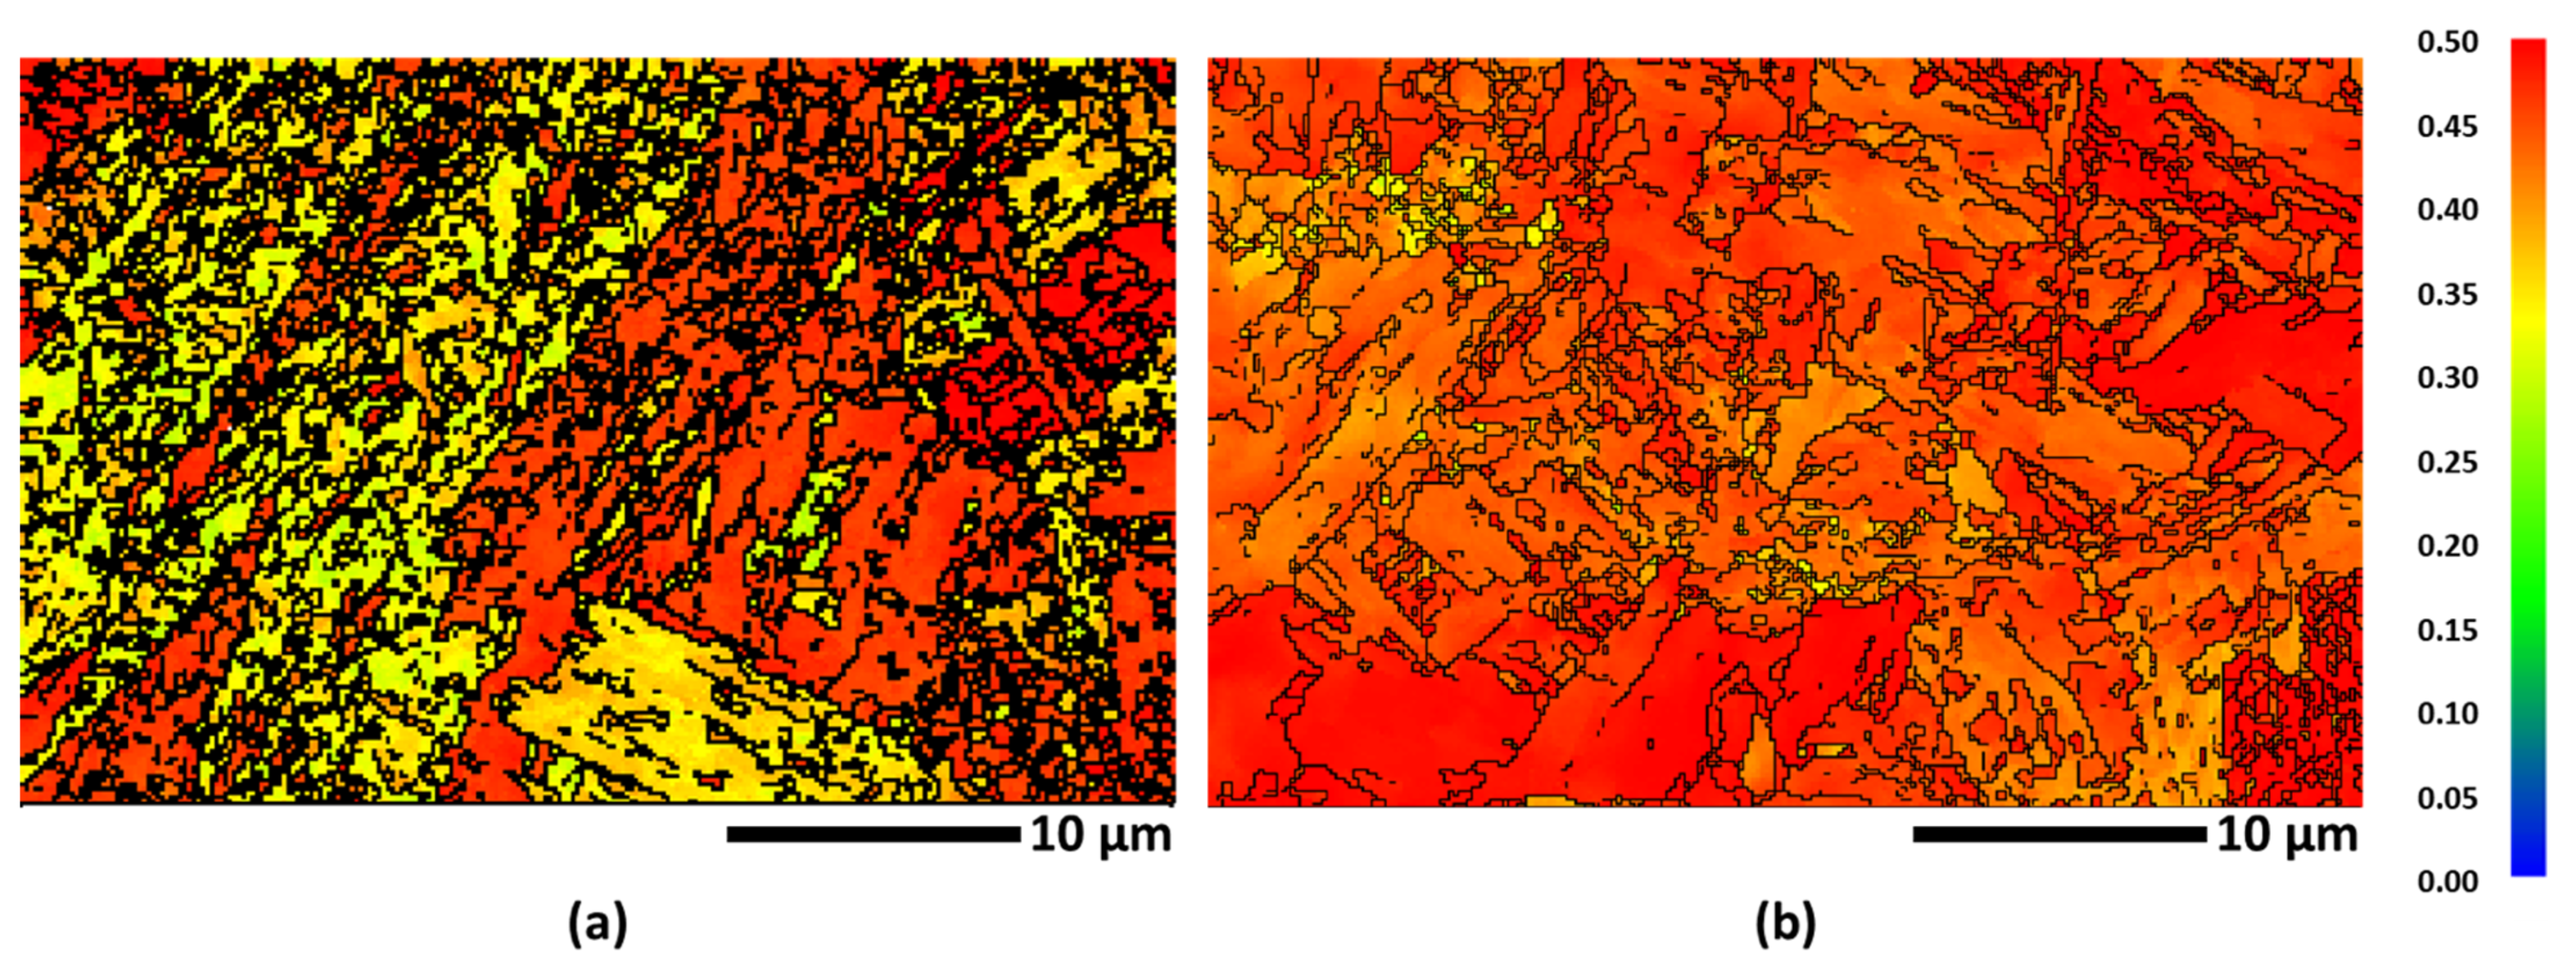
  • The EBSD results confirmed, by means of KAM analyses, that volume fraction of low angle misorientation related to ferrite increased from the roughing to the finishing passes. Schmid factor maps revealed that the after the last pass of the simulation, the grains were better oriented due to DT.
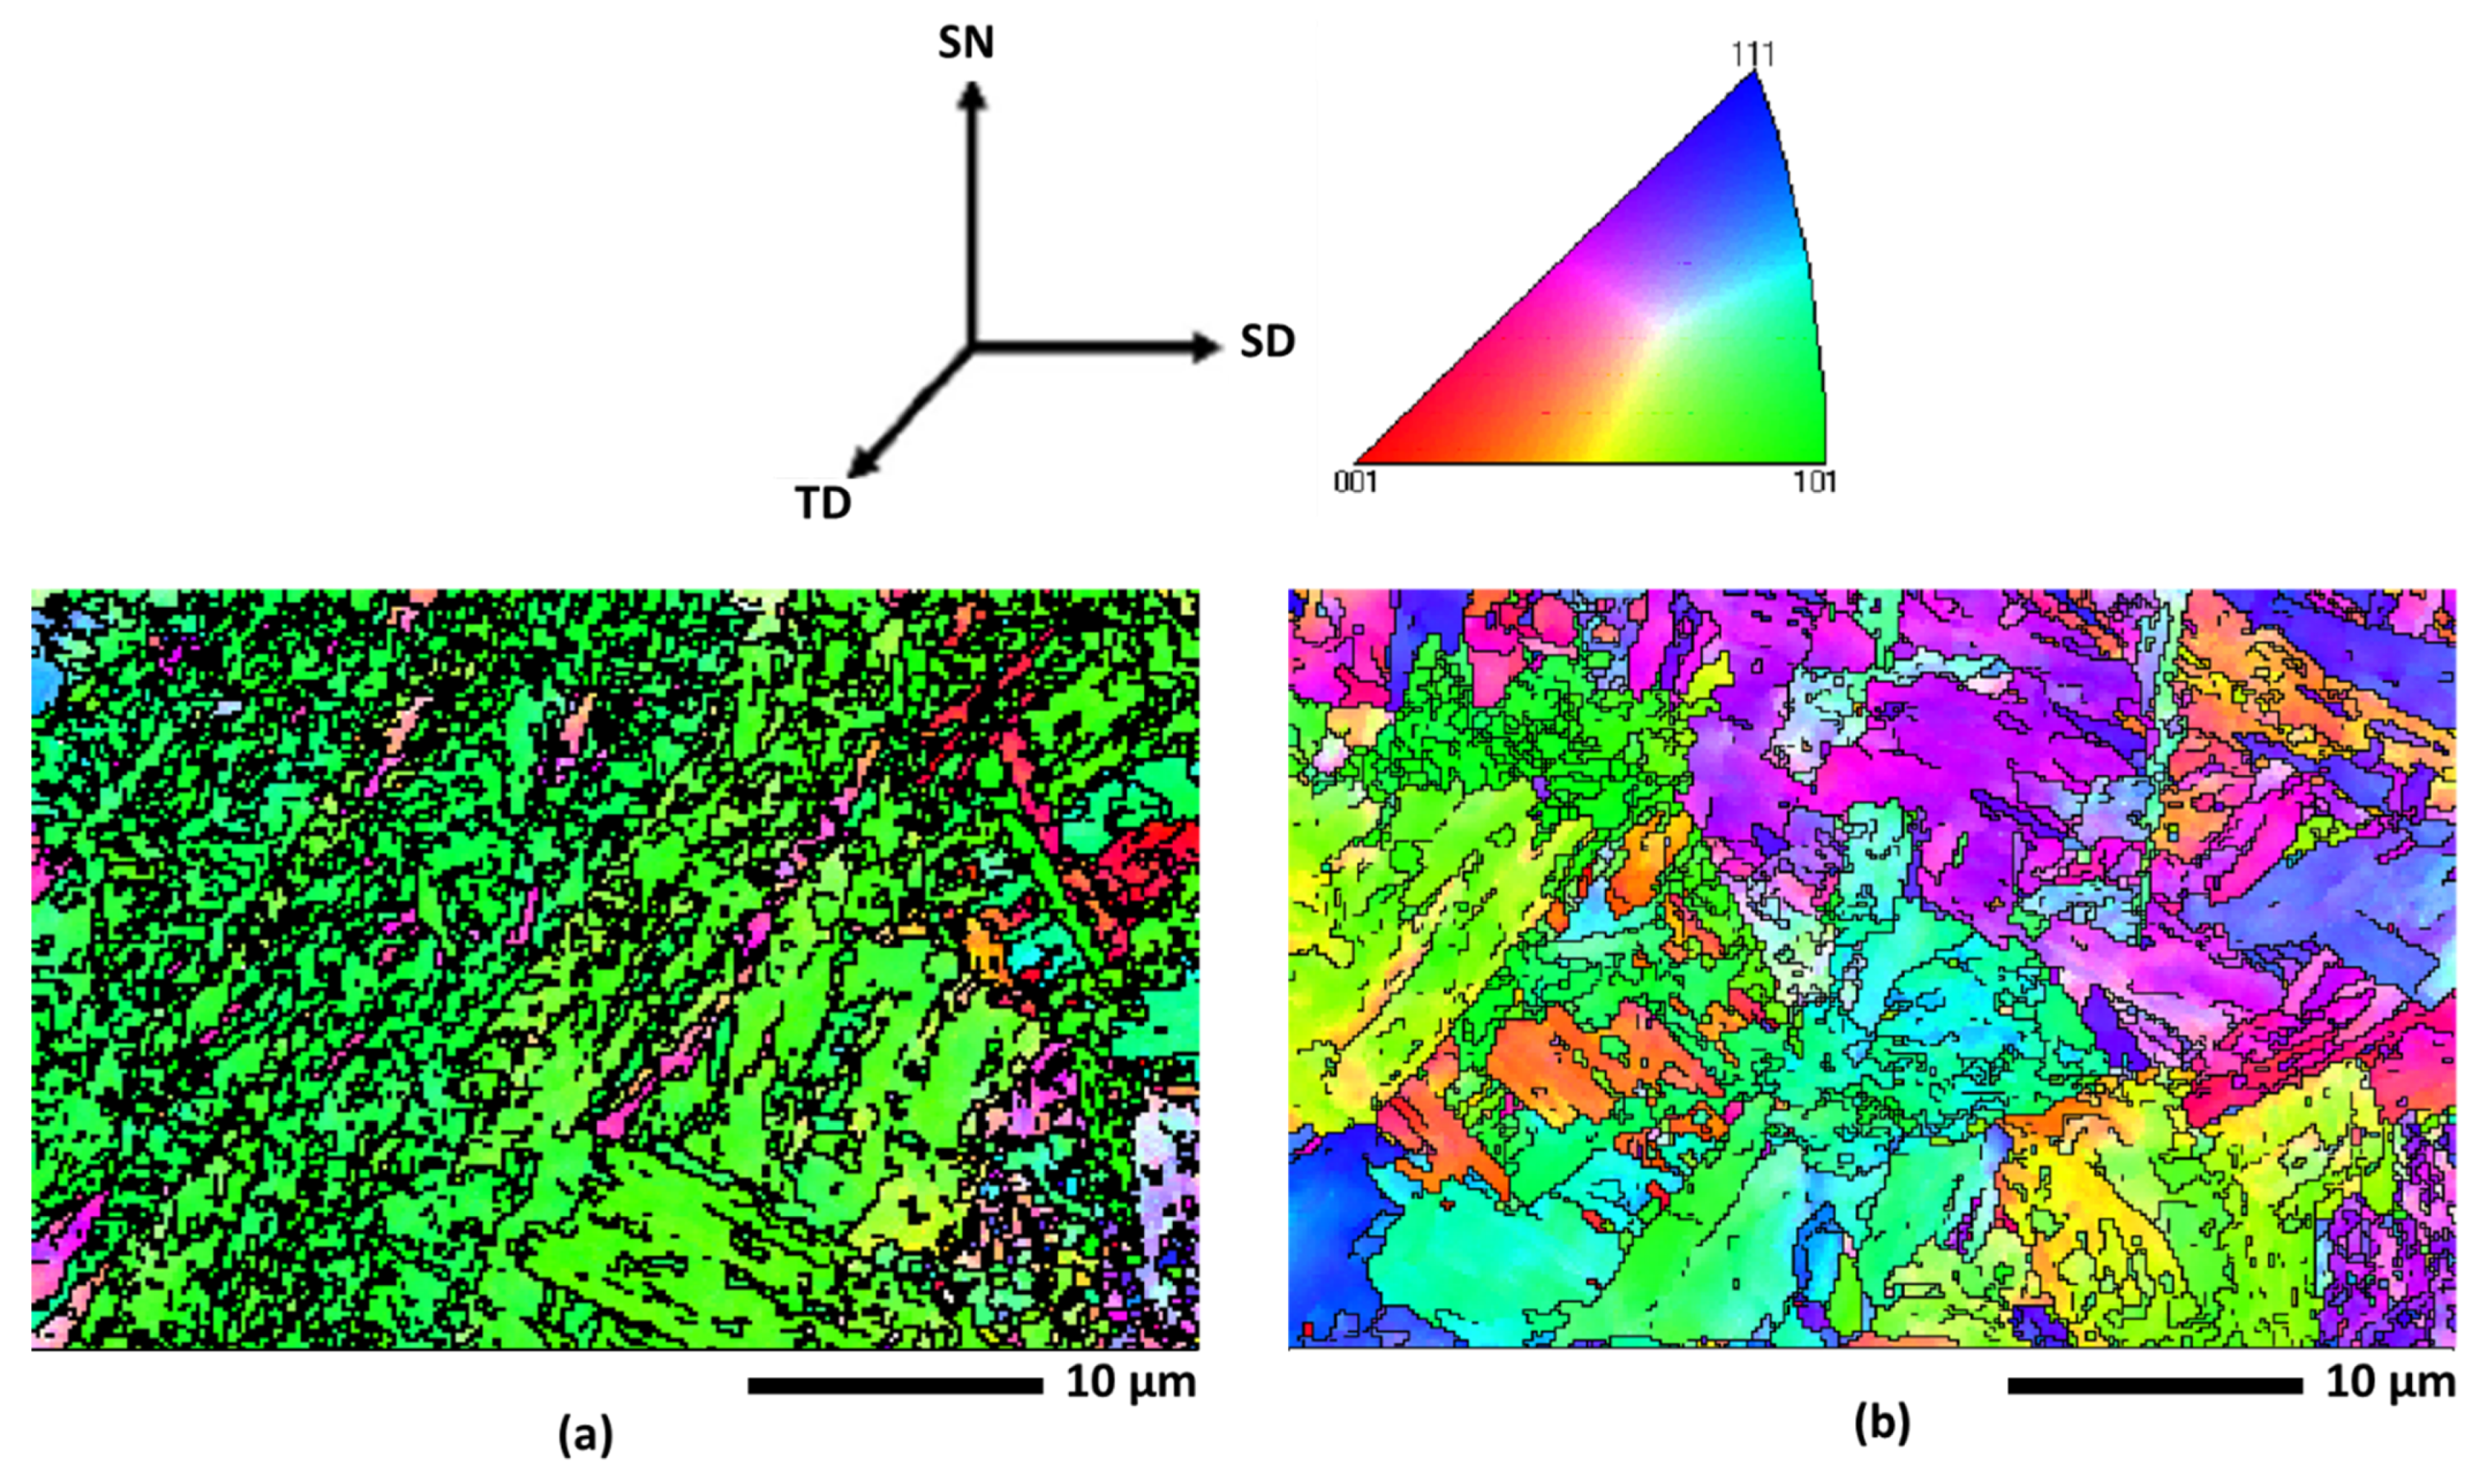
  • OIM and ODF showed that the predominant morphology was that of polygonal ferrite and small packages of martensite (untransformed austenite), and the final texture of the API X80 steel after the simulation was the result of shear from the torsional deformation, which is considered adequate for the final properties of the metal.

Author Contributions

Conceptualization, F.R.d.S.M., J.C.F., S.F.R. and C.A.J.; methodology, F.R.d.S.M., J.C.F., M.V.G.R., M.N.d.S.L., R.d.C.P.L., R.C.d.S. and S.F.R.; software, M.N.d.S.L., H.F.G.d.A., F.S. and E.S.S.; validation, G.S.R., E.S.S., R.C.d.S., H.F.G.d.A., C.A.J., F.S. and S.F.R.; formal analysis, F.R.d.S.M., J.C.F., M.V.G.R., M.N.d.S.L., R.d.C.P.L. and S.F.R.; investigation, F.R.d.S.M., J.C.F., E.S.S., G.S.R., F.S., H.F.G.d.A. and S.F.R.; resources, G.S.R., H.F.G.d.A., C.A.J. and S.F.R.; data curation, M.N.d.S.L., R.d.C.P.L., F.S., R.C.d.S. and C.A.J.; writing—original draft preparation, F.R.d.S.M., J.C.F., M.V.G.R. and R.C.d.S.; writing—review and editing, E.S.S., G.S.R., H.F.G.d.A., F.S., C.A.J. and S.F.R.; supervision, G.S.R., F.S. and S.F.R.; project administration, G.S.R., H.F.G.d.A. and S.F.R.; funding acquisition, G.S.R. and S.F.R. All authors have read and agreed to the published version of the manuscript.

Funding

This research was funded by Research and Support Foundation of Maranhão (FAPEMA), grant number 01006/19 and Brazilian National Council for Scientific and Technological Development (CNPq), grant numbers 403678/2021-8 and 302893/2021-0.

Institutional Review Board Statement

Not applicable.

Informed Consent Statement

Not applicable.

Data Availability Statement

Not applicable.

Acknowledgments

The authors acknowledge with gratitude the team of the Materials Characterization Laboratory (LACAM) and Analytical Central from Federal University of Ceará (UFC) and the PRPGI-IFMA for their unrestricted support.

Conflicts of Interest

The authors declare no conflict of interest.

References

  1. Grewal, R.; Aranas, C.; Chadha, K.; Shahriari, D.; Jahazi, M.; Jonas, J.J. Formation of Widmastatten ferrite at very high temperatures in the austenite phase field. Acta Mater. 2016, 109, 23–31. [Google Scholar] [CrossRef]
  2. Aranas, C.; Jung, I.H.; Yue, S.; Rodrigues, S.F.; Jonas, J.J. A metastable phase diagram for the dynamic transformation of austenite at temperatures above the Ae3. Int. J. Mater. Res. 2016, 107, 881–886. [Google Scholar] [CrossRef]
  3. Rodrigues, S.F.; Siciliano, F.; Aranas, C.; Silva, E.S.; Reis, G.S.; Jahazi, M.; Jonas, J.J. Dynamic phase transformation behavior of a Nb-microalloyed steel during roughing passes at temperatures above the Ae3. Metals 2019, 9, 334. [Google Scholar] [CrossRef] [Green Version]
  4. Ghosh, C.; Basabe, V.V.; Jonas, J.J.; Kim, Y.; Jung, I.; Yue, S. The dynamic transformation of deformed austenite at temperatures above the Ae3. Acta Mater. 2013, 61, 2348–2362. [Google Scholar] [CrossRef] [Green Version]
  5. Ghosh, C.; Aranas, C.; Jonas, J.J. Dynamic transformation of deformed austenite at temperatures above the Ae3. Prog. Mater. Sci. 2016, 82, 151–233. [Google Scholar] [CrossRef] [Green Version]
  6. Palhano, H.B.; Aranas, C.; Rodrigues, S.F.; Silva, E.S.; Reis, G.S.; Miranda, E.J.P., Jr.; Siciliano, F.; Jonas, J.J. Strain-induced ferrite formation during Steckel mill simulations with varying roughing pass schedules. Metals 2019, 9, 814. [Google Scholar] [CrossRef] [Green Version]
  7. Matsumura, Y.; Yada, H. Evolution deformation of ultrafine-grained ferrite in hot successive deformation. Trans. Iron Steel Inst. Jpn. 1987, 27, 492–498. [Google Scholar] [CrossRef]
  8. Yada, H.; Matsumura, Y.; Senuma, T. International conference on physical metallurgy of thermomechanical processing of steels and other metals Thermec ’88. In Proceedings of the 1st Conference Physical Metallurgy of Thermomechanical Processing of Steels and Other Metals, Tokyo, Japan, 6–10 June 1988; Volume 2, pp. 200–207. [Google Scholar]
  9. Yada, H.; Li, C.M.; Yamagata, H. Dynamic γ→α transformation during hot deformation in Iron-Nickel-Carbon alloys. ISIJ Int. 2000, 40, 200–206. [Google Scholar] [CrossRef] [Green Version]
  10. Basabe, V.V.; Jonas, J.J. The ferrite transformation in hot deformed 0.036% Nb austenite at temperature above the Ae3. ISIJ Int. 2010, 50, 1185–1192. [Google Scholar] [CrossRef] [Green Version]
  11. Basabe, V.V.; Jonas, J.J.; Ghosh, C. Formation of Widmastätten ferrite in a 0.036% Nb low carbon steel at temperatures above the Ae3. Steel Res. Int. 2013, 85, 8–15. [Google Scholar] [CrossRef]
  12. Aranas, C.; Rodrigues, S.F.; Fall, A.; Jahazi, M.; Jonas, J. Determination of the critical stress associated with dynamic phase transformation in steels by means of free energy method. Metals 2018, 8, 360. [Google Scholar] [CrossRef] [Green Version]
  13. Aranas, C.; Siciliano, F.; Rodrigues, S.F.; Pasco, J.; Miranda, E.J.P.; Jonas, J.J. Thermomechanical and thermodynamic behavior of deformed austenite in four different steel grades. J. Mater. Res. Technol. 2021, 11, 1911–1916. [Google Scholar] [CrossRef]
  14. Rodrigues, S.F.; Siciliano, F.; Aranas, C., Jr.; Silva, E.S.; Reis, G.S.; Jonas, J.J. High-temperature deformation behavior of high-Nb microalloyed steel during plate rolling simulation. Tecnol. Metal. Mater. Min. 2020, 17, 105–111. [Google Scholar] [CrossRef]
  15. Siciliano, F.; Rodrigues, S.F.; Aranas, C., Jr.; Jonas, J.J. The dynamic transformation of ferrite above the Ae3 and the consequences on hot rolling of steels. Tecnol. Metal. Mater. Min. 2020, 17, 90–95. [Google Scholar] [CrossRef]
  16. Ferreira, J.C.; Machado, F.R.S.; Aranas, C.; Siciliano, F.; Pasco, J.; Reis, G.S.; Miranda, E.J.P.; Paiva, A.E.M.; Rodrigues, S.F.R. Physical simulation based on dynamic transformation under hot plate rolling of a Nb-microalloyed steel. Front. Mater. 2021, 8, 319. [Google Scholar] [CrossRef]
  17. Carneiro, T.B.; Rodrigues, S.F.; Aranas, C., Jr.; Siciliano, F.; Silva, E.S.; Reis, G.S.; Miranda, E.J.P., Jr.; Leal, V.S.; Jahazi, M.; Jonas, J.J. Retransformation of dynamically induced ferrite during physical simulation of Steckel mill hot rolling. J. Mater. Res. Tech. 2020, 9, 10254–10264. [Google Scholar] [CrossRef]
  18. Medes-Fonseca, N.; Rodrigues, S.F.; Guo, B.; Jonas, J.J. Dynamic transformation during the simulated hot rolling of an API-X80 steel. Steel Res. Int. 2019, 90, 1900091. [Google Scholar] [CrossRef]
  19. Rodrigues, S.F.; Aranas, C.; Jonas, J.J. Retransformation behavior of dynamically transformed ferrite during the simulated plate rolling of a low C and an X70 Nb steel. ISIJ Int. 2017, 57, 929–936. [Google Scholar] [CrossRef] [Green Version]
  20. Aranas, C.; Wang, T.; Jonas, J.J. Effect of interpass time on the dynamic transformation of a plain C-Mn and Nb-microalloyed steel. ISIJ Int. 2015, 55, 647–654. [Google Scholar] [CrossRef] [Green Version]
  21. Aranas, C.; Rodrigues, S.F.; Siciliano, F.; Jonas, J. In-situ X-ray diffraction evidence of dynamic transformation of austenite to ferrite during hot compression test in the single austenite phase field. Scr. Mater. 2020, 177, 86–90. [Google Scholar] [CrossRef]
  22. Rodrigues, S.F.; Aranas, C.; Wang, T.; Jonas, J.J. Dynamic transformation of an X70 steel under plate rolling conditions. ISIJ Int. 2017, 57, 162–169. [Google Scholar] [CrossRef] [Green Version]
  23. Beausir, B.; Fundenberger, J.-J. Analysis Tools for Electron and X-ray Diffraction. 2017. Available online: www.atex-software.eu (accessed on 20 June 2022).
  24. Rodrigues, S.F.; Aranas, C.; Sun, B.; Siciliano, F.; Yue, S.; Jonas, J.J. Effect of grain size and residual strain on the dynamic transformation of austenite under plate rolling conditions. Steel Res. Int. 2018, 89, 1700547. [Google Scholar] [CrossRef]
  25. Mirzadeh, H.; Najafizadeh, A. Prediction of the critical conditions for initiation of dynamic recrystallization. Mater. Des. 2010, 31, 1174–1179. [Google Scholar] [CrossRef]
  26. Zhao, L.; Park, N.; Tian, Y.; Shibata, A.; Tsuji, N. Combination of dynamic transformation and dynamic recrystallization for realizing ultrafine-grained steels with superior mechanical properties. Sci. Rep. 2016, 6, 39127. [Google Scholar] [CrossRef] [Green Version]
  27. Park, N.; Shibata, A.; Terada, D.; Tsuji, N. Flow stress analysis for determining the critical condition of dynamic ferrite transformation in 6Ni-0.1C steel. Acta Mater. 2013, 61, 163–173. [Google Scholar] [CrossRef]
  28. Xiong, Z.P.; Saleh, A.A.; Kostryzhev, A.G.; Pereloma, E.V. Strain-induced ferrite formation and its effect on mechanical properties of a dual phase steel produced using laboratory simulated strip casting. J. Alloys Compd. 2017, 721, 291–306. [Google Scholar] [CrossRef] [Green Version]
  29. Beladi, H.; Kelly, G.L.; Shokouchi, A.; Hodgson, P.D. The evolution of ultrafine ferrite formation through dynamic strain-induced transformation. Mater. Sci. Eng. A 2004, 371, 343–352. [Google Scholar] [CrossRef]
  30. Momeni, A.; Dehghani, K.; Ebrahimi, G.R. Modeling the initiation of dynamic recrystallization using a dynamic recovery model. J. Alloys Compd. 2011, 509, 9387–9393. [Google Scholar] [CrossRef]
  31. Aranas, C.; Jonas, J.J. Effect of Mn and Si on dynamic transformation of austenite above the Ae3 temperature. Acta Mater. 2015, 82, 1–10. [Google Scholar] [CrossRef]
  32. Rodrigues, S.F.; Aranas, C.; Jonas, J.J. Dynamic transformation during the simulated plate rolling of a 0.09% Nb steel. ISIJ Int. 2017, 57, 1102–1111. [Google Scholar] [CrossRef] [Green Version]
  33. Poliak, E.I.; Jonas, J.J. A one-parameter approach to determining the critical conditions for the initiation of dynamic recrystallization. Acta Mater. 1996, 44, 127–136. [Google Scholar] [CrossRef]
  34. Chadha, K.; Aranas, C., Jr.; Shahriari, D.; Jahazi, M.; Spray, J.G. The effect of retained work hardening on the driving force for dynamic transformation. Metal. Mater. Trans. A 2020, 51, 5617–5622. [Google Scholar] [CrossRef]
  35. Chadha, K.; Ahmed, Z.; Aranas, C., Jr.; Shahriari, D.; Jahazi, M. Influence of strain rate on dynamic transformation of austenite in an as-cast medium-carbon low-alloy steel. Materialia 2018, 1, 155–167. [Google Scholar] [CrossRef]
  36. Echeverri, E.A.A.; Nishikawa, A.S.; Masoumi, M.; Pereira, H.B.; Marulanda, N.G.; Rossy, A.M.; Goldenstein, H.; Tschiptschin, A.P. In Situ synchrotron X-ray diffraction and microstructural studies on cold and hot stamping combined with quenching & partitioning processing for development of third-generation advanced high strength steels. Metals 2022, 12, 174. [Google Scholar] [CrossRef]
  37. Li, S.; Beyerlein, I.J.; Bourke, M.A.M. Texture formation during equal channel angular extrusion of fcc and bcc materials: Comparison with simple shear. Mater. Sci. Eng. A 2005, 394, 66–77. [Google Scholar] [CrossRef]
  38. Baczynski, J.; Jonas, J.J. Texture development during the torsion testing of α-iron and two IF steels. Acta Mater. 1996, 44, 4273–4288. [Google Scholar] [CrossRef]
  39. Bacroix, B.; Hu, Z. Texture evolution induced by strain path changes in low carbon steel sheets. Metal. Mater. Trans. A 1995, 26, 601–613. [Google Scholar] [CrossRef]
  40. Duan, J.; Wen, H.; Zhou, C.; Islamgaliev, R.; Li, X. Evolution of microstructure and texture during annealing in a high-pressure torsion processed Fe-9Cr alloy. Materialia 2019, 6, 100349. [Google Scholar] [CrossRef]
Figure 1. Thermomechanical schedule of continuous cooling process used for the plate rolling simulations of the API X80 steel by means of torsion testing. All simulations were conducted above the Ae3 temperature.
Metals 12 01239 g001
Figure 2. Flow curves of the API X80 steel samples subjected to 10 deformation passes in the thermomechanical simulation. The 5 roughing and 5 finishing passes were all conducted above the Ae3 temperature.
Metals 12 01239 g002
Figure 3. MFS evolution obtained from the plastic flow curves presented in Figure 2. The MFSs increased from the first to the second pass of the roughing stage and sixth to the seventh in the finishing passes, followed by a softening in the succeeding passes for both regions, which suggested the formation of DT ferrite during each application of strain.
Metals 12 01239 g003
Figure 4. Graphs of (−dθ/dσ) versus (σ) were used to identify the minima related to the onsets of dynamic transformation (DT) and dynamic recrystallization (DRX). The specimens associated with the (a) rouging and (b) finishing stages of the thermomechanical simulation are presented.
Metals 12 01239 g004
Figure 5. Dependence of the critical strains for the onset of DT and DRX on the pass number related to the roughing and finishing stages. Here, the first finishing passes of both roughing and finishing simulations always display the highest critical strain; this critical value is reduced with further deformations.
Metals 12 01239 g005
Figure 6. Calculated continuous cooling transformation (CCT) diagrams of the API X80 quenched from (a) 1100 °C with a grain size of 75 μm; (b) 1060 °C with a grain size of 60 μm; (c) 1020 °C with a grain size of 35 μm; (d) 960 °C with a grain size of 53 μm; (e) 930 °C with a grain size of 31 μm; and (f) 900 °C with a grain size of 17 μm. All simulation was conducted above the Ae3 temperature.
Metals 12 01239 g006
Figure 7. Optical microstructures of the API X80 steel subjected to the thermomechanical simulation and fast quenching. The samples were quenched immediately after the (a) R1, (b) R3 and (c) R5 pass of the roughing part and (d) F1, (e) F3 and (f) F5 pass of the finishing stage. Bright regions are DT ferrite while dark regions are martensite (prior austenite).
Metals 12 01239 g007
Figure 8. The cumulative volume fraction of formed ferrite with the pass number after roughing passes and before and after the finishing passes. More ferrite is produced as the pass number increases, while different amounts retransform into austenite during the time between passes.
Metals 12 01239 g008
Figure 9. SEM images of the specimens subjected to the torsion simulation and transversally sectioned after the (a) first and (b) fifth passes of the roughing stage and after the (c) first and (d) fifth strains of the finishing part of the thermomechanical simulation. The pictures show the presence of ferrite (mostly in polygonal form) and martensite (prior austenite).
Metals 12 01239 g009
Figure 10. EBSD Kernel Average Misorientation (KAM) maps of specimens quenched right after the (a) last roughing pass and (b) last finishing pass. A misorientation <2° regarding ferrite is separated from the 2° ≤ θ ≤ 5°, which may be associated with martensite in both situations.
Metals 12 01239 g010
Figure 11. Schmid factor maps of the samples quenched right after the (a) last roughing pass and (b) last finishing pass. The last pass of the simulation presented a higher fraction of softer grains (higher Schmid factor) while the fifth pass of the roughing stage showed harder grains with a lower Schmid factor value.
Metals 12 01239 g011
Figure 12. The orientation image maps (OIMs) of the deformed specimens after strain accumulation of (a) 1.1 (R5 pass) and (b) 2.1 (F5 pass) obtained by EBSD. More polygonal ferrite was observed after the last pass of the simulation.
Metals 12 01239 g012
Figure 13. The adapted Orientation Distribution Function (ODF) pattern map for specimens that underwent torsion tests and their respective textures and Euler angles positions.
Metals 12 01239 g013
Figure 14. The Orientation Distribution Functions (ODF) at φ2 = 45° displaying the torsion texture of the BCC metals determined from the (a) final roughing passes and (b) final finishing passes for the API X80 steel.
Metals 12 01239 g014
Table 1. Chemical composition (mass%) and equilibrium transformation temperature (°C).
CMnSiCrNiVMo + Nb + Ti + AlPSAe3
0.1121.730.300.150.0230.0320.1110.00840.004830 °C
Publisher’s Note: MDPI stays neutral with regard to jurisdictional claims in published maps and institutional affiliations.

