Article

Relation between Mechanical Milling Parameters in Phase Transformation and Oxygen Content in Ti–Nb–Mo Powders for Posterior Sintering

by
Eber de Santi Gouvea
1,
Mariana Correa Rossi
1,2,*,
Angel Vicente Escuder
1,
Conrado Ramos Moreira Afonso
2 and
Vicente Amigó Borrás
1
1
Instituto de Tecnología de Materiales, Universitat Politècnica de València, 46022 Valencia, Spain
2
Department of Materials Engineering (DEMa), Universidade Federal de São Carlos (UFSCar), São Carlos 13565-905, SP, Brazil
*
Author to whom correspondence should be addressed.
Metals 2022, 12(8), 1238; https://doi.org/10.3390/met12081238
Submission received: 9 May 2022 / Revised: 13 July 2022 / Accepted: 16 July 2022 / Published: 22 July 2022
(This article belongs to the Special Issue Product Development in Net-Shape Metal Powder Technologies)

Abstract

:
The influence of open vessels during milling for 12, 24, 40 and 60 h on microstructure homogeneity and oxygen content effect in the β Ti–Nb–Mo system microstructure were studied. The β phase increased with longer milling times and the strain hardening on particles was verified at 60 h when agglomeration was greater and was also noticed after 40 h in the continuous mode. Oxygen content dropped slightly until 40 h and increased after 60 h, a result linked with the observed hardening. For 40 h in the continuous mode, the oxygen content was noted near 12 h, 24 h and 40 h with high hardness values. For the sintered parts, the α phase and oxygen content significantly increased in all samples. Microhardness-sintered samples decreased compared to sample powders due to grain growth during the sintering. Bending strength was higher at 60 h with more oxygen and α phase content. After 40 h in the continuous mode, more suitable mechanical properties were reached because hardness and bending strength were closer to bone tissue, which was associated with strain hardening and a small crystallite size.

1. Introduction

Metallic devices for orthopaedic applications are constantly studied and developed, mainly due to inconveniences caused by mechanical incompatibly and cytotoxicity over the years. In other words, the metallic devices used in this field present a high Young’s modulus compared to bone tissue, which promotes weakness and loss of bone around implants due to the stress shielding phenomenon [1]. The majority of these devices are made by elements with allergenic or carcinogenic characteristics that can harm health, such as aluminium, vanadium, chromium, cobalt and nickel [2,3,4,5,6,7]. Along with this problem, the need to produce and develop orthopaedic devices grows every year, as does the prevalence of musculoskeletal disorders, such as osteoarthritis and osteoporosis, in geriatric populations. Finally, the number of joint replacement cases and sport injuries has significantly increased [8].
Ti and Ti alloys generally have adequate properties as biomedical devices, such as mechanical strength, elastic modulus, low susceptibility to corrosion and good biocompatibility [9,10]. For these reasons, the composition of more than 70% of the devices used contains Ti [11,12]. As they are non-toxic, both niobium (Nb) and molybdenum (Mo) are good candidates for synthesis as Ti alloys under suitable conditions and can combine good Young’s modulus [13,14]. In addition, Nb and Mo are effective β phase stabilisers and lower a material’s Young’s modulus under appropriate conditions.
Conventionally, these alloys are prepared by melting techniques in arc furnaces, followed by specific thermo–mechanical treatments for homogenization and ageing, and additional mechanical machining to achieve the required shape. All these processes are performed in a vacuum or inert atmosphere because oxidation drastically damages their properties [15,16,17]. The interest recently shown in adopting new unconventional techniques has been significant, such as powder metallurgy (PM) based on a high-energy ball-milling process. Mechanical alloying (MA) is a solid-state powder metallurgical process capable of processing Ti alloys with homogeneous microstructures and improved mechanical properties compared with conventional powder metallurgy or casting techniques [18,19]. In the past few years, MA has shown a very high potential for synthesising a wide variety of nano and microcrystalline supersaturated solid solutions in the amorphous phase with unique characteristics [20,21,22]. Interdiffusion is an omnipresent but important phenomenon in materials science and engineering processes [23,24,25,26], mainly for developing Ti-based alloys with excellent mechanical properties to obtain a homogeneous β phase Ti alloy with superplastic behaviour by means of the heat treatment schedule, which calls for reliable diffusivity information as a prerequisite [27,28,29]. This phenomenon can be achieved by the MA process because its homogeneity during milling times is better. In general, the milling process significantly influences the properties of particles by increasing the surface area and contributing to the generated rapid diffusivity path [30]. Variation in milling times also influences the properties of metallic powders, such as mechanical properties like microhardness, fracture toughness, yield strength, tensile strength, compressive strength and ductility [31,32,33,34,35]. Additionally, long-term high milling of powders can contribute to increase oxygen content trapped into the microstructure, hampering the allotropic transformation of Ti (α→β) once the oxygen is an α-stabilizator of Ti. Changes in the microstructures of metal powders induced by milling also depend on the applied milling type [36]. According to the molybdenum equivalent (Moeq) calculus, the contents of Nb and Mo can offer good mechanical properties to be used in biomedical applications due to the high β-phase content. The Moeq is used to predict the β phase stability of β-type Ti alloys.
The Moeq calculus was calculated according to the following equation [37]:
Mo eq = [ Mo ] = Mo + Nb 3.6 + Ta 4.5 + W 2 + Cr 0.63 + Mn O .65 + V 1 . + Fe 0.35 + Ni 0.8
Therefore, the Moeq is 15.7%. This work aimed to study the microstructural and physical behaviour of β Ti–35Nb–6Mo powders mechanically alloyed at different times and the influence of oxygen content during the milling process as well as subsequent opening the vessels at each milling time and their effects on sintered parts.

2. Materials and Methods

2.1. Nomenclature of Different Samples Characterised

In order to clarify the characterisation results of the samples during the work, here is an accurate description of specimens.
(1)
Precursor powders: Ti, Nb and Mo powders before the milling process.
(2)
Milled powders: pre-alloyed Ti–Nb–Mo powders for evaluation of particle size, phases, crystallite size and lattice strain and oxygen content.
(3)
Powders embedded in resin: pre-alloyed Ti–Nb–Mo powders embedded in resin for evaluation of microstructure and microhardness.
(4)
Compacted bodies: pre-alloyed Ti–Nb–Mo powders compacted.
(5)
Sintered bodies: compacted bodies after thermal treatment used to evaluate the phases, crystallite size, lattice strain, microstructure, total porosity, oxygen content, microhardness and bending strength.

2.2. Powder Preparation

Elemental powders of Ti (99.7%), Nb (99.8%) and Mo (99.98%) were purchased from Atlantic Equipment Engineers (Upper Saddle River, NJ, USA). The granulometry of the precursors powders of Ti, Nb and Mo was around 45 µm, 1–5 µm and 2–8 µm, respectively. They were weighed in a glove box to obtain 35Nb (wt%) and 6Mo (wt%).
After weighing, powders were mixed with PCA (2% NaCl) for 30 min in a mixing mill. Milling by MA was carried out as follows: the vessels that contained powders were milled for 60 h. For the first 12 h, vessels were opened to verify the microstructure, oxygen content and their microhardness. The same vessels were characterised for the next 24, 40 and 60 h. To compare oxygen contamination whilst opening the vessels, samples were compared to the milling sample after 40 h in the continuous mode. Milling was scheduled to work for 10 min following a 5 min rest period. The milling process was performed at room temperature in a high-energy planetary mill (Retsch-PM 400/2, Asturias, Spain) at 240 rpm. Before the process started, Argon was used to purge vessels 4 times. The proportion of steel balls during milling was 10:1 and balls with a 5 mm radius were used. Then they were compacted at 1000 MPa in cold-pressing universal testing Autograph AG-X plus equipment (Shimadzu, Kyoto, Japan), with a maximal machine load of 100 kN. Then, compacted samples were sintered in a high-vacuum furnace (HVT 15/75/450) (Carbolite®, UK (10−4 mbar) during two cycles. The first cycle was run for 1 h at 800 °C (10 °C/min), and the second lasted 3 h and ran at 1300 °C (7 °C/min).

2.3. Physical Characterisation

For the characterisation and evolution of current phases as well as the lattice parameters of structures (for milled powders and sintered samples), X-ray diffraction was used (Bruker/D2Phaser, Karlsruhe, Germany). Cu Kα radiation was employed and operated at 30 kV and 10 mA. The measurement was taken with the range of angles from 20 to 90 degrees with a step of 0.02° every 10 s. Refinement of the structure and the quantitative phase analysis were carried out by the de Rietveld method using the free MAUD software (version 2.94, version 2.94, University of Trento, Trento, Italy). Phases and diffraction planes were analysed by comparing the d value of each peak of the diffraction pattern with the ICSD files of the possible phases (pdf numbers: α-Ti: 253841; β-Ti: 5475; β-Mo: 52267). The microstrain (ε) and crystallite size (<D>) values were also quantified and the instrumental width was disregarded which tends to lead to an underestimation of the crystallite sizes. The parameters obtained by fitting the peak profile at MAUD were performed by the Caglioti equation, as follows [38]:
FWHM = U · tan ( θ ) + V · tan ( θ ) 1 / 2 + W
The MAUD fit for all samples milled according to crystalline phases can be found in Figure 1a–e. It is possible to note a good fit for all XRD profiles.
Particle size distribution was measured in milled powders using a particle size analyser by laser diffraction (Mastersizer 2000-Malvern Instruments, UK).
To evaluate the oxygen content for each milled sample and sintered samples, the analysis was performed using the ONH-2000 (Eltra®, Villach, Austria) equipment, which has high sensitivity to the presence of oxygen at low detection limits. The analysis was performed by melting in an inert gas atmosphere (not influencing the oxygen content), in an oven which receives electrical impulses. The sintered samples were finished in order to neglect possible surface oxides.
Porosity was analysed by Archimedes’ principle for sintered samples. In this method, they were weighed in water and in the air, and then the density of the material was obtained and also the quantification of total porosity (open and closed pores).
The microstructure of the milled powders and the sintered powders was characterised by field emission scanning electron microscopy (FESEM) (ZEISS-ULTRA 55, OXFORD INSTRUMENTS, Oberkochen, Germany) with backscattered electrons (BSE), secondary electrons (SE) and X-ray energy dispersive detectors (EDS) (Oxford Instruments Ltd, Oberkochen, Germany). Powders and sintered samples were embedded in resin and prepared metallographically from cross-sections to analyse particle size, the homogeneity of the Ti, Nb and Mo elements and the evolution of the diffusion process at different milling times. Sintered parts were also evaluated and compared to the data obtained from the powders at different milling times.

2.4. Mechanical Characterisation

After MA, powders embedded in resin were evaluated in relation to microhardness and after the sintering process (Matsuzawa-MHT2, Tokyo, Japan) with a load of 245.2 mN for 10 s in each indentation, following ASTM E-384 standard guidelines. Indentations were made (n = 12) on each powder sample. For the sintered samples, n = 12 measurements were taken starting from the surface and moving to the center of the sample. For each measure, a distance of 250 µm for each indentation was taken. Four-point bending strength tests were carried with universal testing Autograph AG-X (Shimadzu, Kyoto, Japan) plus equipment and a maximal load of 100 kN, at 1000 MPa, using a 30 × 12 mm floating die and a thickness around 5 mm. After milling, the samples were compacted in an universal testing (INSTRON 1343, High Wycombe, UK) hydraulic press at 1000 MPa. Tests were performed at a constant speed of 0.5 mm/min.

3. Results and Discussion

3.1. XRD and Crystallographic Analyses

Figure 2 shows the XRD patterns of the TiNbMo powders before (Figure 2a) and milled by MA at different times (Figure 2b). For the first 12 h of milling, the XRD profile indicated the presence of peaks referring to reflections of the α and β phases and to the presence of Mo particles. After 24 h of milling, the α-100 and 102 reflection peaks were absent, demonstrating the allotropic transformation of Ti (α→β). The peak related to the Mo particles, with a cubic structure, decreased in intensity at a longer milling time. The intensities of the peaks of the β phase increased with milling time. After 40 h, the XRD pattern revealed a slight peak related to Mo-211, as well as slight peaks of the α-100 and 101 phases, which demonstrate a continuous allotropic transformation of Ti, as in 24 h of milling. After 60 h of milling, the peak related to the Mo particle further decreased significantly. In this case, the energy in the system to promote diffuse process of alloying elements (Mo and Nb) was higher, but it can be compared to 40 h, which demonstrates that 40 h of milling and 60 h of milling present quite a similarity. No peak of oxides or nitrites, nor others related to contamination, were found in any of them. To evaluate the influence, vessels were opened during the milling process and milling in the continuous mode was evaluated for 40 h. Its XRD pattern indicated similarity for samples after 40 h and 60 h of milling.
Table 1 shows the % of the phases and Mo content by Rietveld refinement. Rwp came close to Rexp and was low at 10%, which demonstrates refinement quality.
In more detail, to evaluate quantitatively the best fit of the data, several reliability-factors such as Rwp, Rp, Re, RF, S and χ2 can be used. The most accepted factor in the literature is the weighted-profle R, termed as Rwp. One of the ways to calculate the fit refinement is numerically, in terms of R values. The weighted-profile R value, Rwp, is defined as
{ i w i [ y i ( o b s ) y i ( c a l c ) ] 2 i w i   [ y i   ( o b s ) ] 2 } 1 / 2
where yi(obs) is the observed intensity and wi the weight. If the background has been subtracted, yi(obs) is the net intensity after subtraction, but if the background is refined, yi(obs) and yi(calc) are likely to include the background contribution. In the latter case, a high background automatically produces a low Rwp value because a significant part of the intensity is accounted for by the background function. Preferably, the Rwp should be close to the expected R value, which is called Rexp, and it is defined as:
R exp = [ N P i N w i y i ( o b s ) 2 ] 1 / 2
where N is the number of observations and P the number of parameters. Thus, Rexp reflects the quality of the data [39]. Mo content fell within the 3.95–0.8 range, and this content was lowered with longer milling times. The % of the α phase was also lowered and the % of the β phase rose with longer milling times. After 60 h of milling, the maximum % of the β phase was obtained. The powders milled for 40 h in the continuous mode were less efficient compared to 40 h.
Mo gradually dissolved in the Ti lattice with a longer milling time, but a certain amount of Mo remained free, even with longer milling times. This was due to the limited amount of energy transfer to the powder particles from the slow selected rpm, and also to the limited milling time, which might not be able to generate a sufficient amount of dislocation in material towards full solutionisation as the Mo present has a melting point higher than Nb (2623 °C and 2469 °C, respectively)
Parameters associated with the reduction of particle size during MA are the microstrain (ε) and crystallite size (<D>). These parameters are related to diffraction peak broadening, observed with increasing milling time. The values of ε and <D> are present in Table 2 and were evaluated considering the β peaks contained in the XRD profile of Figure 1. According to observations, crystallite size became smaller with milling times from 12 h to 40 h, which is also reported in the literature by several researchers [29,30]. However, after 60 h, it significantly increased. After milling in the continuous mode for 40 h, crystallite size was higher compared with all samples. The microstrain increased from 12 h to 24 h but significantly decreased for 40 h and 60 h of milling. The deformation mechanism that dominates in the ball milling process is the formation of shear bands, which have high dislocation density due to the strong impact associated with powder particles. According to some authors, dislocation density and ε increase in the initial milling stage in the localised region of grains [40,41]. Dislocation density and ε are proportional parameters and are related to the number of lattice imperfections. In the first 12 h of milling, the ε was lower (0.0041%), diverging from the authors’ results. If the grain boundaries increase (for small grain sizes), the number of imperfections and defects increase, and consequently, the angle boundaries are high. When the ε exceeded a certain level, grains fragmented into subgrains separated by the low-angle grain boundary. When milling was prolonged, subgrain fragmentation occurred from the region where unstrained shear bands were present in the previous material. Due to grain fracturing, the degree of randomness of subgrain orientation increased, and consequently, ε and dislocation density also increased. The reduction in grain size occurred until the complete random orientation of subgrains was achieved. Due to grain fragmentation, dislocation density was reduced and further size reduction became difficult. Crystallite size reduction occurs throughout milling.

3.2. Beta Phase Evolution at Different Milling Times

Figure 3a–e shows the cross-sections of the milled powders through back-scattered electron (BSE) images at different milling times to gain a better understanding of the effect of the MA process on particle microstructure evolution and the influence of opening the vessels. After 12 h of milling (Figure 3a), the presence of the α and β phases was noted. This milling time promoted reasonable milling and the diffusion of Nb and Mo in the Ti matrix. Small elemental particles were present, in which the Nb and Ti particles were flaked upon the collision between powders and milling balls. A large amount of lamellar microstructural composite particles was also observed in these powders. After 24 h (Figure 3b) of milling, the brightest contrast was noted in the presence of particles of a heavier atomic weight, as seen in Figure 3a for Nb and Mo. In this case, the milling process promoted a more marked transformation from the α phase to the β phase. A lamellar microstructure was also present but in a small amount, which indicates an increase in microstructure homogeneity. Fewer elemental particles were noted during this process. After 40 h and 60 h (Figure 3c,d) of milling, there was no contrast difference in the cross-sectional BSE images of the powder particles, the lamellar microstructure completely disappeared, and a very uniform microstructure was formed. Thus 40 h of ball milling at 240 rpm is enough to promote a uniform mix in powder particles. When comparing 40 h of milling in the continuous mode to the sample 40 h after opening the vessels, no significant difference appeared between them. Both samples promoted a uniform microstructure in the particle powders, as seen in Figure 3e. Evolution of β phase formation during milling times are shown in Figure 4. From 12 h to 60 h, the increase in the % of the phase β was clear. After 40 h of milling and 40 h in the continuous mode, no significant increase was observed.

3.3. Particle Size Evolution at Different Milling Times

The milling process obtained by MA for different times promoted an evolution in particle size reduction (see Table 3), and these were indicated as the median diameter of the medium values of the particle size distribution. It is the value of the particle diameter at 10% (d(0.1)), 50% (d(0.5)) and 90% (d(0.9)) in the cumulative distribution. The d(0.1) in both the mixture and milling times up to 40 h in the continuous mode were similar. For the 60 h time, d(0.1) was 6.36 µm. The d(0.5) related to the mixed powders were similar when comparing 24 h to 40 h in the continuous mode. For 12 h and 60 h, d(0.5) were slightly higher. Interestingly, d(0.5) significantly decreased for the 40 h time and most particles (d(0.9)) were of a similar size for 24 h (42.512 μm) and 40 h (43.474 μm) in the continuous mode compared to the mixture (d(0.9) ≈ 43.7 µm). In this case there is the formation of large dense agglomerates, the sizes of which decrease as the time increases. When comparing powders for the 12 h and 40 h times, the conditions under which particle size differed the most were 73.33 µm for 12 h and 29.07 µm for 40 h comparing the d(0.9) value. These agglomerates or increasing particle sizes are due to their resistance to fracture from the introduced plastic deformation and the raised the temperature during mechanical milling.

3.4. Homogeneity of Powders by EDS

The typical EDS analyses shown in Figure 5a–d indicate the homogeneity and distribution of the Ti, Nb and Mo elements on the microstructure of the powders milled for 60 h. The excellent distribution of elements Ti, Nb and Mo is clearly indicated in the microstructure of powders, with only a few areas showing Ti enrichment. Microstructural homogeneity appears due to the formation of a single-contrast microstructure. This basically means that particles are connected in this stage, which confirms the significant transformation of the β phase (>90%) obtained by XRD.

3.5. Influence of Opening the Vessels on Oxygen Content

The oxygen content of powders in relation to the different milling times is described in Table 4. It is possible to see that the content ranged from 0.99 to 1.33 wt%, with the minimum value for samples milled for 40 h and the maximum value for samples milled for 60 h. The content for 12, 24 and 40 h and 40 h in continuous mode are close, differing just for 60 h, which presents the highest value (34% more compared to the 12 h milling). As the % were close to each other, it is not clear that the contamination was significant when opening the vessels. However, for a long milling time (60 h), a marked increase was noted compared to the first 12 h. The main effects of oxygen contamination are the increase in the α-phase transformation and the mechanical properties. In this case there is no correlation of the increase alpha phase and oxygen content.

3.6. Microhardness of Powders after Mechanical Alloying

Depending on the milling time, the microhardness behaviour was evaluated and is shown in Figure 6. The microhardness of particles increased with longer milling times, with minimum and maximum of 387.2 HV and 445.8 HV, respectively, and can be correlated to oxygen content. For 40 h in the continuous mode, the microhardness was close to 24 h and lower compared to 40 h. Milling for 40 h in the continuous mode showed a decrease of ≈2%. It is clear that microhardness increased with a longer milling time. Increased microhardness is caused by the hardening work of both Ti and Nb due to the impact of the balls moving during this process. Additionally, the solid solubilisation of Nb in the Ti lattice can increase particle hardness. Particle hardening during milling is also related to increased lattice deformation and results in high displacement density, according to the results obtained in Table 2.

3.7. Microstructural and Mechanical Properties of the Ti-34Nb-6Mo-Sintered Parts

The powder samples with the best microstructural homogeneity and the highest % of the β phase were chosen to be sintered to estimate milling process quality. Figure 7a–g indicates the XRD profiles of the sintered materials obtained by MA for 40 h, 60 h and 40 h in the continuous mode. In all cases, materials were formed by the α-Ti and β-Ti, with no detected remaining oxide or Mo peaks. From the XRD profile, the intensity of the α-Ti-002, 101, 112, 102 and 201 peaks decreased for all samples but was more evident for samples milled in continuous mode (seen in Figure 7b–g). The XRD standard for 40 h of milling in the continuous mode was similar to the sample obtained after 60 h. Table 5 shows the increase in α-Ti in all the samples. In the sintered samples obtained after 60 h of milling, the content in the α phase was basically 1.4 times more, an increment of 38 % higher than that of the others.
Table 6 indicates the ε and <D> of the sintered parts milled for 40 h, 60 h and 40 h in the continuous mode. The ε remain constant for the three samples and the <D> increases significantly. This phenomenon was due to the thermodynamic effects produced during the sintering process, and grain growth occurred. In more detail, the sintering process implies bonding one solid particle to another. This process can be regarded as consisting of two intertwined processes: densification and grain growth. Both processes share the same mechanism, which is the drive force and mass transport.
Table 7 shows the values for the oxygen content of the sintered samples. It is possible to note that all samples presented increase in oxygen content. As shown in Figure 7, there is no evidence of oxides present in the microstructure of the samples, indicating the diffusion of oxygen in the Ti matrix, acting as interstitial element. The main effects of interstitial oxygen are the increase of the mechanical properties and α-phase transformation. Generally, oxygen has extensive solubility in the α and β phases before forming oxide phases, and it is known as a strong α-stabilizing element. Dissolved oxygen in the α and β phases causes hardening from the interstitial solid solution [42]. Table 6 indicates that in samples milled for 60 h, the α-phase content increased more than in the others. However, the oxygen content is very close to samples milled for 40 h. In this case, it is hard to conclude the oxygen influenced directly of phase transformation, just that sintering, as an activating thermal process, accelerates the phase transformation and oxygen increase. The thermodynamic driving force for the sintering particles of any size is the reduction of surface energy. The driving force for the sintering of microsized particles is, therefore, inversely proportional to particle size.
In a systematic study about the stability of milling metal powders, Malow and Koch reported that the grain growth rate of nanocrystalline Fe powders made by ball milling was initially rapid (<5 min) when annealed at several temperatures. Grain growth thus stabilises during extended isothermal holding [43]. During isothermal holding, grain growth follows a generalised parabolic grain growth law and is similar to that found in bulk materials. It was firstly noted that at higher annealing temperatures, grain sizes were already several times bigger than the original ones after milling. In other words, grains grow rapidly during the heat-up and before the preselected isothermal holding temperature is reached.
The grain growth mechanism was marked as a function of milling time. The relation between grain size and milling time during the sintering at 1300 °C before being milled at 40 h, 60 h and 40 h in the continuous mode was clear. This means that the grain growth effect is related to the number of agglomerated nuclei available depending on milling time. After 40 h of milling, the grain sizes for grains α and β were 0.67 µm and 0.59 µm, respectively. For 60 h, they increased significantly and reached 2.39 µm for the α grains and 2.03 µm for the β grains. Particles were harder with a longer milling time (60 h), which led to greater grain growth. Compared to the samples milled in the continuous mode, where vessels were not opened during the process, grains α and β were 1.22 µm and 0.44 µm. respectively. The recrystallisation process was facilitated by inner tension release, which led to grain growth, and was also due to a bigger specific surface of particles (3.82 m2/g) that facilitated the reaction with oxygen (1.47 oxygen %) (see Table 7).
The microstructural evolution achieved with the sintered materials is shown in Figure 8a–c. The microstructure was formed by regions of light contrast, represented by β-Ti, and formed by grains with an equiaxial morphology, and regions formed by the darkest contrast, with a high α-Ti concentration. Pores (indicated by arrows) were significantly present in our samples, with 24.58% for the samples milled at 40 h, 19.32% for the samples milled at 60 h and 24.98% for those milled at 40 h, all in the continuous mode. The regions with a high α-Ti content grew with a longer milling time from 40 h to 60 h (30% increment) and were comparable to 40 h of milling in the continuous mode.
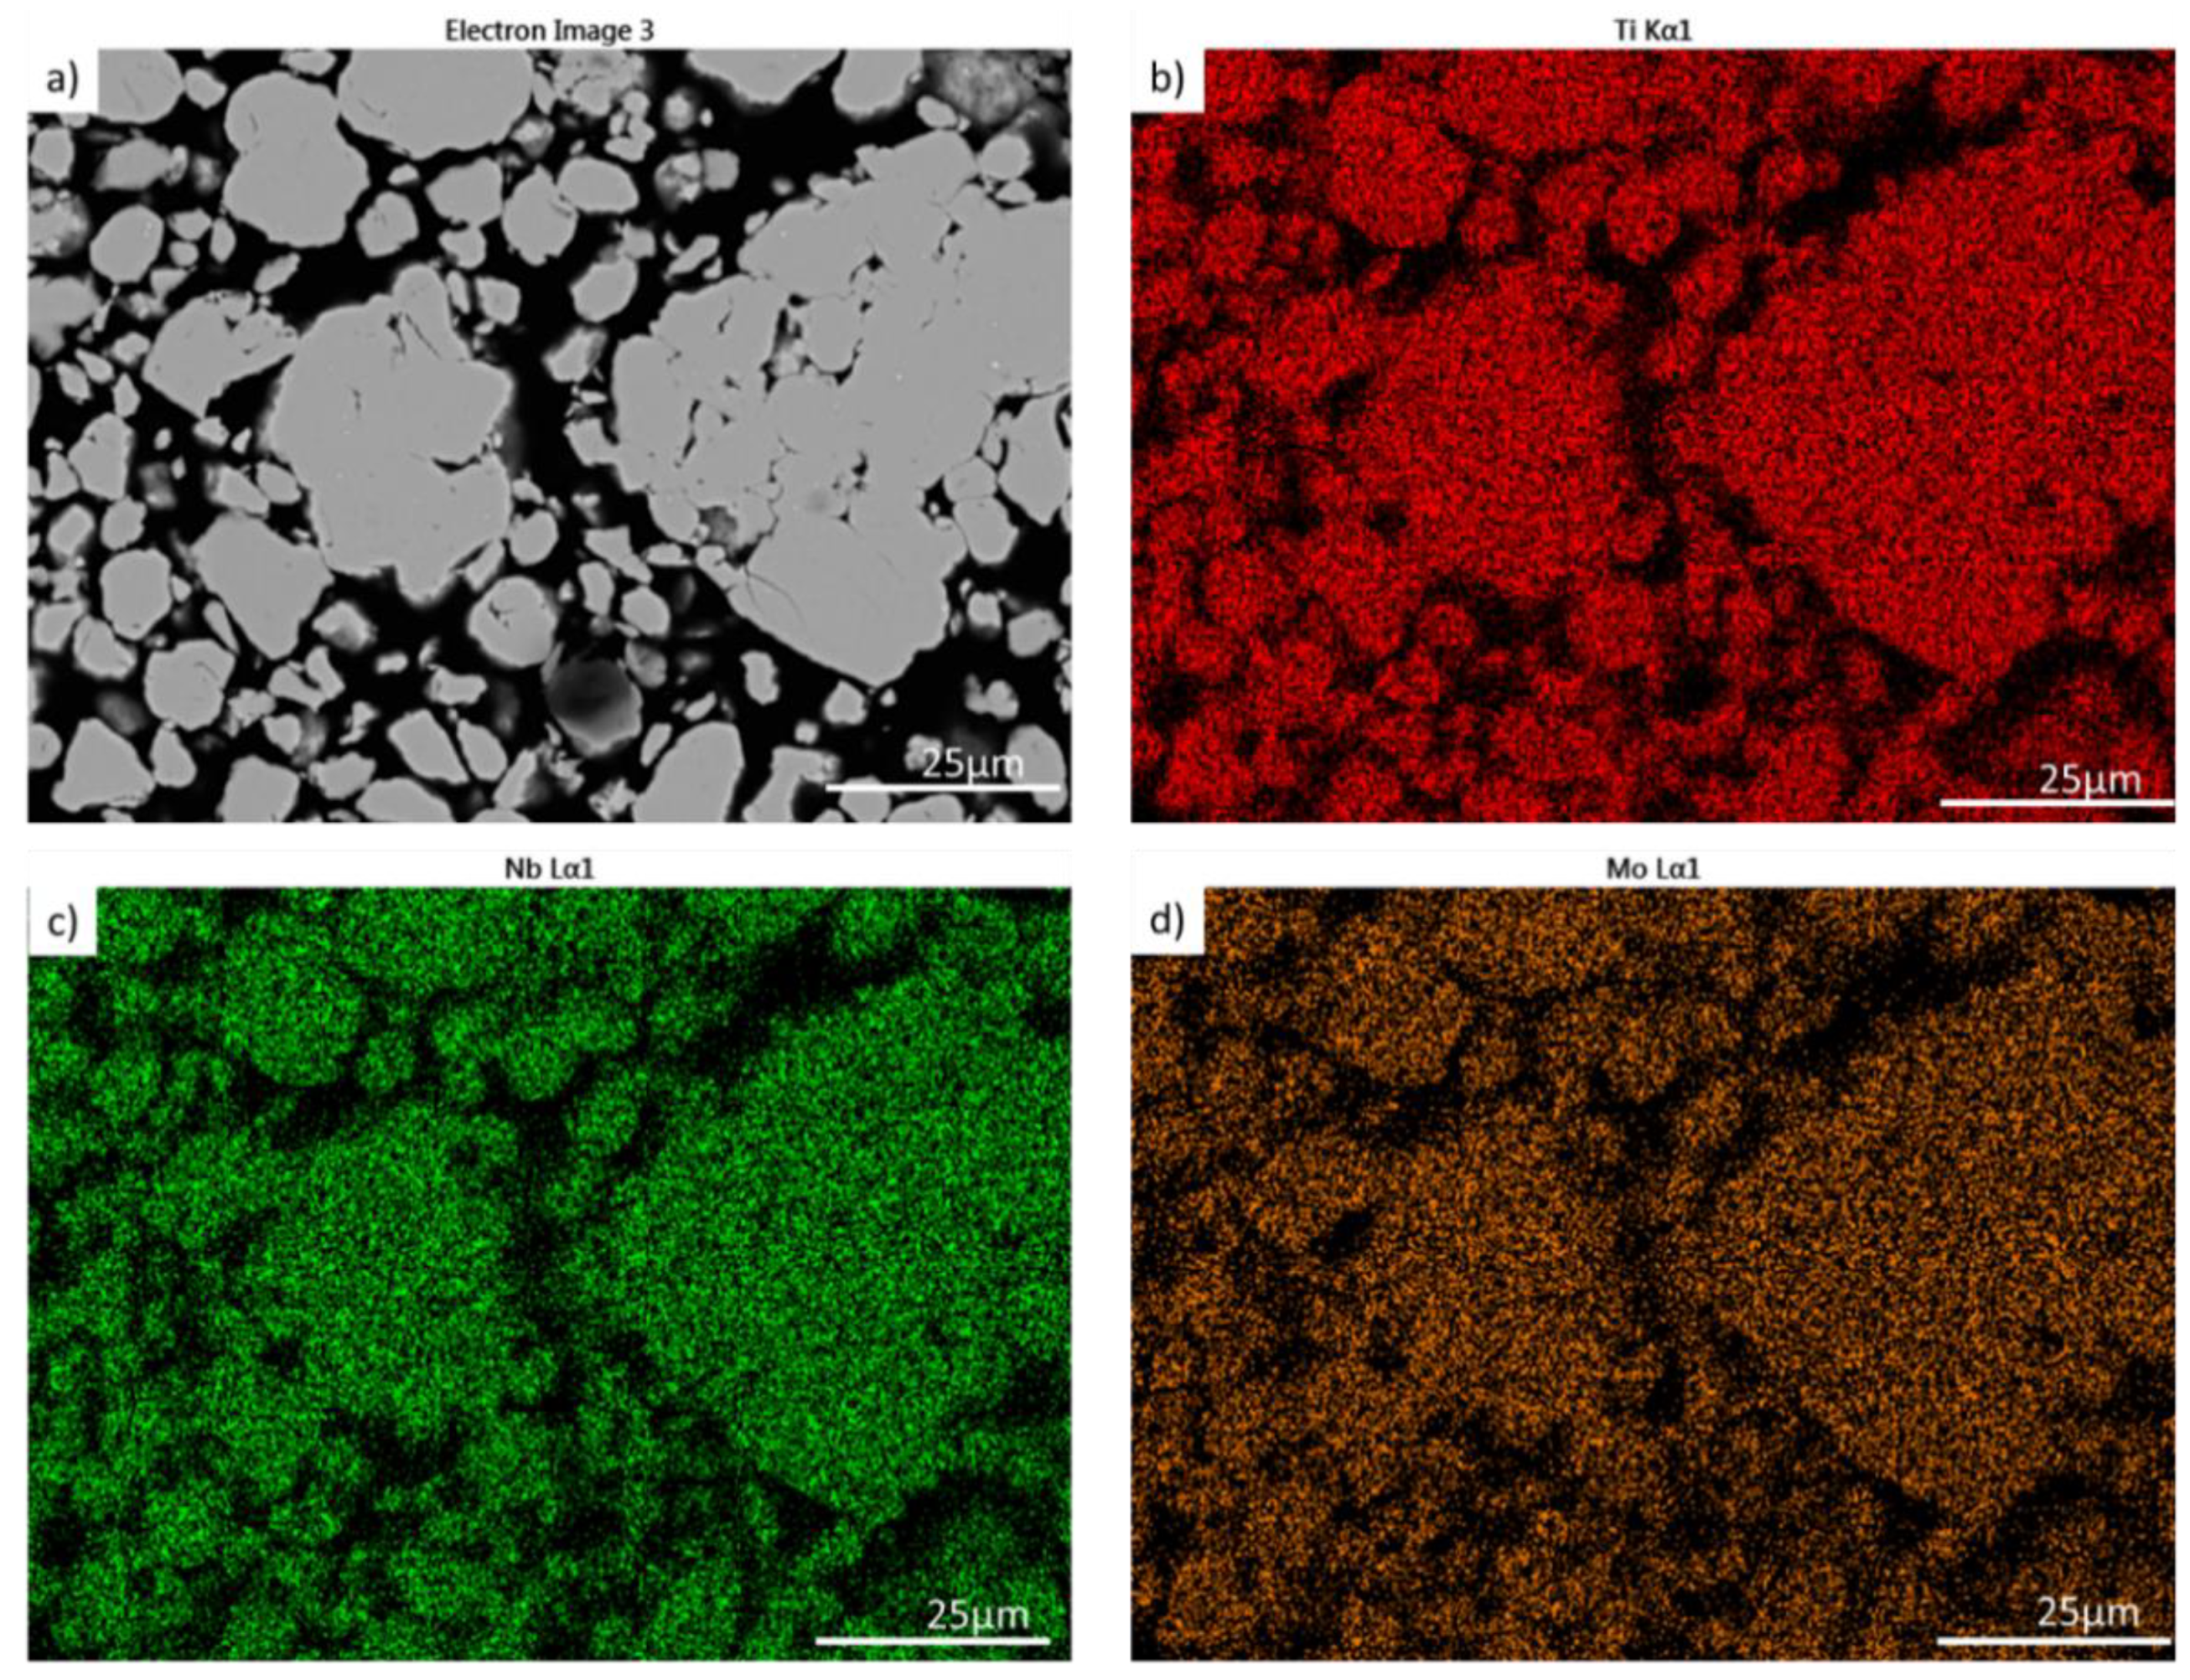
Figure 9 illustrates the typical cross-sectional SEM images and EDS line scan results of the Ti-35Nb-6Mo alloys prepared by MA for 60 h and sintered at 1300 °C. Ti content gradually increased and Nb and Mo contents progressively decreased in the zones indicated by the darkest contrast, represented by numbers 1, 3 and 5. This result confirms the presence of α-Ti in the microstructure formed during the sintering process. In the zones with the brightest contrast, the presence of Nb and Mo contents is homogeneous and linear, with an abrupt decrease in Ti content, as denoted by the β-Ti represented by numbers 2, 4 and 6. With this analysis, the presence of nanopores was observed. Nanopore formation in powder metallurgy is possible when working with refractory elements, such as Mo particles in this case, and with significant oxygen content, as demonstrated by the significant presence of this element.
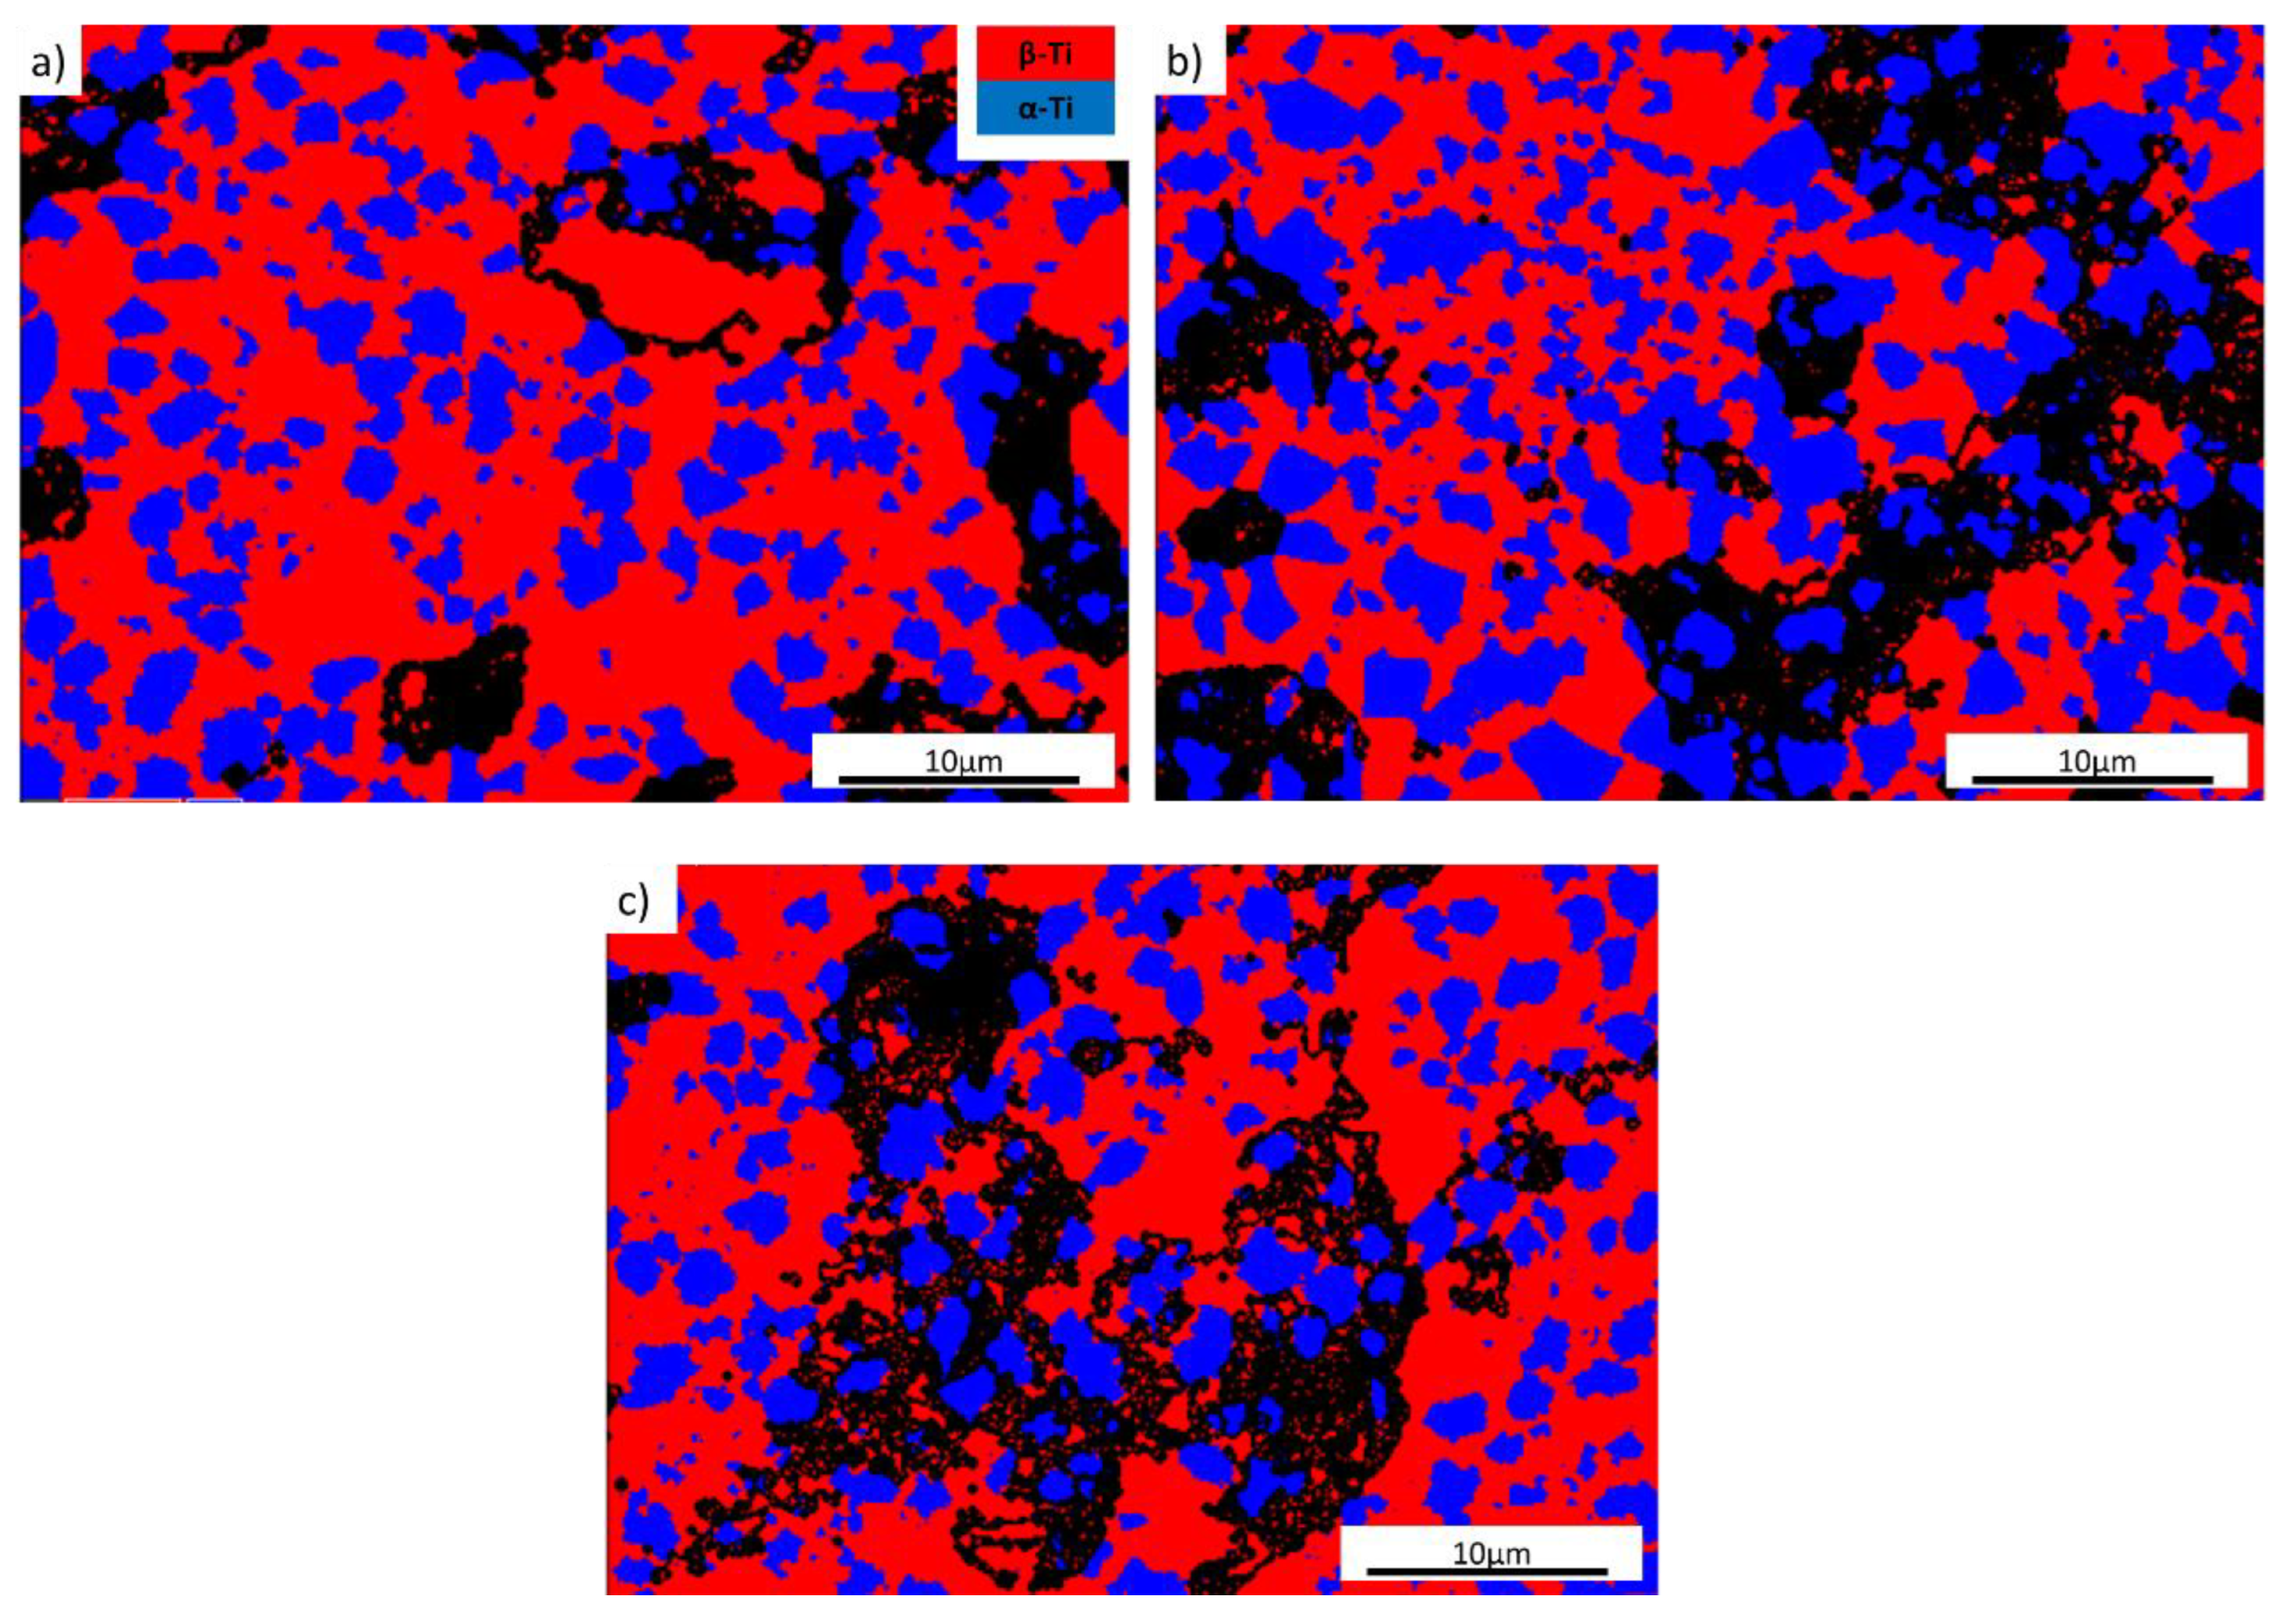
Figure 10a–c illustrates the phases distribution in the sintered Ti-35Nb-6Mo. Red indicates β-Ti and blue denotes the α-phase. These analyses revealed that the grain boundaries of the α-Ti phase were well defined, whilst no grain boundaries were delimited in the β-Ti phase. The α-Ti phases were nucleated in the β-Ti microstructure.
Here a significant difference appeared in the microstructure related to the phases distribution for the samples milled at 40 h, 60 h and 40 h in the continuous mode. For the 60 h time, the grain size in the α-Ti phase increased compared to the grain size at 40 h or 40 h direct milling. After 60 h of milling, the percentage of the α-Ti phase was higher. The grain size of α-Ti increased compared to the 40 h time (Figure 10b) and 40 h in the continuous mode (Figure 10c). From the phase contrast images, it is possible to confirm the recrystallisation of the β grains (in the dark contrast) related to the grain growth for 60 h (Figure 10b), which was more evident than at 40 h or 40 h in the continuous mode.
To study and compare the textures of the three different sample conditions, the orientation density from the crystal planes of the α and β phases was also presented in the form of inverse pole figures (Figure 11a–c). Intensities were visualised in terms of contours and colours and expressed as multiples of uniform density (MUD). The maximum values of the inverse pole density were 1.63, 1.45 and 1.35 for the bcc structure at 40 h, 60 h and 40 h in the continuous mode, respectively. For the hcp structure, the maximum density values were 1.79, 1.79 and 1.96, respectively, which were close to one another. The β phase showed a significant difference in their crystallographic orientation, especially for Ti-35Nb-6Mo milled at 40 h in the continuous mode, where the MUD concentrations can be seen in planes {111} and {101} presenting a high concentration.
However, in the α phase, some concentrations can be seen in planes {120} and {001} for the samples milled for 40 h. No difference was shown for the other samples, and the crystallographic orientation seemed random.
The MUD concentrations in some areas can be related to grain rotation, caused by the thermally activated process during sintering or before or during MA. For the times 60 h and 40 h in the continuous mode, these concentration areas appeared more than for the first one. As the milling time for the samples in Figure 11b was longer, the grain rotation mechanism could take place more often. For the samples in Figure 11c, grain rotation was also present more due to the strong effect of the oxygen content.
Figure 12a shows variations in the microhardness of the sintered samples according to milling time. The microhardness of the sintered Ti-35Nb-6Mo samples tended to decrease with longer milling times by grain growth during sintering. The microhardness values of the sintered samples made with powders milled for 40 h, 60 h and 40 h in continuous mode were measured and show a minimum and maximum value of 154.7 and 170.2 HV. The microhardness of the samples milled for 60 h presented further hardness, which could be the effect of higher oxygen content and the presence of α phase, which is harder than the β phase. Nong et al. showed that with increasing oxygen content, the α phase also increases for samples Ti-6Al-2Zr-1Mo-1V (near α) and Ti-6Al-4V (α + β) [44]. When comparing the as-cast CP-Ti (≈106 HV) and Ti-6Al-4V (≈389 HV) [45], the microhardness of all the materials was low vs. Ti-6Al-4V and higher than CP-Ti, obviously as a consequence of the α phase occurring, which promotes microstructure hardening. Nouri et al. reported that enhanced microhardness due to grain refinement is more pronounced in the early ball-milling stage, whereas a further increase is related to increased grain size refinement, work hardening and the formation of supersaturated solid solutions [19]. Microhardness in healthy human bone falls within the range of 24–53 HV and comprises the sacrum, shaft of the tibia, diaphysis, epiphysis, tibia, humerus, ulna, radius, femur, lumbar, cervical and thoracic vertebra and cortical and cancellous bone [46].
The bending strength indicated in Figure 12b for the samples milled at 60 h was higher than the samples milled at 40 h and 40 h in the continuous mode. Nevertheless, when comparing CP-Ti (692 MPa) and Ti-6Al-4V (891 MPa), the value was significantly lower. It is possible to conclude that the oxygen content and α-phase had an influence on the mechanical properties of the Ti-35Nb-6Mo alloy previously milled for 60 h.

4. Conclusions

A study about the effect of the MA process on different milling times and the influence of oxygen content on the microstructural and mechanical properties of the β-Ti-34Nb-6Mo ternary alloy was conducted. The main conclusions are drawn as follows:
  • Opening the vessels at each MA time did not influence the Ti allotropic transformation process once the β phase percentage increased with longer milling times, with values over 90 wt% for milling at 40 h, 60 h and 40 h in the continuous mode;
  • Samples presented two microcrystalline phases (α and β): the α phase with hcp and the β bcc structure, where phases were distributed in lamellar grains for Ti-β and small zones of the Ti-α particles;
  • The milling time led to greater deformation in the crystal lattice, along with an increased crystallite size after 12 h of milling, followed by an increase in these parameters due to the hardening process and cold welding. After 60 h in the continuous mode, crystallite deformation and size were smaller than for 40 h with the opening of vessels, which gave a larger particle size and hindered the deformation of particles during mechanical milling;
  • Opening the vessels for each milling time, oxygen contamination occurred. A significant increase after 60 h was noted due to the decreased particle size and greater agglomeration which, thus resulted in a bigger exposed specific surface area;
  • The sintered powder samples milled for 40 h and 40 h in the continuous mode showed better mechanical properties due to the greater allotropic transformation that occurred during the thermally activated process in sintering, which was due to the higher percentage of the β phase obtained during mechanical milling;
  • The influence of oxygen content on the mechanical properties of both powders and sintered bodies was noted. This is a good evidence that oxygen is located in the interstitial position.

Author Contributions

Conceptualization, E.d.S.G. and M.C.R.; methodology, E.d.S.G. and V.A.B.; investigation, E.d.S.G., V.A.B. and A.V.E.; resources, V.A.B., M.C.R. and A.V.E.; writing—original draft preparation, E.d.S.G. and M.C.R.; writing—review and editing, M.C.R. and V.A.B.; supervision, V.A.B. and C.R.M.A.; project administration, V.A.B.; funding acquisition, V.A.B. and C.R.M.A. All authors have read and agreed to the published version of the manuscript.

Funding

The authors thank the Spanish Ministerio de Economía y Competitividad for Research Project RTI2018-097810-B-I00, the European Commission for FEDER funds and the Fundação de Amparo a Pesquisa do Estado de São Paulo [grant: 2021/03865-9].

Data Availability Statement

The raw data related to this manuscript would be made available on request.

Conflicts of Interest

The authors declare no conflict of interest.

References

  1. Katti, K. Biomaterials in total joint replacement. Colloids Surfaces B Biointerfaces 2004, 39, 133–142. [Google Scholar] [CrossRef] [PubMed]
  2. Okazaki, Y.; Rao, S.; Asao, S.; Tateishi, T.; Katsuda, S.; Furuki, Y. Effects of Ti, Al and V Concentrations on Cell Viability. Mater. Trans. JIM 1998, 39, 1053–1062. [Google Scholar] [CrossRef] [Green Version]
  3. Okazaki, Y.; Rao, S.; Tateishi, T.; Ito, Y. Cytocompatibility of various metal and development of new titanium alloys for medical implants. Mater. Sci. Eng. C 1998, 243, 250–256. [Google Scholar] [CrossRef]
  4. Keegan, G.M.; Learmonth, I.D.; Case, C.P. A Systematic Comparison of The Actual, Potential and Theoretical Health Effects of Cobalt and Chromium Exposures from Industry and Surgical Implants. Crit. Rev. Toxicol. 2008, 38, 645–674. [Google Scholar] [CrossRef]
  5. Mcdermott, P.H.; Delaney, R.L.; Egan, J.D.; Sullivan, J.F. Myocardosis and cardiac failure in men. JAMA 1966, 198, 253–256. [Google Scholar] [CrossRef] [PubMed]
  6. Morin, Y.; Daniel, P. Quebec beer-drinkers’ cardiomyopathy: Etiological considerations. Can. Med. Assoc. J. 1967, 97, 926–928. [Google Scholar]
  7. Paustenbach, D.J.; Tvermoes, B.E.; Unice, K.M.; Finley, B.L.; Kerger, B.D. A review of the health hazards posed by cobalt. Crit. Rev. Toxicol. 2013, 43, 316–362. [Google Scholar] [CrossRef]
  8. Graphical Research. Available online: https://www.graphicalresearch.com/industry-insights/1968/europe-orthopedic-devices-market?gclid=Cj0KCQjw8uOWBhDXARIsAOxKJ2HkTr4y_90ZVjus5jhWZ1fRx017kp6XxqgUU5RZYZ2zA6FFzd_HiXMaAi3_EALw_wcB (accessed on 19 November 2021).
  9. Churakova, A.A.; Gunderov, D.V. Transformation of the Tini Alloy Microstructure and The Mechanical Properties Caused by Repeated B2-B19′Martensitic Transformations. Acta Metall. Sin.-Engl. 2015, 28, 1230–1237. [Google Scholar] [CrossRef]
  10. Lin, Y.C.; Chen, H.M.; Chen, Y.C. The effect of different methods to add nitrogen to titanium alloys on the properties of titanium nitride clad layers. Mater. Des. 2014, 54, 222. [Google Scholar] [CrossRef]
  11. De Vasconcellos, L.M.R.; Carvalho, Y.R.; Do Prado, R.F.; De Vasconcellos, L.G.O.; Graça, M.L.A.; Cairo, C.A.A. Porous Titanium by Powder Metallurgy for Biomedical Application. Mater. Res. 2008, 11, 275–280. [Google Scholar] [CrossRef] [Green Version]
  12. Cremasco, A.; Messias, A.D.; Esposito, A.R.; Eliana Aparecida De Rezende, D.; Caram, R. Effects of alloying elements on the cytotoxic response of titanium alloys. Mater. Sci. Eng. C 2011, 31, 833–839. [Google Scholar] [CrossRef]
  13. Magdalen, H.C.T.; Baghi, A.D.; Ghomashchi, R.; Xiao, W.; Oskoue, R.H. Effect of niobium content on the microstructure and Young’s modulus of Ti-Xnb-7zr alloys for medical implants. J. Mech. Behav. Biomed. Mater. 2019, 99, 78–85. [Google Scholar] [CrossRef]
  14. Mavros, N.; Larimian, T.; Esqivel, J.; Gupta, R.K.; Borkar, T. Spark plasma sintering of low modulus titanium-niobium-tantalum-zirconium (TNTZ) alloy for biomedical applications. Mater. Des. 2019, 183, 108163. [Google Scholar] [CrossRef]
  15. Kim, J.I.; Kim, H.Y.; Inamura, T.; Hosoda, H.; Miyazaki, S. Shape memory characteristics of Ti–22Nb–(2–8)Zr(at.%) biomedical alloys. Mater. Sci. Eng. A 2005, 403, 334. [Google Scholar] [CrossRef]
  16. Cardoso, F.F.; Ferrandini, P.L.; Lopes, E.S.; Cremasco, A.; Caram, R. Ti–Mo alloys employed as biomaterials: Effects of composition and aging heat treatment on microstructure and mechanical behavior. J. Mech. Behav. Biomed. Mater. 2014, 32, 31. [Google Scholar] [CrossRef] [PubMed]
  17. Oliveira, N.; Aleixo, G.; Caram, R.; Guastaldi, A.C. Electrochemical behavior of Ti–Mo alloys applied as biomaterial. Corros. Sci. 2007, 50, 938. [Google Scholar] [CrossRef]
  18. Hsu, H.C.; Wu, S.C.; Hsu, S.K.; Chang, T.Y.; Ho, W.F. Effect of ball milling on properties of porous Ti-7.5Mo alloy for biomedical applications. J. Alloys. Compd. 2014, 582, 793. [Google Scholar] [CrossRef]
  19. Nouri, A.; Hodgson, P.D.; Wen, C. Effect of Ball-Milling Time on The Structural Characteristics of Biomedical Porous Ti–Sn–Nb Alloy. Mater. Sci. Eng. 2011, 31, 921–928. [Google Scholar] [CrossRef]
  20. Suryanarayana, C. Mechanical alloying and milling. Prog. Mater. Sci. 2001, 46, 1–184. [Google Scholar] [CrossRef]
  21. Dercz, G.; Formanek, B.; Prusik, K.; Pajak, L. Microstructure of Ni(Cr)–Tic–Cr3c2–Cr7c3 composite powder. J. Mater. Process. Technol. 2005, 162, 15–19. [Google Scholar] [CrossRef]
  22. Dercz, G.; Dercz, J.; Prusik, K.; Hanc, A.; Babilas, R.; Pajak, L.; Milczuk, J. Structure investigations of Bi5Ti3FeO15 ceramics prepared by free sintering process of high-energy ball milled nanocrystalline precursors. Arch. Metall. Mater. 2009, 54, 741. [Google Scholar]
  23. Bian, B.; Liu, Y.; Du, Y.; Min, Q.; Liu, H.; Wen, S.; Zhou, P. Measurement of the Interdiffusion Coefficients in Mo-Ti And Mo-Ti-Zr Beta Phase Alloys From 1273 to 1473 K. J. Phase Equilibria Diffus. 2019, 40, 206–218. [Google Scholar] [CrossRef]
  24. Chen, W. Interdiffusion and atomic mobility in Bcc_A2 Ti-Rich Ti-Nb-Zr system. Calphad 2018, 60, 98–105. [Google Scholar] [CrossRef]
  25. Liu, Y.; Zhang, L.; Yu, D. Computational Study of Mobilities and Diffusivities In Bcc_A2 Ti-Zr And Bcc_A2 Ti-Mo Alloys. J. Phase Equilibria Diffus. 2009, 30, 334–344. [Google Scholar] [CrossRef]
  26. Liu, Y.; Wang, G.; Wang, J.; Kang, Z. Mobilities and diffusivities for bcc_A2 Nb-W, Nb-Ta, Zr-Mo and Zr-Hf alloys. J. Alloys. Compd. 2013, 555, 381–389. [Google Scholar] [CrossRef]
  27. Niinomi, M. Recent Research and Development in titanium alloys for biomedical applications and healthcare goods. Sci. Technol. Adv. Mater. 2003, 4, 445–454. [Google Scholar] [CrossRef] [Green Version]
  28. Raman, V.; Tamilselvi, S.; Nanjundan, S.; Rajendran, N. Electrochemical behavior of titanium and titanium alloy in artificial saliva. Trends Biomater. Artif. Organs. 2005, 18, 137–140. [Google Scholar]
  29. Oliveira, N.T.C.; Guastaldi, A.C. Electrochemical stability and corrosion resistance of Ti-Mo alloys for biomedical applications. Acta Biomater. 2009, 5, 399–405. [Google Scholar] [CrossRef]
  30. Singh, L.K.; Bhadauria, A.; Laha, T. Al-MWCNT nanocomposite synthesized sintering kinetics and mechanical properties. Integr. Med. Res. 2018, 8, 503–512. [Google Scholar] [CrossRef]
  31. Ozkaya, S.; Canakci, A. Effect of the B4C Content and the milling time on the synthesis, consolidation and mechanical properties of AlCuMg-B4C nanocomposites synthesized by mechanical milling. Powder Technol. 2016, 297, 8–16. [Google Scholar] [CrossRef]
  32. Zhao, M.; Zhou, Z.; Tan, J.; Ding, Q.; Zhong, M. Effects of ball milling parameters on microstructural evolution and mechanical properties of W-3 % Y composites. J. Nucl. Mater. 2015, 465, 6–12. [Google Scholar] [CrossRef]
  33. Yang, C.; Huang, H.; Zhou, X.; Li, Z.; Zhou, X.; Xia, T. High-temperature stability of Ni-3 wt.% SiC NP composite and the effect of milling time. J. Nucl. Mater. 2019, 467, 635–643. [Google Scholar] [CrossRef]
  34. Debata, H.; Acharya, M.; Sengupta, T.S.; Acharya, P.; Bajpai, P.P. Effect of high energy ball milling in structure and properties of 95W-3.5NI-1.5FE heavy alloys. Int. J. Refract. Hard Mater. 2017, 69, 170–179. [Google Scholar] [CrossRef]
  35. Estrada-Guel, I.; Carreño-Gallardo, C.; Leyva-Porras, C.; Martínez-Sánchez, R. Effect of process parameters on micro and macro-properties of an Al-based nanocomposite prepared by means of mechanical milling. Alloys Compd. 2014, 586, S85–S89. [Google Scholar] [CrossRef]
  36. Ağaoğullari, D.; Balci, Ö.; Öveçoğlu, M.L. Effect of milling type on the microstructural and mechanical properties of W-Ni-ZrC-Y2O3 composites. Ceram. Int. 2017, 43, 7106–7114. [Google Scholar] [CrossRef]
  37. Mehjabeen, A.; Xu, W.; Qiu, D.; Qian, M. Redefining the β-Phase stability in Ti-Nb-Zr alloys for alloy design and microstructural prediction. J. Occup. Med. 2018, 70, 2254–2259. [Google Scholar] [CrossRef] [Green Version]
  38. Caglioti, G.; Paoletti, A.; Ricci, F.P. Choice of collimators for a crystal spectrometer for neutron diffraction. Nucl. Instrum. 1958, 3, 223–228. [Google Scholar] [CrossRef]
  39. McCusker, L.B.; von Dreele, R.B.; Cox, D.E.; LoueÈrd, D.; Scardi, P. Rietveld refinement guidelines. J. Appl. Cryst. 1999, 32, 36–50. [Google Scholar] [CrossRef] [Green Version]
  40. Raghu, T.; Sundaresan, R.; Ramakrishnan, P.; Rama Mohan, T.R. Synthesis of nanocrystalline copper–tungsten alloys by mechanical alloying. Mater. Sci. Eng. 2001, 304–306, 438–441. [Google Scholar] [CrossRef]
  41. Yang, D.-Y.; Yoon, D.-Y.; Kang, S.-J.L. Effect of ball-milling on dislocation generation and grain growth behavior in sintered Nbc–Co. J. Int. Ceram. Soc. 2012, 120, 467–472. [Google Scholar] [CrossRef] [Green Version]
  42. Liu, Z.; Welsch, G. Effects of oxygen and heat treatment on the mechanical properties of alpha and beta titanium alloys. Metall. Trans. A 1988, 19, 527–542. [Google Scholar] [CrossRef]
  43. Malow, T.R.; Koch, C.C. Thermal stability of nanocrystalline materials. Mater. Sci. Forum. 1996, 4, 225–227. [Google Scholar] [CrossRef]
  44. Xu, W.; Yu, A.; Lu, X.; Tamaddon, M.; Ng, L.; Hayat, M.D.; Wang, M.; Zhang, J.; Qu, X.; Liu, C. Synergistic interactions between wear and corrosion of Ti-16Mo orthopedic alloy. J. Mater. Res. Technol. 2020, 9, 9996–10003. [Google Scholar] [CrossRef]
  45. Nong, Z.; Lei, Y.; Zhu, J. Effect of α phase on evolution of oxygen-rich layer on titanium alloys. Trans. Nonferrous Met. Soc. China 2019, 29, 534–545. [Google Scholar] [CrossRef]
  46. Li, S.; Wang, J.-Z.; Yin, B.; Hu, Z.-S.; Zhang, X.-J.; Wu, W.; Liu, G.-B.; Liu, Y.-K.; Fu, L.; Zhang, Y.-Z. Atlas of Human Skeleton Hardness Obtained Using The Micro-Indentation Technique. Orthop. Surg. 2021, 13, 1417–1422. [Google Scholar] [CrossRef] [PubMed]
Figure 1. MAUD fits for powders milled at (a) 12 h, (b) 24 h, (c) 40 h, (d) 60 h and (e) 40 h in continuous mode.
Metals 12 01238 g001
Figure 2. The XRD profiles for the (a) precursor powders and (b) TiNbMo powders milled for 12 h, 24 h, 40 h, 60 h and 40 h in the continuous mode.
Metals 12 01238 g002
Figure 3. The cross-sectional BSE images of powders embedded in resin after ball milling for different times at 240 rpm: (a) 12 h, (b) 24 h, (c) 40 h, (d) 60 h, (e) 40 h in the continuous mode.
Metals 12 01238 g003
Figure 4. Evolution of the β phase obtained after milling process.
Metals 12 01238 g004
Figure 5. The SEM-EDS elemental map analysis for the Ti–Nb–Mo powders milled at 60 h: (a) electron image, (b) Ti Kα, (c) Nb Lα, (d) Mo Lα.
Metals 12 01238 g005
Figure 6. Evolution of microhardness for Ti–Nb–Mo powders at different milling times.
Metals 12 01238 g006
Figure 7. The XRD profile of the Ti-34Nb-6Mo sintered and obtained after 40 h and 60 h and 40 h in the continuous mode. (a) XRD profile of the Ti-34Nb-6Mo sintered and obtained after 40 h (in red), 60 h (in black) and 40 h in continuous mode (in blue). (bd) are indicated in more details the main reflections peak between 2θ= 35–50° of samples sintered after 40 h, 60 h and 40 h in continuous mode. (eg) are indicated in more details the main reflections peak between 2θ = 70–90° of samples sintered after 40 h, 60 h and 40 h in continuous mode.
Metals 12 01238 g007
Figure 8. SEM images of the sintered samples of Ti-34Nb-6Mo obtained at (a) 40 h, (b) 60 h and (c) 40 h of direct milling.
Metals 12 01238 g008
Figure 9. The SEM micrographs and EDS line scan results of the sintered Ti-35Nb-6Mo alloy for 60 h. Dashed blue lines indicate the regions in the microstructure related to the homogeneity of Ti, Nb and Mo elements. The numbers of 1 to 6 indicate the regions in the micrography related to the homogeneity of the microstructure.
Metals 12 01238 g009
Figure 10. The EBSD contrast phase micrographs of (a) Ti-35Nb-6Mo milled at 40 h, (b) Ti-35Nb-6Mo milled at 60 h and (c) Ti-35Nb-6Mo milled at 40 h in the continuous mode.
Metals 12 01238 g010
Figure 11. IPFs of the β and α grains obtained after milling at (a) 40 h, (b) 60 h and (c) 40 h in the continuous mode of the sintered samples.
Metals 12 01238 g011
Figure 12. The microhardness (a) and bending strength (b) values of the sintered parts previously milled at 40 h, 60 h and 40 h in the continuous mode.
Metals 12 01238 g012
Table 1. Quality parameters of Rietveld refinement and the α, β, Mo phases.
TimeRwp (%)Rexp (%)α-Ti (%)β-Ti (%)Mo (%)
Powder12 h6.14.234.9 ± 0.96.0 ± 0.03.95 ± 0.2
24 h6.64.019.3 ± 1.278.10 ± 3.12.59 ± 0.4
40 h6.34.610.14 ± 0.888.76 ± 01.09 ± 0.1
60 h5.93.96.5 ± 0.492.6 ± 9.00.8 ± 0.1
40 h in the continuous mode6.54.526.98 ± 1.5571.39 ± 4.81.6 ± 0.1
Table 2. Variation in crystallite size (<D>) and lattice strain (ε) of β phase for the precursors powders and TiNbMo powders with milling time.
Milling Timeε (rms)<D> (Å)
Powderα-Ti0.00103 ± 2.55 × 10−52482 ± 91
β-Nb0.00104 ± 2.311210 ± 17
β-Nb0.0011 ± 1.25 × 10−51561 ± 26
12 h0.0041 ± 1.52 × 10−4191 ± 4
24 h0.0071 ± 1.92 × 10−4178 ± 3
40 h0.0069 ± 1.85 × 10−4167 ± 4
60 h0.0068 ± 1.58 × 10−4184 ± 4
40 h in the continuous mode0.0078 ± 1.07 × 10−4268 ± 19
Table 3. Particle size (μm) distribution obtained by laser dispersion.
GranulometryMixing12 h24 h40 h60 h40 h in the Continuous Mode
d(0.1)0.19 ± 0.0020.20 ± 0.0010.19 ± 0.0020.14 ± 0.0026.36 ± 0.0010.19 ± 0.001
d(0.5)14.48 ± 0.00219.86 ± 0.72715.25 ± 1.1346.51 ± 1.14616.67 ± 0.9514.55 ± 1.063
d(0.9)42.11 ± 0.00173.34 ± 7.62942.51 ± 4.05229.07 ± 1.1546.28 ± 0.9943.47 ± 0.672
Table 4. Oxygen content obtained during the milling process.
Milling TimeOxygen (wt%)
12 h1.14 ± 0.13
24 h1.10 ± 0.07
40 h0.99 ± 0.06
60 h1.33 ± 0.01
40 h in the continuous mode1.08 ± 0.06
Table 5. Quality parameters of Rietveld refinement and the α and β phases %.
TimesRwp (%)Rexp (%)α-Ti (%)β-Ti (%)
Sintered40 h5.54.119.4 ± 0.480.6 ± 0.0
60 h6.13.926.9 ± 0.573.1 ± 0.0
40 h in the continuous mode5.84.118.7 ± 0.081.2 ± 1.7
Table 6. Variation in crystallite size <D> and lattice strain (ε) of β phase for the sintered Ti-35Nb-6Mo alloys.
Milling Timeε (Strain, rms)<D> (Crystallite Size, Å)
Sintered40 h0.0026 ± 4.67 × 10−5282 ± 3
60 h0.0025 ± 7.27 × 10−5316 ± 5
40 h in the continuous mode0.0026 ± 2.75 × 10−5334 ± 3
Table 7. Oxygen content of the sintered samples.
SinteredOxygen (wt%)
40 h1.47 ± 0.05
60 h1.49 ± 0.08
40 h in the continuous mode1.28 ± 0.1
Publisher’s Note: MDPI stays neutral with regard to jurisdictional claims in published maps and institutional affiliations.

