Article

Failure Rate Model of Materials under Uncertain Constant Amplitude Cyclic Load

School of Mechanical and Electronical Engineering, Lanzhou University of Technology, Lanzhou 730050, China
*
Author to whom correspondence should be addressed.
Metals 2022, 12(7), 1181; https://doi.org/10.3390/met12071181
Submission received: 19 May 2022 / Revised: 23 June 2022 / Accepted: 8 July 2022 / Published: 11 July 2022
(This article belongs to the Special Issue Fatigue Design of Steel and Composite Structures)

Abstract

:
Failure rate is an important reliability index of mechanical components. Failure rate is usually used to characterize the degradation rule of material performance under the cyclic load, which is critical to fatigue life prediction as well as reliability assessment of Ti–6Al–2Sn–4Zr–6Mo (Ti-6246) alloy. In order to reveal the probability characteristics of failure rate of Ti-6246 alloy under uncertain cyclic load, the equation of P-S-N curve is studied in this paper. Firstly. The probability density function for fatigue life under uncertain cyclic loading is derived from the probability density function for external stresses. A probabilistic model for the failure rate is then presented based on the basic assumptions. It is assumed that the failure rate and fatigue life of the material depend on the same damage state. Finally, the validity of the proposed model is verified by the Ti-6246 alloy fatigue test. The results show that the fatigue life of Ti-6246 alloy is more affected by material parameters (internal factors) than stress (external factors) under uncertain constant amplitude cyclic loading.

1. Introduction

The research and application of fatigue fracture of materials involve aerospace, high-speed trains and other important industries and key fields, and the problem of strength degradation caused by fatigue in the world [1,2]. Ti-6246 alloy is an alpha-beta titanium alloy offering very high mechanical strength with good retention up to 450 °C. The alloy is heat-treatable and deep-harden-able. Ti-6246 alloy is mainly used in the manufacture of compressor discs, blades and other parts of aero-engines [3,4,5]. Due to the inhomogeneous microstructure of the material, in the random distribution of material defects and the uncertainty in processing and manufacturing there is usually a certain dispersion in fatigue life for the same loading conditions. The use of different fatigue models to describe the stress/strain-life behavior also brings with it a certain dispersion of models, and the uncertainty of the random distribution of material defects usually leads to a certain dispersion of fatigue life under the same loading conditions. The general stress/strain-life model can only characterize the median fatigue life at a certain stress/strain level, so the reliability of the stress–fatigue life (S-N) curve obtained from this model is only 50%, which does not meet the engineering design requirements. The probability of failure-stress–fatigue life (P-S-N) curve is used to determine the life value of a material at a certain reliability rate, which usually requires multiple sets of fatigue tests at different stress levels, resulting in higher costs [6].
Failure rates can be estimated from empirical data and formulas in manuals, manufacturer’s data, industry standards, MIL standards, etc. If quantitative data are not available, experts can use their own experience to assess values [7]. However, all these methods are characterized by a number of limitations. The failure rate formulas provided in manuals or regulations are complex. They are only valid under very specific operating conditions, which are rarely met in practice. The failure rates recommended by manufacturers can be conservative, which can lead to excessive maintenance. Probabilistic methods for estimating downtime appear to be too complex to be applied in most practical situations, and the statistical tools and capabilities required are virtually non-existent in industry. To overcome these problems, some researchers have proposed practical non-parametric methods for failure rate analysis. The Classification and Regression Tree method was used by [8]. A method based on artificial neural networks was developed by [9]. A multivariate data classification technique was proposed by [10].
Yang [11] presented a failure rate model for a tidal turbine pitch system using empirical failure physics equations, and the associated uncertainties. The design parameters of key components are also identified and their effect on the failure rate is investigated through sensitivity analysis. The modelled failure rates are then compared with failure data for a range of turbines. Braglia [12] proposed an ensemble learning model to estimate the failure rate of equipment under different operating conditions, which allows the identification of the most important operating parameters affecting the failure rate. Yang [13] studied the actual dispersion characteristics of the material for large samples of test data when building design curves. A design curve construction method considering the stress level was proposed based on the approximate Owen tolerance method. Xie [14] established a failure rate model to consider the load uncertainty, strength uncertainty and the influence of load statistical risk. Qiu [15] established the failure rate model of mechanical parts to study the life index, which can reflect the parameters of load, strength degradation and fatigue life. To reveal the failure dependence of mechanical system, Golmakani [16] proposed a failure rate interaction model based on the Copula function, and used the model to analyze the failure rate of a two-component system. Wang [17,18] investigated a method for describing failure behavior of mechanical parts based on stress intensity interference theory. Moreover, a description method of component failure behavior under multiple failure modes is established, and component reliability, failure rate model and average failure time model are derived. Liu [19] drew frequency histograms based on the life distribution function of mechanical components, and combined with the theory of relativity to establish a Copula reliability model under the conditions of mechanical component life. This model does not need to determine the joint distribution function of random variables. Liu [20,21] established a fatigue life model based on the entire abrasion of the sleeve, which predicted fatigue life based on actual surface morphology parameters.
Based on the above analysis, many studies are conducted in-depth on the failure rate of materials, but the most only focuses on constant cyclic loading. In fact, many components operate under random and complex loads [22,23], so the uncertainty of the load should be considered during the modeling process of failure rate. In this paper, the mapping relationship between external cyclic stress and fatigue life is studied, and the conversion mechanism between the probability distribution of cyclic stress and the probability distribution of Ti-6246 alloy fatigue life is revealed. Based on the assumption that the remaining strength and remaining life depend on the same fatigue damage state in the composite material, a probabilistic model of the remaining strength of Ti-6246 alloy under uncertain constant amplitude cyclic loading is established.
The probability density function of fatigue life is obtained from the probability density function of stress by using the relationship between stress response and fatigue life in Section 2. The fatigue life distribution and failure rate model under the uncertain constant amplitude cyclic load is developed in Section 3. Finally, the proposed method is applied to assess the fatigue life and the failure rate of aero-engine compressor blade material Ti-6246 in Section 4.

2. Fatigue Life Distribution

2.1. The Formula of S-N Curve

In practical engineering, the S-N curve can illustrate the relationship between the fatigue life and the stress. The S-N curve describes the corresponding relationship between the failure cycle (fatigue life) N and the cyclic stress S. Generally, the power law formula is used to express the S-N curve of materials, as shown in Equation (1) [24]:
S m N = C

2.2. Probability Distribution of Fatigue Life

Generally, the probability distribution characteristics of material fatigue life under constant amplitude cyclic loading can be obtained by classical probability and statistics methods. However, it can only roughly judge the probability distribution trend of material fatigue life. The probability distribution law of the fatigue life of metal materials is mainly determined by two factors, the external cyclic load characteristics and the internal microstructure characteristics of the material.
For a given type of metal material, the probability distribution law of its fatigue life mainly depends on the probability distribution characteristics of the external cyclic load, so the fatigue life can be regarded as the fatigue response of the material under the action of the external cyclic load. Therefore, the probability distribution law of fatigue life can be inferred according to the probability distribution characteristics of external cyclic load.
Uncertainty constant amplitude cyclic load (also called random constant amplitude cyclic load) means that any load sample in a component is a constant amplitude cyclic stress, but for the entire component, its stress amplitude serves a specific type of probability distributions.
In Figure 1, the stress S is a random variable, representing each stress amplitude in the stress matrix, and its probability density function is fS(S). S1, S2, and S3 are three different stress samples representing three types of constant amplitude cyclic stress with different stress amplitudes, respectively.
Assuming that the probability density function of Ti-6246 alloy fatigue life under the action of uncertainty constant amplitude cyclic stress is recorded as fN(n), there is a specific mapping relationship between the probability distribution of fatigue life (fN(n)) and the probability distribution of uncertainty constant amplitude cyclic stress (fS(S)), as shown in Figure 2 [25].
Figure 2 shows the mapping relationship between fatigue life and stress probability density function, and the transfer link of this mapping relationship is the S-N curve. Therefore, based on the probability distribution characteristics of the uncertainty constant amplitude cyclic stress and the S-N curve equation of Ti-6246 alloy, a method to infer the probability distribution of Ti-6246 alloy fatigue life is given.
Based on the above analysis, the cumulative distribution function of fatigue life is defined as Equation (2):
F N ( n ) = Pr { N n }
By Equation (1), fatigue life N is transformed as a function of stress S, as shown in Equation (3):
N = C S m
Equation (3) is substituted into Equation (2) to obtain the cumulative distribution function relationship between fatigue life and stress, as shown in Equation (4):
F N ( n ) = Pr { N n } = Pr { C S m n } = Pr { S ( C n ) 1 m } = 1 Pr { S < ( C n ) 1 m } = 1 F S [ ( C n ) 1 m ]
Equation (5) shows the probability density function of fatigue life under uncertain constant amplitude cyclic load. The fatigue life distribution of materials is always affected by the stress and the material parameters. Specially, it should be noted that the parameters m and C at different survival probabilities are also different, which reflects that under different stresses, the changes in the internal microstructure of the material are also different.
f N ( n ) = d F N ( n ) d n = f S [ ( C n ) 1 m ] · [ ( C n ) 1 m ] = f S [ ( C n ) 1 m ] · [ 1 m · ( C n ) 1 m 1 · ( C n 2 ) ] = 1 m n · ( C n ) 1 m · f S [ ( C n ) 1 m ]

3. Failure Rate Law

Due to the influence of random factors such as the internal microstructure characteristics of Ti-6246 alloy, processing and manufacturing technology, and external load environment, the failure rate of Ti-6246 alloy is significantly dispersed. The distribution of fatigue life of Ti-6246 alloy has been determined, as shown in Equations (4) and (5). According to the definition of failure rate, the following expression can be obtained in Equation (6):
λ ( n ) = Pr { n < N < n + 1 | N > n } = R ( n ) R ( n + 1 ) R ( n ) = 1 R ( n + 1 ) R ( n )
The reliability R ( n ) can be formulated as:
R ( n ) = n + f N ( n ) d n = 1 0 n f N ( n ) d n = 1 F N ( n )
Substituting Equations (4) and (7) in Equation (6), the failure rate model of materials is obtained in Equation (8):
λ ( n ) = 1 R ( n + 1 ) R ( n ) = 1 1 F N ( n + 1 ) 1 F N ( n ) = 1 F S [ ( C n + 1 ) 1 m ] F S [ ( C n ) 1 m ]
Equation (8) shows the failure rate model depends on the distribution of stress (external factor) and the parameters of the material (internal factor). In other words, if the distribution of stress and the parameters of the material are different, the shape of the failure-rate curve will also be different. Especially, the parameters m and C at different survival probabilities are different, which reflects that under different stresses, the changes in the internal microstructure of the material are also different.
In the above, based on Equations (1)–(5), through the mapping model between stress and fatigue life, the probability density function of fatigue life is obtained from the stress–strain response of the material. Based on Equations (6)–(8), the failure rate model is developed based on the model between fatigue life distribution and failure rate.

4. Experimental Verification

The microstructure of the Ti-6246 alloy had a duplex nature and consisted of equiaxed primary- α particles and α platelets in a transformed β matrix. The fatigue tests were carried out on round bar stress-life (S-N) fatigue specimens. All fatigue specimens were machined from the same master disc forging and exhibited a highly homogeneous microstructure. The fatigue test machine is an MTS 810 servo-hydraulic test system. The tests are carried out at room temperature and in laboratory air for tensile–tensile fatigue. The test frequency was 20 Hz and the stress ratio was 0.05. At selected stress levels, an infrared damage detection system was used to detect crack formation [26]. The nominal chemical composition of the Ti-6246 alloy by weight percent (wt%) is: 6.5 Al, 2.25 Sn, 4.5 Zr, 6.5 Mo, 0.04 C, 0.04 N, 0.5 O, 0.0125 H, and balance Ti. The mechanical properties of Ti-6246 alloy showed a tensile strength of 1172 MPa, a yield strength of 1103 MPa, a Rockwell hardness of 39, and an elongation of 10% for a 51 mm standard specimen.
We take the test data of the Ti-6246 alloy for aero-engine compressor blade material as an example to verify the accuracy and effectiveness of the method. The fatigue test loading conditions and data are taken from reference [13,26]. Table 1 lists the key data, including mean value and standard deviation.
The least square method was used to fit the fatigue test data to obtain the P-S-N curve of Ti-6246 alloy. The results are shown in Table 2 and Figure 3. Among them, the parameters of P-S-N curves of Ti-6246 alloy are listed in Table 2, and the P-S-N curves under different survival probabilities are shown in Figure 3.
Obviously, Figure 3 shows that when the survival rate decreases, the S-N curve becomes gentle. On the contrary, when the survival rate gradually increases, the S-N curve also becomes steep. Moreover, with the increase of survival rate, the required stress is smaller under a certain life.

4.1. Fatigue Life Distribution of Ti-6246 Alloy

The uncertain constant amplitude cyclic load is assumed to follow a normal distribution, and its mean and standard deviation are μ = 880 MPa and σ = 30 MPa, respectively. Here, the S-N curve when p = 0.50 is taken as an example to illustrate the fatigue life distribution of Ti-6246 alloy under uncertain constant amplitude cyclic load. The probability density function of fatigue life of Ti-6246 alloy is obtained in Equation (9):
f N ( n ) = 1 m n · ( C n ) 1 m · f S ( C n ) 1 m = 1 25.4901 n × ( 1.9980 × 10 80 n ) 1 25.4901 × f S [ ( 1.9980 × 10 80 n ) 1 25.4901 ]
where, f S ( s ) = 1 30 2 π exp [ 1 2 ( s 880 30 ) 2 ] .
According to Equation (9), the probability density function curve of Ti-6246 is obtained in Figure 4.
Figure 4 shows that the fatigue life increases rapidly at first, then decreases slowly, and reaches a stable trend at last. Furthermore, the fatigue life distribution is derived from the stress–strain response, regardless of the fatigue life statistical method and distribution type, which is concise and accurate.

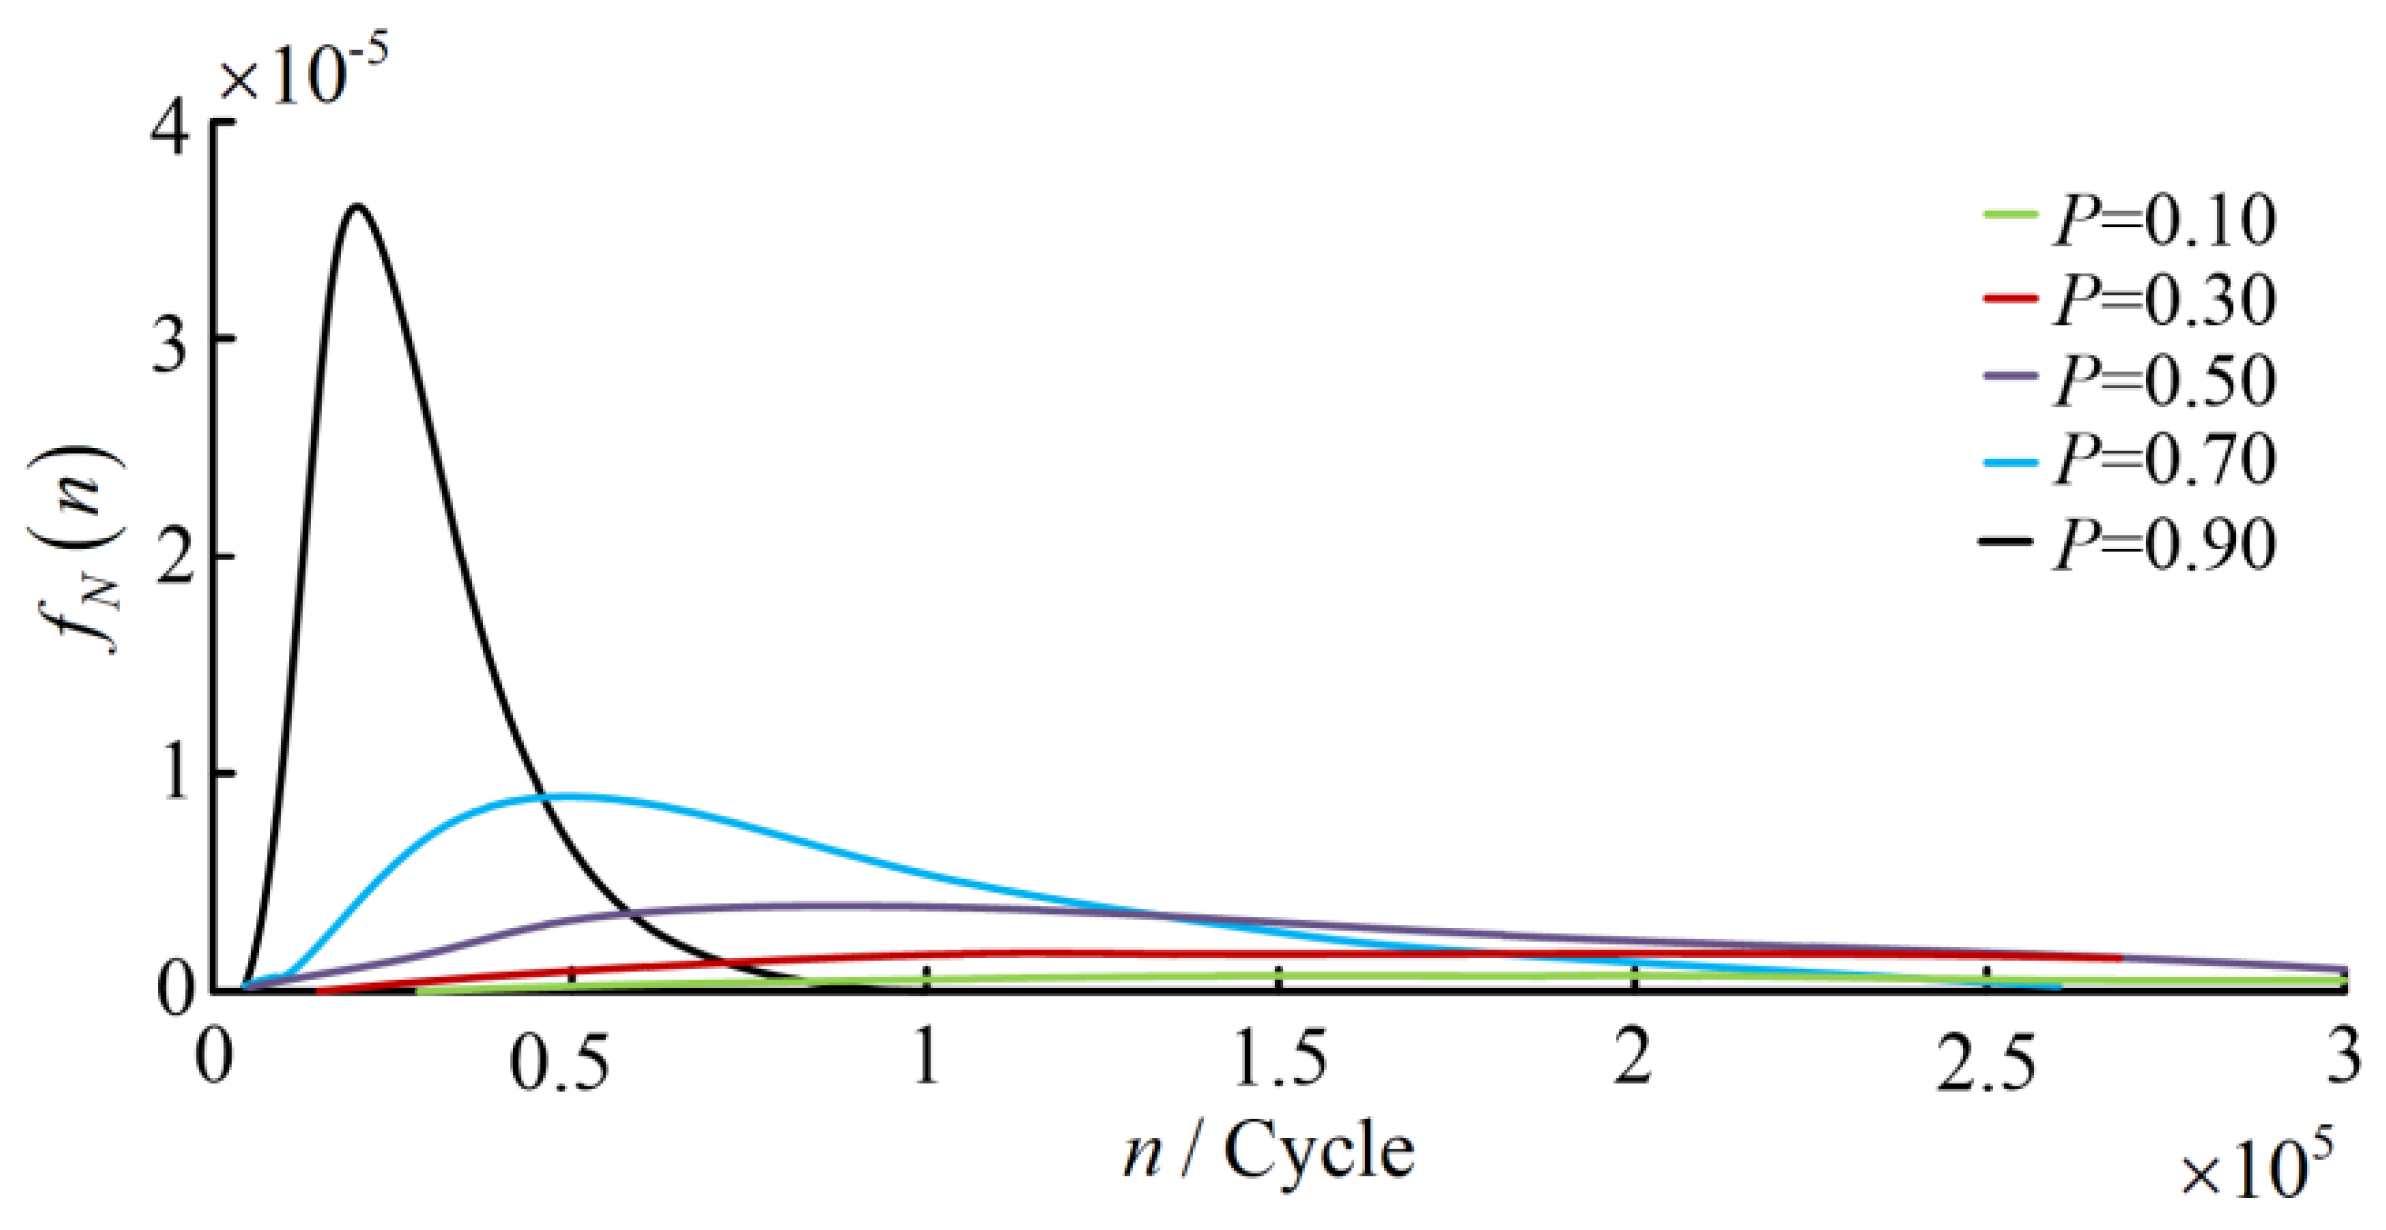
4.2. Fatigue Life Distribution Affected by m and C

To reveal the effect of material parameters on fatigue life distribution, the S-N curves at different survival probabilities are used to illustrate it. The fatigue life distributions of Ti-6246 alloy at different survival probabilities (p = 0.10, 0.30, 0.50, 0.70, 0.90) is obtained from Equation (5), the result is shown in Figure 4.
Figure 5 shows fatigue life distributions of Ti-6246 alloy at different survival probabilities are quite different. Combined with the P-S-N parameters of Ti-6246 alloy in Table 2, the mean of fatigue life decreases when the material parameters decrease. Similarly, the standard deviation of fatigue life decrease with the decreasing of material parameters. This phenomenon indicates that Ti-6246 alloy property parameters m and C have an important influence on the probability distribution pattern of the fatigue rate. Thus, the manufacturing process of Ti-6246 alloy should be improved in time to avoid or reduce the influence of the original manufacturing defects (e.g., porosity, inclusions, cracks or fractures, etc.) within the FRP and the randomness of their distribution locations on the evolution pattern of the failure rate.

4.3. Fatigue Life Distribution Affected by Stress

4.3.1. Mean Stress

The mean stress μ are 840 MPa, 860 MPa, 880 MPa, 900 MPa, respectively, and the standard deviation of σ = 30 MPa remains unchanged, so the fatigue life distributions of Ti-6246 can be obtained in Figure 6.
Figure 6 shows that, if the standard deviation of the stress remains the same, the mean fatigue life decreases with the increase of the mean stress, and the dispersion of the fatigue life increases with the decrease of the mean stress. The fatigue life is smaller when the mean stress is larger [27,28].

4.3.2. Stress Standard Deviation

If the mean stress σ = 880 MPa remains the same and the standard deviation of stress σ are 20 MPa, 30 MPa, 40 MPa, 50 MPa, respectively, the fatigue life distributions of Ti-6246 can be obtained in Figure 7.
Figure 7 shows that if the mean stress remains constant, the mean fatigue life will decrease as the stress standard deviation increases. This phenomenon indicates that the stress dispersion has a negative effect on the fatigue life of Ti-6246 alloy. Therefore, the degree of stress dispersion must be controlled in engineering practice. The smaller the standard deviation of the stress, the greater the increase in fatigue life. When the standard deviations of stress are σ = 20 MPa and σ = 50 MPa, the increasing ranges of fatigue life are larger than others.

4.4. Failure Rate of Ti-6246 Alloy

Similarly, the S-N curve when p = 0.50 is used to illustrate the failure rate of Ti-6246 alloy under uncertain constant amplitude cyclic load. According to Equation (8), the failure rate function of Ti-6246 alloy can be obtained in Equation (10).
λ ( n ) = 1 F S [ ( C n + 1 ) 1 m ] F S [ ( C n ) 1 m ] = 1 F S [ ( 1.9980 × 10 80 n + 1 ) 1 25.4901 ] F S [ ( 1.9980 × 10 80 n ) 1 25.4901 ]
where, F S ( s ) = s { 1 30 2 π exp [ 1 2 ( s 880 30 ) 2 ] } d s .
According to Equation (10), the failure rate curve of Ti-6246 alloy can be obtained, the result is shown in Figure 8.
Figure 8 shows the failure rate of Ti-6246 alloy increases rapidly at the early period. Then, the failure rate gradually decreases with the increasing of load cycles. Finally, the failure rate shows a relatively stable trend at the later period. Obviously, the failure rate curve of the Ti-6246 alloy under uncertain constant amplitude cyclic load is quite different from the traditional bathtub-shaped curve.

4.5. Failure Rate Affected by Parameters of Material

To reveal the effect of material parameters on the failure rate of Ti-6246, the S-N curves at different survival probabilities are used to illustrate it. According to Equation (8), the failure rate curves at different survival probabilities (p = 0.10, 0.30, 0.50, 0.70, 0.90) can be obtained, the results are shown in Figure 9.
Figure 9 shows the effect of material parameters on failure rate is very significant at the early stage, and the effect gradually decreases with the increasing of load cycles. Finally, the effect tends to be stable at the later stages. Overall, the failure rate increases rapidly at first, then decreases slowly, and reaches a stable trend at the end.

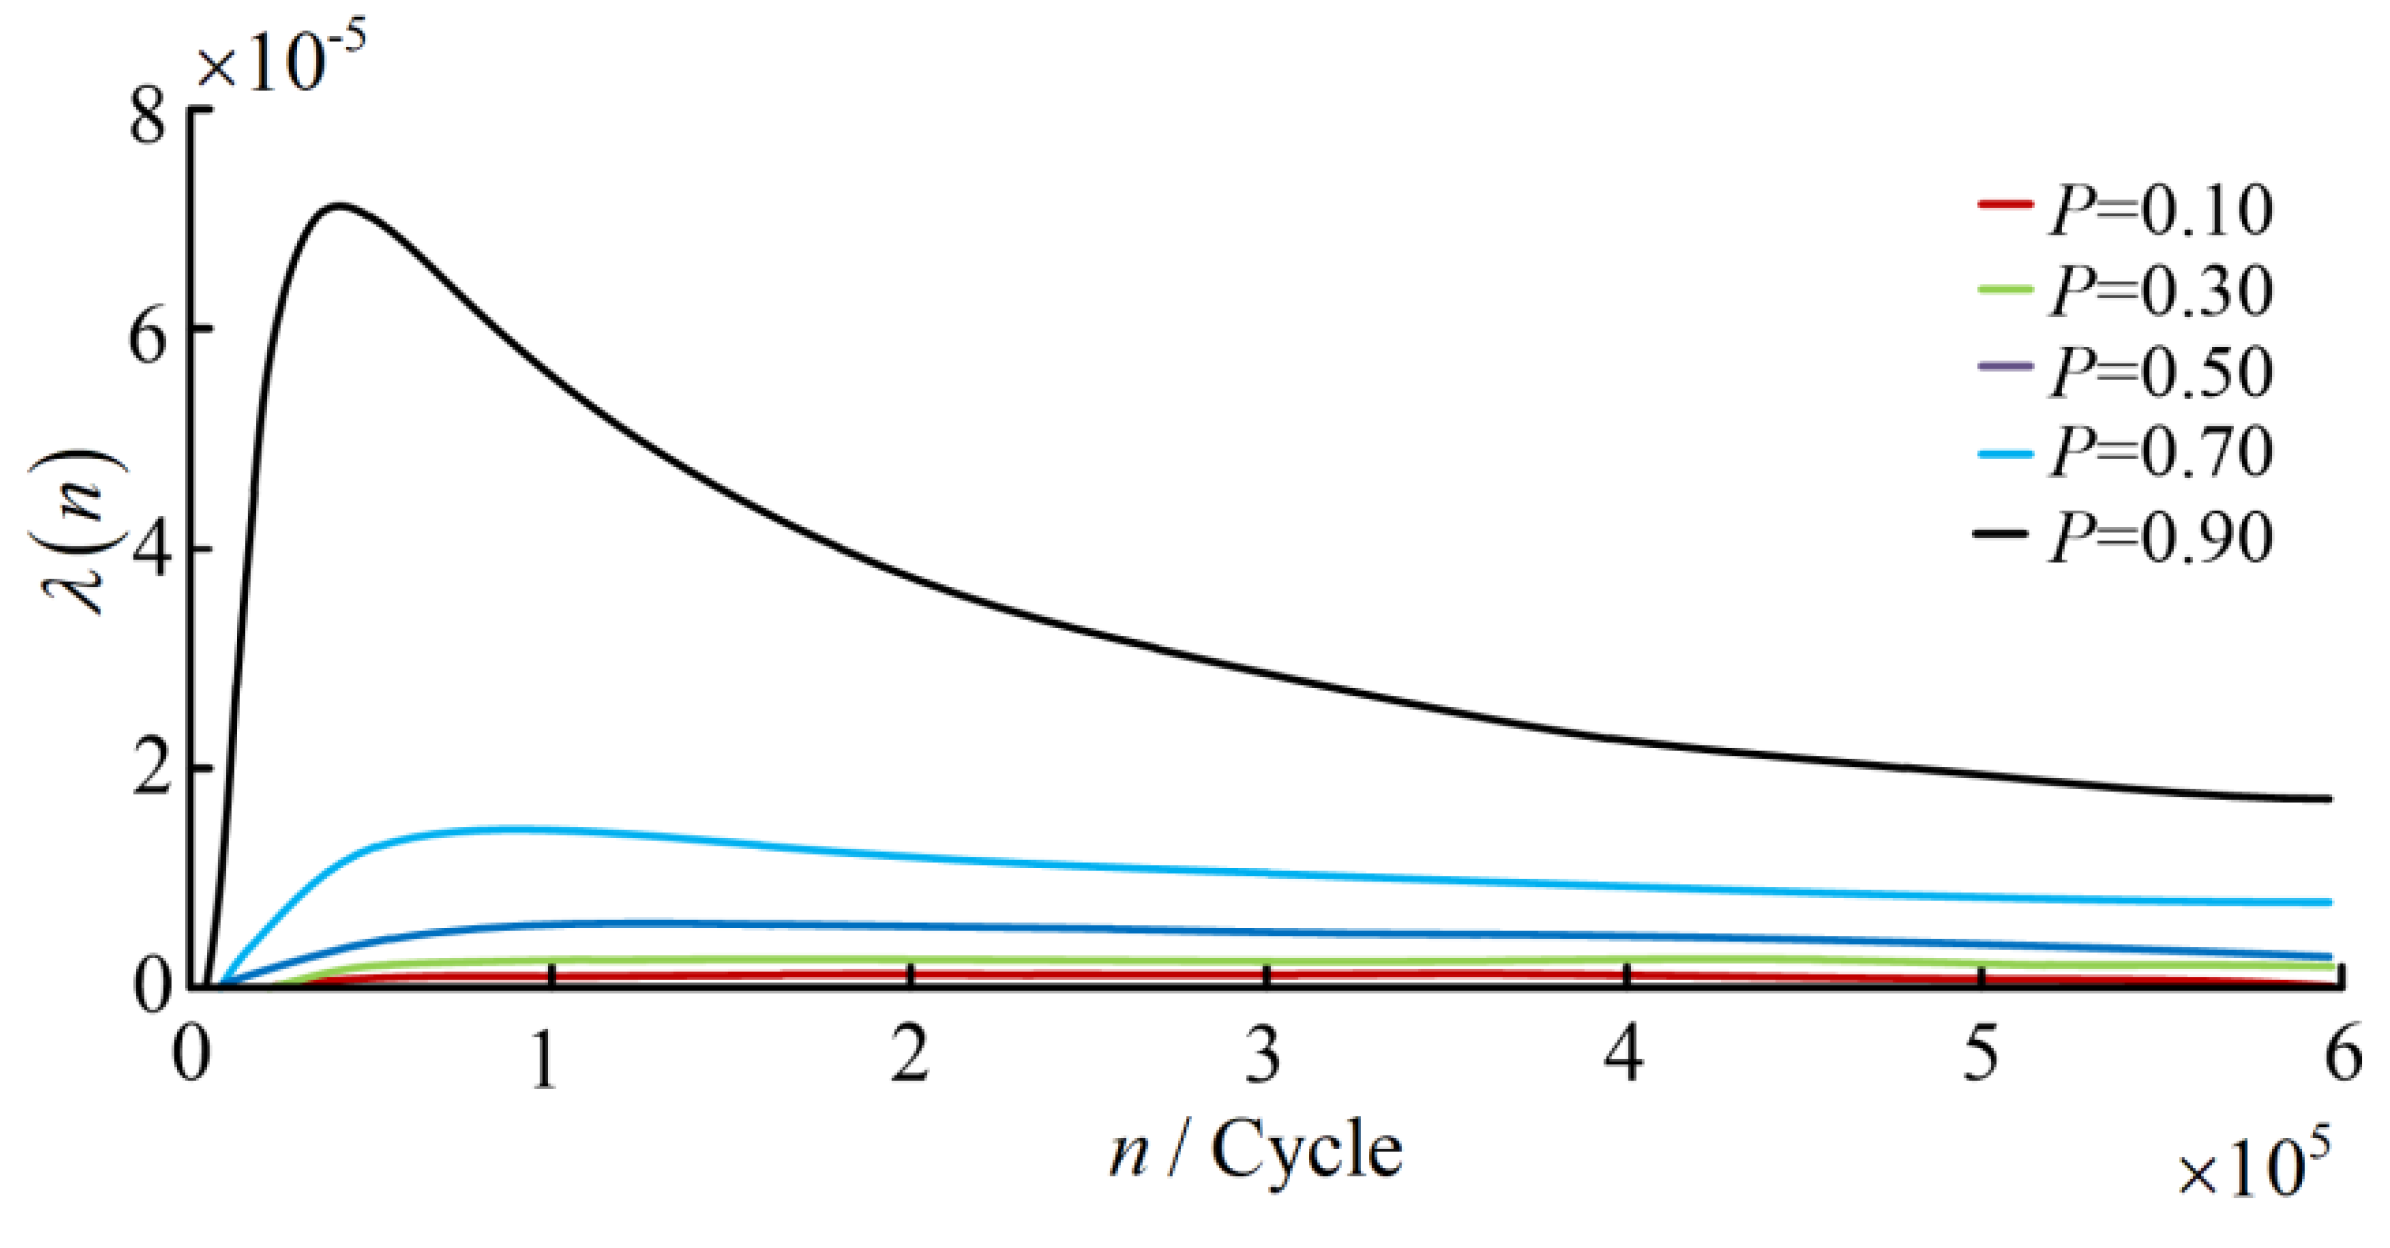
4.6. Failure Rate Affected by Stress
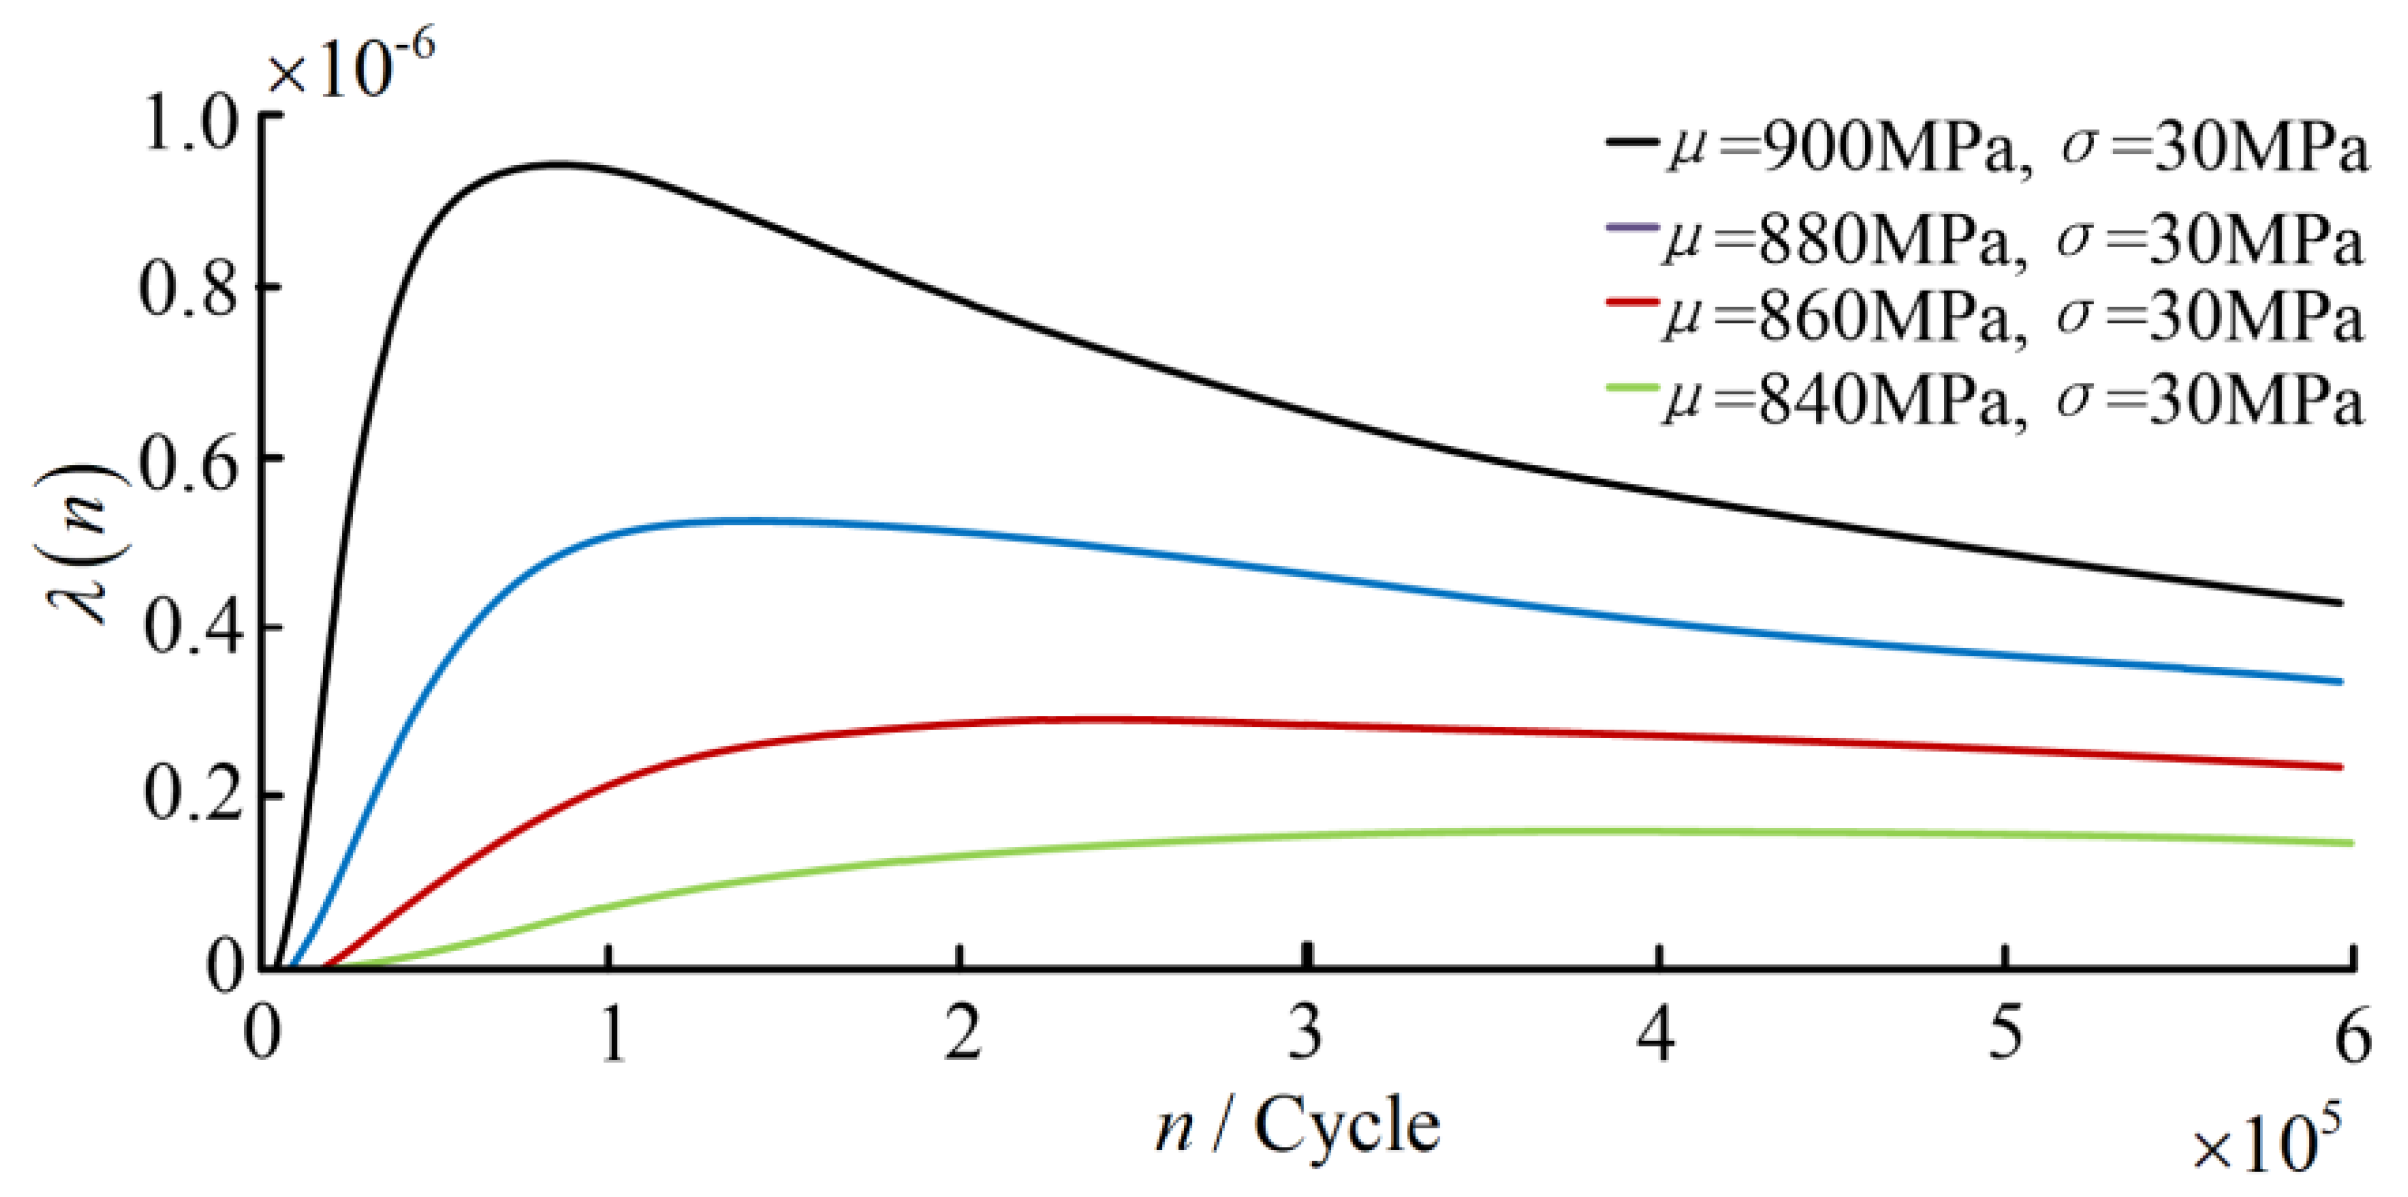
4.6.1. Mean Stress

If the standard deviation of stress σ = 30 MPa remains constant and the mean stress μ are 840 MPa, 860 MPa, 880 MPa, 900 MPa, respectively, and the failure rate curves of Ti-6246 alloy can be obtained in Figure 10.
Figure 10 shows if the standard deviation of stress remains constant, the failure rate of Ti-6246 alloy increases with the increasing of mean stress, while it decreases with the mean stress decreasing. Actually, it has been widely used in practical engineering, such as the accelerated life test. The greater the mean stress, the earlier the failure rate increases. When the mean stress is the largest, the increasing range is the largest.

4.6.2. Stress Standard Deviation

If the mean stress σ = 880 MPa remains constant and the standard deviation of stress σ are 20 MPa, 30 MPa, 40 MPa, 50 MPa, respectively, the failure rate curves of Ti-6246 alloy can be obtained in Figure 11.
Figure 11 shows if the mean stress remains unchanged, the failure rate increases with the increasing of standard deviation of stress at the early stage. However, the failure rate decreases with the increasing of standard deviation of stress at the later stages. This phenomenon indicates that the dispersion of stress has both negative and positive effects on the fatigue failure of mechanical component, which the negative effect occurs at the early stage, and the positive effect occurs at the later stages. Overall, the failure rate increases rapidly at first, then decreases slowly, and reaches a stable trend at last. However, it is different in the increasing and decreasing time (times of load applications) of failure rate. The greater the standard deviation of stress, the earlier the failure rate increases. When the standard deviation is the smallest, the increasing range is the largest.

5. Conclusions

The mapping relationship between external cyclic stress and fatigue life was investigated, and the conversion mechanism between the probability distribution of cyclic stress and the probability distribution of fatigue life of Ti-6246 alloy was revealed. Additionally, the fatigue life distribution and failure rate of Ti-6246 alloy aero-engine compressor blade material were evaluated using the proposed method.
(1) Based on the assumption that the failure rate and fatigue life depend on the same fatigue damage state in the material, a failure rate model of Ti-6246 alloy under uncertain constant amplitude cyclic loading is developed.
(2) The proposed model has the advantage of simplicity in that the fatigue life of Ti-6246 under uncertain constant amplitude cyclic loading is more influenced by material parameters (internal factors) than by stresses (external factors). The material property parameters m and C have an important effect on the probability distribution characteristics of the failure rate of Ti-6246 alloy. The mean value of stress has an effect on the mean value and dispersion of the failure rate of Ti-6246 alloy, while the standard deviation of stress has an important effect on the dispersion of the failure rate, but has little effect on the mean value of the failure rate.

Author Contributions

Methodology, X.B.; validation, Z.A.; formal analysis, Q.M.; data curation, X.W.; writing—original draft preparation, X.B. and Q.M.; writing—review and editing, X.B. and X.W.; supervision, Z.A. All authors have read and agreed to the published version of the manuscript.

Funding

This research was supported by the National Natural Science Foundation of China (No. 51665029).

Conflicts of Interest

The authors declare no conflict of interest.

Nomenclature

Pr { } the probability,
Sstress
Nfatigue life
nloading times
mmaterial parameter
Cmaterial parameter
λ ( n ) failure rate
R ( n ) reliability
μ mean stress
f N ( n ) probability density function

References

  1. Liu, X.; Zhang, M.; Wang, H.; Luo, J.; Tong, J.; Wang, X. Fatigue life analysis of automotive key parts based on improved peak-over-threshold method. Fatigue Fract. Eng. Mater. Struct. 2020, 43, 1824–1836. [Google Scholar] [CrossRef]
  2. Wang, H.; Liu, X.; Wang, X.; Wang, Y. Numerical method for estimating fatigue crack initiation size using elastic-plastic fracture mechanics method. Appl. Math. Model. 2019, 73, 365–377. [Google Scholar] [CrossRef]
  3. Kandi, R.; Sahoo, S.K.; Sahoo, A.K. Ultrasonic vibration-assisted turning of Titanium alloy Ti–6Al–4V: Numerical and experimental investigations. J. Braz. Soc. Mech. Sci. Eng. 2020, 42, 1–17. [Google Scholar] [CrossRef]
  4. Wölfle, C.H.; Wimmer, M.; Shahul Hameed, M.Z.; Krempaszky, C.; Zäh, M.; Werner, E. Towards real-time prediction of residual stresses induced by peripheral milling of Ti–6Al–4V. Contin. Mech. Thermodyn. 2021, 33, 1023–1039. [Google Scholar] [CrossRef]
  5. Fomin, F.; Froend, M.; Ventzke, V.; Alvarez, P.; Bauer, S.; Kashaev, N. Metallurgical aspects of joining commercially pure titanium to Ti-6Al-4V alloy in a T-joint configuration by laser beam welding. Int. J. Adv. Manuf. Technol. 2018, 97, 2019–2031. [Google Scholar] [CrossRef] [Green Version]
  6. Dennis, R.M.; Michael, B. Pressure Vessel Design Manual; Butterworth-Heinemann: Oxford, UK, 2012. [Google Scholar] [CrossRef]
  7. Shalev, D.M.; Tiran, J. Condition-based fault tree analysis (CBFTA): A new method for improved fault tree analysis (FTA), reliability and safety calculations. Reliab. Eng. Syst. Saf. 2007, 92, 1231–1241. [Google Scholar] [CrossRef]
  8. Bevilacqua, M.; Braglia, M.; Montanari, R. The classification and regression tree approach to pump failure rate analysis. Reliab. Eng. Syst. Saf. 2003, 79, 59–67. [Google Scholar] [CrossRef]
  9. Bevilacqua, M.; Braglia, M.; Frosolini, M.; Montanari, R. Failure rate prediction with artificial neural networks. J. Qual. Maint. Eng. 2005, 11, 279–294. [Google Scholar] [CrossRef]
  10. Braglia, M.; Carmignani, G.; Frosolini, M.; Zammori, F. Data classification and MTBF prediction with a multivariate analysis approach. Reliab. Eng. Syst. Saf. 2012, 97, 27–35. [Google Scholar] [CrossRef]
  11. Yang, D.Y.; Frangopol, D.M. Probabilistic optimization framework for inspection/repair planning of fatigue-critical details using dynamic Bayesian networks. Comput. Struct. 2018, 198, 40–50. [Google Scholar] [CrossRef]
  12. Marcello, B.; Davide, C.; Marco, F.; Roberto, G.; Leonardo, M.; Luca, P. An ensemble-learning model for failure rate prediction. Procedia Manuf. 2020, 42, 41–48. [Google Scholar] [CrossRef]
  13. Yang, X.G.; Huang, F.; Miao, G.L. Approach to construction of fatigue design curve. J. Aerosp. Power 2015, 30, 2312–2317. (In Chinese) [Google Scholar] [CrossRef]
  14. Xie, L.Y.; Lin, W.Q.; Zhang, M.C.; Yan, S.Z. Series system failure rate modeling and the mechanism to yield bathtub curve. Appl. Mech. Mater. 2012, 121–126, 4858–4862. [Google Scholar] [CrossRef]
  15. Qiu, J.; Wang, H.; Lin, D.; He, B.; Zhao, W.; Xu, W. Nonparametric regression-based failure rate model for electric power equipment using lifecycle data. IEEE Trans. Smart Grid 2017, 6, 955–964. [Google Scholar] [CrossRef]
  16. Golmakani, H.R.; Moakedi, H. Periodic inspection optimization model for a two-component repairable system with failure interaction. Comput. Ind. Eng. 2012, 61, 295–302. [Google Scholar] [CrossRef]
  17. Wang, Z.; Wang, A.N. Life probability distribution model of mechanical components with the number of load application as life parameter. J. Risk Reliab. 2014, 228, 429–434. [Google Scholar] [CrossRef]
  18. Wang, Z.; Wang, Z. Method for calculating the life probability distribution characteristic of mechanical components with multiple failure modes. J. Mech. Eng. 2017, 53, 186–193. [Google Scholar] [CrossRef]
  19. Liu, B.; An, Z.W. System reliability analysis of wind turbine gearbox considering component life dependency. J. Mech. Eng. 2015, 51, 170–177. [Google Scholar] [CrossRef] [Green Version]
  20. Liu, X.; Kan, F.; Wang, H.; Xin, X.; Wang, Z.; Huang, H. Fatigue life prediction of clutch sleeve based on abrasion mathematical model in service period. Fatigue Fract. Eng. Mater. Struct. 2020, 43, 488–501. [Google Scholar] [CrossRef]
  21. Zhang, M.; Liu, X.; Wang, Y.; Wang, X. Parameters distribution characteristics of material fatigue life based on improved bootstrap method. Int. J. Damage Mech. 2019, 28, 772–793. [Google Scholar] [CrossRef]
  22. Maljaars, J.; Vrouwenvelder, A.C.W.M. Probabilistic fatigue life updating accounting for inspections of multiple critical locations. Int. J. Fatigue 2014, 68, 24–37. [Google Scholar] [CrossRef] [Green Version]
  23. Wu, Z.R.; Hu, X.T.; Zhu, L.; Song, Y.D.; Li, Z.X. Evaluation of fatigue life for TC4 notched components under variable amplitude multiaxial loading. Iran. J. Sci. Technol. Trans. Mech. Eng. 2019, 43, 235–243. [Google Scholar] [CrossRef]
  24. Zhai, J.M.; Li, X.Y. A methodology to determine a conditional probability density distribution surface from SN data. Int. J. Fatigue 2012, 44, 107–115. [Google Scholar] [CrossRef]
  25. Gao, J.X.; An, Z.W.; Kou, H.X. Structural probabilistic model of fatigue cumulative damage under uncertain cyclic load. J. Harbin Eng. Univ. 2017, 38, 263–268. [Google Scholar] [CrossRef]
  26. Jha, S.K.; Larsen, J.M.; Rosenberger, A.H.; Hartman, G. Dual fatigue failure modes in Ti–6Al–2Sn–4Zr–6Mo and consequences on probabilistic life prediction. Scr. Mater. 2003, 48, 1637–1642. [Google Scholar] [CrossRef]
  27. Rao, M.S.; Naikan, V.N.A. A system dynamics model for transient availability modeling of repairable redundant systems. Int. J. Perform. Eng. 2015, 11, 203–211. [Google Scholar] [CrossRef]
  28. Xie, L.; Liu, J.; Wu, N.; Qian, W. Backwards statistical inference method for PSN curve fitting with small-sample experiment data. Int. J. Fatigue 2014, 63, 62–67. [Google Scholar] [CrossRef]
Figure 1. Uncertainty constant amplitude cyclic load.
Metals 12 01181 g001
Figure 2. Stress distribution and fatigue life distribution law.
Metals 12 01181 g002
Figure 3. P-S-N curves of Ti-6246 alloy.
Metals 12 01181 g003
Figure 4. Probability density function curve of fatigue life of Ti-6246.
Metals 12 01181 g004
Figure 5. Fatigue life distribution affected by parameters of material.
Metals 12 01181 g005
Figure 6. Fatigue life distribution affected by mean stress.
Metals 12 01181 g006
Figure 7. Fatigue life distribution under stress standard deviation.
Metals 12 01181 g007
Figure 8. Failure rate curve of Ti-6246 alloy.
Metals 12 01181 g008
Figure 9. Failure rate affected by parameters of material.
Metals 12 01181 g009
Figure 10. Failure rate affected by mean stress.
Metals 12 01181 g010
Figure 11. Fatigue life distribution under stress standard deviation.
Metals 12 01181 g011
Table 1. The test data of Ti-6246 alloy.
Cyclic Alternating Stress (MPa)Number of SpecimensFatigue Life (Cycles, ×105)Mean Value
(Cycles)
Standard Deviation
(Cycles)
820140.20617, 0.60839, 0.64257, 1.21128, 15.63151, 16.87442, 21.69694, 29.46633, 33.59605, 38.30456, 42.72785, 45.62387, 53.75202, 74.611912.6782 × 1062.2850 × 106
860180.21099, 0.34129, 0.57048, 0.60254, 0.60915, 0.69451, 0.73352, 0.99616, 2.26120, 3.57854, 4.70294, 5.91634, 15.65031, 19.91498, 26.73786, 27.03170, 30.81965, 50.401541.0654 × 1061.4577 × 106
900180.27164, 0.28069, 0.34547, 0.35699, 0.38119, 0.40260, 0.44421, 0.52335, 0.75066, 0.76725, 0.88439, 1.22759, 1.28245, 2.52548, 8.87648, 13.15610, 16.73239, 21.049123.9032 × 1056.4777 × 105
92580.21141, 0.24369, 0.30656, 0.30993, 0.36916, 0.43020, 0.53532, 2.819286.5319 × 1048.8132 × 104
Table 2. P-S-N parameters of Ti-6246 alloy.
PmC
0.1037.04681.4138 × 10115
0.3030.22243.7239 × 1094
0.5025.49011.9980 × 1080
0.7020.75911.0824 × 1066
0.9013.92792.7221 × 1045
Publisher’s Note: MDPI stays neutral with regard to jurisdictional claims in published maps and institutional affiliations.

