Article

Melting–Dropping Property of Blast Furnace Charge on the Basis of Its Slag Formation Behavior

1
College of Materials Science and Engineering, Chongqing University, Chongqing 400044, China
2
Institute Research of Iron & Steel, Sha-Steel, Zhangjiagang 215625, China
3
College of Metallurgical and Ecological Engineering, University of Science and Technology Beijing, Beijing 100083, China
*
Authors to whom correspondence should be addressed.
Metals 2022, 12(6), 987; https://doi.org/10.3390/met12060987
Submission received: 6 April 2022 / Revised: 30 May 2022 / Accepted: 2 June 2022 / Published: 8 June 2022

Abstract

:
In order to reveal the melting–dropping property of a charged blast furnace (BF) and the mechanism of its slag formation, such as the temperature interval of slag formation, the pressure drop during the reduction process, and the K value of each sample, the soft melt drop experiment was tested in a large-capacity melting–dropping furnace. The results show that a positive linear relationship exists between the slag melting behavior and the melting–dropping property of the corresponding charge. The results indicate that owing to their poor melting–dropping property, single iron ores are not suitable for BF production and the charging mix can improve slag formation as well as the melting–dropping property when the temperature is increased. Chemical composition is the key factor that will affect slag formation. An excessive amount of lump ore in the charging mix favors the formation of a high-fusion point slag phase such as spinel at low temperatures. The charging mix containing fewer lump ore has high FeO content in the slag, decreasing fluidity at increased temperature. Consequently, the gas path is choked and permeability is reduced.

1. Introduction

Numerous studies have been conducted on blast furnaces (BF), both locally and internationally [1,2,3]. Dissection of a BF [4] reveals that BF production is mainly affected by the shape and position of the cohesive zone. Several researchers have confirmed that the melting–dropping property of the BF charge significantly influences the formation of a cohesive zone [5,6]. Wu and colleagues demonstrated that iron ores interact with one another to improve the melting–dropping property of the BF charge [7,8,9].
Traditional BF production in China aims to achieve a high clinker rate, which can improve BF smelting, decrease the fuel ratio, and improve the reduction behavior of the BF charge, thus facilitating BF production [10,11,12]. In recent decades, the quality of iron ores has increasingly worsened because of rapid consumption by ironmaking industries and insufficient productivity in large-scale mining. Consequently, some iron and steel operations have increased the proportion of lump ore in BF charge, causing the melting–dropping property of iron ores to fluctuate markedly [8,13,14]. Thus, the primary cause of this occurrence needs to be investigated.
Current research on melting–dropping properties is limited to the performance of BF charge and the formation behavior of primary slag [7,9,15,16]; studies on the relationship between the melting–dropping property and slag formation of the BF charge are rarely reported. In the present study, the melting–dropping property of the BF charge and its slag formation behavior are evaluated by means of a large-capacity melting–dropping furnace. The mechanism underlying the change in the melting–dropping property of the BF on the basis of its slag formation behavior is investigated by scanning electron microscopy (SEM), X-ray diffractometry (XRD), X-ray fluorescence spectroscopy (XRF), and melting-point tests (MPT). The thermodynamic software FactSage 6.3.1, (Thermfact/CRCT, Montreal, QC, Canada) and GTT-Technologies (Aachen, Germany) is also used.

2. Materials and Procedures

2.1. Raw Material

Raw materials were used in the actual production, including two sinters of different basicity (S-1, S-2), a flux pellet (P-1), an oxidized pellet (P-2), and a lump ore (O-1). The chemical compositions of the iron ores and charging mixes are listed in Table 1, and the proportions of constituent raw materials in the charging mixes are shown in Table 2. (H1 and H2 are the charging mixes containing sinter S-1 and S-2, respectively; A and B denote the different ratios of lump ore.)
With regard to the chemical compositions of the iron ores and charging mix iron grade, pellets are considerably higher than the others while sinters are relatively low. Lump ore exhibits the lowest basicity, with high SiO2 content and low CaO content. S-2 contains a high proportion of CaO; hence, there is a higher basicity of S-2 over S-1.

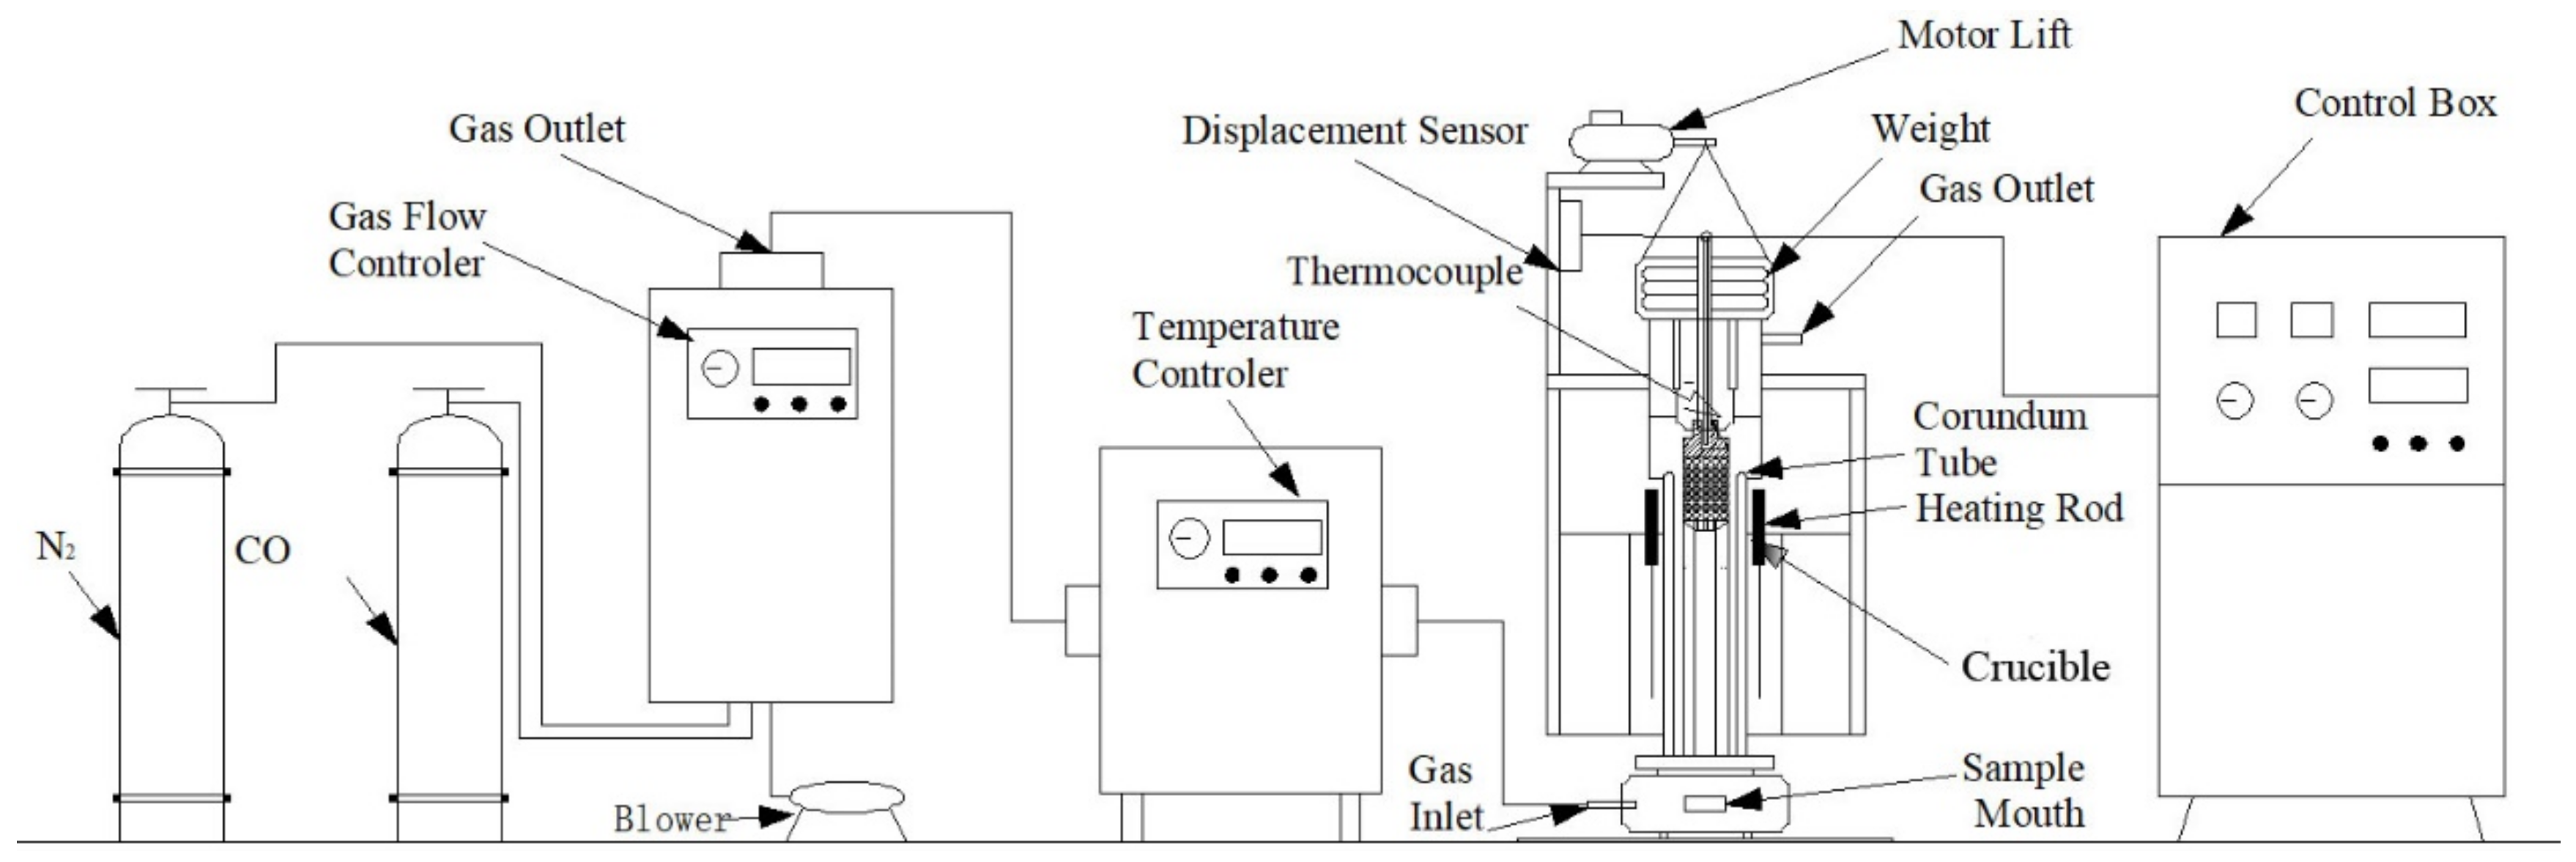
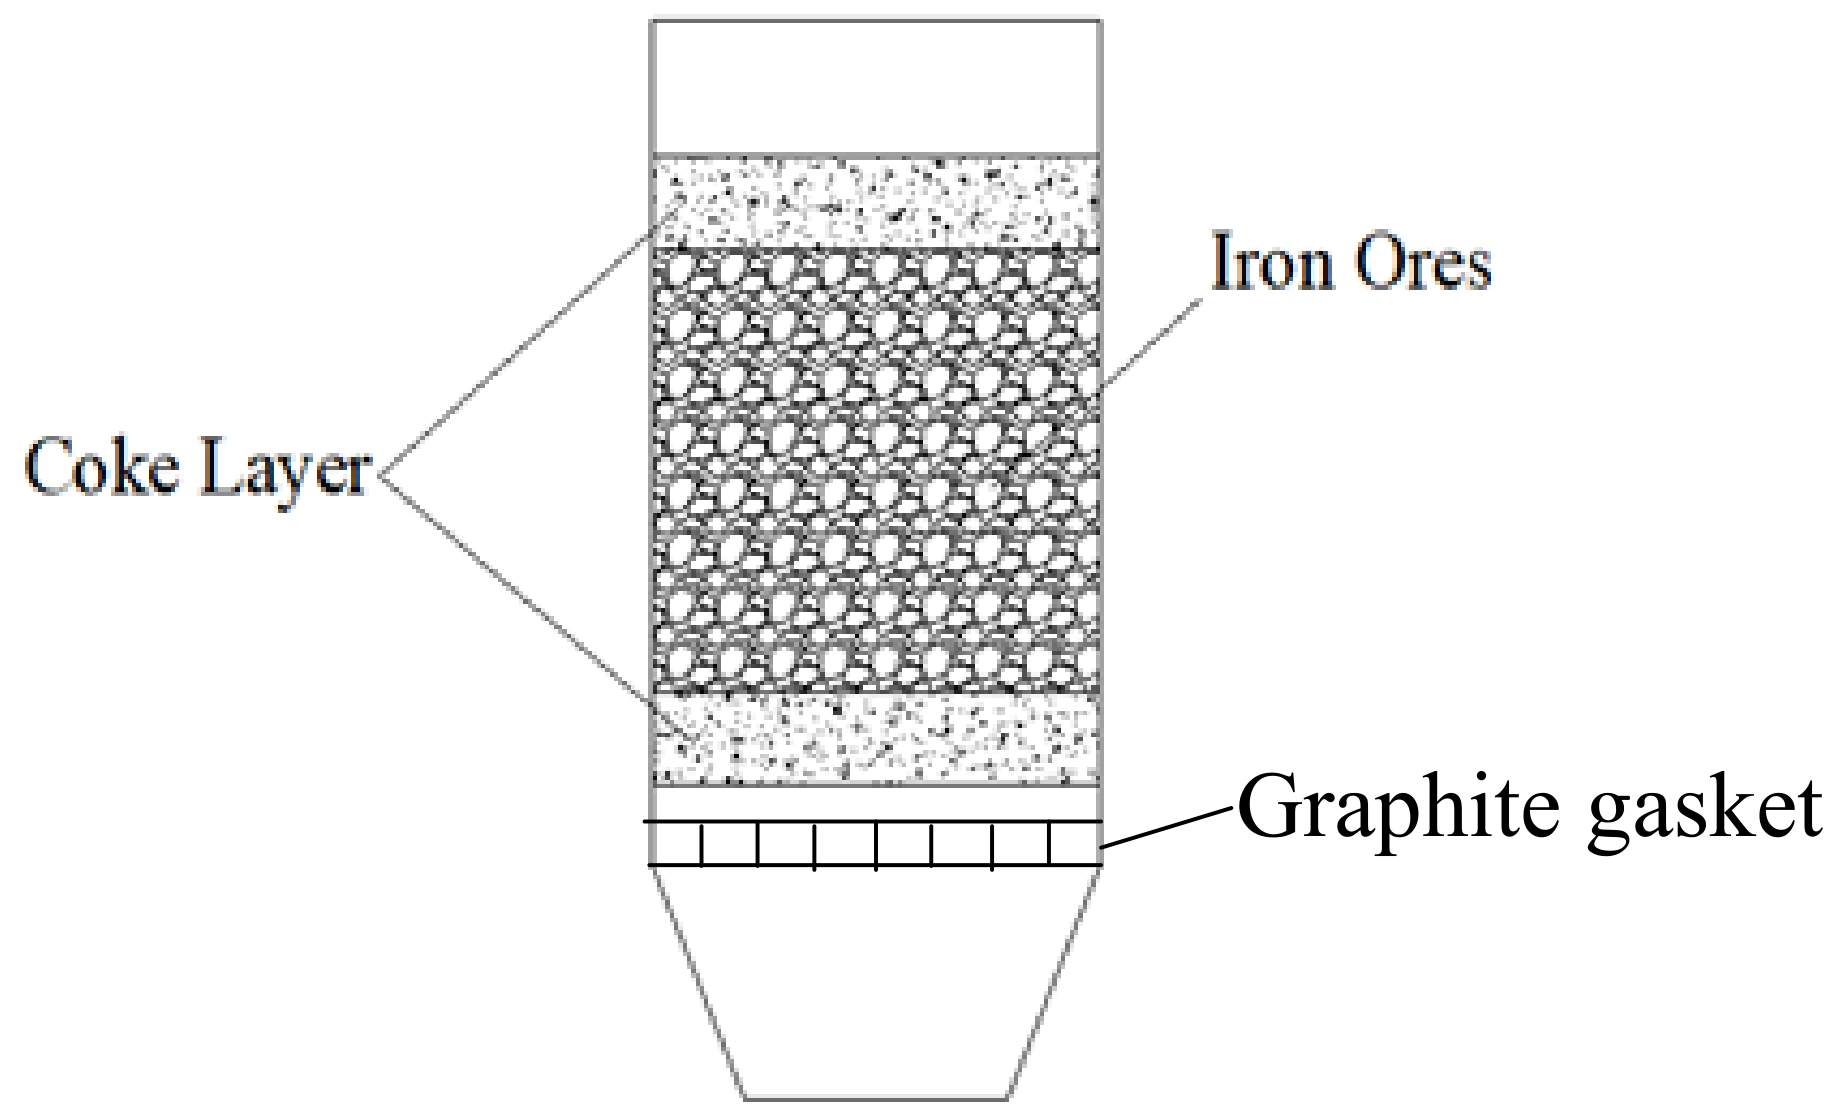
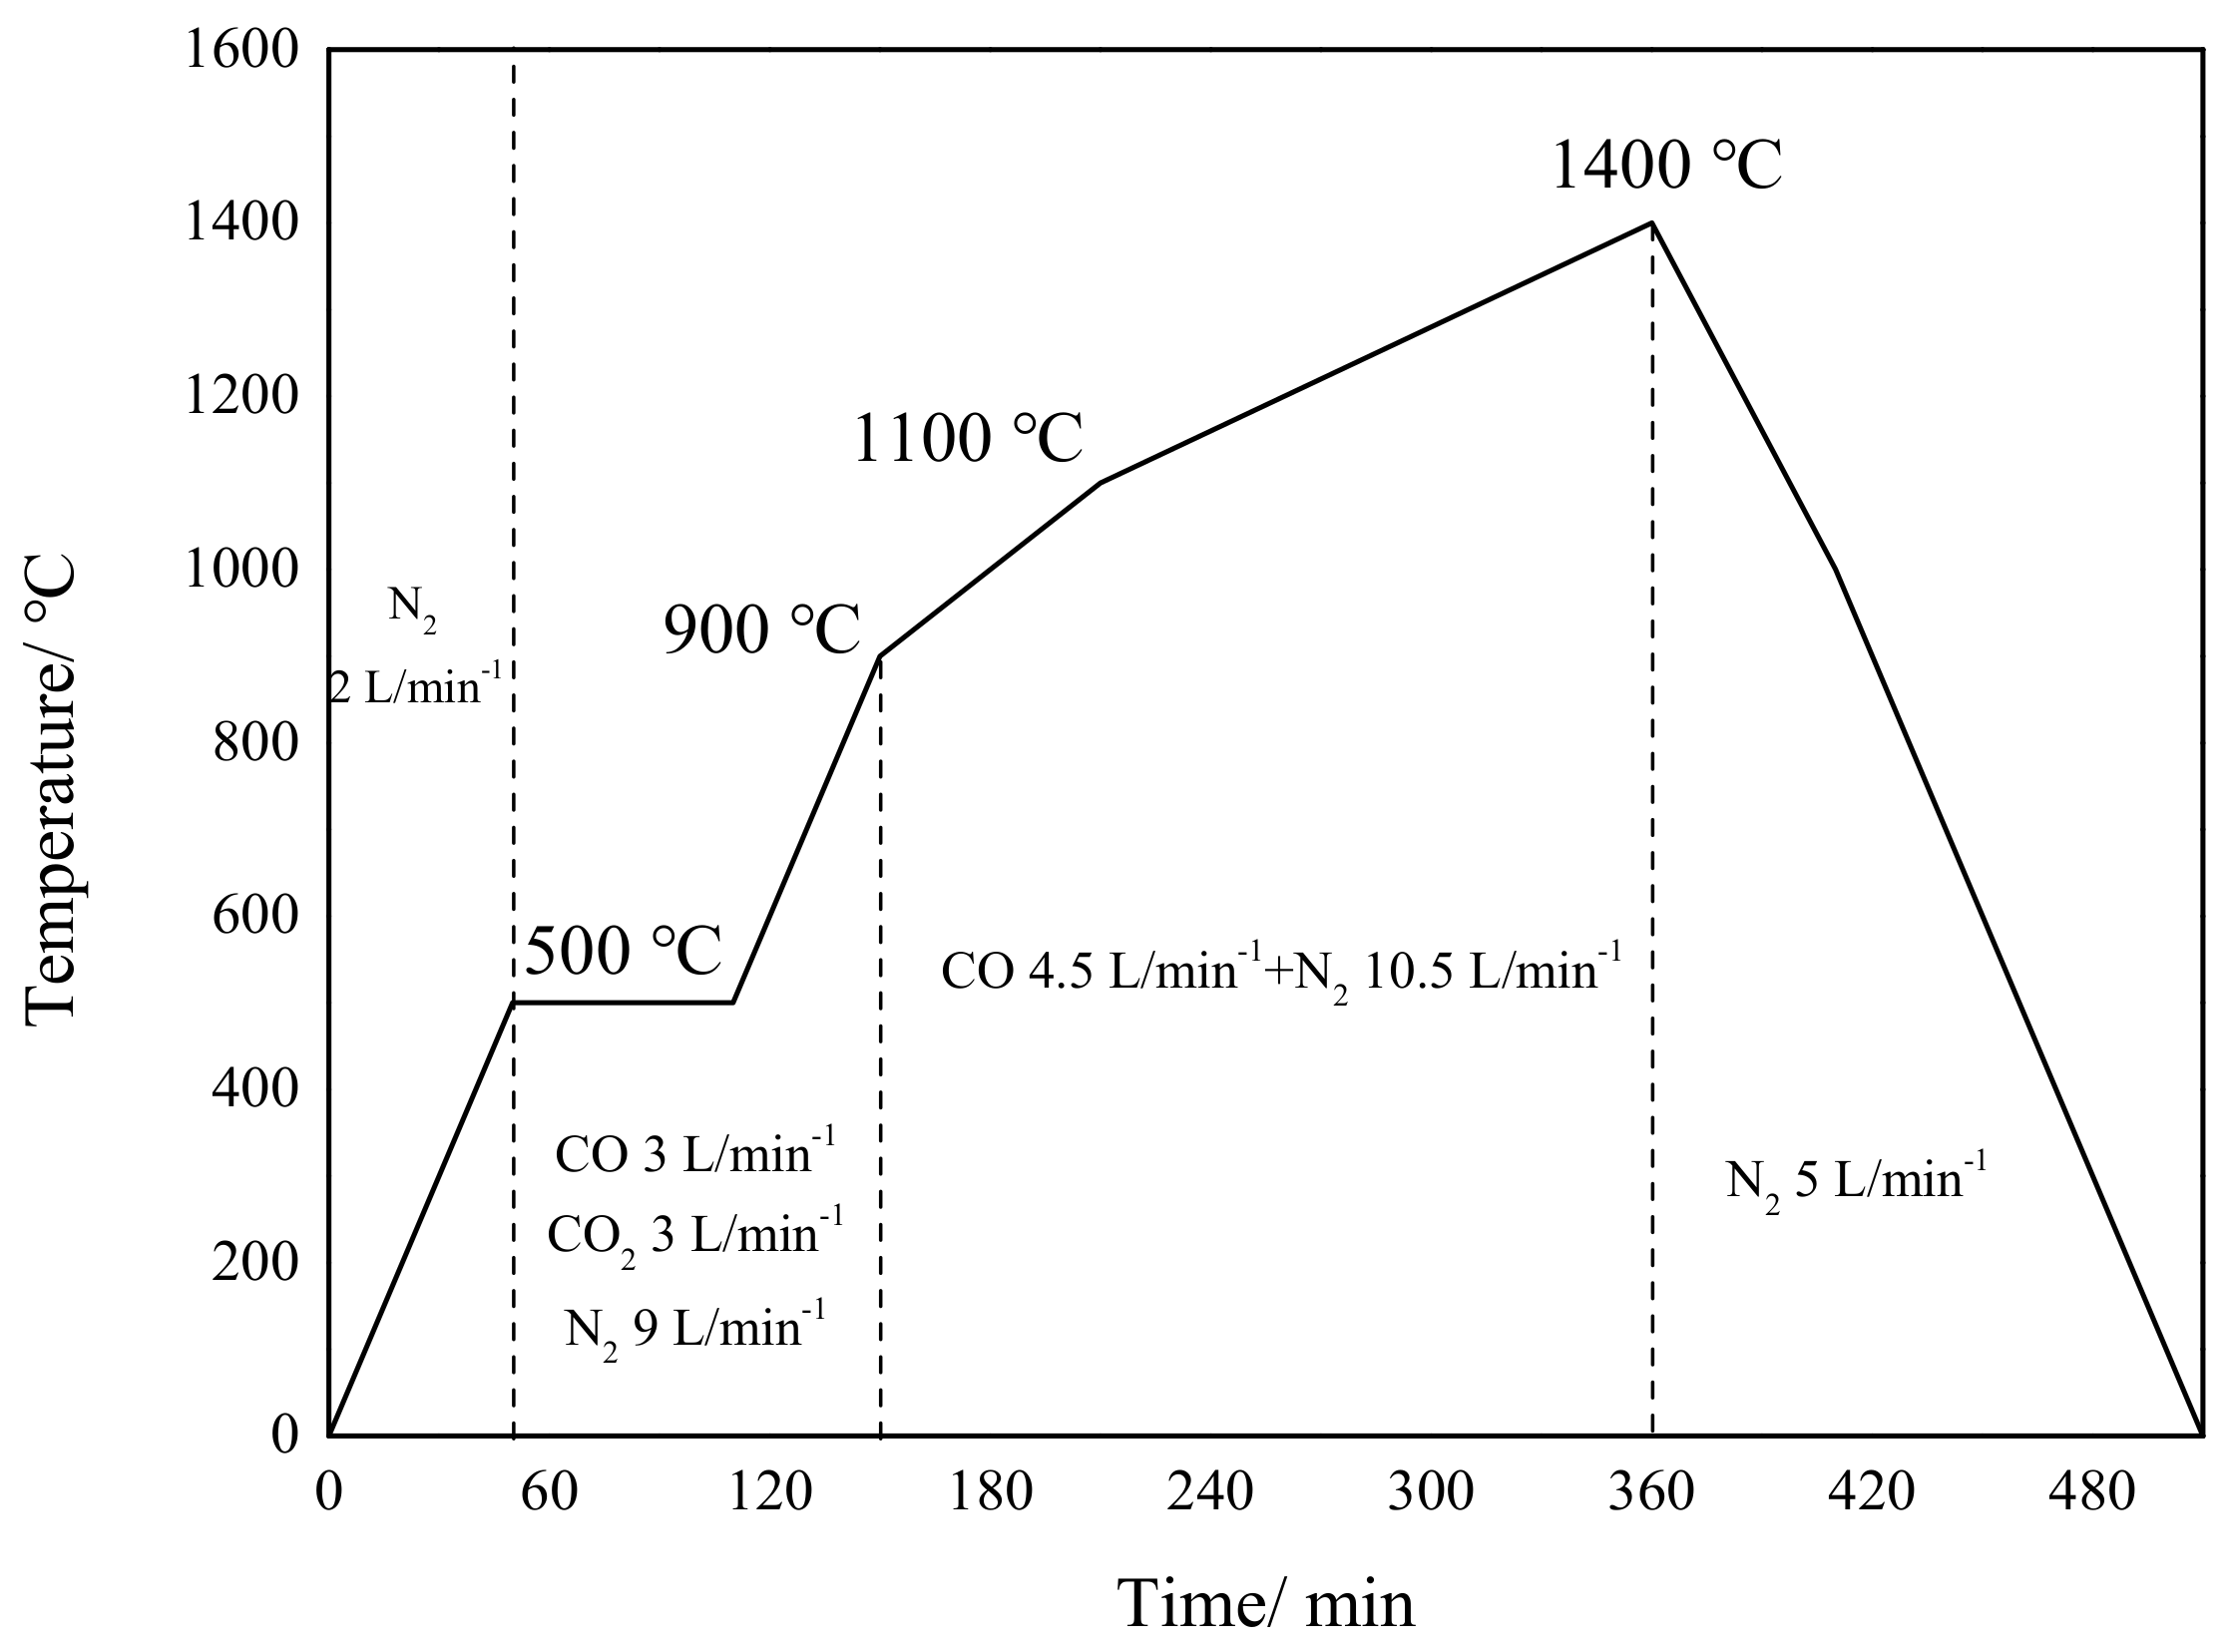
2.2. Experimental Procedure

Experiments on the slag formation behavior were conducted in a large-capacity melting–dropping furnace. A schematic diagram is shown in Figure 1. The apparatus comprises a gas-flow controller, a heating element, and a reacting volume. The gas was mixed and injected into the sample bed from the side. All data included the pressure obtained by the pressure gauges. The temperature was measured with thermocouples, and the sample-bed shrinkage rate was transmitted to the data logger. The sample bed, which consisted of alternating layers of iron ore and coke, was set in the graphite crucible of the reacting components. The molten iron and slag were collected in the mouth of the sample. These devices were designed to simulate the condition of the BF interior and investigate the interaction between the iron ores and slag formation behavior.
For each test, iron ore with a layer thickness of 160 mm was placed in a graphite crucible (Figure 2), the inner diameter of which was 120 mm; there was a graphite gasket of the same size at the bottom on which samples could be placed; and there were 5-mm holes evenly distributed on the graphite gasket, from which the drops will drop at high temperature. Coke with a layer thickness of 10 mm was set above and below the iron ore layer. All samples measured 8 mm to 12 mm in diameter. Each test followed a preset program of temperature and gas flow (see Figure 3). In addition, to simulate the conditions in the BF interior better and ensure that the charging mix was previously reduced adequately, the sample was kept at 500 °C for 60 min. After a test was complete and slag had formed, 5 L/min–1 N2 was injected to cool the sample.
Owing to the invisibility of the BF interior, the measured parameters are quantified to evaluate the melting–dropping properties of the charging mix, as well as the slag formation behavior [7,9]. In the current study, Ts is the temperature at which the pressure increases sharply, reflecting the active slag formation behavior. Pmax is the highest value of the sample pressure, and its temperature is defined as Tp, which is also regarded as the maximum rate of slag formation. T10 and T40 are the temperatures when the packed bed shrinkage is 10% and 40%, respectively. The softening interval of the charging mix is (T40T10). The K value is introduced to quantify the permeability of the charging mix, which is the integral of pressure drop over the slag formation behavior. The equation determining K is
K = T s T p P max P s   d t ,
where Ts and Tp are the upper and lower boundary temperatures of the slag formation rate, respectively, and Ps denotes the pressure drop at Ts.
To reduce the experimental error, each test was repeated. When the detection was completed, the graphite crucible was dissected, and the slag was separated from the nondropped. The chemical compositions of the nondropped slags were measured by X-ray fluorescence spectrometry (XRF). The viscosities of the nondropped slags were calculated from the XRF measurements with the viscosity module of FactSage. The phases in the slag were identified by XRD. The melting points of slag samples were measured by RDS-04 automatic slag melting point and melting rate tester (MPT). Before MPT test, the sample were machined to Φ 3 mm × 3 mm cylindrical and dried for 24 h under natural conditions; In the technique, the samples were placed on a corundum plate and heated at 10 °C/min under atmosphere of N2 and 3 tests for every sample. Figure 4 shows the change in the shape of a sample during heating.

3. Results and Discussion

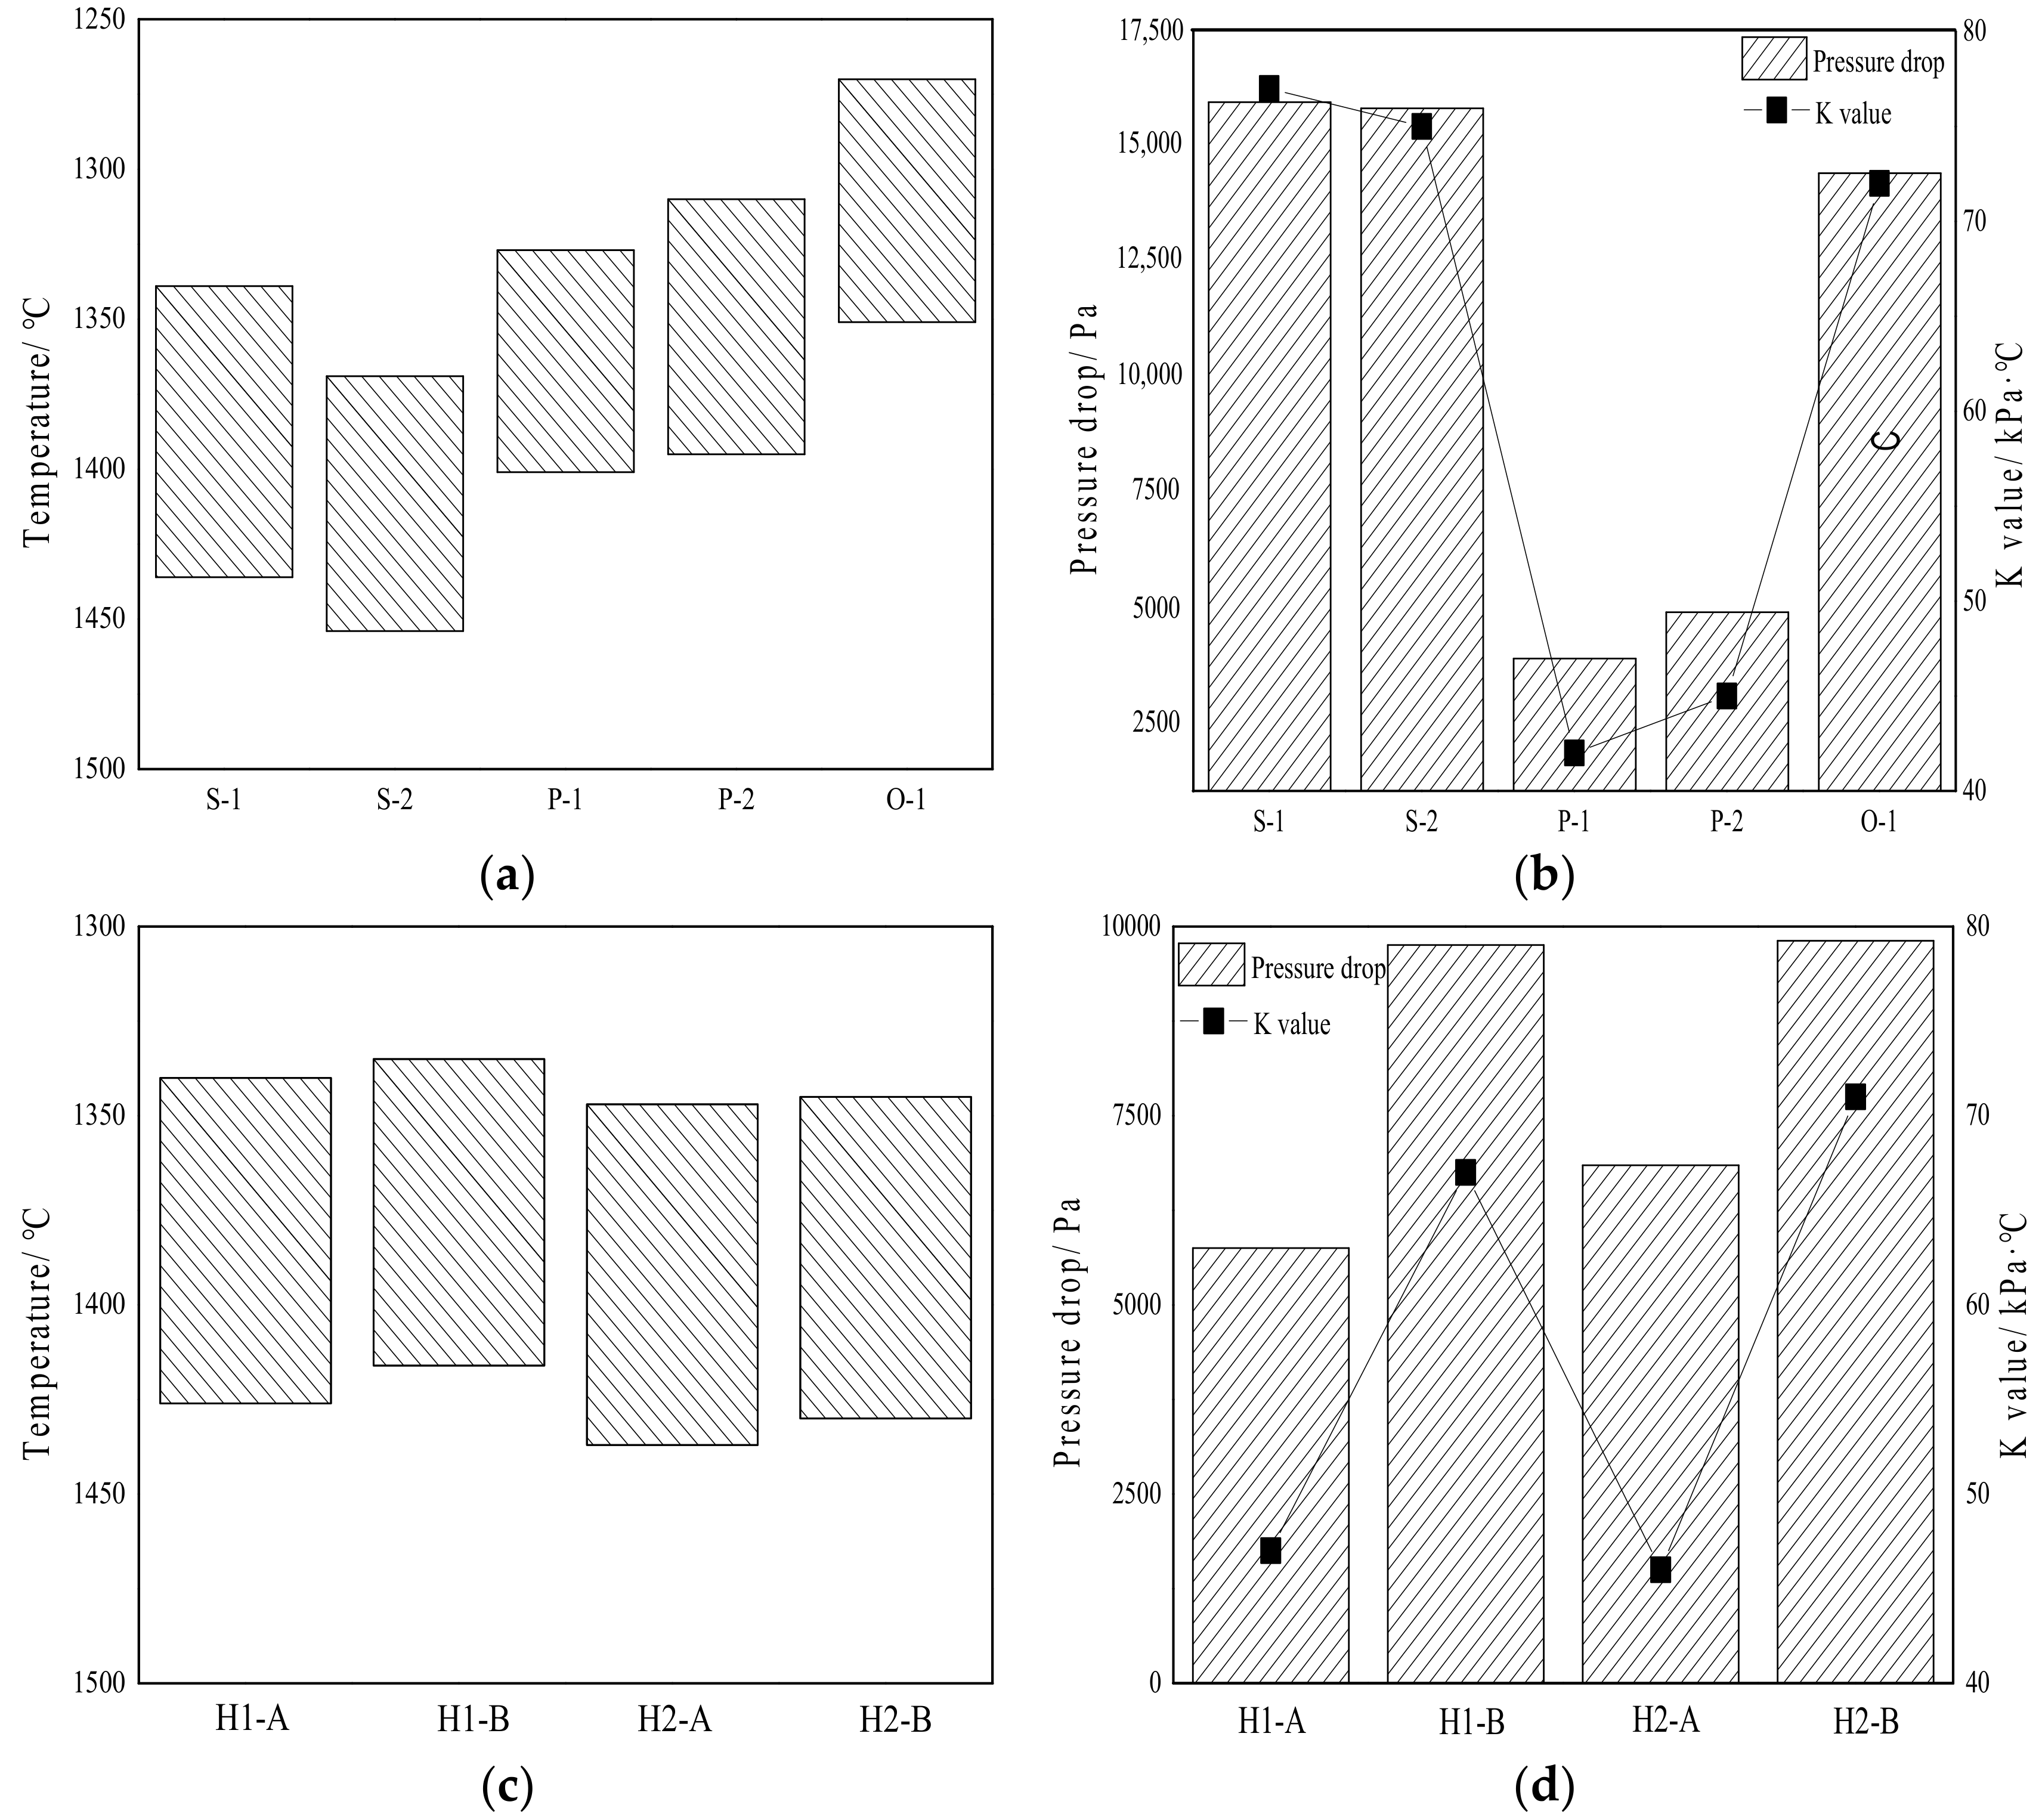
3.1. Melting–Dropping Property and Slag Formation Behavior

The melting–dropping properties of each of the samples—i.e., the temperature interval of slag formation, the pressure drop during the reduction process, and the K value of each sampleare shown in Figure 5.
As shown in Figure 5, the samples S-1 and S-2 have relatively higher initial temperatures and final temperatures for slag formation than those of the other iron ores. This finding reflects the BF charge position in the lower part of the BF. The lump ore O-1 starts its slag formation at 1270 °C. Its corresponding charge position is in the upper part of the BF, which can lead to hanging and easy slipping. The temperature intervals of the cohesive zone of the pellets are the shortest of all the samples, the charge of which forms reduced resistance on the gas flow; the fine permeability is likely to decrease the pressure drop, and the K values of the pellets is less than those of the other iron-ore samples.
For the mixed samples, the cohesive zone lies between those of the sinters and the pellets. In addition, the pressure drops of the mixed samples are less than those of the sinters and the lump ore. The larger the proportion of lump ore in a mixed sample, the larger the pressure drop, and the K value increases correspondingly. Compared with the pressure drops of H1-A and H2-A, the higher basicity of the sinter can increase the effect of the permeability of the charge. The K value of a mixed sample with a higher proportion of sinter S-2 is higher than that of a sample containing more S-1, with the basicity of the former being higher.

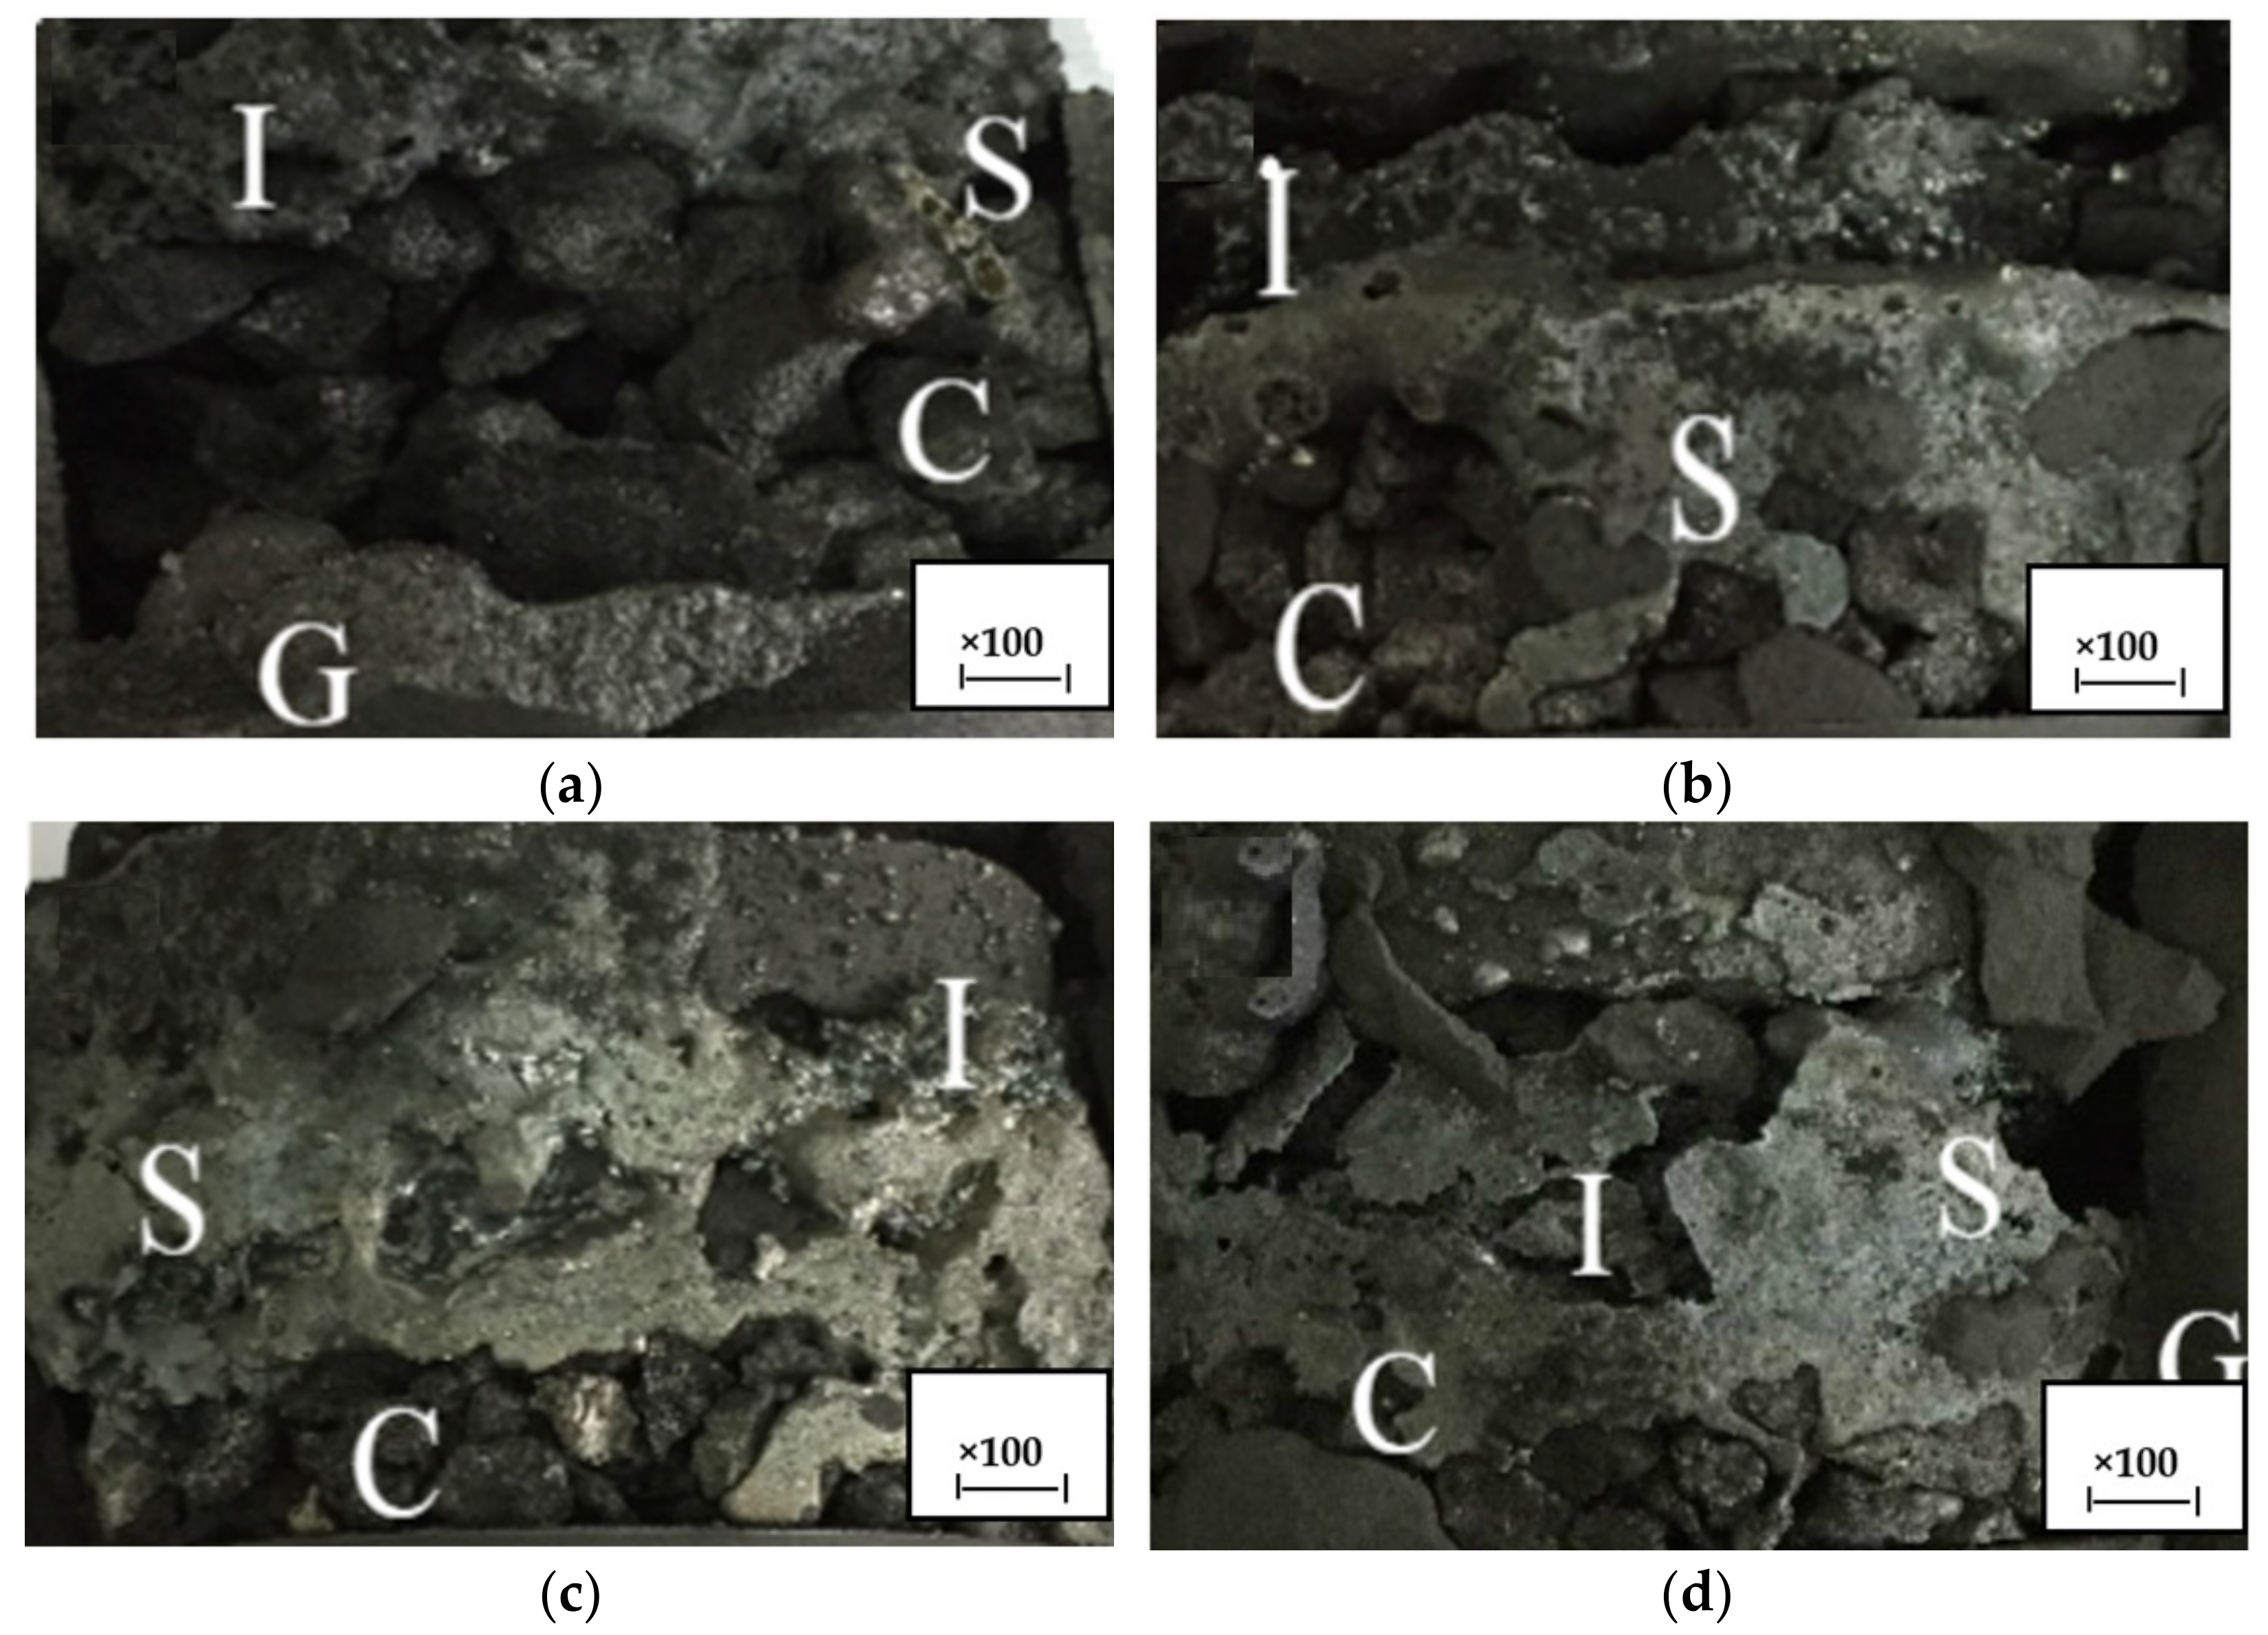
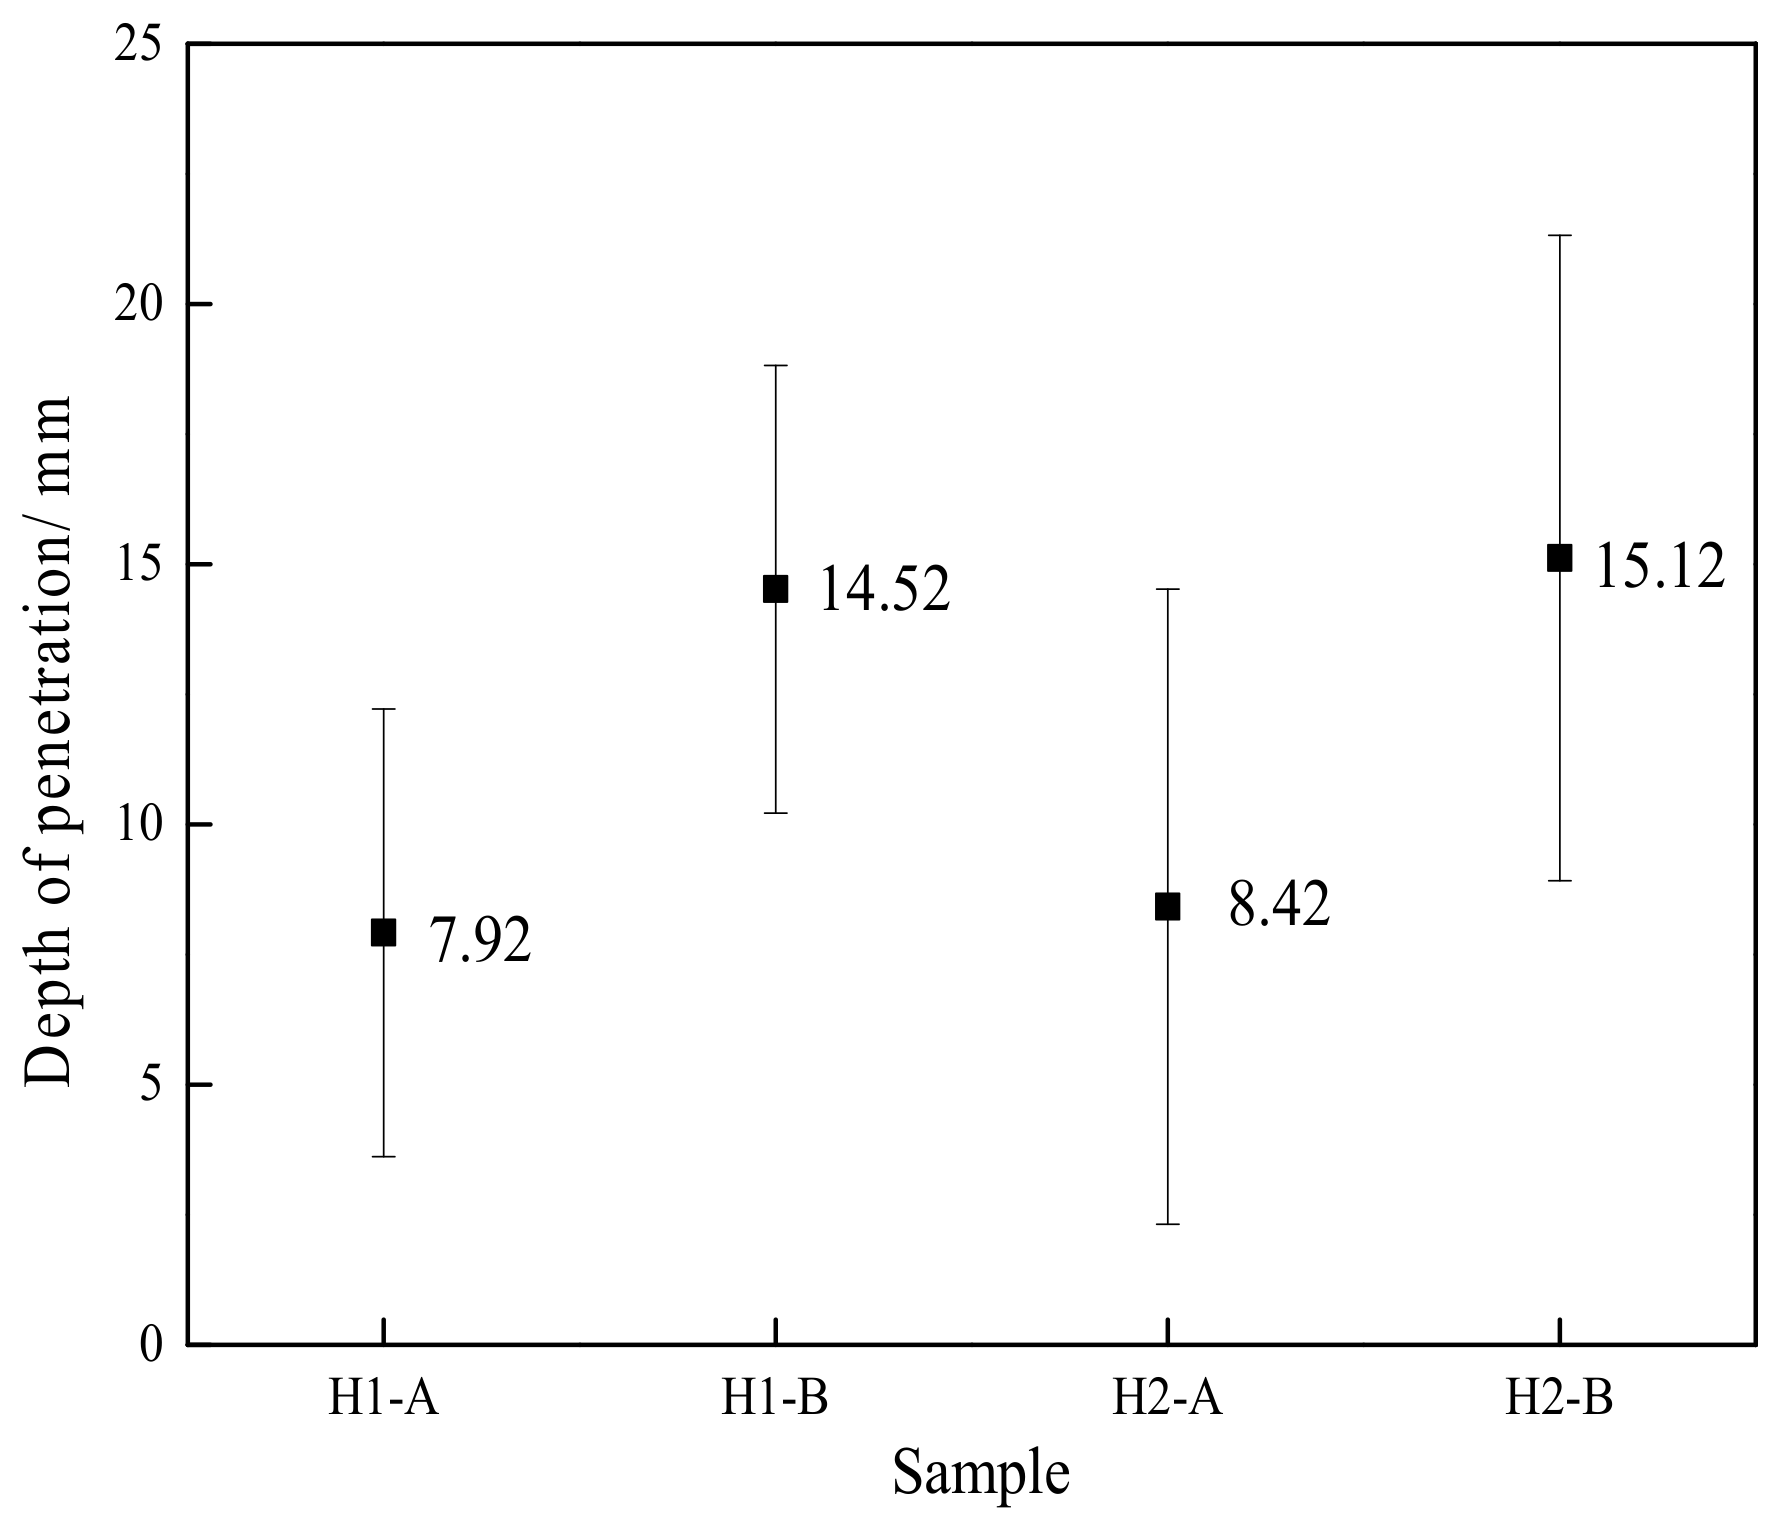
3.2. Distribution of Iron and Slag in the Graphite Crucible

After testing, some nondropped material was found in the graphite crucible. The crucible was dissected (see Figure 6). The visible light and dark phases can be distinguished by SEM (Figure 7), and the two phases were identified as iron and slag, respectively.
As shown in Figure 6 and Figure 7, it can be seen that the slag–iron aggregation in the nondropped material is relatively obvious in the charging mix, adding higher basicity to S-2, which is consistent with the experimental results for the melting–dropping property of the charging mix. In addition, the penetration of slag and iron in some nondropped material can be clearly found in the gas pathway formed by the coke layer. The penetration depth of the iron slag is measured at multiple points, the degree of penetration of slag–iron–coke is shown in Figure 8. The figure indicates that under the same sintering condition, the penetration of slag–iron–coke in Scheme B is more obvious than that in Scheme A. The penetration average of H1-B is 14.52 mm, and that of H2-B is 15.12 mm. As can be observed, the penetration of slag–iron–coke is aggravated after increasing the proportion of the lump ore. In addition, the penetration of slag–iron–coke with high-basicity sinter is considerably higher than that with low-basicity sinter. By comparing the penetration of H1-A and H2-A as well as H1-B and H2-B, the penetration range of slag–iron–coke with high-basicity sinter is obviously higher than that with low-basicity sinter.

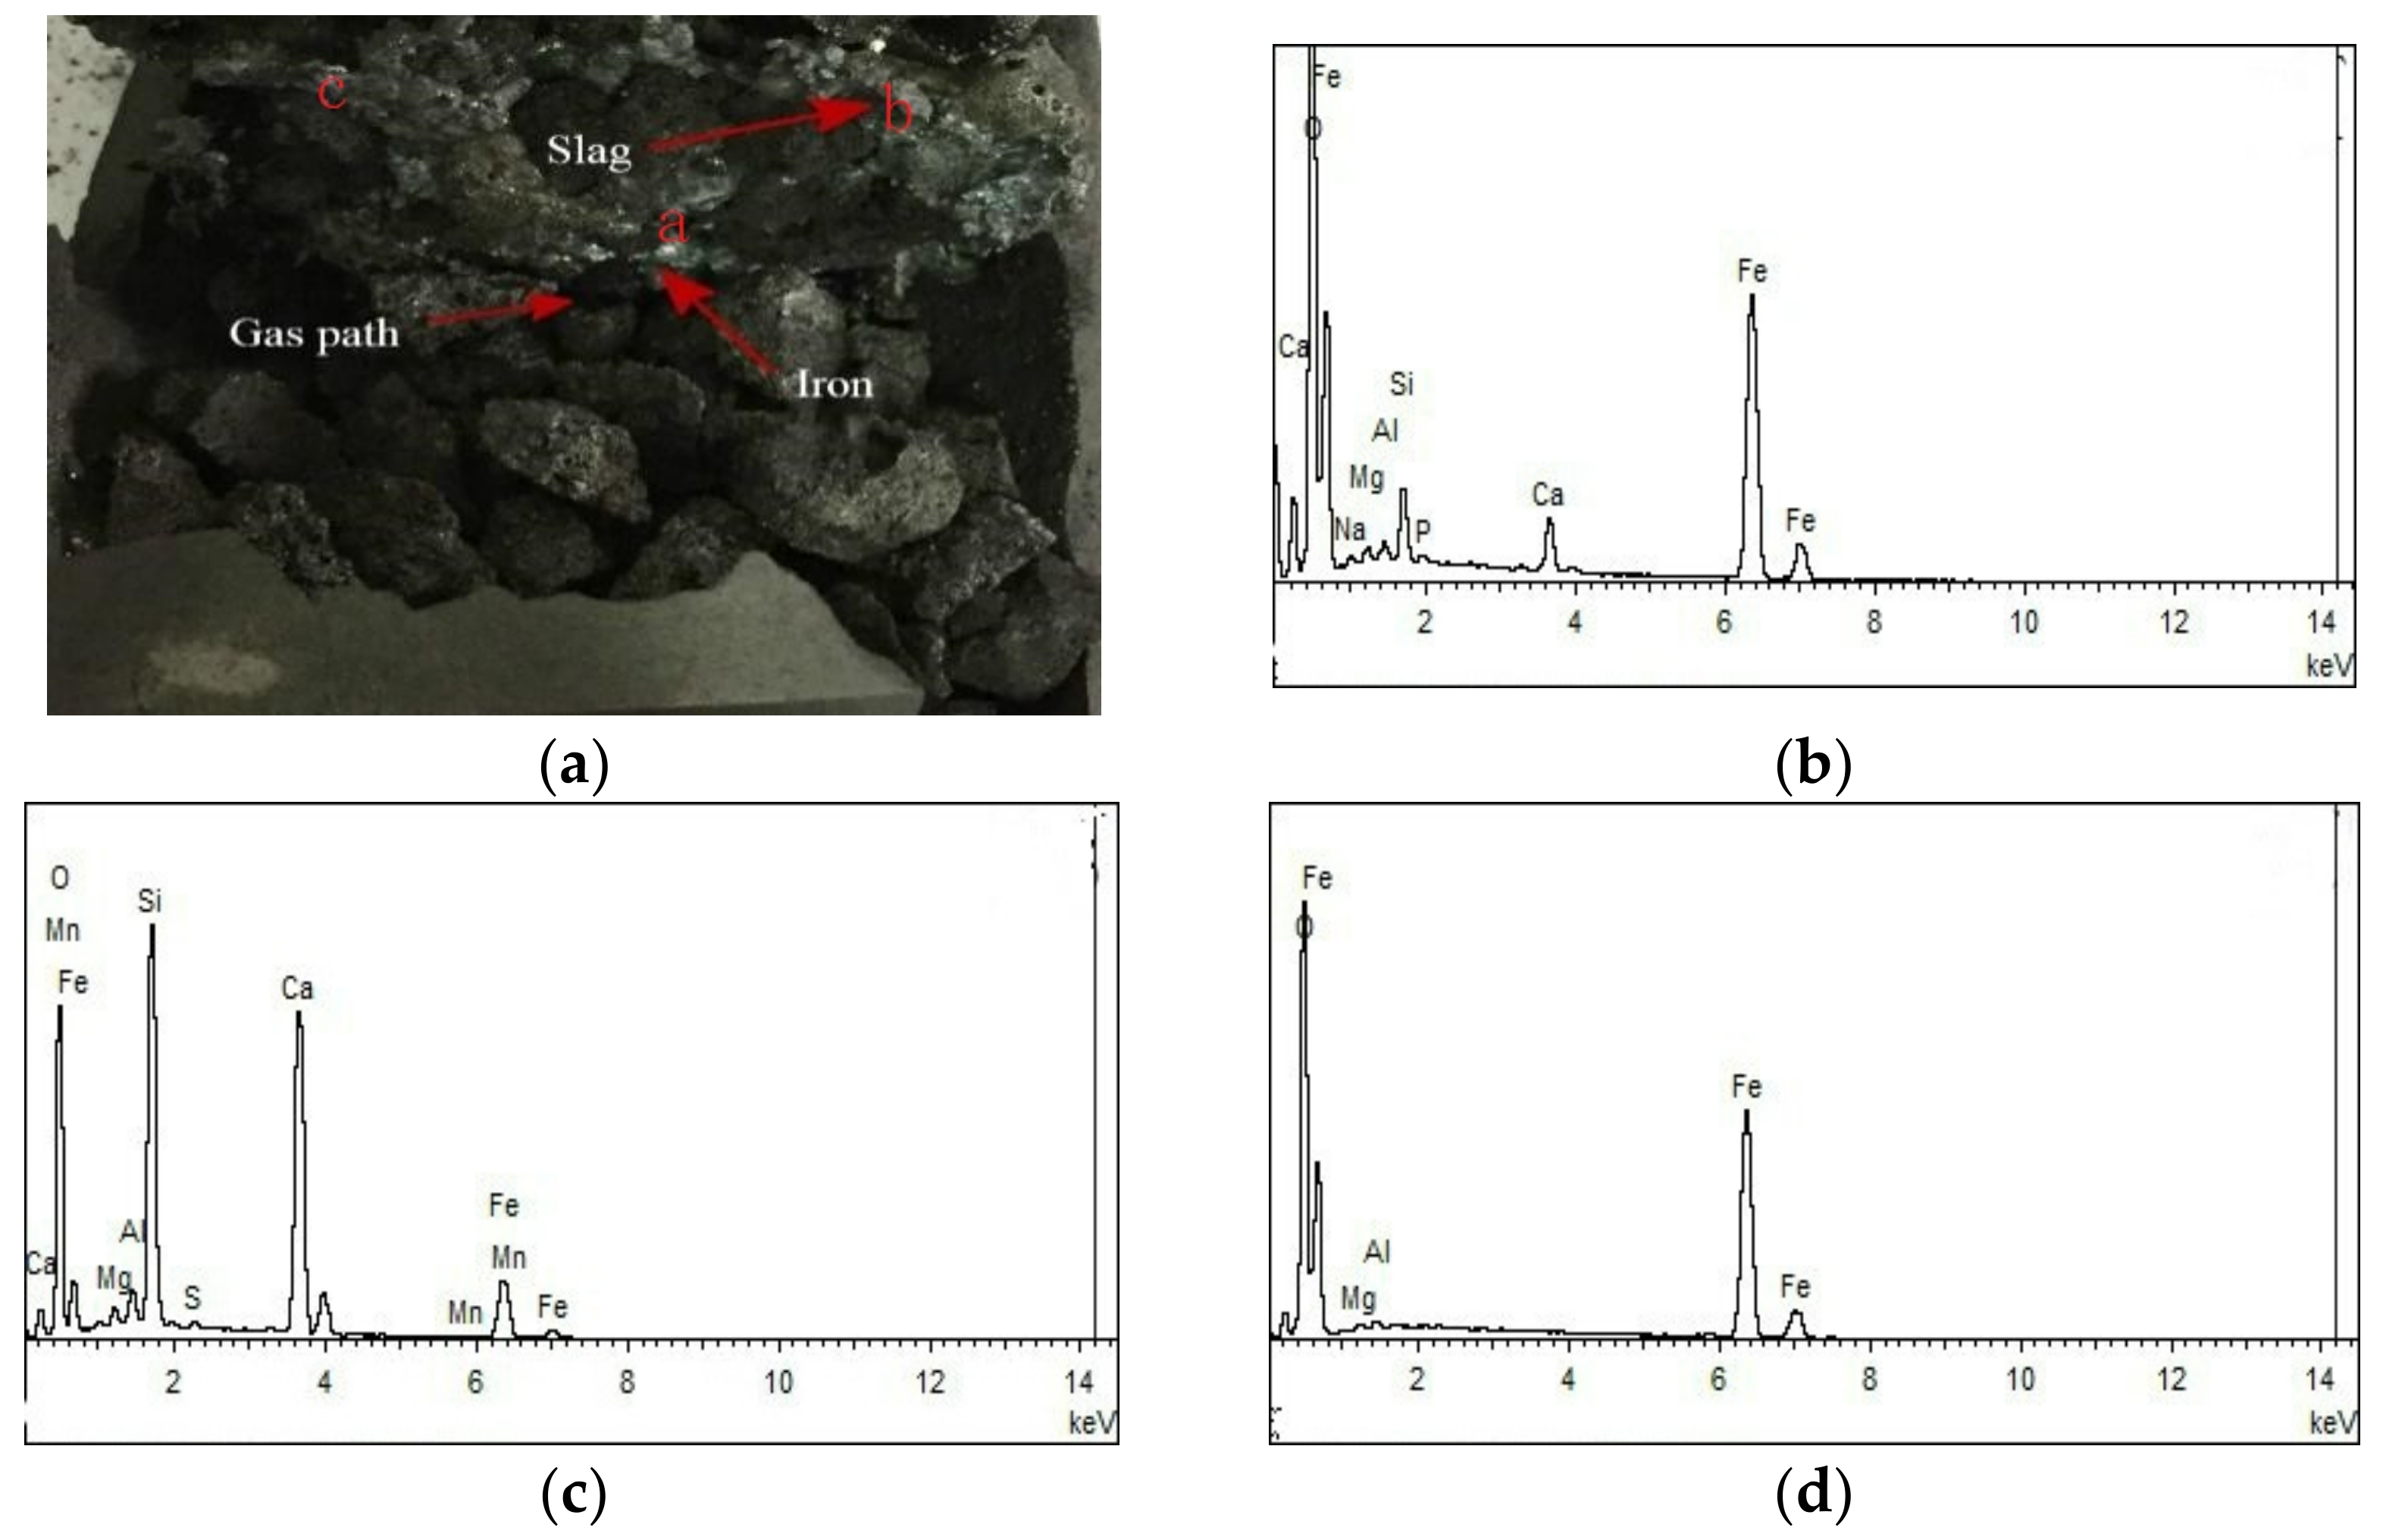
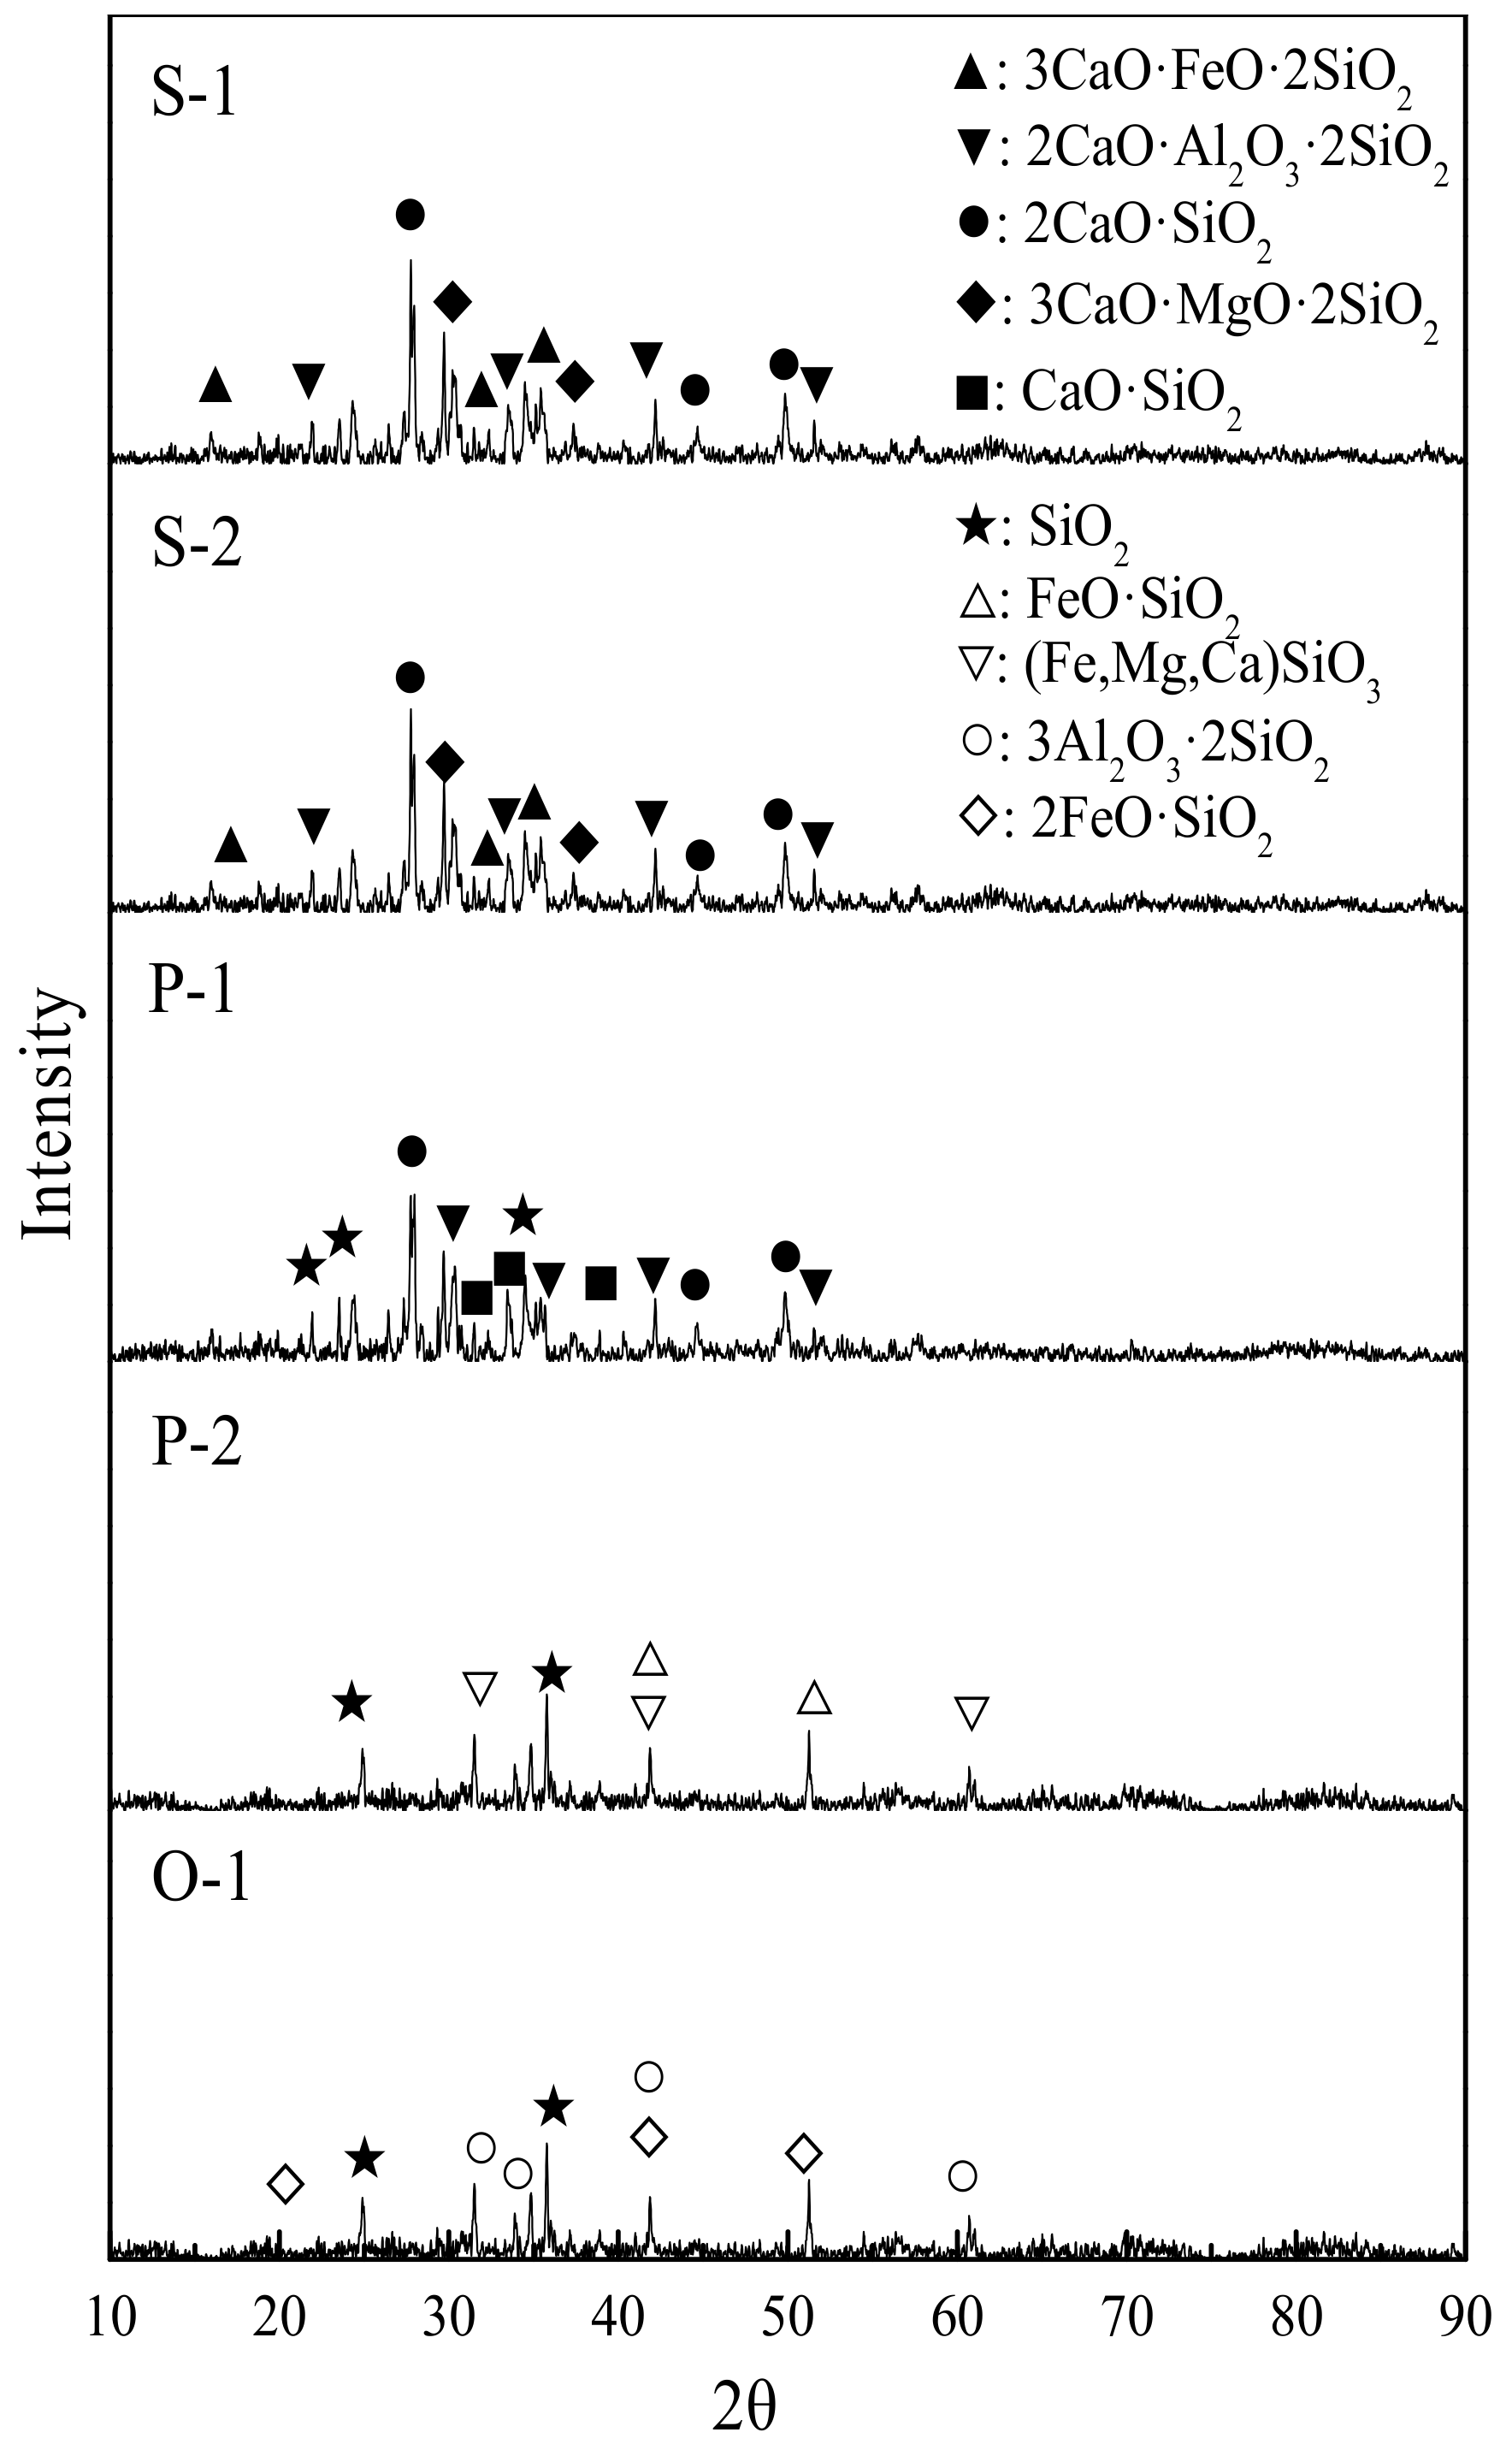
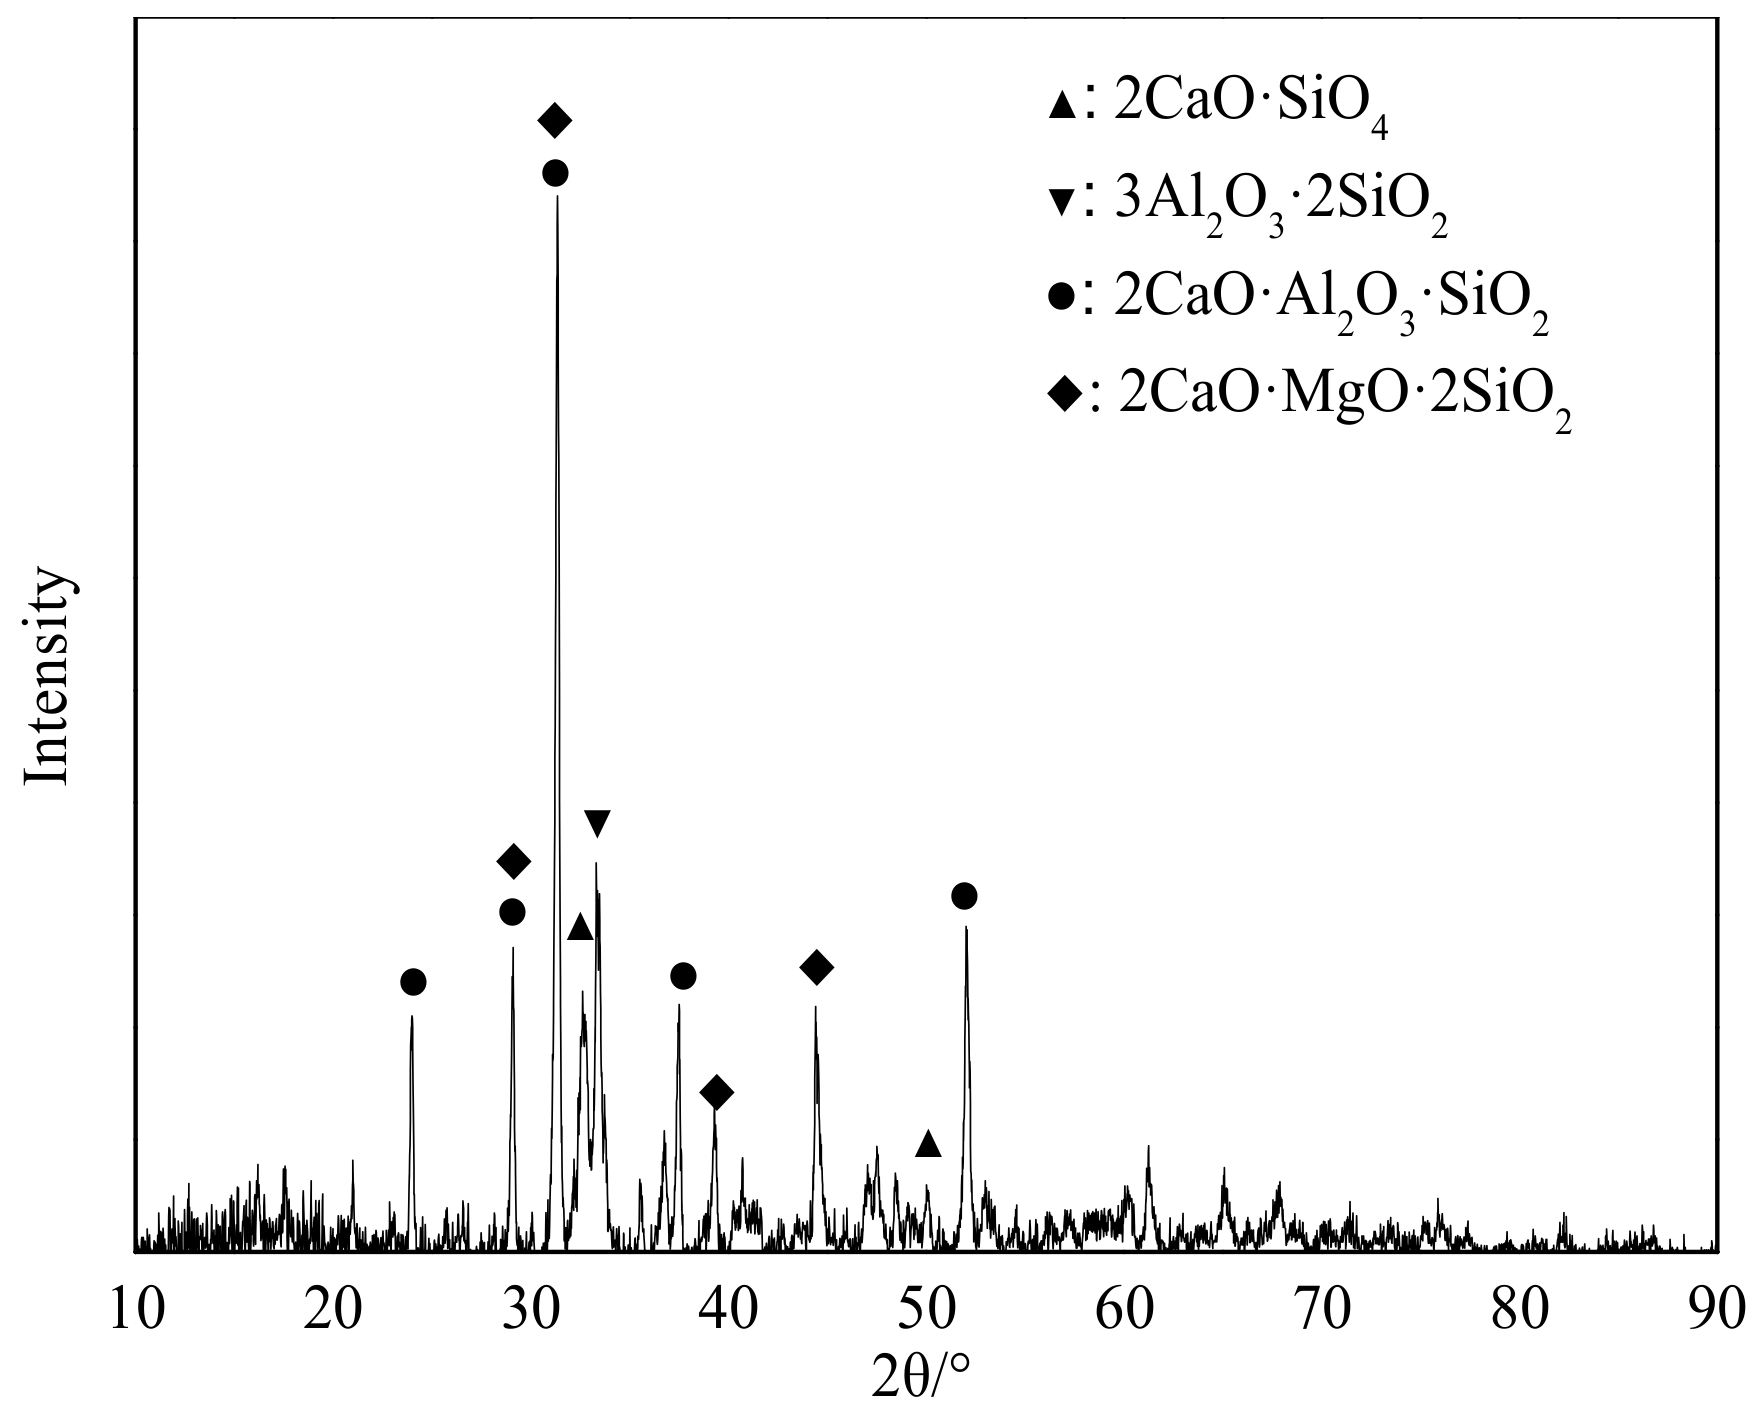
3.3. Phase-Chemical Composition

As shown in Figure 9, the phases in the slag are affected by the chemical components, such as Al2O3 and so on. The high-basicity sinters S-1 and S-2 are alike in the phases of the slag. The main slag phases of the sinter are a dicalcium silicate and wüstite. Owing to the high MgO and Al2O3 contents in the sinter, the eutectic phase in wüstite and Al2O3 occur in the solid–solution reaction during slag formation, and excessive melilite and merwinite form in the slag system. Both pellets are detected in the SiO2 component in the slag; most SiO2 is found in free state, and other parts are formed as a complex mineral phase. The pellet P-1 contains a large amount of CaO, causing some of the CaO to react with free-state SiO2 and generating monocalcium silicate and dicalcium silicate; the remaining CaO reacts with Al2O3 and SiO2 in the slag system, and the gehlenite phase is formed. In the slag of the pellet P-2, the free-state SiO2, Ca2+, Mg2+, and wüstite reacted and generated complicated mineral phase. The mineral phases fayalite and mullite are found in the slag of the lump ore O-1 because of the reduced CaO and MgO contents in the slag formation. SiO2, Al2O3, and FeO reacted with one another to generate a complex mineral.
One charging mix is selected as a typical scheme, as analyzed based on the X-ray diffraction energy spectrum of the slag of the typical charging mix. In Figure 10, the main mineral phases are gehlenite and akermanite, and small amounts of dicalcium silicate and mullite are accompanied by the main slag phase. The mineral phase constituents in the slag are consistent with the findings in previous studies [7,9,15].

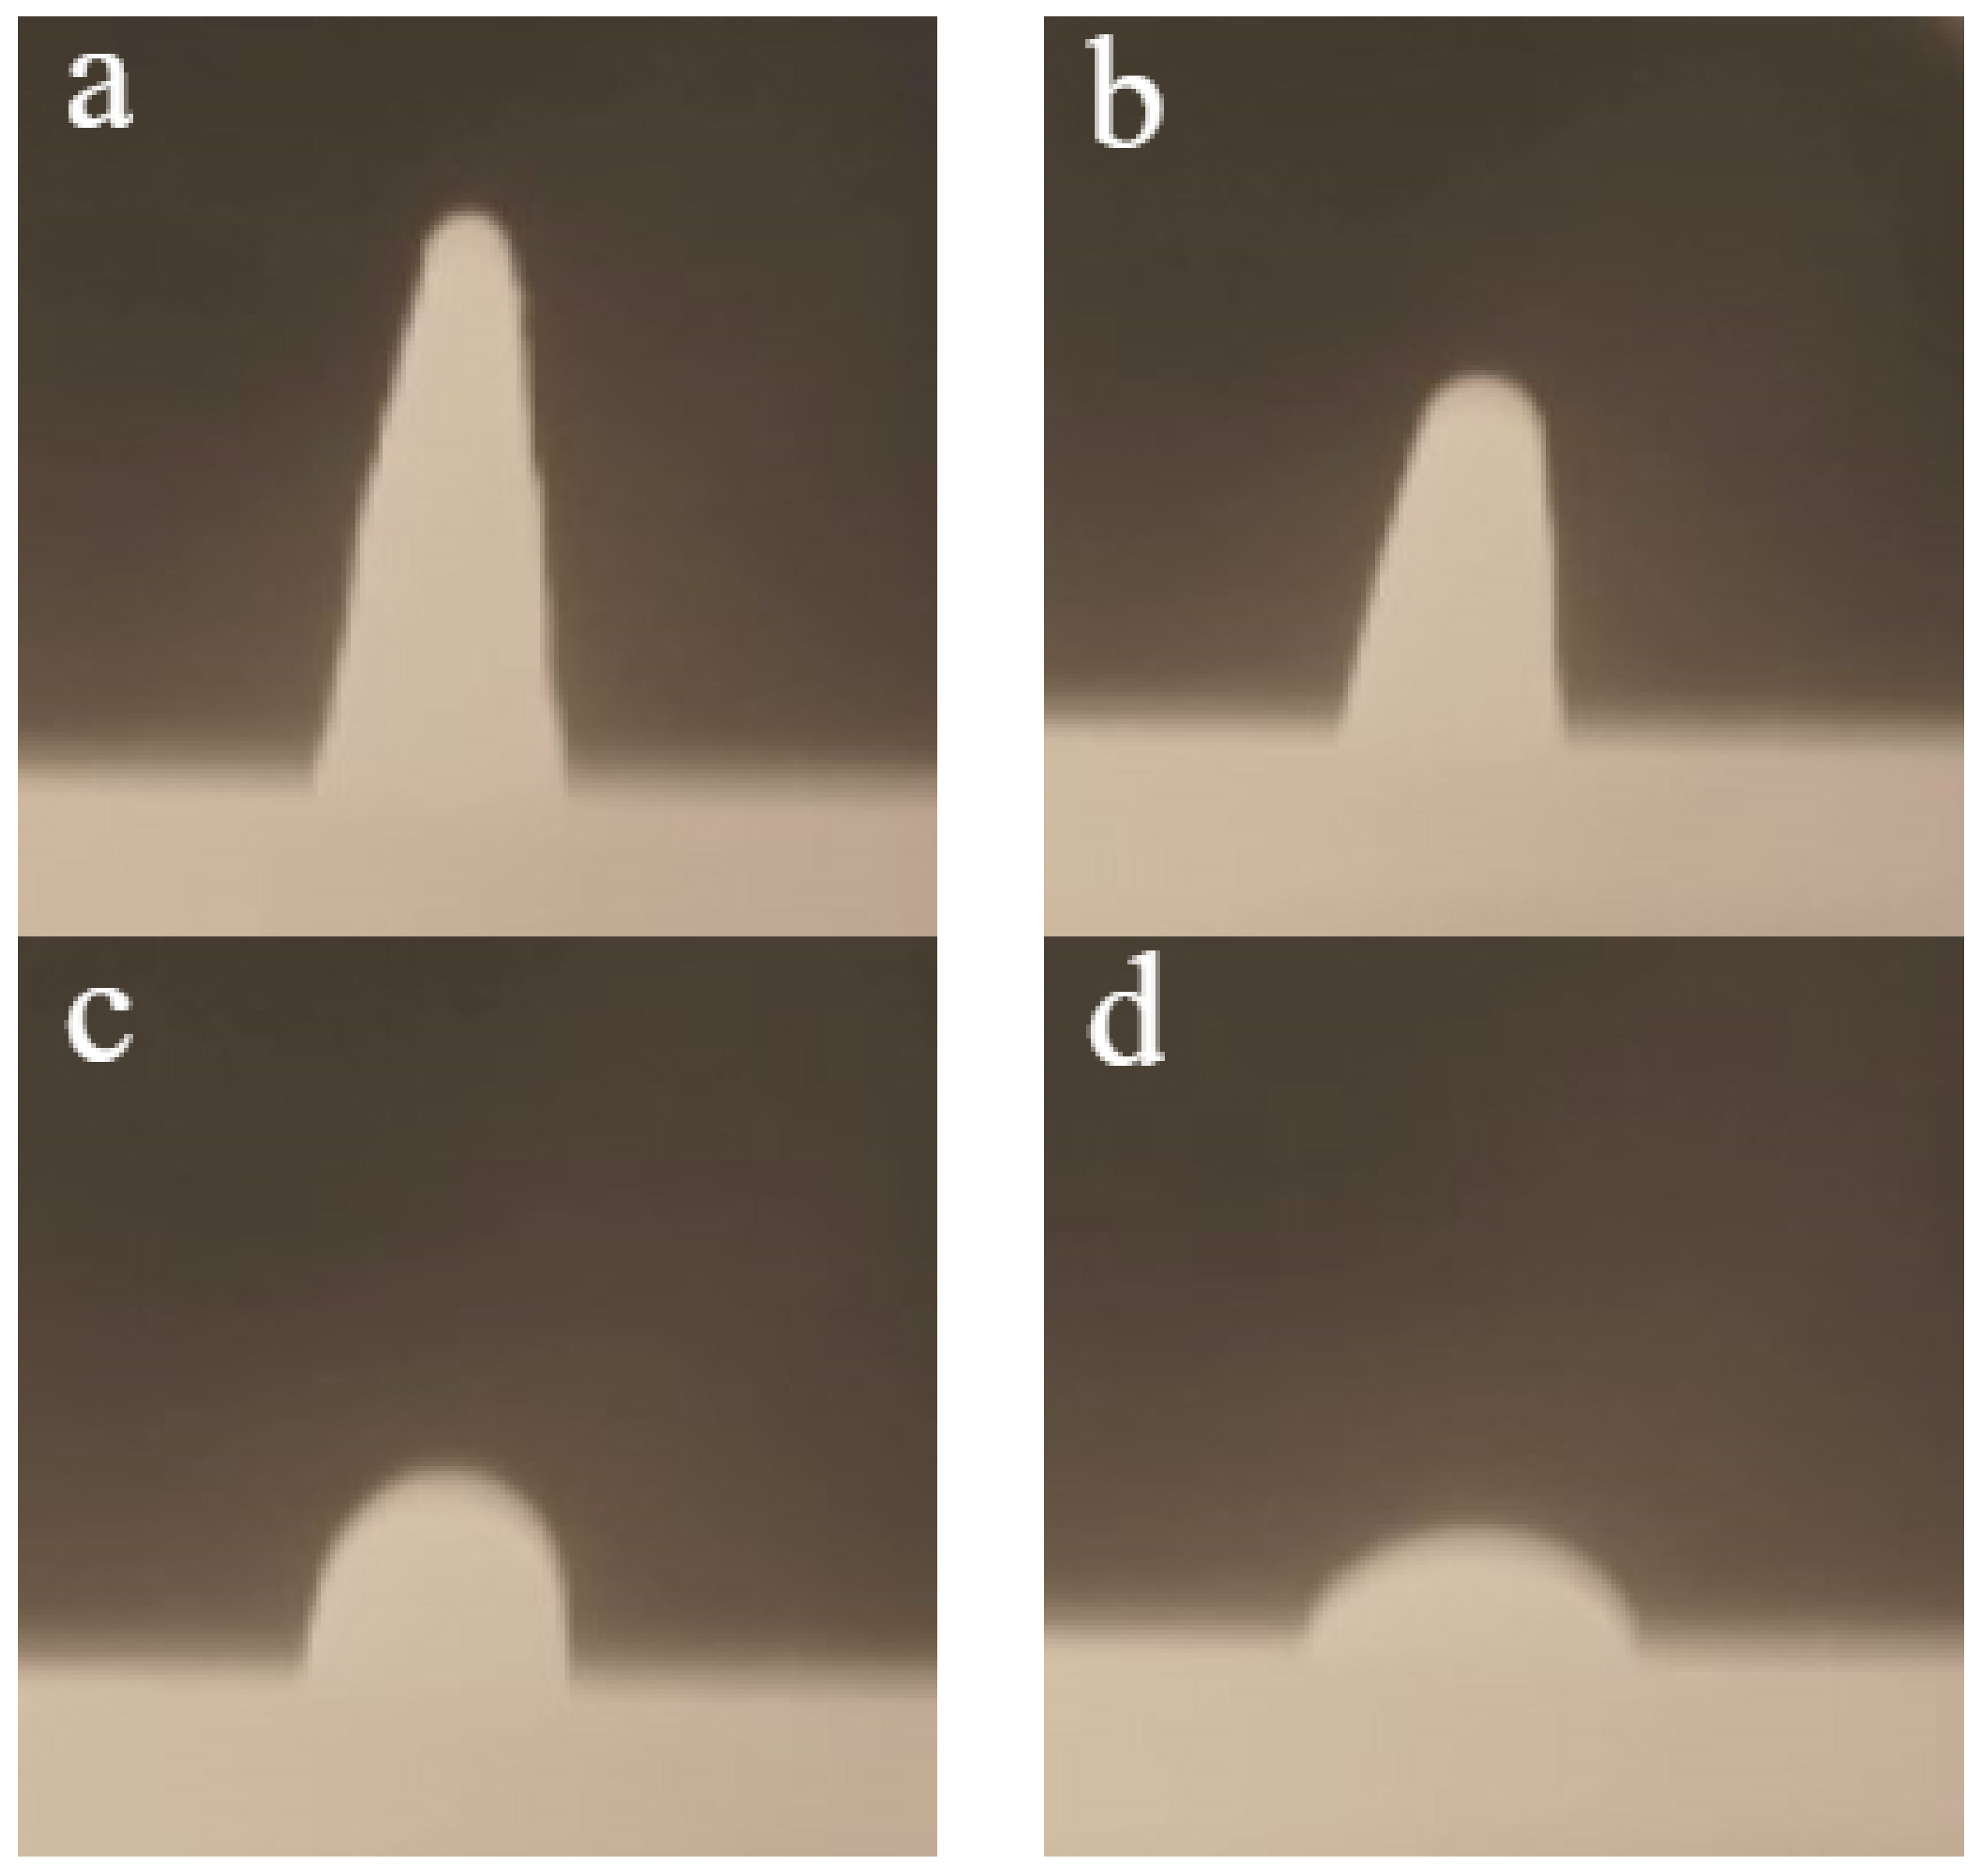
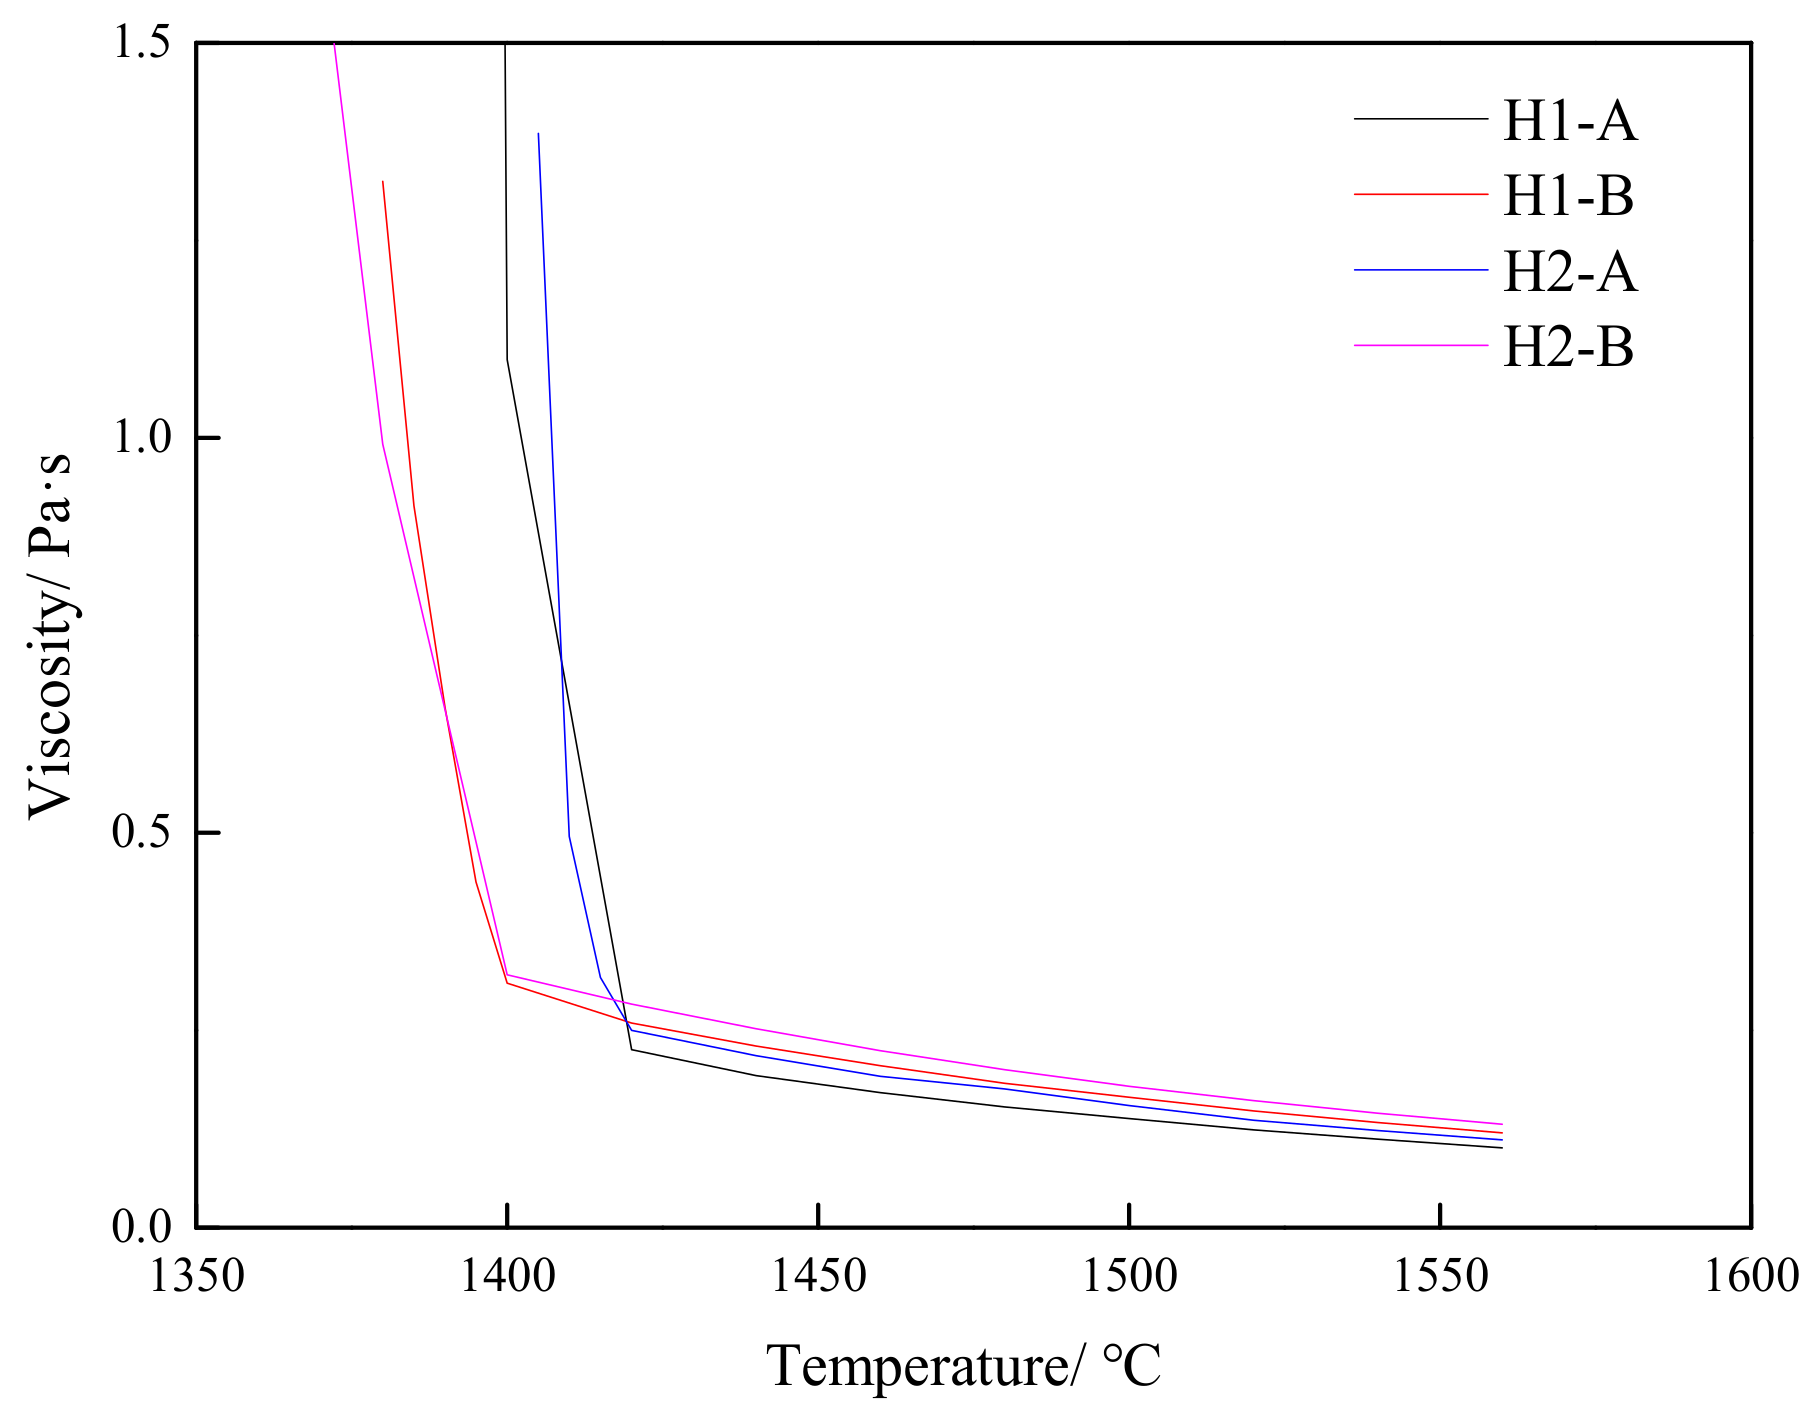
3.4. Melting Property and Mobility of the Slag

Table 3 shows that the melting temperatures of S-1 and S-2, which are all based on the melting-point tester (MPT), are increased and that the flowing temperature of the sinters are relatively high; the slag of S-2 is slightly higher than that of S-1. The slag sample of the lump ore O-1 begins to deform at a lower temperature (1088 °C) and completes the melting process at 1123 °C. The melting behavior of the pellets are between lump ore and sinter ore (P-1 1184 °C−1234 °C, P-2 1116 °C−1318 °C). The slags of the charging mix start melting at 1218 °C, 1204 °C, 1224 °C, and 1210 °C and completely melt at 1324 °C, 1329 °C, 1345 °C, and 1335 °C. A positive linear relationship exists between the melting behavior of the slag and the melting–dropping property of the corresponding charging mix.
The combination of the XRD results with the melting properties of the slag indicates that the single iron ore is not suitable for BF production because of the differences in the mineral component and melting properties of the slag. During the reduction process, a large number of high-fusion-temperature-slag phase, such as dicalcium silicate (with a melting point of 2130 °C) and gehlenite (1590 °C), are generated in the slag system of high-basicity sinters and flux pellets at high temperatures. The initial phase is fayalite (1208 °C) in the slag of lump ores and oxidized pellets. The mullite (1870 °C) phase may be formed with reduction reaction.
Two reactions occur among the FeO, CaO, and SiO2 of the reduced lump ore or sinter, which are separately listed in Equations (2) and (3). The difference in fusion points in the slag is attributed to fayalite and dicalcium silicate.
2 FeO + SiO 2 = 2 FeO · SiO 2
2CaO + SiO2 = β-2CaO·SiO2
However, in the charging mix, the concentration gradients of CaO, SiO2, Al2O3, and MgO among the iron ores are caused by irregular mechanical distributions, which interact with one another at high temperatures. Al2O3 and SiO2 in the lump ore diffuse freely to the contact surface of iron ores when the temperature is lower than 1150 °C. This diffusion behavior reduces the content of fayalite, and the initial phase in the slag mainly consists of olivine and wollastonite. With an increase in temperature, the diffusion of CaO and MgO is induced. The dicalcium silicate content decreases, and merwinite (1575 °C), akermanite (1458 °C), and gehlenite (1590 °C) are generated in the slag, as shown in Equations (4)–(6).
2 CaO + Al 2 O 3 + SiO 2 = 2 CaO · Al 2 O 3 · SiO 2
2 CaO + MgO + 2 SiO 2 = 2 CaO · MgO · 2 SiO 2
2 CaO · MgO · 2 SiO 2 + CaO = 3 CaO · MgO · 2 SiO 2
In summary, blending iron ores is likely to improve slag formation, enhancing the melting–dropping property of the charging mix. However, this improvement has limitations, which may cause the pressure drop to deteriorate with the addition of excessive lump ores, as shown in Figure 5.

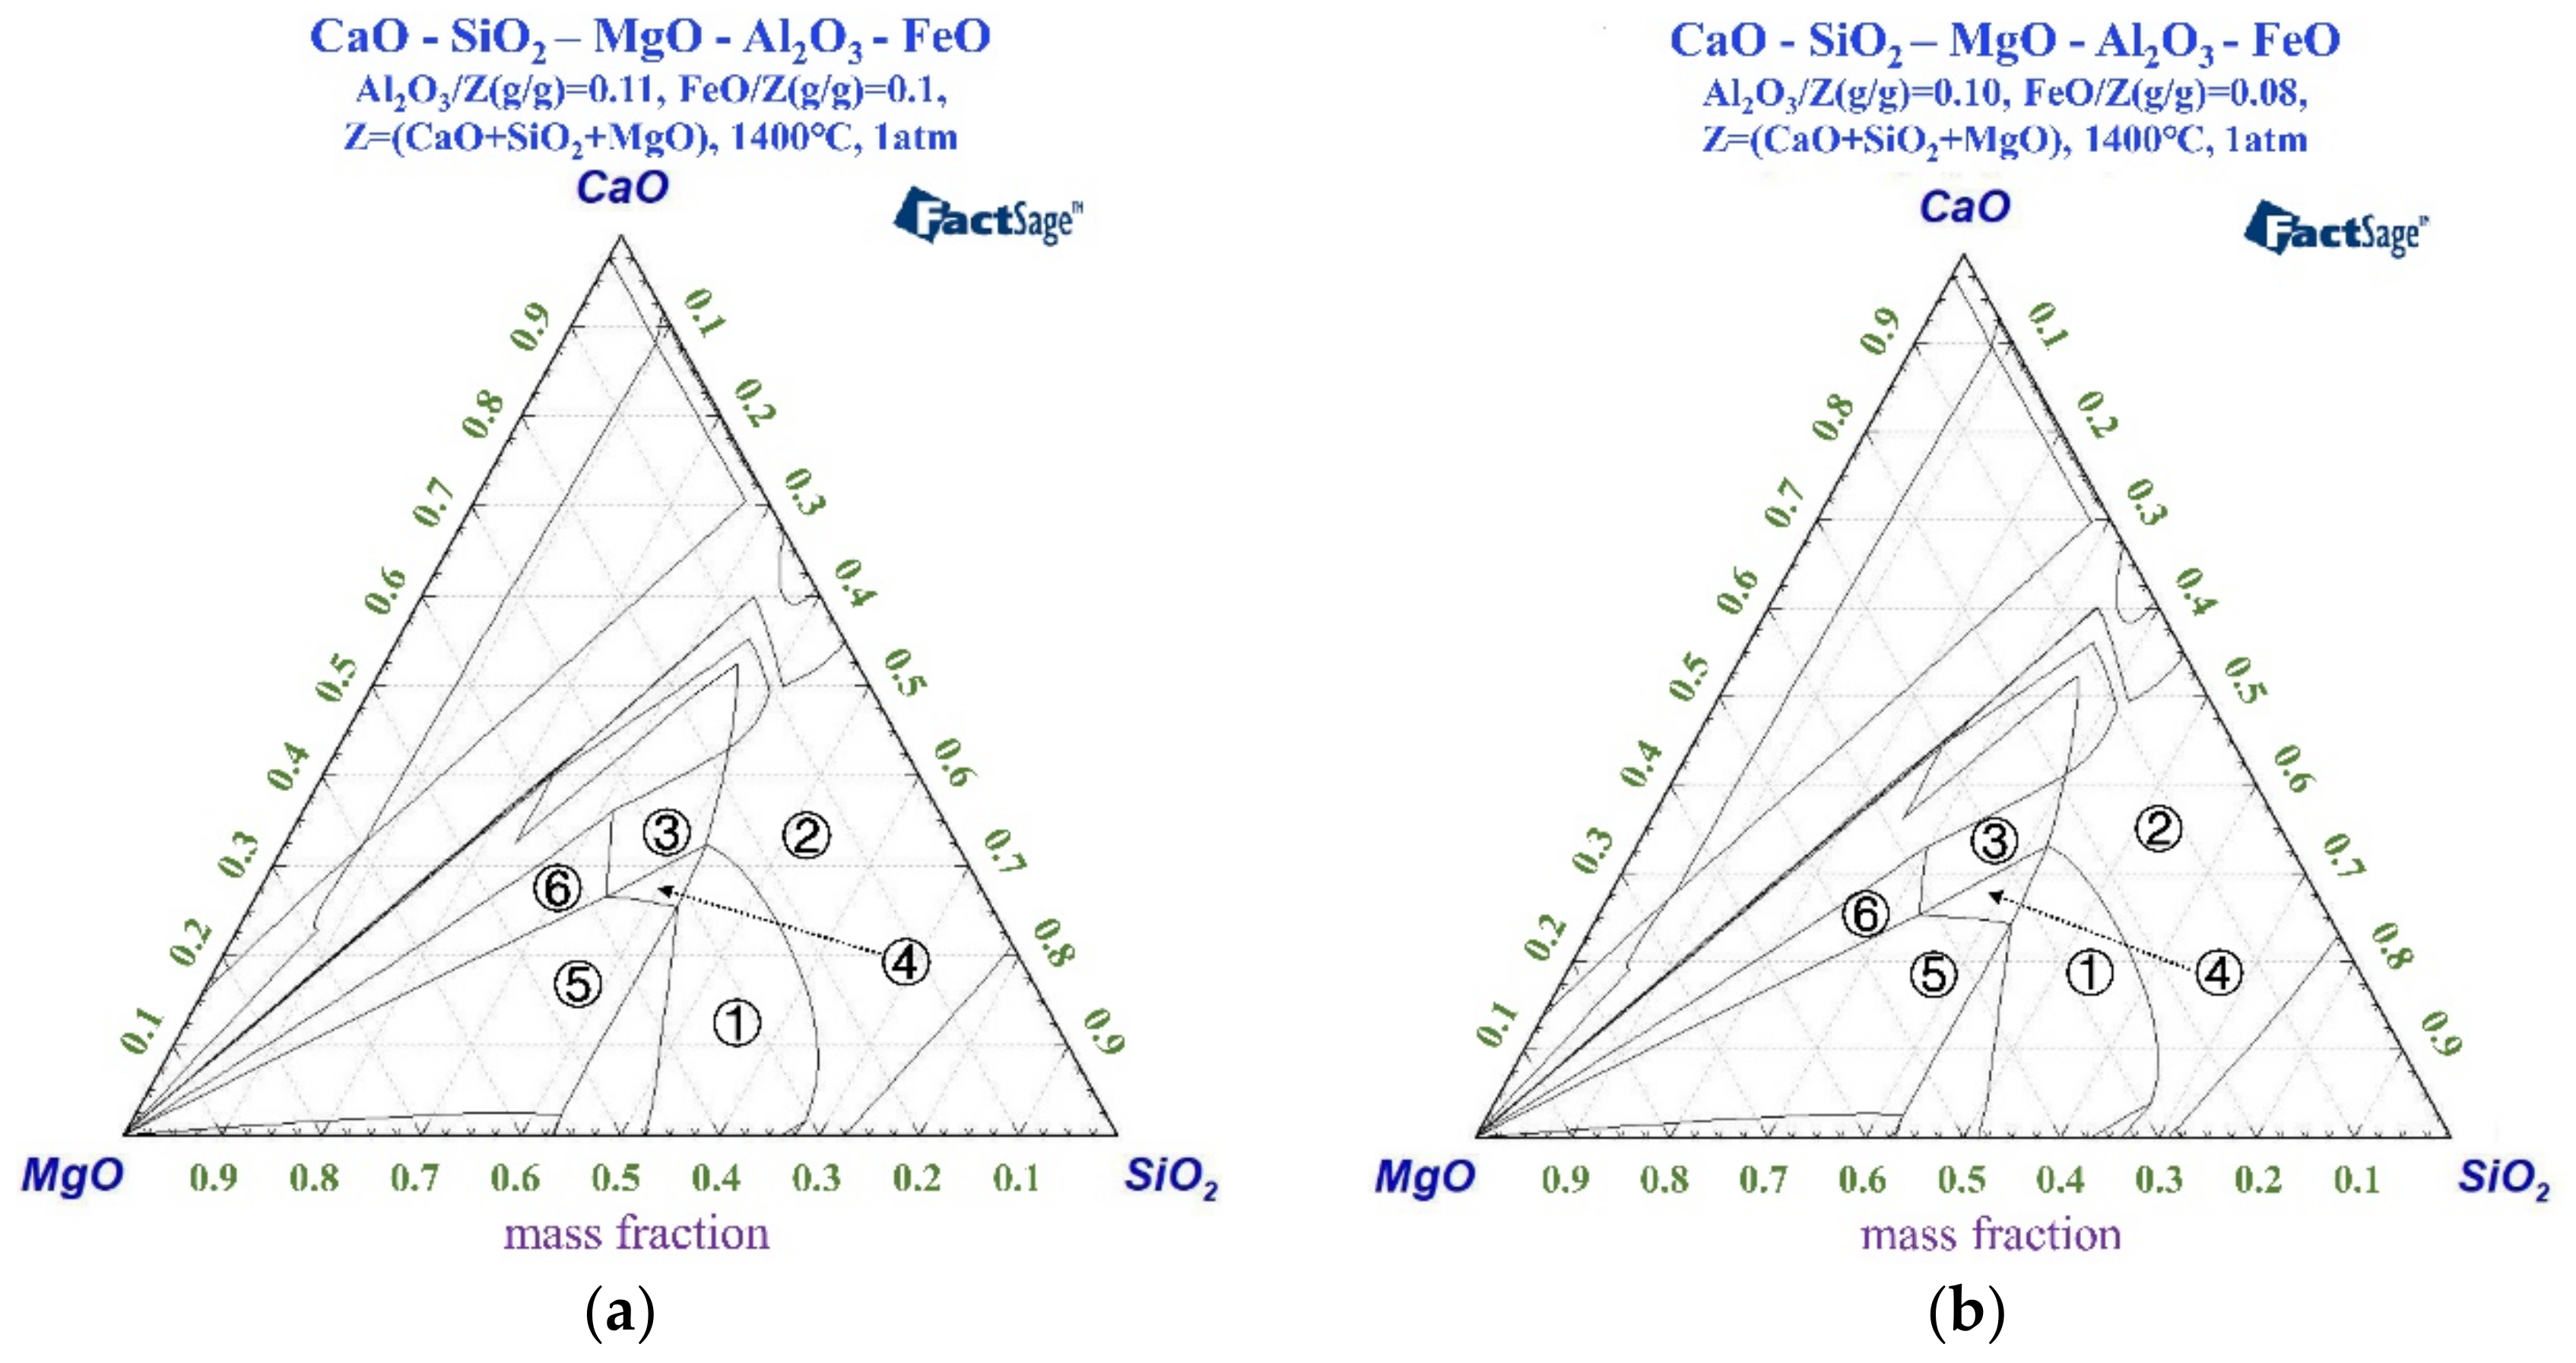
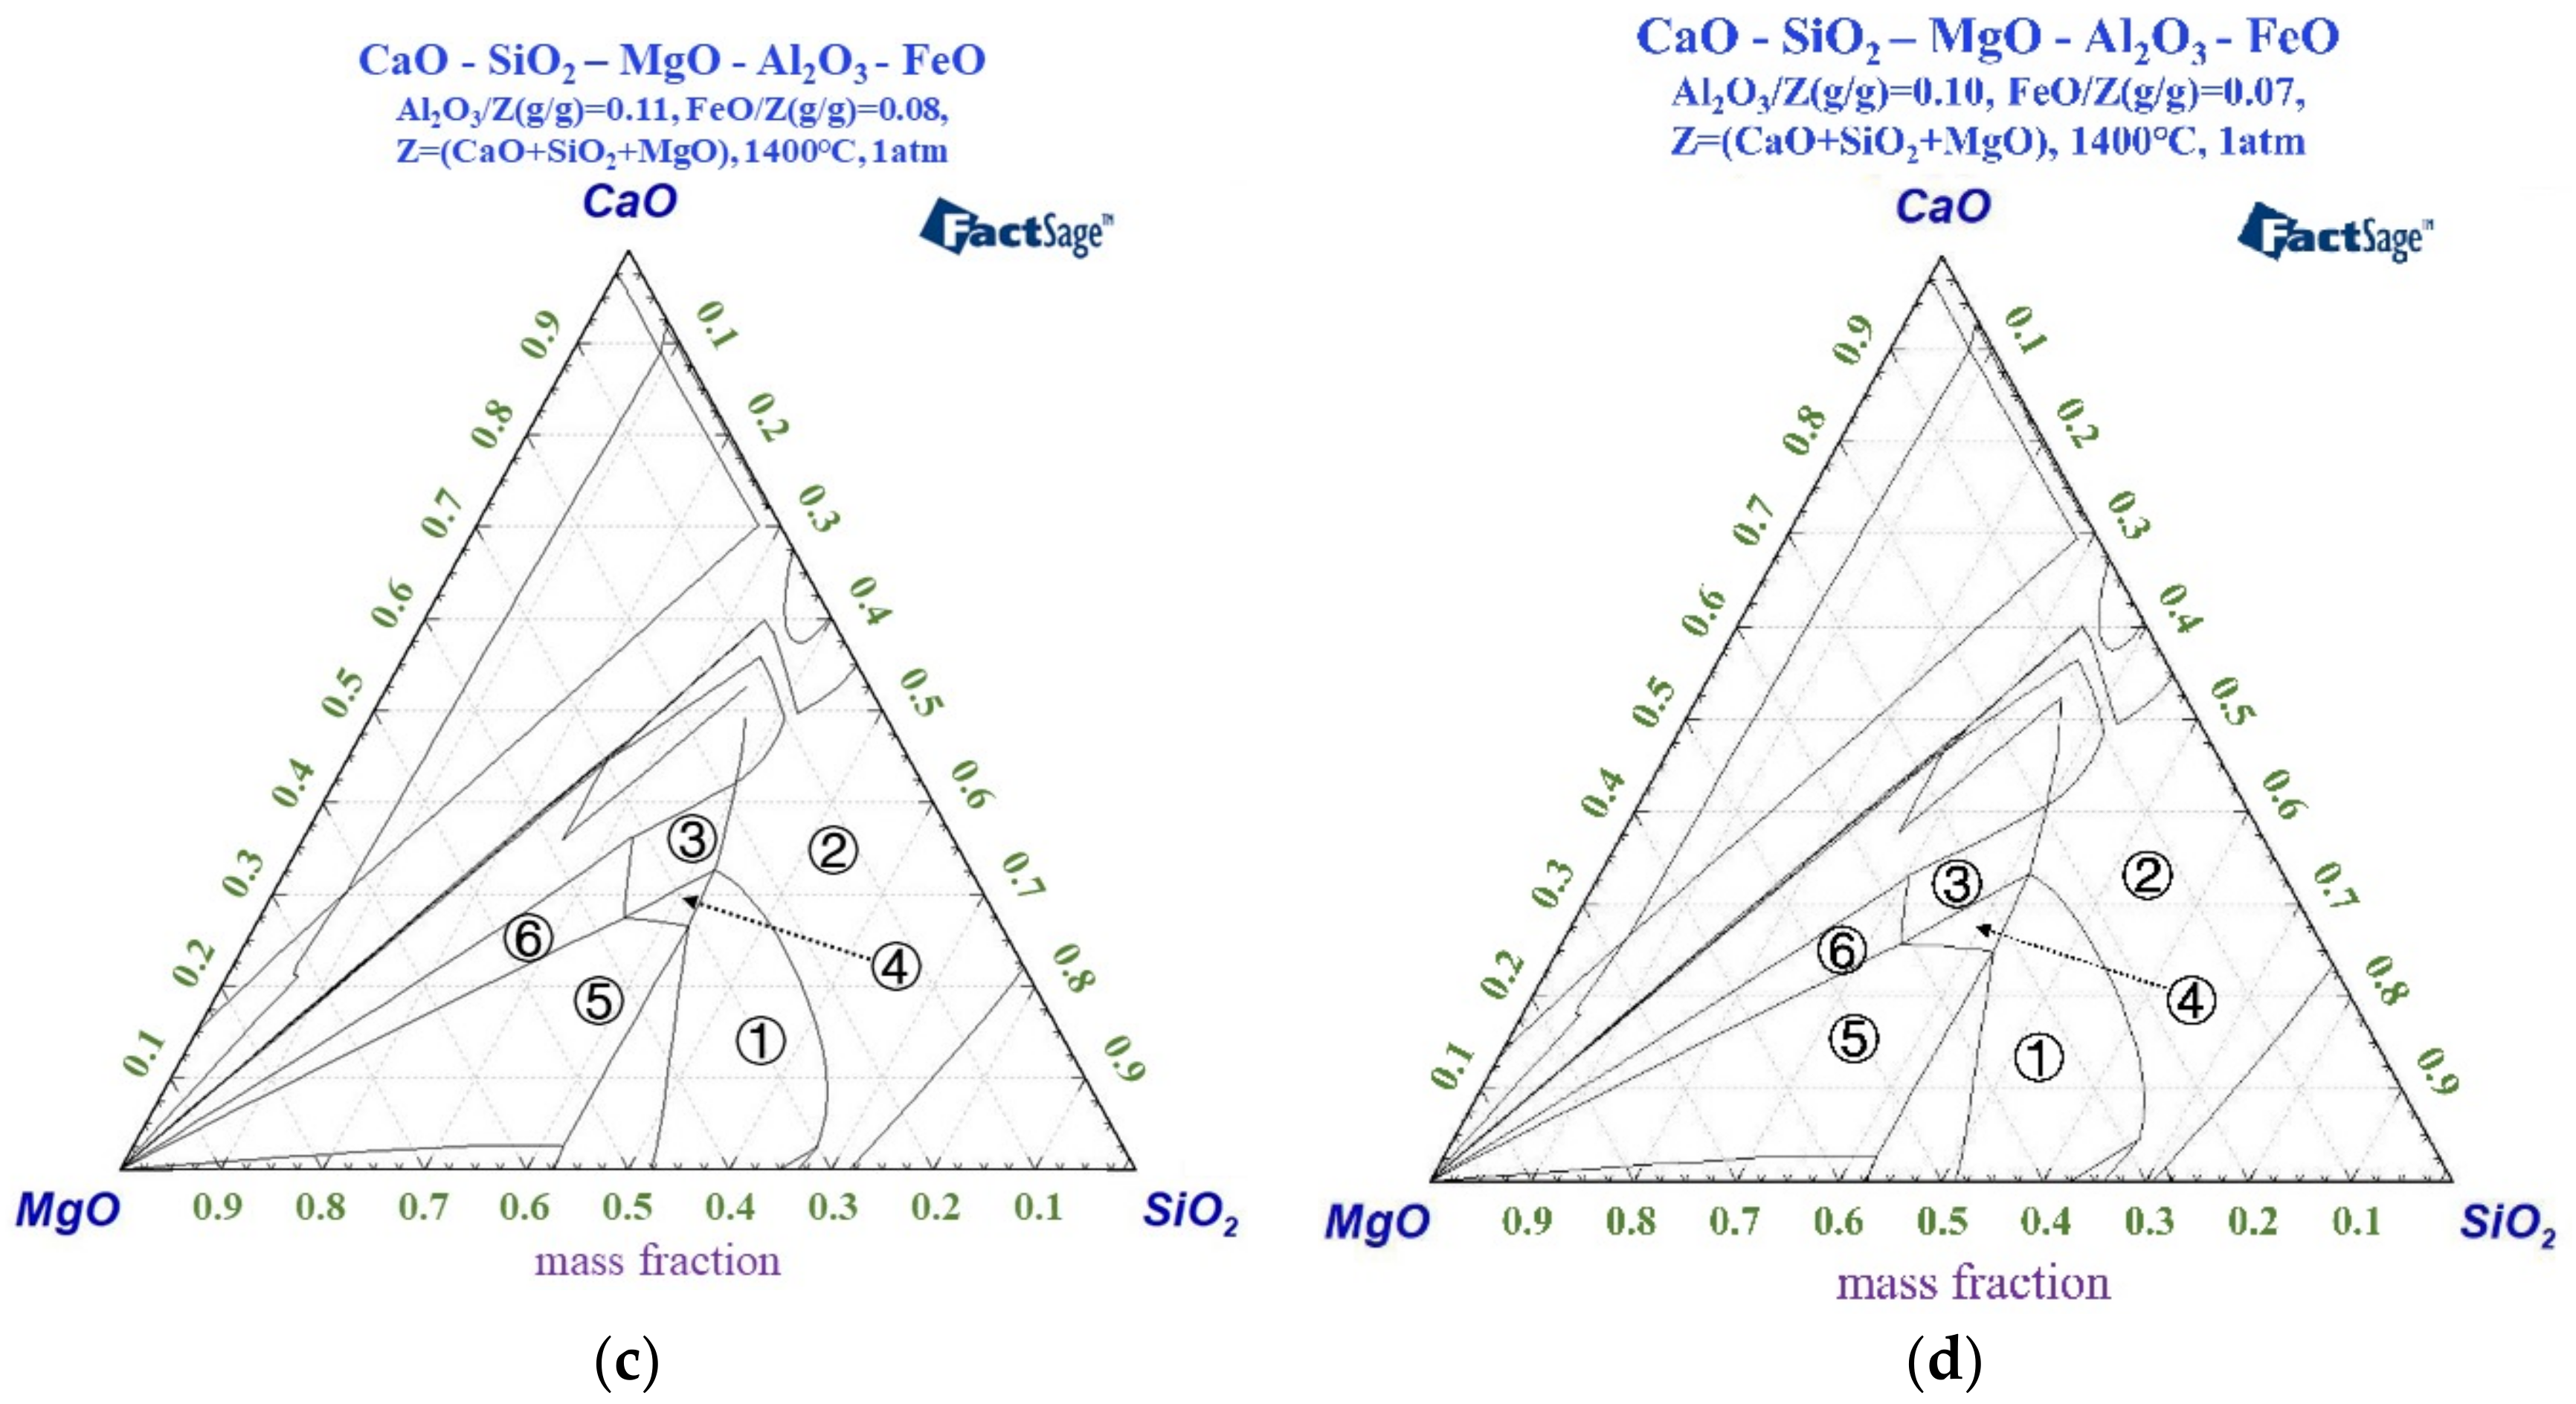
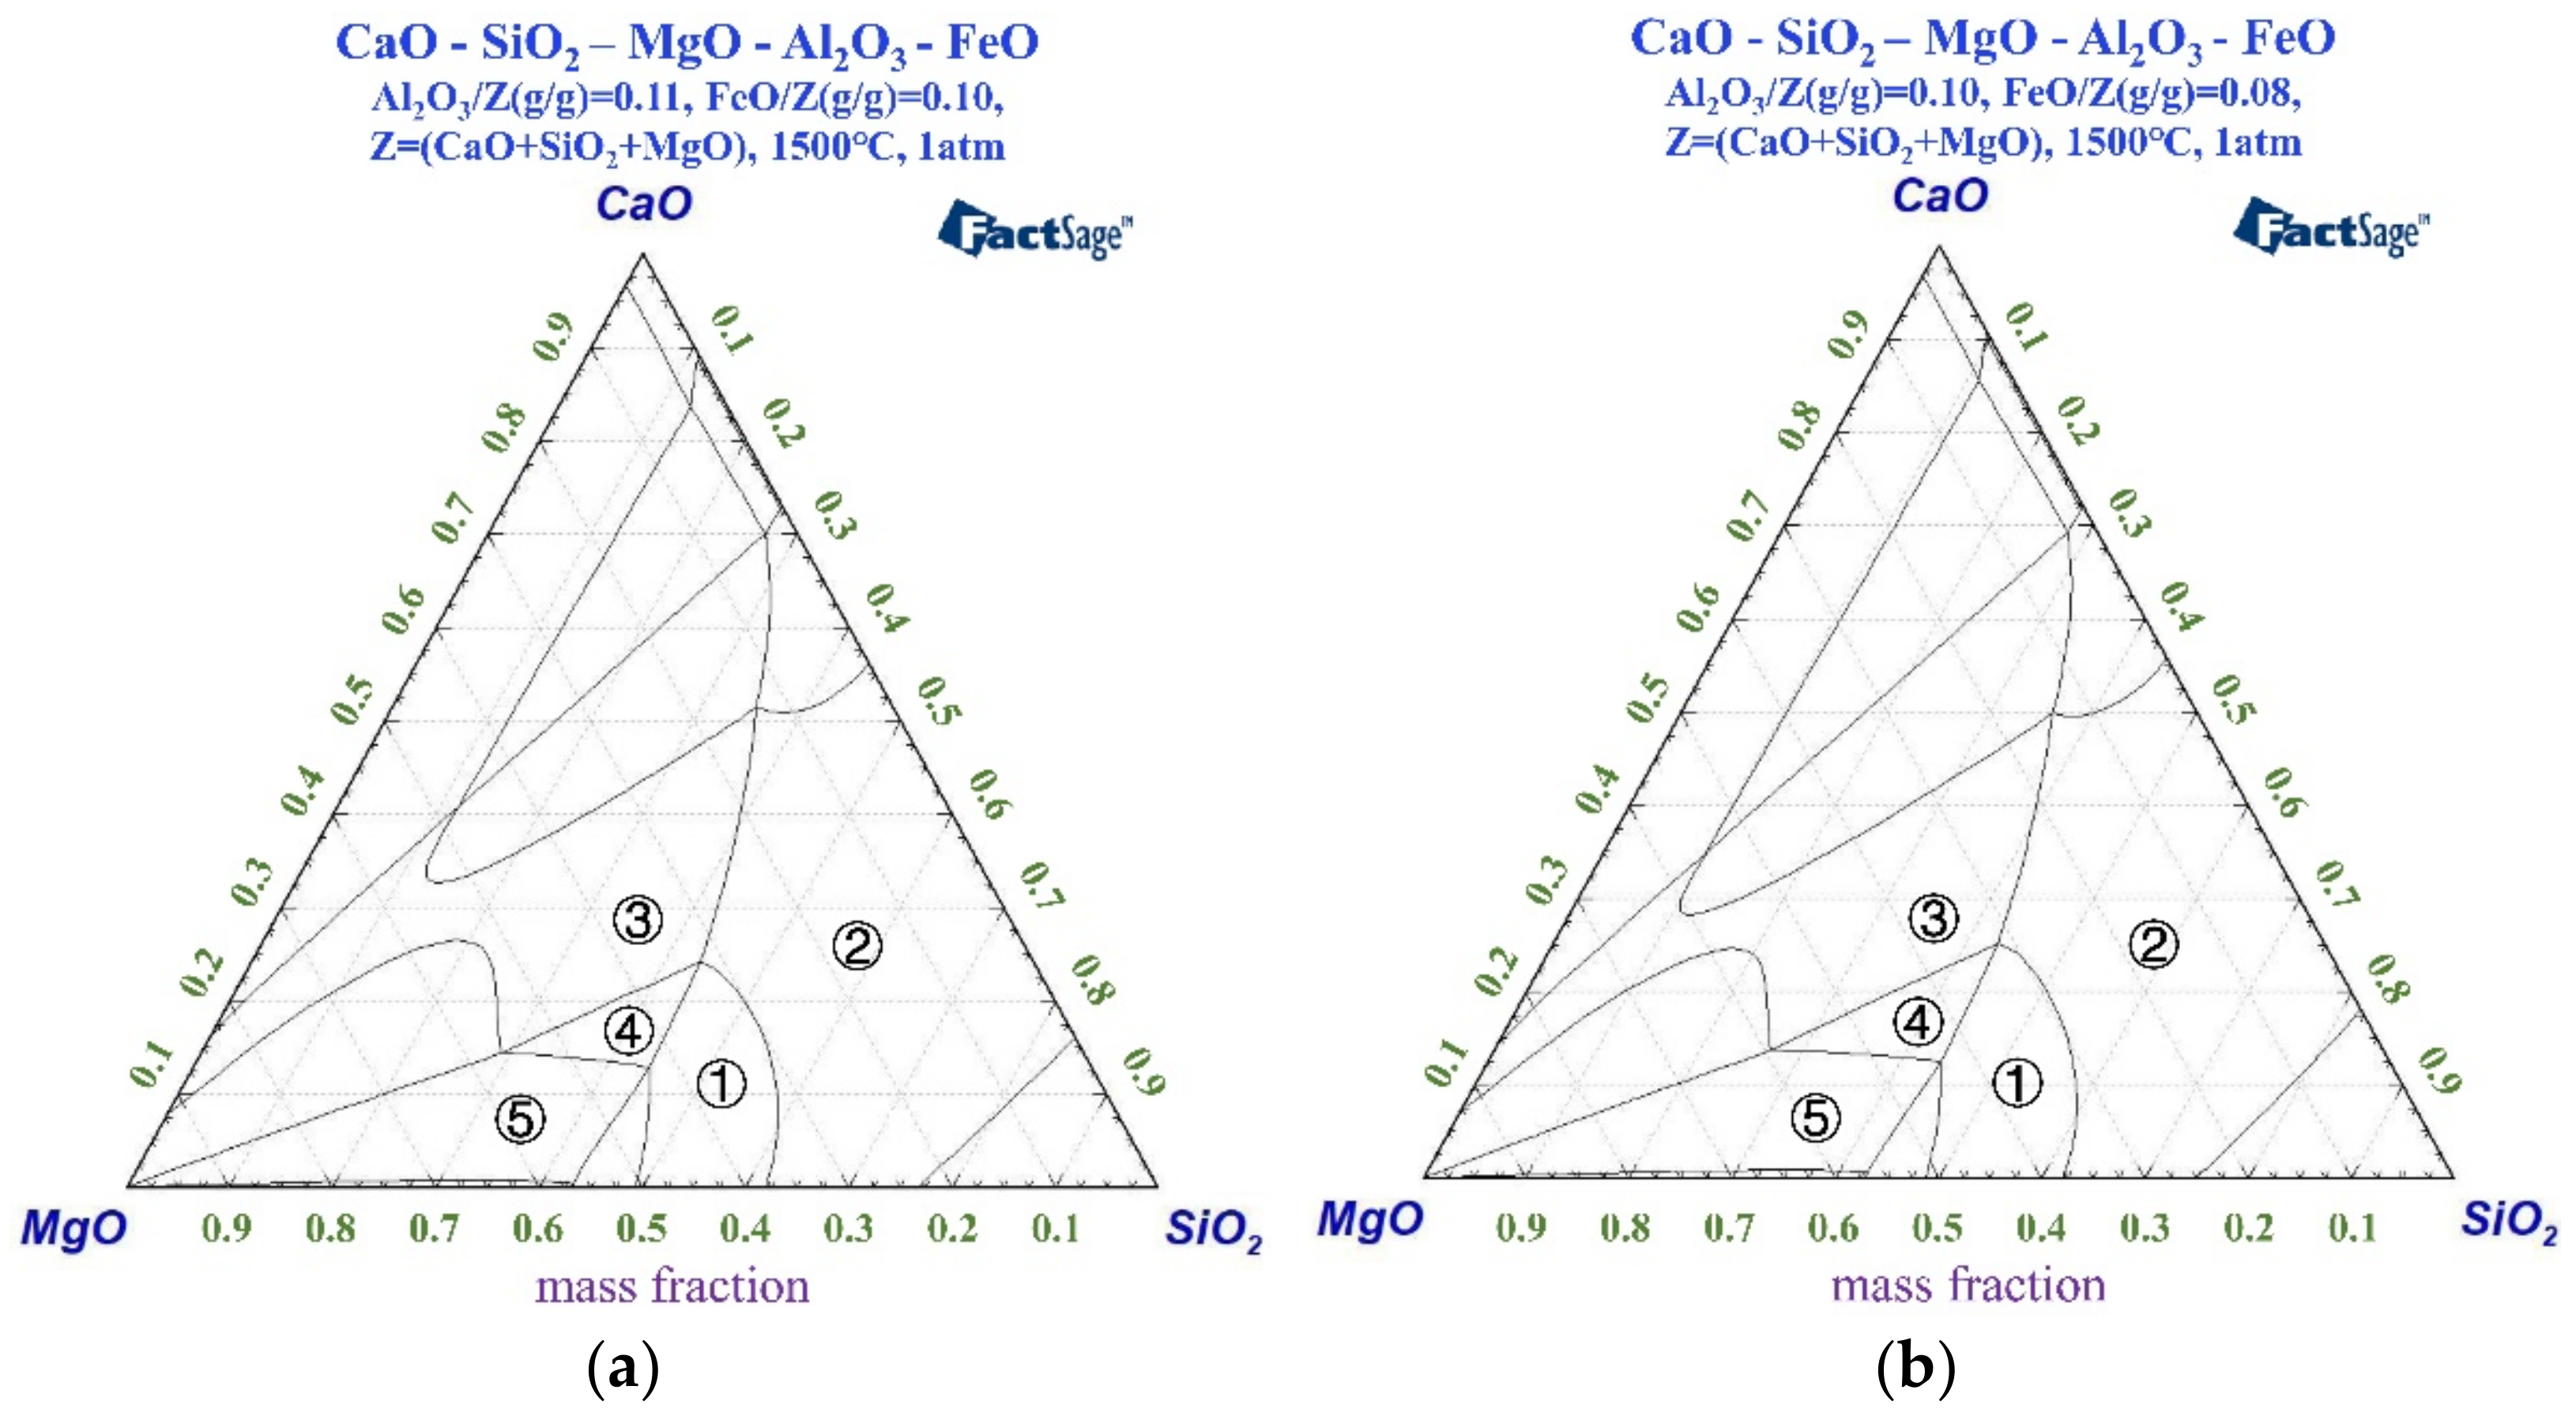
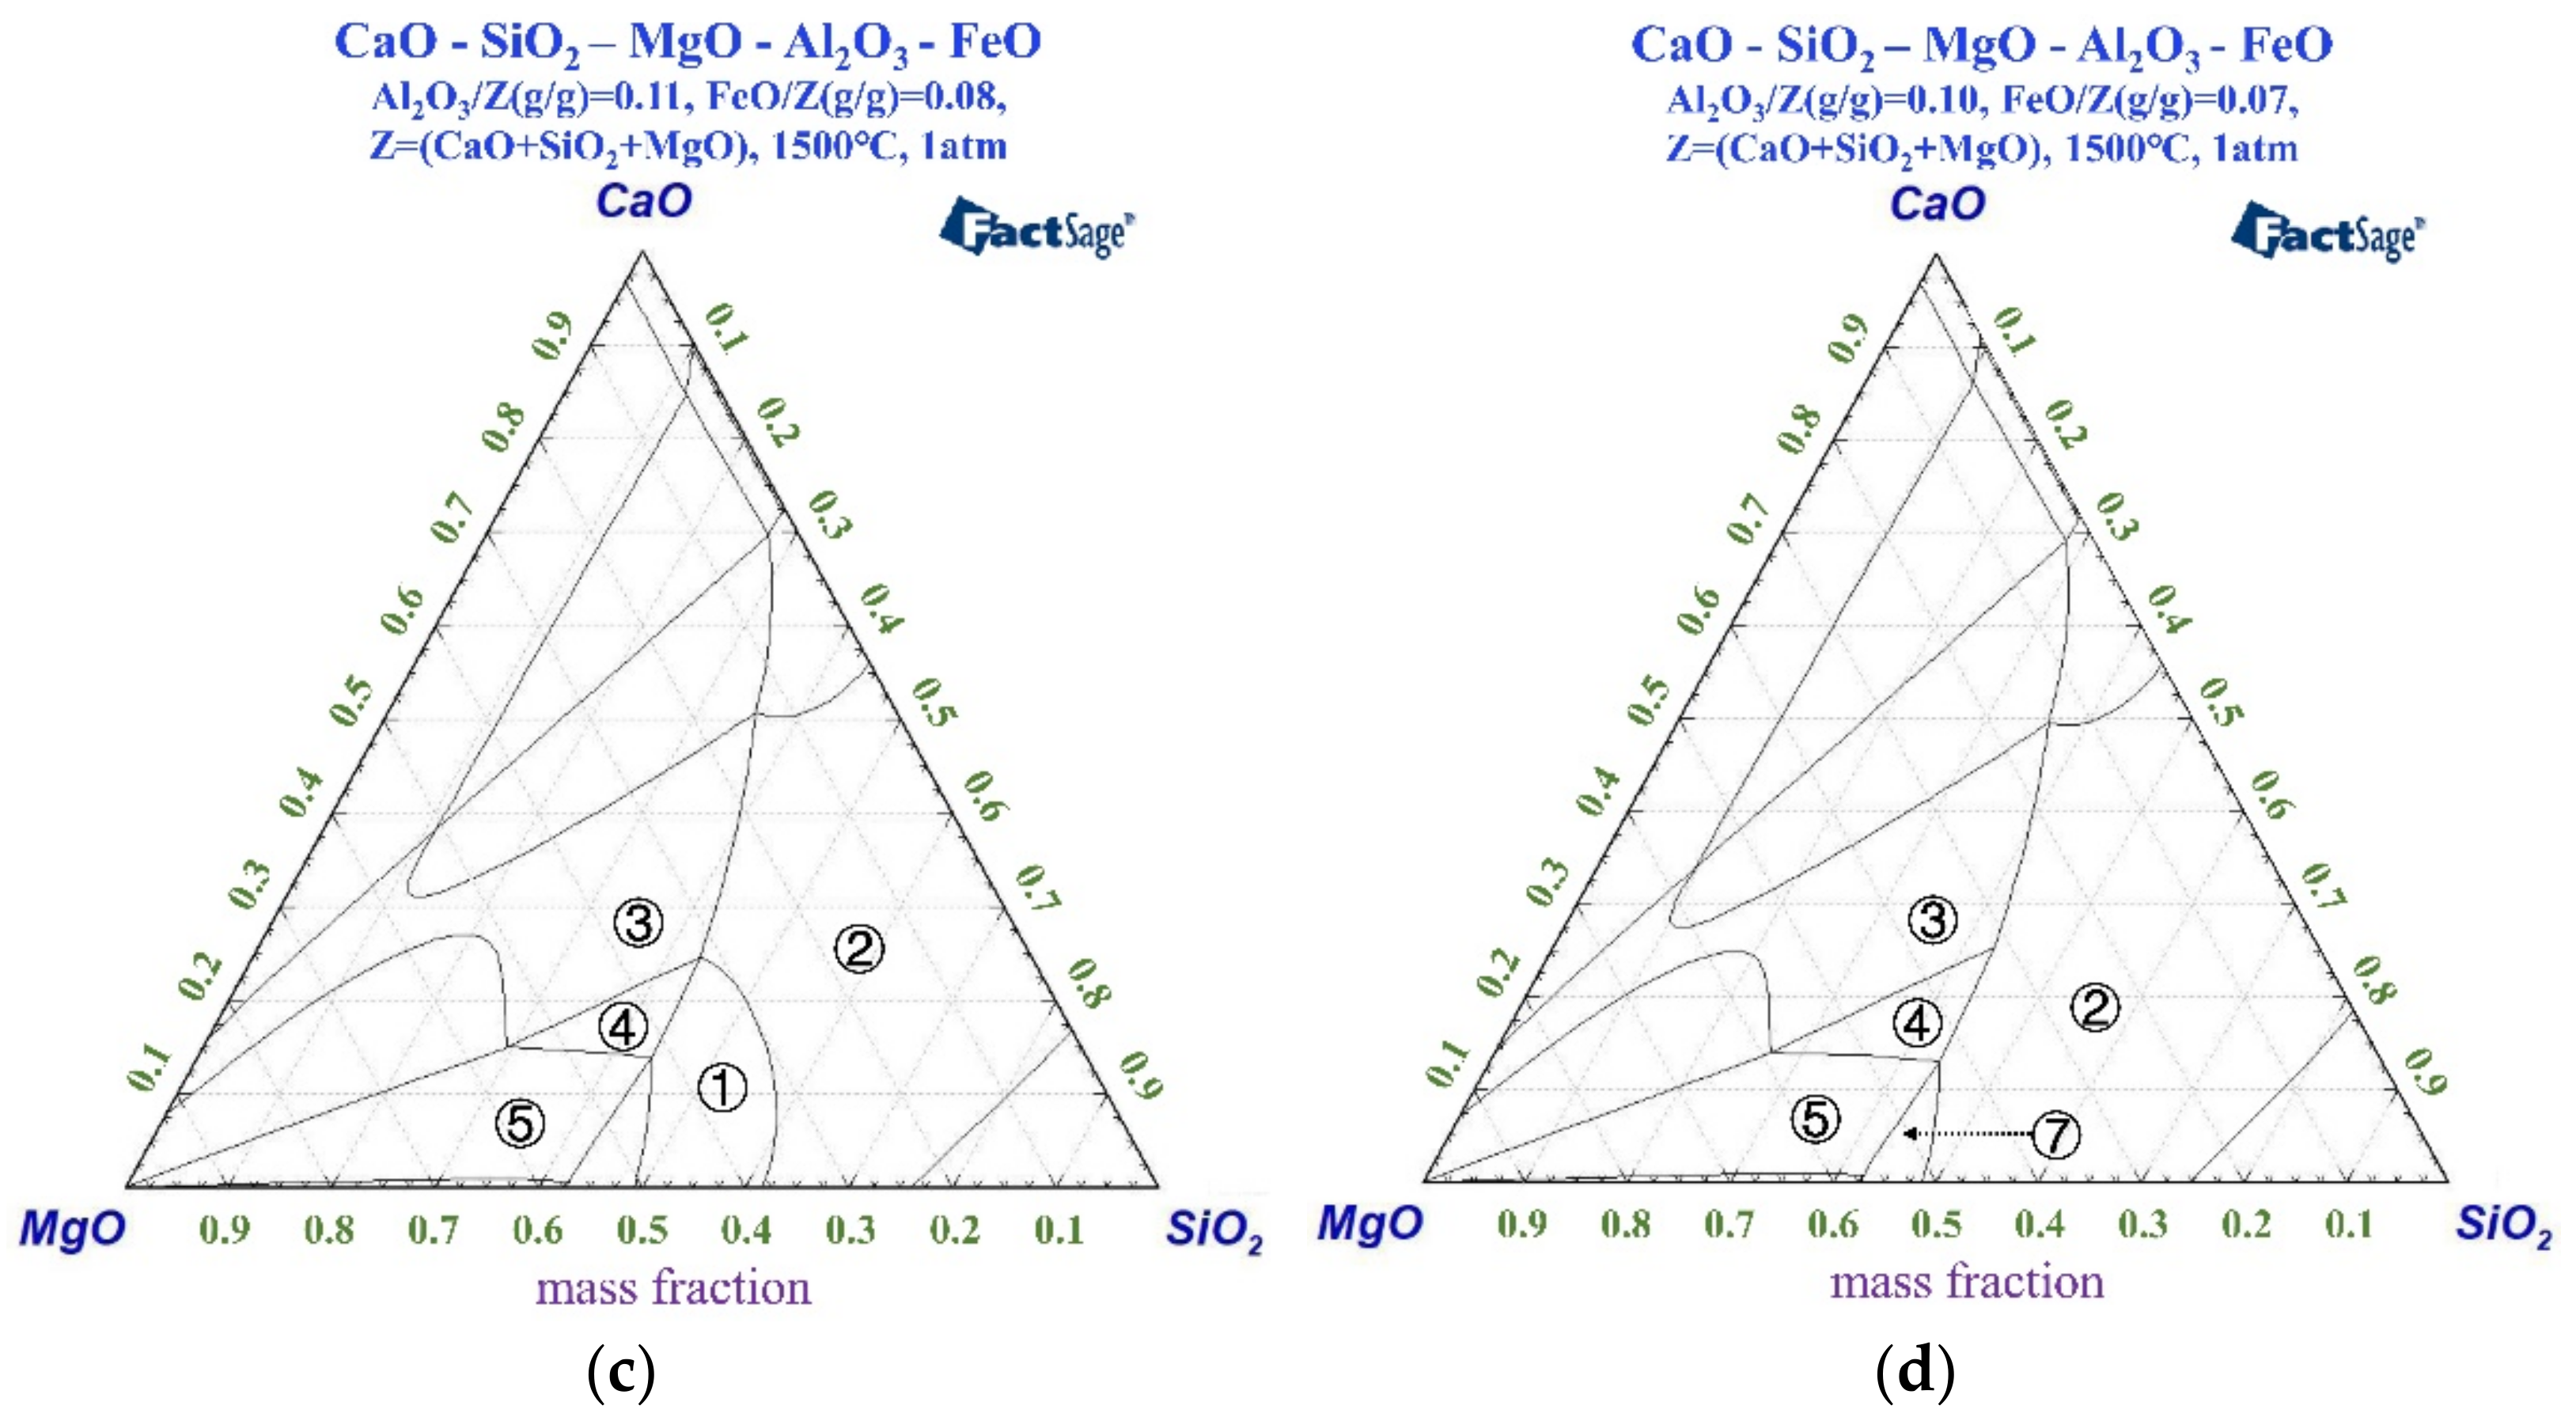
3.5. Theoretical Calculation by FactSage Software

In accordance with the chemical component of the mixed slag shown in Table 4, the viscosity of the mixed slag is calculated using the viscosity module in FactSage. The calculating conditions are as follows: standard atmosphere, temperature ranging from 1350 °C to 1560 °C, and temperature interval of 10 °C.
The object of the calculation is the liquid molten salt in the viscosity module of FactSage. The slag sample exists as a liquid phase and a solid precipitate phase in the range 1350–1560 °C by using the Einstein–Roscoe equation to simulate the viscosity of the slag sample in this temperature range.
Viscosity solid + liquid   mixture Viscosity liquid · 1 solid   fraction 2.5
The Equilib module in FactSage is used to calculate the liquid phase content and the percentage of the solid phase precipitated under the corresponding temperature conditions. The calculated results are imported into the Einstein–Roscoe equation, and the temperature–viscosity curve in Figure 11 is generated.
Figure 11 indicates that under the given conditions, the viscosity of the slag sample decreases with an increase in temperature. The slopes of the viscosity–temperature curves of H1-A and H2-A are similar; those of H1-B and H2-B are similar as well. Before the inflection point of the temperature–viscosity curve appears, viscosity has a steep gradient of variation; after the inflection point appears, viscosity tends to be stable. In addition, the temperature of the inflection point of samples H1-B and H2-B is earlier than that of H1-A and H2-A, which is also consistent with the melting–dropping property of the corresponding charged structure. When the curves become steady, the viscosity of mixed Slag B is slightly higher than that of mixed Slag A. The viscosity of slag is inversely proportional to the fluidity of slag itself; thus, Slag A exhibits better fluidity than Slag B at the same temperature.
The viscosity of the slag reflects the friction coefficient between different flow layers. During BF production, the permeability of the composite charge below the cohesive zone is directly affected by the viscosity of the slag; the higher the viscosity of the slag, the poorer the flow-properties of the slag, which facilitates blocking of the gas–liquid path formed by the coke layer. The porosity of the coke layer decreases, and the permeability of the charge column is reduced. As shown in Figure 11, the sinter S-2 causes an increase in the viscosity of the slag, thus decreasing the permeability of the charge. The peak value of pressure drop in H-2 is higher than that in H-1. The distribution of nondropped iron and slag in the graphite crucible in Figure 6 verifies this interpretation.
The calculation parameters and boundary conditions are set in accordance with the chemical component of the slag in Table 4. The influence of the chemical component of the slag sample on slag formation is examined using the phase diagram module in FactSage. Figure 12 and Figure 13 present the quinary phase diagrams of the slag at 1400 °C and 1500 °C, respectively.
The mainly solid–liquid components in the quinary phase diagrams are marked from ① to ⑦, which denote the following:
Fe(s) + Olivine + Slag-liq
Fe(s) + Slag-liq
Fe(s) + Monoxide + Slag-liq
Fe(s) + Monoxide + Olivine + Slag-liq
Fe(s) + Monoxide + Olivine + Slag-liq + Spinel
Fe(s) + Monoxide + Slag-liq + Spinel
Fe(s) + Olivine + Slag-liq + Spinel
The phase diagrams indicate that at 1400 °C, the area of Fe(s) + Monoxide + Slag-liq + Spinel in the quinary phase diagrams is larger for Slag A than Slag B, whereas the area of Fe(s) + Monoxide + Slag-liq is smaller for Slag A than Slag B. This change leads to the formation of more spinel phases during the formation of Slag A. The high fusion point spinel phase causes Slag A to melt after Slag B in Figure 11. The chemical component is the key factor causing the difference in slag melting at 1400 °C. The corresponding charge of Slag B adds 25% of lump ore; an excessive amount of lump ore in the charging mix causes the charge to contain more Al2O3, causing SiO2 and Al2O3 in the slag to absorb O2– to generate (SiO4)4– and (AlO4)5– in the slag system of CaO-SiO2-MgO-Al2O3-FeO. This behavior is likely to form a high-fusion-point phase.
When the temperature increases to 1500 °C, the areas of Fe(s) + Monoxide + Olivine + Slag-liq + Spinel, Fe(s) + Monoxide + Slag-liq + Spinel, and Fe(s) + Olivine + Slag-liq + Spinel narrowed distinctly, whereas the phases of Fe(s) + Monoxide + Slag-liq and Fe(s) + Monoxide + Olivine + Slag-liq enlarged, as shown in the quinary phase diagrams of Slag A. This behavior indicates that as smelting occurs, the spinel phase decreases significantly. The quinary phase system consists mainly of melilite and fayalite phases, which have lower fusion points; Slag A exhibits better fluidity than Slag B at high temperatures. Lump ores can be reduced easily at lower temperatures. The charging mix containing fewer lump ore still fails to complete the reduction reaction. Slag A contains more FeO than Slag B, providing free-moving Fe2+ and O2– in the Si-O network. Al2O3 in the slag absorbs O2– to generate (AlO6)5–, and the main mineral phases in the slag are feldspathic, which causes variations in fluidity.

4. Conclusions

This study evaluates the melting–dropping properties of single iron ores and four typical mixed BF charged with different proportions of lump ore and sinter basicity to explore the relationship between the melting–dropping property of the BF charge and its slag formation. The mechanisms underlying the change in melting–dropping property on the basis of slag formation are studied by SEM, XRD, XRF, and MPT in addition to using the FactSage thermodynamic software. The following conclusions are drawn:
  • A positive linear relationship exists between the melting behavior of slag and the melting–dropping property of the corresponding charge. Owing to their poor melting–dropping property, single iron ores are not suitable for BF production.
  • It is proposed that the effect is fundamentally dependent on the chemical; the mix charge can result in a concentration gradient of the chemical components at the contact interface, which can improve slag formation at high temperatures and enhance the melting–dropping property of the charging mix.
  • It is proposed that the self-softening and melting properties of the lump ores were dramatically improved by interaction between sinters and lump ores; the collocation pattern of lump ores and ratio between lump ores was also optimized, accordant with the interaction. So, the chemical component is the key factor causing the difference in slag formation behavior. An excessive amount of lump ore in the charging mix results in a mix charge with higher Al2O3 content, which causes SiO2 and Al2O3 in the slag to absorb O2– in order to generate (SiO4)4– and (AlO4)5–. In the CaO-SiO2-MgO-Al2O3-FeO slag system, this behavior is likely to form a high-fusion-point phase such as spinel.
  • Lump ores are easy to reduce at lower temperatures. The mix charge containing fewer lump ore retains more FeO, providing free-moving Fe2+ and O2– in the Si-O network. Al2O3 in slag absorbs O2– to generate (AlO6)5–. The main phases in the slag are feldspathic, causing variations in fluidity.

Author Contributions

Research design, Y.W., J.D. and B.X.; Data collection and analysis, Y.W.; Drafting, Y.W.; Charting, Y.W.; Literature search, C.Q. and P.D. All authors have read and agreed to the published version of the manuscript.

Funding

This research was funded by [Natural Science Foundation of Chongqing, China] grant number [cstc2020jcyj-msxmX0043] And the APC was funded by [ChongQing Science Bureau]. And this research was also funded by [Fundamental Research Funds for the Central Universities] grant number [2020CDJ-LHZZ-084], And The APC was funded by [Ministry of Education of the People’s Republic of China].

Data Availability Statement

Data presented in this article are available at request from the corresponding author.

Conflicts of Interest

The authors declare no conflict of interest.

References

  1. Elices, M.; Guinea, G.V.; Gómez, J.; Planas, J. The Cohesive Zone Model: Advantages, Limitations and Challenges. Eng. Fract. Mech. 2002, 69, 137–163. [Google Scholar] [CrossRef]
  2. Nomura, S.; Higuchi, K.; Kunitomo, K.; Naito, M. Reaction Behavior of Formed Iron Coke and Its Effect on Decreasing Thermal Reserve Zone Temperature in Blast Furnace. ISIJ Int. 2010, 50, 1388–1395. [Google Scholar] [CrossRef] [Green Version]
  3. Shi, P.Y.; Zhou, P.; Fu, D.; Zhou, C.Q. Mathematical model for burden distribution in blast furnace. Ironmak. Steelmak. 2016, 43, 74–81. [Google Scholar] [CrossRef]
  4. Committee on Reaction within Blast Furnace. Dissection of Quenched Blast Furnaces. In Blast Furnace Phenomena and Modelling; Springer: Amsterdam, The Netherlands, 1987. [Google Scholar]
  5. Yu, Y.; Saxén, H. Experimental and DEM Study of Segregation of Ternary Size Particles in a Blast Furnace Top Bunker Model. Chem. Eng. Sci. 2010, 65, 5237–5250. [Google Scholar] [CrossRef]
  6. Yang, W.; Zhou, Z.; Pinson, D.; Yu, A. A New Approach for Studying Softening and Melting Behavior of Particles in a Blast Furnace Cohesive Zone. Metall. Mater. Trans. B 2015, 46, 977–992. [Google Scholar] [CrossRef]
  7. Liu, X.; Wu, S.; Huang, W.; Zhang, K.; Du, K. Influence of High Temperature Interaction between Iron Ores on the Formation Behavior of Primary Slags. ISIJ Int. 2014, 54, 2089–2096. [Google Scholar] [CrossRef] [Green Version]
  8. Wu, S.L.; Xu, H.F.; Tian, Y.Q. Evaluation of Lump Ores for Use in Modern Blast Furnaces as Part of Mixed Burden Practice. Ironmak. Steelmak. 2009, 36, 19–23. [Google Scholar] [CrossRef]
  9. Wu, S.L.; Su, B.; Liu, X.L.; Kou, M.Y. Optimisation of the Blast Furnace Burden Based on Its Primary Slag Formation Behavior. Ironmak. Steelmak. 2016, 45, 50–57. [Google Scholar] [CrossRef]
  10. Wei, H.U.; Shusen, C.; Wenxuan, X.U.; Bang, J.W. Effect of Particle Size on Burden Distribution of Stock Surface and Permeability of Burden Layer in Blast Furnace. J. Iron Steel Res. 2018, 30, 769–775. [Google Scholar]
  11. Gupta, P.K.; Rao, A.S.; Sekhar, V.R.; Ranjan, M.; Naha, T.K. Burden Distribution Control and Its optimisation under High Pellet Operation. Ironmak. Steelmak. 2013, 37, 235–239. [Google Scholar] [CrossRef]
  12. Umadevi, T.; Brahmacharyulu, A.; Sah, R.; Mahapatra, P.C. Influence of Sinter Grate Suction Pressure (Flame Front Speed) on microstructure, productivity and quality of Iron Ore Sinter. Ironmak. Steelmak. 2014, 41, 410–417. [Google Scholar] [CrossRef]
  13. Long, C.; Xue, Q.; Guo, W.; She, X.; Wang, J. Study on the interaction behavior between lump and sinter under the condition of oxygen blast furnace. Ironmak. Steelmak. 2016, 43, 458–464. [Google Scholar]
  14. Wu, S.; Han, H.L.; Tao, W.Z.; Xu, H.F.; Wang, H.W. Increasing Proportion of Natural Lump Ores in Blast Furnace. Iron Steel 2009, 44, 12–16. [Google Scholar]
  15. Tanskanen, P.A.; Huttunen, S.M.; Mannila, P.H.; Härkki, J.J. Experimental Simulations of Primary Slag Formation in Blast Furnace. Ironmak. Steelmak. 2013, 29, 281–286. [Google Scholar] [CrossRef]
  16. Hino, M.; Nagasaka, T.; Katsumata, A.; Higuchi, K.I.; Yamaguchi, K.; Kon-No, N. Simulation of Primary-Slag Melting Behavior in the Cohesive Zone of a Blast Furnace, Considering the Effect of Al2O3, FetO, and Basicity in the Sinter Ore. Metall. Mater. Trans. B 1999, 30, 671–683. [Google Scholar] [CrossRef]
Figure 1. Schematic drawing of large capacity melting-drop furnace.
Metals 12 00987 g001
Figure 2. Sketch of a vertical section through the sample holder.
Metals 12 00987 g002
Figure 3. Temperature and gas−flow profiles programmed for each test.
Metals 12 00987 g003
Figure 4. The changing shape of a sample during heating. The four transition temperatures: (a) deformation, (b) softening, (c) hemispherical fusion, (d) flow.
Metals 12 00987 g004
Figure 5. Melting–dropping properties of samples tested. (a,b) Cohesive zone pressure drops and K values for single iron ore samples. (c,d) Cohesive zone pressure drops and K values for mixed iron ore samples.
Metals 12 00987 g005
Figure 6. Distribution of iron and slag in nondropped materials in the graphite crucible. The symbols denote iron (I), slag (S), coke particles (C), and the graphite crucible (G). (a) H1-A; (b) H1-B; (c) H2-A; (d) H2-B.
Metals 12 00987 g006
Figure 7. SEM observation of typical nondropped materials. (a) Appearance of typical nondropped materials, (b) SEM scanning of point a, (c) SEM scanning of point b, (d) SEM scanning of point c.
Metals 12 00987 g007
Figure 8. Penetration among slag–iron–coke under different charging mixes.
Metals 12 00987 g008
Figure 9. XRD analysis of single iron ore.
Metals 12 00987 g009
Figure 10. XRD analysis of slag in a typical mixed charge.
Metals 12 00987 g010
Figure 11. The viscosity curves of different slag.
Metals 12 00987 g011
Figure 12. Quinary phase diagrams of slag at 1400 °C. (a) H1−A; (b) H1−B; (c) H2−A; (d) H2−B.
Metals 12 00987 g012aMetals 12 00987 g012b
Figure 13. Quinary phase diagrams of slag at 1500 °C. (a) H1−A; (b) H1−B; (c) H2−A; (d) H2−B.
Metals 12 00987 g013aMetals 12 00987 g013b
Table 1. Chemical compositions of the raw materials, %.
SampleT[Fe]FeOSiO2CaOMgOAl2O3R2
S-158.529.334.859.041.271.991.86
S-257.209.105.0610.251.881.332.02
P-166.530.322.021.490.160.590.73
P-266.820.412.251.080.110.530.48
O-163.390.483.140.040.061.250.01
H1-A67.366.254.306.240.881.691.45
H1-B60.556.224.156.010.851.661.44
H2-A59.856.064.236.871.261.201.62
H2-B59.706.074.296.801.251.231.58
Table 2. Proportions of constituent raw materials in the charging mixes, %.
SampleS-1P-1P-2O-1
H1-A6510520
H1-B655525
H2-A6510520
H2-B655525
Table 3. The melting temperature of the slags with different furnace charged/°C.
SampleDeformationSofteningHemispherical FusionFlow
S-11312136913881422
S-21337137313961441
P-11184120012221234
P-21116113912341318
O-11088109611091123
H1-A1218131113171324
H1-B1204130313121329
H2-A1224132413321345
H2-B1210131613231335
Table 4. The chemical component of the slag sample in nondropped/%.
SampleCaOSiO2MgOAl2O3FeOR2
H1-A44.0532.166.278.958.571.3
H1-B43.0535.096.508.706.661.2
H2-A45.1232.936.189.306.471.3
H2-B42.7536.656.488.355.771.2
Publisher’s Note: MDPI stays neutral with regard to jurisdictional claims in published maps and institutional affiliations.

