Article

Experimental Determination of the Conversion Rate of Molten White Metal by Supplying Individual Air Bubbles

by
Maximiliano F. Roa-Jofré
,
Víctor R. Parra-Sánchez
*,
Gonzalo A. Reyes-Alcántara
,
Eugenia A. Araneda-Hernández
,
Eduardo R. Balladares-Varela
,
Roberto A. Parra-Figueroa
and
Camila V. Mora-Vilches
Department of Metallurgical Engineering, University of Concepcion, Concepción 4030000, Chile
*
Author to whom correspondence should be addressed.
Metals 2022, 12(6), 980; https://doi.org/10.3390/met12060980
Submission received: 27 April 2022 / Revised: 27 May 2022 / Accepted: 1 June 2022 / Published: 7 June 2022
(This article belongs to the Topic Recent Advances in Metallurgical Extractive Processes)

Abstract

:
The conversion of copper sulfide mattes lacks fundamental kinetic information for understanding the process. This work presents the results of the experimental measurement of the rate of oxidation of molten white metal by supplying individual air bubbles. The bubbles were characterized from information collected during the experiments and through theoretical and empirical correlations. Conversion tests were carried out at different temperature conditions and injection dynamics of the oxidizing gas. The results indicate that the conversion is controlled by the transport of oxygen into the bubble. A dependency between the characteristics of the injector and the shape, size and surface of the bubbles was identified. The oxidation rate of the white metal depended on the characteristics of the bubbles and the oxygen available for conversion. The results of this research provide relevant information to improve the operation of industrial conversion furnaces by controlling gas injection through the tuyeres. The criterion for improving conversion systems is the balance between the retention of the bubbles in the molten white metal and their size, such that the availability of oxygen for the conversion is guaranteed.

1. Introduction

At present, world copper production is based mainly on the refining of sulfide concentrates through pyrometallurgical processes. In a standard copper smelter, there are four stages, which are smelting, conversion, refining and slag cleaning, with the conversion stage being the process of interest in this work. The main objective of the copper conversion process is to eliminate sulfur and iron present in the matte (Cu2S–FeS) from the smelting stage, using the Peirce Smith Converter (PSC), the main technology used for this purpose [1]. During this stage, air or oxygen-enriched air is supplied into the molten phase at a temperature of 1523 K, to selectively oxidize iron and copper sulfides, from which SO2(g) is produced, as well as the slagging of iron using fluxes, mainly SiO2. Oxygen tends to react preferentially with iron, to subsequently oxidize the sulfur of copper sulfide, due to the greater affinity of oxygen to these elements with respect to copper [2].
The conversion process is typically carried out through two sequential stages: the first, related to the generation of slag; and the second, related to copper production, which is of greater interest for the present study. The copper generation stage begins with the elimination of iron from the matte (<1% by weight of Fe), from which the oxygen supplied through tuyeres submerged in the molten bath reacts with the sulfur present in the white metal, producing an immiscible liquid phase of blister copper and a gas phase of SO2(g), which is further processed to produce sulfuric acid as a by-product.
Even though the PSC has been predominantly used for copper matte processing, given its operational simplicity and the quality of blister copper produced, it has also shown poor environmental performance. Due to the new challenges driven by environmental restrictions, efforts have been focused on counteracting the low efficiency in capturing fugitive emissions, inherent in this type of reactor. The current trend is the development of continuous conversion processes that do not compromise the current performance achieved in the PSC [3,4]. In recent times, innovative continuous copper conversion technologies have been incorporated, such as Bottom Blowing technology in China, Mitsubishi of Kennecott-Outokumpu (Helsinki, Finland), ISASMELT of Glencore (Baar, Switzerland) and packed bed technology developed by ENAMI (Santiago, Chile), whose main characteristic is the supply of the oxidizing gas within the metallic phase of blister copper [5,6]. Even though this type of technology is already in operation at an industrial level, certain phenomena that occur inside the reactors are still unknown; furthermore, there is not enough experimental kinetic information on the desulfurization of white metal (Cu2S).
To quantitatively describe the heterogeneous kinetics of processes such as white metal conversion, the rate of specific oxygen consumption per unit of reaction area and time is usually used, and thus the effect of the bubble formation dynamics (shape, size, speed, area, frequency, among others) is considered in a single term, as well as aspects related to chemical transformations in the system. The availability of kinetic information, such as the specific rate of reaction, is relevant to analyze the global performance of the reactor, since it allows adjustment of the conversion variables, such as the height of the molten phases, the thermal control of the reactor, volumetric flows of oxidizing gas, raw material feeding, among others.
In recent decades, different researchers have carried out experimental and theoretical studies on the kinetic behavior of oxidation of copper sulfide at high temperatures [7,8,9,10,11,12]. These studies are mainly characterized by supplying the oxidizing gas on the surface of the molten bath [8,9,11], by monitoring the conversion process from changes in the mass of the melt [7,8,9,10,11] and by measuring the rate of generation of SO2(g) [8] in the exhaust gases. Kinetic information on the conversion process related to the operation of a Peirce–Smith reactor at an industrial level has also been reported [12]. In general, the authors of these investigations agree that the kinetics of the white metal conversion reaction is mainly controlled by oxygen transport in the gas boundary layer, regardless of the characteristics of the experimental systems studied. However, Carrillo et al. [9] indicate that the conversion rate is controlled by the chemical reaction when the oxidizing gas is supplied over the sample surface under laminar flow conditions in a horizontal reactor.
Given the wide variety of experimental systems and high-temperature Cu2S oxidation operating conditions, there is no consensus on the overall reaction mechanism under dynamic conditions of the white metal conversion process. However, it has been proposed that the conversion of copper sulfide is carried out through two reaction mechanisms [7,8,10,11]: during the initial stages of the process, the melt progressively desulfurizes, generating SO2(g) and remaining a single molten phase, that is, without blister copper appearing. After saturation of the molten phase in oxygen, a second conversion stage begins, during which SO2(g) is generated at a constant rate and, simultaneously, a liquid phase of blister copper immiscible in the remaining sulfide phase.
Additionally, previous investigations [7,8,9,11] have provided relevant information regarding the operational variables with the greatest influence on the conversion kinetics, such as temperature, oxidizing gas flow and oxygen content of the gas supplied to the melt. The operating temperature had a negligible effect on Cu2S oxidation in the range of 1373 K to 1523 K [7,8,9], confirming that under these conditions, the chemical reaction is not the limiting stage of the process [8]. This condition is reversed below 1373 K, since it corresponds to the eutectic reaction temperature of the components of the molten system [7]. On the other hand, there is no agreement among the authors [7,8,9,10,11] regarding the preponderance of the oxidizing gas flow over the conversion of the white metal, and it is reported that there is a minimal influence or a linear dependence of this variable on the oxidation of Cu2S. Regarding the oxygen content in the supplied gas, the authors agree that the increase in the oxygen concentration in the process gas causes a linear increase in the rate of sulfur removal from the molten bath [7,8,11], confirming the high dependence of the conversion process by mass transfer phenomena in the gas phase.
It is important to point out that most of the experimental studies reported on the oxidation of copper sulfide have been carried out using small samples, which varied between 8 × 10⁻⁵ kg and 0.2 kg, and which correspond to an approximate maximum volume of 0.09 L of molten material, where the kinetic data depend on the geometry and dimensions of the experimental system. Even when the results obtained in these experiments are useful to describe the oxidation of copper sulfide, they are insufficient when applied to other conditions of gas injection, specifically, under the surface of the molten bath. This is mainly due to the impossibility of using higher flows (greater than 0.3 L/min), since large bubbles are generated in the melt (0.0025 L to 0.0045 L), which cause white metal splashes on the walls of the crucible because of the intensity of agitation, hindering the representativeness of the results obtained.
On the other hand, characterizing the supply of bubbles through an injector immersed in a molten medium is highly complex, since it is not possible to visualize the detachment and subsequent rise of the bubbles formed, due to the need to maintain the hermeticity of the reactive system and the thermal insulation of the reactor. For this reason, it is extremely important to study the bubble formation phenomena based on the predictive theory reported in the literature [13] for molten media with similar physicochemical characteristics, or for aqueous media.
The study of the heterogeneous reactions (gas–melt) requires three fundamental aspects of bubble formation: size, shape and rise velocity. When a bubble is released from the injector submerged in a liquid or molten medium, free rise begins in the continuous medium, caused by the balance between the upward forces (buoyancy, contact pressure and gas momentum) and the downward forces (surface tension, drag and inertial) that interact on the bubble [14,15]. These fluid dynamic conditions determine the initial size of the bubble at the time of its detachment from the injector.
The size of individual bubbles supplied to a continuous medium has been investigated both in aqueous media [14] and in molten systems [16]. Gaddis et al. [14] developed a theoretical model to estimate the dimensions of bubbles injected into an aqueous medium, considering that at the moment of their detachment they have a spherical geometry, and in addition, that the gas flow is constant and the liquid phase is in a steady state. On the other hand, Andreini et al. [16] studied the behavior of bubbles injected into molten metals (tin, copper and lead) under laminar flow conditions at the injector outlet and proposed an empirical expression to estimate the size of the bubbles generated, based on the dimensionless Froude and Weber numbers. However, even though this expression was formulated for molten metallic systems, its predictions are inaccurate for high volume flow rates such as those used in this investigation. In this sense, Andreini et al. [16] reported a measurement technique for the frequency of bubble formation based on capturing the sound they emit at the moment of their detachment and their subsequent rupture on the surface, from which the size of the bubbles formed in the molten bath is estimated.
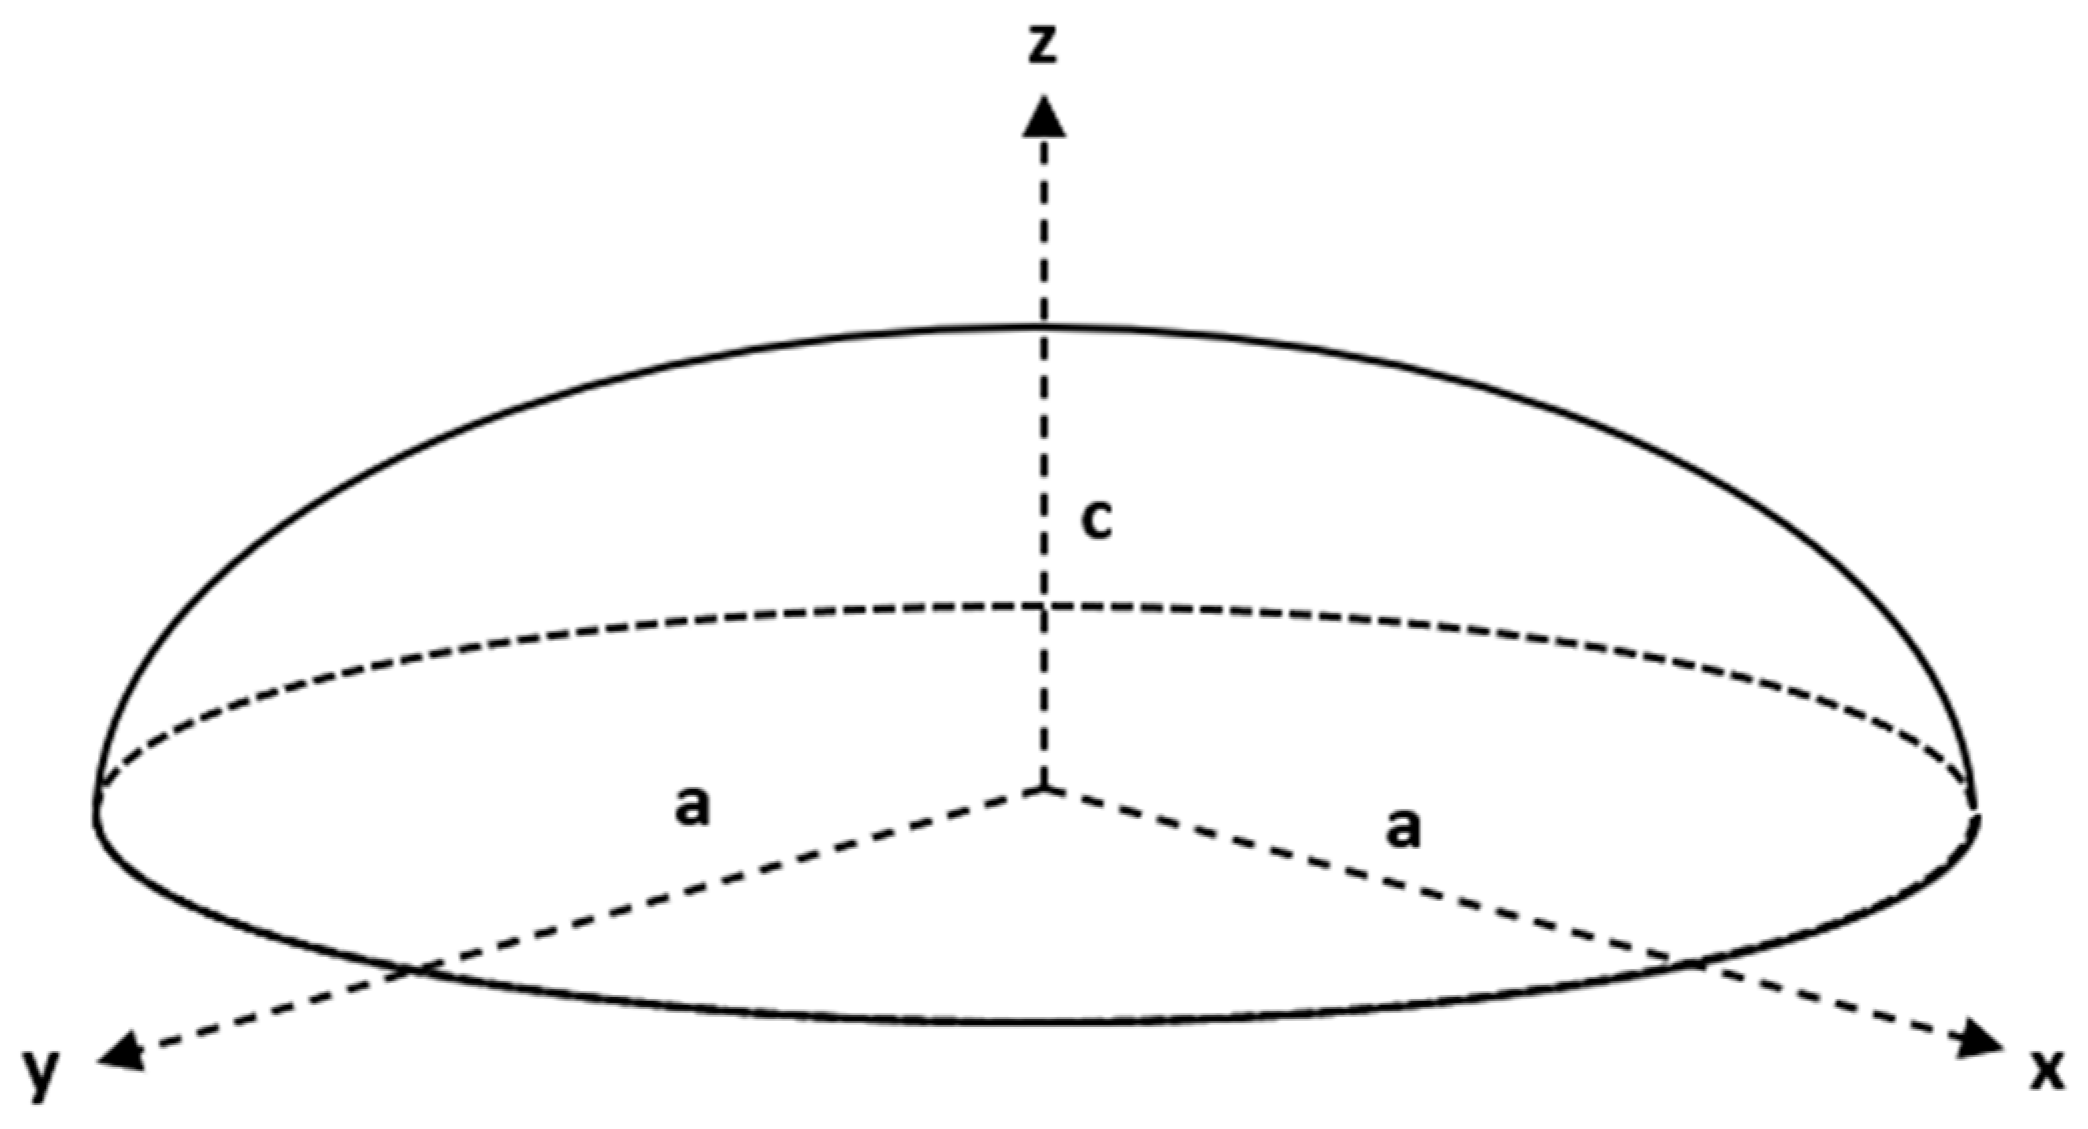
Regarding the shape of the bubbles, the studies reported in the literature indicate that at the moment of their detachment from the injector, they present a completely spherical geometry, when a balance is established between the forces that act on the bubble [17,18,19]. Subsequently, during their rise, the bubbles are deformed by the global or local stress generated by the different forces that are exerted on the gas–melt interface. Based on the available literature [13,20,21], the surface tension forces tend to maintain the spherical shape of the bubbles, while the buoyancy forces cause the opposite effect, that is, they adopt forms far from sphericity, for example, ellipsoidal. In this sense, Clift et al. [20] characterized the shape of the bubbles that rise through a liquid medium as infinite from the dimensionless Reynolds, Eötvös and Morton numbers, to consider the physicochemical properties of the system. As a result, they proposed graphical correlations to estimate the shape of the bubbles during their rise into the melt as a function of these three dimensionless numbers.
To finish with the characterization of the bubbles, several authors have studied the rise velocity in liquid systems in a wide range of experimental conditions [13], although very few studies are related to gas supply in high-temperature molten systems. In this sense, the research carried out by Rodrigue et al. [22] formulated a mathematical correlation to estimate the terminal rise velocity of individual bubbles through any Newtonian fluid. The proposal is based on the analysis of a large database created and published in previous articles [23,24], highlighting the use of experimental information obtained from a liquid phase of mercury and molten silver.
The present investigation aims at contributing to the description of the kinetics of the molten white metal conversion process based on the supply of individual bubbles, providing experimental information on the reaction rate. As far as the authors of this work are aware, kinetic studies related to the subject have not addressed the oxidation of Cu white metal by injecting bubbles under the molten bath, so the reported kinetic information that contributes to the understanding of the chemical phenomena involved in this stage is extremely scarce. In this regard, the results of a kinetic study are presented, which includes the experimental characterization of the oxidizing gas supply in terms of the shape, size and frequency of the injected bubbles, as well as continuous monitoring of the conversion process by measuring the SO2(g) generated by oxidation reactions. Kinetic data described in terms of gas phase characteristics are relevant, since they were obtained under equivalent oxidizing gas supply conditions to those utilized in industrial molten bath conversion reactors, and so can be used to identify potentials for process improvement.

2. Materials and Methods

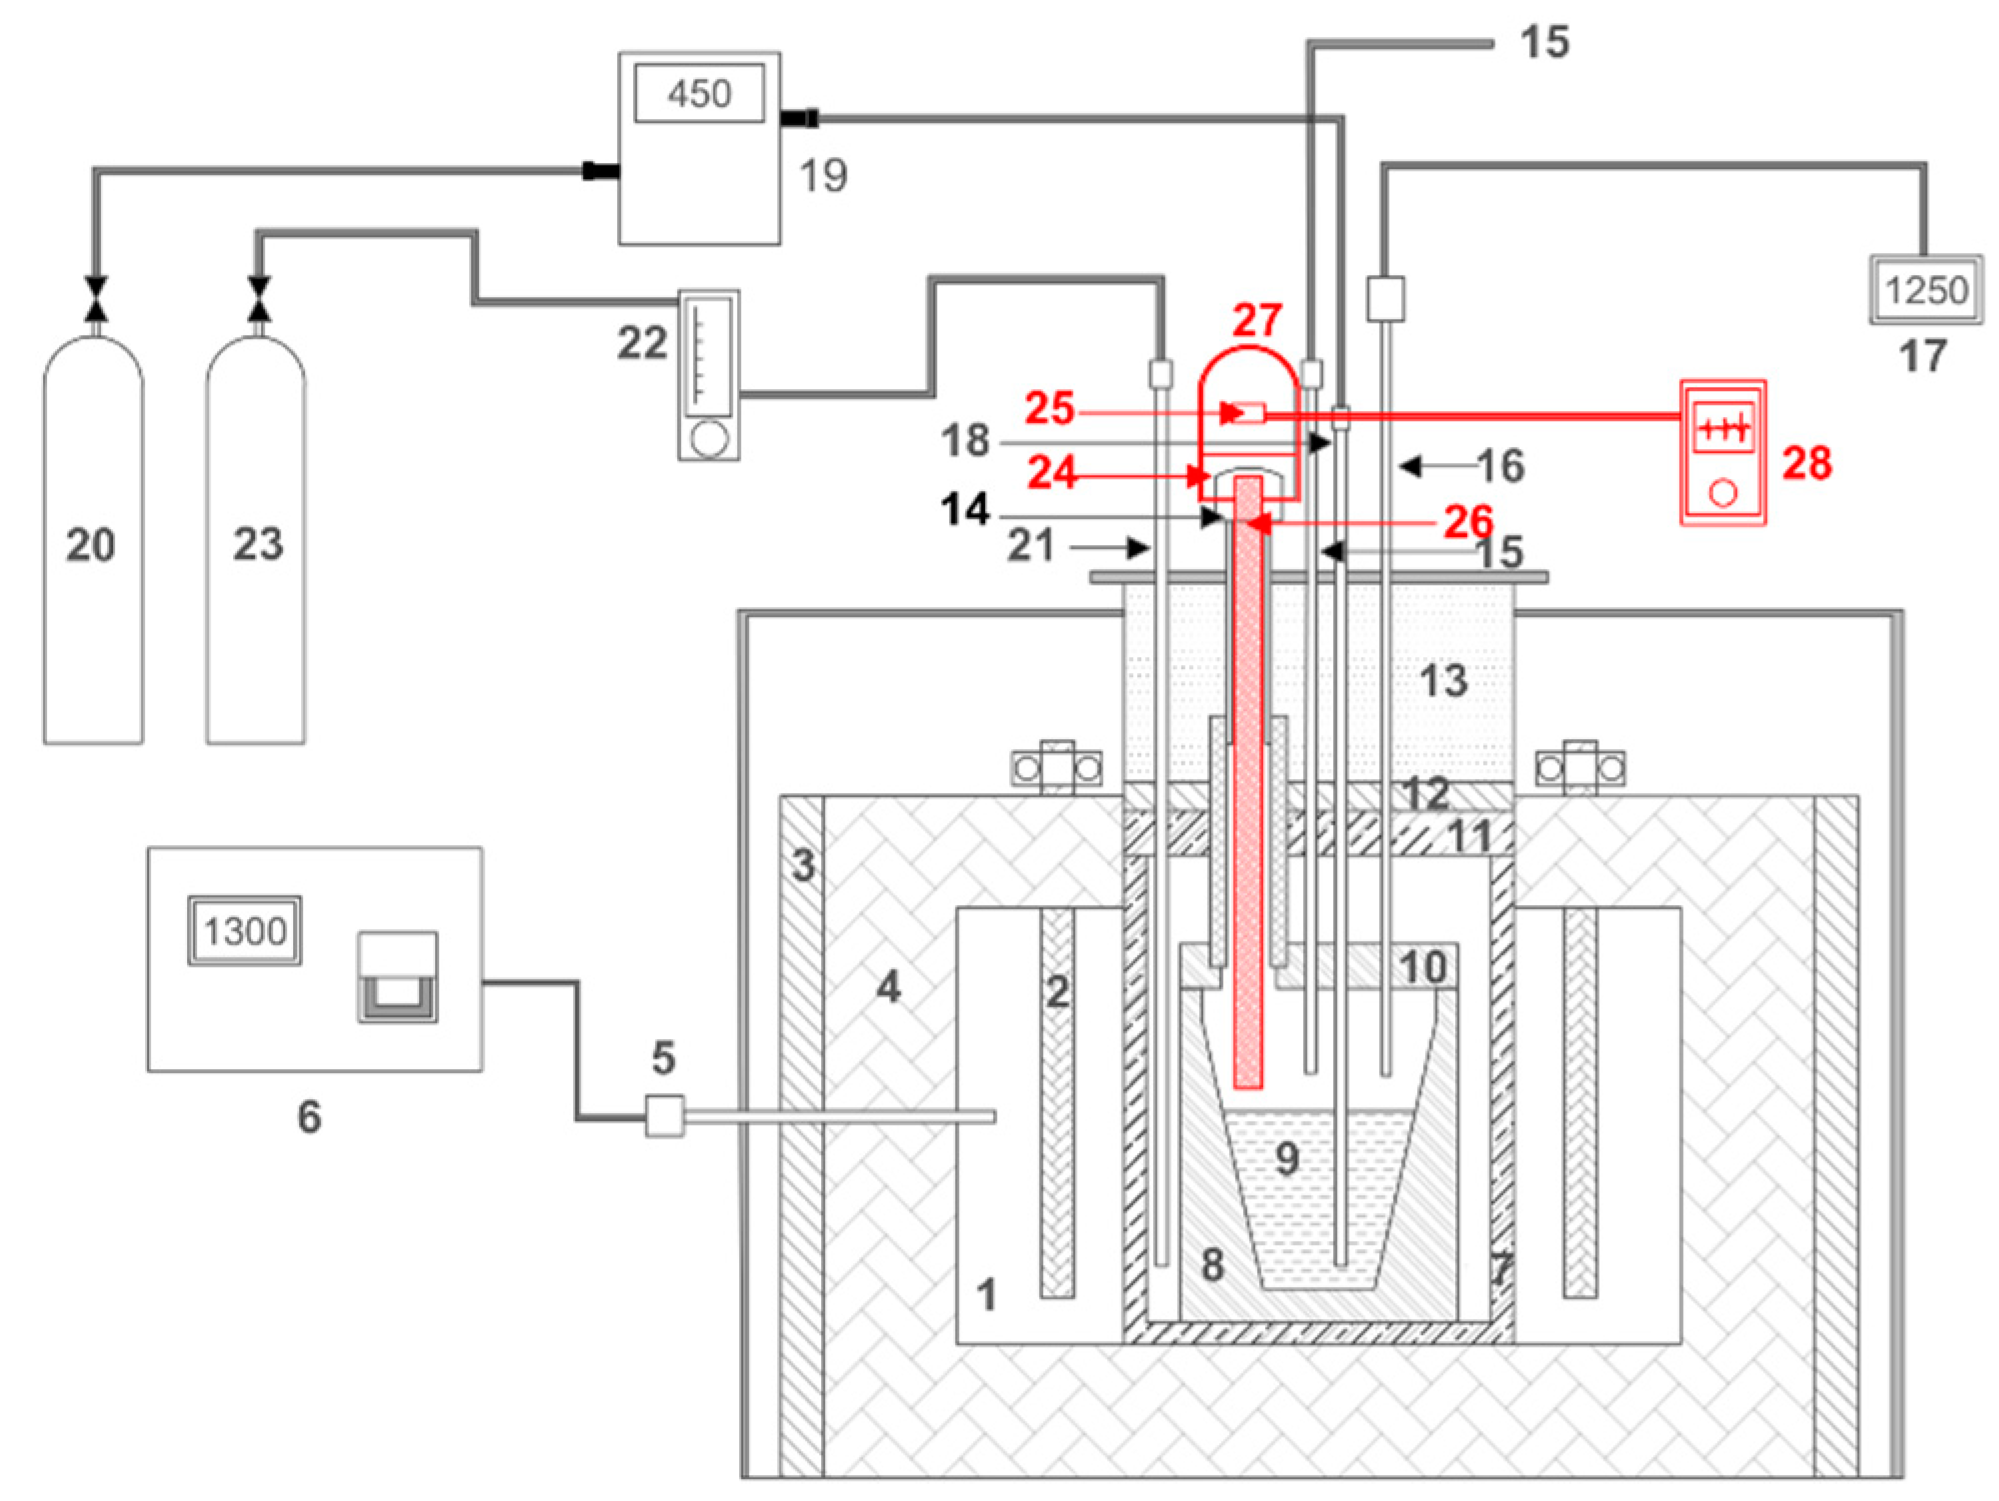
The experimental conversion tests were carried out in a reaction furnace capable of reaching temperatures up to 1573 K. The reactor consists of an electrically heated Lindberg® crucible furnace composed of a reaction chamber, nine silicon carbide (SiC) electrical resistors and thermal insulation (glass wool and refractory cement) with which the constant operating temperature was maintained. The reaction chamber is cylindrical in shape with a height of 0.34 m, an external diameter of 0.43 m and a central opening of 0.24 m in diameter. Inside, the SiC resistors are suspended concentrically, with the aim of homogeneously distributing the heat in the reaction zone. The heating system is controlled by an S-type thermocouple located on the side of the reaction chamber and a PID-type temperature controller with a ramp input signal. Inside the reaction chamber, a cylindrical ceramic piece 0.36 m high, with an internal and external diameter of 0.195 m and 0.235 m, respectively, was designed and manufactured, known as a safety crucible. This crucible fulfills two essential functions: it guarantees the protection of the integrity of the reactor against possible spills of molten material, and it isolates the reactive system, promoting a neutral environment free of ambient oxygen. The reactive material is melted in a working crucible designed and built in the shape of a truncated cone, with dimensions of 0.135 m and 0.07 m in upper and lower diameter, respectively, and a total height of 0.200 m (0.175 m effective filling height). The safety crucible and the working crucible were made with refractory cement (96% Al2O3). To ensure the correct positioning of the gas injection system and to avoid possible fugitive emissions from the reactor, a system of removable covers was built for the working crucible and the safety crucible, as well as for the main opening of the oven, called working, safety and furnace covers. All the covers were made of the same refractory material as the safety and working crucibles. The experimental system used in this research is shown in detail in the scheme of Figure 1.
The internal temperature of the working crucible was measured by means of a type K thermocouple (Ni 10% Cr–Ni 2% Al) with a diameter of 0.003 m, positioned 0.02 m above the surface of the melt. Air injection was carried out using alumina injectors of 0.005 m, 0.006 m and 0.007 m external diameter (0.001 m thick), while nitrogen injection was carried out through an alumina injector of 0.005 m external diameter. The reaction gas was extracted through an alumina tube with an external diameter of 0.008 m, positioned at 0.002 m above the surface of the molten material.
In addition to the reaction furnace, the system was equipped with three annex units, which allowed it to operate in a stable manner during the conversion experiments. The first unit to achieve precise control of the supply of gases to the reactor was composed of the following elements: an air (process gas) line controlled by a mass flowmeter (Omega®) to operate in the range of 0–0.55 L/min with an accuracy of ± 0.001 L/min; and an extra pure nitrogen (auxiliary) line (>99.9% N2(g),10 ppm O2(g)) that maintains constant isolation of the reactive zone, a condition that is controlled by a rotameter with a capacity of 0–10 L/min, with an accuracy of 1 L/min. The second experimental unit allows online quantification of the SO
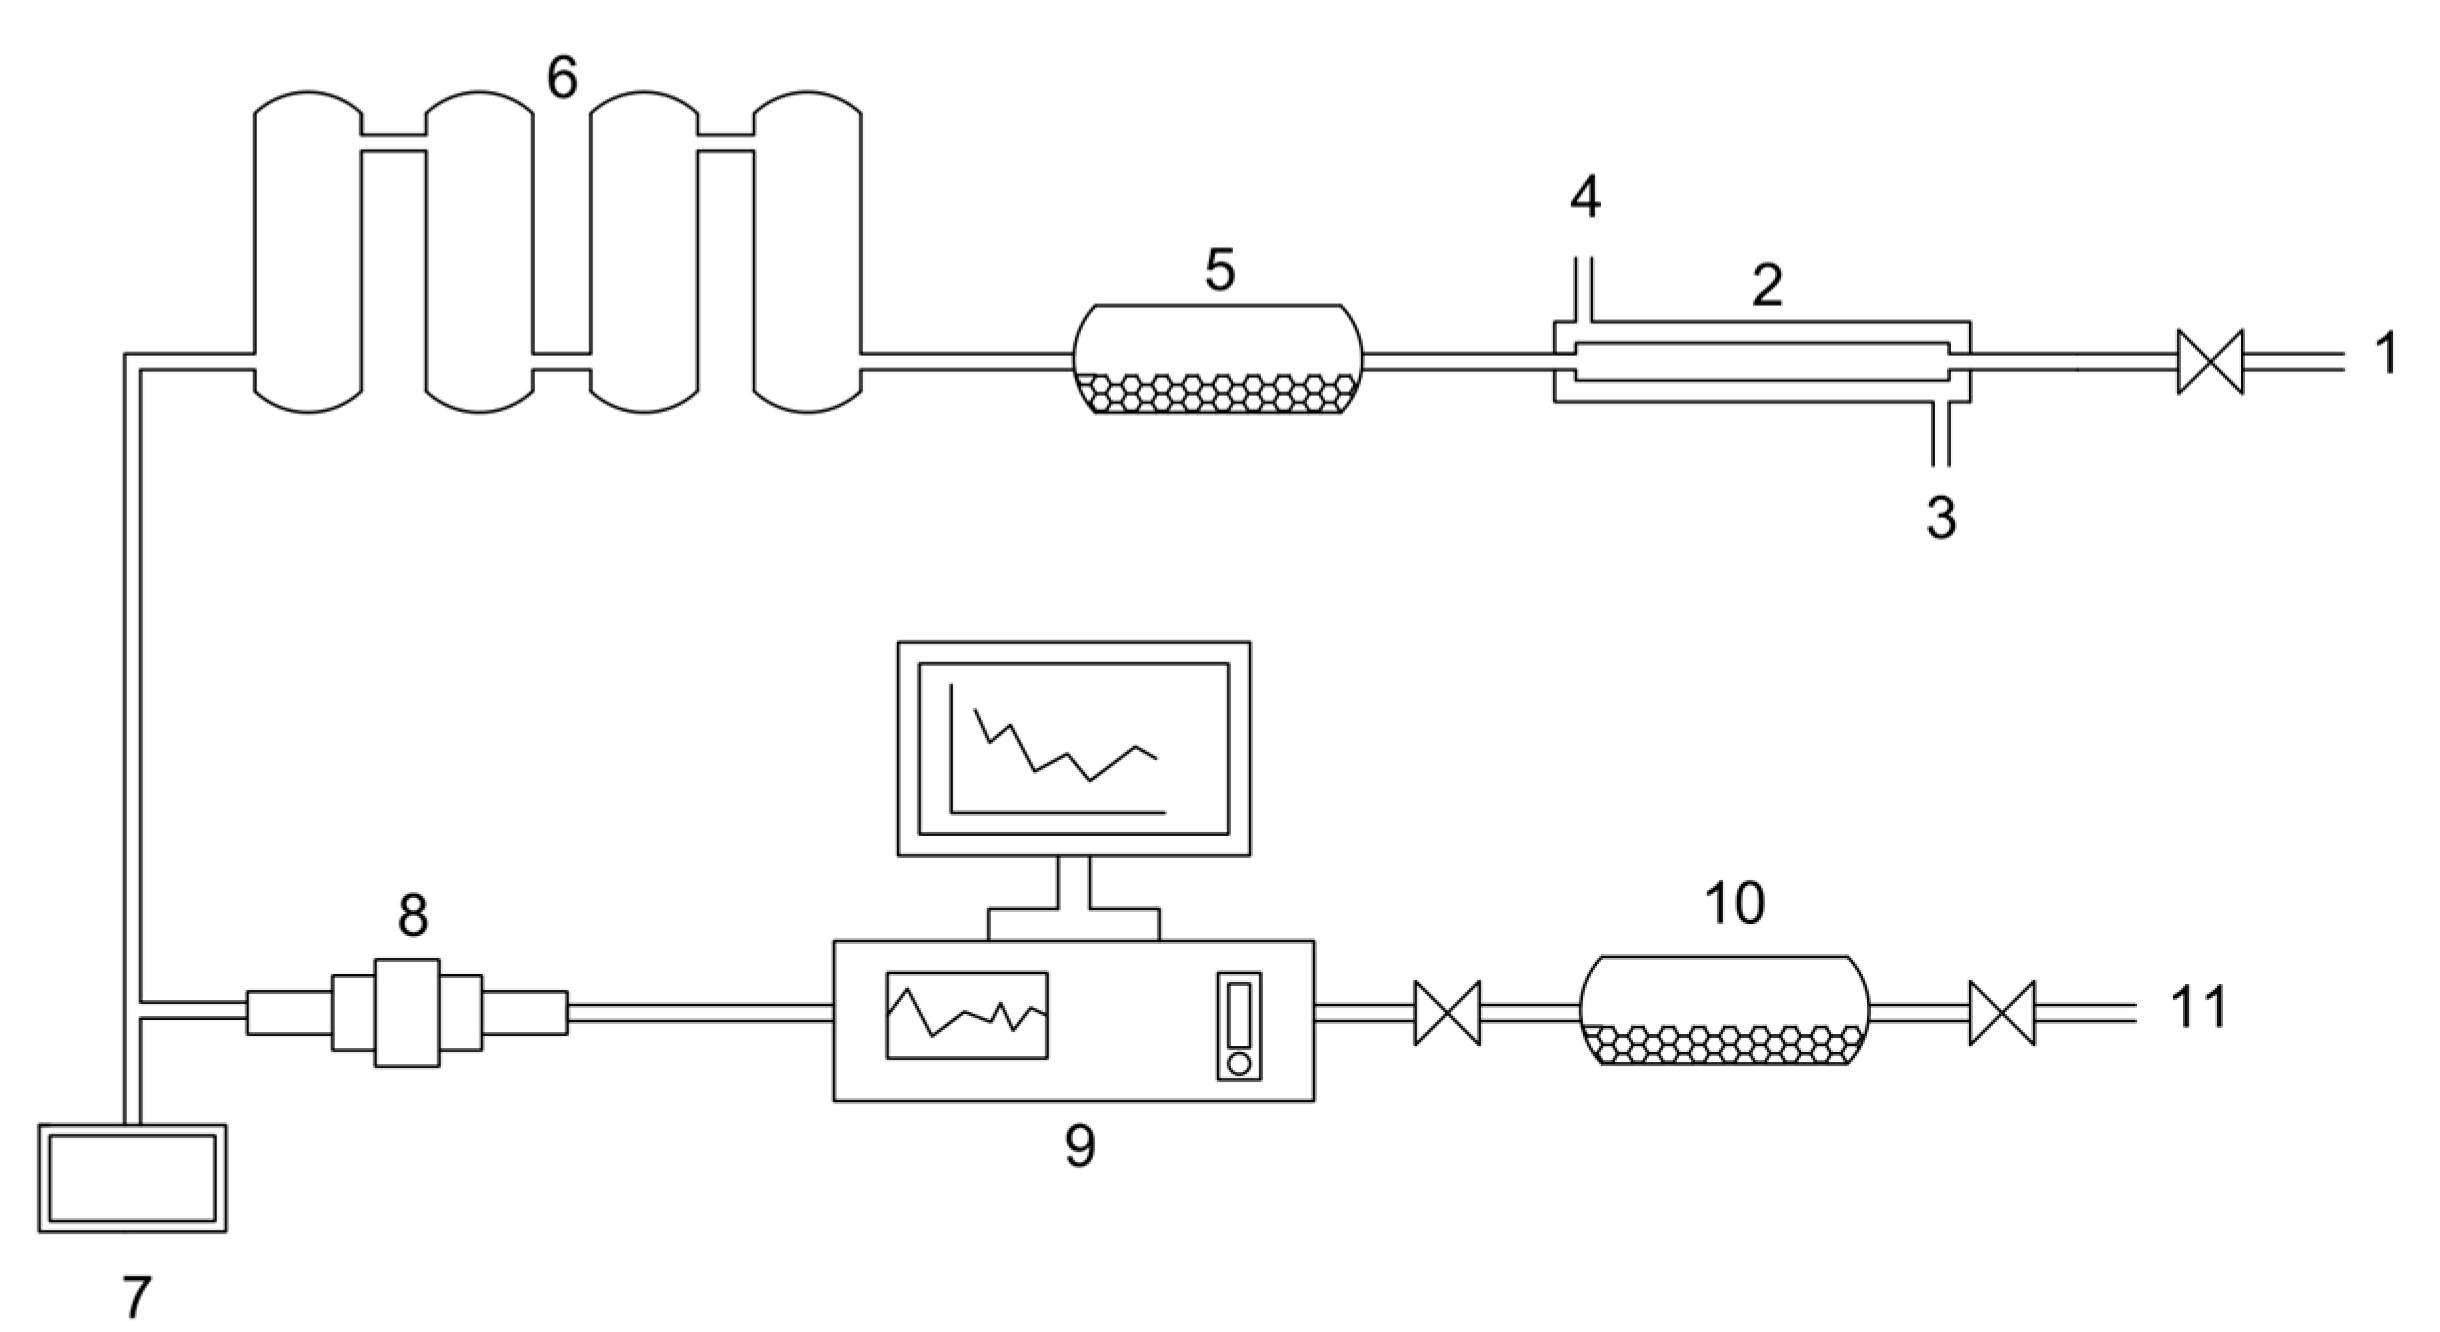
2(g) concentration in the reactor outlet gases with a DOAS analyzer (Differential Optical Absorption Spectroscopy) of the Unisearch Associates Inc., capable of measuring volumetric concentrations of SO2(g) in the interval from 0% to 75%. The DOAS was connected to a gas extraction and cleaning system, the design of which is shown in Figure 2. The purpose of gas cleaning is to cool, dehumidify and capture the suspended particles to avoid damage and adverse effects on the SO2(g) analysis equipment. The extraction of gases was carried out with a Venturi-type vacuum pump, allowing the continuous collection of the process gas flow.
Finally, the third unit consists of a system for capturing the sound emitted by the air bubbles being injected under the molten bath. Sony® hands-free microphones incorporated in a metal amplification chamber were used, as shown schematically in red in Figure 1. The amplification chamber has two side holes on the upper surface for the microphone input and output, as well as a lower hole where an AISI 304 steel tube was connected through a rubber plug coated with ceramic fiber material for thermal insulation of the recording component. The sound capture system is arranged above the loading mouth and is introduced until it reaches a height of 0.02 m above the surface of the melt. The measurement of the frequency of bubble formation was discrete given the progressive wear of the acoustic components due to the high operating temperatures.

2.1. Experimental Methodology

The reaction rate of the molten white metal conversion, r O 2 , in mol O2 m−2 s−1, was determined from the following expression:
r O 2 = J O 2 A b   f   t r
In which, J O 2 are the moles of oxygen consumed to form SO2(g) and measured from the continuous analysis of the exhaust gases in mol O2 s−1; A b   is the interfacial area of the individual bubbles (depending on the geometry that the bubbles acquire in the melt phase) in m−2; f is the frequency of bubble formation in s−1; and t r is the residence time of the bubbles in the melt in s.
According to the literature [25,26,27], once the injection of the oxidizing gas in the molten white metal phase starts, the volatilization of sulfur in the form of SO2(g) begins (see Equation (2)), generating a white metal deficient in sulfur, without blister copper formation:
Cu 2 S ( l ) + x   O 2 ( g ) Cu 2 S 1 x ( l ) + x   SO 2 ( g )
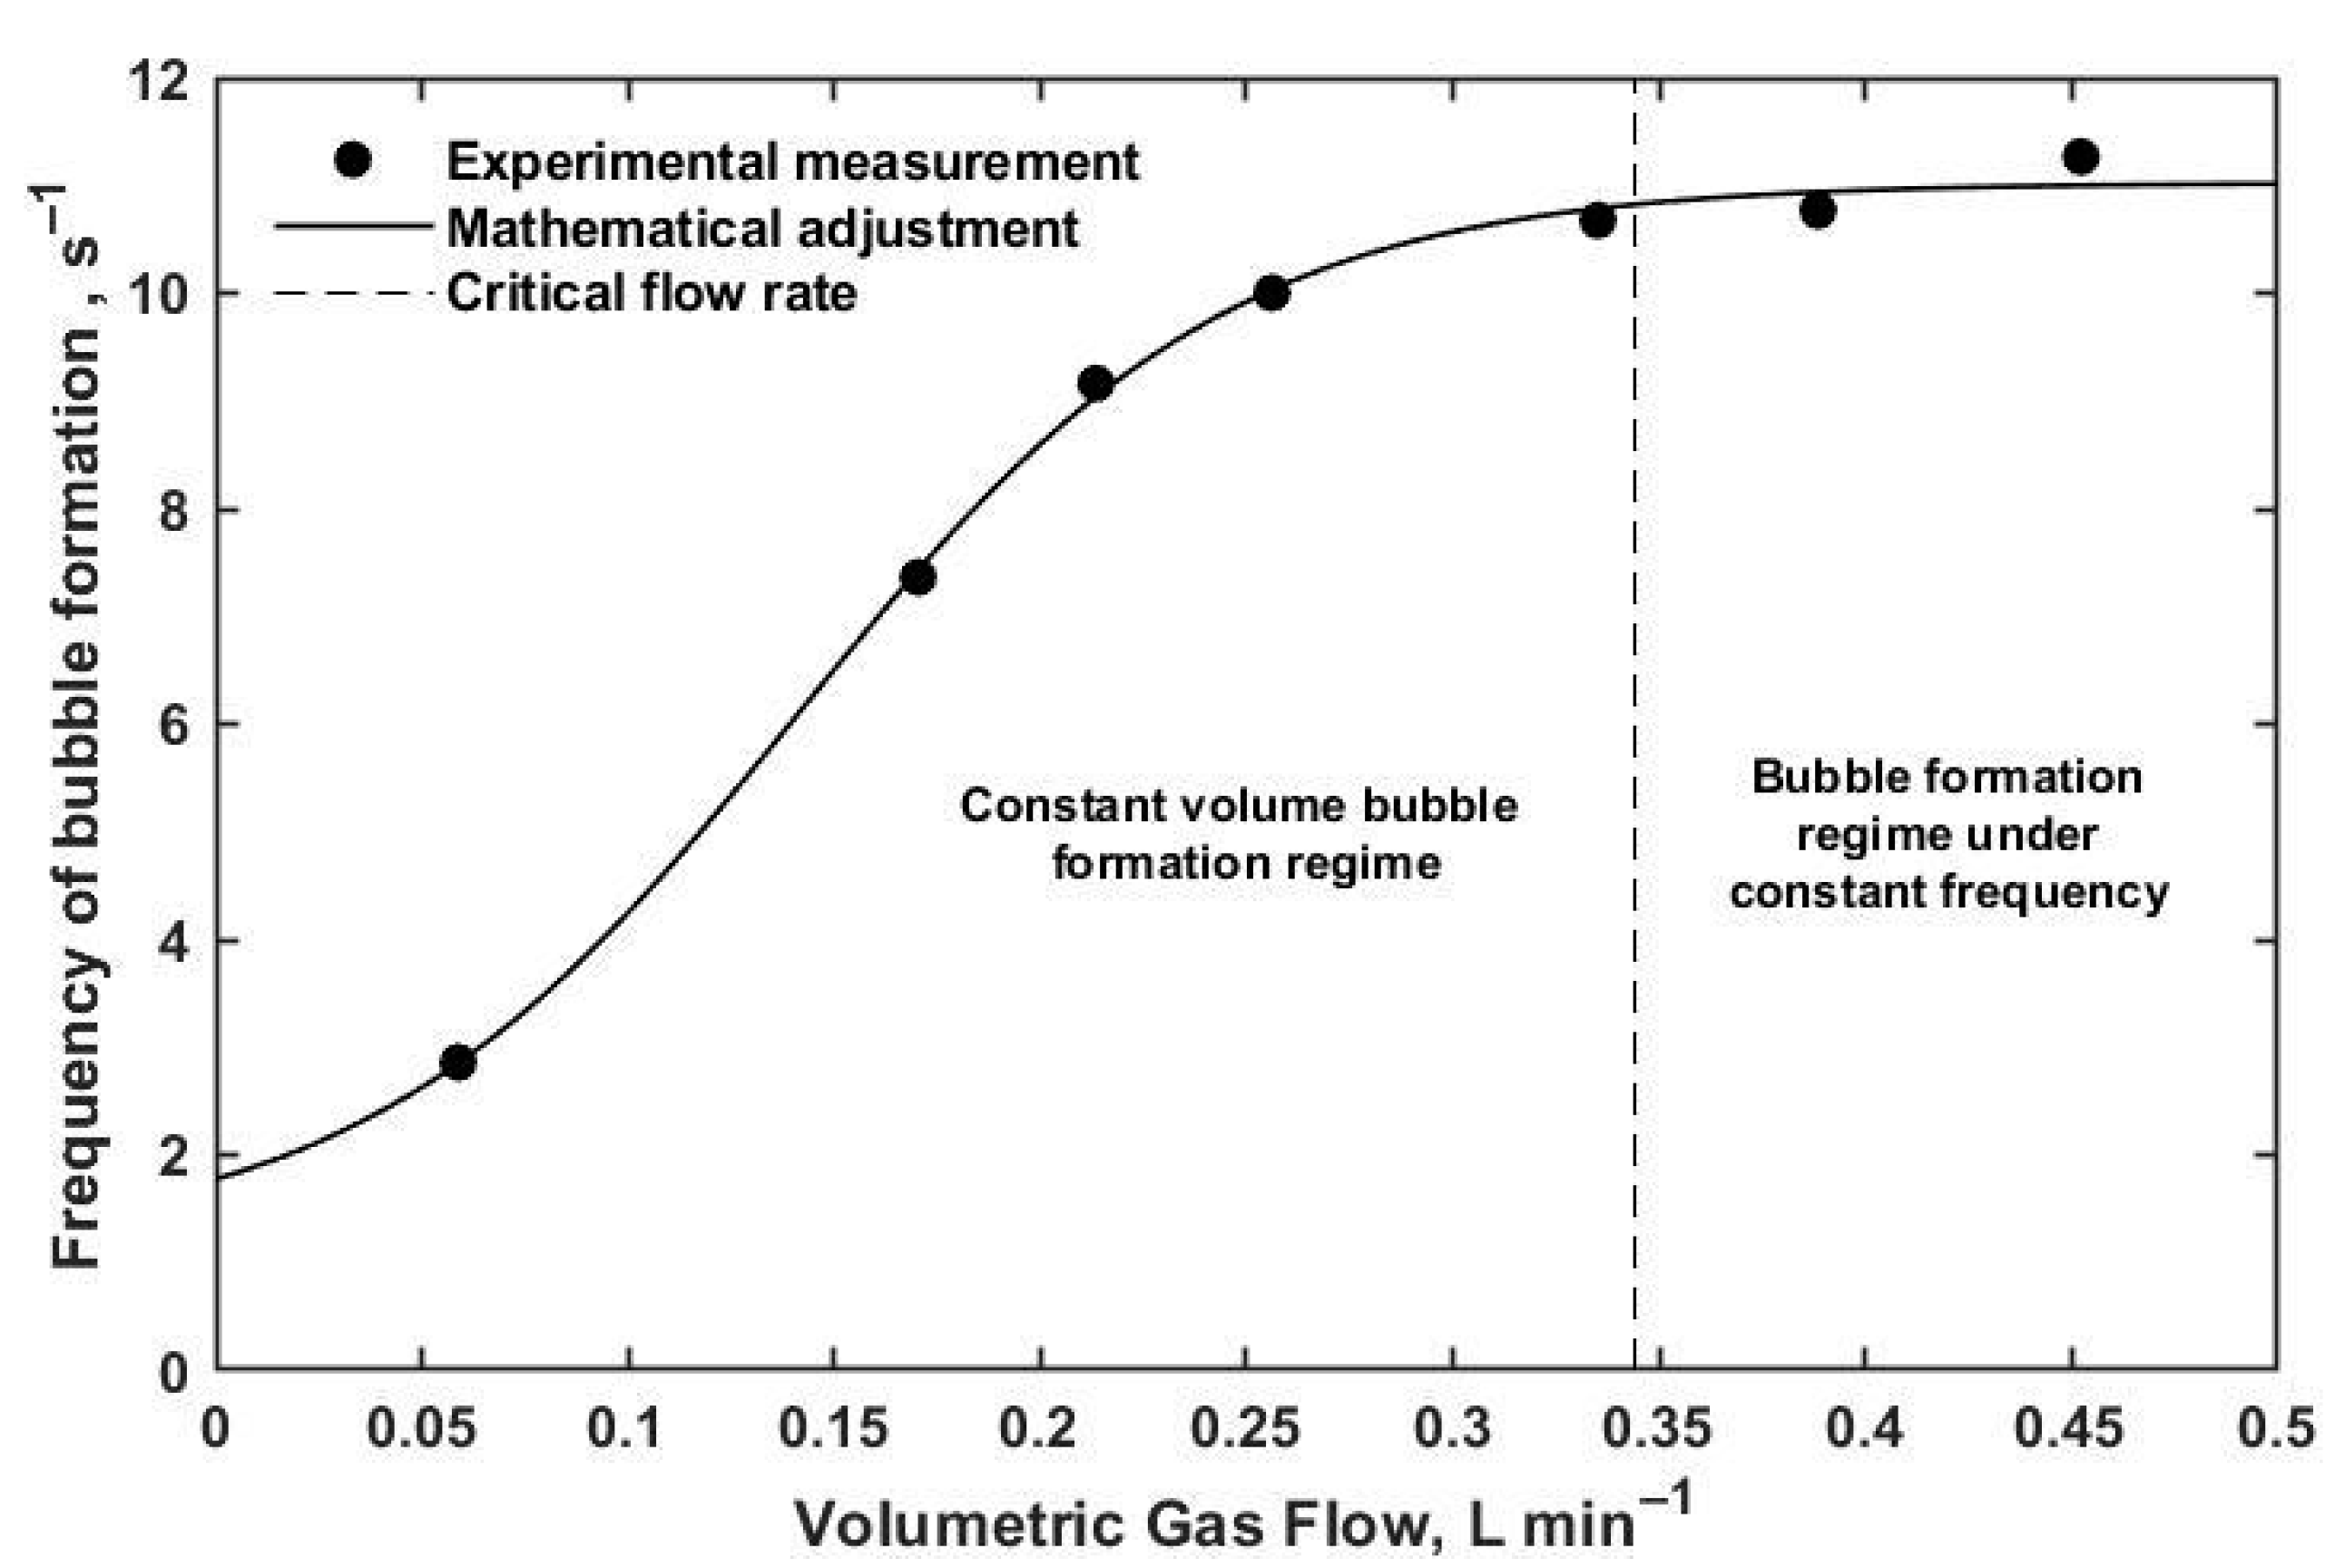
The experimental design contemplated the realization of 12 experiences at the laboratory level to investigate the effect of the following variables on the rate of conversion of the white metal: the diameter of the oxidizing gas injector, the position of the injector with respect to the surface of the melt and the operating temperature of the system. The air flow rates, Q in L min−1, reported in Table 1 were defined based on the critical flow rate determined for each injector [17,28]. Under this condition, the highest permissible volumetric flow is considered to achieve bubble injection under a constant volume regime. Additionally, under these gas injection conditions, the formation of individual air bubbles is promoted, inhibiting the presence of swarms of bubbles inside the melt due to the effect of coalescence phenomena and, therefore, reducing errors in the estimation of the reaction area. On the other hand, the recorded operating temperature (see Table 1) was defined based on the value of the controller, since the temperature record through the thermocouple located near the molten bath was deficient due to the serious damage caused by molten material and by continuous exposure to SO2(g) generated during the conversion process.
Likewise, the position of the injector was defined to evaluate the effect of the column of molten material on the point from where the bubbles of the process gas were injected. In operational terms, this variable is related to the distance traveled by the bubbles from the point where they were injected until they burst on the surface of the molten white metal. For the extraction of the reaction gases, a volumetric flow at the outlet of 2.0 L/min was defined for all the experiments, in order to guarantee the complete collection of the SO2(g) generated by the reaction.
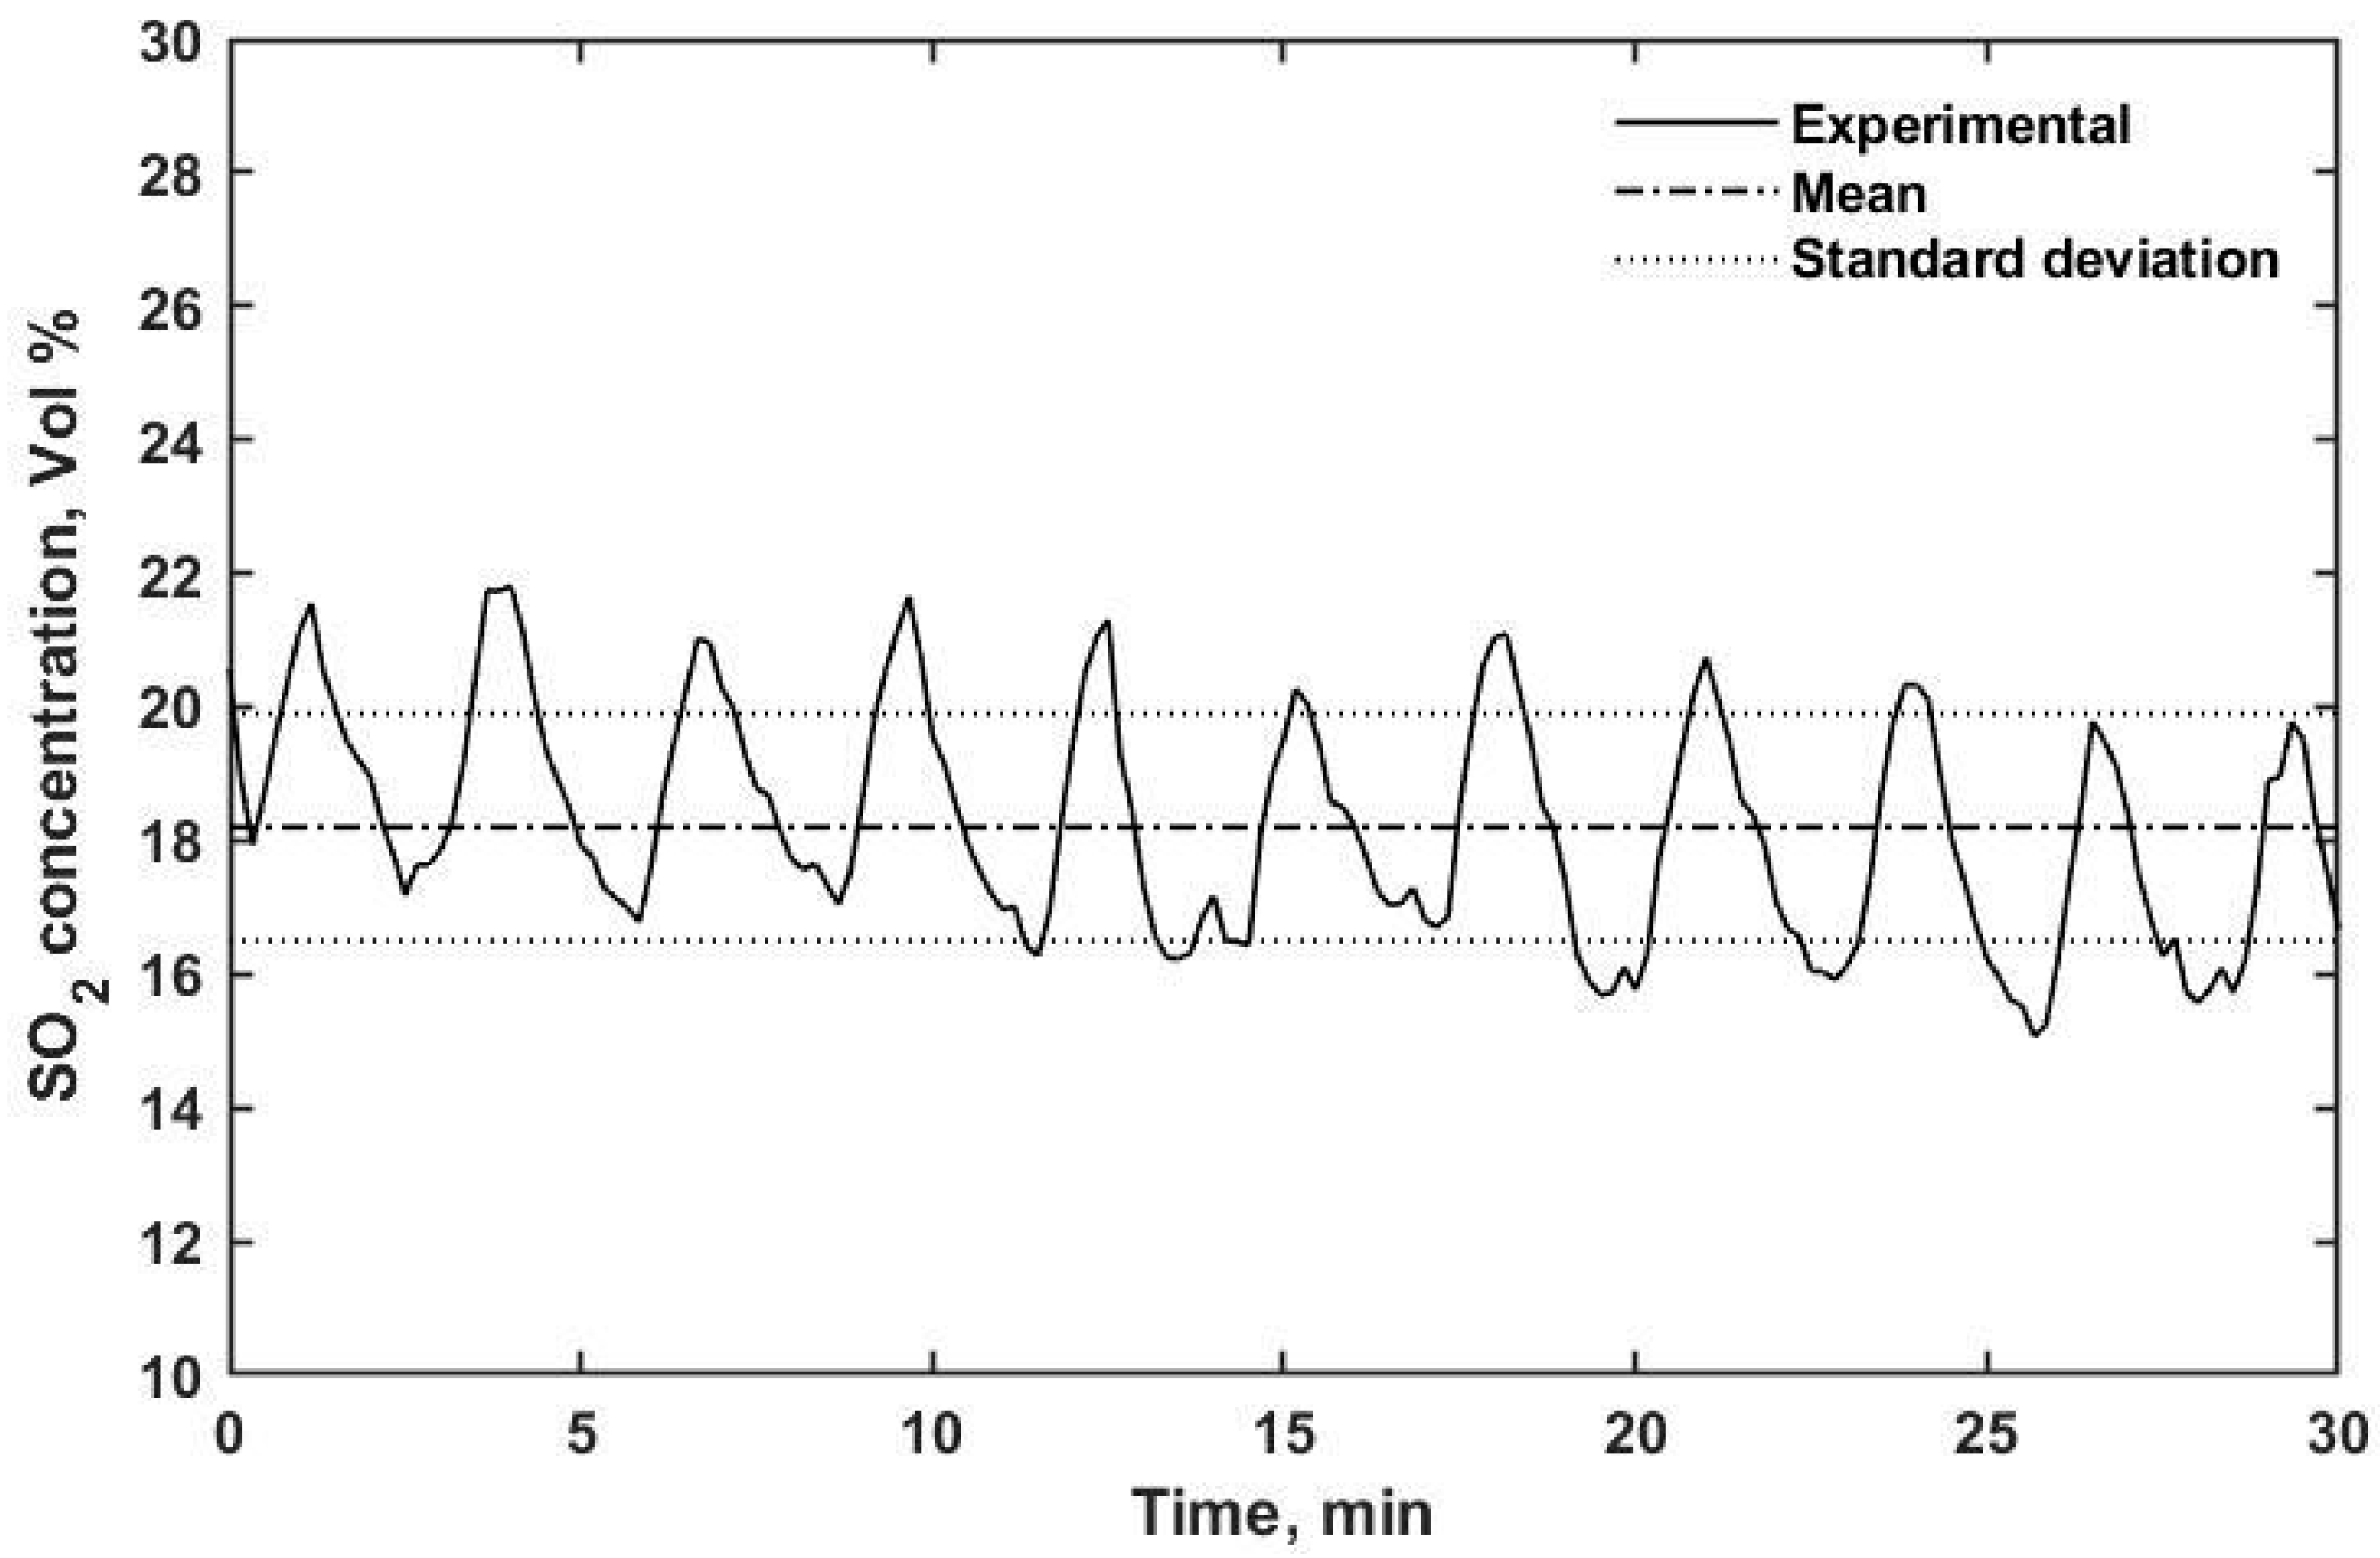
For the white metal conversion experiments, 5.2 kg of reactive material were required. Once the operating temperature was reached, the oxidizing gas flow was supplied for a period of 30 min, counted from the moment the SO2(g) signal in the outlet gases was stable for all the experimental conditions tested. Subsequently, the gas composition data recorded by the DOAS system were processed to quantify the oxygen consumption for the white metal conversion reaction.
The frequency of bubble formation was also measured during experiments similar to the white metal conversion experiments, without performing the analysis of the reaction gas. In a typical frequency measurement experiment, the operating temperature, the injector position and the respective volumetric flows were adjusted for each study condition. The audio signal of the sounds emitted by the bubbles was captured for a period of 45 s, which was subsequently processed using the Audacity® software and mathematically treated using the fast Fourier transform in Matlab®, to filter out ambient noise from the measured signal and identify the characteristic frequency of the system.

2.2. White Metal Preparation

For the oxidation experiments, a copper matte (Cu2S–FeS) generated during the smelting process of a Teniente converter from the Caletones smelter, Codelco, Chile, was used. Due to the operating conditions of the industrial furnace, the copper matte was produced with an iron content of 5.67% by weight, which made it difficult to use this material in the conversion tests, due to the potential formation of oxidized iron compounds as a consequence of oxidation reactions. This aspect is undesirable considering that the physicochemical properties of the melt would be strongly altered, in addition to the latent possibility that the oxidized iron compounds would interact with the construction material of the crucibles (Al2O3), compromising the integrity of the structure of the crucible furnace. For this reason, a previous experimental procedure was designed to treat the copper matte and drastically reduce the iron content.
The pretreatment of the copper matte consisted of crushing it in a roller mill until it reached a size less than 0.002 m (Tyler #10 mesh, Combustion Engineering Inc., New York, NY, USA). The collected material was arranged in rectangular bins with a height of 0.015 m and a base of 0.0504 m2, allowing 1.25 kg to be loaded into a muffle-type oven at a temperature of 923 K for 30 min. During this period, an air flow was continuously supplied, which allowed the copper matte to be partially desulfurized (copper calcine). Subsequently, 3 kg of this copper calcine were melted in the presence of a mixture of SiO2 and CaO as flux, to slag the oxidized iron in the form of an olivine-type slag, completing the maximum operating capacity of the working crucible. The proportion of the flux mixture was adjusted to slag completely the initial iron of the reactive system. When the complete fusion of this material was achieved (approximately 2 h), a fresh mixture of copper calcine with the respective flux was added, until a total mass of 5.0 kg was achieved inside the crucible (discrete loads of 0.25 kg were made for 2 h). For the smelting of copper calcine, the operating temperature of the reactor was set at 1573 K, constantly supplying air on the surface of the melt. At the end of the fusion stage, the working crucible was removed and allowed to cool for 12 h, and with the resulting material, the physical separation of the generated phases was carried out: slag, white metal and metallic copper. Table 2 shows the normalized chemical composition of the copper matte from the Caletones smelter and the white metal obtained from the experimental procedure described above.

3. Results

3.1. Characterization of Bubbles

3.1.1. Bubble Formation Frequency, f

Based on the frequency measurements, the total number of bubbles fed during the conversion experiments was determined, which is directly related to the total reaction surface in the system. Andreini et al. [16] used a technique to record sounds on the surface of the metal bath to quantify the bubbles delivered to the molten medium. From preliminary tests based on the supply of air under room temperature and pressure conditions in different media (water, oil and honey), it was determined that the high amplitude wave signals corresponded to the bursting of the bubbles during their detachment from the injector, while the low amplitude wave signals were associated with the sound emitted by the bursting of the bubbles on the surface of the metal bath. Bubbles were quantified using two criteria. First, the manual counting of bubbles when the playback speed of the captured audio was slowed down, thereby defining the most appropriate periods to process higher quality audio signals. The second criterion was the quantification of the bubbles in the time interval of the previous criterion, using the Fast Fourier Transform (FFT), which allows continuous digital audio signals to be transformed into discrete signals, and in this way differentiate the characteristic frequency or frequency of bubble formation from the total signal captured. The analysis using this tool allows identifying the representative frequency of the captured signal from the highest maximum FFT value in the range of values tested, which is highlighted in Figure 3 by means of a segmented rectangle.
With this same procedure, the bubble formation frequency was determined for different gas flow rates in the range of 0.080 L/min and 0.540 L/min. It should be noted that the sound measurement tests were not carried out simultaneously with the desulfurization tests, since this would imply intervening in the system by installing additional equipment that would interfere with the oxidation behavior of the molten system. To compensate for the difference in the operating conditions, a curve was mathematically adjusted for the experimental data of bubbling frequency measurement with different gas flow rates through the least squares tool, and thus estimating the frequency of bubble formation under oxidizing conditions. Table 3 presents the characterization of the bubbles in the conversion of molten white metal.
There is an inverse relationship between injector diameter and bubble frequency. This is associated with the increase in the surface tension forces that causes the generation of larger bubbles [13], and with it, the decrease in the bubbling frequency. The operating temperature of the system did not have a significant influence on the behavior of the bubbles in the molten medium.
According to the literature [13,14,17], the volumetric flow rate of the gas is a predominant variable in the formation of bubbles, and for this reason, it was necessary to establish a gas supply condition that met both the oxygen requirements defined in the experimental design, but which guaranteed the injection of individual bubbles. To achieve this, the critical flow rate was used, which establishes the boundary condition between two bubble formation regimes: the bubble formation regime under constant volume and the bubble formation regime under constant frequency. To be certain of the dimensions of the air bubbles supplied to the melt, the conversion experiments were performed using flow rates below the critical one, ensuring that the reaction surface of the individual bubbles was relatively constant. Given the fluid dynamic characteristics of the melt, the maximum permissible condition of volumetric flow of oxidizing gas that complied with the constant volume bubble formation regime was used. To verify that the theoretically obtained critical flow rate value was valid for the molten white metal, the frequency of bubble formation was experimentally measured at different oxidizing gas flow rates. Figure 4 shows the frequency in terms of the volumetric flow rate for the 0.006 m × 0.004 m injector located 0.11 m from the surface of the melt.
It was determined that the calculated critical flow fits the experimental data for each of the injectors, identifying the ranges of values for the two bubble formation regimes. It was also determined that the external diameter of the injector [17,28] is adequate to describe the characteristics of the bubbles and extend the mathematical correlations proposed for aqueous media to molten systems; therefore, the estimation of the critical flow rate for the formation of bubbles in molten white metal is reliable and represents experimentally measured results.

3.1.2. Bubble Area, Ab

The shape of the bubbles injected into the molten medium was theoretically determined from correlations [20,21] proposed in terms of the dimensionless Reynolds (Re), Eötvös (Eo) and Weber (We) numbers. Table 4 shows the dimensionless numbers from which the shape of the bubbles injected into the molten medium was estimated.
According to these results, the inertial forces acting on the bubble are significantly more important than the viscous forces, based on the high values of Re. This causes the bubble to lose its initial spherical shape when it separates from the injector and tends to flatten out, causing the bubble to deform into a spheroid shape. In the same way, the buoyancy forces are substantially more important than the surface tension forces, considering the values obtained for Eo, also contributing to the deformation of the bubbles in the same direction as the Reynolds number. Thus, it was determined that the description that best represents the bubble shape is that of a spherical cap. Schematically, the shape that the bubbles acquired during their trajectory through the molten white metal is shown in Figure 5.
The dimensions of the bubbles when they detach from the injector were estimated with Equations (3) and (4), and with the experimental data of bubbling frequency, where V b (in m3) and d b (in m) are the volume and diameter of the bubbles.
V b = Q f
For all cases, the estimation of the properties of the bubbles considers that their temperature is equal to that of the reactive system, considering the relative dimensions of the bubbles and the molten bath.
d b = ( 3 V b 4 π ) 1 3
From the shape and size of the bubbles it is possible to estimate the area of the bubble–melt interface where the white metal conversion chemical reaction occurs. The initial volume, (Equation (3)) was conserved during its deformation and this value is used to estimate its aspect ratio using Equation (5), in terms of the radii of the spherical cap-shaped bubbles. According to Lot et al. [21], high values of the We number establish that the aspect ratio, E, is independent of the effect of surface tension forces and acquires a constant value of 0.25.
E = c a = 0.25
In Table 3, the surface area of individual bubbles is shown; the dimensions of the bubbles were constant along the trajectory in the melt. The total reaction area considers all the bubbles injected during the operation time, which depended on the dimensions of the injector used in each test.

3.1.3. Residence Time, tr

The residence time of the bubbles depends on the rise velocity through the molten medium, which is determined, among other things, by their size. Given the difficulty of experimentally measuring the residence time of bubbles, a theoretical method was developed to estimate the rise velocity from the physicochemical properties of the molten medium and the dimensions of the injector, for which the mathematical expressions developed by Rodrigue et al. [22] were used. From there, the residence time of the bubbles was determined, considering that they follow a linear vertical path from their formation to their rupture on the surface of the white metal phase, using Equation (6). The theoretical results of the residence time are presented in Table 3.
t r = h v s
In Equation (6), h represents the position of the injector with respect to the surface of the melt (in m) and vs is the rise velocity of the bubbles (in m s−1). It is observed that the dimensions of the injector affect the residence time of the bubbles; the larger their size, the greater the forces that drive the rise of the bubbles. Finally, the position of the injector directly determines the distance that it travels when freely ascending towards the surface of the melt, and therefore, the residence time.

3.2. Oxygen Consumption

Data on the generation of SO2(g) during the conversion of the molten white metal were acquired and were consistent with those reported in other similar kinetic studies regarding the magnitude and constant behavior of the values in this oxidation stage [7,8,9,10,11,12]. However, unlike other studies, this work describes the degree of conversion as a function of the properties of the gas–melt interface, which is an important factor in this type of heterogeneous process. Figure 6 shows the SO2(g) concentration curve of the gases generated by the reaction when the 0.006 m × 0.004 m diameter injector was used, positioned 0.05 m from the surface of the molten bath and at a temperature of 1533 K. It is clear from the figure that the white metal conversion process is constant throughout the experiment. The discontinuities observed in the curve do not represent an intrinsic characteristic of the white metal conversion process and are related only to intermittences in the SO2(g) measurement process in the gas analysis system.
Table 5 presents the results of the oxygen consumption rate determined from the SO2(g) concentration data obtained during the molten white metal conversion experiments; oxygen consumption efficiency is also included.
The values reported in this table do not consider the fraction of oxygen that was dissolved in the molten phase, due to technical limitations to carry out its quantification, and for this reason, the oxygen consumption refers only to the formation of SO2(g). In general, the values of higher oxygen consumption are associated with larger injectors located deeper in the melt, which is related to the high reaction surface of the bubbles. However, the injection of bubbles of larger dimensions is detrimental when analyzing their effect on the conversion with respect to the efficiency of oxygen consumption in desulfurization, especially for the experiments carried out at lower temperatures. Although the use of larger injectors implies a greater supply of oxygen for the conversion process, it also increased the thickness of the gas boundary layer inside the larger bubbles, increasing the resistance to oxygen transfer towards the reaction interface.
In general, there is no clear trend regarding the influence of temperature on the rate and efficiency of oxygen consumption, since the kinetic process is controlled by the characteristics of the gas phase injection: the frequency of bubble formation, contact area and residence time.

4. Discussion

As stated at the beginning, the main objective of this research was to provide experimental information about the rate of white metal conversion under conditions of injection of individual air bubbles, as defined in Equation (1). For the above, experiments were designed in which the effect of the mass transfer resistance inherent to the reactive system was minimized, in order to obtain approximate information on the intrinsic kinetics of the molten white metal conversion reaction. For this, the experiments were conducted under suitable conditions that promoted the formation of small individual bubbles [13,20], to reduce the resistance to oxygen transfer in the gas phase and increase the contact surface between the phases. To reduce the effect of resistance to mass transfer in the melt, the highest gas injection flows were selected to intensify the agitation of the bath and thus promote the interaction between the reacting species [29].
Table 6 presents the values of the overall specific rate of oxygen consumption, obtained during the conversion of the molten white metal under all the experimental conditions tested. The conversion rate values present the same order of magnitude in all cases, which validates the rigor with which the oxidation experiments were conducted. The values varied between 0.0088 and 0.0412 mol O2 m−2 s−1, with an average value of 0.0183 mol O2 m−2 s−1 under the temperature and bubble injection conditions evaluated.
According to these results, it is possible to validate the conclusion of Table 5 and affirm that the operating temperature does not have a controlling effect on the specific rate of oxygen consumption, which is consistent with previous studies on the dynamics of white metal oxidation [7,8,9,10,11,12], in which it is reported that the controlling kinetic stage of the reactive system corresponds to the mass transfer in the gas phase and not to the chemical reaction. This is supported by the influence of the characteristics of the bubbles on the specific rate of reaction, since in general, the larger their dimensions, the higher the specific conversion rates.
To facilitate the analysis of the specific rate of oxygen consumption with respect to the characteristics of the bubbles, Table 7 presents the qualitative comparison of the operational parameters involved in the conversion experiments, distinguishing the differences observed in the cases in which the smallest injector (0.003 m × 0.005 m) was used compared to the largest injector (0.005 m × 0.007 m). The experiments that were carried out with the smaller injectors tended to form small bubbles under high frequency conditions, which remained in the melt for a longer time compared to the smaller number of large bubbles injected when the larger injector was used, which were retained for a shorter time in the melt. In addition, as specified in the description of the experimental design (Table 1), the conversion tests carried out with the first injector involved low air flows (0.296 L/min), while, with the second type of injector, the flows were higher (0.391 L/min). In summary, under the first condition, a high number of bubbles was supplied with the injection of a low overall amount of oxygen into the melt and, in contrast, under the second condition, a lower number of bubbles was injected with a high oxygen content.
The consumption efficiency indicates that the oxygen in the small bubbles was practically consumed in positions close to the injection point, that is, instantaneously. In that sense, the premature consumption of oxygen from the small bubbles caused the drastic deceleration of the conversion reaction due to the notable increase in the resistance to the mass transfer of oxygen into the gas phase. In contrast, the oxygen consumption of larger bubbles was more gradual, taking considerably longer to reach efficiencies similar to those of small bubbles, preventing the consumption itself from having a detrimental effect on oxygen transport within the gas phase and kinetically limiting the conversion of molten white metal.
The values of the specific rate of oxygen consumption strongly depend on the oxygen supply, as well as the characteristics of the bubbles in the experiments, that is, the white metal conversion process is mainly controlled by the oxygen transport in the gas phase [8]. It must be considered that, due to the reaction time and the amount of oxidizing gas supplied during the experiments, composition changes in the white metal were negligible, so the mass transfer in the melt is not an aspect to consider in this study. To correctly interpret these values, it is necessary to consider that they represent an overall indicator of the conversion process that integrates kinetic information from the injection of the bubbles until they emerge on the surface, since the experimental determination of the oxygen consumption for the formation of SO2(g) was performed from the analysis of the gas collected in this last position. However, its determination is relevant for the white metal conversion process at an industrial level, since it depends on data whose collection does not interfere with the operation of the reactors, since the characterization of the inlet flows of the oxidizing gas and of the outlet gases is sufficient.
Finally, the values of specific rate of oxygen consumption obtained in this study represent an important contribution to improve the understanding of the phenomena that intervene in the refining of the molten metallic phases of Cu, since the kinetic information reported in the literature regarding this topic is scarce.

5. Conclusions

Experimental values of specific rate of conversion of molten white metal were determined under conditions of injection of individual air bubbles. It was established that bubble characteristics, mainly the size and oxygen content, determine the rate and efficiency of oxygen consumption during white metal oxidation. The use of injectors of smaller diameter (0.003 m of internal diameter and 0.005 m of outer diameter) promoted the formation of a high number of small spherical cap bubbles ranging from 2.03 × 10⁻³ m2 to 2.15 × 10⁻³ m2, with a high efficiency of oxygen consumption, varying from 82.6% to 95.5% for the formation of SO2(g), but with lower values of overall conversion rate (0.0088 to 0.0193 mol O2 m−2 s−1). In contrast, larger diameter injectors (0.005 m of internal diameter and 0.007 m of external diameter) formed larger bubbles (3.02 × 10⁻³ m2 to 3.11 × 10⁻³ m2) with lower oxygen consumption efficiency, ranging from 66.8% to 91.2%, but higher overall conversion values (0.0128 to 0.0412 mol O2 m−2 s−1) compared to the smaller bubbles. Thus, the observed strong dependence on bubble characteristics and available oxygen confirms that mass transfer in the gas phase controls the conversion process.
The opportunities to improve the performance of the white metal conversion process include establishing a balance between the size of the bubbles fed into the melt and the retention time in the melt, to guarantee that during the process there is a high availability of oxygen for the elimination of sulfur in the form of SO2(g). The information generated in this study is expected to represent a contribution to elucidate the phenomena that occur inside copper bath conversion furnaces.

Author Contributions

Conceptualization: M.F.R.-J. and V.R.P.-S.; methodology, R.A.P.-F. and V.R.P.-S.; validation, M.F.R.-J. and E.A.A.-H.; formal analysis, E.A.A.-H. and E.R.B.-V.; investigation, G.A.R.-A.; resources, E.A.A.-H. and R.A.P.-F.; data curation, M.F.R.-J.; writing—original draft preparation, C.V.M.-V.; writing—review and editing, V.R.P.-S. and C.V.M.-V.; visualization, G.A.R.-A.; supervision, V.R.P.-S.; project administration, R.A.P.-F. and E.R.B.-V. All authors have read and agreed to the published version of the manuscript.

Funding

This research received no external funding.

Institutional Review Board Statement

Not applicable.

Informed Consent Statement

Not applicable.

Data Availability Statement

The data presented in this study are available on request from the corresponding author.

Acknowledgments

The authors express their gratitude to Codelco and CodelcoTech for their support in this research and for providing the raw material used in this study. Special acknowledgments are due to Leonel Contreras , former Smelting and Refining Director of Codelco, for his invaluable contribution to this research.

Conflicts of Interest

The authors declare no conflict of interest.

References

  1. Prietl, T.F.A.; Wallner, S. Productivity increase in a Peirce-smith converter using the COP KIN and OPC system. In Converter and Fire Refining Practices, Proceedings of the Annual TMS Meeting, San Francisco, CA, USA, 13–17 February 2005; The Minerals, Metals, & Materials Society: Warrenale, PA, USA, 2005; pp. 177–190. [Google Scholar]
  2. Biswas, A.K.; Davenport, W.G. (Eds.) Chapter 11—Converting of Cu Matte. In Extractive Metallurgy of Copper, 3rd ed.; Pergamon: Amsterdam, The Netherlands, 1994; pp. 194–223. [Google Scholar]
  3. Moyano, A.C.C.; Mackay, R.; Morales, P.; Cordero, D.; Font, J. The Development of the Codelco-Chile Continuous Converting Process. In Proceedings of the Sohn International Symposium, San Diego, CA, USA, 27–31 August 2006; pp. 239–250. [Google Scholar]
  4. Caballero, C.; Moyano, A.; Morales, P.; Toro, C.; Jara, H.; Guzmán, L.; Díaz, R. A dynamic simulation for the validation tests of the Codelco-Chile continuous converting process. In Proceedings of the International Peirce-Smith Converting Centennial, San Francisco, CA, USA, 15–19 February 2009; pp. 263–272. [Google Scholar]
  5. Schlesinger, M.E.; Sole, K.C.; Davenport, W.G.; Alvear Flores, G.R.F. (Eds.) Chapter 8—Converting of Copper Matte. In Extractive Metallurgy of Copper, 5th ed.; Elsevier: Amsterdam, The Netherlands, 2011; pp. 127–178. [Google Scholar]
  6. Schlesinger, M.E.; Sole, K.C.; Davenport, W.G.; Alvear Flores, G.R.F. (Eds.) Chapter 9—Bath Matte Smelting: Ausmelt/Isasmelt and Mitsubishi. In Extractive Metallurgy of Copper, 5th ed.; Elsevier: Amsterdam, The Netherlands, 2011; pp. 180–201. [Google Scholar]
  7. Asaki, Z.; Ajersch, F.; Toguri, J.M. Oxidation of molten ferrous sulphide. Metall. Mater. Trans. B 1974, 5, 1753–1759. [Google Scholar] [CrossRef]
  8. Alyaser, A.H.; Brimacombe, J.K. Oxidation kinetics of molten copper sulfide. Metall. Mater. Trans. B 1995, 26, 25–40. [Google Scholar] [CrossRef]
  9. Carrillo, F.; Berrios, J.; Roselló, A. Kinetics of the conversion of copper sulfide to blister copper. Revista Metalurgia. 2002, 38, 334–338. [Google Scholar] [CrossRef] [Green Version]
  10. Asaki, Z.; Ando, S.; Kondo, Y. Oxidation of molten copper matte. Metall. Mater. Trans. B 1988, 19, 47–52. [Google Scholar] [CrossRef]
  11. Jalkanen, H. Phenomenology of the oxidation kinetics of molten cuprous sulfide and copper. Scand. J. Metall. 1981, 10, 157–262. [Google Scholar]
  12. Roselló, A.; Martínez, J.; Barrios, P.; Carrillo, F. Desulfurization Rate during the Copper Blow in a Peirce–Smith Converter. Metall. Mater. Trans. B 2008, 39, 16–22. [Google Scholar] [CrossRef]
  13. Kulkarni, A.A.; Joshi, J.B. Bubble Formation and Bubble Rise Velocity in Gas−Liquid Systems:  A Review. Ind. Eng. Chem. Res. 2005, 44, 5873–5931. [Google Scholar] [CrossRef]
  14. Gaddis, E.S.; Vogelpohl, A. Bubble formation in quiescent liquids under constant flow conditions. Chem. Eng. Sci. 1986, 41, 97–105. [Google Scholar] [CrossRef]
  15. Ramakrishnan, S.; Kumar, R.; Kuloor, N.R. Studies in bubble formation—I bubble formation under constant flow conditions. Chem. Eng. Sci. 1969, 24, 731–747. [Google Scholar] [CrossRef]
  16. Andreini, R.J.; Foster, J.S.; Callen, R.W. Characterization of gas bubbles injected into molten metals under laminar flow conditions. Metall. Trans. B 1977, 8, 625–631. [Google Scholar] [CrossRef]
  17. Bari, S.; Robinson, A. Experimental study of gas injected bubble growth from submerged orifices. Exp. Therm. Fluid Sci. 2013, 44, 124–137. [Google Scholar] [CrossRef] [Green Version]
  18. García-Moreno, F.; Siegel, B.; Heim, K.; Meagher, A.J.; Banhart, J. Sub-mm sized bubbles injected into metallic melts. Colloids Surf. A Physicochem. Eng. Asp. 2015, 473, 60–67. [Google Scholar] [CrossRef]
  19. Satyanarayan, A.; Kumar, R.; Kuloor, N.R. Studies in bubble formation—II bubble formation under constant pressure conditions. Chem. Eng. Sci. 1969, 24, 749–761. [Google Scholar] [CrossRef]
  20. Clift, R.; Grace, J.R.; Weber, M.E. Chapter 11: Accelerated Motion without Volume Change. In Bubble, Drops, and Particles; Academic Pres: New York, NY, USA, 1978; pp. 285–318. [Google Scholar]
  21. Loth, E. Quasi-steady shape and drag of deformable bubbles and drops. Int. J. Multiph. Flow 2008, 34, 523–546. [Google Scholar] [CrossRef]
  22. Rodrigue, D. A General Correlation for the Rise Velocity of Single Gas Bubbles. Can. J. Chem. Eng. 2008, 82, 382–386. [Google Scholar] [CrossRef]
  23. Rodrigue, D. Generalized correlation for bubble motion. Am. Inst. Chem. Eng. AIChE J. 2001, 47, 39. [Google Scholar] [CrossRef]
  24. Rodrigue, D. A simple correlation for gas bubbles rising in power-law fluids. Can. J. Chem. Eng. 2002, 80, 289–292. [Google Scholar] [CrossRef]
  25. Yazawa, A.; Azakami, T. Thermodynamics of removing impurities during copper smelting. Can. Metall. Q. 1969, 8, 257–261. [Google Scholar] [CrossRef]
  26. Vignes, A. Extractive Metallurgy 2: Metallurgical Reaction Processes; John Wiley & Sons: Hoboken, NJ, USA, 2013. [Google Scholar]
  27. Sharma, R.C.; Chang, Y.A. A thermodynamic analysis of the copper-sulfur system. Metall. Mater. Trans. B 1980, 11, 575–583. [Google Scholar] [CrossRef]
  28. Oguz, H.N.; Prosperetti, A. Dynamics of bubble growth and detachment from a needle. J. Fluid Mech. 1993, 257, 111–145. [Google Scholar] [CrossRef] [Green Version]
  29. Vignes, A. Extractive Metallurgy 1: Basic Thermodynamics and Kinetics; John Wiley & Sons: Hoboken, NJ, USA, 2013. [Google Scholar]
Figure 1. Experimental system for the conversion experiments. 1. Reaction chamber. 2. SiC resistors. 3. Thermal insulation. 4. Refractory bricks. 5. Control type S thermocouple. 6. Controller. 7. Security crucible. 8. Working crucible. 9. Molten bath. 10. Working cover. 11. Safety cover. 12. Thermal insulation. 13. Furnace cover. 14. White metal feeding. 15. Gas outlet line. 16. Thermocouple. 17. Temperature reader. 18. Process gas (air) injector. 19. Mass flowmeter. 20. Air cylinder. 21. Nitrogen injector. 22. Rotameter. 23. Nitrogen cylinder. In red, the unit for capturing the sound of the bubbles supplied to the molten medium installed in the crucible furnace. 24. Thermal insulation. 25. Hands-free microphone. 26. Steel tube. 27. Chamber of amplification. 28. Electronic sound recording device.
Metals 12 00980 g001
Figure 2. Diagram of the cooling system, cleaning and analysis of the gases coming out of the furnace. 1. Gas inlet. 2. Heat exchanger. 3. Coolant inlet. 4. Coolant outlet. 5. CaSO4 dehumidifier. 6. Particle settler. 7. Pressure transducer. 8. Particle filter. 9. DOAS gas analyzer. 10. Silica gel dehumidifier. 11. Gas outlet.
Metals 12 00980 g002
Figure 3. Application of the Fast Fourier Transform (FFT) to audio signals using a 0.006 m × 0.004 m injector submerged 0.11 m from the surface of the melt and a gas flow rate of 0.21 L/min.
Metals 12 00980 g003
Figure 4. Experimental determination of the bubble formation regimes by the relationship between the frequency and the flow rate of gas supplied through an injector of 0.006 m × 0.004 m located 0.11 m below the surface of the melt.
Metals 12 00980 g004
Figure 5. Schematic representation of the average shape of the bubbles during their rise through the molten white metal estimated from the dimensionless numbers of Re, We and Eo.
Metals 12 00980 g005
Figure 6. Evolution of the SO2(g) concentration in the gases generated during the conversion of molten white metal, conducted with the 0.006 m × 0.004 m injector, placed 0.05 m from the surface of the melt at 1533 K.
Metals 12 00980 g006
Table 1. Experimental design of the conversion kinetic tests.
TestT, KDo, mDi, mhiQ, L min−1
114530.0050.0030.050.296
214530.0060.0040.050.344
314530.0070.0050.050.391
414530.0050.0030.110.296
514530.0060.0040.110.344
614530.0070.0050.110.391
715330.0050.0030.050.296
815330.0060.0040.050.344
915330.0070.0050.050.391
1015330.0050.0030.110.296
1115330.0060.0040.110.344
1215330.0070.0050.110.391
Do and Di are external and internal diameters of the injectors, respectively. hi is the injector position from the bath surface.
Table 2. Chemical composition of copper matte and white metal used during conversion tests.
ElementCopper Matte, % by WeightWhite Metal, % by Weight
Cu71.4580.21
Fe5.670.53
S22.8819.26
Table 3. Characteristics of the bubbles injected into the molten white metal during the conversion experiments described in Table 1.
Testf, s−1Ab × 103, m2tr, s
110.32.100.086
29.372.470.072
37.803.050.057
410.82.030.195
510.82.250.175
67.913.020.128
710.32.150.075
89.372.530.063
97.803.110.051
1010.82.070.170
1110.82.300.152
127.913.090.113
Table 4. Dimensionless Numbers for White Metal Conversion Tests.
Dimensionless NumberAverage ValueMinimum ValueMaximum Value
Re36,14622,35855,491
We143.468.5258.8
Eo42.434.252.4
Table 5. Oxygen consumption rate and efficiency for molten white metal conversion experiments.
Test J O 2   ×   10 5 ,   mol   s 1 Ef, %
13.5782.6
24.2679.9
33.3666.8
44.0295.5
54.5096.1
63.9170.5
72.6664.8
83.3370.6
95.0891.2
103.3583.6
114.4589.3
124.5484.8
Table 6. Results of the overall specific rate of oxygen consumption for the white metal conversion process under the experimental conditions tested.
TestT, KDo, m hi, mQ, L min−1 r O 2   ×   10 2   mol   m 2   s 1
114530.0050.050.2961.93
214530.0060.050.3442.56
314530.0070.050.3912.47
414530.0050.110.2960.93
514530.0060.110.3441.06
614530.0070.110.3911.28
715330.0050.050.2961.62
815330.0060.050.3442.24
915330.0070.050.3914.12
1015330.0050.110.2960.88
1115330.0060.110.3441.17
1215330.0070.110.3911.65
Table 7. Comparison of the operational parameters during white metal conversion experiments. The terms “high” and “low” are only used for comparison purposes.
Operational ParameterSmall Injector
(0.003 m × 0.005 m)
Large Injector
(0.005 m × 0.007 m)
Specific reaction rate, r O 2 LowHigh
Oxygen consumption rate, J O 2 LowHigh
Oxygen consumption efficiency, E f HighLow
Bubble area, A b LowHigh
Frequency, f HighLow
Residence time, t r HighLow
Publisher’s Note: MDPI stays neutral with regard to jurisdictional claims in published maps and institutional affiliations.

