Article

First-Principles Study on the Elastic Mechanical Properties and Anisotropies of Gold–Copper Intermetallic Compounds

1
Engineering Research Center of Electronic Information Materials and Devices, Ministry of Education, Guilin University of Electronic Technology, Guilin 541004, China
2
Guangxi Key Laboratory of Manufacturing System and Advanced Manufacturing Technology, School of Mechanical and Electrical Engineering, Guilin University of Electronic Technology, Guilin 541004, China
3
Guangdong Provincial Key Laboratory of Advanced Welding Technology, China-Ukraine Institute of Welding, Guangdong Academy of Sciences, Guangzhou 510650, China
4
EEMCS Faculty, Delft University of Technology, 2628 Delft, The Netherlands
*
Authors to whom correspondence should be addressed.
Metals 2022, 12(6), 959; https://doi.org/10.3390/met12060959
Submission received: 5 May 2022 / Revised: 25 May 2022 / Accepted: 31 May 2022 / Published: 2 June 2022

Abstract

:
In this study, first-principles calculations were utilized to investigate the lattice constants, elastic constants, and mechanical properties of gold–copper (Au–Cu) intermetallic compounds (IMCs), including AuCu3, AuCu, and Au3Cu. We also verified the direction dependence of the Young’s modulus, shear modulus, and Poisson’s ratio of the compounds. The calculated lattice parameters agreed with the experimental data, and the single-crystal elastic constants, elastic modulus E, shear modulus G, bulk modulus B, and Poisson’s ratio ν were calculated. For the Young’s and shear moduli, AuCu3 showed the highest anisotropy, followed by AuCu and Au3Cu. The Poisson’s ratios of AuCu3 and Au3Cu crystals were isotropic on (100) and (111) crystal planes and anisotropic on the (110) crystal plane. However, the Poisson’s ratio of the AuCu crystal was anisotropic on (100) and (111) crystal planes and isotropic on the (110) crystal plane.

1. Introduction

Gold–copper (Au–Cu) alloy systems are binary mixtures with high electrical and thermal conductivities and excellent mechanical strength and chemical stability, and they are widely used in catalysis, electronics industries, and biological materials [1,2]. There are three Au–Cu intermetallic compounds (IMCs), including AuCu3, AuCu, and Au3Cu, in the Au–Cu alloy phase diagram reported by Okamoto et al. [3]. Janczak et al. [4] employed X-ray powder diffraction to study the composition and structure of Au–Cu IMCs during annealing and confirmed the presence of these three compounds. Ravi et al. [5] carried out mutual diffusion experiments of Au–Cu system at different temperatures. Singh et al. [6] examined the alloy behavior of Au–Cu via transmission electron microscopy and high-resolution phase-contrast microscopy. However, to date, the physical and mechanical properties of the three IMCs have not been determined due to the difficulty in obtaining pure samples of sufficient sizes. Several first-principles simulation studies on Au–Cu IMCs have been reported. Mohri et al. [7] conducted a complete phase stability analysis of Au–Cu IMCs. Xie et al. [8] calculated the potential energies, heat of formation, and critical temperatures of order–disorder transitions of AuCu3, AuCu, and Au3Cu IMCs and AuCu3-, AuCu-, and Au3Cu-type ordered alloys with maximal ordering degrees. Ozolins et al. [9] investigated the phase stability, thermodynamic properties, and bond lengths of Au–Cu alloys. Hu et al. [10] studied the stability and thermal properties of AuCu3, AuCu, and Au3Cu and calculated the phonon spectrum and phonon density of states. Kong et al. [11] evaluated the structure, elasticity, and thermodynamic properties of AuCu3, AuCu, and Au3Cu.
Although several studies on Au–Cu IMCs have been reported, most of them do not consider the anisotropy of Au–Cu IMCs. However, the abnormal growth of crystal grains, transformation and formation of material structure, and formation of microcracks are closely related to the anisotropy of the material [12,13]. There is, therefore, a need for further research on the elastic mechanical properties and anisotropy to increase the applications of Au–Cu IMC and improve the reliability and structure of designs. In this study, we calculated the elastic constants of monocrystalline AuCu3, AuCu, and Au3Cu based on the first-principles method. Next, according to the Voigt–Reuss–Hill approximation, we obtained the Young’s, bulk, and shear moduli and the Poisson’s ratio of polycrystalline IMCs. Finally, we examined the directional dependence and anisotropic degree of IMCs.

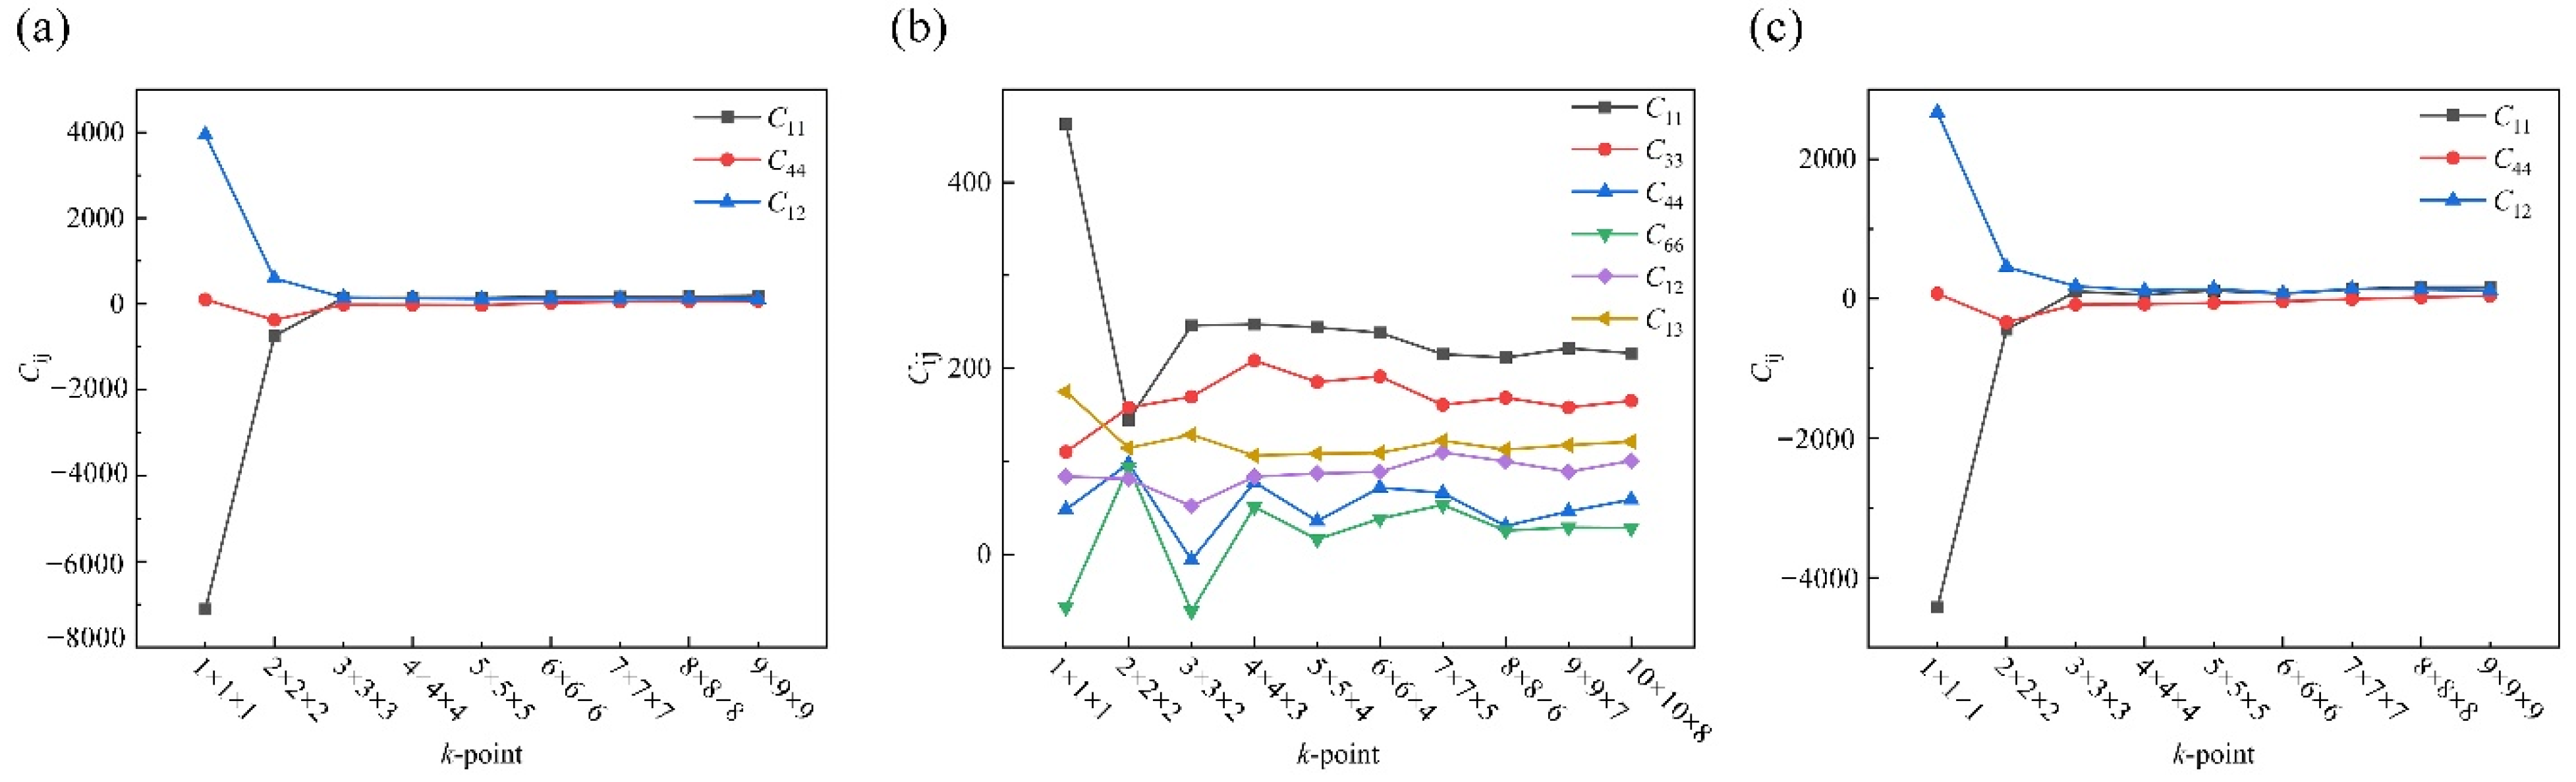
2. Methods and Computational Details

All first-principles calculations for Au–Cu IMCs were performed using the Cambridge Serial Total Energy Package (CASTEP) code based on the density functional theory (DFT) [14]. The generalized gradient approximation (GGA) with the Perdew–Burke–Ernzerhof (PBE) functional [15] was selected to estimate the exchange-correlation energy for Au and Cu. The kinetic energy cutoff and self-consistent field tolerance for plane waves were set at 440 eV and 1.0 × 10⁻⁶ eV/atom, respectively [11]. For different Au–Cu alloy structures, different Monkhorst–Pack grids [16] were used to sample the Brillouin zone to produce different k-points in each structure. The k-point sampling in the first irreducible zones of AuCu3, AuCu, and Au3Cu was 8 × 8 × 8, 9 × 9 × 7, and 8 × 8 × 8, respectively. All k-point settings were convergent with respect to total energy (see Appendix A). The Broyden–Fletcher–Goldfarb–Shannon (BFGS) algorithm [17] was used to optimize the space group and lattice constants of the Au–Cu IMCs. The convergence tolerance of energy and maximum force were set at 4.0 × 10⁻⁶ eV/atom and 0.01 eV/Å. The maximum displacement was set at 4.0 × 10⁻⁴ Å. Figure 1 shows the unit cells of the three Au–Cu IMCs considered herein.

3. Simulation Methods

3.1. Lattice Constants and Elastic Properties

AuCu3, AuCu, and Au3Cu were investigated, and Table 1 lists the calculated and experimental lattice constants. The calculated values are consistent with the experimental results with an average deviation of less than 2%.
Elastic constants are vital for crystals. They can correlate the microscopic properties of materials with macroscopic mechanical behaviors. Elastic constants can be calculated using Hooke’s law based on the stress–strain relationship:
σ i j = C i j k l ε i j
where Cijkl represents the elastic constant, also known as the stiffness matrix. The stress–strain matrix can be written as follows:
( σ 1 σ 2 σ 3 τ 1 τ 2 τ 3 ) = ( C 11 C 12 C 13 C 14 C 15 C 16 C 22 C 23 C 24 C 25 C 26 C 33 C 34 C 35 C 36 C 44 C 45 C 46 S y m . C 55 C 56 C 66 ) ( ε 1 ε 2 ε 3 γ 1 γ 2 γ 3 )
where σi, τi, εi, and γi are the normal stress, shear stress, normal strain, and shear strain, respectively. The elastic constants of AuCu3, AuCu, and Au3Cu calculated herein and the reported values are listed in Table 2. The two sets of data are in good agreement. The elastic flexibility matrix was obtained by inverting the elastic stiffness matrix (i.e., Sij = [Cij]−1). According to the symmetry of Au–Cu IMCs, to express the elastic flexibility matrix, there are three Sij (i.e., S11, S12, and S44) for AuCu3 and Au3Cu and six Sij (i.e, S11, S12, S13, S33, S44, and S66) for AuCu. Herein, the calculated values of S11, S12, and S44 for AuCu3 were 0.01430, −0.00597, and 0.015380, respectively, and those for Au3Cu are 0.02075, −0.00921, and 0.05313, respectively. For AuCu, S11, S12, S13, S33, S44, and S66 were 0.00693, −0.00007, −0.00510, 0.01392, 0.02170, and 0.03424, respectively.
Before calculating the Young’s, shear, and bulk moduli and the Poisson’s ratio of a lattice, it is important to examine its mechanical stability. For the cubic crystals, AuCu3 and Au3Cu, the mechanical stability criteria are as follows [21]:
C 11 C 12 > 0 ,   C 11 > 0 ,   C 44 > 0 ,   C 11 + 2 C 12 > 0
For the tetragonal crystal AuCu, the criteria are [22]:
C 11 > 0 ,   C 33 > 0 ,   C 44 > 0 ,   C 66 > 0 ,   C 11 C 12 > 0 ,   C 11 + C 33 2 C 13 > 0 ,   2 C 11 + C 33 + 2 C 12 + 4 C 13 > 0
According to the elastic constants listed in Table 2, the lattices of AuCu3, AuCu, and Au3Cu are stable. Moreover, the Young’s, shear, and bulk moduli and the Poisson’s ratio play decisive roles in evaluating the mechanical properties of the materials. Herein, the Voigt–Reuss–Hill (VRH) method [23] was employed to approximate the elastic moduli. The calculation of the elastic moduli based on the VRH approximation depends on the type of crystal. For the cubic crystals AuCu3 and Au3Cu, the bulk moduli, BV and BR, and shear moduli, GV and GR, can be calculated using Equations (5)–(8), respectively [24]:
B V = 1 3 ( C 11 + 2 C 12 )
G V = 1 5 ( C 11 C 12 + 3 C 44 )
B R = 1 3 S 11 + 6 S 12
G R = 15 4 S 11 4 S 12 + 3 S 44
For the tetragonal crystal AuCu, BV, BR, GV, and GR can be calculated using Equations (9)–(13), respectively [25]:
B V = 1 9 ( 2 C 11 + 2 C 12 + 4 C 13 + C 33 )
B R = C 33 ( C 11 + C 12 ) 2 C 13 2 C 11 + C 12 + 2 C 33 4 C 13
G V = 1 15 ( 2 C 11 C 12 2 C 13 + C 33 + 6 C 44 + 2 C 66 )
G R = 15 18 B V / C 2 + 6 / ( C 11 C 12 ) + 6 / S 44 + 3 / C 66
C 2 = ( C 11 + C 12 ) C 33 2 C 13 2
where BV, BR, GV, and GR are the upper and lower limits of the polycrystalline bulk modulus B and shear modulus G, respectively. The calculated bulk and shear moduli are the arithmetic average of the two limits [26]. The bulk modulus B and shear modulus G are expressed as follows:
B = 1 2 ( B R + B V )
G = 1 2 ( G R + G V )
Next, Young’s modulus E and Poisson’s ratio v can be calculated from B and G as Equations (16) and (17), respectively:
E = 9 B G 3 B + G
ν = 3 B E 6 B
The calculated B, G, E, and v are listed in Table 3. The bulk modulus reflects the resistance of a material to external uniform compression in an elastic system and is related to the elasticity of the chemical bond. Herein, the bulk moduli of the three IMCs were similar. The magnitude of the Young’s modulus indicates the stiffness of the material. The higher the Young’s modulus of a material, the less likely it is to deform. Table 3 shows that the Young’s modulus of Au–Cu IMCs decreased with increasing Au content (from AuCu3 to Au3Cu), and the shear modulus showed a similar trend. Poisson’s ratio is an elastic constant that reflects the lateral deformation of a material. The calculated results show that Poisson’s ratio increased with an increase in Au content in the three IMCs (Table 3). Vickers hardness HV is calculated using Equation (18) [27]:
H V = 0.92 ( G / B ) 1.3137 G 0.708
The calculated HV is listed in Table 3. The Vickers hardness Hv and Young’s modulus E of Au–Cu IMCs showed the same trend (i.e., AuCu3 > AuCu > Au3Cu). Pugh [28] established a ductility index (B/G ratio) to evaluate the ductility of materials. High values of B/G indicate high ductility, and vice versa. If the ratio is higher than 1.75, the material is ductile; otherwise, it is brittle. Herein, the B/G ratios of the three Au–Cu IMCs were higher than 1.75, implying that they are ductile materials. The ductility increased with the Au content. The Poisson’s ratio ν is also related to B/G. A material with ν greater than 0.26 is considered ductile [29]. For the Au–Cu IMCs, B/G was greater than 1.75, and ν was greater than 0.26, confirming that they are ductile.

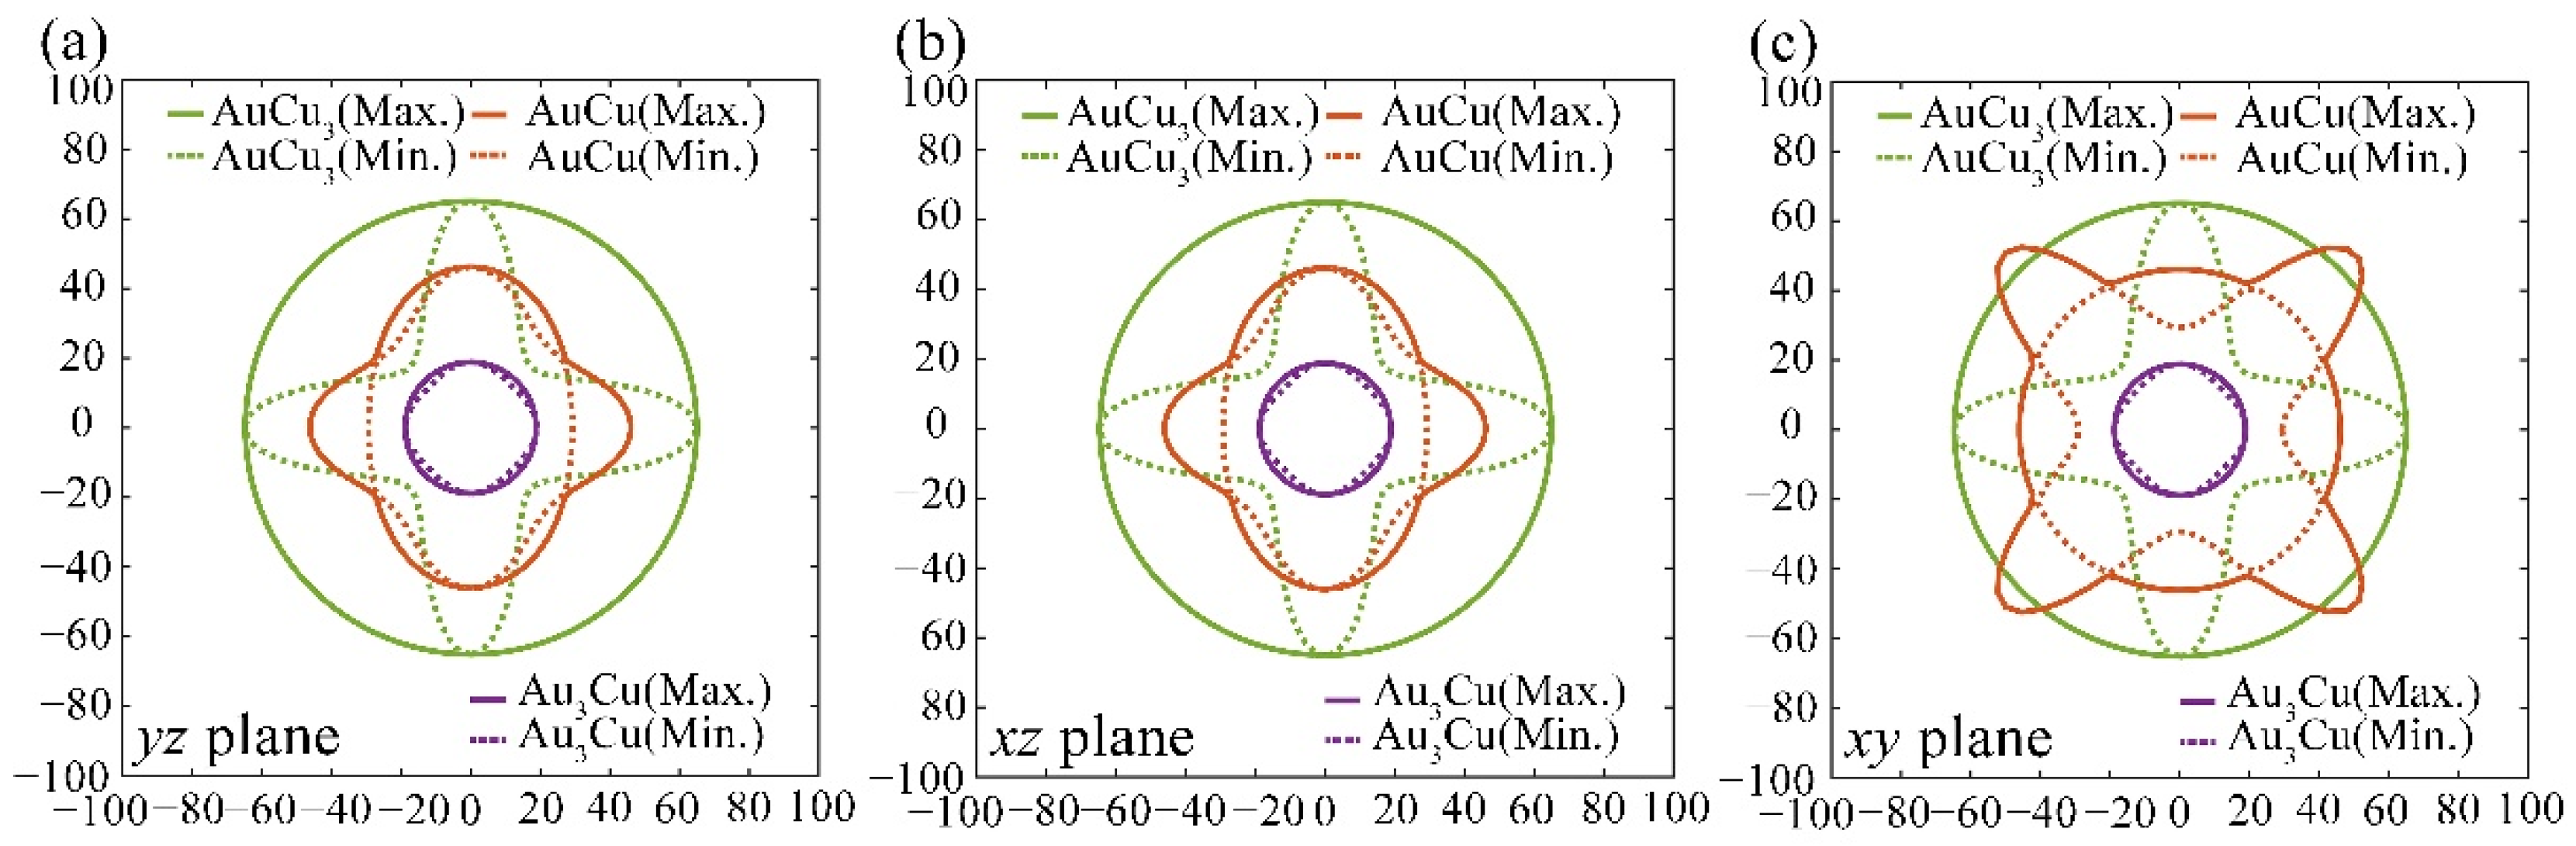
3.2. Elastic Anisotropy

Elastic anisotropy determines many basic properties of materials and is important for predicting the fracture toughness of materials. The universal anisotropy index AU and percent anisotropy indices of compression and shear (AB and AG) are used to evaluate the elastic anisotropy of a material, and they are expressed as follows [11]:
A U = 5 G V G B + B V B R 6
A B = B V B R B V + B R × 100 %
A G = G V G R G V + G R × 100 %
For AU, AB, and AG, if the value is 0, the crystal is isotropic. The greater their deviation from 0, the higher the degree of anisotropy. Herein, AU of AuCu3 was 1.217, indicating that AuCu3 is anisotropic. The AB and AG were 0 and 10.85, respectively, indicating that AuCu3 has no compression but shear anisotropy. The AU, AB, and AG for AuCu were 0.682, 0.97, and 5.27, respectively, indicating that AuCu has lower universal, compression, and shear anisotropy. The AU for Au3Cu was 0.017, indicating that the degree of universal anisotropy of Au3Cu is low. Also, the AB and AG for Au3Cu were 0 and 0.17, respectively, indicating that the compound has no compressive anisotropy and weakest shear anisotropy.
To further investigate the tangential anisotropy of Au–Cu IMCs, we employed the anisotropy factors A1, A2, and A3. The index of A1 represented the shear anisotropy factor between [011] and [010] crystal orientations on the (100) crystal plane, Similarly, A2 was the shear anisotropy factor between [101] and [001] orientations on the (010) crystal plane, and A3 was that between [110] and [010] orientations on the (001) crystal plane. For cubic crystals, A1, A2, and A3 were expressed as follows [11]:
A 1 = A 2 = A 3 = 4 C 44 C 22 + C 33 2 C 13
For tetragonal crystal [11]
A 1 = A 2 = 4 C 44 C 11 + C 33 2 C 13 ,   A 3 = 4 C 66 2 C 11 2 C 12
The greater the difference between the anisotropy factors and 1, the higher the anisotropy of the crystal was. The calculated values are shown in Table 4. The A1, A2, and A3 for AuCu3 were 2.63, which is the highest deviation from 1, indicating that AuCu3 exhibits the highest shear anisotropy. For Au3Cu, the A1, A2, and A3 were 1.13, indicating negligible shear anisotropy. For AuCu, the A1 and A2 were 1.19, and A3 was 0.41, indicating that AuCu has mild shear anisotropy, between that of AuCu3 and Au3Cu.
To further evaluate the anisotropy of Au–Cu IMCs, the Young’s modulus in three dimensions was calculated. For the cubic crystals AuCu3 and Au3Cu, the three-dimensional (3D) expression of E is given by Equation (24) [24]:
1 E = S 11 2 ( S 11 S 12 0.5 S 44 ) ( l 1 2 l 2 2 + l 2 2 l 3 2 + l 1 2 l 3 2 )
For the tetragonal crystal, AuCu [30]
1 E = S 11 ( l 1 4 + l 2 4 ) + ( 2 S 13 + S 44 ) ( l 1 2 l 3 2 + l 2 2 l 3 2 ) + S 33 l 3 4 + ( 2 S 12 + S 66 ) l 1 2 l 2 2
where l1, l2, and l3 are the direction cosines of the a-, b-, and c-axes, respectively. Figure 2 and Figure 3 show E for the 3D surface and cross-section of the IMCs. The degree of anisotropy depends on the deviation of a geometrical body from the spherical shape. If a geometrical body is a sphere, it exhibits isotropy. Thus, the Young’s modulus of AuCu3 showed the highest anisotropy, and that of Au3Cu showed the lowest anisotropy, as shown in Figure 2. The Young’s modulus of AuCu3 had a maximum value of 169.05 GPa in the <111> crystal directions and a minimum value of 69.94 GPa in the <100> directions. In comparison, Au3Cu had a maximum Young’s modulus of 54.099 GPa in the <111> crystal orientation directions and a lowest Young’s modulus of 48.19 GPa in the <100> crystallographic directions. The tetragonal AuCu had a maximum Young’s modulus of 147.25 GPa in the [201], [021], [201], [021], [201], [021], [201], and [021] directions and a minimum Young’s modulus of 71.85 GPa in the [001] and [00] directions. In directions perpendicular to the normal direction to the (001) plane, the bulk modulus had a maximum value of 568.86 GPa, whereas it was minimum in the [001] and [001] crystal directions (269.50 GPa). The maximum and minimum Young’s moduli are listed in Table 5. The anisotropy ratio Emax/Emin was employed to quantify the degree of anisotropy of the Young’s modulus, and the larger the anisotropy ratio, the higher the anisotropy was [31]. AuCu3 had the highest Emax/Emin of 2.42, and Au3Cu had the minimum value of 1.12.
Shear modulus G is related to l and n, which are mutually perpendicular vectors (Figure 4). A crystal shears at the plane perpendicular to the vector n. In a particular direction l, G changes with n, and it can be determined using Equation (26) [32].
1 G ( l , n ) = 4 [ 2 S 12 ( S 11 + S 22 S 66 ) ] l 1 n 1 l 2 n 2 + S 66 ( l 1 n 2 l 2 n 1 ) 2 + 4 ( l 1 n 2 + l 2 n 1 ) [ ( S 16 S 36 ) l 1 n 1 + ( S 26 S 36 ) l 2 n 2 ] + 4 [ 2 S 23 ( S 22 + S 33 S 44 ) ] l 2 n 2 l 3 n 3 + 4 ( l 2 n 3 + l 3 n 2 ) [ ( S 24 S 14 ) l 2 n 2 + ( S 34 S 14 ) l 3 n 3 ] + 4 [ 2 S 31 ( S 33 + S 11 S 55 ) ] l 3 n 3 l 1 n 1 + 4 ( l 3 n 1 + l 1 n 3 ) [ ( S 35 S 25 ) l 2 n 3 + ( S 15 S 25 ) l 1 n 1 ] + S 44 ( l 2 n 3 l 3 n 2 ) 2 + S 55 ( l 3 n 1 l 1 n 3 ) 2 + 2 S 45 ( l 2 n 3 + l 3 n 2 ) ( l 3 n 1 + l 1 n 3 ) + 2 S 56 ( l 3 n 1 + l 1 n 3 ) ( l 1 n 2 + l 2 n 1 ) + 2 S 64 ( l 1 n 2 + l 2 n 1 ) ( l 2 n 3 + l 3 n 2 )
l and n are related as follows:
n 1 l 1 + n 2 l 2 + n 3 l 3 = 0
Usually, the maximum and minimum values in each direction are used to evaluate the shear modulus G. Figure 5 and Figure 6 show the 3D shape and cross-section of the shear modulus for the three Au–Cu IMCs. The shear anisotropy of AuCu3 was the highest, followed by that of AuCu and Au3Cu, which was consistent with AG in Table 4. Furthermore, the maximum shear modulus of AuCu3 was maximum in directions perpendicular to the (001), (010), and (100) crystal planes and minimum in the <111> direction. On the other hand, the minimum shear modulus was maximum in the <110> direction and maximum in the <100> direction. Similar to AuCu3, the maximum shear modulus of Au3Cu was minimum in <111> and maximum in directions perpendicular to the (001), (010), and (100) crystal planes. Additionally, the minimum shear modulus of Au3Cu was maximum in the <100> direction and minimum in the <110> direction. As shown in Figure 5, the maximum shear modulus of AuCu was maximum in the [110], [110], [110], and [110] crystal directions and minimum in the [011], [101], [011], [101], [011], [101], [011], and [101] directions. On the other hand, the minimum shear modulus of AuCu was maximum in the [110], [110], [110], [110], [001], and [001] directions and minimum in the <111> and [100], [100], [010], and [010] crystal directions. The maximum and minimum values of the shear modulus G and the anisotropy ratio Gmax/Gmin for the compounds are listed in Table 6. AuCu3 had the largest anisotropy ratio (2.63), and Au3Cu had the lowest (1.13). For AuCu, the anisotropy ratio was 2.58 in all planes, and the anisotropy ratios of the yz and xz planes were the same (1.58), whereas that on the xy plane was 2.44.
Poisson’s ratio is an important index of elastic constant reflecting the transverse deformation of materials. For the cubic crystals AuCu3 and Au3Cu, the ratio is expressed as follows [33]:
v ( h k l , θ ) = { S 12 + S 0 h 2 + k 2 + l 2 [ ( h 2 l h 2 + k 2 h 2 + k 2 + l 2 cos θ h k h 2 + k 2 sin θ ) 2 + ( k 2 l h 2 + k 2 h 2 + k 2 + l 2 cos θ + h k h 2 + k 2 sin θ ) 2 + ( l h 2 + k 2 h 2 + k 2 + l 2 cos θ ) 2 ] } / [ S 11 + 2 S 0 ( h k ) 2 + ( h l ) 2 + ( l k ) 2 ( h 2 + k 2 + l 2 ) 2 ]
S 0 = S 11 S 12 1 2 S 44
For the tetragonal crystal, AuCu [34]:
v ( h k l , θ ) = { S 11 h 2 + k 2 [ ( h 2 L h 2 + k 2 + L 2 cos θ h k sin θ ) 2 + ( k 2 L h 2 + k 2 + L 2 cos θ + h k sin θ ) 2 ] + S 12 h 2 + k 2 [ ( h k l h 2 + k 2 + L 2 cos θ k 2 sin θ ) 2 + ( h k L h 2 + k 2 + L 2 cos θ + h 2 sin θ ) 2 ] + S 13 [ ( h 2 + k 2 ) cos 2 θ + L 2 ] + S 66 h 2 + k 2 ( h k l h 2 + k 2 + L 2 cos θ k 2 sin θ ) ( h k L h 2 + k 2 + L 2 cos θ + h 2 sin θ ) + ( S 33 2 S 13 S 44 ) ( h 2 + k 2 ) L 2 h 2 + k 2 + L 2 cos 2 θ } × h 2 + k 2 + L 2 S 11 ( h 4 + k 4 ) + ( 2 S 12 + S 66 ) h 2 k 2 + ( 2 S 13 + S 44 ) ( h 2 + k 2 ) L 2 + S 33 L 4
where h, k, and l are the Miller indices. L = (a/c)l, where a and c are the lattice constants of the tetragonal crystal. The Poisson’s ratios of the three IMCs on three low-index crystal planes ((100), (110), and (111)) along different directions are shown in Figure 7, Figure 8 and Figure 9. The Poisson’s ratios of AuCu3 on the (100) and (111) crystal planes were 0.417 and 0.300, respectively, and the shape was circular, indicating that it is isotropic. However, it showed high anisotropy on the (110) crystal plane, and the minimum and maximum values were 0.040 and 0.745 in [110] and [001] directions, respectively. For AuCu, the Poisson’s ratio was circular on the (110) crystal plane with a value of 0.428, indicating no anisotropy. AuCu exhibited anisotropy on the (100) plane with Poisson’s ratios of 0.019 and 0.736 for the [010] and [001] directions, respectively. AuCu also showed high anisotropy on the (111) plane with Poisson’s ratios of 0.518 and 0.260 in [110] and [112] crystal directions, respectively. Further, the Poisson’s ratio of Au3Cu on (100) and (111) crystal planes was 0.444 and 0.437, respectively, indicating no significant anisotropy on the planes. However, it exhibited anisotropy on the (110) crystal plane, where the minimum and maximum values were 0.39 and 0.48 in the [110] and [001] directions, respectively. In summary, for Poisson’s ratio, Au3Cu and AuCu3 crystals exhibited isotropy on the (100) and (111) crystal planes and anisotropy on the (110) crystal plane, whereas AuCu was anisotropic on the (100) and (111) crystal planes and isotropic on the (110) crystal plane.

4. Conclusions

In this study, we employed the first-principles method to extensively explore the elastic mechanical properties and anisotropy of Au–Cu IMCs, and the following conclusions were drawn from the results:
  • The Young’s modulus, shear modulus, and Poisson’s ratio increased with Au content (i.e., from AuCu3 through AuCu to Au3Cu). However, the bulk moduli of the compounds were similar.
  • The Au–Cu IMCs exhibited excellent ductility in this order: Au3Cu > AuCu > AuCu3.
  • For the Young’s modulus and shear modulus, the three Au–Cu IMCs were anisotropic, and among them, AuCu3 showed the highest anisotropy.
  • The Poisson’s ratios of Au3Cu and AuCu3 were isotropic on the (100) and (111) crystal planes and anisotropic on the (110) crystal plane. However, the Poisson’s ratio of the AuCu crystal was anisotropic on the (100) and (111) crystal planes and isotropic on the (110) crystal plane.

Author Contributions

J.W.: conceptualization, testing, software, writing—review and editing; J.C., D.Y. and G.Z.: supervision, visualization; H.Q.: data curation, writing—original draft and review. All authors have read and agreed to the published version of the manuscript.

Funding

This research was sponsored by the National Natural Science Foundation of China (Qin H.: 52065015), Guangxi Natural Science Foundation (Qin H.: 2021 GXNSFAA075010), Director Fund Project of Guangxi Key Laboratory of Manufacturing System and Advanced Manufacturing Technology (Qin H.: 20-065-40-002Z), Self-Topic Fund of Engineering Research Center of Electronic Information Materials and Devices (Qin H: EIMD-AB202007) and Innovation Project of GUET Gradu-ate Education (Qin H.: 2021YCXS006 and 2021YXW06).

Institutional Review Board Statement

Not applicable.

Informed Consent Statement

Not applicable.

Data Availability Statement

Not applicable.

Conflicts of Interest Statement

The authors declare that they have no conflict of interest.

Appendix A

The relationship between the k-point and total energy is presented in Figure A1. For AuCu3, AuCu, and Au3Cu, the total energies began to converge when the k-points increased to 3 × 3 × 3, 3 × 3 × 2, and 3 × 3 × 3, respectively. The dependence between the k-point and elastic constants Cij are shown in Figure A2. Similarly, the elastic constants of the three IMCs converged when the k-points rose to 3 × 3 × 3, 3 × 3 × 2, and 3 × 3 × 3, respectively. Therefore, the k-points of AuCu3, AuCu, and Au3Cu (8 × 8 × 8, 9 × 9 × 7, and 8 × 8 × 8) were convergent with respect to the elastic constant Cij.
Figure A1. The relationship between k-point and total energy: (a) AuCu3, (b) AuCu, (c) Au3Cu.
Metals 12 00959 g0a1
Figure A2. The relationship between k-point and elastic constants Cij: (a) AuCu3, (b) AuCu, (c) Au3Cu.
Metals 12 00959 g0a2

References

  1. Aish, M. Mechanical properties and sound velocity of gold copper (AuCu) II superlattice: 3D molecular dynamic (MD) simulation. J. Theor. Appl. Mech. 2020, 58, 901–909. [Google Scholar] [CrossRef]
  2. Huang, Y.; Liu, W.; Ma, Y.; Tang, S.; Wang, J.; Chen, B. A novel interface strengthening layer: Nanoscale AuCu super-structure formed during Au80Sn20/Cu rapid solidification soldering process. Mater. Charact. 2017, 135, 214–220. [Google Scholar] [CrossRef]
  3. Okamoto, H.; Chakrabarti, D.J.; Laughlin, D.E.; Massalski, T.B. The Au−Cu (Gold-Copper) system. J. Phase Equilib. 1987, 8, 454–474. [Google Scholar] [CrossRef]
  4. Janczak, J.; Kubiak, R. X-Ray Study of Annealing Process of Au3Cu, AuCu and AuCu3 at 270 °C in Air. Mater. Sci. Forum 1991, 79, 567–574. [Google Scholar] [CrossRef]
  5. Ravi, R.; Paul, A. Diffusion mechanism in the gold-copper system. J. Mater. Sci.-Mater. Electron. 2012, 23, 2152–2156. [Google Scholar] [CrossRef]
  6. Singh, M.K.; Chettri, P.; Basu, J.; Tripathi, A.; Mukherjee, B.; Tiwari, A.; Mandal, R.K. Synthesis of anisotropic Au–Cu alloy nanostructures and its application in SERS for detection of methylene blue. Mater. Res. Express. 2020, 7, 015–052. [Google Scholar] [CrossRef]
  7. Mohri, T.; Terakura, K.; Takizawa, S.; Sanchez, M.J. First-principles study of short range order and instabilities in AuCu, AuAg and AuPd alloys. Acta Metall. Mater. 1991, 39, 493–501. [Google Scholar] [CrossRef]
  8. Xie, Y.Q.; Liu, X.B.; Li, X.B.; Peng, H.J.; Nie, Y.Z. Potential energies of characteristic atoms on basis of experimental heats of formation of AuCu and AuCu3 compounds (I). Trans. Nonferrous Met. Soc. China 2009, 19, 1243–1256. [Google Scholar] [CrossRef]
  9. Ozolins, V.; Wolverton, C.; Zunger, A. Cu-Au, Ag-Au, Cu-Ag and Ni-Au intermetallics: First-principles study of phase diagrams and structures. Phys. Rev. B Condens. Matter 1997, 57, 6427–6443. [Google Scholar] [CrossRef] [Green Version]
  10. Hu, J.; Xie, M.; Zhang, J.; Yang, Y.; Liu, M.; Chen, Y.; Chen, S.; Wang, S.; Wang, S. First Principles Study of Stability and Thermal Properties of AuxCuy Compounds. Rare Metal Mater. Eng. 2015, 44, 2677–2682. [Google Scholar]
  11. Kong, G.X.; Ma, X.J.; Liu, Q.J.; Yong, L.; Liu, Z.T. Structural stability, elastic and thermodynamic properties of Au–Cu alloys from first-principles calculations. Phys. B Condens. Matter 2018, 533, 58–62. [Google Scholar] [CrossRef]
  12. Zhang, J.M.; Zhang, Y.; Xu, K.W. Dependence of stresses and strain energies on grain orientations in FCC metal films. J. Cryst. Growth 2005, 285, 427–435. [Google Scholar] [CrossRef]
  13. Choi, J.H.; Kang, S.Y.; Dong, N.L. Relationship between deposition and recrystallization textures of copper and chromium electrodeposits. J. Mater. Sci. 2000, 35, 4055–4066. [Google Scholar] [CrossRef]
  14. Segall, M.D.; Lindan, P.J.D.; Probert, M.J.; Pickard, C.J.; Hasnip, P.J.; Clark, S.J.; Payne, M.C. First-principles simulation: Ideas, illustrations and the CASTEP code. J. Phys. Condens. Matter 2002, 14, 2717–2744. [Google Scholar] [CrossRef]
  15. Perdew, J.P.; Burke, K.; Ernzerhof, M. Generalized Gradient Approximation Made Simple. Phys. Rev. Lett. 1998, 77, 3865–3868. [Google Scholar] [CrossRef] [Green Version]
  16. Monkhorst, H.J.; Pack, J.D. Special points for Brillouin-zone integrations. Phys. Rev. B Condens. Matter 1976, 13, 5188–5192. [Google Scholar] [CrossRef]
  17. Pfrommer, B.G.; Cote, M.; Louie, S.G. Relaxation of crystals with the quasi-Newton method. J. Comput. Phys. 1997, 131, 233–240. [Google Scholar] [CrossRef] [Green Version]
  18. Kubiak, R.; Janczak, J. X-ray study of ordered phase formation in Au31.6Cu68.4, Au50Cu50 and Au75Cu25. J. Alloys Compd. 1991, 176, 133–140. [Google Scholar] [CrossRef]
  19. Bjerkelund, E.; Pearson, W.B.; Selte, K.; Kjekshus, A.; Hagen, G. Lattice Parameters of the CuAu(I) Phase. Acta Chem. Scand. 1967, 21, 2900–2902. [Google Scholar] [CrossRef]
  20. Flinn, P.A.; Mcmanus, G.M.; Rayne, J.A. Elastic constants of ordered and disordered Cu3Au from 4.2 to 300° K. J. Phys. Chem. Solids 1960, 15, 189–195. [Google Scholar] [CrossRef]
  21. Nye, J.F. Physical Properties of Crystals: Their Representation by Tensors and Matrices; Oxford University Press: Oxford, UK, 1985. [Google Scholar]
  22. Zhou, Y.X.; Yan, P.; Chong, X.Y.; Feng, J. Revealing the stability, elastic properties and electronic structures of Pd-V intermetallics via first principle calculations. AIP Adv. 2018, 8, 105132. [Google Scholar] [CrossRef] [Green Version]
  23. Francis, G.P.; Payne, M.C. Finite basis set corrections to total energy pseudopotential calculations. J. Phys. Condens. Matter 1990, 2, 4395. [Google Scholar] [CrossRef]
  24. Luan, X.; Qin, H.; Liu, F.; Dai, Z.; Yi, Y.; Li, Q. The mechanical properties and elastic anisotropies of cubic Ni3Al from first principles calculations. Crystals 2018, 8, 307. [Google Scholar] [CrossRef] [Green Version]
  25. Wang, X.; Bao, L.; Wang, Y.; Wu, Y.; Duan, Y.; Peng, M. Explorations of electronic, elastic and thermal properties of tetragonal TM4N3 (TM= V, Nb and Ta) nitrides. Mater. Today Commun. 2021, 26, 101723. [Google Scholar] [CrossRef]
  26. Hill, R. The elastic behaviour of a crystalline aggregate. Proc. Phys. Soc. Lond. Sect. A. 1952, 65, 349. [Google Scholar] [CrossRef]
  27. Tian, Y.; Xu, B.; Zhao, Z. Microscopic theory of hardness and design of novel superhard crystals. Int. J. Refract. Met. Hard Mater 2012, 33, 93–106. [Google Scholar] [CrossRef]
  28. Pugh, S.F. XCII. Relations between the elastic moduli and the plastic properties of polycrystalline pure metals. Philos. Mag. 1954, 45, 823–843. [Google Scholar] [CrossRef]
  29. Zhang, X.; Jiang, W. First-principles investigation on the mechanical, vibrational and thermodynamics properties of AuCu3-type X3Sc (X= Al, Ga, In) intermetallic compounds. Comput. Mater. Sci. 2015, 106, 38–44. [Google Scholar] [CrossRef]
  30. Li, R.-Y.; Duan, Y.-H. Anisotropic elastic properties of MB (M= Cr, Mo, W) monoborides: A first-principles investigation. Philos. Mag. 2016, 96, 972–990. [Google Scholar] [CrossRef]
  31. Gomis, O.; Manjón, F.-J.; Rodríguez-Hernández, P.; Muñoz, A. Elastic and thermodynamic properties of α-Bi2O3 at high pressures: Study of mechanical and dynamical stability. J. Phys. Chem. Solids 2019, 124, 111–120. [Google Scholar] [CrossRef]
  32. Ting, T.C.T. On Anisotropic Elastic Materials for which Young’s Modulus E (n) is Independent of n or the Shear Modulus G (n, m) is Independent of n and m. J. Elast. 2005, 81, 271–292. [Google Scholar] [CrossRef]
  33. Zhang, J.-M.; Zhang, Y.; Xu, K.-W.; Ji, V. Young’s modulus surface and Poisson’s ratio curve for cubic metals. J. Phys. Chem. Solids 2007, 68, 503–510. [Google Scholar] [CrossRef]
  34. Zhang, J.-M.; Zhang, Y.; Xu, K.-W.; Ji, V. Young’s modulus surface and Poisson’s ratio curve for tetragonal crystals. Chin. Phys. B 2008, 17, 15–65. [Google Scholar]
Figure 1. Crystal structures of gold–copper (Au–Cu) intermetallic compounds (IMCs): (a) AuCu3, (b) AuCu, and (c) Au3Cu.
Metals 12 00959 g001
Figure 2. Directional dependence of Young’s moduli: (a) Young’s modulus of AuCu3; (b) Young’s modulus of AuCu; (c) Young’s modulus of Au3Cu.
Metals 12 00959 g002
Figure 3. Cross-sections of Young’s modulus E on the (a) yz, (b) xz, and (c) xy planes of AuCu3, AuCu, and Au3Cu.
Metals 12 00959 g003
Figure 4. Spherical coordinate diagrams of shear moduli G with respect to perpendicular vectors, l and n.
Metals 12 00959 g004
Figure 5. Direction dependence of shear modulus: (a) maximum shear modulus of AuCu3; (b) minimum shear modulus of AuCu3; (c) maximum shear modulus of AuCu; (d) minimum shear modulus of AuCu; (e) maximum shear modulus of Au3Cu; and (f) minimum shear modulus of Au3Cu.
Metals 12 00959 g005
Figure 6. Cross-sections of shear modulus G in the (a) yz, (b) xz, and (c) xy planes for AuCu3, AuCu, and Au3Cu.
Metals 12 00959 g006
Figure 7. Direction dependence of Poisson’s ratio on low-index planes of AuCu3: (a) (100), (b) (110), and (c) (111).
Metals 12 00959 g007
Figure 8. Direction dependence of Poisson’s ratio on low-index planes of AuCu: (a) (100), (b) (110), and (c) (111).
Metals 12 00959 g008
Figure 9. Direction dependence of Poisson’s ratio on low-index planes of Au3Cu: (a) (100), (b) (110), and (c) (111).
Metals 12 00959 g009
Table 1. Calculated and experimental lattice constants of Au–Cu IMCs.
PhaseRef.Crystal SystemSpace Groupk-Points Mesha(Å)c(Å)
AuCu3This work
Exp. [18]
error/%
CubicPm-3m8 × 8 × 83.778589
3.747000
0.84
AuCuThis work
Exp. [19]
error/%
TetragonalP4/mmm9 × 9 × 72.840972
2.806000
1.25
3.708597
3.67000
1.05
Au3CuThis work
Exp. [20]
error/%
CubicPm-3m8 × 8 × 84.042688
3.965000
1.96
Table 2. Calculated elastic constants of Au–Cu IMCs (GPa).
Ref.PhaseC11C33C44C66C12C13
This workAuCu3173.9 65.0 124.6
Ref. [10]AuCu3180.9 65.1 119.3
This workAuCu231.7158.146.129.289.0117.6
Ref. [11]AuCu229.8159.645.833.390.0118.4
This workAu3Cu165.2 18.8 131.8
Ref. [11]Au3Cu165.4 23.9 128.7
Table 3. Calculated bulk modulus B, shear modulus G, Young’s modulus E, B/G ratio, Poisson ratio ν, and Vickers hardness HV of Au–Cu IMCs.
PhaseB (GPa)G (GPa)B/GE (GPa)νHV (GPa)
BVBRBGVGRG
AuCu3141.03141.03141.0348.8839.3144.093.20119.800.3582.919
AuCu141.08138.37139.7344.1038.9441.523.37113.340.3652.611
Au3Cu142.93142.93142.9317.9717.9117.947.9751.650.4400.462
Table 4. Calculated anisotropic index of Au–Cu IMCs.
PhaseAUABAGA1A2A3
AuCu31.217010.852.632.632.63
AuCu0.6820.975.271.191.190.41
Au3Cu0.01700.171.131.131.13
Table 5. Anisotropy ratios and maximum and minimum Young’s moduli E for AuCu3, AuCu, and Au3Cu.
AuCu3AuCuAu3Cu
WholeyzxzxyWholeyzxzxyWholeyzxzxy
Emax (GPa)169.05124.86124.86124.86147.25143.82143.82144.254.0952.4852.4852.48
Emin (GPa)69.9469.9469.9469.9471.8571.8571.8583.4148.1948.1948.1948.19
Anisotropy ratios2.421.791.791.792.052.002.001.731.121.091.091.09
Table 6. Anisotropy ratios and maximum and minimum share moduli G for AuCu3, AuCu, and Au3Cu.
AuCu3AuCuAu3Cu
WholeyzxzxyWholeyzxzxyWholeyzxzxy
Gmax (GPa)65.0265.0265.0265.0271.3146.1046.1071.3118.8218.8218.8218.82
Gmin (GPa)24.6824.6824.6824.6827.6929.2429.2429.2416.6916.6916.6916.69
Anisotropy ratios2.632.632.632.632.581.581.582.441.131.131.131.13
Publisher’s Note: MDPI stays neutral with regard to jurisdictional claims in published maps and institutional affiliations.

