Article

Anisotropic Elastic and Thermal Properties of M2InX (M = Ti, Zr and X = C, N) Phases: A First-Principles Calculation

Faculty of Material Science and Engineering, Kunming University of Science and Technology, Kunming 650093, China
*
Author to whom correspondence should be addressed.
Metals 2022, 12(7), 1111; https://doi.org/10.3390/met12071111
Submission received: 8 June 2022 / Revised: 24 June 2022 / Accepted: 24 June 2022 / Published: 28 June 2022

Abstract

:
First-principles calculations were used to estimate the anisotropic elastic and thermal properties of Ti2lnX (X = C, N) and Zr2lnX (X = C, N) M2AX phases. The crystals’ elastic properties were computed using the Voigt-Reuss-Hill approximation. Firstly, the material’s elastic anisotropy was explored, and its mechanical stability was assessed. According to the findings, Ti2lnC, Ti2lnN, Zr2lnC, and Zr2lnN are all brittle materials. Secondly, the elasticity of Ti2lnX (X = C, N) and Zr2lnX (X = C, N) M2AX phase are anisotropic, and the elasticity of Ti2lnX (X = C, N) and Zr2lnX (X = C, N) systems are different; the order of anisotropy is Ti2lnN > Ti2lnC, Zr2lnN > Zr2lnC. Finally, the elastic constants and moduli were used to determine the Debye temperature and sound velocity. Ti2lnC has the maximum Debye temperature and sound velocity, and Zr2lnN had the lowest Debye temperature and sound velocity. At the same time, Ti2lnC had the highest thermal conductivity.

1. Introduction

The ternary layered compound MAX phase has the common characteristics of ceramics and metals, and has become a research hotspot in the field of structural ceramics for more than 20 years. High damage tolerance and high fracture toughness are essential characteristics that distinguish it from traditional ceramics [1,2,3,4,5,6]. This type of material has a similar nano-layered crystal structure (space group P63/mmc), which is named the “Mn+1AXn” phase, referred to as MAX phase, where M is a transition metal element, A is a IIIA or IVA group element, and X is C or N, (n = 1~3) [7,8,9]. MAX phase compounds can be regarded as the formation of a layer of main group atoms inserted into the binary carbon/nitride lattice. Characterization shows the extraordinary properties of MAX phase materials. They have many excellent properties, such as high damage tolerance, high fracture toughness, low hardness, machinability, thermal shock resistance, high damping, high stiffness, and good electrical and thermal conductivity [10,11], etc. Among them, 211-type MAX phase compounds also have similar properties. This extraordinary performance quickly attracted widespread attention in the field of ceramics.
At present, Z. J. Yang et al. have carried out many theoretical studies on the novel hysteresis behavior of Zr2InC based on plane-wave pseudopotential (PW-PP) density functional theory (DFT) calculations, and the mechanical and electronic properties of Zr2InC under pressure were investigated using first principles [12]. A.D. Bortolozo et al. investigated the Ti2InN phase by X-ray diffraction and magnetic and resistivity measurements, and the results clearly showed that Ti2InN is the first nitride superconductor belonging to the Mn+1AXn family [13]. Sun et al. investigated the relationship between chemical bonds and the elastic properties of M2AN (M = Ti, Zr, Hf, V, Nb, Ta, Cr, Mo and W, A = Al, Ga and Ge) by calculation [14]. The study showed that with the increase of valence electron concentration, the bulk modulus of M2AN increases by a factor of 1.8, and the coupling between the MN layer and the A layer weakens. Despite these studies, theoretical studies of the M2lnX phase are not sufficient. Previously, MAX carbides have received the greatest attention, while MAX nitrides have received less. In general, the nitride phase and the carbide phase are very similar. Therefore, first-principles calculations are employed to investigate the structure, elastic anisotropy, and thermodynamic properties of Ti2lnX (X = C, N) and Zr2lnX (X = C, N) M2AX phase ceramics, providing a comprehensive complement to previously unexplored areas.

2. Methods

In this work, M2InX (M = Ti, Zr and X = C, N) MAX phases were analyzed using the Cambridge Sequential Total Energy Package (CASTEP) [15,16] of Density Functional Theory (DFT) [17]. The interactions between electrons and ionic nuclei were calculated using on-the-fly generation (OTFG), ultrasoft pseudopotentials (USPPs), and the Perdew–Wang generalized-gradient approximation (PW91) [18,19,20,21] method in generalized gradient approximation (GGA) was utilized to model exchange correlation potential. In this work, the geometric optimization tolerance was set to 5 × 10⁻⁶ eV/atom of total energy difference, the maximum ionic Hellmann–Feynman force was 0.01 eV/atom, the maximum ion displacement was 5 × 10⁻⁴, and the maximum stress was 0.02 GPa; the M2InX phases plan-wave cutoff energy was set to 450 eV and the k-point in the first irreducible Brillouin zone was selected as 10 × 10 × 2. In this calculation, we conducted relevant tests on 1 × 1 × 1, 1 × 1 × 2, 1 × 2 × 2, and 2 × 2 × 2 supercells, and found that when using 1 × 1 × 2, 1 × 2× 2, 2 × 2 × 2 supercells, the resulting energy change was about 1 meV/atom. The total number of atoms in 1 × 1 × 1, 1 × 1 × 2, 1 × 2 × 2, and 2 × 2 × 2 supercells were 8, 16, 32, and 64, respectively. Considering the computational cost and time, this study finally decided to use a 1 × 1 × 2 supercell for the calculation.

3. Results and Discussion

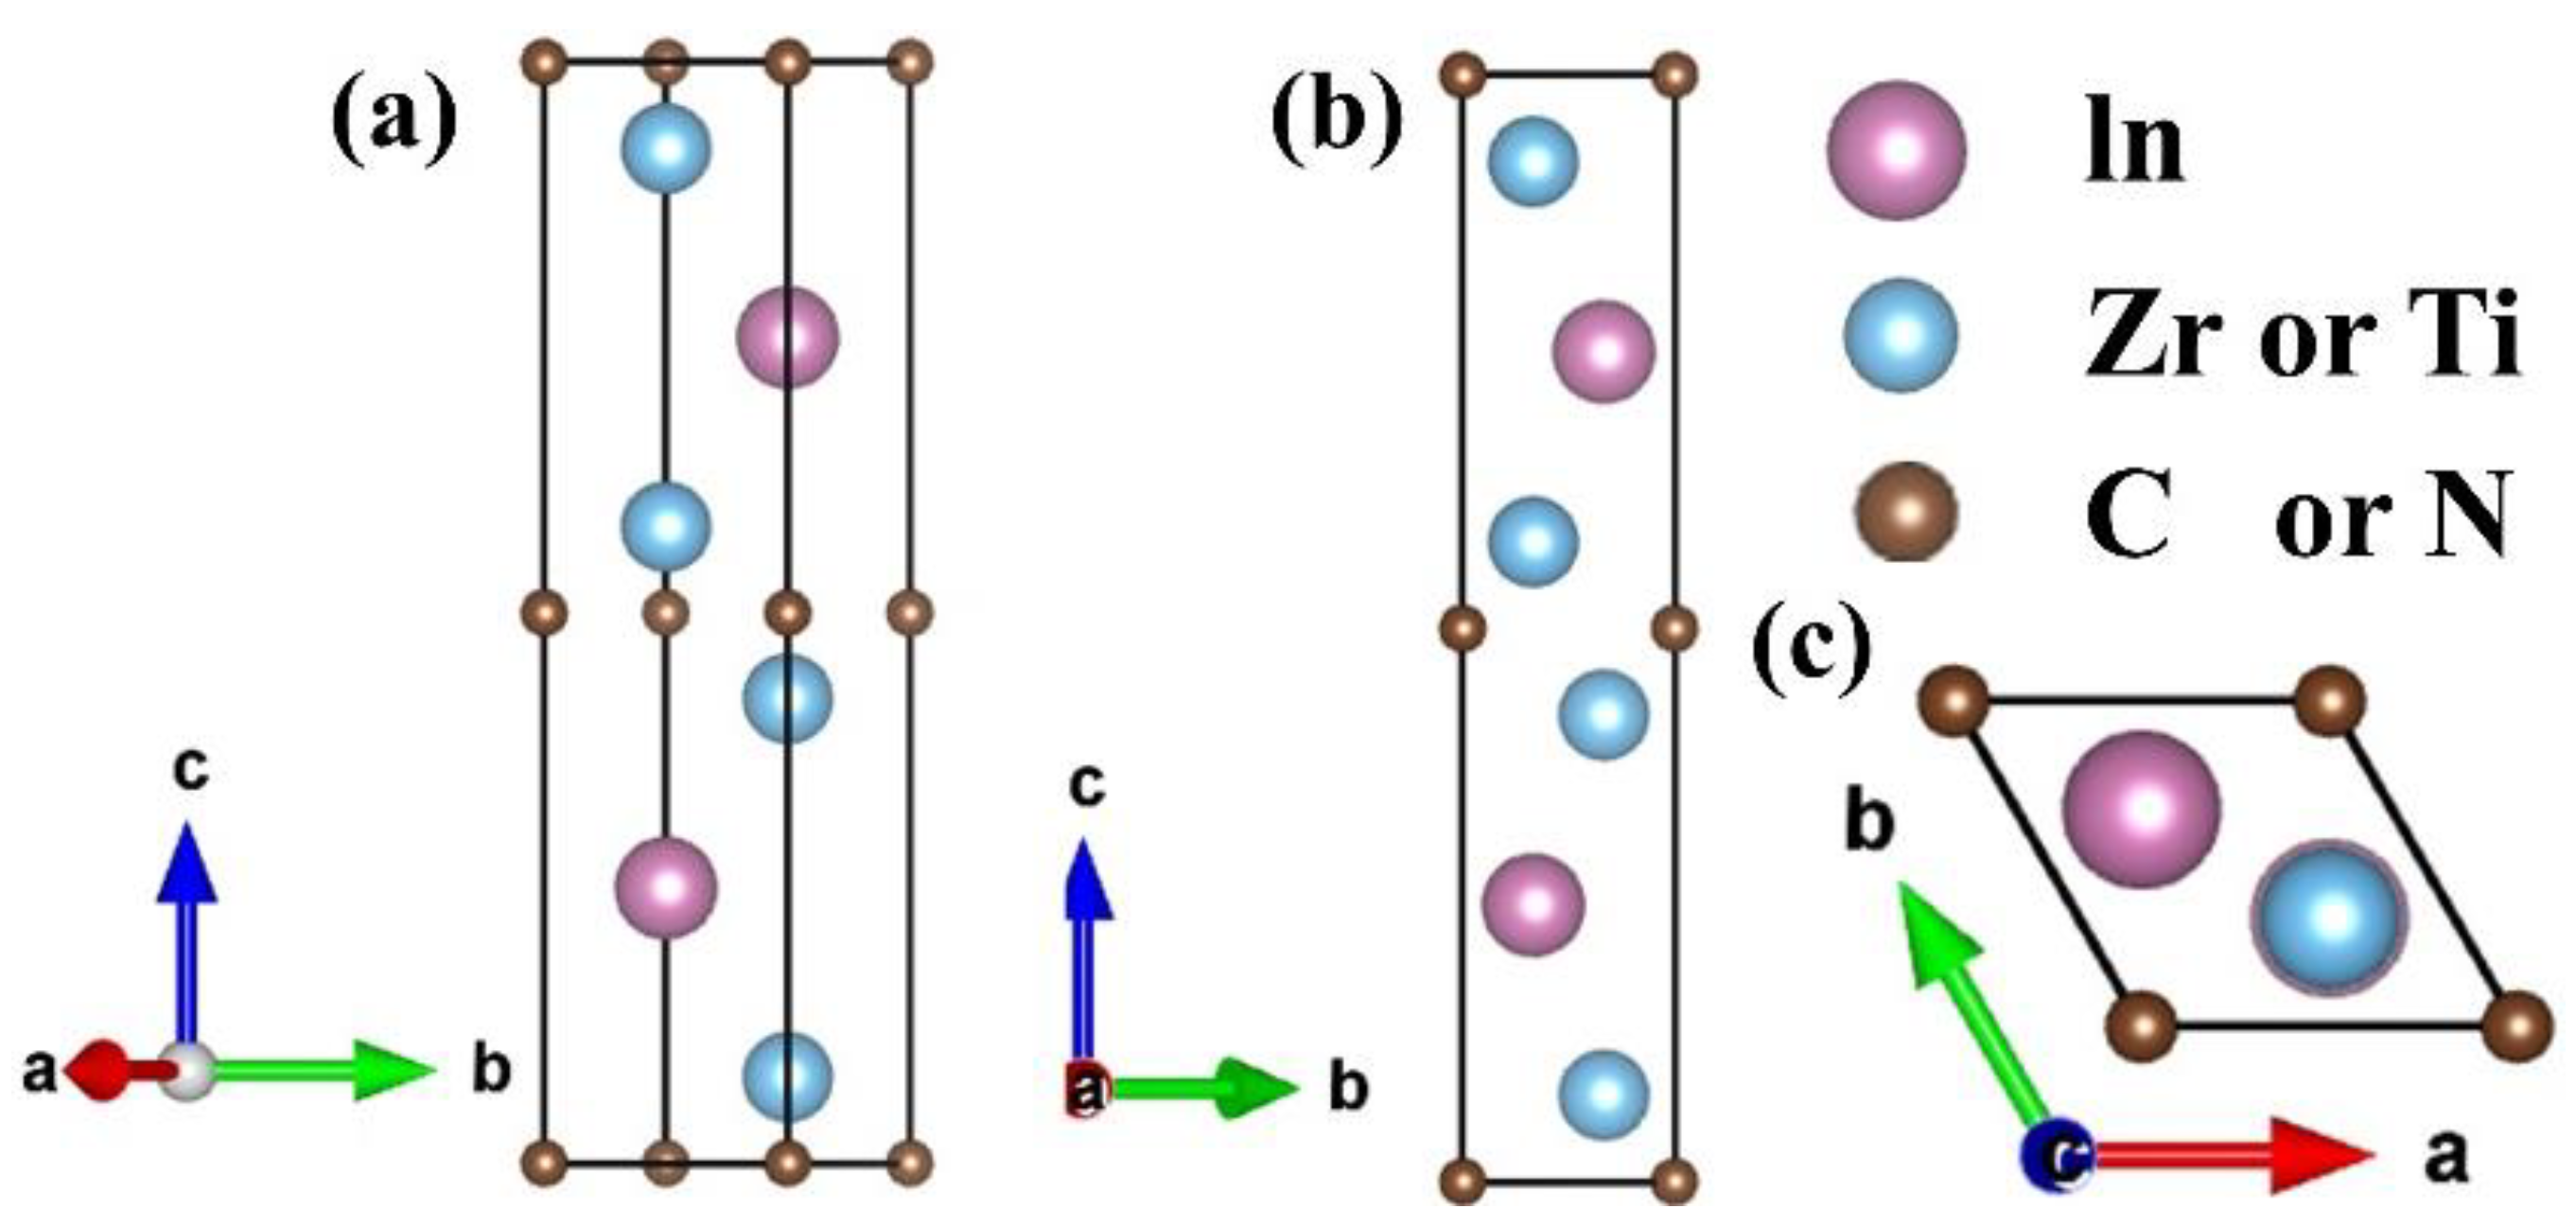
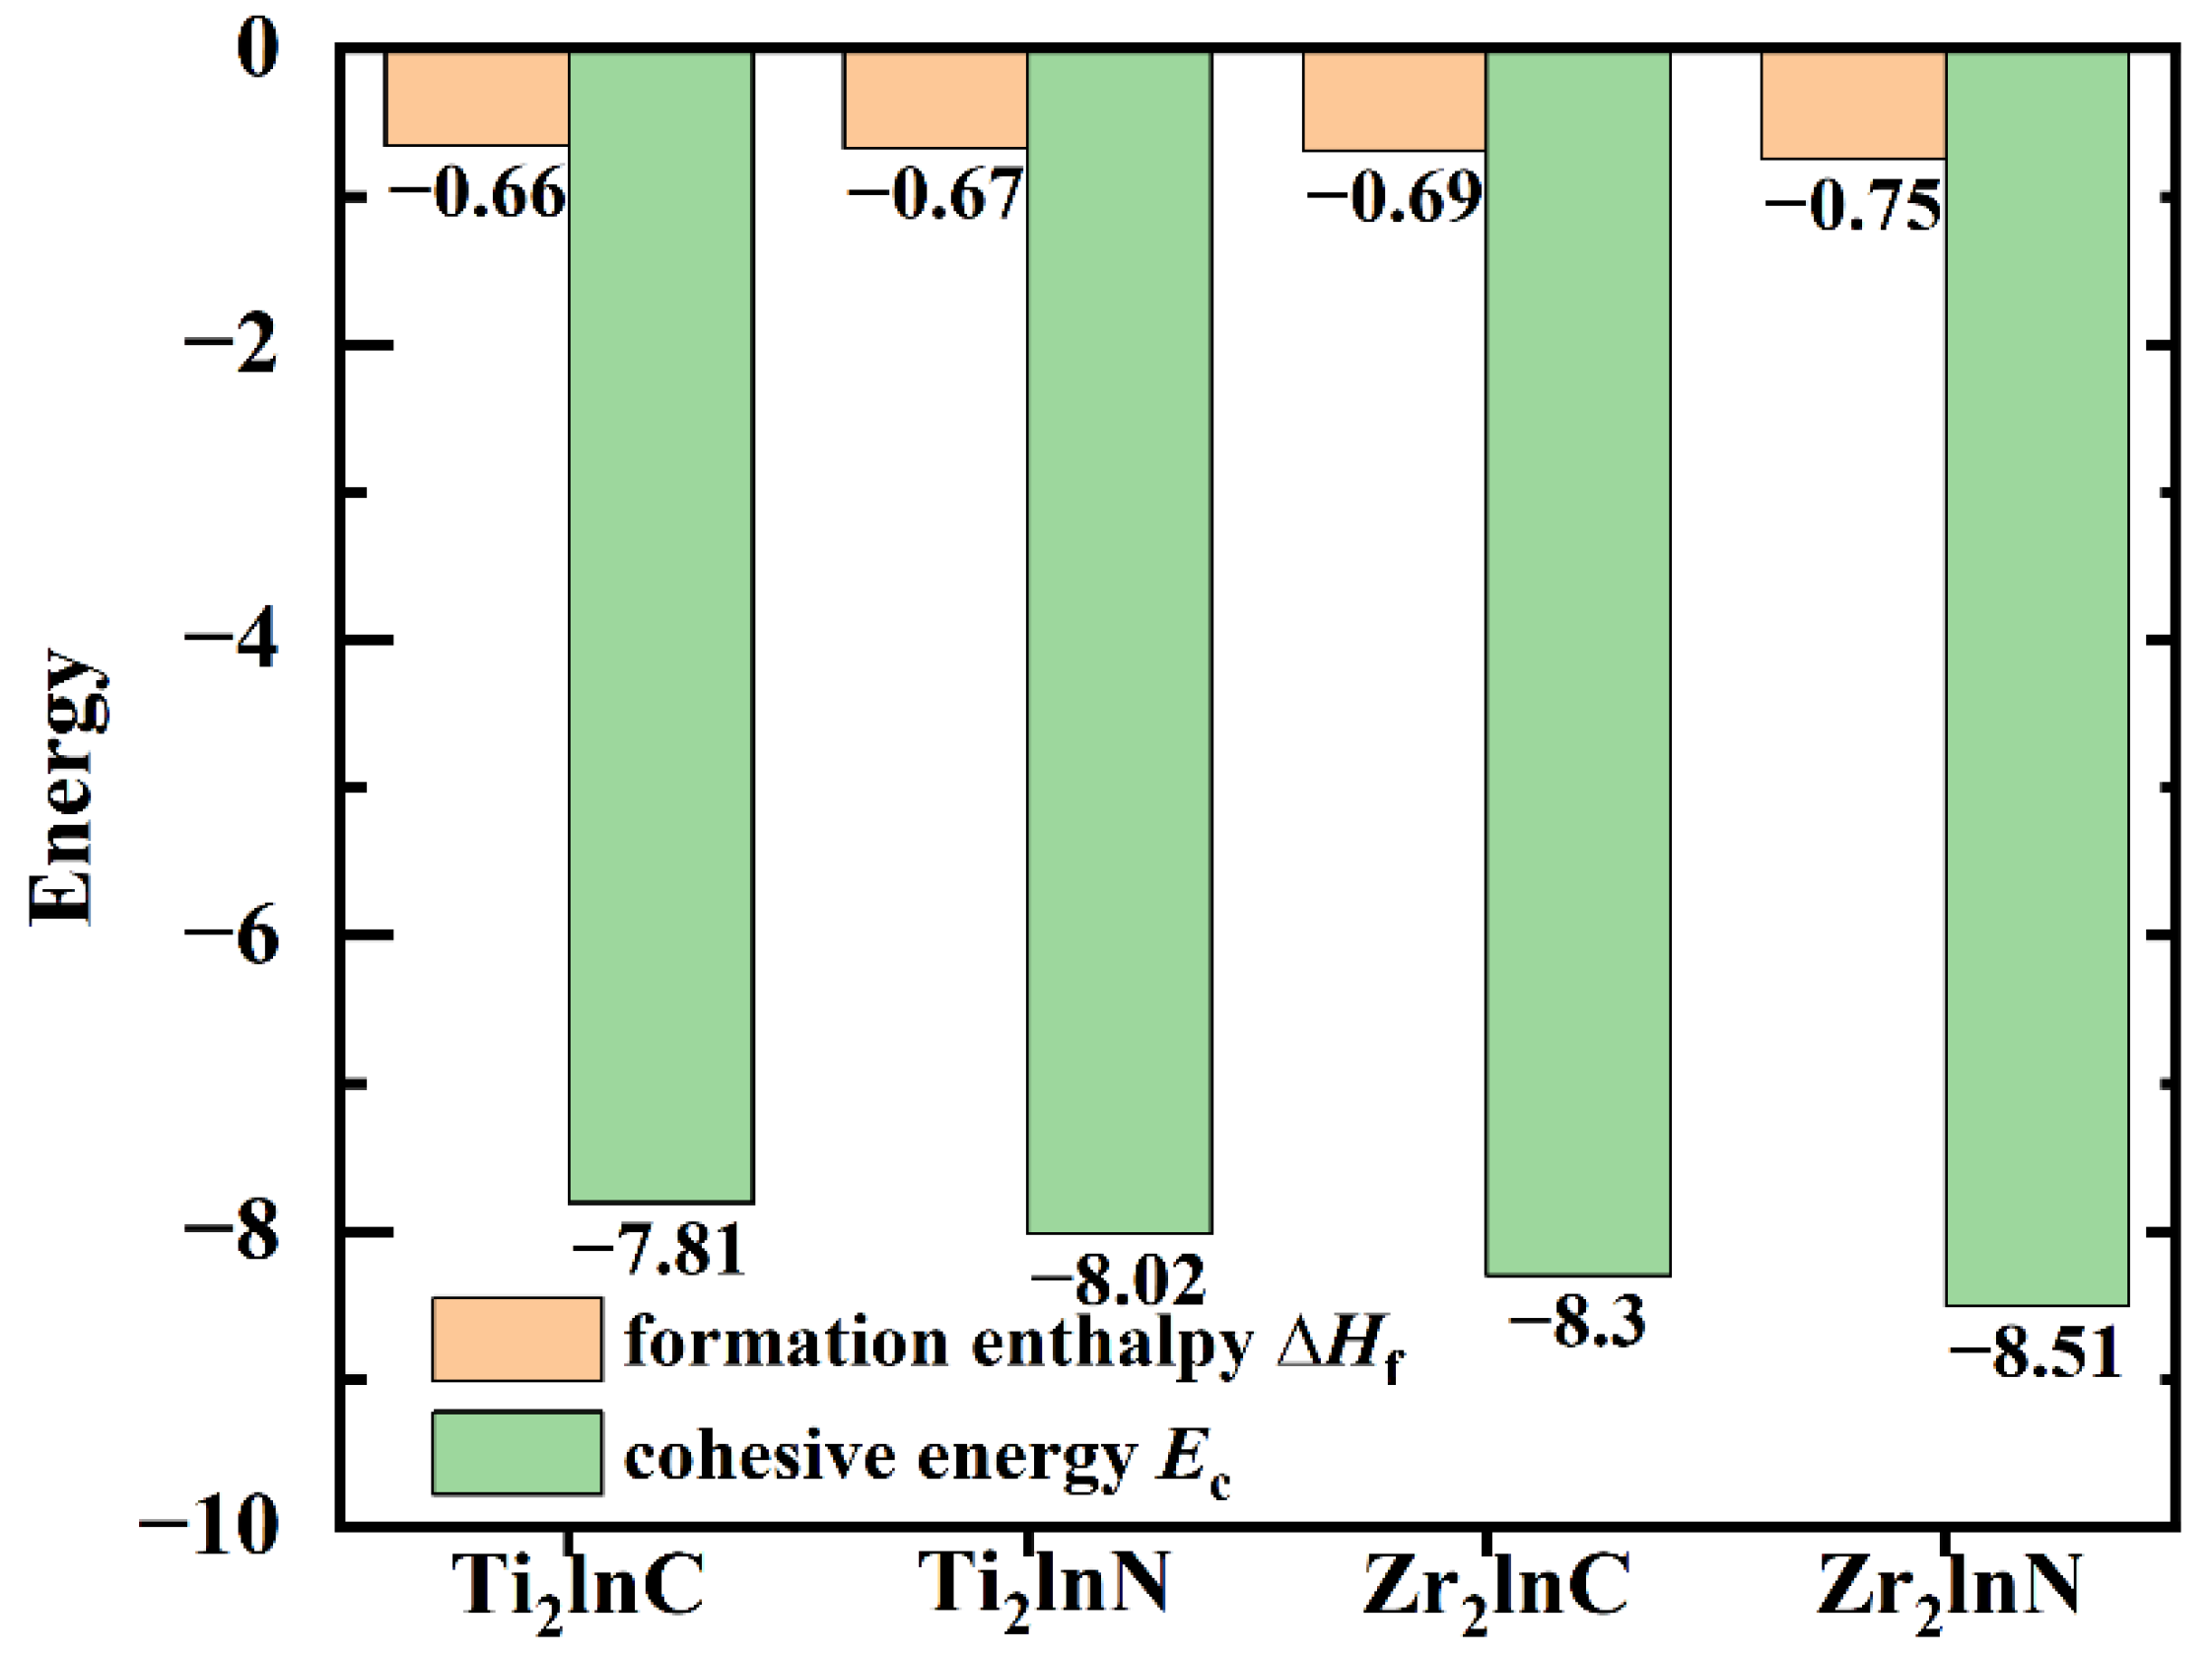
3.1. Single-Crystal Structural Properties

Firstly, the most stable hexagonal M2InX (M = Ti, Zr and X = C, N) MAX phase crystal structure was determined, as shown in Figure 1. Fully relaxing atomic locations and lattice parameters yielded a crystal structure in equilibrium. Table 1 displays the computed lattice parameters a and c, as well as their volumes and formation enthalpies. The calculated structural parameters of the M2InX phase are in agreement with other experimental results [12,22]. This demonstrates the dependability and precision of the simulations presented in this study, and provided us with the confidence to continue investigating the characteristics of Ti2lnX (X = C, N) and Zr2lnX (X = C, N) ceramics. Ti2lnX (X = C, N) and Zr2lnX (X = C, N) crystallize in the P63/mmc-space group with the Wyckoff positions of 4f (1/3, 2/3, ZZr/Ti) for Zr/Ti atoms, 2d (1/3, 2/3, 3/4) for In atoms, and 2a (0, 0, 0) for N/C atoms, and the unit cell was made up of 8 atoms, including 2X, 4M, and 2ln atoms. The atoms were aligned along the c-axis in the order X-ln-M-X, as shown in Figure 1.
The computed lattice parameters a and c, their volumes, the formation enthalpy, and cohesive energy are listed in Table 1. As we all know, thermodynamic stability can be understood to some extent as the concept of minimal energy, which states the lower the energy, the greater the system’s thermodynamic stability. As a result, thermodynamic stability is described using quantities such as formation enthalpy ΔHf, and cohesive energy Ec. When the formation enthalpy and cohesive energy are both negative, the structure is stable. Therefore, the greater the negative value, the greater the substance’s stability. The calculation is as follows:
E c ( M 2 lnX ) = 1 8 [ E ( M 2 lnX ) 4 E iso ( M ) 2 E iso ( ln ) 2 E iso ( X ) ]
Δ H f ( M 2 lnX ) = 1 8 [ E ( M 2 lnX ) 4 E bulk ( M ) 2 E bulk ( ln ) 2 E bulk ( X ) ]
Here, E is the total energy of M2lnX. Ebulk(M), Ebulk(ln) and Ebulk(X) represent the energies of single M, ln, and X atoms in a stable state, respectively. Eiso(M), Eiso(ln), and Eiso(X) are the energies of isolated M, ln, and X atoms, respectively.
Table 1 and Figure 2 show the computed cohesive energy Ec and formation enthalpy ΔHf of Ti2lnC, Ti2lnN, Zr2lnC, and Zr2lnN, as well as other experimental data for related compounds [12,13,22–24]. The predicted Ec and ΔHf values for the compounds in Table 1 are negative, indicating that Ti2lnC, Ti2lnN, Zr2lnC, and Zr2lnN are thermodynamically stable and have stronger bond strengths. Furthermore, the sequence of Ec and ΔHf values is Ti2lnC > Ti2lnN and Zr2lnC > Zr2lnN. Therefore, the order of thermodynamic stability is Ti2lnN > Ti2lnC and Zr2lnN > Zr2lnC. The comprehensive comparison shows that Zr2lnN and Ti2lnN have the highest thermodynamic stability. If Zr2lnN and Ti2lnN continue to be compared, it can be seen that Zr2lnN has the highest thermodynamic stability, which is shown in Figure 2.

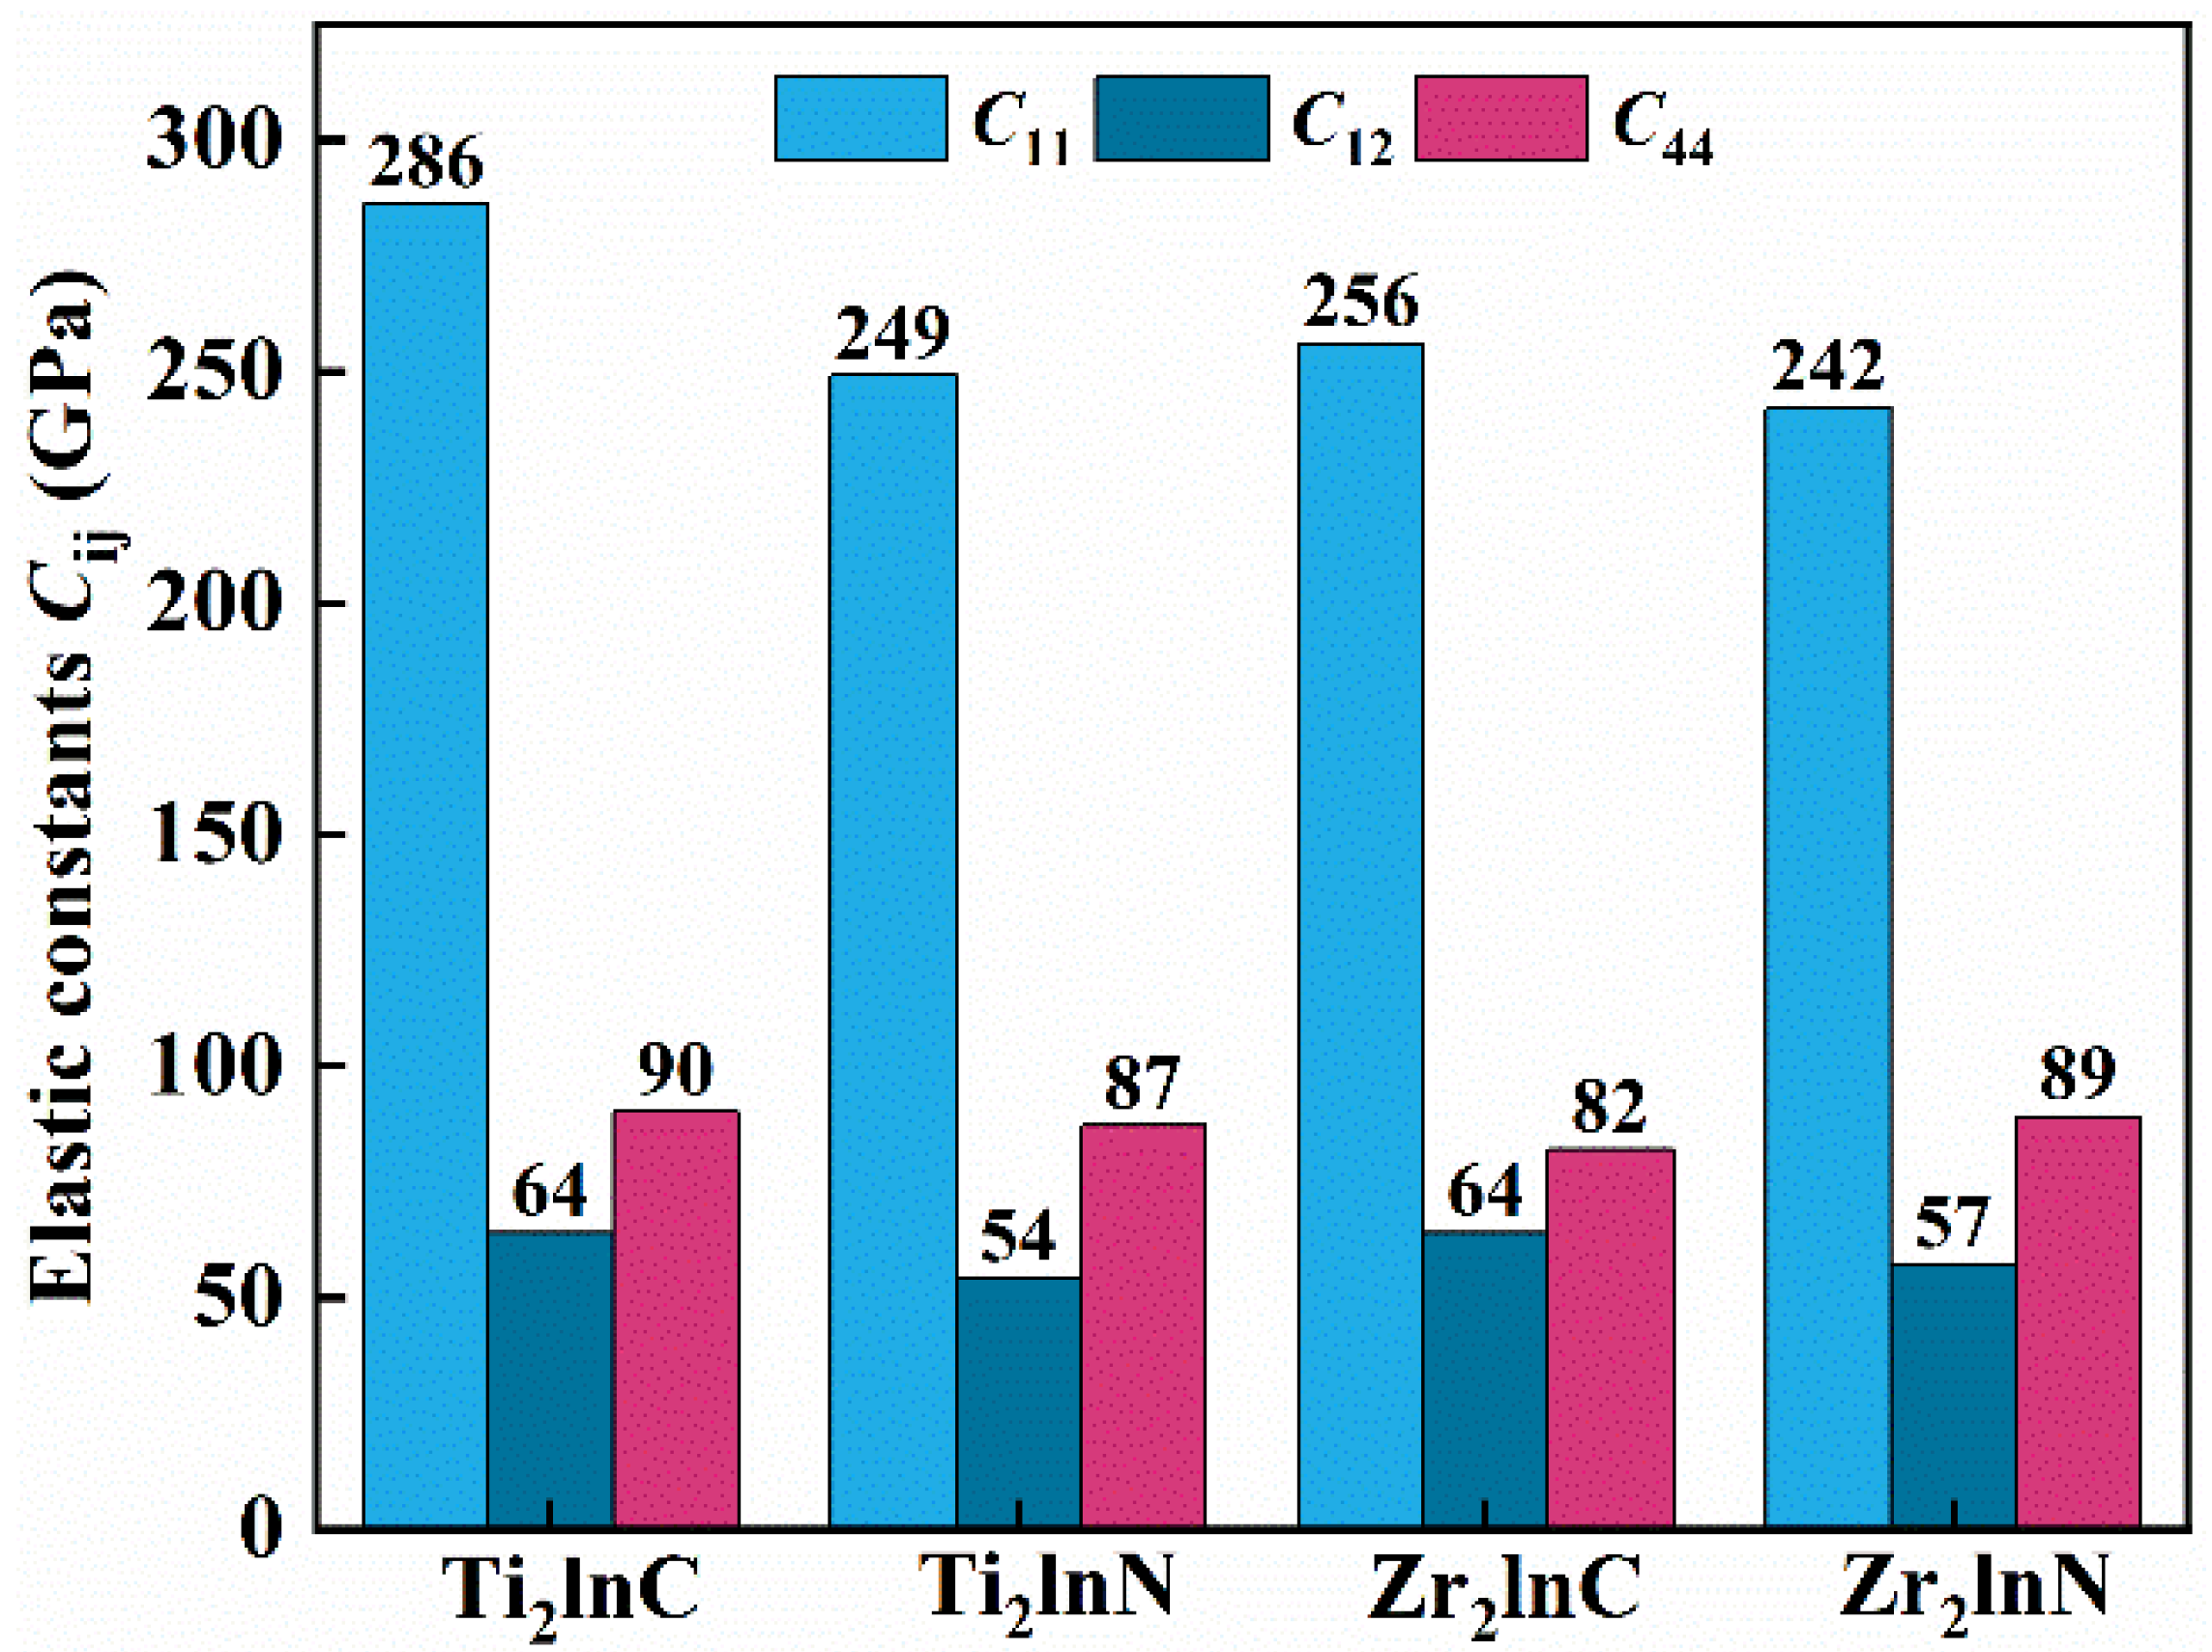
3.2. Elastic Properties
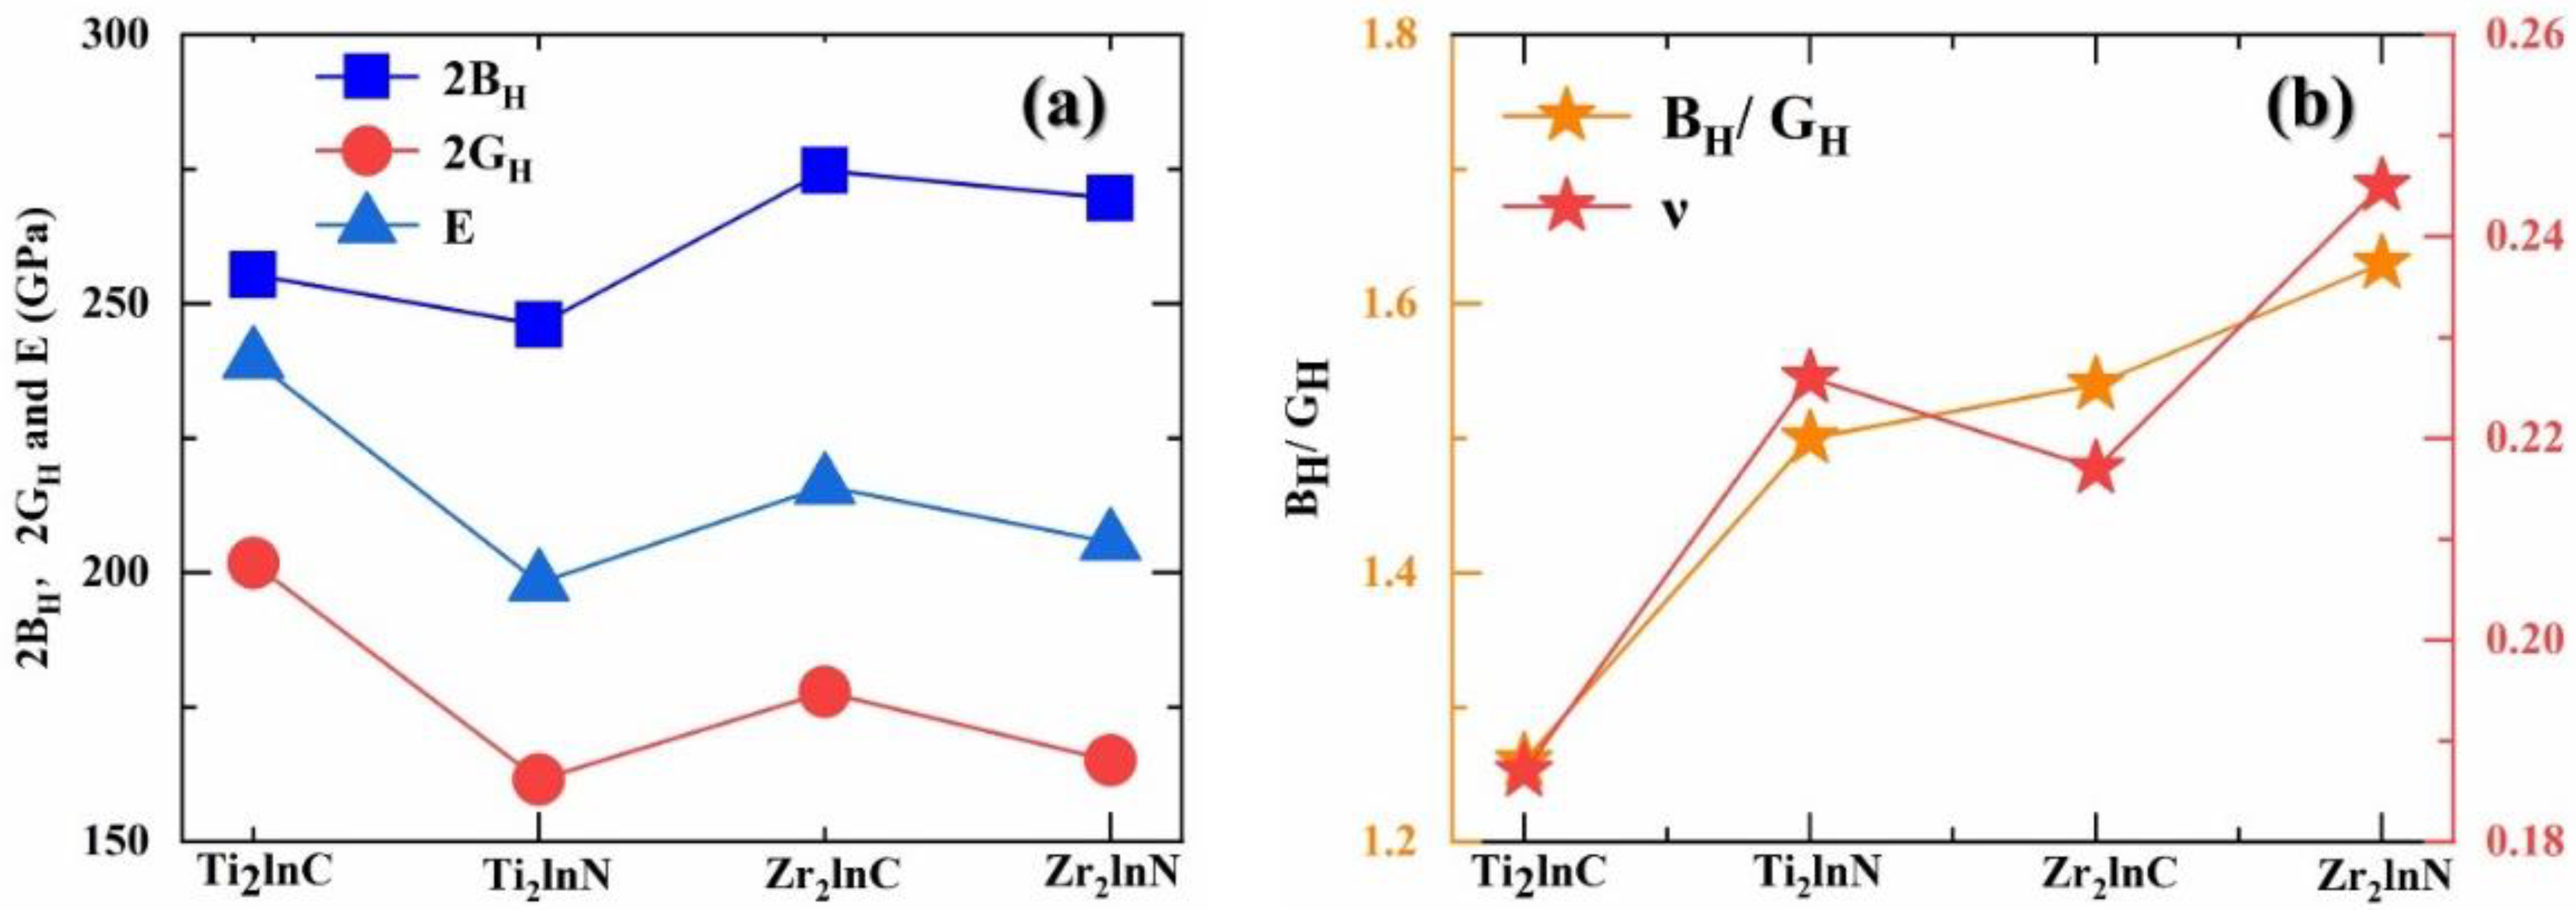
This work is based on the stress-strain approach of Hooke’s law to analyze mechanical stability, and the elastic constants were determined by applying normal stress, shear stress, and six different deformations. Table 2 shows the calculated elastic constants Cij and elastic compliance constants Sij of Ti2lnC, Ti2lnN, Zr2lnC, and Zr2lnN. Only five elastic constants (C11, C12, C13, C33, C44) are independent for hexagonal crystals [25]. The mechanical stability criteria for hexagonal crystals are given by the following equation [26,27,28]:
C11C12 > 0; C44 > 0; C11 + C12 − 2C132/C33 > 0
Combining the elastic constants calculated in Table 2 and Figure 3, it is not difficult to see that these constants satisfy all the above conditions, proving that Ti2lnC, Ti2lnN, Zr2lnC, and Zr2lnN are mechanically stable. Usually, the elastic constant represents some important physical meaning, for example, C11 and C33 correspond to the linear compression resistance of the a and c axes, respectively. Table 2 reflects that the C33 value of M2lnX is significantly smaller than the C11 value, indicating that M2lnX has a high compressibility along the c-axis. To begin with, for the Ti2lnX (X = C, N) system, Ti2lnC has the highest C11 value (286 GPa) and C33 value (244 GPa), while Ti2lnN has the lowest C11 value (229 GPa) and C33 value (228 GPa), suggesting that Ti2lnC is the least compressible along the a-axes and c-axes, while Ti2lnN is the most compressible along the a-axes and c-axes. This is consistent with Ti2lnC having the strongest chemical bond and Ti2lnN having the weakest chemical bond [13,22]. It can also be seen that for the system of Zr2lnX (X = C, N), Zr2lnC is the most incompressible along the a- and c-axes, while Zr2lnN is the most compressible along the a- and c-axes. From the comparison of the above two systems, it can be understood that Ti2lnC and Zr2lnC are the most incompressible of the two systems, respectively. If the values of C11 and C33 are continuously compared in the M2lnC (M = Ti, Zr) system, it can be seen that Ti2lnC > Zr2lnC, and therefore the compressibility of Ti2lnC along the a-axis and c-axis is the smallest, which also confirms that Ti2lnC has a great elasticity constant.
It is well-known that C12, C44, and C66 are related to shear modulus, and larger values of C12, C44, and C66 correspond to larger shear modulus. For Ti2lnX (X = C, N) the order of C12, C44, and C66 is Ti2lnC > Ti2lnN, while for Zr2lnX (X = C, N) the order of C12, C44, and C66 is Zr2lnC > Zr2lnN. Therefore, Ti2lnC and Zr2lnC should have the highest shear moduli. Similarly, by comparing the values of C12, C44, and C66 in the M2lnC (M = Ti, Zr) system, it can be seen that Ti2lnC > Zr2lnC, which proves that Ti2lnC has the highest shear modulus.

3.3. Elastic Moduli

In general, using elastic modulus as a parameter to measure the mechanical properties of polycrystals is more convincing than using the elastic constant. In practice, because most materials are polycrystalline, the applied elastic modulus can more accurately describe the anisotropy of the material than the elastic constant. The Reuss-Hill-Voigt approximation is generally used to obtain the elastic modulus for M2InX phase, which contains Young’s modulus E, bulk modulus B, and shear modulus G [24,29,30]. The following are the specific expressions of BH, EH, and GH:
G H = ( G V + G R ) 2
B H = ( B R + B V ) 2
E = 9 G H B H ( 3 B H + G H )
Bulk modulus can be specifically divided into lower bulk modulus (BV) and upper bulk modulus (BR). Likewise, the shear modulus has a lower shear modulus (GV) and an upper shear modulus (GR).
Table 3 shows the estimated and reference data for the elastic modulus M2lnX compound [12,13,23,31]. The results of this computation are obviously close to the findings stated in the reference. Bulk moduli are frequently used to define a material’s compressibility under hydrostatic pressure. A higher bulk modulus indicates less compressibility. To put it another way, the higher the bulk modulus, the stiffer the material. It can be seen from Table 3 that for Ti2lnX (X = C, N), the BH value of Ti2lnC is greater than that of Ti2lnN, indicating that Ti2lnC has higher incompressibility. For Zr2lnX (X = C, N), Zr2lnC has higher incompressibility. It is well-known that the larger bulk modulus in compounds originates from the strong hybridization between orbitals. Therefore, Ti2lnC and Zr2lnC should have the strongest orbital hybridization.
Furthermore, the stiffness of a material can be defined by its Young’s modulus; the greater the Young’s modulus, the greater the stiffness of the material. Table 3 shows that Ti2lnC and Zr2lnC have the maximum stiffness in the Ti2lnX (X = C, N) and Zr2lnX (X = C, N) systems, respectively. Ti2lnC has the highest stiffness in the M2lnC (M = Ti, Zr) system, because its Young’s modulus is greater than that of Zr2lnC. Additionally, the shear modulus can be used to forecast the hardness of a material. In general, the shear modulus characterizes the degree to which the shape of the material is affected by the shear force acting on it. The larger the shear modulus, the greater the corresponding deformation resistance. Therefore, the greater the shear modulus, the higher the hardness and strength of the material. From the conclusion drawn from the elastic constants in the previous section, it can be seen that Ti2lnC and Zr2lnC have the highest shear moduli, so the hardness of both Ti2lnC and Zr2lnC is highest. Further comparison of the M2lnC (M = Ti, Zr) system shows that Ti2lnC has the largest shear modulus, so the deformation resistance of Ti2lnC is the largest. Finally, Figure 4a shows the comparison between B, G, and E. Generally, the plastic properties of materials can be characterized by B/G. Judging whether the material is ductile or brittle depends on the value of B/G. If B/G > 1.75, the material is plastic; if the contrary, the material is brittle. In addition, it is straightforward to see from the ratios in Table 3 that all four materials are brittle, as these values are all less than the critical value (1.75). In addition, Poisson’s ratio (ν) can also be used to measure the brittleness and toughness of materials. When ν < 1/3, it is a brittle material; in addition, the material exhibits toughness. Table 3 shows that the Poisson’s ratio of all four materials is less than 0.33. Likewise, Figure 4b can also prove that all four materials are brittle.

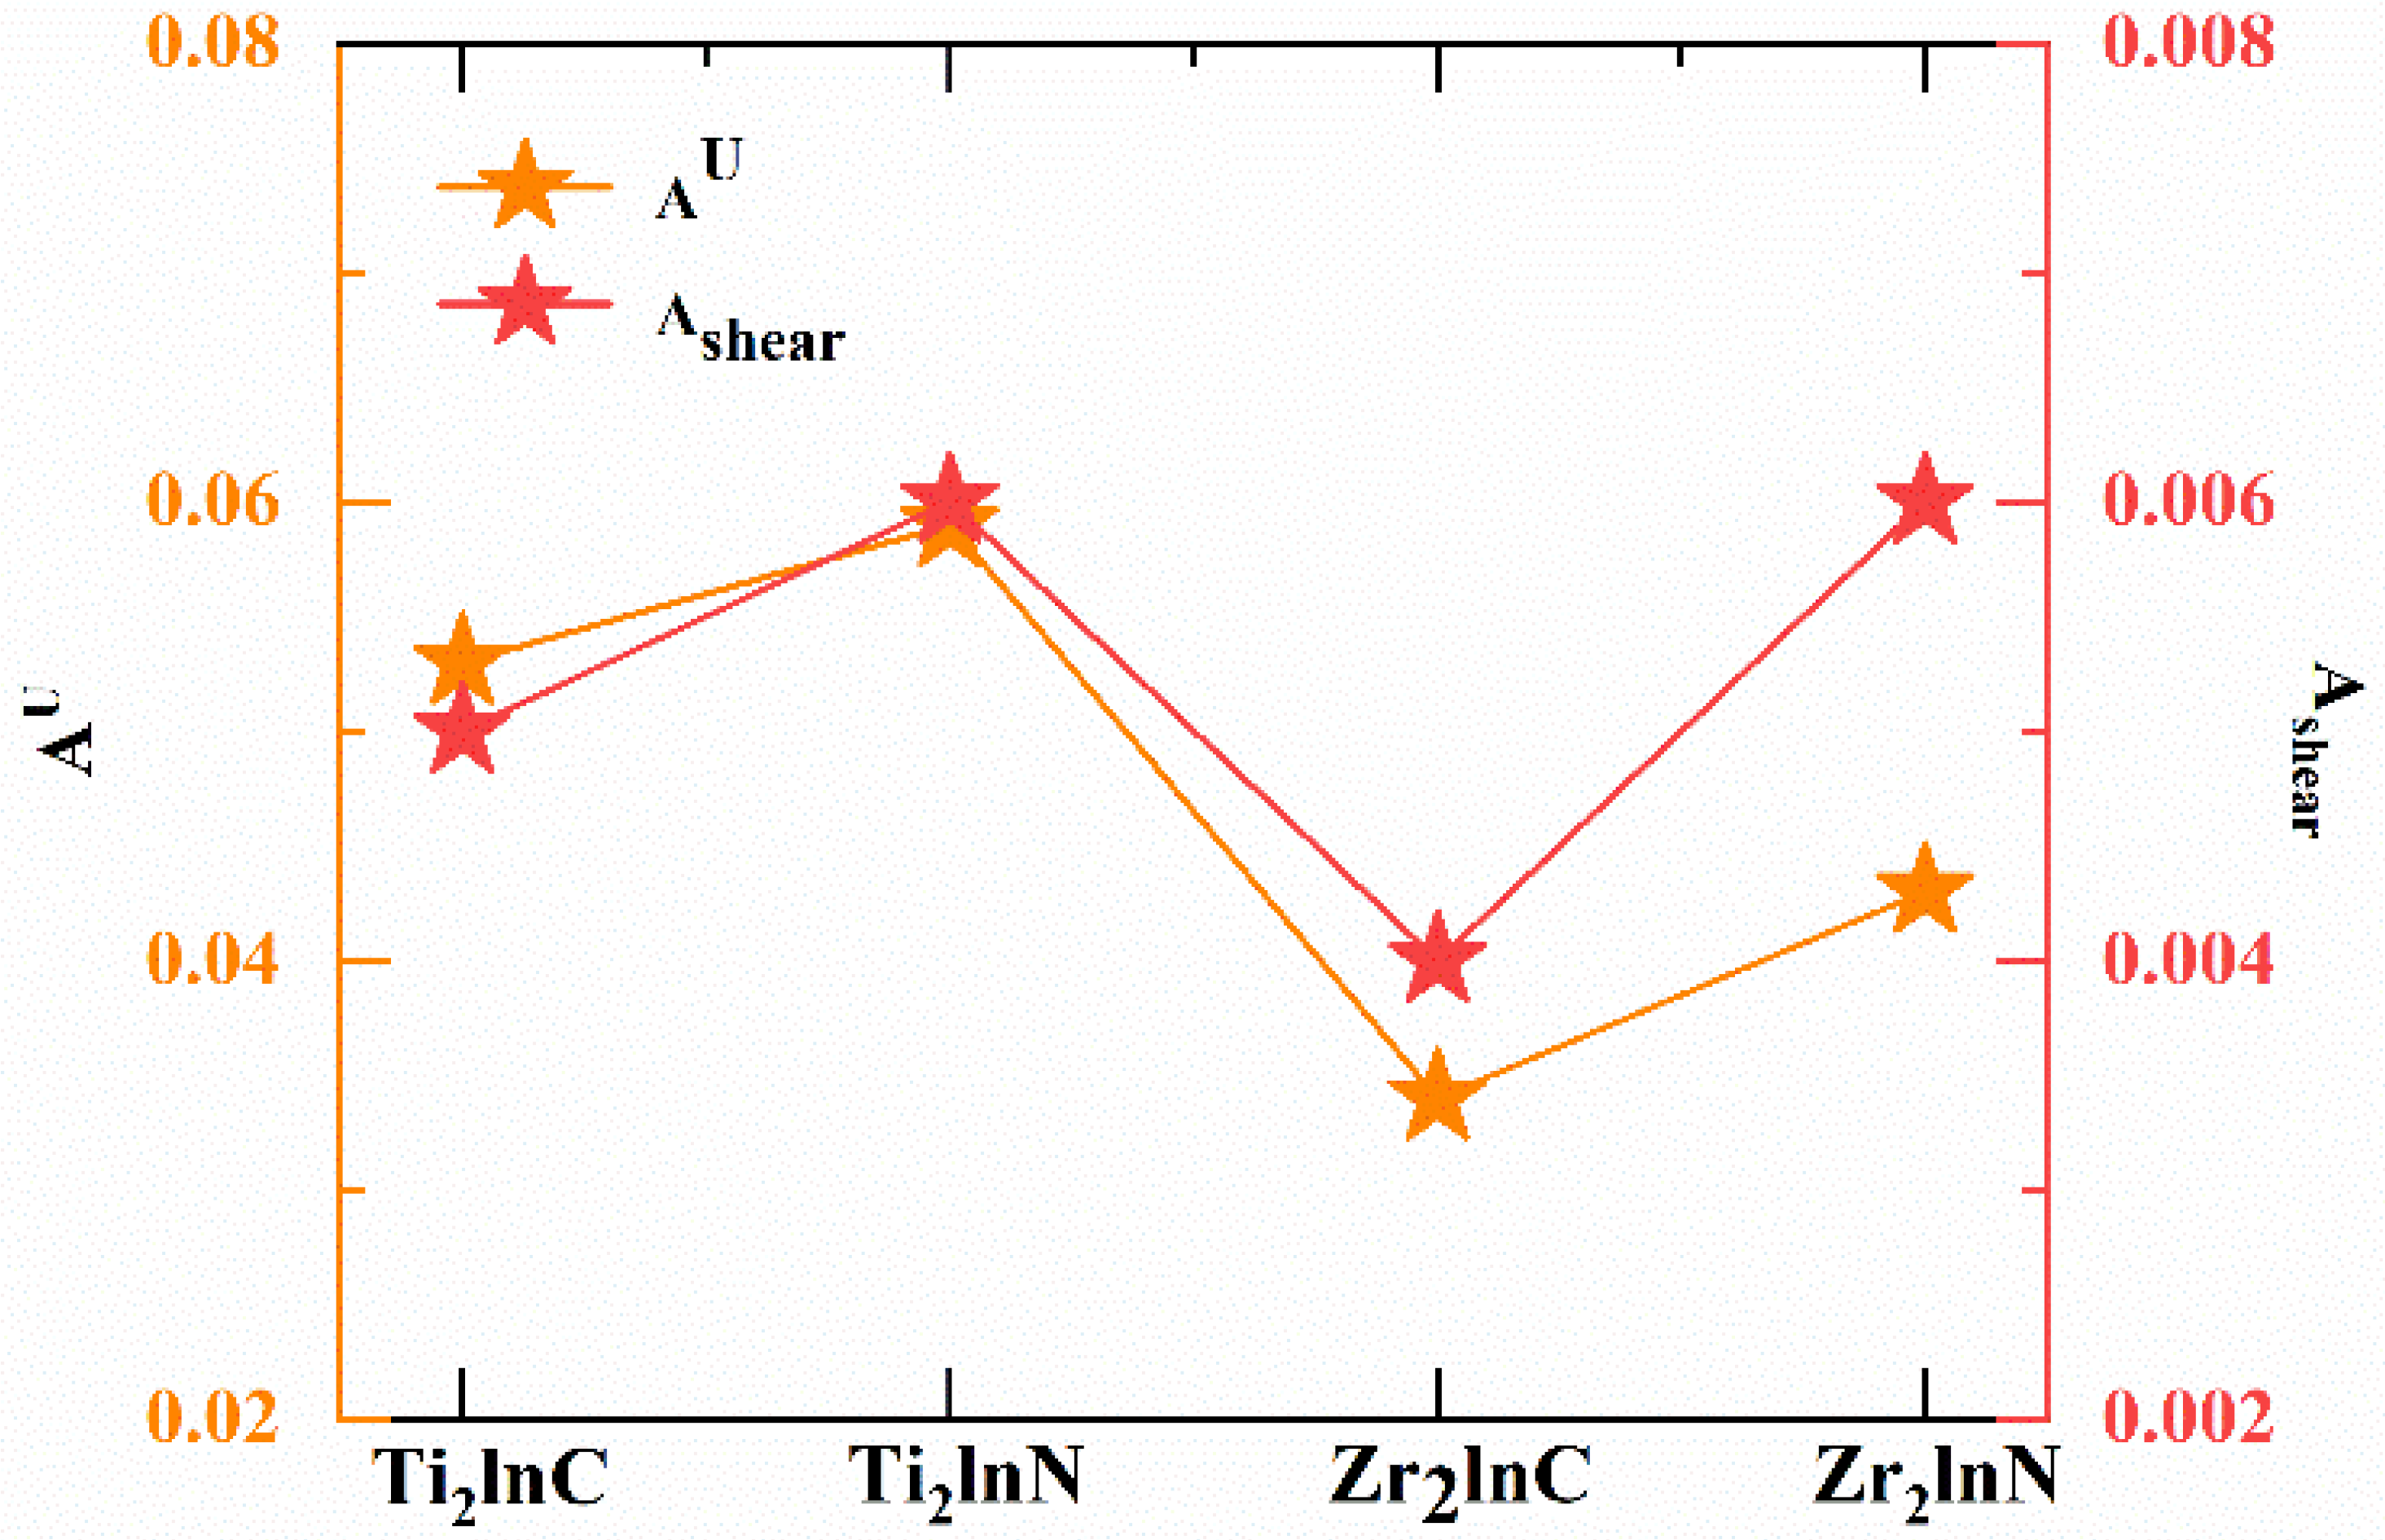
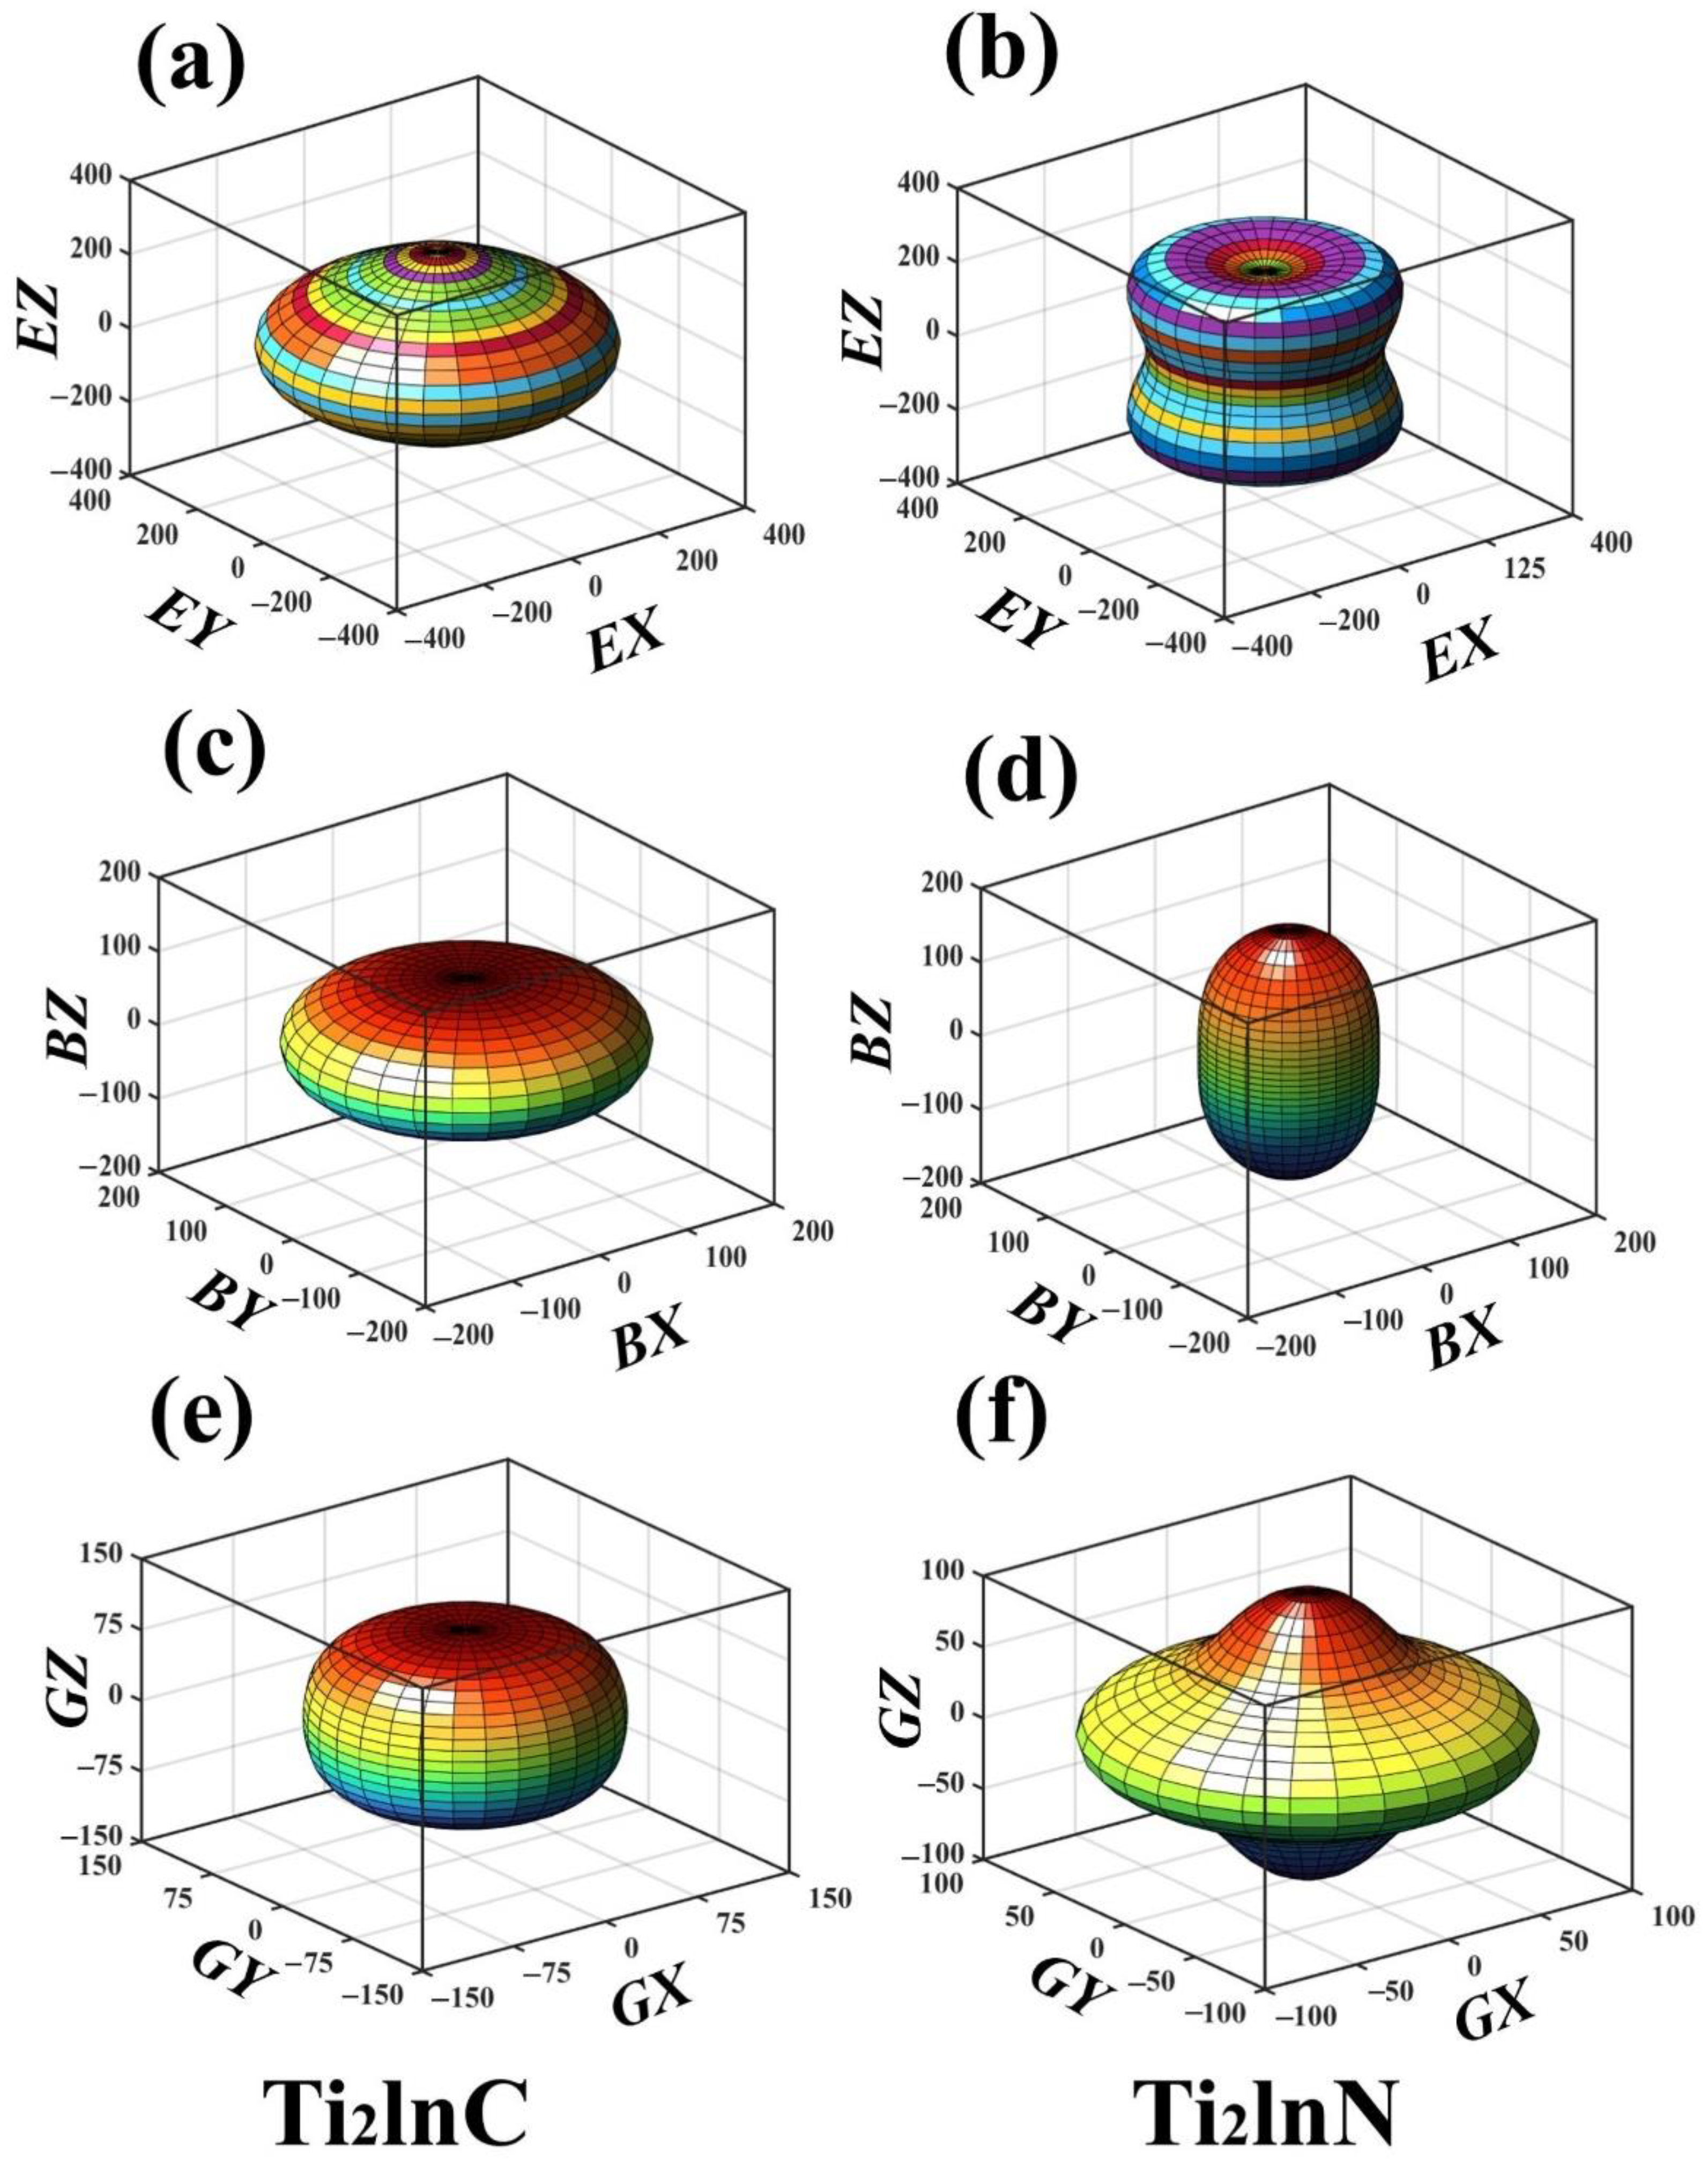
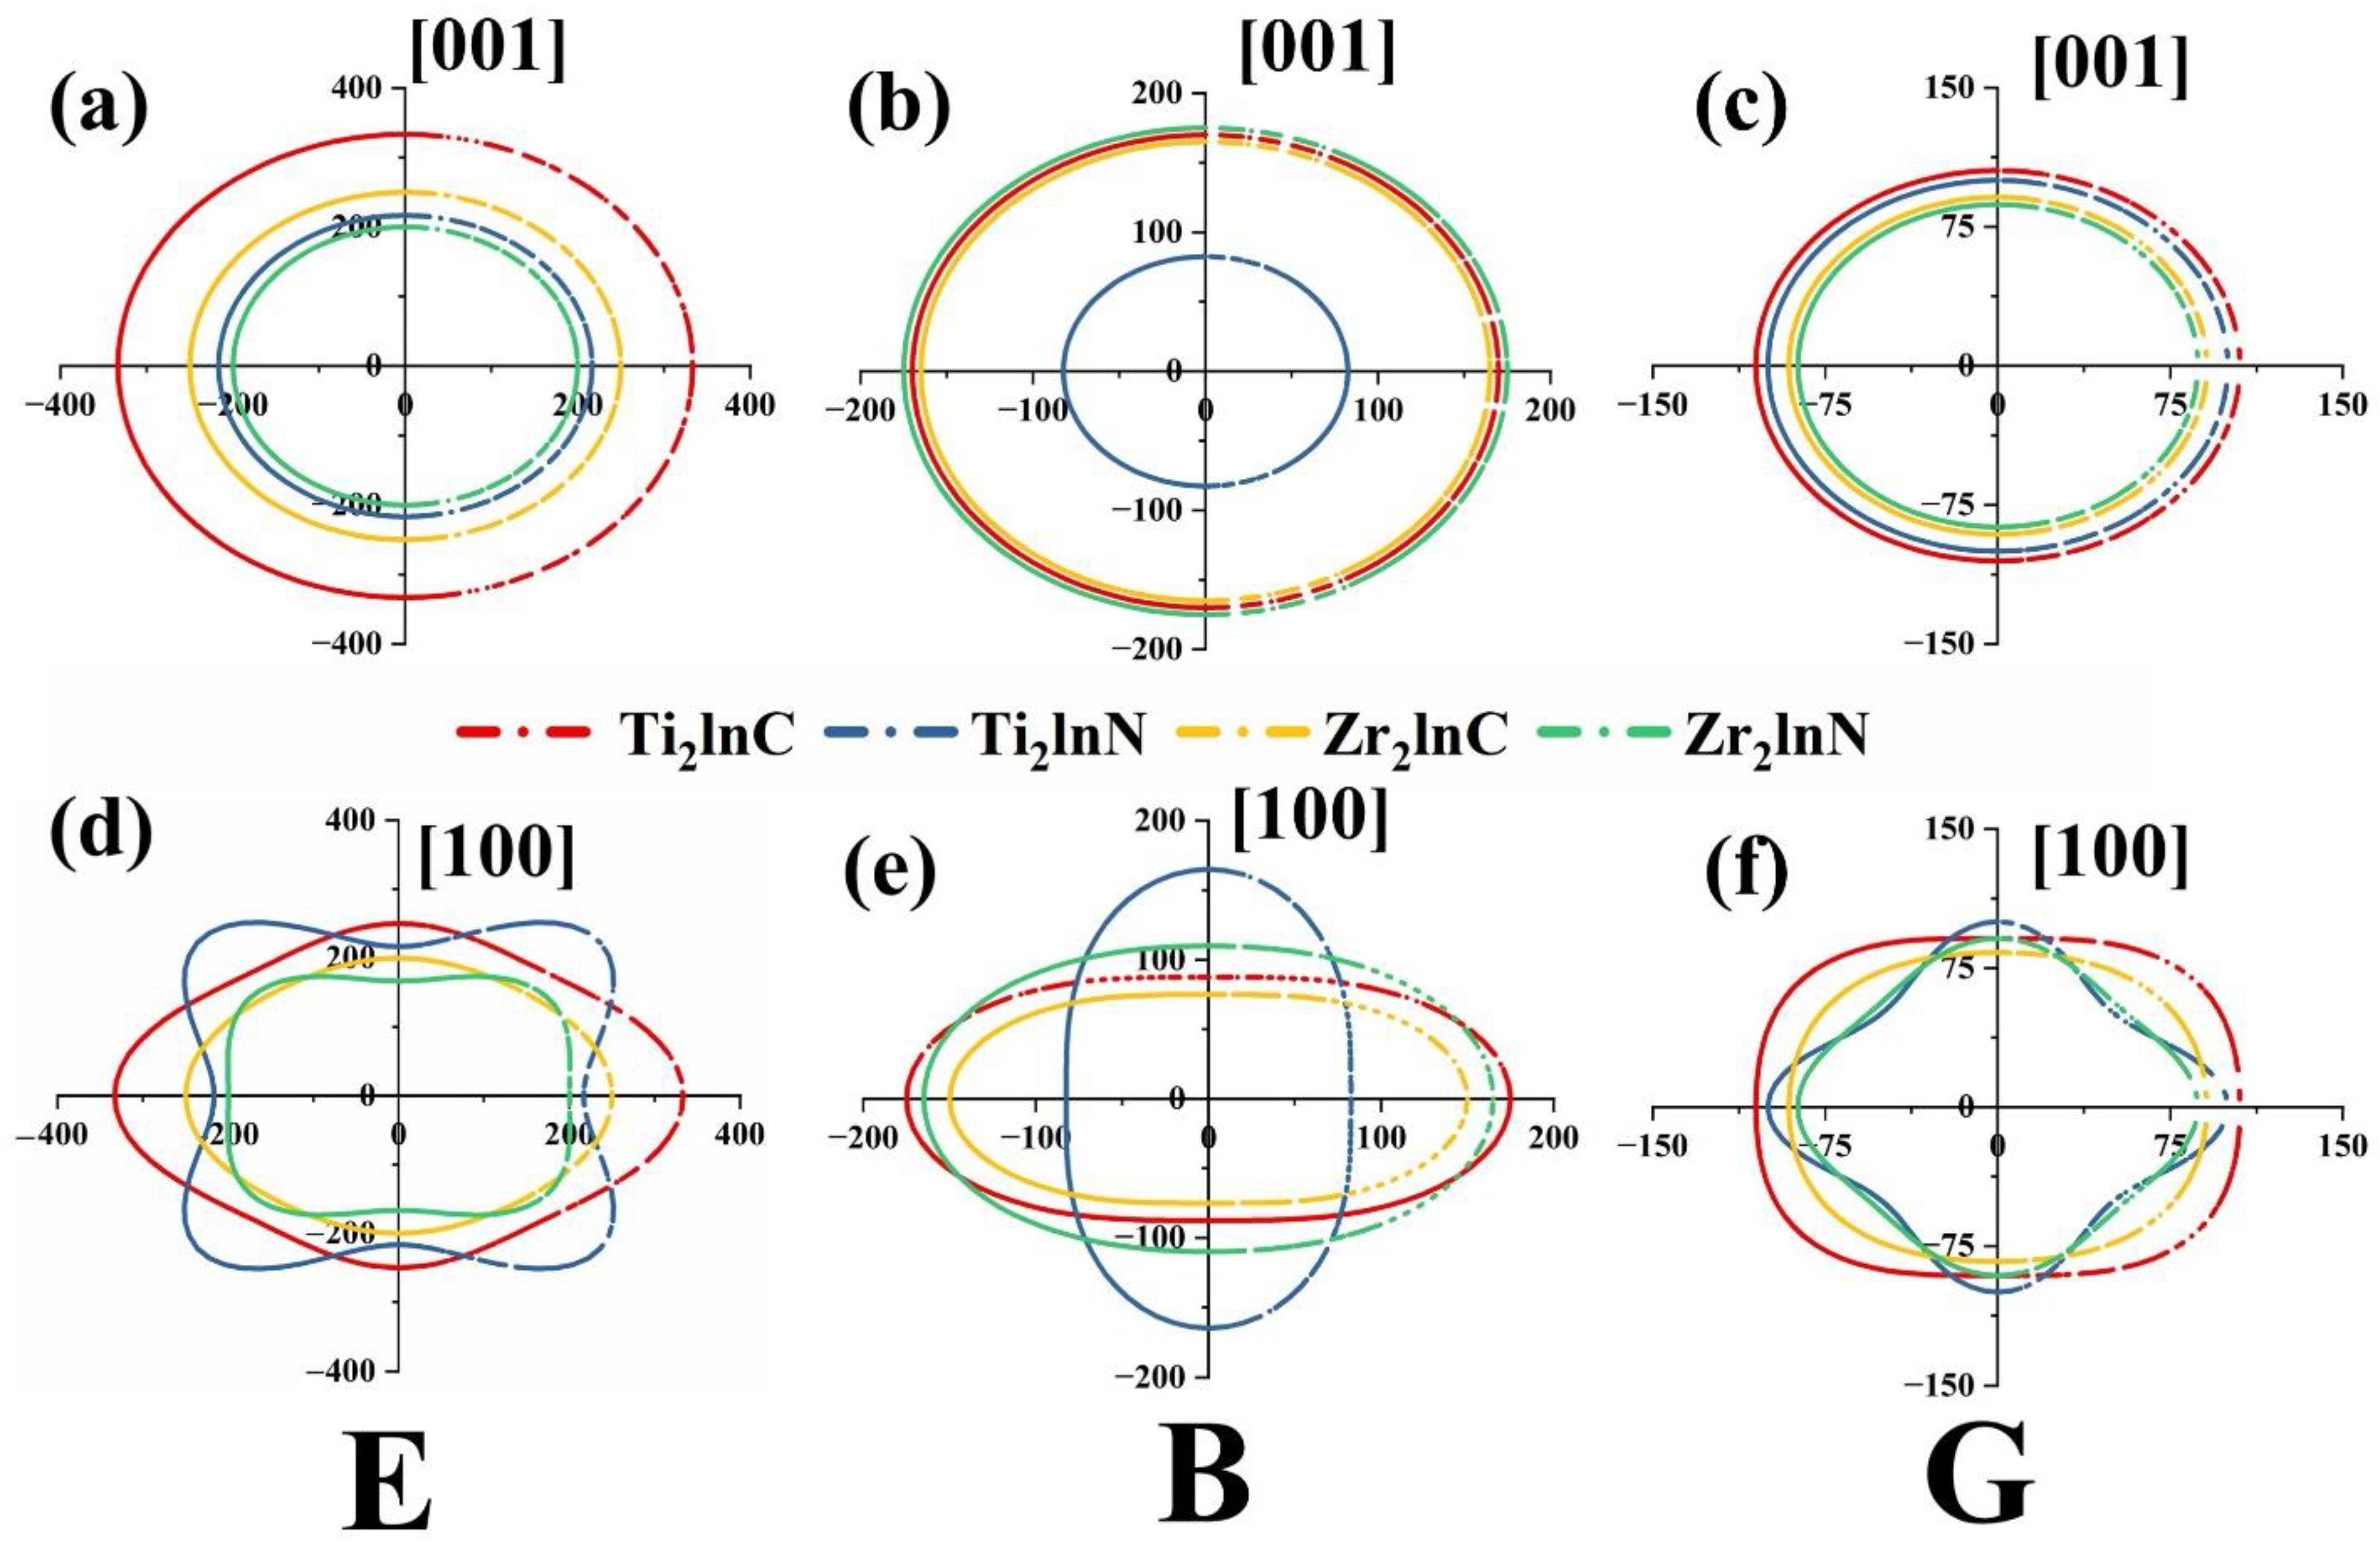
3.4. Anisotropy in Elastic Moduli

Elastic anisotropy is commonly responsible for the formation and development of microcracks in materials. As a result, the elastic anisotropy of solids must be discussed, and this anisotropy is best defined by three indicators: the anisotropy index AU [32], the percentage of compression anisotropy Acomp, and the percentage of shear anisotropy Ashear [33,34,35]. The calculation formula is as follows:
A U = 5 G V G R + B V B R 6
A comp = B V B R B V + B R × 100 %
A shear = G V G R G V + G R × 100 %
A 1 = 4 C 44 C 11 + C 33 2 C 13
A 2 = 4 C 55 C 22 + C 33 2 C 23
A 3 = 4 C 66 C 11 + C 22 2 C 12
Table 4 shows the anisotropy indices of the obtained ceramics of M2InX phases. Figure 5 depicts the variation of AU with Ashear. From Table 4, it can be seen that for Ti2lnX (X = C, N), the AU value of Ti2lnC (0.063) is smaller than that of Ti2lnN (0.042). For Zr2lnX (X = C, N), the AU value of Zr2lnC is smaller than that of Zr2lnN. Because the AU value is proportional to the elastic anisotropy, the order of elastic anisotropy is Ti2lnN > Ti2lnC and Zr2lnN > Zr2lnC. It shows that Ti2lnC and Zr2lnC have better performance and lower possibility of microcracks.
Acomp is used to reflect the compressible anisotropy of the material. From the data in Table 4, it can be seen that the Acomp value of Ti2lnC is the largest (0.004%), indicating that it has the strongest elastic anisotropy. In addition, it can be seen from Ashear that Ti2lnN (0.006) and Zr2lnN (0.006) have the highest shear elastic anisotropy. Meanwhile, from the Ashear value, Ti2lnC (0.005) and Zr2lnC (0.004) have the lowest anisotropy of shear modulus. A1 denotes shear anisotropy in the (100) plane, A2 shear anisotropy in the (010) plane, and A3 shear anisotropy in the (001) plane. Table 4 shows the |A1 − 1| values of Ti2lnX (X = C, N) and Zr2lnX (X = C, N). Ti2lnN and Zr2lnN have the highest absolute values, respectively, indicating that the shear anisotropy is high. On the other hand, Ti2lnC and Zr2lnC have the lowest shear anisotropy on the (100) and (010) planes, respectively. The shear anisotropy results for A1 agree with those of Ashear. Therefore, the order of shear anisotropy is consistent with the order of elastic anisotropy. To sum up, the elastic anisotropy order of the M2InX system is Ti2InX > Zr2InX (X = C, N) and M2InN > M2InC (M = Ti, Zr).
Crystal orientation, or the arrangement of crystal atoms in distinct crystal planes and orientations, can also influence elastic anisotropy. As a result, the elastic modulus anisotropy of the M2InX phase is represented by the 3D surface structure using the following formula [36,37,38]:
1 B = ( S 11 + S 12 + S 13 ) ( S 11 + S 12 S 13 S 33 ) l 3 2
1 G = S 44 + [ ( S 11 S 12 ) 1 2 S 44 ] ( 1 l 3 2 ) + 2 ( S 11 + S 33 2 S 13 S 44 ) l 3 2 ( 1 l 3 2 )
1 E = S 11 ( 1 l 3 2 ) 2 + S 33 l 3 4 + ( 2 S 13 + S 44 ) l 3 2 ( 1 l 3 2 )
In this case, l3 represents the direction cosine.
Figure 6 and Figure 7 display the 3D surface structures of Ti2lnC, Ti2lnN, Zr2lnC, and Zr2lnN in terms of E, B, and G. Elastic isotropy may be described if the spherical 3D surface structure does not stray significantly from the sphere. Otherwise, it is anisotropic.
As can be seen from Figure 6 and Figure 7, for bulk modulus, the 3D views of Ti2lnC and Zr2lnC show significant compression along the c-axis, while the 3D views of Ti2lnN and Zr2lnN show significant compression along the a- and b-axes. Combined with the data analysis in Table 5, the B[100]/B[1] values of Ti2lnC, Zr2lnC, Ti2lnN, and Zr2lnN have a large deviation from 1, which can also indicate that the materials are anisotropic.
When the shear moduli of Ti2lnN and Zr2lnN are compared to those of a spherical shape, it is obvious that their shapes are considerably different. As a result, Ti2lnN and Zr2lnN shear moduli are anisotropic. Ti2lnN and Zr2lnN shear moduli also are anisotropic, and the anisotropy order is Ti2lnN > Ti2lnC and Zr2lnC > Zr2lnN. Ti2lnN has a substantially higher degree of shear anisotropy than Zr2lnN. At the same time, this conclusion is compatible with the previously reported order of percent shear anisotropy. When compared to bulk and shear modulus, Young’s modulus E considers both bulk modulus B and shear modulus G. The 3D plots of the Young’s modulus of M2InX (M = Ti, Zr and X = C, N) MAX phases are more compressible along the a- and b-axes than the c-axis, as shown in Figure 6 and Figure 7. Ti2lnN is more anisotropic than Ti2lnC, whereas Zr2lnN is more anisotropic than Zr2lnN.
The three-dimensional elastic modulus graph shows that Ti2lnN and Zr2lnN are elastically anisotropic, with Ti2lnN having more elastic anisotropy than Zr2lnN. This is consistent with the AU value results presented above.
To further illustrate the elastic anisotropy of M2InX (M = Ti, Zr and X = C, N) MAX phases, Figure 8 plots the 2D projections of the elastic modulus of the M2InX system on crystal planes (001) and (100), respectively. Based on Figure 8, Table 5 shows the elastic modulus of the M2InX phases. As can be shown in Table 5, the G[100]/G[1] values of Ti2lnC and Ti2lnN are 1.02 and 1.03, respectively, indicating that there is a divergence between G[100]/G[1] and 1, indicating that the material has a greater shear modulus and anisotropy. As a result, Ti2lnN has the largest shear modulus anisotropy, followed by Ti2lnC, showing that the order of anisotropy of G is Ti2lnN > Ti2lnC. Zr2lnC and Zr2lnN have G[100]/G[1] values of 1.03 and 1.05, respectively, showing that the anisotropic order of G is Zr2lnN > Zr2lnC. This is consistent with the results of A1 above.
The E[100]/E[1] values of Ti2lnC and Ti2lnN are 1.02 and 1.05, respectively, as shown in Table 5. Zr2lnC and Zr2lnN have E[100]/E[1] values of 1.02 and 1.04, respectively. As a result, the anisotropic order of E is Ti2lnN > Ti2lnC, Zr2lnN > Zr2lnC. This is consistent with the AU results.
The expected values of the bulk modulus along the [100] and [10] directions are significantly larger than those along the [1] direction. As shown in Table 5, the B[100]/B[1] values of Ti2lnC and Ti2lnN are 1.08 and 1.90, respectively. The B[100]/B[1] values of Zr2lnC and Zr2lnN are 1.03 and 1.04, respectively. It can be seen that Ti2lnN has the largest anisotropy, which can be clearly perceived in combination with the 2D diagram, showing that the compression ratio along the c-axis is smaller than the a-axis and b-axis compression [39,40].

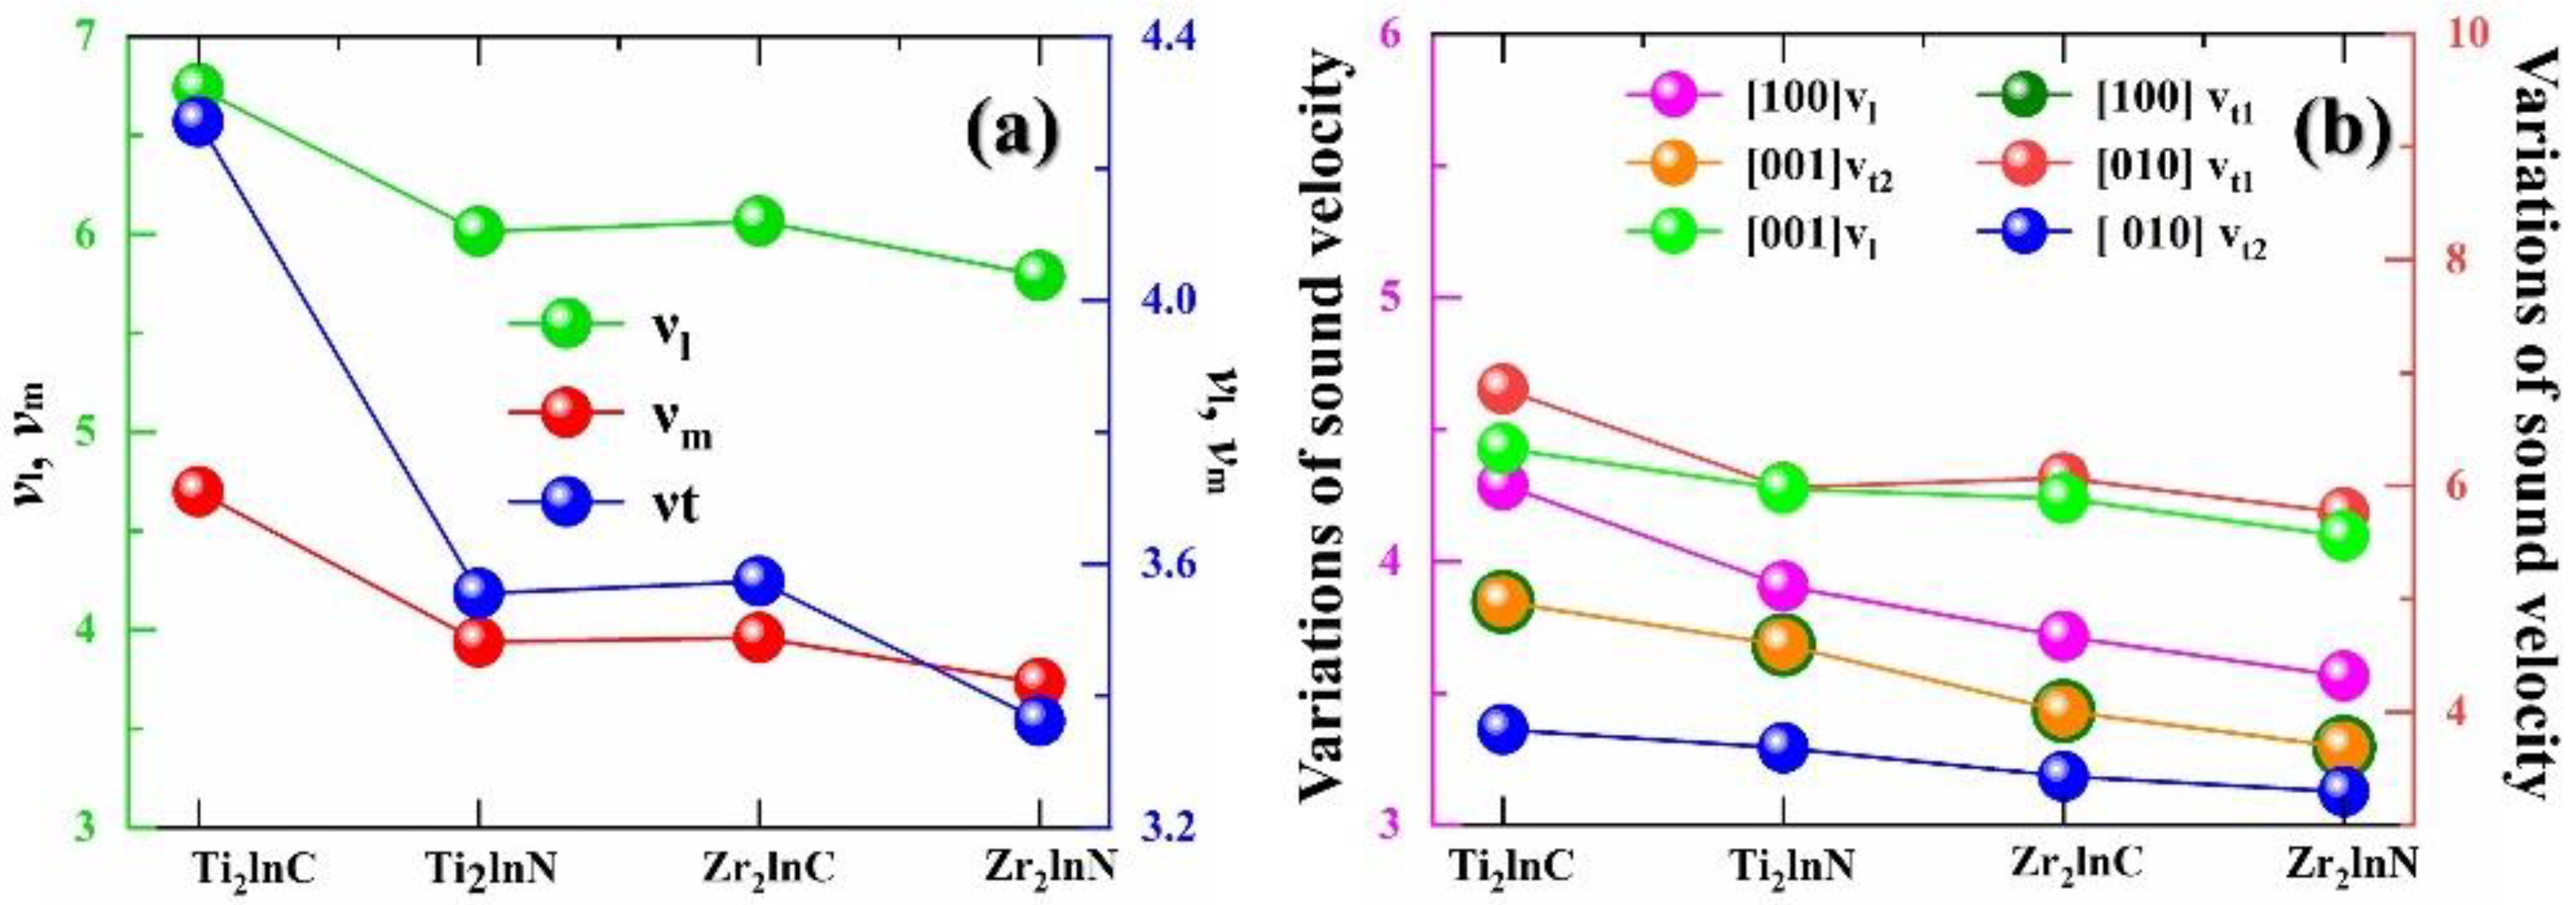
3.5. Debye Temperatures and Anisotropy of Sound Velocities

The Debye temperature ( θ D ) is a fundamental thermodynamic property of a solid. The Debye temperature is commonly used to characterize a material’s thermal properties, which may be computed using the single crystal elastic constant [41]:
θ D = h k B [ 3 n 4 π ( N A ρ Mc ) ] 1 3 v m
NA stands for Avogadro’s constant, kB is Boltzmann’s constant, and h is Planck’s constant. the total number of atoms in the unit cell is represented by n. M stands for molecular weight, ρ is density, and vm represents the average sound velocity, which is determined by the longitudinal and transverse sound velocities, as shown in the following equation [42,43]:
v l = [ ( B + 4 G 3 ) / ρ ] 1 2
v t = ( G ρ ) 1 2
v m = [ 1 3 ( 2 v t 3 + 1 v l 3 ) ] 1 3
Table 6 shows the calculated values of vl, vt, vm, and θD for the compounds. In general, the greater the density, the slower the sound speed. Due to the higher densities of Ti2lnN and Zr2lnN (6.389 g/cm3 for Ti2lnN and 7.302 g/cm3 for Zr2lnN), their sound velocities are relatively slow in Table 6.
Figure 9a shows the variation in different sound velocities. Ti2lnC has the highest Debye temperature due to its low density and high elastic modulus, and Zr2lnN has the lowest Debye temperature due to its high density and low elastic modulus. As we all know, the Debye temperature is commonly employed to reflect the strength of chemical bonds and the hardness of materials. As a result, the higher the Debye temperature, the stronger the chemical bond and the harder the solid.
It can be shown that Ti2lnC has the highest Debye temperature (564 K), suggesting that its chemical bond is the strongest, while Zr2lnN has the lowest (426 K), showing that its chemical bond is the weakest. At the same time, it can be demonstrated that Ti2lnC has the highest hardness and Zr2lnN has the lowest. This confirms the previous section’s conclusion about the materials’ strength and hardness based on the elastic constant.
In addition, there is a certain proportional relationship between Debye temperature and thermal conductivity, so the higher the Debye temperature of the material, the greater the thermal conductivity, which is consistent with the literature [44,45,46]. Therefore, Ti2lnC has the largest Debye temperature and thus exhibits the largest thermal conductivity.
The transverse sound velocity has two modes: vt1 (first transverse mode) and vt2 (second transverse mode). The directional sound velocity calculation results of M2InX phases are shown in Table 7. Table 7 shows that the first transverse sound velocity ([10]vt1) of the M2InX system along the [100] direction is the greatest, followed by the first longitudinal sound velocity ([1]vl). The directional sound velocity is well-known to be related to the elastic constants (C11, C33, C44). As a result, Figure 9b shows the relationship between the elastic constants of sound velocity in different directions for the M2InX phases. All sound speeds are obviously anisotropic in both Ti2lnX (X = C, N) and Zr2lnX (X = C, N) systems due to the shift in sound speed direction. It is also demonstrated that the link between sound speed and elastic constant is consistent. For example, the initial transverse sound velocity ([10]vt1) along the [100] direction is related to C11, for which the order is Ti2lnC > Zr2lnC > Ti2lnN > Zr2lnN. Similarly, the change trend of [1]v1 matches that of C33, and the change trend of [1]vt2, [100]vt1, and [10]vt2 matches that of C44. [100]vl is associated with C11-C12. Therefore, Figure 9b plots the relationship between different sound velocities for M2InX phases.

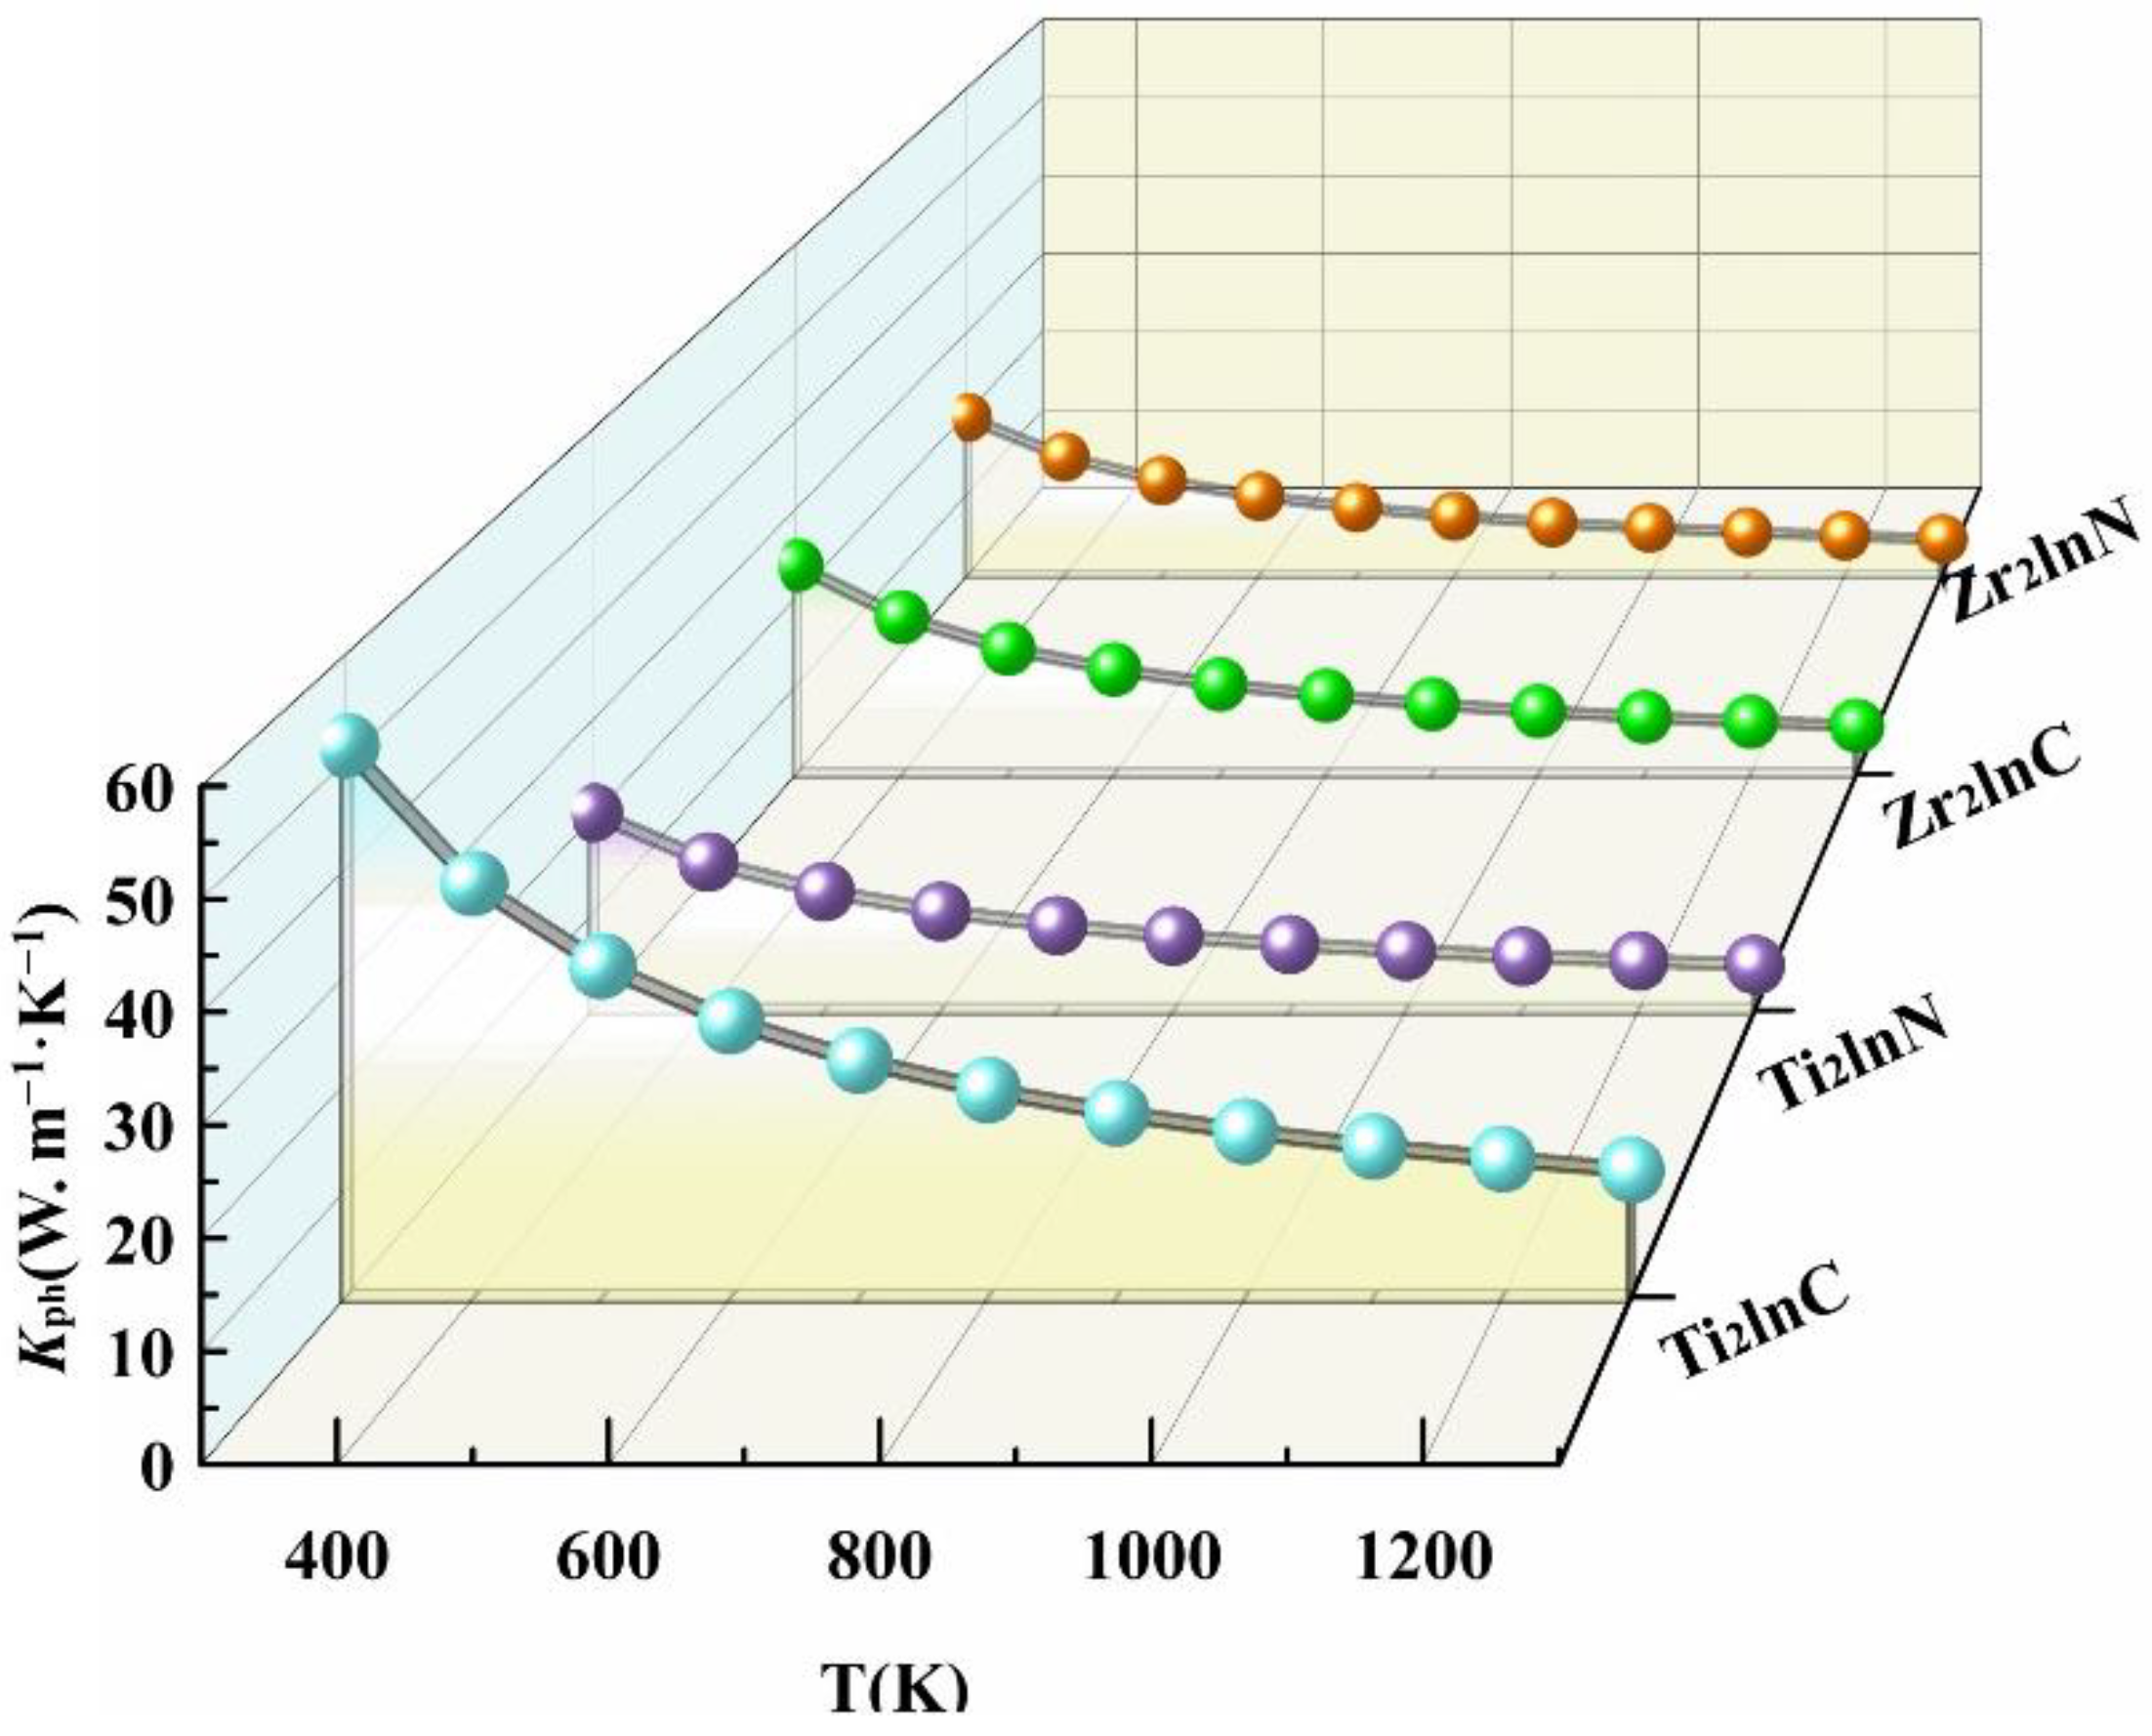
3.6. Thermal Properties

Generally speaking, the thermal properties of materials are usually characterized by thermal conductivity, heat capacity, and thermal expansion coefficient. Thermal conductivity is a measure of the thermal conductivity of a substance. The lattice thermal conductivity kph is one of the most important indicators to describe the thermal behavior of solids. Therefore, according to Slack’s model [47], the lattice thermal conductivity of M2InX phases can be calculated with the following empirical formula:
k ph = A M av δ θ D 3 γ 2 Tn 2 / 3
Here, the volume of each atom is denoted by δ3. The average atomic mass of each atom is denoted by Mav, T is the temperature, and n is the number of atoms in the unit cell. γ is the Grüneisen parameter that can be obtained from Poisson’s ratio v, while Aγ is the component associated with γ, and the formulas are as follows [48]:
γ = 3 ( 1 + v ) 2 ( 2 3 v )
A γ = 5.720 × 10 7 × 0.849 2 × ( 1 0.154 γ + 0.228 γ 2 )
The lattice thermal conductivities of Ti2lnC, Ti2lnN, Zr2lnC, and Zr2lnN at two temperatures (300 K and 1300 K) are shown in Table 8. The results show that most of the M2AX phases have thermal conductivities ranging from 12 to 60 W·m−1 [49]. The calculation result is within this range. The lattice thermal conductivities of Ti2lnC, Ti2lnN, Zr2lnC, and Zr2lnN at room temperature (300 K) are 51.48, 20.43, 23.59, and 19.42 W·m−1·K−1, respectively. Therefore, Ti2lnC, Ti2lnN, Zr2lnC, and Zr2lnN can serve as potential thermal conductive materials at room temperature. As shown in Figure 10, as the temperature increases, kph decreases rapidly and then tends to a limit value. In the temperature range of 300 K–1300 K, the order of kph is Ti2lnC > Zr2lnC > Ti2lnN > Zr2lnN.
The thermal conductivity is mainly derived from the lattice thermal conductivity at the ground state temperature. Therefore, the thermal conductivity reflection of ceramics can be characterized as the minimum thermal conductivity [50]. Consequently, the Clark model is used here to calculate the minimum thermal conductivity kmin of the M2InX system, and the expression is as follows:
k m i n = K B V m ( n ρ N A M ) 2 3
Table 8 shows the calculated minimum lattice thermal conductivities for the M2InX system. It can be seen from Table 8 that the kmin of M2InX are 1.23, 1.12, 0.96, and 0.94 W·m−1·K−1, respectively. The difference between the lattice thermal conductivity and θD is that the higher Debye temperature has a larger lattice thermal conductivity, so Ti2lnC has the largest thermal conductivity, which corresponds to the highest Debye temperature (564 K) of Ti2lnC. Furthermore, the calculated order of minimum thermal conductivity is Ti2lnC > Ti2lnN > Zr2lnC > Zr2lnN. As is known, M2InX phases are not potential high-temperature thermal barrier coatings when compared with Ln2Zr2O7 (1.2~1.4 W·M−1·K−1) [51]. The thermal conductivity of new ceramic materials is between 1.2 W·m−1·K−1–1.6 W·m−1·K−1. Among these compounds, the thermal conductivity of Ti2lnC is within this range, so Ti2lnC may become a potential insulating material [52].

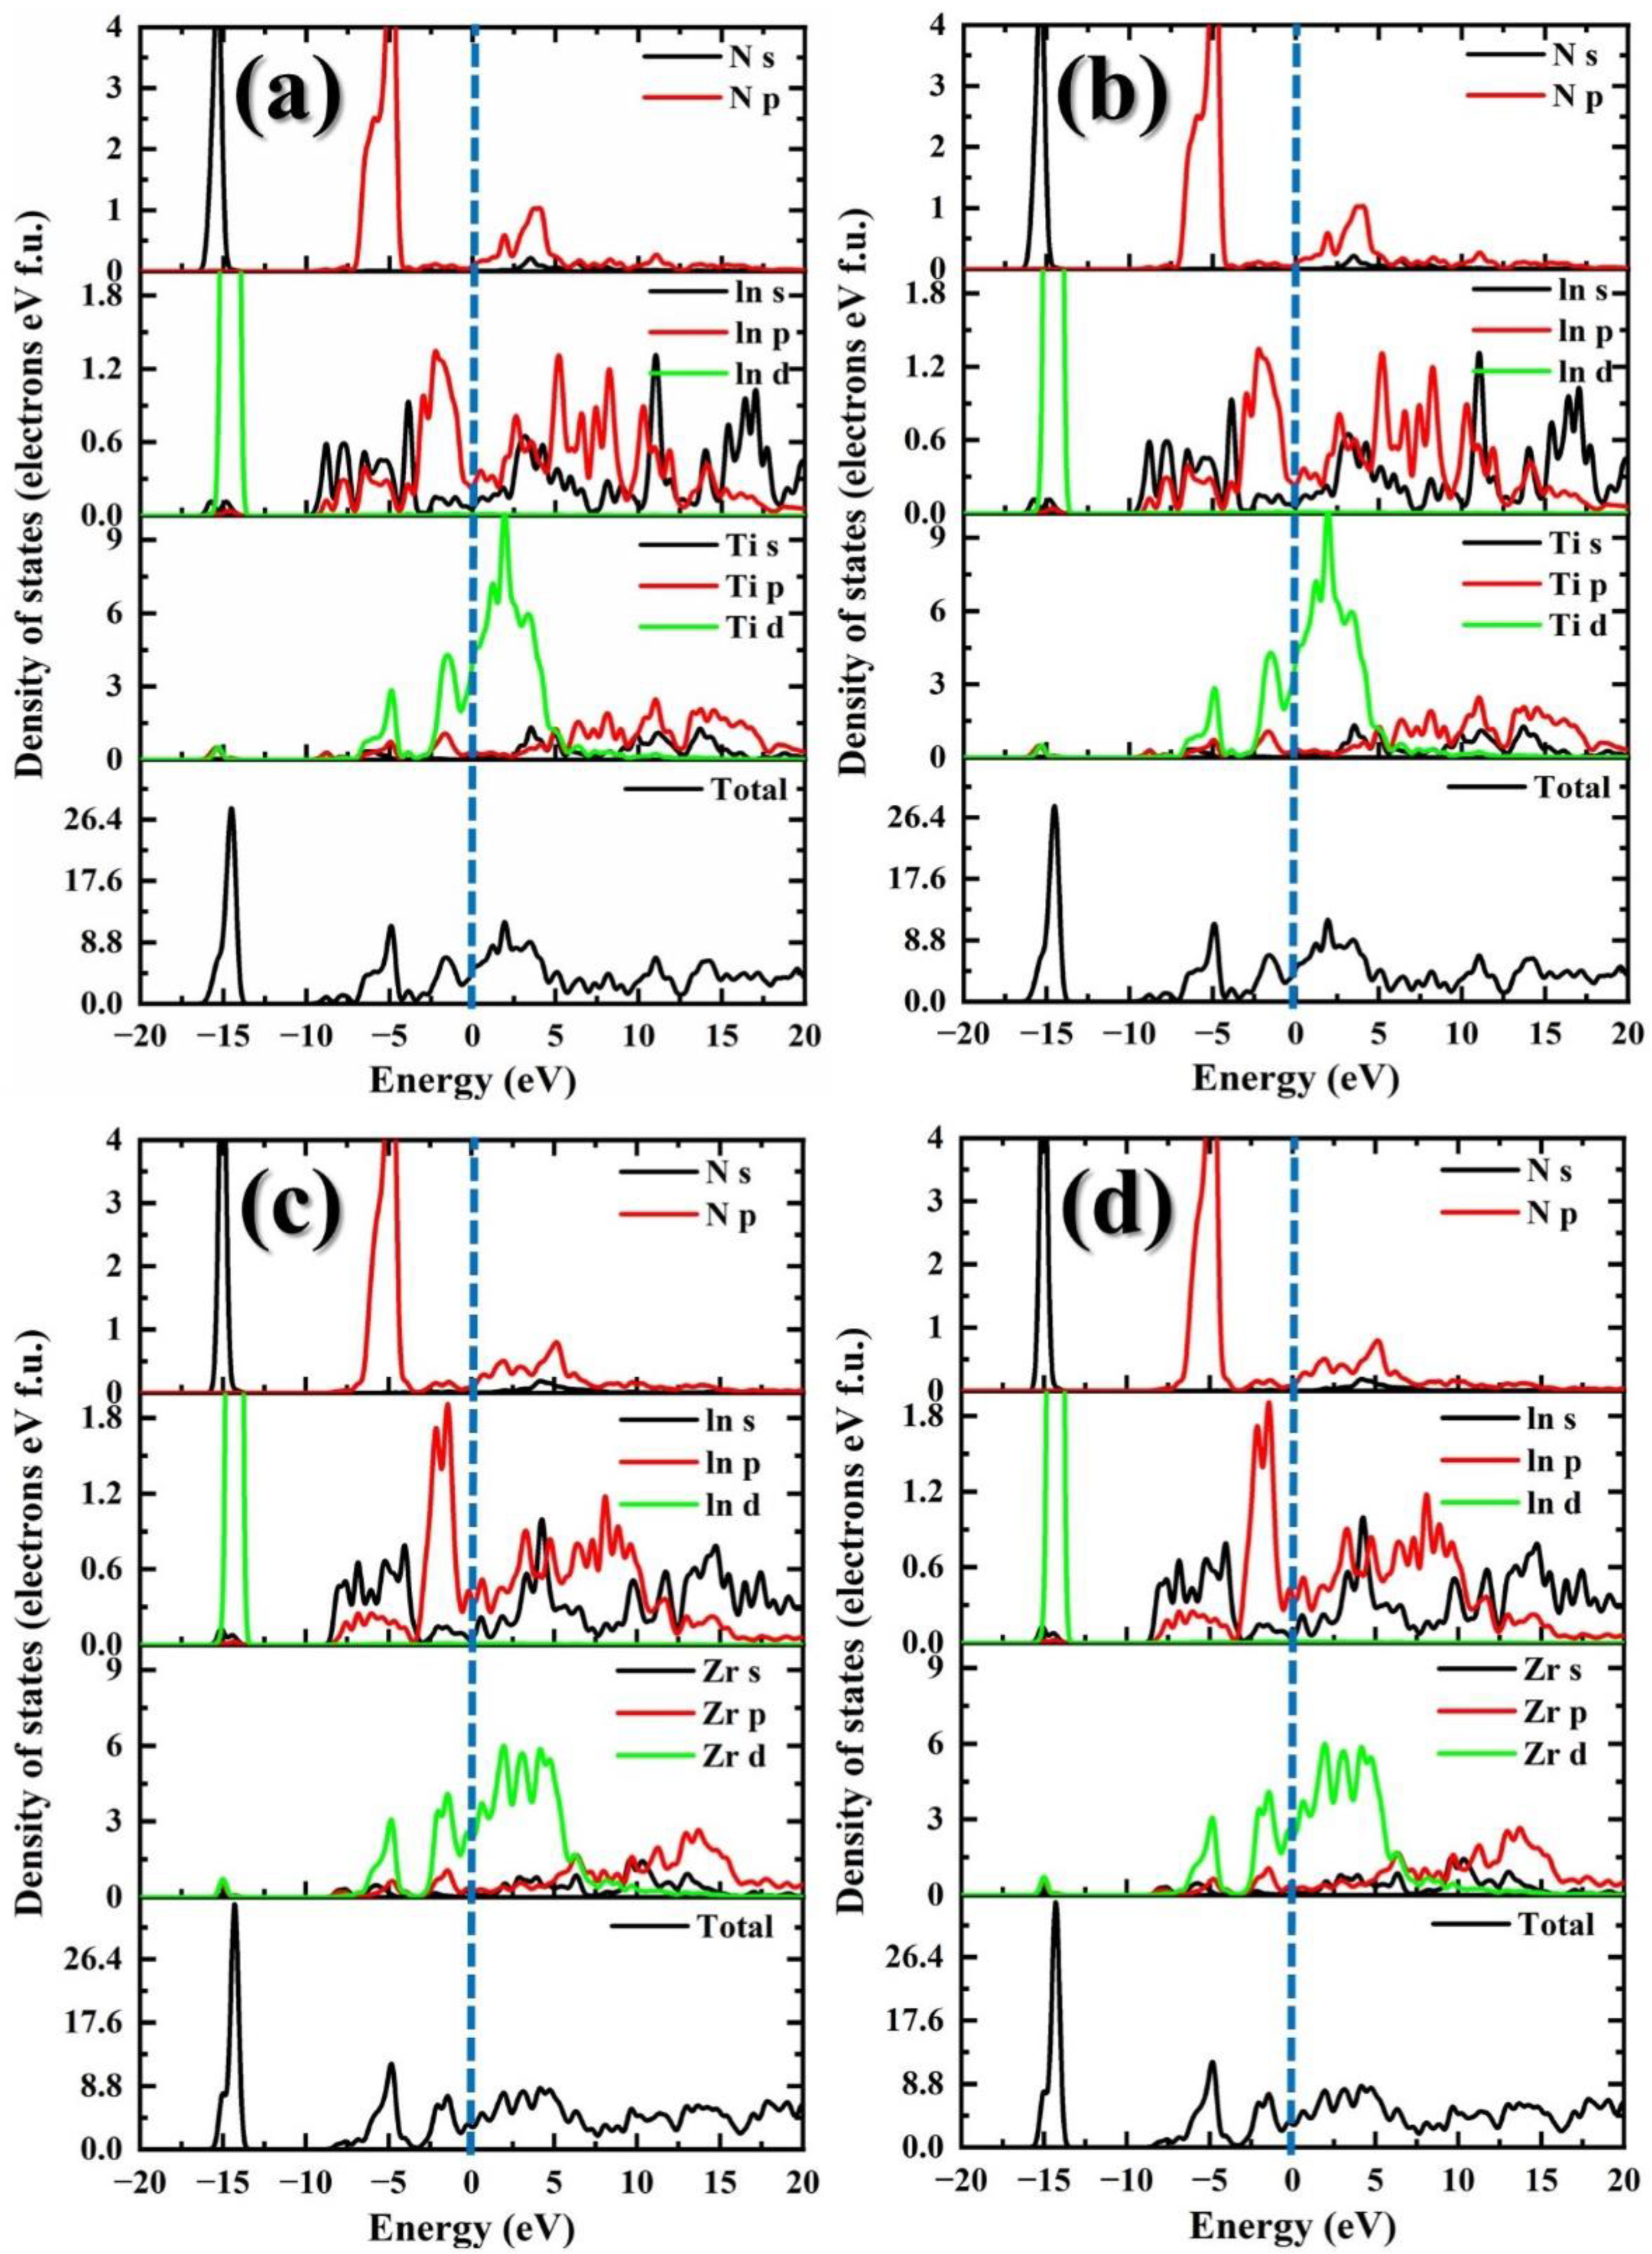
3.7. Electronic Properties

The electronic properties (density of states) of M2InX (M = Ti, Zr and X = C, N) MAX phases were studied to better understand chemical bonding and bond behaviors. Figure 11 depicts the M2InX phases’ total density of states (TDOS) and partial density of states (PDOS). To begin, it is clear that DOS has a significant finite value at the Fermi level, indicating that these compounds exhibit metallic conductivity. Figure 11 shows that the total density of states (Ef) value of Ti2InN and Zr2lnN is greater than that of Ti2InC and Zr2lnC, indicating that Ti2InN and Zr2lnN are more conductive than Ti2InC and Zr2lnC. Secondly, the peak topologies and relative heights of the peaks around Ef in the TDOS plot are highly comparable, indicating the presence of similar chemical bonds in Zr2AN. The time difference around the Fermi level is mostly made up of ln-p and M-d states. The time difference below the Fermi energy is caused mostly by the X-s, M-s, and M-p states, whereas the time difference above the Fermi energy is caused primarily by the ln-s and X-p states. As shown in Figure 11, the ln-p, M-d, and X-p states exhibit substantial hybridization, allowing M-C and M-N chemical bonds to form, resulting in the high elastic modulus of M2InX. PDOS exhibits multiple hybridizations of the electronic states M, ln, and X. The valence band of M2InX in Figure 11 displays substantial hybridization of the M-d and X-p states, as predicted for covalent compounds. The d-p hybrid state corresponding to the M-ln bond was discovered to be in a greater energy range than the M-X bond. As a result, the M-X d-p hybridization helps to maintain the crystal structure. Finally, it is demonstrated that M’s electronic charge density almost overlaps that of ln, indicating that the bonding between M and ln is quite weak. These findings are consistent with the observation that the biggest phase features very strong M-X bonds and very weak M-ln bonds.
As can be seen from Table 9, the M atom loses electrons, while the ln and X atoms gain electrons. Among them, for the Ti2InX system, the Ti-C bond has the largest BP value, indicating that the Ti-C bond has a strong chemical bond. Therefore, it is proved that Ti2lnC has the strongest chemical bond and Ti2lnN has the weakest chemical bond. For the Zr2InX system, it can also be stated that Zr2InC has the strongest chemical bond and Zr2InN has the weakest chemical bond. The M and X atoms form a strongly directed M-X covalent bond originating from the hybrid M d-X p state. These results are also consistent with the finding that the largest phase typically has very strong M-X bonds and relatively weak M-A bonds.

4. Conclusions

In summary, this work uses first-principles calculations to estimate the anisotropic elastic and thermal properties of M2InX (M = Ti, Zr and X = C, N) MAX phases. The structural properties and elastic constants of the obtained M2InX phases are in agreement with the results reported in the literature, the obtained data are quite reliable, and the M2InX phase’s mechanical stability has been studied. According to the elastic constants, Ti2lnC and Zr2lnC are more incompressible along the a- and b-axes, while Ti2lnN and Zr2lnN are more compressible along the a- and b-axes. For all M2InX phase materials, shear modulus is a better measure of hardness than bulk modulus. Therefore, Ti2lnC has high hardness and can be used to make superhard materials. The anisotropic elasticity of the M2InX phase is Ti2lnN > Ti2lnC, Zr2lnN > Zr2lnC, based on AU, Acomp, and Ashear values, 3D graphs, and 2D projection analysis. In addition, Ti2lnC has the highest speed of sound (4.697) and Debye temperature (564 K), while Zr2lnN has the lowest speed of sound (3.731) and Debye temperature (426 K). Meanwhile, Ti2lnC may become a potential insulation material. The electronic properties of the M2InX phase were investigated, and the presence of strong M-X d-p hybridization helps to maintain the crystal structure.

Author Contributions

Conceptualization, writing—review and editing, supervision, funding acquisition, Y.D.; data curation, M.P.; writing—original draft preparation, B.L.; visualization, L.S.; formal analysis, H.Q. All authors have read and agreed to the published version of the manuscript.

Funding

This research received no external funding or This research was funded by the Rare and Precious Metal Materials Genome Engineering Project of Yunnan Province (Y.D.: 202002AB080001), Yunnan Ten Thousand Talents Plan Young and Elite Talents Project (Y.D.: YNWR-QNBJ-2018-044) and the National Natural Science Foundation of China (M.P.: 51761023).

Institutional Review Board Statement

Not applicable.

Informed Consent Statement

Not applicable.

Data Availability Statement

Not applicable.

Conflicts of Interest

The authors declare no conflict of interest.

References

  1. Qian, X.K.; He, X.D.; Li, Y.B. Cyclic oxidation of Ti3AlC2 at 1000–1300 °C in air. Corros. Sci. 2011, 53, 290–295. [Google Scholar] [CrossRef]
  2. Lin, Z.J.; Li, M.S.; Wang, J.Y.; Zhou, Y.C. High-temperature oxidation and hot corrosion of Cr2AlC. Acta Mater. 2007, 55, 6182–6191. [Google Scholar] [CrossRef]
  3. Zhou, A.G.; Barsoum, M.W. Kinking nonlinear elastic deformation of Ti3AlC2, Ti2AlC, Ti3Al (C0.5, N0.5) 2 and Ti2Al (C0.5, N0.5). J. Alloys Compd. 2010, 498, 62–70. [Google Scholar] [CrossRef]
  4. Qian, X.; He, X.; Li, Y.; Sun, Y.; Zhu, C. Improving the Cyclic-Oxidation Resistance of Ti3AlC2 at 550 °C and 650 °C by Preoxidation at 1100 °C. Int. J. Appl. Ceram. Tec. 2010, 6, 760–765. [Google Scholar] [CrossRef]
  5. Eriksson, A.O.; Zhu, J.Q.; Ghafoor, N.; Jensen, J.; Greczynski, G.; Johansson, M.P.; Rosén, J. Ti–Si–C–N thin films grown by reactive arc evaporation from Ti3SiC2 cathodes. J. Mater. Res. 2011, 26, 874–881. [Google Scholar] [CrossRef] [Green Version]
  6. Zhu, H.P.; Qian, X.K.; Wu, H.Y.; Lei, J.; Song, Y.; He, X.; Zhou, Y. Cyclic Oxidation of Ternary Layered Ti2AlC at 600–1000 °C in Air. Int. J. Appl. Ceram. Tec. L. 2015, 12, 403–410. [Google Scholar] [CrossRef]
  7. Barsoum, M.W. The MN+1AXN phases: A new class of solids: Thermodynamically stable nanolaminates. Prog. Solid. State. Ch. 2000, 28, 201–281. [Google Scholar] [CrossRef]
  8. Eklund, P.; Beckers, M.; Jansson, U.; Högberg, H.; Hultman, L. The Mn+1AXn phases: Materials science and thin-film processing. Thin Solid Films 2010, 518, 1851–1878. [Google Scholar] [CrossRef] [Green Version]
  9. Qian, X.; Li, Y.; Sun, Y.; He, X.; Zhu, C. Cyclic oxidation behavior of TiC/Ti3AlC2 composites at 550–950 °C in air. J. Alloys Compd. 2010, 491, 386–390. [Google Scholar] [CrossRef]
  10. Whittle, K.R.; Blackford, M.G.; Aughterson, R.D.; Moricca, S.; Lumpkin, G.R.; Riley, D.P.; Zaluzec, N.J. Radiation tolerance of Mn+ 1AXn phases, Ti3AlC2 and Ti3SiC2. Acta Mater. 2010, 58, 4362. [Google Scholar] [CrossRef]
  11. Utili, M.; Agostini, M.; Coccoluto, G.; Lorenzini, E. Ti3SiC2 as a candidate material for lead cooled fast reactor. Nucl. Eng. Des. 2011, 241, 1295–1300. [Google Scholar] [CrossRef]
  12. Yang, Z.J.; Tang, L.; Guo, A.M.; Cheng, X.L.; Zhu, Z.H.; Yang, X.D. Origin of c-axis ultraincompressibility of Zr2InC above 70 GPa via first-principles. J. Appl. Phys. 2013, 114, 083506. [Google Scholar] [CrossRef]
  13. Bortolozo, A.D.; Serrano, G.; Serquis, A.; Rodrigues, D., Jr.; Santos, C.A.M.D.; Fisk, Z.; Machado, A.J.S. Superconductivity at 7.3 K in Ti2InN. Solid State Commun. 2010, 150, 1364–1366. [Google Scholar] [CrossRef] [Green Version]
  14. Sun, Z.M.; Music, D.; Ahuja, R.; Schneider, J.M. Theoretical investigation of the bonding and elastic properties of nanolayered ternary nitrides, Schneider. Phys. Rev. B 2005, 71, 193402. [Google Scholar] [CrossRef]
  15. Bao, L.; Qu, D.; Kong, Z.; Duan, Y. Predictions of structural, electronic, mechanical, and thermodynamic properties of TMBCs (TM= Ti, Zr, and Hf) ceramics. J. Am. Ceram. Soc. 2020, 103, 5232–5247. [Google Scholar] [CrossRef]
  16. Kohn, W.; Sham, L.J. Self-consistent equations including exchange and correlation effects. Phys. Rev. 1965, 140, 1133–1138. [Google Scholar] [CrossRef] [Green Version]
  17. Segall, M.D.; Lindan, P.J.D.; Probert, M.J.; Pichard, C.J.; Hasnip, P.J.; Clark, S.J.; Payne, M.C. First-principles simulation: Ideas, illustrations and the CASTEP code. J. Phys. Condens. Mater. 2002, 14, 2717–2744. [Google Scholar] [CrossRef]
  18. Pacheco-Kato, J.C.; del Campo, J.M.; Gázquez, J.L.; Trickey, S.B.; Vela, A. A PW91-like exchange with a simple analytical form. Chem. Phys. Lett. 2016, 651, 268–273. [Google Scholar] [CrossRef]
  19. Monkhorst, H.J.; Pack, J.D. Special points for Brillouin-zone integrations. Phys. Rev. B 1976, 13, 5188. [Google Scholar] [CrossRef]
  20. Vanderbilt, D. Soft self-consistent pseudopotentials in a generalized eigenvalue formalism. Phys. Rev. B 1990, 41, 7892. [Google Scholar] [CrossRef]
  21. Perdew, J.P.; Chevary, J.A.; Vosko, S.H.; Jackson, K.A.; Pederson, M.R.; Singh, D.J.; Fiolhais, C. Erratum: Atoms, molecules, solids, and surfaces: Applications of the generalized gradient approximation for exchange and correlation. Phys. Rev. B 1992, 46, 6671. [Google Scholar] [CrossRef] [PubMed]
  22. Barsoum, M.W.; Golczewski, J.; Seifert, H.J. Fabrication and electrical and thermal properties of Ti2InC, Hf2InC and (Ti, Hf)2InC. J. Alloys Compd. 2002, 340, 173–179. [Google Scholar] [CrossRef]
  23. Wu, H.; Qian, X.; Zhu, H. First-principles study of the structural, electronic and elastic properties of ternary Zr2AN (A = Ga, In and Tl). Comp. Mater. Sci. 2014, 84, 103–107. [Google Scholar] [CrossRef]
  24. Horlait, D.; Middleburgh, S.; Chroneos, A.; Lee, W.E. Synthesis and DFT investigation of new bismuth-containing MAX phases. Sci. Rep. 2016, 6, 18829. [Google Scholar] [CrossRef] [Green Version]
  25. Wang, X.; Bao, L.; Wang, Y.; Wu, Y.; Duan, Y.; Peng, M. Explorations of electronic, elastic and thermal properties of tetragonal TM4N3 (TM= V, Nb and Ta) nitrides. Mater. Today Commun. 2021, 26, 101723. [Google Scholar] [CrossRef]
  26. Karki, B.B.; Ackland, G.; Crian, J. Elastic instabilities in crystals from ab initio stress- strain relations. J. Phys. Condens. Matter 1997, 9, 8579–8589. [Google Scholar] [CrossRef] [Green Version]
  27. Shou, H.; Duan, Y. Anisotropic elasticity and thermal conductivities of (α, β, γ)-LiAlSi2O6 from the first-principles calculation. J. Alloys Compd. 2018, 756, 40–49. [Google Scholar] [CrossRef]
  28. Zhang, X.H.; Luo, X.G.; Han, J.C.; Li, J.P.; Han, W.B. Electronic structure, elasticity and hardness of diborides of zirconium and hafnium: First principles calculations. Comput. Mater. Sci. 2008, 4, 411–421. [Google Scholar] [CrossRef]
  29. Khazaei, M.; Arai, M.; Sasaki, T.; Estili, M.; Sakka, Y. Trends in electronic structures and structural properties of MAX phases: A first-principles study on M2AlC (M = Sc, Ti, Cr, Zr, Nb, Mo, Hf, or Ta), M2AlN, and hypothetical M2AlB phases. J. Phys. Condeens. Mat. 2014, 26, 505503. [Google Scholar] [CrossRef]
  30. Lapauw, T.; Lambrinou, K.; Cabioc’h, T.; Halim, J.; Lu, J.; Pesach, A.; Rivin, O.; Ozeri, O.; Caspi, E.N.; Hultman, L.; et al. Synthesis of the new MAX phase Zr2AlC. J. Eur. Ceram. Soc. 2016, 36, 1847–1853. [Google Scholar] [CrossRef] [Green Version]
  31. Medkour, Y.; Bouhemadou, A.; Roumili, A. Structural and electronic properties of M2InC (M = Ti, Zr, and Hf). Solid State Commun. 2008, 148, 459–463. [Google Scholar] [CrossRef]
  32. Ranganathan, S.I.; Ostoja-Starzewski, M. Universal elastic anisotropy index. Phys. Rev. Lett. 2008, 101, 055504. [Google Scholar] [CrossRef] [Green Version]
  33. Thomsen, L. Weak elastic anisotropy. Geophysics 1986, 51, 1954–1966. [Google Scholar] [CrossRef]
  34. Ravindran, P.; Fast, L.; Korzhavyi, P.A.; Johansson, B. Density functional theory for calculation of elastic properties of orthorhombic crystals: Application to TiSi2. J. Appl. Phys. 1998, 84, 4891–4904. [Google Scholar] [CrossRef]
  35. Ledbetter, M.H. Elastic properties of zinc: A compilation and a review. J. Phys. Chem. Ref. Data 1977, 6, 1181–1203. [Google Scholar] [CrossRef] [Green Version]
  36. Nye, J.F. Physical properties of crystals. Mater. Today 2007, 10, 53. [Google Scholar]
  37. Hearmon, R.F.S.; Maradudin, A.A. An introduction to applied anisotropic elasticity. Phys. Today 1961, 14, 48. [Google Scholar] [CrossRef]
  38. Li, B.; Duan, Y.; Peng, M. Theoretical insights on elastic anisotropy and thermal anisotropy of TM5Al3C (TM= Zr, Hf, and Ta) carbides. Vacuum 2022, 200, 110989. [Google Scholar] [CrossRef]
  39. Peng, M.; Wang, R.; Wu, Y. Elastic anisotropies, thermal conductivities and tensile properties of MAX phases Zr2AlC and Zr2AlN: A first-principles calculation. Vacuum 2022, 196, 110715. [Google Scholar] [CrossRef]
  40. Bao, W.; Liu, D.; Duan, Y. A first-principles prediction of anisotropic elasticity and thermal properties of potential superhard WB3. Ceram. Int. 2018, 44, 14053–14062. [Google Scholar] [CrossRef]
  41. Anderson, O.L. A simplified method for calculating the Debye temperature from elastic constants. J. Phys. Chem. Solid. 1963, 2490, 9–17. [Google Scholar] [CrossRef]
  42. Arab, F.; Sahraoui, F.A.; Haddadi, K.; Bouhemadou, A.; Louail, L. Phase stability, mechanical and thermodynamic properties of orthorhombic and trigonal MgSiN2: An ab initio study. Phase Transit. 2016, 89, 480–513. [Google Scholar] [CrossRef]
  43. Chen, S.; Sun, Y.; Duan, Y.H.; Huang, B.; Peng, M.J. Phase stability, structural and elastic properties of C15-type Laves transition-metal compounds MCo2 from first-principles calculations. J. Alloys Compd. 2015, 630, 202–208. [Google Scholar] [CrossRef]
  44. Benayad, N.; Rached, D.; Khenata, R. First principles study of the structural, elastic and electronic properties of Ti2InC and Ti2InN. Mod. Phys. Lett. B 2011, 25, 747–761. [Google Scholar] [CrossRef]
  45. Yang, Z.J.; Li, J.; Linghu, R.F.; Cheng, X.L.; Yang, X.D. First-principle investigations on the structural dynamics of Ti2GaN. J. Alloys Compd. 2013, 574, 573–579. [Google Scholar] [CrossRef]
  46. He, X.; Bai, Y.; Li, Y.; Zhu, C.; Li, M. Ab initio calculations for properties of MAX phases Ti2InC, Zr2InC, and Hf2InC. Solid State Commun. 2009, 149, 564–566. [Google Scholar] [CrossRef]
  47. Morelli, D.T.; Slack, G.A.; Shinde, S.L.; Goela, J.S. (Eds.) High Thermal Conductivity Materials; Springer: New York, NY, USA, 2006. [Google Scholar]
  48. Julian, C.L. Theory of heat conduction in rare-gas crystals. Phys. Rev. 1965, 137, A128. [Google Scholar] [CrossRef]
  49. Barsoum, M.W. MAX Phases: Properties of Machinable Ternary Carbides and Nitrides; John Wiley & Sons: Weinheim, Germany, 2013. [Google Scholar]
  50. Li, S.; Sun, W.; Luo, Y. Pushing the limit of thermal conductivity of MAX borides and MABs. J. Mater. Sci. Technol. 2021, 97, 87–106. [Google Scholar] [CrossRef]
  51. Feng, J.; Xiao, B.; Wan, C.L.; Qu, Z.X.; Huang, Z.C.; Chen, J.C.; Zhou, R.; Pan, W. Electronic structure, mechanical properties and thermal conductivity of Ln2Zr2O7 (ln = La, Pr, Nd, Sm, Eu and Gd) pyrochlore. Acta Mater. 2011, 59, 1742–1760. [Google Scholar] [CrossRef]
  52. Yang, A.; Bao, L.; Peng, M.; Duan, Y. Explorations of elastic anisotropies and thermal properties of the hexagonal TMSi2 (TM = Cr, Mo, W) silicides from first-principles calculations. Mater. Today Commun. 2021, 27, 102474. [Google Scholar] [CrossRef]
Figure 1. Crystal structure of M2InX (M = Ti, Zr and X = C, N) MAX phases: (a) three-dimensional view, (b) side view, (c) top view.
Metals 12 01111 g001
Figure 2. The cohesive energy Ec (in eV/atom) and formation enthalpy ∆Hf (in eV/atom) of M2InX (M = Ti, Zr and X = C, N) MAX phases.
Metals 12 01111 g002
Figure 3. The elastic constants Cij (in Gpa) of M2InX (M = Ti, Zr and X = C, N) MAX phases.
Metals 12 01111 g003
Figure 4. (a) Correlations between bulk modulus B (shear modulus G) and Young’s modulus (E) of M2InX (M = Ti, Zr and X = C, N) MAX phases; (b) Variations of GH/BH and ν of M2InX (M = Ti, Zr and X = C, N) MAX phases. In graph (a), the values of bulk modulus and shear modulus are multiplied by the factor of 2 for a better comparison with Young’s modulus.
Metals 12 01111 g004
Figure 5. Variations of AU and Ashear of M2InX (M = Ti, Zr and X = C, N) MAX phases.
Metals 12 01111 g005
Figure 6. Three-dimensional surface constructions of E (a,b), B (c,d) and G (e,f) of M2InX (M = Ti, Zr and X = C, N) MAX phases. The unit is GPa.
Metals 12 01111 g006
Figure 7. Three-dimensional surface constructions of E (a,b), B (c,d) and G (e,f) of Zr 2InX (X = C, N) MAX phases. The unit is GPa.
Metals 12 01111 g007
Figure 8. Projections of E (a,b), B (c,d) and G (e,f) of M2InX (M = Ti, Zr and X = C, N) MAX phases. The unit is GPa.
Metals 12 01111 g008
Figure 9. (a) Variations in sound velocity of M2InX (M = Ti, Zr and X = C, N) MAX phases; (b) Directional sound velocity of M2InX (M = Ti, Zr and X = C, N) MAX phases.
Metals 12 01111 g009
Figure 10. Lattice thermal conductivities kph of M2InX (M = Ti, Zr and X = C, N) MAX phases in the temperature range of 300 K–2000 K.
Metals 12 01111 g010
Figure 11. The calculated total and partial density of states for (a) Ti2InC, (b) Ti2InN, (c) Zr 2InC, and (d) Zr 2InN.
Metals 12 01111 g011
Table 1. The lattice parameters, cohesive energy Ec (in eV/atom), and formation enthalpy ∆Hf (in eV/atom) of M2InX (M = Ti, Zr and X = C, N) MAX phases.
Lattice Parameters (Å)V3)EcHfRef.
ac
Ti2lnC3.1514.18121.67−7.81−0.665This work
3.1414.17120.74 −0.669Exp. [22]
Ti2lnN3.1014.05116.76−8.02−0.667This work
−8.01 Exp. [13]
Zr2lnC3.3615.04147.47−8.30−0.690This work
3.3515.04146.62 Theo. [12]
3.34914.91144.8 Theo. [12]
3.35815.09147.437 Theo. [12]
Zr2AlC −0.40Theo. [24]
Zr2BiC −4.17Theo. [24]
Zr2lnN3.3114.92141.25−8.51−0.751This work
−8.12 Theo. [23]
Table 2. The elastic constants Cij (in GPa) of M2InX (M = Ti, Zr and X = C, N) MAX phases.
C11C33C44C66C12C13Ref.
Ti2lnC286244901126453This work
285243831116452Theo. [22]
Ti2lnN24922887875499This work
Zr2lnC25624182966496This work
25823783 6488Theo. [12]
Zr2lnN24222589835788This work
23719976 5582Theo. [23]
Table 3. Calculated bulk modulus B (in GPa), shear modulus G (in Gpa), Poisson’s ratio ν, and Young’s modulus E (in GPa) of M2InX (M = Ti, Zr and X = C, N) MAX phases.
BVBRBHGVGRGHBH/GHEνRef.
Ti2lnC128.2127.2127.7101.4100.5100.91.26239.50.187This work
Ti2lnN
Zr2lnC
Zr2lnN
127 232.040.176Theo. [31]
Ti2lnN123.4122.7123.178.677.882.71.5198.10.226This work
Ti2lnN
Zr2lnC
Zr2lnN
121.78 Theo. [13]
Zr2lnC137.4137.3137.489.588.5891.54216.10.217This work
Ti2lnN
Zr2lnC
Zr2lnN
126.03 Exp. [12]
Zr2lnN134.8134.8134.882.982.282.51.63205.70.245This work
Ti2lnN
Zr2lnC
Zr2lnN
134 79 196 Theo. [23]
Table 4. Calculated elastic anisotropic indexes (AU, Acomp, Ashear, A1, A2, A3) of M2InX (M = Ti, Zr and X = C, N) of MAX phases.
AUAcomp (%)Ashear (%) A1A2A3
Ti2lnC
Ti2lnN
Zr2lnC
Zr2lnN
0.0530.0040.0050.8510.8511.000
Ti2lnN
Ti2lnN
Zr2lnC
Zr2lnN
0.0590.0030.0061.6221.6221.000
Zr2lnC
Ti2lnN
Zr2lnC
Zr2lnN
0.0340.0010.0041.0721.0721.000
Zr2lnN
Ti2lnN
Zr2lnC
Zr2lnN
0.0430.0010.0061.2251.2251.000
Table 5. Calculated uniaxial elastic moduli in the [100], [10] and [1] directions (in GPa) of M2InX (M = Ti, Zr and X = C, N) MAX phases.
Ti2lnCTi2lnNZr2lnCZr2lnN
E[1]304205211174
[10]309216215174
[100]309216215180
[100]/[1]1.021.051.021.04
B[1]16086156163
[10]172163160170
[100]172163160170
[100]/[1]1.081.901.031.04
G[1]12211811280
[10]12512211584
[100]12512211584
[100]/[1]1.021.031.031.05
Table 6. The density ρ, sound velocities (longitudinal νl, transverse νt, and mean νm), and Debye temperature θD of M2InX (M = Ti, Zr and X = C, N) MAX phases.
TM5Al3Cρ (g/cm3)vl(km/s)vt (km/s)vm(km/s)θD (K)Ref.
Ti2lnC6.0796.7384.2714.697564This work
Ti2lnN6.3896.0133.5553.938480This work
Zr2lnC6.9496.0663.5733.960446This work
Zr2lnN7.3025.7913.3623.731426This work
5.7703.297 423Theo. [23]
Table 7. Anisotropic sound velocities (m/s) of M2InX (M = Ti, Zr and X = C, N) MAX phases.
[100] [1]
[100]vl[10]vt1[1]vt2[1]vl[100]vt1[10]vt2
Ti2lnC428968583846633138463846
Ti2lnN390659853683597436833683
Zr2lnC371560703431588834313431
Zr2lnN356457603295555532953295
Table 8. Calculated δ (in Å), Mav (in kg/mol), Grüneisen parameter γ, Aγ (×10−8), and lattice thermal conductivities kph (in W·m−1·K−1) of M2InX (M = Ti, Zr and X = C, N) MAX phases.
δMavγnAγkph (300 K)kph (1300 K)kmin
Ti2lnC2.4855.661.168.003.3451.4811.881.23
Ti2lnN2.4456.161.418.003.2420.434.721.12
Zr2lnC2.6077.311.438.003.2323.595.440.96
Zr2lnN2.6477.811.488.003.2119.424.480.94
Table 9. Calculated Mulliken charge and bond population (BP) analysis of M2InX (M = Ti, Zr and X = C, N) MAX phases.
AtomCharge NumberChargeBondBPLength(Å)
spdfTotal
Ti2lnCTi2.186.792.660.0011.620.38Ti-C1.042.12
In1.111.949.970.0013.02−0.02
C1.463.270.000.004.73−0.73
Ti2lnNTi2.196.772.690.0011.650.35Ti-N0.762.10
In1.051.979.970.0012.990.01
N1.684.040.000.005.71−0.71
Zr2lnCZr2.286.632.680.0011.590.41Zr-C1.062.30
In1.111.939.980.0013.02−0.02
C1.493.310.000.004.80−0.80
Zr2lnNZr2.306.632.720.0011.650.35Zr-N0.692.27
In1.031.929.970.0012.920.08
N1.704.070.000.005.77−0.77
Publisher’s Note: MDPI stays neutral with regard to jurisdictional claims in published maps and institutional affiliations.

