Article

Effect of Zn and Cu Addition on Microstructure and Mechanical Properties of Al-10wt%Mg Alloy

School of Materials Science and Engineering, Wuhan University of Technology, Wuhan 430070, China
*
Author to whom correspondence should be addressed.
Metals 2022, 12(6), 1037; https://doi.org/10.3390/met12061037
Submission received: 30 May 2022 / Revised: 14 June 2022 / Accepted: 15 June 2022 / Published: 17 June 2022

Abstract

:
5xxx series aluminum alloys have been widely used in automobiles, ships, aerospace and other fields for their low density, good corrosion resistance and weldability. The present study designs a new Al-10.0Mg-1.0Zn-0.15Cu (wt%) alloy with different composition from the traditional 5xxx series and 7xxx series aluminum alloys; the Zn/Mg ratio is below 1.0. Detailed characterization by scanning electron microscopy (SEM), X-ray diffraction analysis (XRD) and transmission electron microscopy (TEM) has been carried out to reveal the microstructural evolution. The results show that the addition of Zn and Cu inhibits the precipitation of the Al3Mg2 phase in the traditional Al-Mg binary alloy during annealing and promotes the precipitation of T-Mg32(Al,Zn)49 phase, which contributes to precipitation strengthening. After 75% rolling and 150 °C annealing, the T-Mg32(Al,Zn)49 phase precipitates and the alloy obtains good strength and plasticity coordination with 0.2% offset yield strength of 519 MPa and ultimate tensile strength of 653 MPa, accompanied by uniform elongation of 8.1%. The mechanisms underlying the improved strength and plasticity in the Al-10.0Mg-1.0Zn-0.15Cu (wt%) alloy are discussed.

1. Introduction

Energy conservation and green development are important principles to be followed in the research and development of the world. The popularity of the concepts of “carbon peaking” and “carbon neutralization” means that the global determination to deal with climate change and take the green low-carbon development path has driven the rapid development of the new-energy-vehicle industry. Coupled with the trend of sustainable development of lightweight vehicles, the demand for aluminum alloy has increased [1,2,3,4].
Aluminum alloy is widely used in industry because of its low density, high strength, good weldability, good formability and corrosion resistance [5]. Currently, aluminum alloys are widely used in the automotive and marine fields, which mainly include 2xxx, 5xxx and 7xxx series aluminum alloys. 2xxx series and 7xxx series aluminum alloys have high strength, but the former shows large welding-crack tendency and poor corrosion resistance, and the latter’s strength increases with the increase in Zn and Mg content, but its corrosion resistance decreases. Compared with these two series alloys, 5xxx series aluminum alloy has better corrosion resistance and weldability, and its comprehensive properties are relatively better, although the strength is relatively low.
The addition of different alloying elements displays different effects on the microstructure and mechanical properties of aluminum alloys. The addition of Mg significantly improves the solid-solution strengthening effect [6], but coarse Al3Mg2 phase is precipitated in the matrix with the increase in Mg content, which seriously affects the mechanical properties. The equilibrium Al3Mg2 phase is a face-centered cubic structure; the lattice parameter a = 2.824 nm; the orientation relationship between the Al3Mg2 phase and Al matrix is (111)β‖(001)α and [110]β‖[010]α. Mn [7] can partially be dissolved in the Al matrix to enhance solid-solution strengthening, or precipitate as the Al6Mn phase, which contributes to precipitation strengthening. Ti can significantly refine the alloy grain, obtain smaller grain size and improve the grain-boundary strengthening effect [8]. Rare-earth elements [9,10,11] such as Sc, Zr and Er can refine grains and improve grain-boundary strengthening. In addition, the Al3Sc, Al3Zr and Al3Er precipitated phase enhanced precipitation strengthening. According to the aluminum-alloy manual and aluminum-alloy phase diagram, the solid solubility of Zn, Cu, Li, Ag and other elements in the Al matrix is relatively large. However, the addition of Li and Ag could not form a single-phase solid solution after solution treatment, and some of the phase residues were still able to be detected. Current studies [12,13,14,15,16,17] show that the addition of Zn and Cu to Al-5Mg alloy can obtain a better precipitation-strengthening effect during annealing. 7xxx series aluminum alloy is a series of age-strengthened alloy with Zn, Mg and Cu as the main alloy elements, which precipitates the η-MgZn2, T-Mg32(Al,Zn)49 and S-Al2CuMg phase during aging [12,13,14]. Generally speaking, the Zn/Mg ratio in 7xxx aluminum alloy is higher than 2.0; the content of Zn element is higher than that of Mg; and Zn and Cu can also be dissolved in Al matrix. Therefore, different proportions of Zn, Mg and Cu can be added to 5xxx aluminum alloy to obtain a different Zn/Mg ratio from 7xxx aluminum alloy, so as to inhibit the precipitation of coarse Al3Mg2 phase or change the structure of the precipitated phase.
The T-Mg32(Al,Zn)49 phase is body-centered and cubic with a lattice constant of a = 1.461 nm for the equilibrium T phase, a = 1.435 nm for the metastable T″ phase, and a = 1.422 nm for the metastable T″ phase [14,15,16]. The orientation relations between matrix and precipitates are (110)T‖(110)Al and (110)T‖(010)Al for both T and T′ phases. The main composition of equilibrium T-Mg32(Al,Zn)49 phase is 37.5 at% Mg, 36.5 at% Al, and 26.0 at% Zn [13,14]. Currently, studies [18,19,20] show that the precipitation sequences of T-Mg32(Al,Zn)49 phase can be defined as SSSS → GP zone → intermediate phase η′ → equilibrium phase η → equilibrium T phase or SSSS → GP zone → intermediate phase T′ → equilibrium phase T-Mg32(Al,Zn)49. Previous studies [20] show that changing the Zn/Mg ratio can alter the type of precipitated phase; the smaller the Zn/Mg ratio, the more conductive to the precipitation of T-Mg32(Al,Zn)49 phase. Recent studies [17] reported new Al-5.1Mg-0.15Cu-XZn(X = 0, 1, 2, 3 wt%) alloy with low Zn/Mg ratio that is below 1.0. The relationship among age-hardening response behavior, clustering of Mg-Zn or Mg-Cu atoms and precipitation phases are investigated. According to the results, the Zn addition stimulates the precipitation of coherent T″ precipitates and suppresses S-Al2CuMg and Al3Mg2 phase. The age-hardening response of the alloy is enhanced and accelerated with Zn addition. After determining the added elements as Zn and Cu, a series of preliminary experiments was carried out for Al-10.0Mg-xZn-0.15Cu (x = 1, 2, 3 wt%) alloy. The results show that when the Zn content was higher than 1.0 wt%, the alloy could not achieve the complete solution effect, and some of the phase residues could still be detected. Therefore, the final alloy component is determined as Al-10.0Mg-1.0Zn-0.15Cu (wt%). After solution treatment, the alloy achieved good solution-treatment effect, forming a single-phase solid solution, which can better be carried out in the next deformation treatment.
The yield strength of binary Al-10Mg alloy that is 75% rolled at room temperature is 432 MPa and the tensile strength is 514 MPa. After annealing, the strength of Al-10Mg alloy decreases with the increase in annealing temperature. When the annealing temperature is raised to 150 °C, the X-ray diffraction results show that the solute Mg content decreases significantly, and the yield strength decreases to 291 MPa. Other studies [21] show that the Al3Mg2 phase precipitates at the grain boundary after the annealing temperature of Al-10Mg alloy reaches 200 °C. The higher the annealing temperature, the coarser the precipitated phase, which affects the strength of the alloy. Therefore, it is of great significance for the further development and application of high-Mg-content aluminum-alloy materials to explore how to further improve the strength of high-Mg-content Al-Mg alloy and prevent or avoid the precipitation of the Al3Mg2 phase during annealing treatment.
The aim of the present study is to design a new composition of Al-10.0Mg-1.0Zn-0.15Cu (wt%) alloy with lower Zn/Mg ratio compared with 5xxx and 7xxx series alloys. Further, possible inner mechanisms are investigated to explain the high strength and plasticity of the alloy and reveal the inhibition mechanism of Zn and Cu addition on Al3Mg2 phase. The precipitation evolution of the T-Mg32(Al,Zn)49 phase with increased annealing temperature is investigated via a combination of XRD and TEM techniques. The improvement of mechanical properties is discussed, as well as the mechanisms for the high strength and plasticity of the alloy.

2. Materials and Methods

The Al-10wt%Mg, Al-15wt%Mg, Al-50wt%Cu, Pure Zn (purity > 99.5 wt%) ingots were used to prepare Al-10.0Mg-1.0Zn-0.15Cu (wt%) alloy by vacuum melting. During vacuum melting, firstly, the furnace cavity was pumped to a vacuum degree of ~10−3 Pa, and then argon (purity > 99.9995%) was introduced for heating in argon-protected environment. The ingots were heated at 720 °C for 20 min in a graphite crucible, and then sprayed into the metal mold with a diameter of 40 mm and a height of 60 mm. The composition of alloy is Mg:9.75 wt%, Zn:1.06 wt%, Cu:0.16 wt%, Si:0.02 wt%, Fe:0.02 wt%, Mn:0.01 wt%, Al:Bal.
The process route adopted in this work is as follows: vacuum-melting alloy → cutting → solution treatment → rolling → annealing. As a pretreatment, solution treatment can improve the strength and plasticity of the alloy. Rolling deformation can accumulate high-density dislocations in the alloy through high-strain plastic deformation, and significantly refine the grains, so as to obtain the effects of dislocation strengthening and grain-boundary strengthening. However, after high-strain plastic deformation, high-density dislocations have accumulated in the grains, and the ability to continue to accommodate dislocations is weakened. The dislocations formed in the tensile process are attracted by the ultrafine grains and further accumulate at the grain boundary, resulting in necking and fracture under low strain, which shows that fracture occurs under low uniform elongation. Annealing treatment refers to holding the as-rolled alloy at low or high temperature for a certain time to release the internal stress of the alloy and improve the plasticity. After annealing treatment, the dislocation density decreases, the grain size grows, the strength decreases and the plasticity increases.
The solution-treatment temperature was determined by analyzing the Al-Mg binary-phase diagram and the Al-Mg-Zn ternary-phase diagram; the as-cast ingot was processed by solution treatment at 440 °C for 9 h and quenched in water quickly. The rolling was carried out on a small rolling mill with a roll size of 100 mm. Due to the limitations of the sample size of the rolling mill, an electric-spark wire-cutting machine (Beijing Ninghua Technology company, Beijing, China) was used to divide the ingots into sheet samples with uniform thickness (6 mm). Then, the ingots were rolled from 6 mm to 1.5 mm by several passes; the reduction ratio was about 75%. In order to obtain the work-hardening effect, the rolling process of this work was carried out at room temperature (25 °C). The as-rolled samples were long strips, with smooth surfaces, no obvious cracks and a few burrs at the edges. The as-rolled ingots were annealed at 100 °C, 150 °C and 200 °C for 1 h.
The microstructures of the as-rolled and as-annealed alloys were determined by FEI FEG Quanta 250 scanning electron microscope (SEM) (Thermo Fisher Scientific, Waltham, MA, USA) equipped with energy-dispersive X-ray spectroscopy. The TEM analysis was conducted by FEI Talos F200X transmission electron microscopy(TEM) (Thermo Fisher Scientific, Waltham, MA, USA) and high-resolution TEM(HRTEM), operated at 200 kV. The specimens for TEM analysis were prepared by mechanical grinding to 30–40 μm in thickness and twin-jet electropolishing to electron transparency in a solution of 30 vol% HNO3 and 70 vol% CH3OH at −30 °C. X-ray diffraction (XRD) analysis was performed on mechanically polished specimens in Bruker D8 Advance diffractometer (Bruker, Karlsruhe, Germany) using Cu Kα radiation with scanning rate of 2.0° per minute and 2θ (θ, Bragg angle) of 30–120°.
Tensile tests were performed at room temperature under an initial strain rate of 5 × 10 4   s 1 using an Instron-5966 Tester (Instron, Boston, MA, USA). The dog-bone-shaped specimens with a gauge length of 10 mm and a cross-section of 2.5 mm × 0.5 mm were used. The strains in the gauge sections were accurately measured using the equipped video extensometer. The fracture surfaces of the tensile specimens were also observed using the FEI FEG Quanta 250 SEM (Thermo Fisher Scientific, Waltham, MA, USA), operated at 20 kV.

3. Results

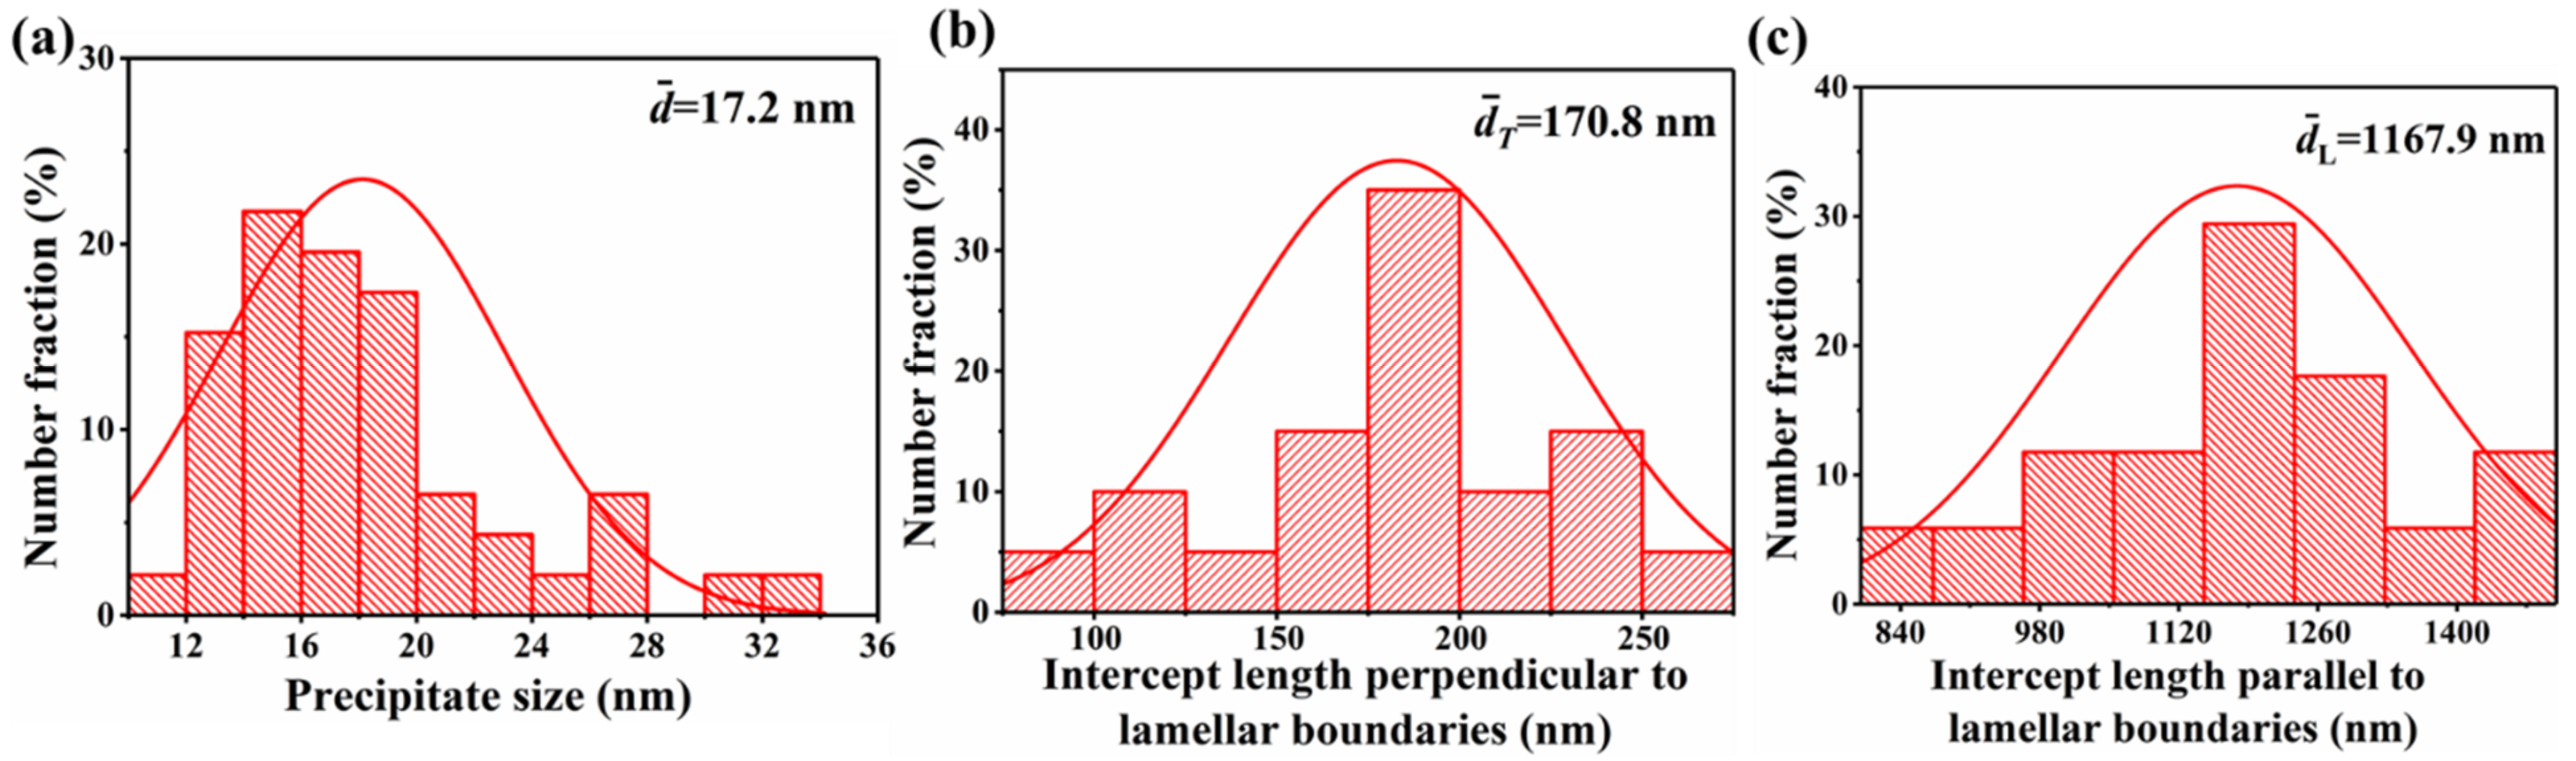
3.1. Microstructure Evolution

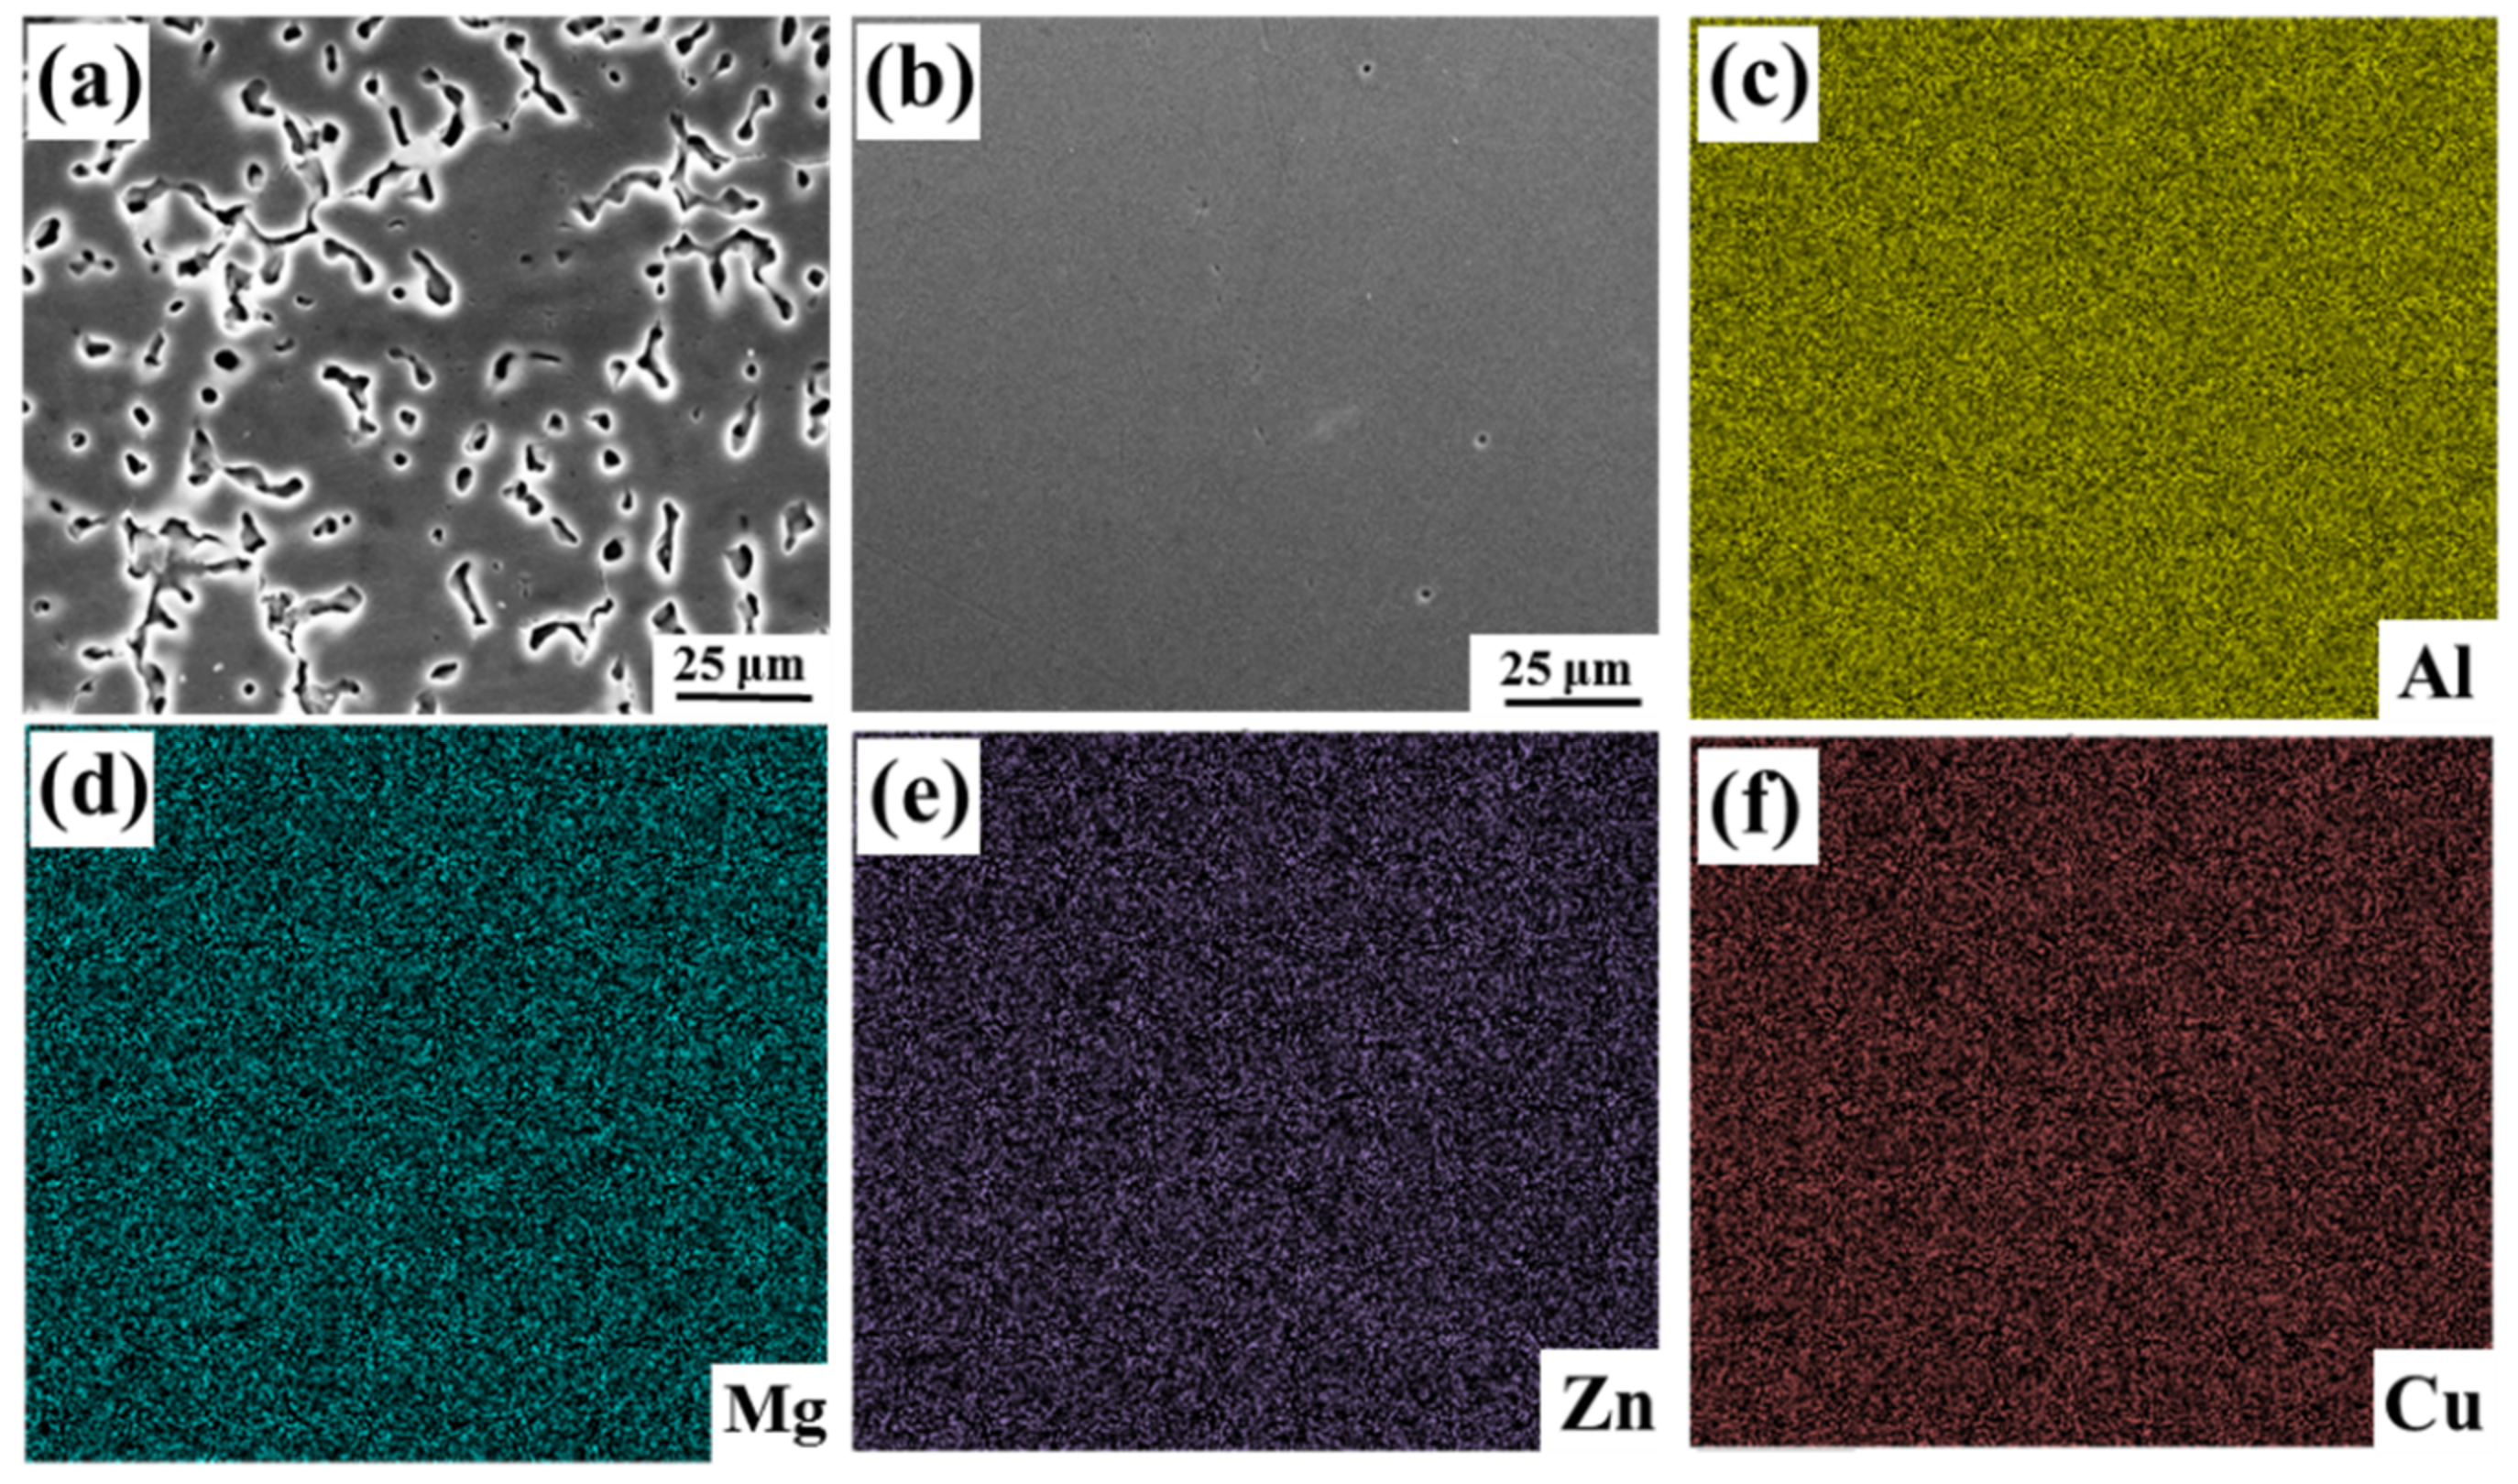
3.1.1. Microstructure of as-Cast and as-Homogenized Alloys

Figure 1 shows the SEM micrographs of the Al-10.0Mg-1.0Zn-0.15Cu (wt%) alloy and the corresponding mapping micrographs. The SEM secondary electron (SE) micrograph in Figure 1a displays the microstructure of as-cast alloy as typical dendritic structure, and the precipitates are short-chain, short-rod or island-like spherical particles, which are disorderly distributed in the Al matrix. During the tensile process, these second phases become the position of stress concentration, which seriously affects the properties of the alloy. After solution treatment, it can be seen from Figure 1b that the second phase in the original as-cast microstructure is completely eliminated; that is, it has been completely dissolved in the Al matrix. It can be seen that after homogenization at 440 °C for 9 h (Figure 1b–f), no obvious second-phase particle could be detected; the corresponding energy-dispersive spectroscopy (EDS) micrographs show that Mg, Zn and Cu elements are uniformly distributed in the Al matrix.

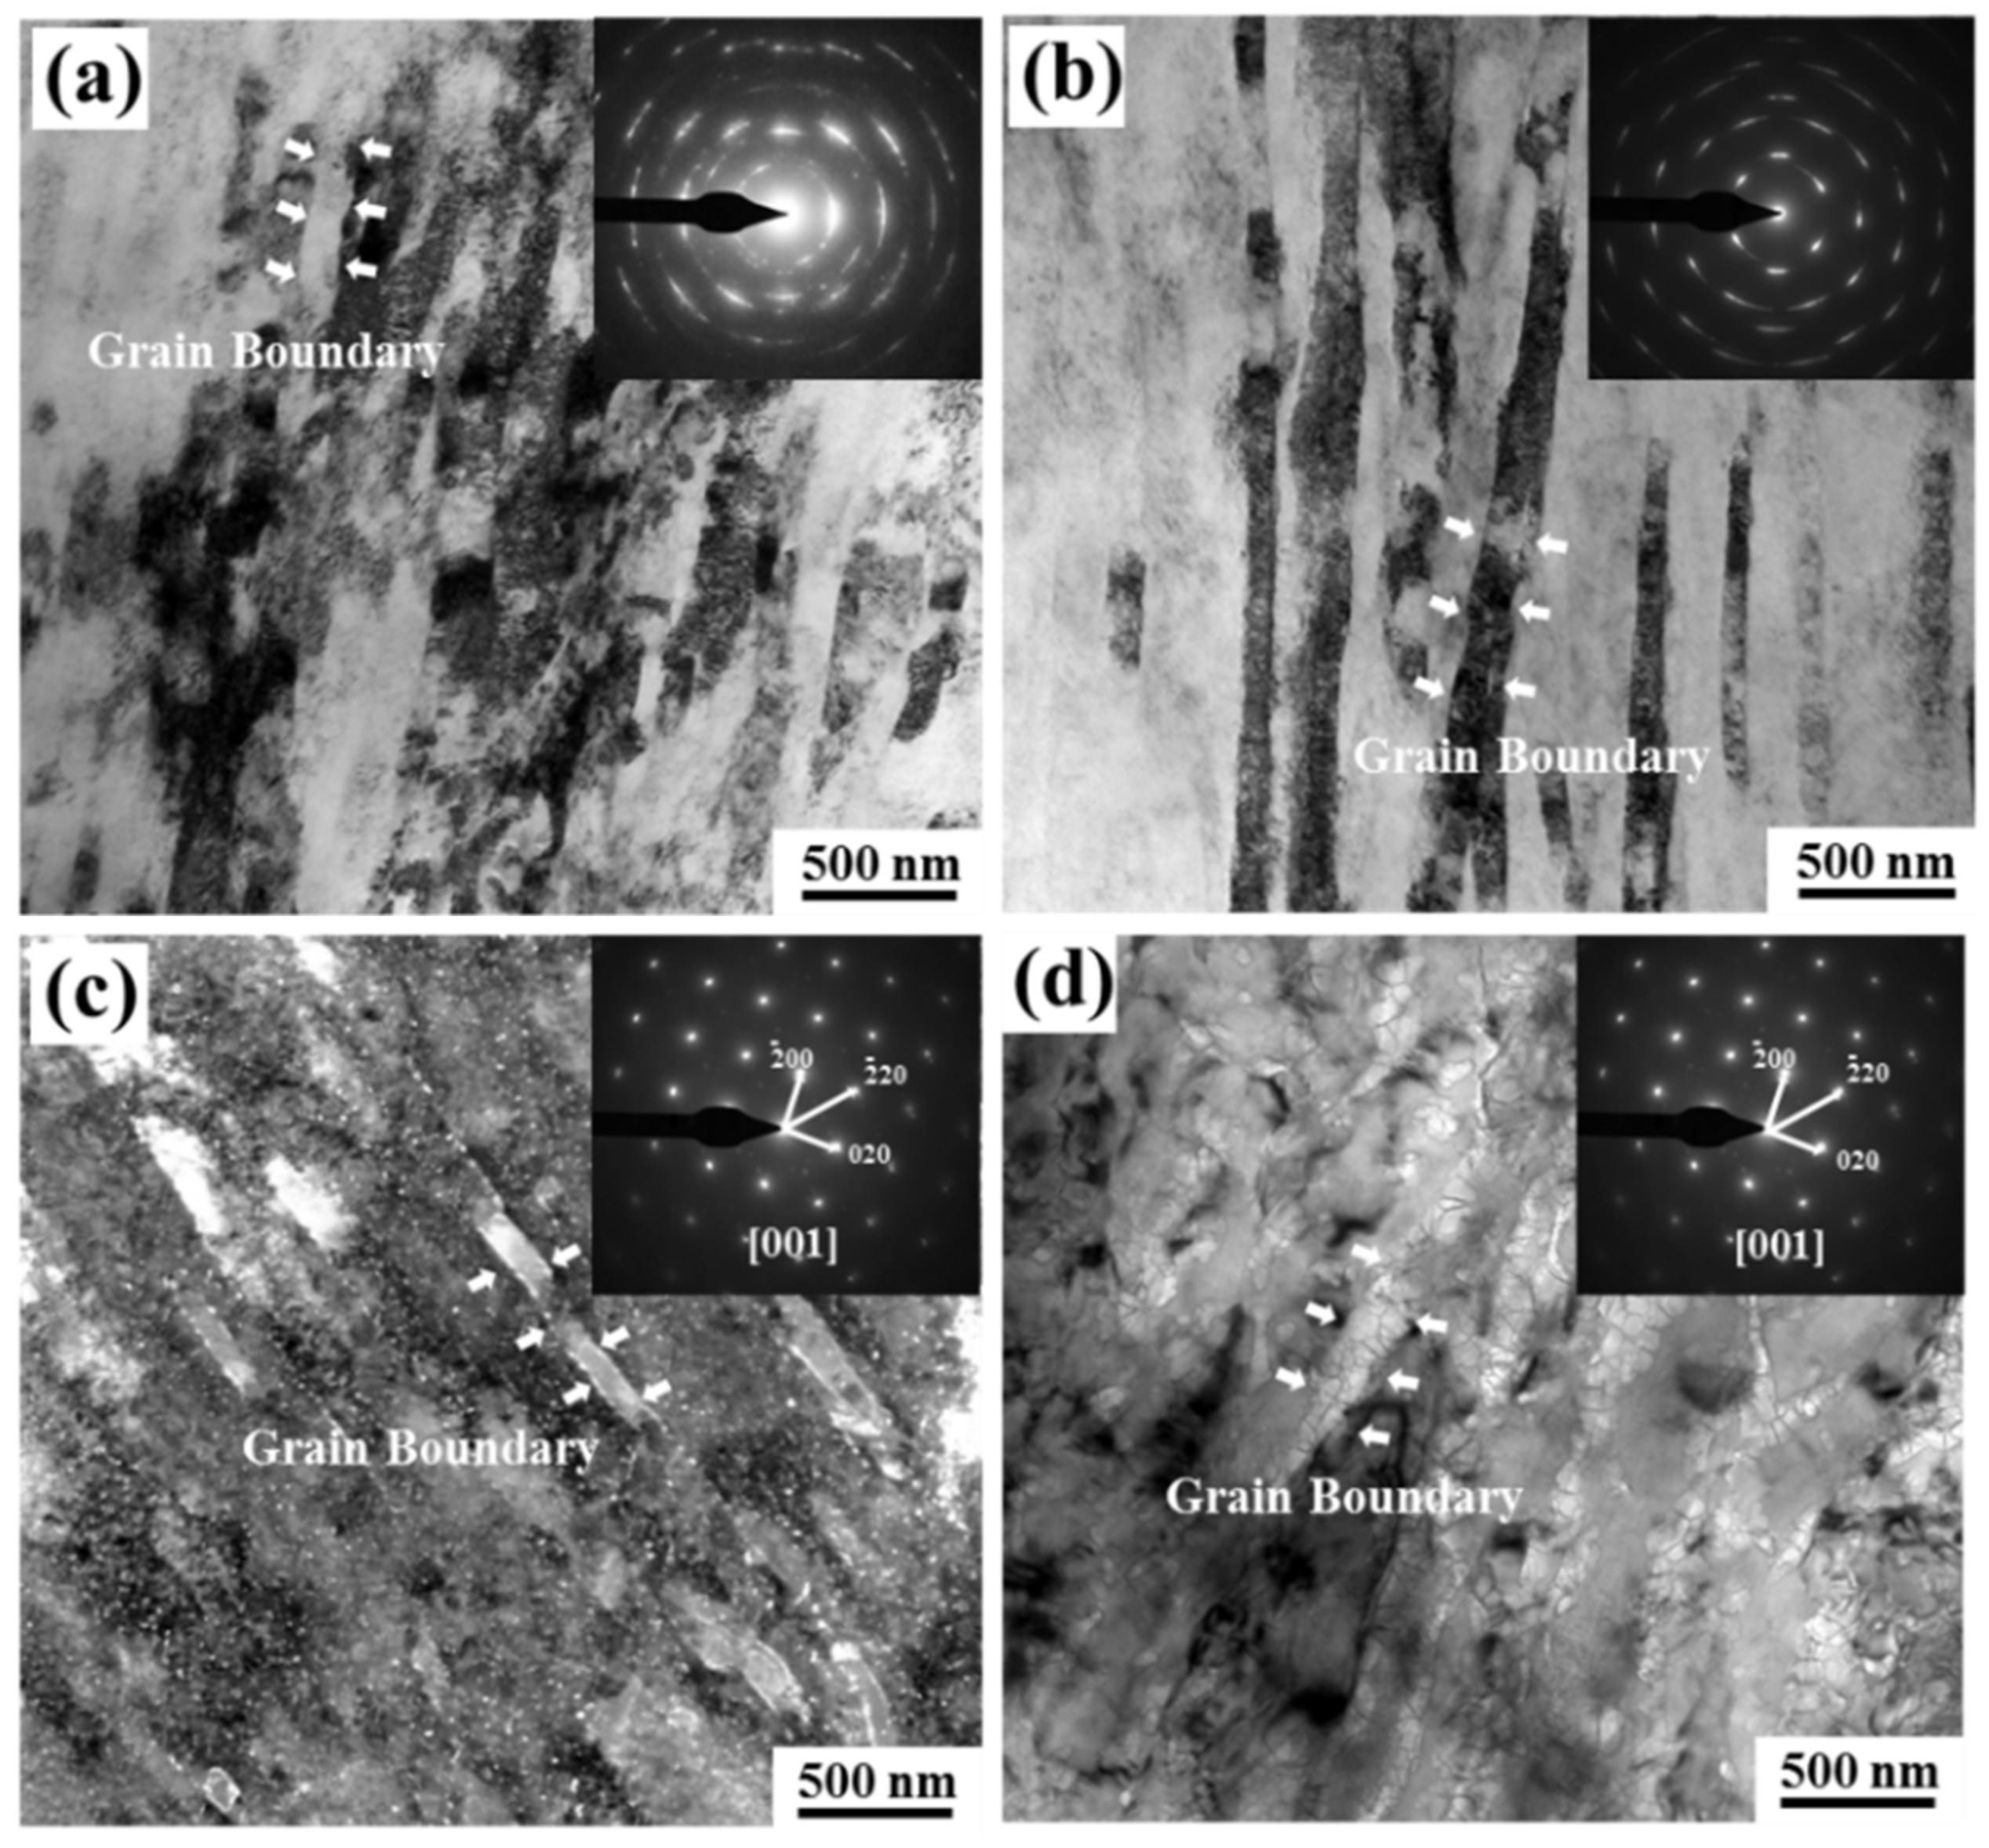
3.1.2. Microstructure of as-Rolled and as-Annealed Alloys
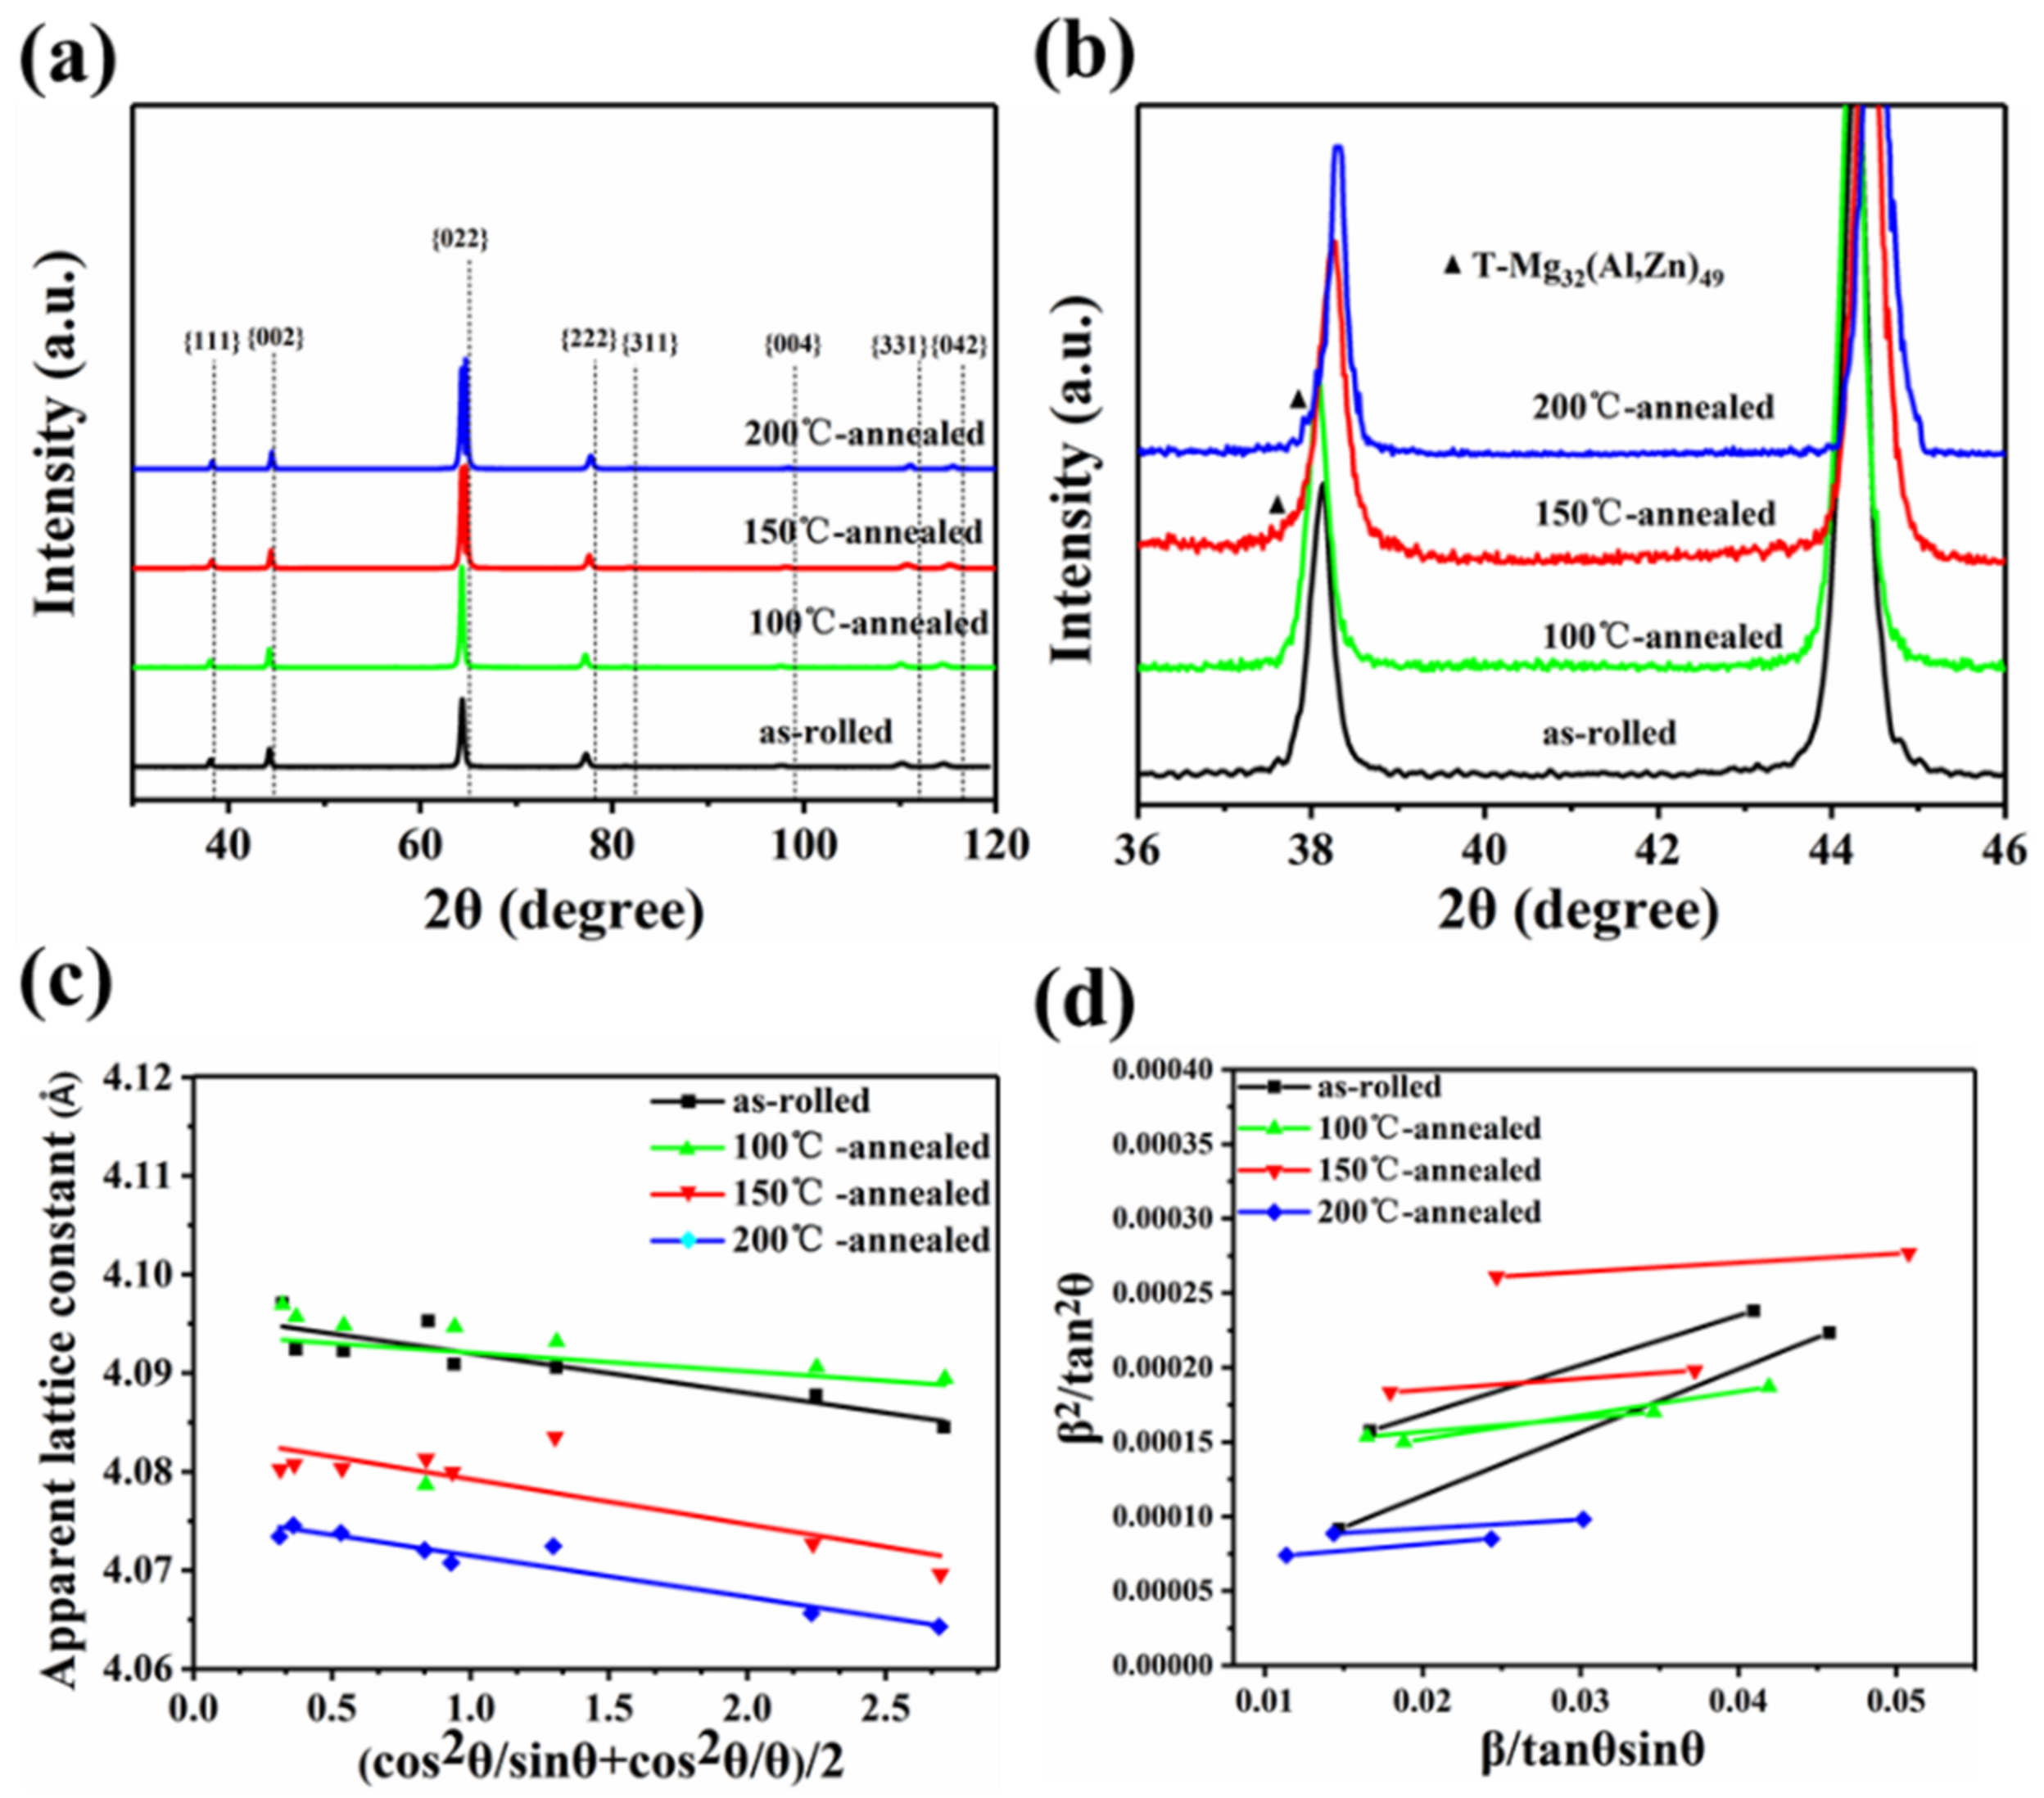
Figure 2 shows the TEM micrographs and corresponding selected area’s electron diffraction (SAED) patterns of as-rolled and as-annealed alloys, characterized by elongated nanoscale ultrafine grains containing a high density of dislocations. Figure 2a–d show the as-rolled, 100 °C-annealed, 150 °C-annealed and 200 °C-annealed alloy, respectively. It can be seen that the elongated grains coarsen gradually with the increase in annealing temperature. The SAED patterns of as-rolled alloy and 100 °C-annealed alloy are annular and no extra spot exists, which means that there is no second-phase precipitation in these two states. After annealing 150 °C, sphere-like precipitates are uniformly distributed in the matrix according with faint spots in the corresponding SAED pattern, seen in Figure 2c, these rod-like precipitates correspond to the T-Mg32(Al,Zn)49 phase (a = 1.461 nm). It should be noted that there is no Al3Mg2-phase precipitate at the grain boundary. When the annealing temperature rises to 200 °C, sphere-like precipitates coarsen and gather at the grain boundary, which worsen the mechanical properties of the alloy.
Figure 3 shows the representative bright-field (BF) image, dark-field (DF) image, high-resolution TEM (HRTEM) image and fast Fourier transform (FFT) image of 150 °C-annealed alloy. The most striking feature is the existence of sphere-like precipitates in Figure 3b. The T-Mg32(Al,Zn)49 phase is confirmed via the DF TEM image and SAED pattern shown in Figure 3b. Based on the significant spots in the corresponding SAED pattern and DF image, the sphere-like T-Mg32(Al,Zn)49 phase can be observed without the Al3Mg2 phase in 150 °C-annealed alloy. The HRTEM image shows the boundary between the Al matrix and T-Mg32(Al,Zn)49 phase; the corresponding FFT image is consistent with the SAED pattern, which proves that the precipitates are T-Mg32(Al,Zn)49 phase. Figure 4 displays the STEM image of 150 °C-annealed alloy and corresponding EDS results. From Figure 4b–f, it can be identified that Mg and Zn are enriched in the precipitates’ position in grains and at grain boundaries, which corresponds with the composition of the T-Mg32(Al,Zn)49 phase. No evidence for the Al3Mg2 phase is found in the images.
Figure 5 shows the average size of precipitated T-Mg32(Al,Zn)49 phase of the 150 °C-annealed alloy and the grain size in the vertical and parallel directions of the lamellar grains. It can be seen that the average size of the T-Mg32(Al,Zn)49 phase is 17.2 nm, the intercept length perpendicular to lamellar boundaries is 170.8 nm and the intercept length parallel to lamellar boundaries is 1167.9 nm. This will be used for the calculation of subsequent grain-boundary strengthening and precipitation strengthening.

3.2. XRD Results

Figure 6a shows the XRD patterns of Al-10.0Mg-1.0Zn-0.15Cu (wt%) alloy of as-rolled and as-annealed states; Figure 6b is a local amplification of Figure 6a. It can be seen that there is no characteristic peak of precipitated phase around the characteristic peak of as-rolled and 100 °C-annealed alloys, meaning that there is no second-phase precipitation in these two states. Under 150 °C and 200 °C annealing states, there is a weak characteristic peak of the second phase around the first Al matrix characteristic peak. Combined with the aforementioned analysis of the microstructure and SAED pattern, it can be identified that the precipitated phase is the T-Mg32(Al,Zn)49 phase.
The lattice constants of the Al matrix are determined by extrapolating the Nelson–Riley function [22], (cos2θ/sinθ + cos2θ/θ)/2 = 0 in the straight lines obtained by fitting apparent lattice constants a(θ) vs. (cos2θ/sinθ + cos2θ/θ)/2. Based on an increase by 0.0046 Å in lattice constant per 1 at% of Mg solute in Al-Mg alloys and lattice constant 4.0495 Å of pure Al [23], the Mg solute concentrations can be estimated (Table 1), showing increased Mg solid solubility in the Al-10.0Mg-1.0Zn-0.15Cu (wt%) alloy. The lattice constants of the as-rolled and annealed at 100–200 °C Al-10.0Mg-1.0Zn-0.15Cu (wt%) alloy are 4.096 Å, 4.094 Å, 4.084 Å and 4.076 Å, respectively.
The XRD patterns can also be used to calculate the dislocation density of the as-rolled and as-annealed Al-10.0Mg-1.0Zn-0.15Cu (wt%) alloys. Based on XRD peak broadening, the microstrains ε x 2 1 / 2 and the crystalline sizes (D) can be evaluated by [24]: β 2 tan 2 θ = λ D β / tan θ sin θ + 16 ε x 2 , where β is the integral breadth corresponding to Bragg angle θ after subtraction of instrumental broadening, and λ is the X-ray wavelength. As shown in Figure 6d, β2/tan2θ as a function of β/tanθsinθ is plotted for the {111}–{222} and {200}–{400} diffraction-peak pairs to calculate ε x 2 1 / 2 and D along <111> and <100> directions, due to the presence of crystallographic texture in these as-rolled and as-annealed alloys. Then, the dislocation densities (ρ) can be evaluated by [25]: ρ = 2 3 ε x 2 1 / 2 / b D , where b is the dislocation Burgers vector. The arithmetic average values of dislocation densities corresponding to {111}–{222} and {200}–{400} diffraction-peak pairs are taken as the overall dislocation densities (Table 1), showing the following order of dislocation density.

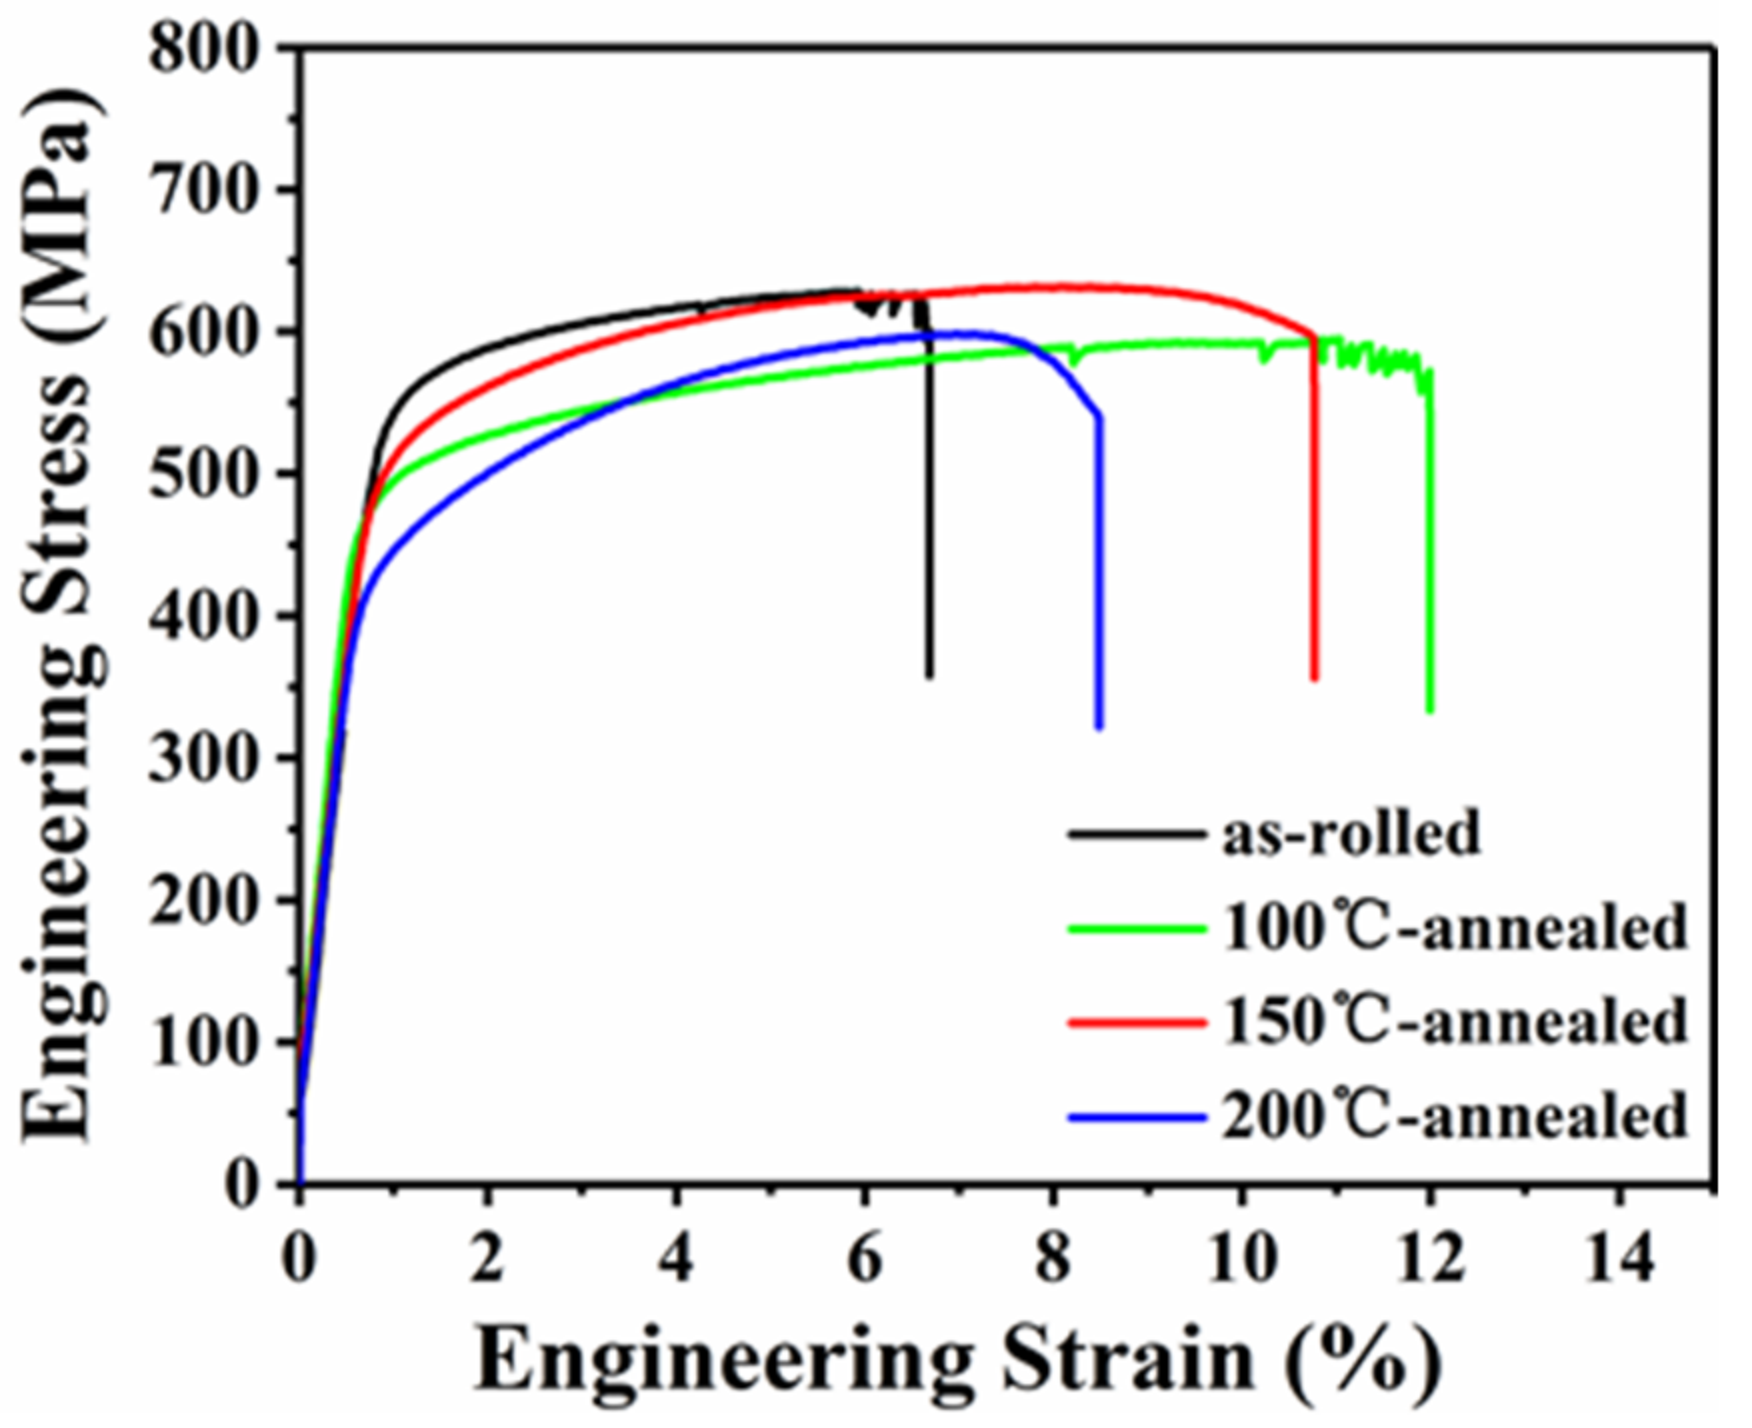
3.3. Mechanical Property

Figure 7 shows typical engineering stress–strain curves of Al-10.0Mg-1.0Zn-0.15Cu (wt%) alloy. Table 2 summarizes the corresponding mechanical properties. Previous studies show that the Al-10Mg binary alloy obtains a yield strength of 432 MPa and ultimate tensile strength of 514 MPa after 75% rolling at room temperature. After annealing, the strength of the alloy gradually decreases with the increase in annealing temperature. The higher the annealing temperature, the greater the decrease in strength. After annealing at 150 °C, the yield strength was reduced to 291 MPa and the tensile strength was 453 MPa. However, as shown in Table 2, the as-rolled Al-10.0Mg-1.0Zn-0.15Cu (wt%) alloy obtained the maximum 0.2% offset yield strength of 536 MPa and ultimate tensile strength of 618 MPa, accompanied by uniform elongation of 6.3%. After annealing at 100 °C, the strength of the alloy decreases and the elongation increased. However, when annealed at 150 °C, the strength of the alloy increased; the 0.2% offset yield strength was 519 MPa and ultimate tensile strength was 653 MPa, accompanied by uniform elongation of 8.1%; the alloy achieves good combination of strength and plasticity. After annealing at 200 °C, the strength of the alloy decreased sharply, the 0.2% offset yield strength decreased to 424 MPa, ultimate tensile strength decreased to 597 MPa, accompanied by uniform elongation decreasing to 7%.
Figure 8 displays the fracture surfaces of as-rolled and as-annealed Al-10.0Mg-1.0Zn-0.15Cu (wt%) alloys. Figure 8a shows that the dimples are small and shallow in the as-rolled alloy, and most of the dimple edges are not smooth, which is consistent with its poor plasticity (low uniform elongation). After annealing at 100 °C, the alloy obtains the best uniform elongation of 11.0%, and the fracture surface presents large and deep dimples, which is consistent with its good plasticity (higher elongation). As the annealing temperature increased to 150 °C and 200 °C, the dimples turned to smaller and shallower compared with the large and deep dimples annealed at 100 °C, which is consistent with the decreasing trend of uniform elongation.

4. Discussion

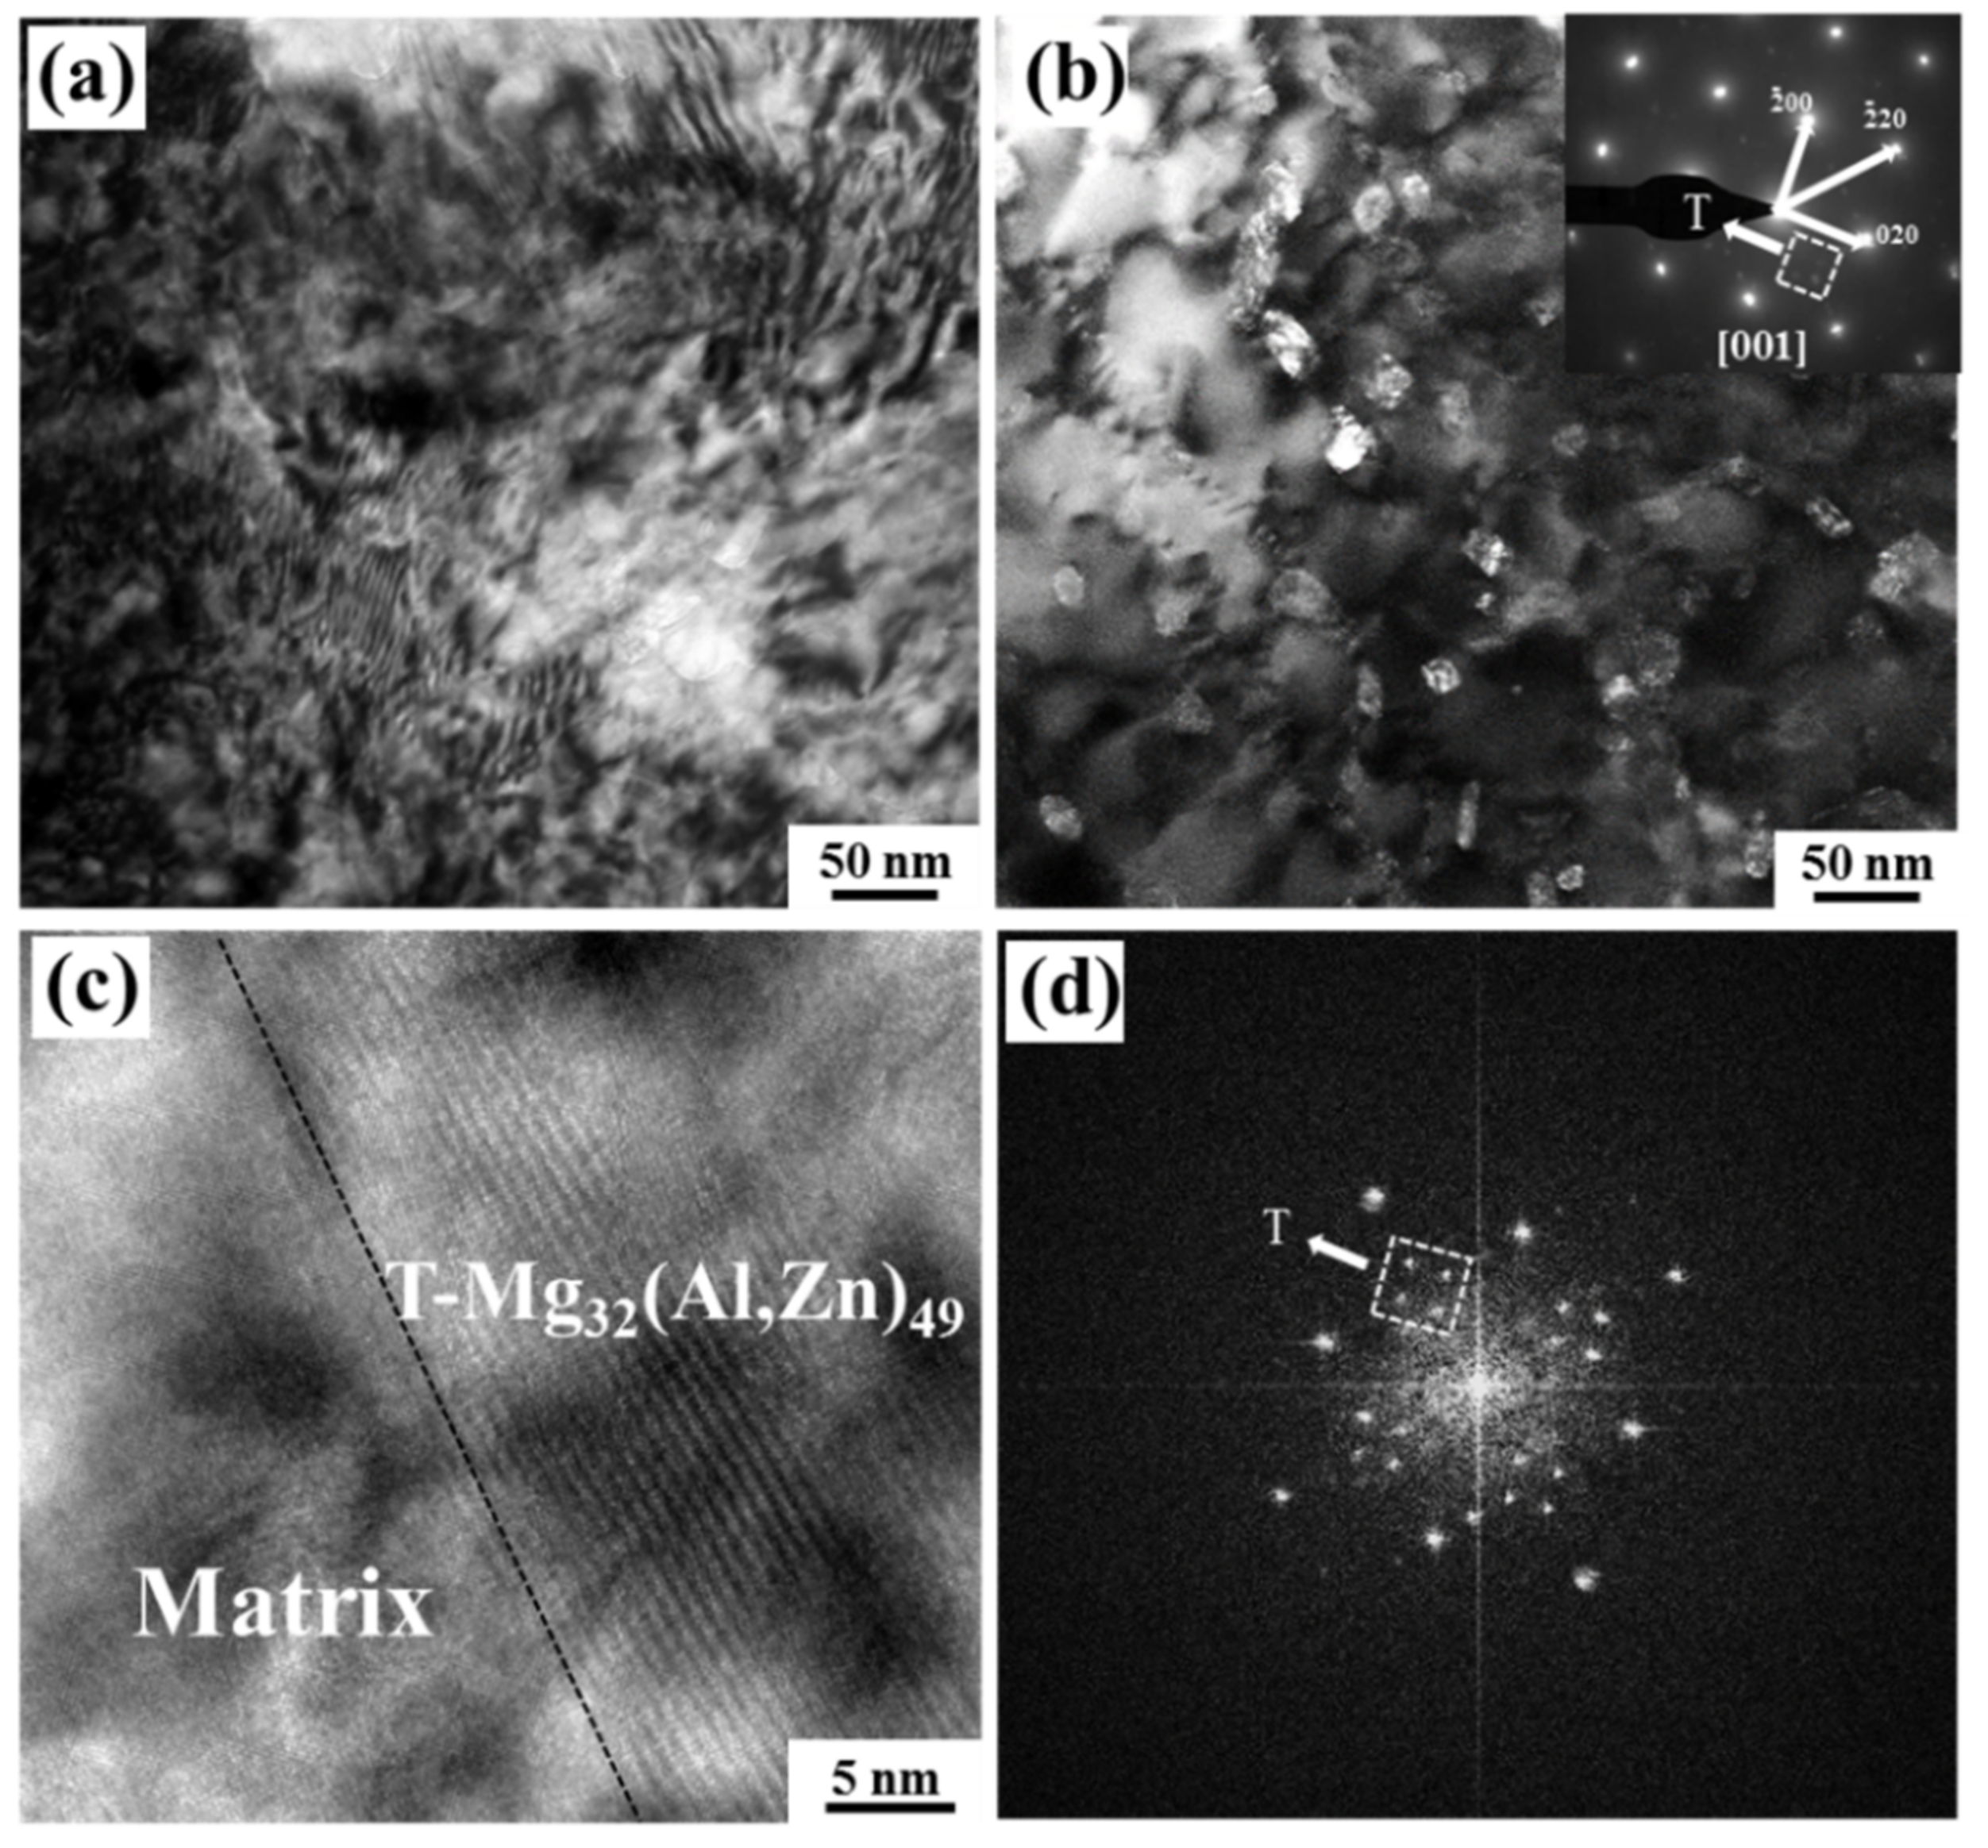
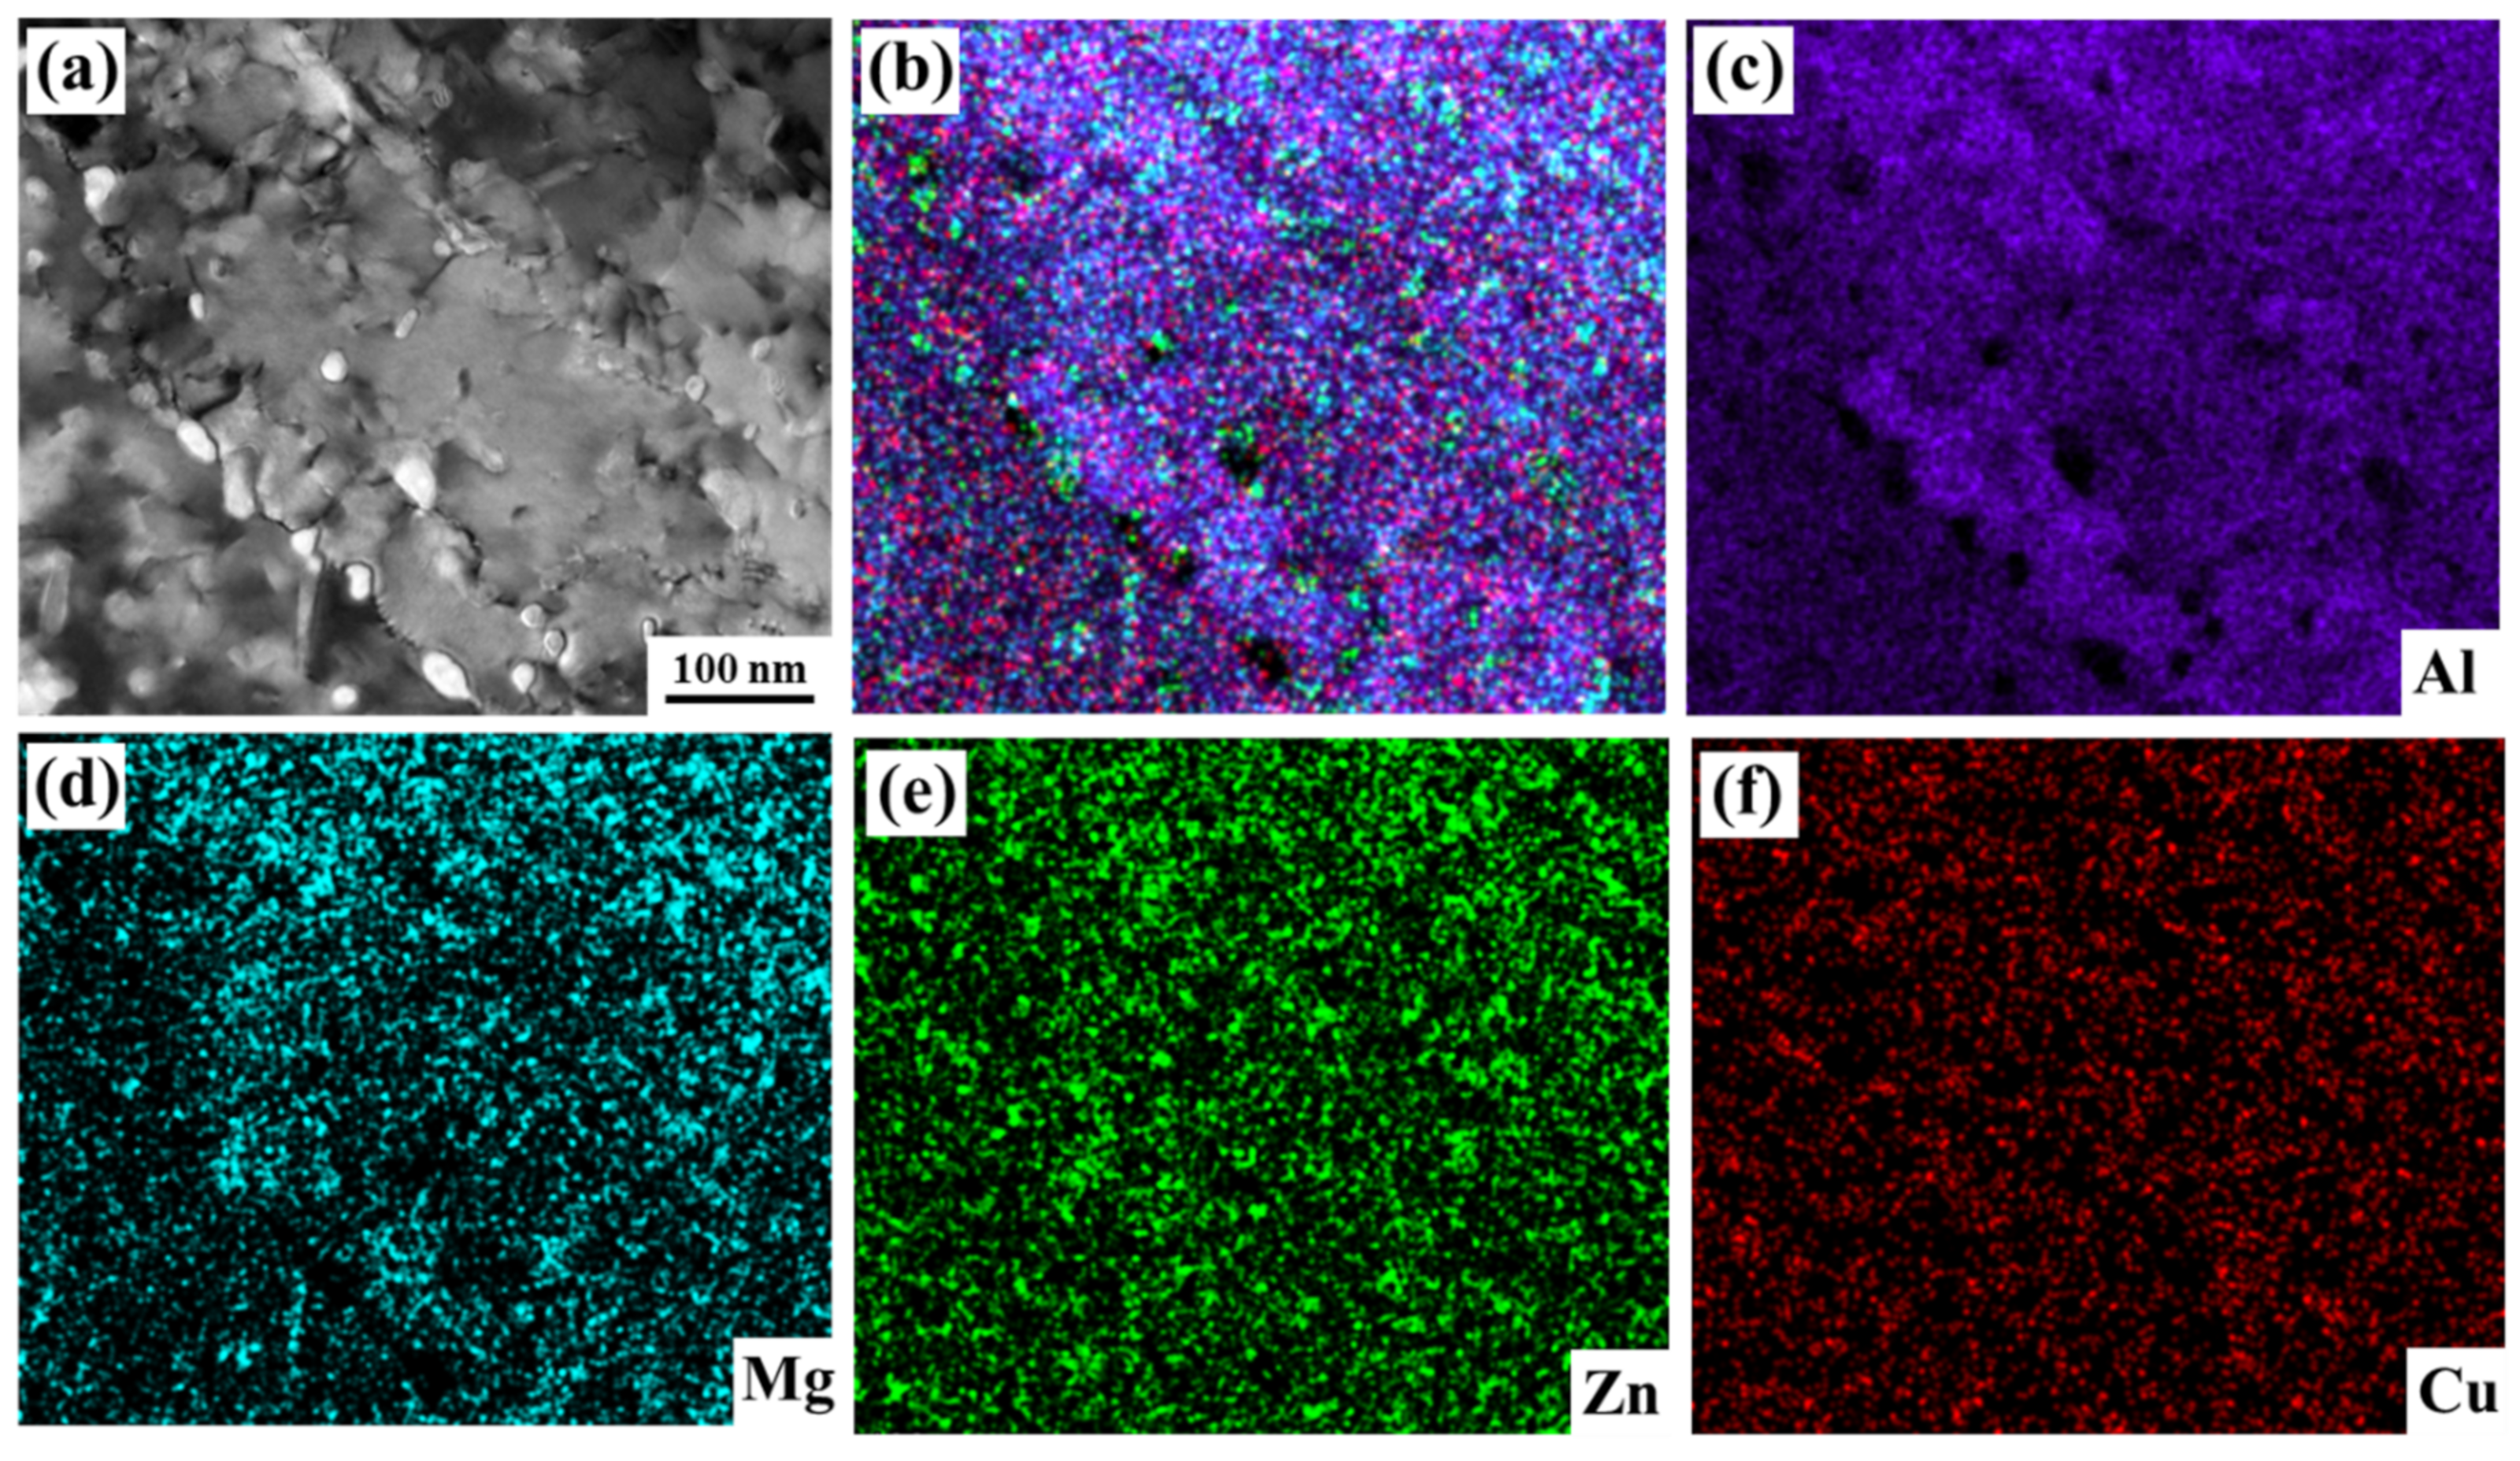
4.1. Precipitation Behavior of Al-10.0Mg-1.0Zn-0.15Cu (wt%) Alloy

After the Al-10.0Mg-1.0Zn-0.15Cu (wt%) alloy is rolled to 75% reduction, the microstructure of the alloy is characterized by elongated nanoscale ultrafine grains containing a high density of dislocations, which greatly contributes to the strength of the alloy. However, ultrafine grains and high-density dislocations lead to the decrease in plasticity. Therefore, the subsequent annealing treatment is carried out to regulate the strength and plasticity of the alloy to obtain a better combination of strength and plasticity. The Al-Mg binary alloys with high Mg content (such as Al-10wt%Mg) are easy to precipitate the Al3Mg2 phase along the grain boundary during annealing. The precipitation of Al3Mg2 phase causes stress concentration during the tensile process, which seriously affects the strength and plasticity of the alloy.
The addition of Zn and Cu inhibits the precipitation of the Al3Mg2 phase and promotes the precipitation of the nanoscale T-Mg32(Al,Zn)49 phase during annealing, resulting in the precipitation-strengthening effect and improving the strength of the alloy. After solution quenching, the alloy produces a large number of quenching vacancies, and the subsequent deformation treatment produces high-density dislocations, resulting in the formation of Mg-vacancy pair clusters at the grain boundary. Zn atoms preferentially combine with Mg-vacancy pair clusters to form Mg-Zn clusters due to the higher diffusion speed than Cu atoms. In addition, based on the interfacial adsorption effect, Mg, Zn and Cu atoms are continuously absorbed, and then further grown and finally transformed into the T-Mg32(Al,Zn)49 phase.

4.2. Mechanism of High Strength and Plasticity

According to the summary of mechanical properties in Table 2, the as-rolled alloy obtained the highest yield strength of 536 MPa. After annealing at 100 °C, the yield strength decreases, while the yield strength increases after annealing at 150 °C and decreases again after annealing at 200 °C. Combined with the microstructure characterized by TEM and XRD results, the 100 °C-annealed alloy shows grain coarsening and dislocation-density reduction, which leads to the decrease in strength and improvement of plasticity. After annealing at 150 °C and 200 °C, the T-Mg32(Al,Zn)49 phase was precipitated in the matrix, which greatly contributed to the strength because of precipitation strengthening. Taking the 150 °C-annealed alloy as an example, the mechanism of high strength and good plasticity is analyzed.
The 150 °C-annealed alloy obtained yield strength of 519 MPa, tensile strength of 653 MPa and uniform elongation of 8.1%. There are four main contribution mechanisms to the high yield strength of the alloy: solid-solution strengthening ( Δ σ s s ), grain-boundary strengthening ( Δ σ g b ), dislocation strengthening ( Δ σ d ) and precipitate strengthening ( Δ σ p ). The contribution of each strengthening mechanism to the yield strength is different, and its total yield-strength contribution can be calculated by this formula: σ y s = σ 0 + Δ σ s s + Δ σ g b + Δ σ d + Δ σ p , where σ 0 is the Peierls-stress caused by crystal lattice to dislocation motion, which is very small in face-centered cubic metals (such as Al) and hence can be neglected [26]. (1) Solid-solution strengthening can be calculated by the following formula: Δ σ s s = H C n , where n and H are constants depending on material. For Mg solid solution of the present study [27,28,29,30], H = 13.8 (MPa/wt%) and n = 1.14. According to the analysis of XRD results, the Mg solute concentration is 6.76 wt% under 150 °C annealing, so its contribution to yield strength is 125 MPa, the content of Zn is 1.0 wt% and its contribution to yield strength is about 2 MPa. (2) Grain-boundary (GB) strengthening stems from the resistance of GBs as barriers to dislocation motion and dislocation propagation to adjacent grains. Grain-size refinement increases volumetric density of GBs and enhances the contribution of GB strengthening to strength. GB strengthening, Δ σ g b , can be quantitatively described by the Hall–Petch relationship: Δ σ g b = k D ¯ 1 / 2 , where k is Hall–Petch slope. With k being taken as 60–280 MPa μm1/2 [28,29,30], in the present work, k is taken as 73 MPa μm1/2, D ¯ is the equivalent average size of lamellar boundary for the grain-boundary-strengthening calculation [31], which can be calculated by formula: D ¯ = 2 / 1 / d ¯ T + π / 2 d ¯ L . According to the elongated grains shown in Figure 2 and the statistical distribution diagram shown in Figure 5, the values of d ¯ T and d ¯ L can be calculated: d ¯ T = 170.8 nm, d ¯ L = 1167.9 nm, so it can be calculated from the formulas that the grain-boundary strengthening is 138 MPa. (3) The calculation formula of dislocation strengthening is Δ σ d = M α 1 G b ρ , where M = 3.06 is the Taylor factor, G = 26 GPa, b = 0.286 nm and ρ is dislocation density. The aforementioned XRD calculation shows that the dislocation density of 150 °C-annealed alloy is 1.90 × 10¹⁴ m−2, so the contribution of dislocation strengthening to the yield strength is 98 MPa. (4) Precipitation strengthening, Δ σ p , can be calculated by [32]: Δ σ p = M 0.4 G b π 1 v 1 / 2 l n d = / b λ ¯ , where M = 3.06 is the Taylor factor, G = 26 GPa, b = 0.286 nm and v = 0.3 are shear modulus, Burgers vector and Poisson’s ratio of Al alloys [23], respectively; d = is a dimension defined as d = = 2 / 3 d ¯ ; and λ ¯ = d ¯ π / 4 f 1 is average interparticle distance. The precipitated phase T-Mg32(Al,Zn)49 of the 150 °C-annealed alloy can be calculated according to Figure 3; the statistical distribution diagram is shown in Figure 5. According to statistics, the average sizes of the T-Mg32(Al,Zn)49 phase are: d ¯ = 17.2 nm and f = 0.054, so it can be calculated from the formulas that the precipitation strengthening is 278 MPa. The uniformly distributed sphere-like T phase precipitated in 150 °C-annealed alloy leads to a strong precipitation-strengthening effect. It can be seen that the contribution values of the four strengthening effects are Δ σ s s = 125 MPa, Δ σ g b = 138 MPa, Δ σ d = 98 MPa and Δ σ p = 278 MPa. The precipitation-strengthening effect in the alloy is strongest at 150 °C-annealed alloy. The addition of Zn and Cu elements promotes the precipitation of the T-Mg32(Al,Zn)49 phase and has an excellent precipitation strengthening effect.
Solution strengthening caused by Mg, Zn content; dislocation strengthening caused by high density in grains; grain-boundary strengthening caused by nanoscale elongated grains; and precipitation strengthening caused by nanoscale T-Mg32(Al,Zn)49 phase—the synergistic effect of four strengthening mechanisms significantly enhances the strength of the alloy, and it is also accompanied by the loss of plasticity. The loss of plasticity is mainly due to the reduction in work-hardening ability, which is caused by the small grain size and the high dislocation density. The work-hardening of materials is usually determined by the change rate of dislocation density, which is controlled by the dynamic competition between dislocation storage during plastic deformation and dislocation annihilation during dynamic recovery [33]. During plastic deformation, the dislocation tends to saturate quickly and the dislocation proliferation slows down due to the fine grain size and high dislocation density. After annealing at different temperatures, the alloy grains grow and the dislocation density decreases. The former means that larger grains accommodate more dislocations; the decrease in dislocation density in the latter also provides more space for dislocation proliferation. However, the further accumulation and storage of dislocations in the matrix becomes more difficult with the increase in strain, and the dynamic recovery further affects strain hardening. When annealed at 150 °C, the solute atoms and T-Mg32(Al,Zn)49 phase promotes dislocation proliferation by pinning dislocations and inhibiting the dynamic recovery, which provides outstanding contribution to the strength and plasticity of the alloy.

5. Conclusions

The Al-10.0Mg-1.0Zn-0.15Cu (wt%) alloy is processed by rolling to thickness-reduction ratio of 75% characterized by nanoscale and ultrafine elongated grains with high density of dislocations. The addition of Zn and Cu inhibits the precipitation of the Al3Mg2 phase and promotes the precipitation of the T-Mg32(Al,Zn)49 phase during annealing. The 150 °C-annealed alloy obtains 0.2% offset yield strength of 519 MPa and ultimate tensile strength of 653 MPa, accompanied by uniform elongation of 8.1%. The ultrahigh strength stems from a high degree of solid-solution strengthening of Mg, Zn and Cu; dislocation strengthening with density of 1.90 × 10¹⁴ m−2; grain-boundary strengthening of nanoscale and ultrafine elongation grains; and precipitation strengthening of sphere-like nano-T-Mg32(Al,Zn)49 phase. The appreciable uniform elongation can be primarily attributed to a high concentration of Mg solute that effectively retards dynamic recovery during tensile testing.

Author Contributions

Conceptualization, Y.L. and S.L.; methodology, Y.L. and X.W.; software, X.W.; validation, X.W. and Y.L.; formal analysis, X.W.; investigation, X.W.; resources, Y.L. and S.L.; data curation, X.W.; writing—original draft preparation, X.W.; writing—review and editing, Y.L. and S.L.; visualization, Y.L.; supervision, Y.L.; project administration, Y.L.; funding acquisition, Y.L. All authors have read and agreed to the published version of the manuscript.

Funding

The present study was financially supported by the National Nature Science Foundation of China (Grant number: U1810108).

Institutional Review Board Statement

Not applicable.

Informed Consent Statement

Not applicable.

Data Availability Statement

The raw and processed data required to reproduce these results are available by contacting the authors.

Conflicts of Interest

The authors declare no conflict of interest.

References

  1. Tisza, M. Advanced Materials for Automotive Applications. Mater. Eng. Appl. 2013, 47, 012010. [Google Scholar] [CrossRef]
  2. Stojanovic, B.; Ivanovic, L. Application of Aluminium Hybrid Composites in Automotive Industry. Teh. Vjesn. 2015, 22, 247–251. [Google Scholar] [CrossRef] [Green Version]
  3. Taub, A.; Moor, E.D.; Luo, A.; Matlock, D.K.; Speer, J.G.; Vaidya, U. Materials for Automotive Light weighting. Ann. Rev. Mater. Res. 2019, 49, 327–359. [Google Scholar] [CrossRef]
  4. Zhang, X.; Chen, Y.; Hu, J. Recent Advances in the Development of Aerospace Materials. Prog. Aerosp. Sci. 2018, 97, 22–34. [Google Scholar] [CrossRef]
  5. Chen, B.; Zhou, X.Y.; Zhang, B.; Kondoh, K.; Li, J.S.; Qian, M. Microstructure, Tensile Properties and Deformation Behaviors of Aluminium Metal Matrix Composites Co-Reinforced by Ex-Situ Carbon Nanotubes and in-situ Alumina Nanoparticles. Mater. Sci. Eng. A 2020, 795, 139930. [Google Scholar] [CrossRef]
  6. Liu, Z.; Sun, J.; Yan, Z.; Lin, Y.; Liu, M.; Roven, H.J.; Dahle, A.K. Enhanced Ductility and Strength in a Cast Al-Mg Alloy with High Mg Content. Mater. Sci. Eng. A 2021, 806, 140806. [Google Scholar] [CrossRef]
  7. Wu, C.T.; Lee, S.L.; Chen, Y.F.; Bor, H.Y.; Liu, K.H. Effects of Mn, Zn Additions and Cooling Rate on Mechanical and Corrosion Properties of Al-4.6Mg Casting Alloys. Materials 2020, 13, 1983. [Google Scholar] [CrossRef] [PubMed]
  8. Wang, X.; Chen, G.Q.; Li, B.; Wu, G.H.; Jiang, D.M. Effect of Minor Sc, Zr and Ti Co-addition on Microstructure and Properties of Al-Mg alloys. Rare Metal Mat. Eng. 2010, 39, 719–722. [Google Scholar]
  9. Pozdniakov, A.V.; Yarasu, V.; Barkov, R.Y.; Yakovtseva, O.A.; Makhov, S.V.; Napalkov, V.I. Microstructure and mechanical properties of novel Al-Mg-Mn-Zr-Sc-Er alloy. Mater. Let. 2017, 202, 116–119. [Google Scholar] [CrossRef]
  10. Sohi, M.; Poole, W.J.; Sinclair, C.W.; Gallerneault, M. Yield Strength of Twin-Belt Cast Al-Mg-Sc-Zr Alloy after Annealing. Mater. Sci. Technol. 2015, 31, 460–467. [Google Scholar] [CrossRef]
  11. Yang, D.X.; Li, X.Y.; He, D.Y.; Huang, H. Effect of minor Er and Zr on microstructure and mechanical properties of Al-Mg-Mn alloy (5083) welded joints. Mater. Sci. Eng. A 2013, 561, 226–231. [Google Scholar]
  12. Yang, X.B.; Chen, J.H.; Liu, J.Z.; Qin, F.; Xie, J.; Wu, C.L. A High-Strength AlZnMg Alloy Hardened by the T-Phase Precipitates. J. Alloys Compd. 2014, 610, 69–73. [Google Scholar] [CrossRef]
  13. Berg, L.K.; Gjonnes, J.; Hansen, V.; Li, X.Z.; Knutson-Wedel, M.; Waterloo, G.; Schryvers, D.; Wallenberg, L.R. Gp-Zones in Al-Zn-Mg Alloys and Their Role in Artificial Aging. Acta Mater. 2001, 49, 3443–3451. [Google Scholar] [CrossRef]
  14. Birbilis, N.; Cavanaugh, M.K.; Kovarik, L.; Buchheit, R.G. Nano-Scale Dissolution Phenomena in Al-Cu-Mg Alloys. Electrochem. Commun. 2008, 10, 32–37. [Google Scholar] [CrossRef]
  15. Bigot, A.; Auger, P.; Chambreland, S.; Blavette, D.; Reeves, A. Atomic scale imaging and analysis of T’ precipitates in Al-Mg-Zn alloys. Microsc. Microanal. Microstruct. 1997, 8, 103–113. [Google Scholar] [CrossRef]
  16. Cao, C.; Zhang, D.; Zhuang, L.; Zhang, J. Improved age-hardening response and altered precipitation behavior of Al-5.2Mg-0.45Cu-2.0Zn (wt%) alloy with pre-aging treatment. J. Alloys Compd. 2017, 691, 40–43. [Google Scholar] [CrossRef]
  17. Hou, S.; Liu, P.; Zhang, D.; Zhang, J.; Zhuang, L. Precipitation hardening behavior and microstructure evolution of Al-5.1Mg-0.15Cu alloy with 3.0Zn (wt%) addition. J. Mater. Sci. 2018, 53, 3846–3861. [Google Scholar] [CrossRef]
  18. Inoue, H.; Sato, T.; Kojima, Y.; Takahashi, T. The temperature limit for GP zone formation in an Al-Zn-Mg alloy. Metall. Mater. Trans. A 1981, 12, 1429–1434. [Google Scholar] [CrossRef]
  19. Polmear, L.J. Light Alloys: Metallurgy of the Light Alloys, 3rd ed.; Arnold: London, UK, 1995. [Google Scholar]
  20. Hou, S.; Zhang, D.; Ding, Q.; Zhang, J.; Zhuang, L. Solute Clustering and Precipitation of Al-5.1Mg-0.15Cu-XZn Alloy. Mater. Sci. Eng. A 2019, 759, 465–478. [Google Scholar] [CrossRef]
  21. Feng, L.; Li, J.; Huang, C.; Huang, J. Annealing Response of a Cold-rolled Binary Al-10Mg alloy. Metals 2019, 9, 759. [Google Scholar] [CrossRef] [Green Version]
  22. Cullity, B.D.; Stock, S.R. Elements of X-ray Diffraction, 3rd ed.; Prentice-Hall: Upper Saddle River, NJ, USA, 2001. [Google Scholar]
  23. Davis, J.R. Aluminum and Aluminum Alloys; ASM International, Materials Park: Cleveland, OH, USA, 1993. [Google Scholar]
  24. Klug, H.P.; Alexander, L. X-ray Diffraction Procedures for Polycrystalline and Amorphous Materials, 2nd ed.; John Wiley and Sons: New York, NY, USA, 1974. [Google Scholar]
  25. Zhao, Y.H.; Sheng, H.W.; Lu, K. Microstructure evolution and thermal properties in nanocrystalline Fe during mechanical attrition. Acta Mater. 2001, 49, 365–375. [Google Scholar] [CrossRef]
  26. Husking, E.L.; Cao, B.; Ramesh, K.T. Strengthening mechanisms in an Al-Mg alloy. Mater. Sci. Eng. A 2010, 527, 1292–1298. [Google Scholar] [CrossRef]
  27. Ryen, Ø.; Holmedal, B.; Nijs, O.; Nes, E.; Sjölander, E.; Ekström, H.E. Strengthening mechanisms in solid solution aluminum alloys. Metall. Mater. Trans A 2006, 37, 1999–2006. [Google Scholar] [CrossRef]
  28. Witkin, D.B.; Lavernia, E.J. Synthesis and mechanical behavior of nanostructured materials via cryomilling. Prog. Mater. Sci. 2006, 51, 1–60. [Google Scholar] [CrossRef]
  29. Jang, D.H.; Park, Y.B.; Kim, W.J. Significant strengthening in superlight Al-Mg alloy with an exceptionally large amount of Mg (13 wt%) after cold rolling. Mater. Sci. Eng. A 2019, 744, 36–44. [Google Scholar] [CrossRef]
  30. Zha, M.; Li, Y.; Mathiesen, R.H.; Bjørge, R.; Roven, H.J. Microstructure evolution and mechanical behavior of a binary Al-7Mg alloy processed by equal-channel angular pressing. Acta Mater. 2015, 84, 42–54. [Google Scholar] [CrossRef]
  31. Lin, Y.; Liu, W.; Wang, L.; Lavernia, E.J. Ultra-Fine Grained Structure in Al-Mg Induced by Discontinuous Dynamic Recrystallization under Moderate Straining. Mater. Sci. Eng. A 2013, 573, 197–204. [Google Scholar] [CrossRef]
  32. Kelly, A.; Nicholson, R.B. Strengthening Methods in Crystals; Elsevier: Amsterdam, The Netherlands, 1971. [Google Scholar]
  33. Chen, X.H.; Lu, L.; Lu, K. Grain Size Dependence of Tensile Properties in Ultrafine-Grained Cu with Nanoscale Twins. Scr. Mater. 2011, 64, 311–314. [Google Scholar] [CrossRef]
Figure 1. SEM micrographs and corresponding EDS results of the Al-10.0Mg-1.0Zn-0.15Cu (wt%) alloy: (a) as-cast, (b) as-homogenized, (cf) the EDS results of (b).
Metals 12 01037 g001
Figure 2. TEM microstructure and corresponding SAED patterns of Al-10.0Mg-1.0Zn-0.15Cu (wt%) alloy: (a) as-rolled, (b) 100 °C-annealed, (c) 150 °C-annealed, (d) 200 °C-annealed.
Metals 12 01037 g002
Figure 3. TEM microstructure of 150 °C-annealed alloy: (a) BF TEM image, (b) DF TEM image and corresponding SAED pattern, (c) HRTEM image, (d) FFT image corresponding to (c).
Metals 12 01037 g003
Figure 4. STEM images of 150 °C-annealed alloy: (a) BF STEM image, (bf) EDS results corresponding to (a).
Metals 12 01037 g004
Figure 5. Statistical-distribution diagram of 150 °C-annealed alloy: (a) the average size of T-Mg32(Al,Zn)49 phase, (b) intercept length perpendicular to lamellar boundaries, (c) intercept length parallel to lamellar boundaries.
Metals 12 01037 g005
Figure 6. (a) XRD patterns of the Al-10.0Mg-1.0Zn-0.15Cu (wt%) alloy, (b) local amplification of (a), (c) apparent lattice constant a(θ) vs. (cos2θ/sinθ + cos2θ/θ)/2 and the fitted straight lines, and (d) β2/tan2θ vs. β/tanθsinθ and the corresponding connecting straight lines.
Metals 12 01037 g006
Figure 7. Tensile engineering stress–strain curves of as-rolled and as-annealed Al-10.0Mg-1.0Zn-0.15Cu (wt%) alloy.
Metals 12 01037 g007
Figure 8. Fracture surfaces of the Al-10.0Mg-1.0Zn-0.15Cu (wt%) alloy: (a) as-rolled, (b) 100 °C-annealed, (c) 150 °C-annealed, (d) 200 °C-annealed.
Metals 12 01037 g008
Table 1. Lattice constant, Mg solute concentration and dislocation density of as-rolled and as-annealed Al-10.0Mg-1.0Zn-0.15Cu (wt%) alloys.
StatusLattice Constant (Å)Mg Solute ConcentrationDislocation Density (m−2)Crystalline Sizes (nm)
(at%)(wt%)
as-rolled4.09610.119.205.55 × 101441.4
100 °C-annealed4.0949.668.792.76 × 1014133.9
150 °C-annealed4.0847.456.761.90 × 1014228.9
200 °C-annealed4.0765.695.151.19 × 1014246.8
Table 2. Tensile properties of as-rolled and as-annealed Al-10.0Mg-1.0Zn-0.15Cu (wt%) alloys.
StatusYield Strength (MPa)Ultimate Tensile Strength (MPa)Uniform Elongation (%)
as-rolled536 ± 8.5618 ± 8.56.3 ± 0.5
100 °C-annealed469 ± 9.6593 ± 11.211.0 ± 0.9
150 °C-annealed519 ± 8.3653 ± 11.38.1 ± 0.7
200 °C-annealed424 ± 5.1597 ± 4.77.0 ± 0.4
Publisher’s Note: MDPI stays neutral with regard to jurisdictional claims in published maps and institutional affiliations.

