Article

Indentation Size Effect of Composite A356 + 6%FA Subjected to ECAP

1
E-PRO Ltd. for Design, Engineering, and Technical Consulting, 77000 Bihać, Bosnia and Herzegovina
2
Faculty of Mechanical Engineering and Naval Architecture, University of Zagreb, 10000 Zagreb, Croatia
3
Vinča Institute of Nuclear Science, National Institute of the Republic of Serbia, University of Belgrade, 11000 Belgrade, Serbia
*
Author to whom correspondence should be addressed.
Metals 2022, 12(5), 821; https://doi.org/10.3390/met12050821
Submission received: 1 April 2022 / Revised: 29 April 2022 / Accepted: 6 May 2022 / Published: 10 May 2022

Abstract

:
In this study, metal matrix-based composite (MMC) was subjected to Equal Chanel Angular Pressing (ECAP) in several passes to determine the influence of deformation on the hardness of the samples. Composite based on A356 aluminum alloy and reinforced with Fly Ash (FA) particles was obtained by the compo casting method. The microstructural analyses and microhardness measurements were performed on the cast and pressed samples. Vickers hardness measurement of composite samples was performed with different indentation load sizes: HV0.02, HV0.05, HV0.1 and HV0.2. Results showed that hardness increases after each ECAP pass. The lowest hardness value of 42 (HV0.02) as well as the lowest arithmetical mean value of 46 (HV0.2) was measured at the cast composite. The greatest composite hardness of 107 (HV0.1) and the highest arithmetical mean value of 94 (HV0.1) was measured at the three-time pressed sample. The mathematical model named Meyer’s law was used for data analysis. In the cast sample, a decrease in hardness was detected with increasing indentation load, termed Indentation Size Effect (ISE), was confirmed with Meyers index n = 1.9112 < 2. Pressed samples showed opposite behavior—an increase in hardness with increasing indentation load—where Meyers index n > 2 indicated Reverse Indentation Size Effect (RISE). For all samples, a high coefficient of determination R2 > 0.99 confirmed that Meyer’s law described this phenomenon well.

1. Introduction

The development of metal matrix composites (MMCs) for the replacement and/or improvement of the classical materials has generated much interest in the past decades. By combining different materials, it is possible to design MMCs with specific mechanical, electrical and tribological properties. Aluminum (Al) alloy-based composites have an important place because of the wide use of aluminum and its alloys in automotive, aviation, household appliance and other industries. By adding a low-density reinforcement in the Al/Al alloy matrix, an enhanced material can be obtained. Characteristics of the composites depend on the materials used in their production as well as the procedure applied. In our research, the A356 alloy was used as a matrix. This alloy has good mechanical strength, ductility, hardness, fatigue strength, pressure tightness, fluidity, and machinability. A356 alloy is used in many industrial applications, such as airframe castings, machine parts, truck chassis parts, aircraft and missile components, and structural parts requiring high strength [1,2,3,4,5,6]. We used Fly Ash (FA) as reinforcement. It is a low-density, inexpensive material available in great amounts. It is collected as waste in the flue gas filters in thermal plants, and its disposal represents a serious ecological problem. About 370 million tons of FA are produced annually worldwide, which causes ground, air and waterflow pollution [7,8,9]. Therefore, the beneficial use of FA solves both environmental and economic problems. Although FA has so far found a wider application in construction, there are also numerous studies that evaluate the potential of FA as reinforcement in metal- and polymer-matrix composites. Composition of FA varies depending on its source and the coal used in the thermal plant, but generally it is a nonhomogeneous mixture of metallic oxides in the form of small particles between 1–120 microns in diameter. Previous research shows that FA can be well incorporated in the aluminum alloy base using the stir casting and compo casting method. Aluminum alloy composite reinforced with FA shows improved properties, such as higher strength and hardness, as well as wear resistance, lower density and porosity, etc. [10,11,12,13,14,15].
The specific properties of the cast composite can be additionally improved with plastic deformation processing, such as Equal Channel Angular Pressing (ECAP). In this procedure, the material is pressed through a channel that changes direction. Severe plastic deformation occurs, which causes microstructural changes of the subjected material. Shear tensions and deformation degree, as well as the microstructural changes of the material, depend on several influencing factors: tool/channel geometry, number of passes, route-rotation of the sample after each pass, pressure and velocity and the lubricant used [16,17,18,19].
The above-mentioned microstructural changes have an influence on the different material properties. One of the most important and frequently tested properties is hardness. Hardness represents a measure of material resistance to permanent plastic deformation. The significance of micro and macro hardness measurements is reflected in the fact that hardness affects other material properties. By determining hardness, one can bring conclusions about other material characteristics. The commonly used indentation method for hardness measurement is the Vickers method. It has been confirmed that hardness can depend on the load applied during the test. Some materials show a decrease of hardness with increasing load, which is called the Indentation Size Effect (ISE), while others manifest an increase in hardness with increasing load, known as Reverse Indentation Size Effect (RISE) [20,21,22,23,24,25,26].
This paper analyzes the influence of the deformation degree by ECAP on hardness of A356 aluminum alloy composite reinforced with 6%FA. To evaluate ISE, Vickers hardness measurement was performed with different loads. The obtained results are described by the mathematical model known as Meyer’s law, which gives a correlation between applied load (F) and resulting indentation size (d).

2. Materials and Methods

For composite production, commercial A356 Al alloy was used as a metal matrix. The chemical composition (wt.%) of A356 was as follows: Si-7.0; Fe-0.11; Cu < 0.01; Mn < 0.01; Mg-0.37; Zn-0.01; Ti-0.12; Sr-0.056 and Al-balance. This, hypoeutectic, heat-treatable alloy has good casting properties, but during the research, it was also shown to be suitable for ECAP [18].
FA used as reinforcement originates from the thermal power plant “Kolubara”, Veliki Crljeni, Serbia. FA composition was determined by X-ray diffraction analysis (XRD), and it is dominated by oxides: Al2O3, SiO2, Fe2O3 and others [13,14]. Morphology of the FA shown in Figure 1 was examined with Scanning Electron Microscope (SEM, JEOL 5800LV, JEOL Ltd., Tokyo, Japan). FA particles can be categorized into solid (precipitator), hollow (cenosphere), porous, and irregular particles [10]. It was noticed that FA consists of small particles of the spherical and precipitator type, as well as irregular particles.
In order to achieve a better distribution of reinforcement in the matrix, FA was sieved, and only phases smaller than w = 45 µm and d = 63 µm were used, where: w = width and d = diagonal of square sieve holes.
Samples of the composite were produced by the compo casting method, where infiltration of FA particles was performed by mixing them into the semi-solid A356 matrix. The melted alloy was overheated at 650 °C to remove slag. To contain the semi-solid state during FA addition, the temperature of the matrix was about 10 °C below the liquidus line, 620 °C. Reinforcement was mixed in with the plate fixed on a shaft rotating at 500 min−1 for a duration of 5 min. To eliminate moisture, FA was preheated at 150 °C for a duration of 2 h. The mold was also preheated to the temperature of 600 °C. Dimensions of the mold were 20 × 30 × 150 mm3. The specific equipment of the compo casting process, such as a ceramic pot, furnace and others have been described in previous works [13,14,18] and therefore will not be repeated here. All composite production was performed in the laboratory of the “Vinča” Institute of Nuclear Sciences, National Institute of the Republic of Serbia, University of Belgrade, Belgrade, Serbia.
From the cast ingot shown in Figure 2a, samples were cut in dimensions 12 × 12 × 120 mm3 to be prepared for ECAP (Figure 2b).
Samples were pressed on the hydraulic press “HYDRAUMA” (Hermann Grimm KG, Triebes, Germany) with the rated force of 40 kN, a velocity below 0.2 m/s and with constant pressure. To reduce friction, molybdenum-disulfide was used as a lubricant. After each ECAP pass, samples were rotated around the vertical axis by 90°. This route, known as BC, has shown the best improvement of material microstructure according to literature [16,17,18,19]. Samples were pressed up to three times. After each pass, there was some loss of the material, because it had to be machined to fit into the ECAP die for the next extrusion. Figure 2c shows samples after one ECAP pass, where specific geometry can be noticed as well as the requirement for machining afterwards. Due to the mechanics of ECAP and uneven sliding of the material during the process, the ends of the sample usually must be cut off. In Figure 3, the ECAP tool is shown. The channels have a square section, and the angle between them is 90°. The punch is also square-shaped, and the tool has the necessary clearance to avoid jamming.
The test pieces intended for the microstructural analyses and microhardness measurements were cut from the cast and extruded samples, their dimensions being 12 × 12 × 10 mm3. The analyzed surface (12 × 12 mm2) coincided with the cross-section of the pressed specimens. After cutting, the analyzed surface was grinded and polished. The microstructure was analyzed with an Olympus GX51 optical microscope (Olympus, Tokyo, Japan). Microhardness was measured on a polished surface. Vickers hardness measurement of the composite samples was performed on a PMT-3U4.2 (Tochpribor, Moscow, Russia) hardness tester with different loads (F): 0.1962 N (HV0.02); 0.4905 N (HV0.05); 0.981 N (HV0.1); and 1.96 N (HV0.2). For each of the indentations, 20 measurements were made. Gained values were processed by the mathematical model Meyer’s law, which is a simple way to describe ISE [21,22,23,24,25]. All experimental procedures were performed in laboratories in the Faculty of Mechanical Engineering and Naval Architecture, University of Zagreb, Zagreb, Croatia.
After standard metallographic preparation of the samples, they were subjected to the Vickers hardness test. Indentations were made with a regular four-sided diamond pyramid. The size of indentation (d) corresponds to the arithmetical mean value of two measured diagonals of the print (d1 and d2 in Figure 4a):
d   =   d 1 +   d 2 2
and the value of the Vickers hardness HV is defined and calculated as follows:
H V   =   k F d 2
where k = 0.1891 is the geometrical constant for the Vickers test and F (N) is the applied load.
Measurements were made by applying a constant load for a duration of 15 s. To obtain the statistically relevant data on each sample, measurements were made according to the schematic in Figure 4b. For every set of measurements, the mean value and standard deviation were calculated.

3. Results

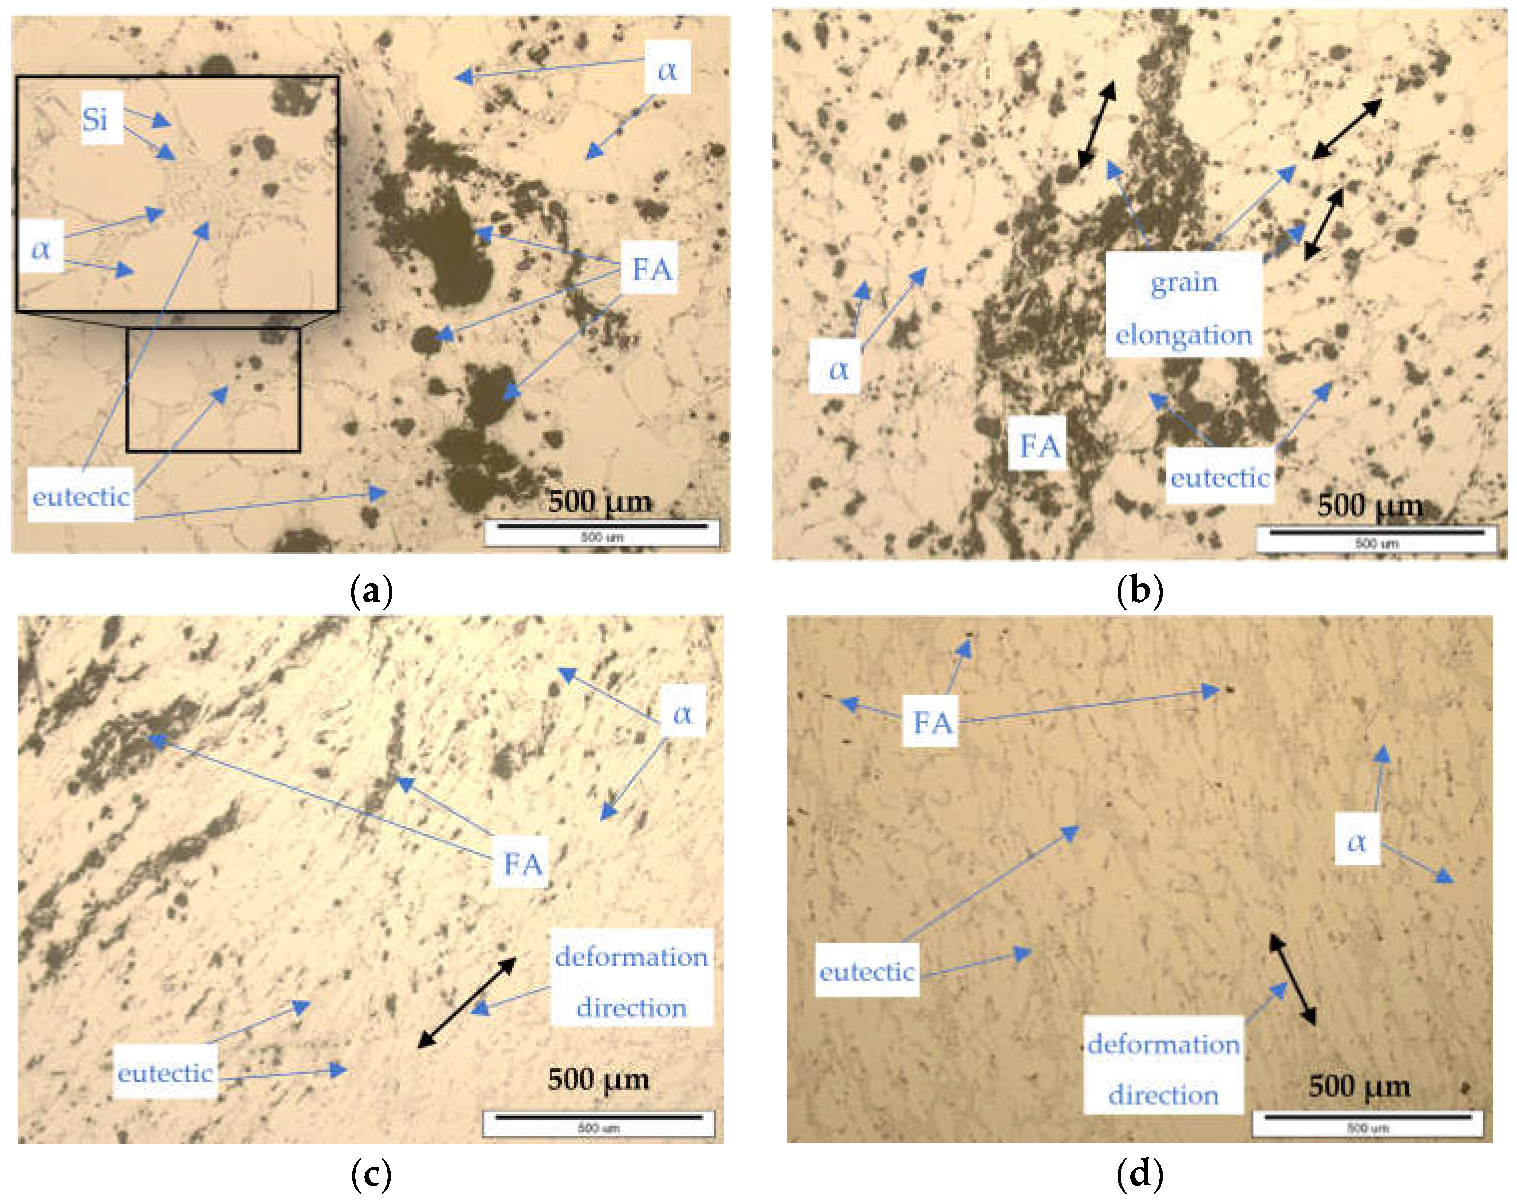
3.1. Microstructure Analysis

The microstructure of the A356 + 6%FA composite is presented in Figure 5. The bright area represents the α-solid solution of Si in Al, while the grey areas are eutectic. The eutectic in Al-Si alloys is a mixture of the primary α-crystals and fiber-like Si. Dark areas in between these crystals correspond with agglomerations of FA particles. The microstructure of the cast sample in Figure 5a is dendritic with oval grains, which is characteristic of cast alloys. FA is well bonded into the matrix.
Due to deformation, the microstructure of the composite changes after every ECAP pass (Figure 5b–d). During the first phase of the ECAP process, before it starts to flow in the orthogonal channel, material is exposed to the normal compression stress of pressing. Severe shear tensions appear when the material flows through the ECAP channel with the change of direction. These complex stress conditions cause the above-mentioned microstructural changes. Crystal grains change shape, and the agglomerations of FA dissipate in the matrix. By observing the shape of the grains and FA distribution, conclusions about the deformation direction can be deduced. In all ECAP deformed samples, some elongation of the grains can be observed. In Figure 5b, elongation of the primary α-crystals and collapse of the dendritic structure can be noticed. After two and three ECAP passes with rotation around the vertical axis, the microstructure is improved (Figure 5c,d). FA is further distributed into the structure of the matrix. Finer, more uniform grains can be noticed, and the microstructure is more compact and denser.

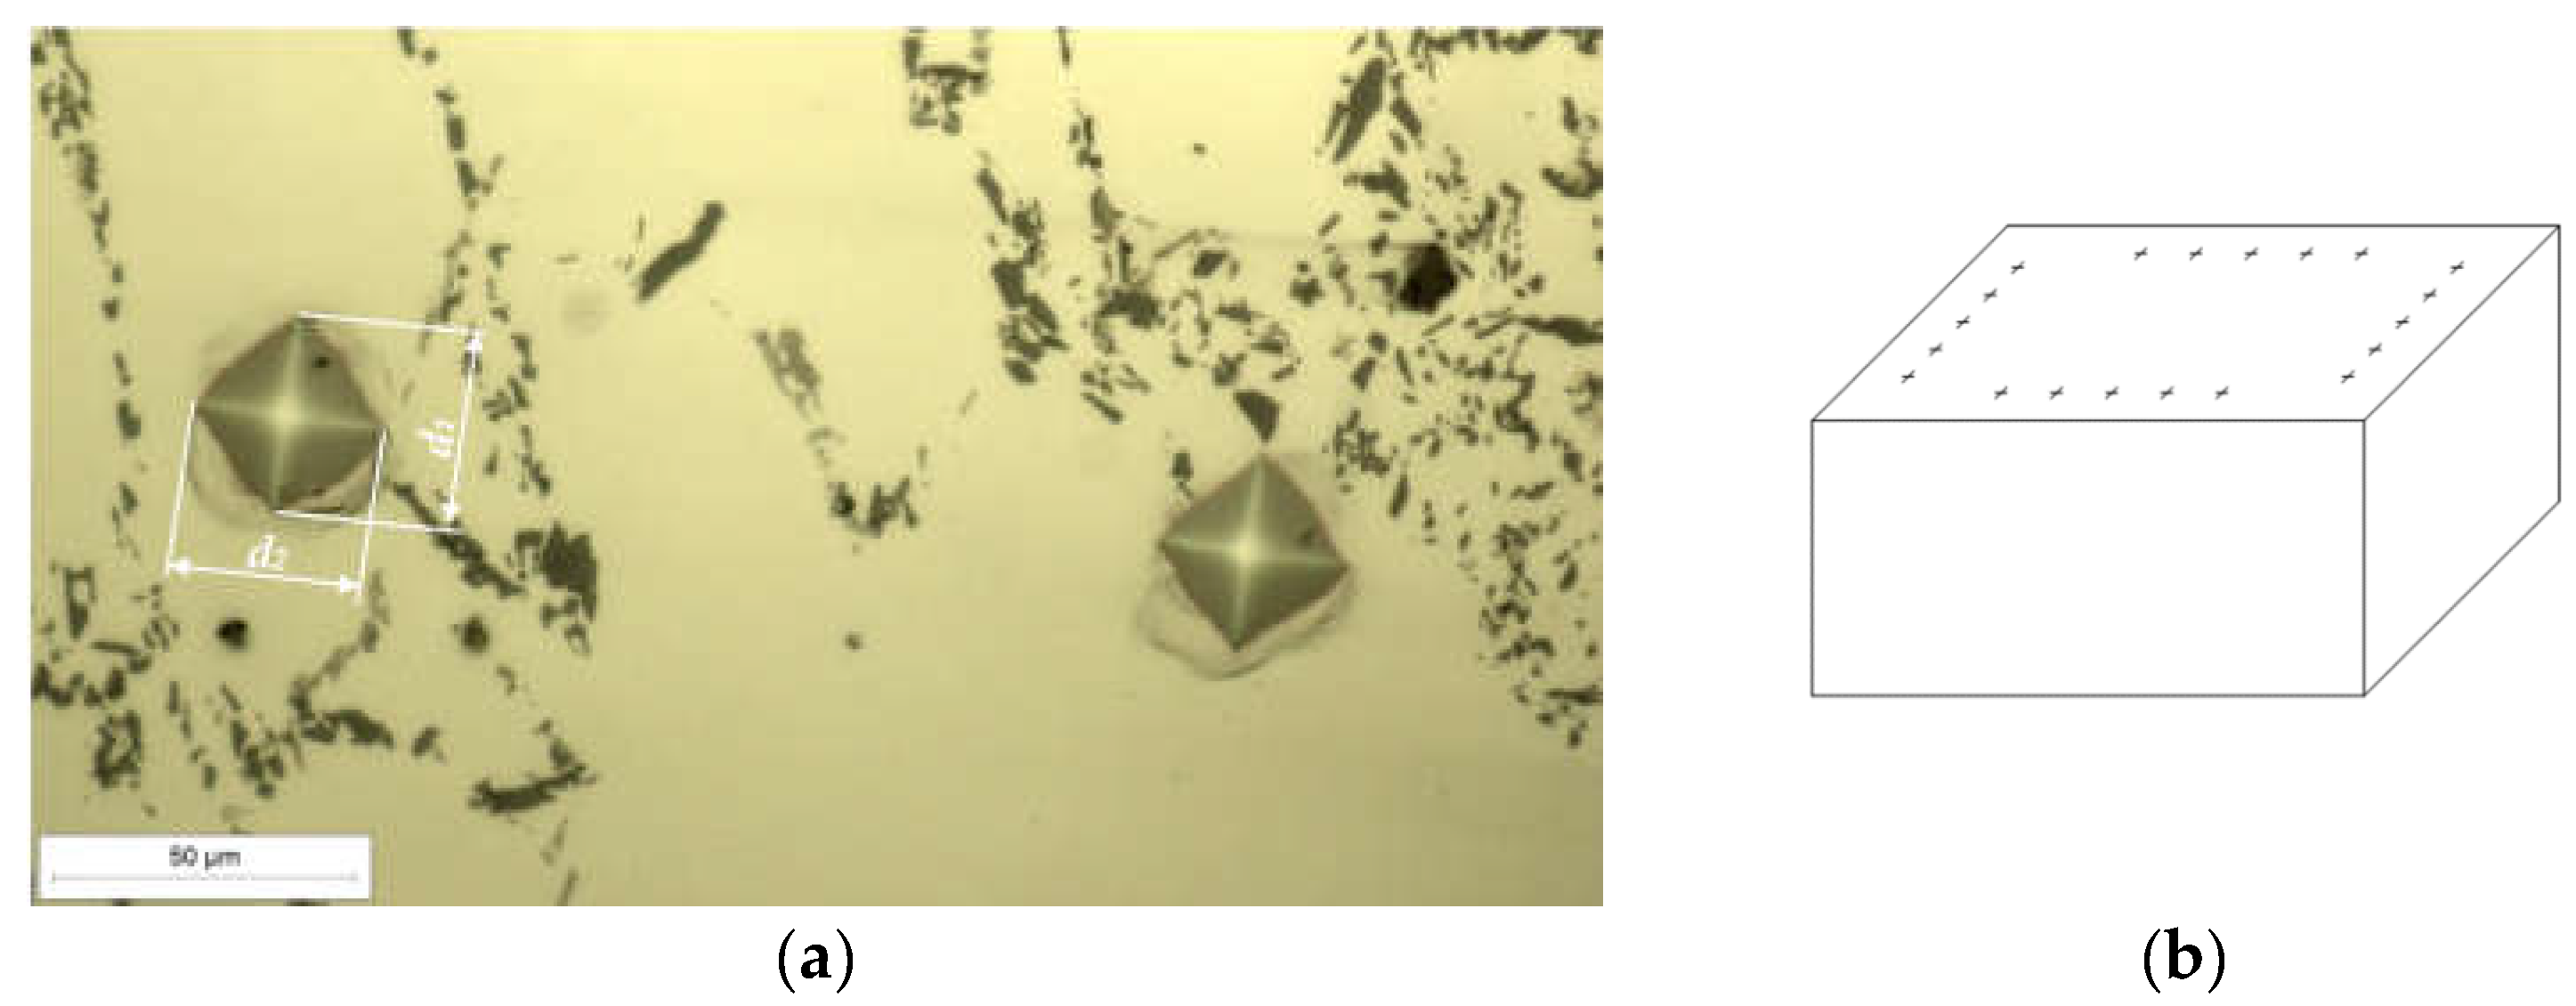
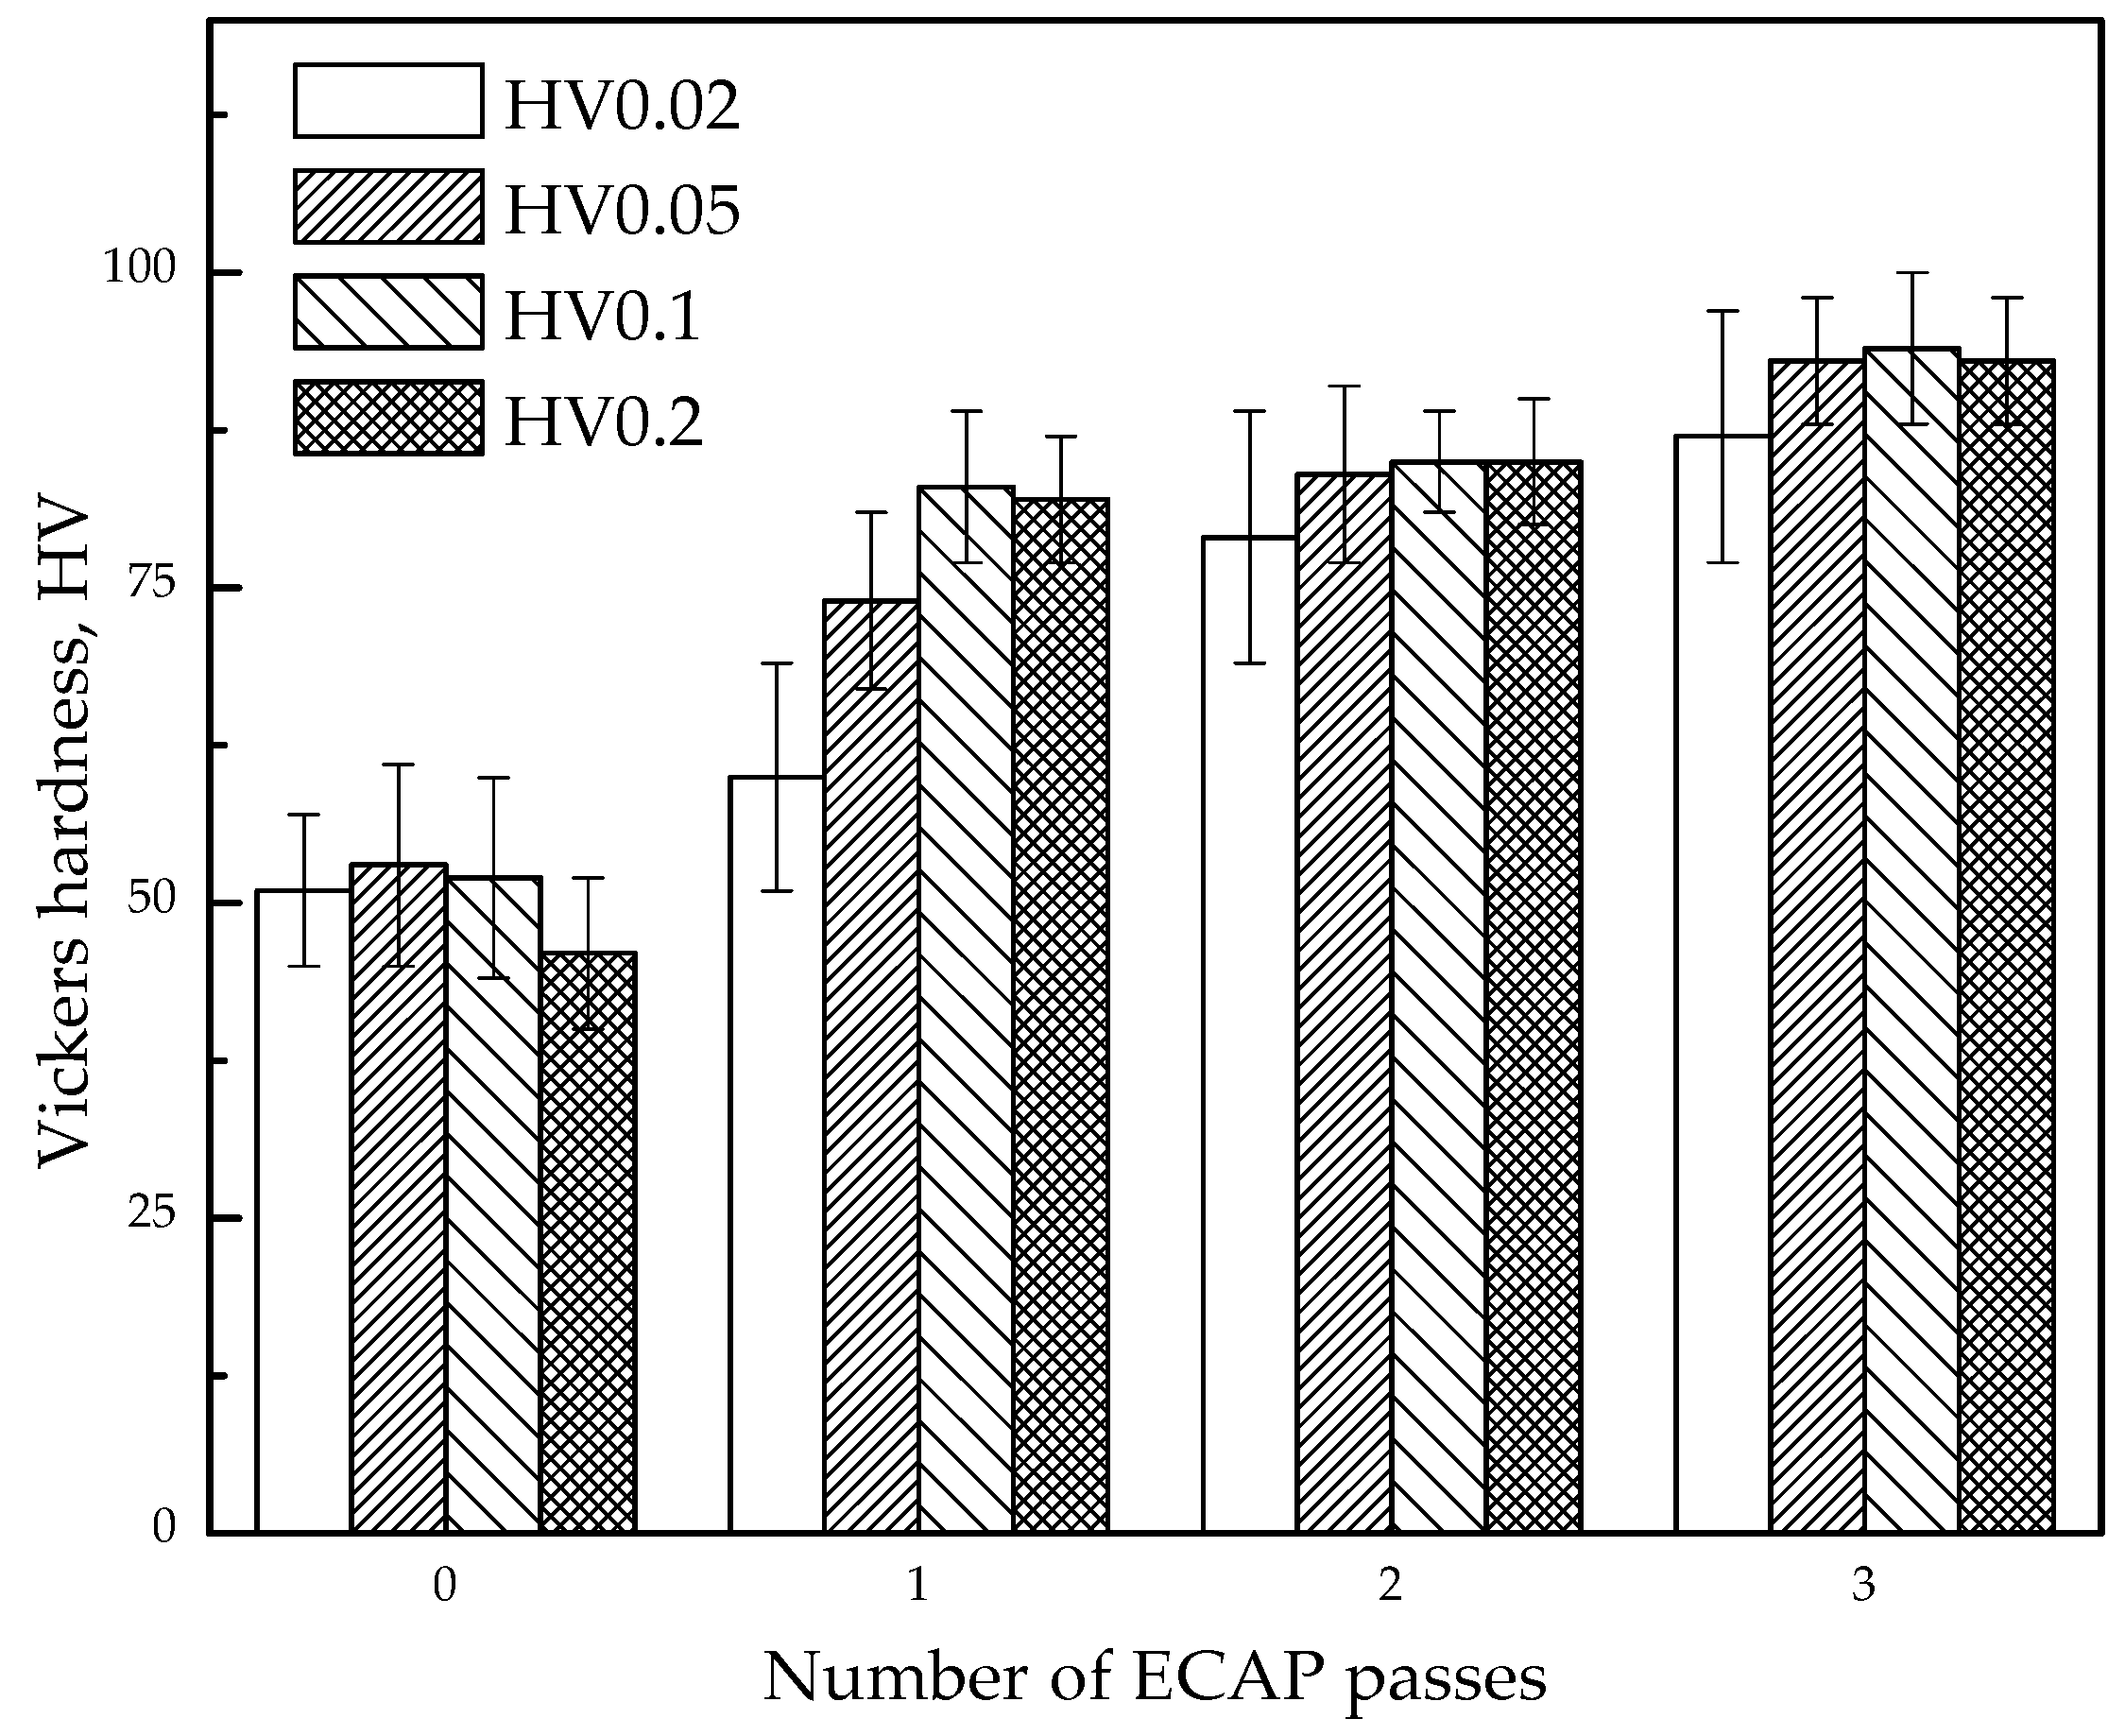
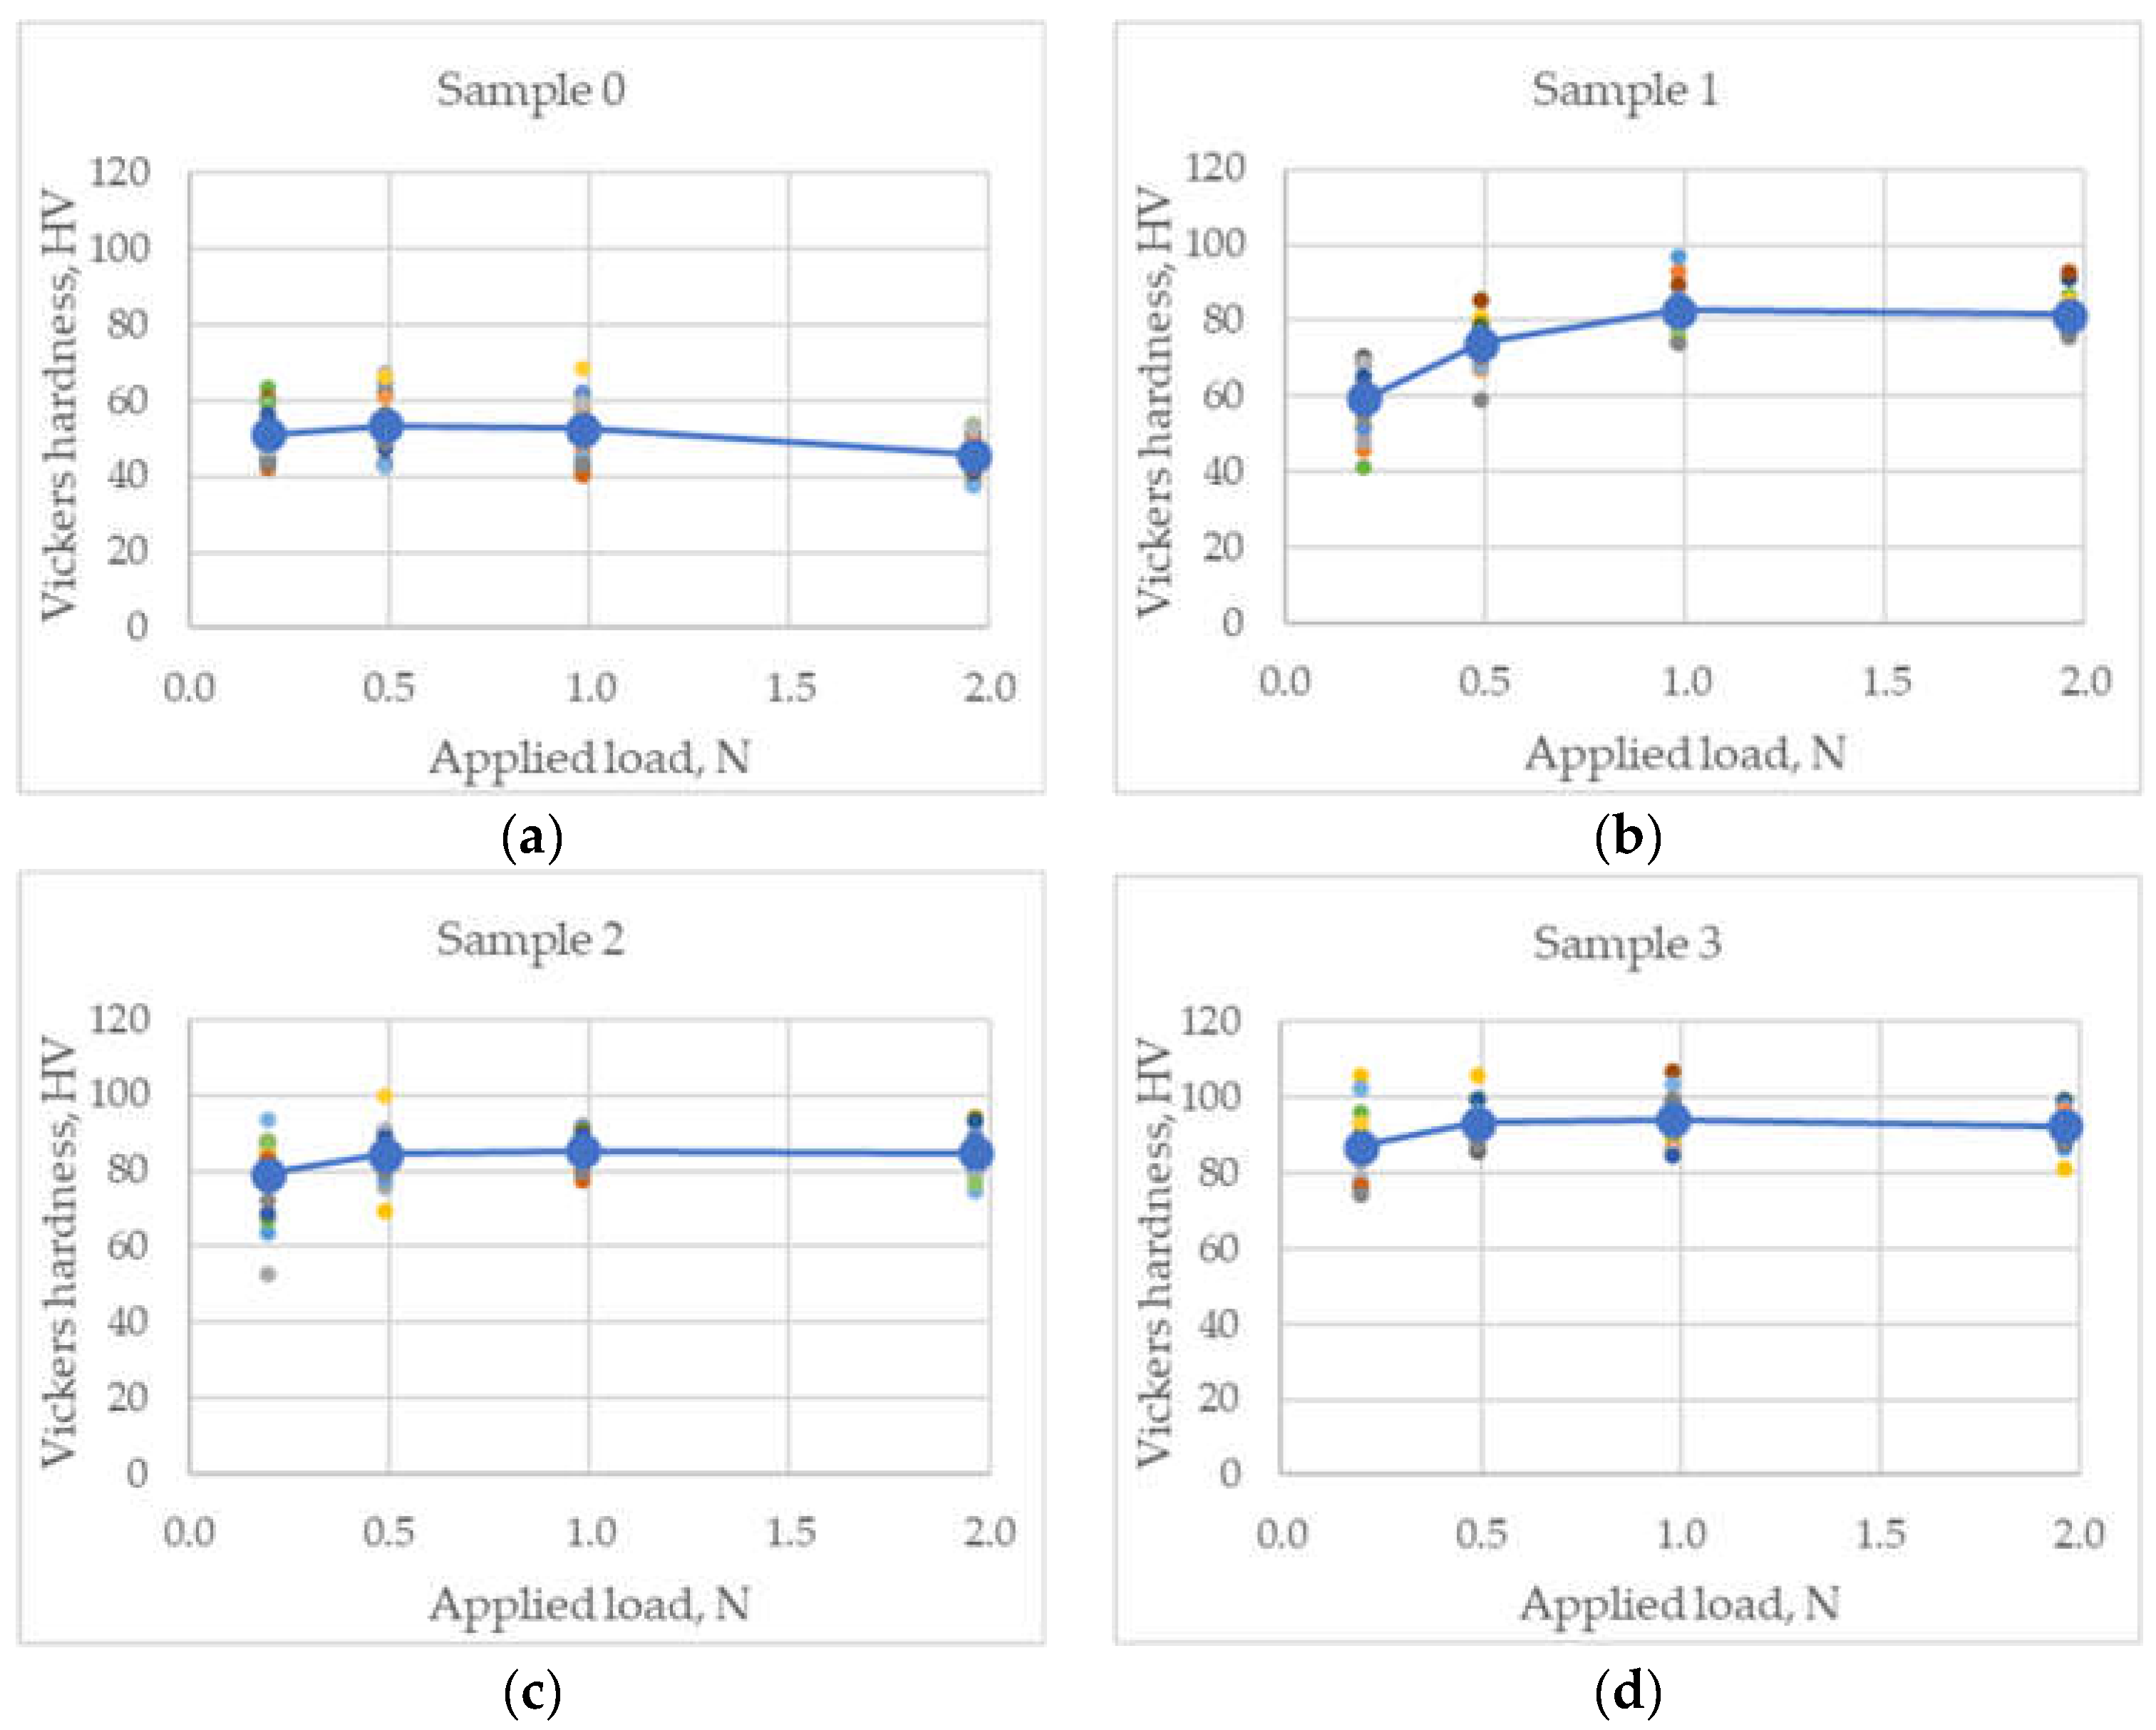
3.2. Hardness Measurement

A graphical representation of the gained results is given in Figure 6 and Figure 7. In Figure 6, dependance of the Vickers hardness (arithmetical mean values and standard deviations) on the number of ECAP passes is illustrated.
The graphs in Figure 7 show the influence of the applied load on the hardness for all four representative samples, as follows: Sample 0: cast; Sample 1: after one ECAP pass; Sample 2: after two ECAP passes; Sample 3: after three ECAP passes.

4. Discussion

According to the results given in Figure 6. it can be noticed that the hardness of the composite increases after every ECAP pass. At the cast composite, sample 0, the lowest value of the hardness was measured as 42 (HV0.02), and lowest arithmetical mean value as 46 (HV0.2). In the microstructure analysis, the dendritic structure with FA agglomerations was observed in this sample, which evidently had an influence on the hardness. After every ECAP pass, there were some changes and microstructure improvements, which caused the increase in hardness. The greatest hardness was measured at the three-time pressed composite, sample 3, as 107 (HV0.1), and the highest arithmetical mean value as 94 (HV0.1). In most of the cases, first ECAP, due to intensive plastic deformation, led to the greatest hardness increment, while later passes caused a lower hardness increment compared to the first pass. This was not the case with HV0.02. Results show that with higher indentation loads, the scattering of the hardness measurement results generally decreases for pressed samples. When applying the higher indentation loads, there is a lower possibility that the hardness of only one phase (single matrix grain, eutectic, FA, or some void) will be measured. As the number of passes increases, at the lowest load (HV0.02), the standard deviation and scattering of the results increase, and at higher loads (HV0.05, HV0.1 and HV0.2) the standard deviation decreases.
All samples showed dependency of the hardness on the applied load (Figure 7). According to Figure 6 and Figure 7, the greatest dissipation of the results and highest values of standard deviation were at lowest load, HV0.02. These differences occur depending on whether the indenter hits the crystal grain, void or FA. The differences between the mean hardness values measured at different loads are very pronounced in sample 1 (Figure 7b). In the case of the cast sample (Figure 7a) and specimens after 2 and 3 ECAP passes (Figure 7c,d), these differences are much smaller.
Sample 0 shows a decrease in hardness with increasing test load. Pressed samples show an increase in hardness with increasing test load. To describe this phenomenon and quantify the influence of the applied indentation load F on the hardness of the composite material, the mathematical model named Meyer’s law was used [21,22,23,24,25]:
F   =   K d n
where d is the indentation diagonal length according to expression (1), n is the Meyer’s number (index) and K is the standard hardness constant (Nmm−n).
The values of the coefficients K and n in Equation (3) depend on the applied load F and can be easily calculated by linear regression analysis of the log F versus log d (Figure 8).
Meyer’s index n is determined as the slope of the lines on the graphs shown in Figure 8, and log K is the section on the ordinate. According to Meyer’s law, values n < 2 indicate that the material has “normal” ISE: hardness decreases with the load increasing, and that was the case with the cast composite. For n > 2, the material shows reverse ISE (RISE-hardness increases with load increasing), which was the case with samples subjected to ECAP. Results of the linear regression analysis are given in Table 1. The coefficient K is the highest in sample 1, which indicates that this sample has the greatest increase in hardness with increasing load.
For all samples, a high coefficient of determination R2 confirms that Meyer’s law describes this phenomenon well.

5. Conclusions

Based on the experimental research conducted, several conclusions can be drawn:
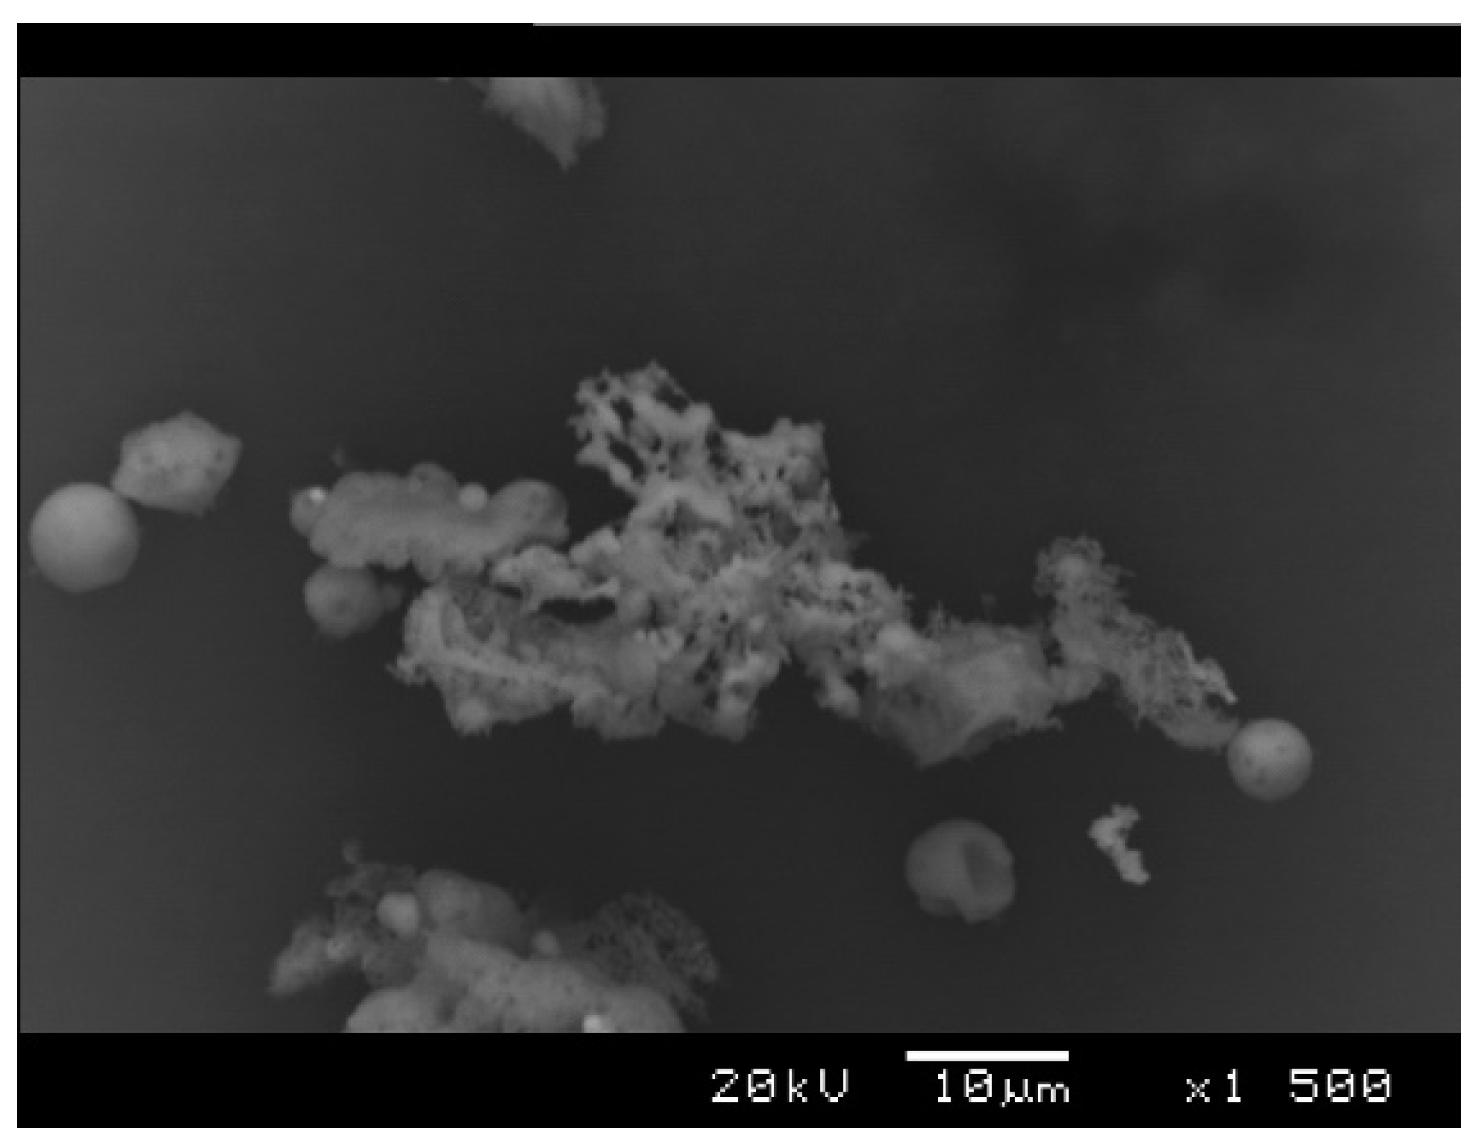
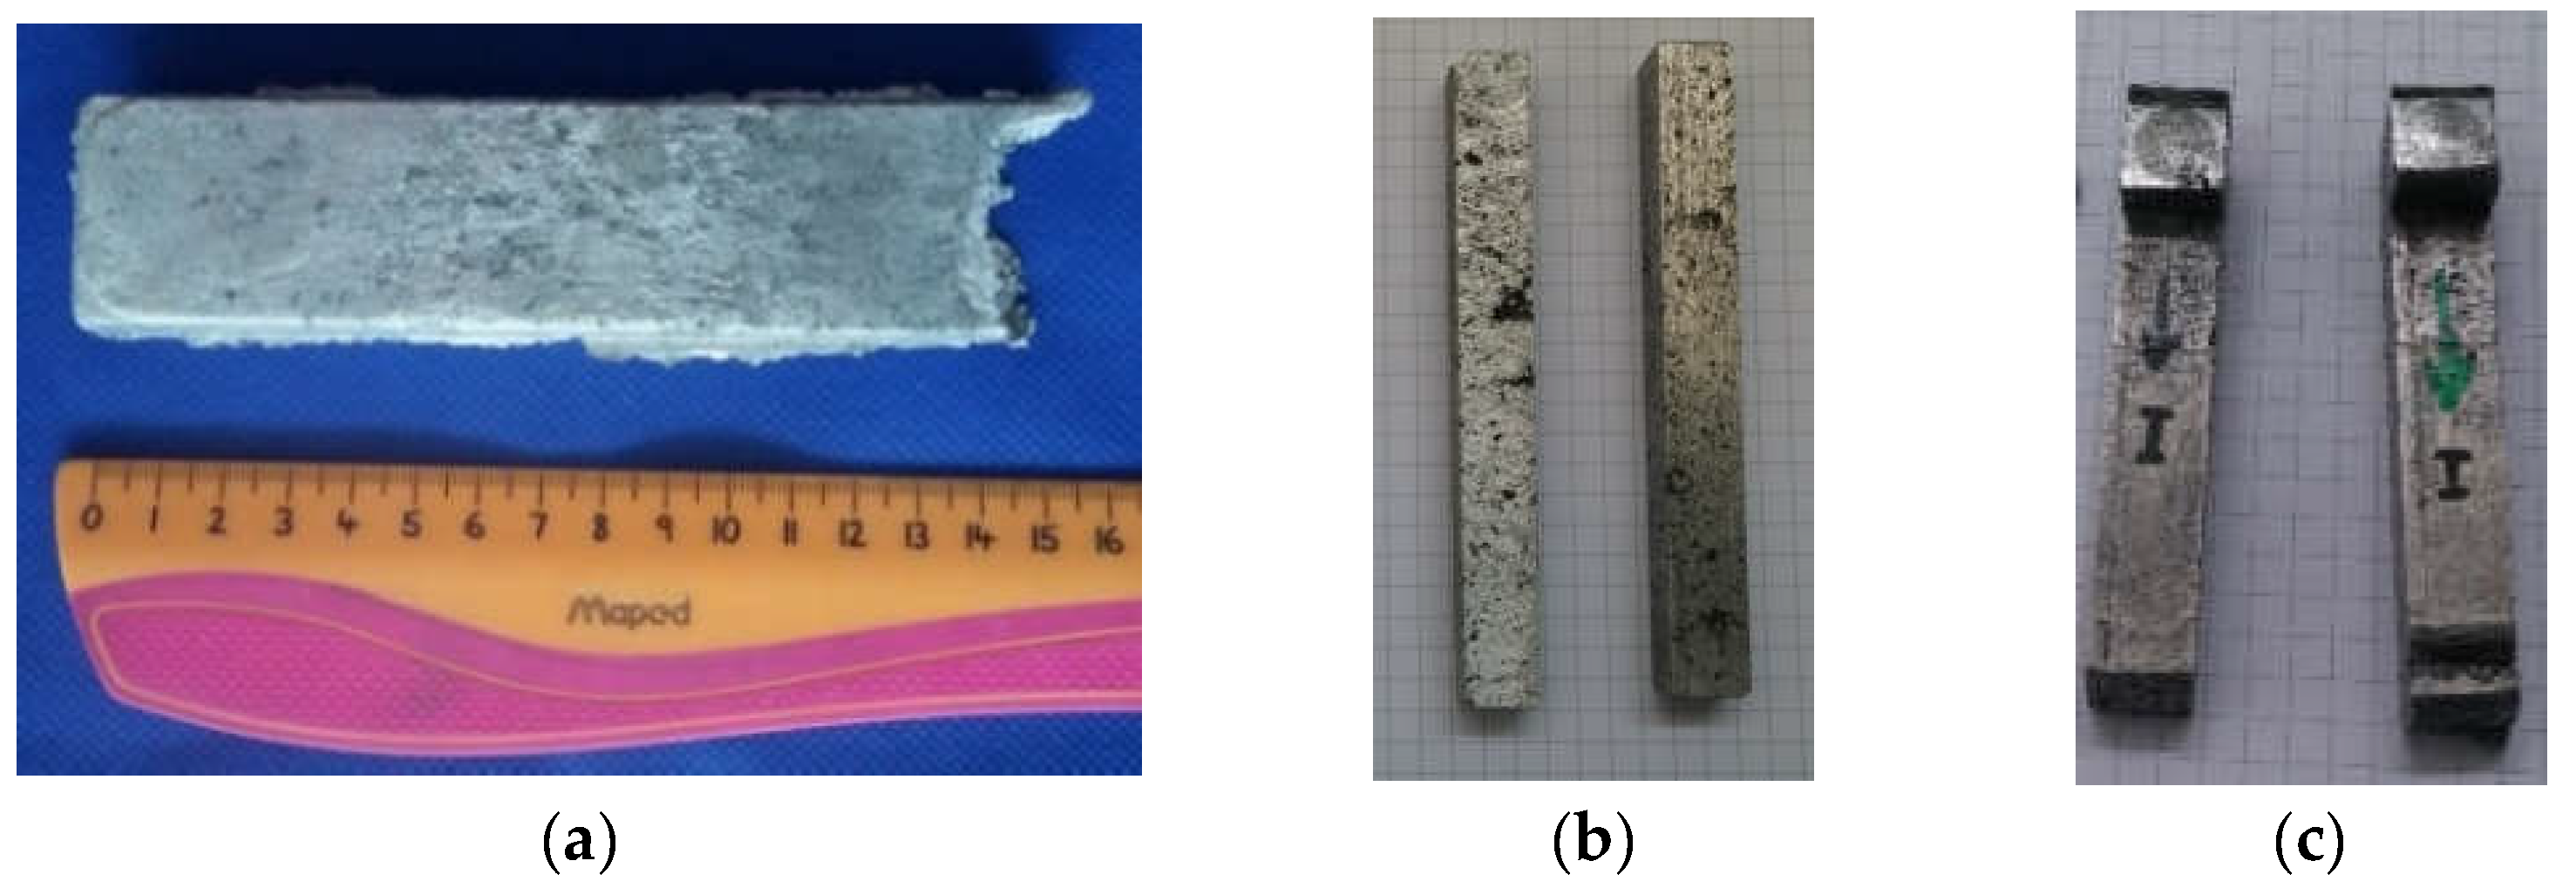
It is possible to produce composite with A356 aluminum alloy matrix with FA reinforcement by the compo casting method.
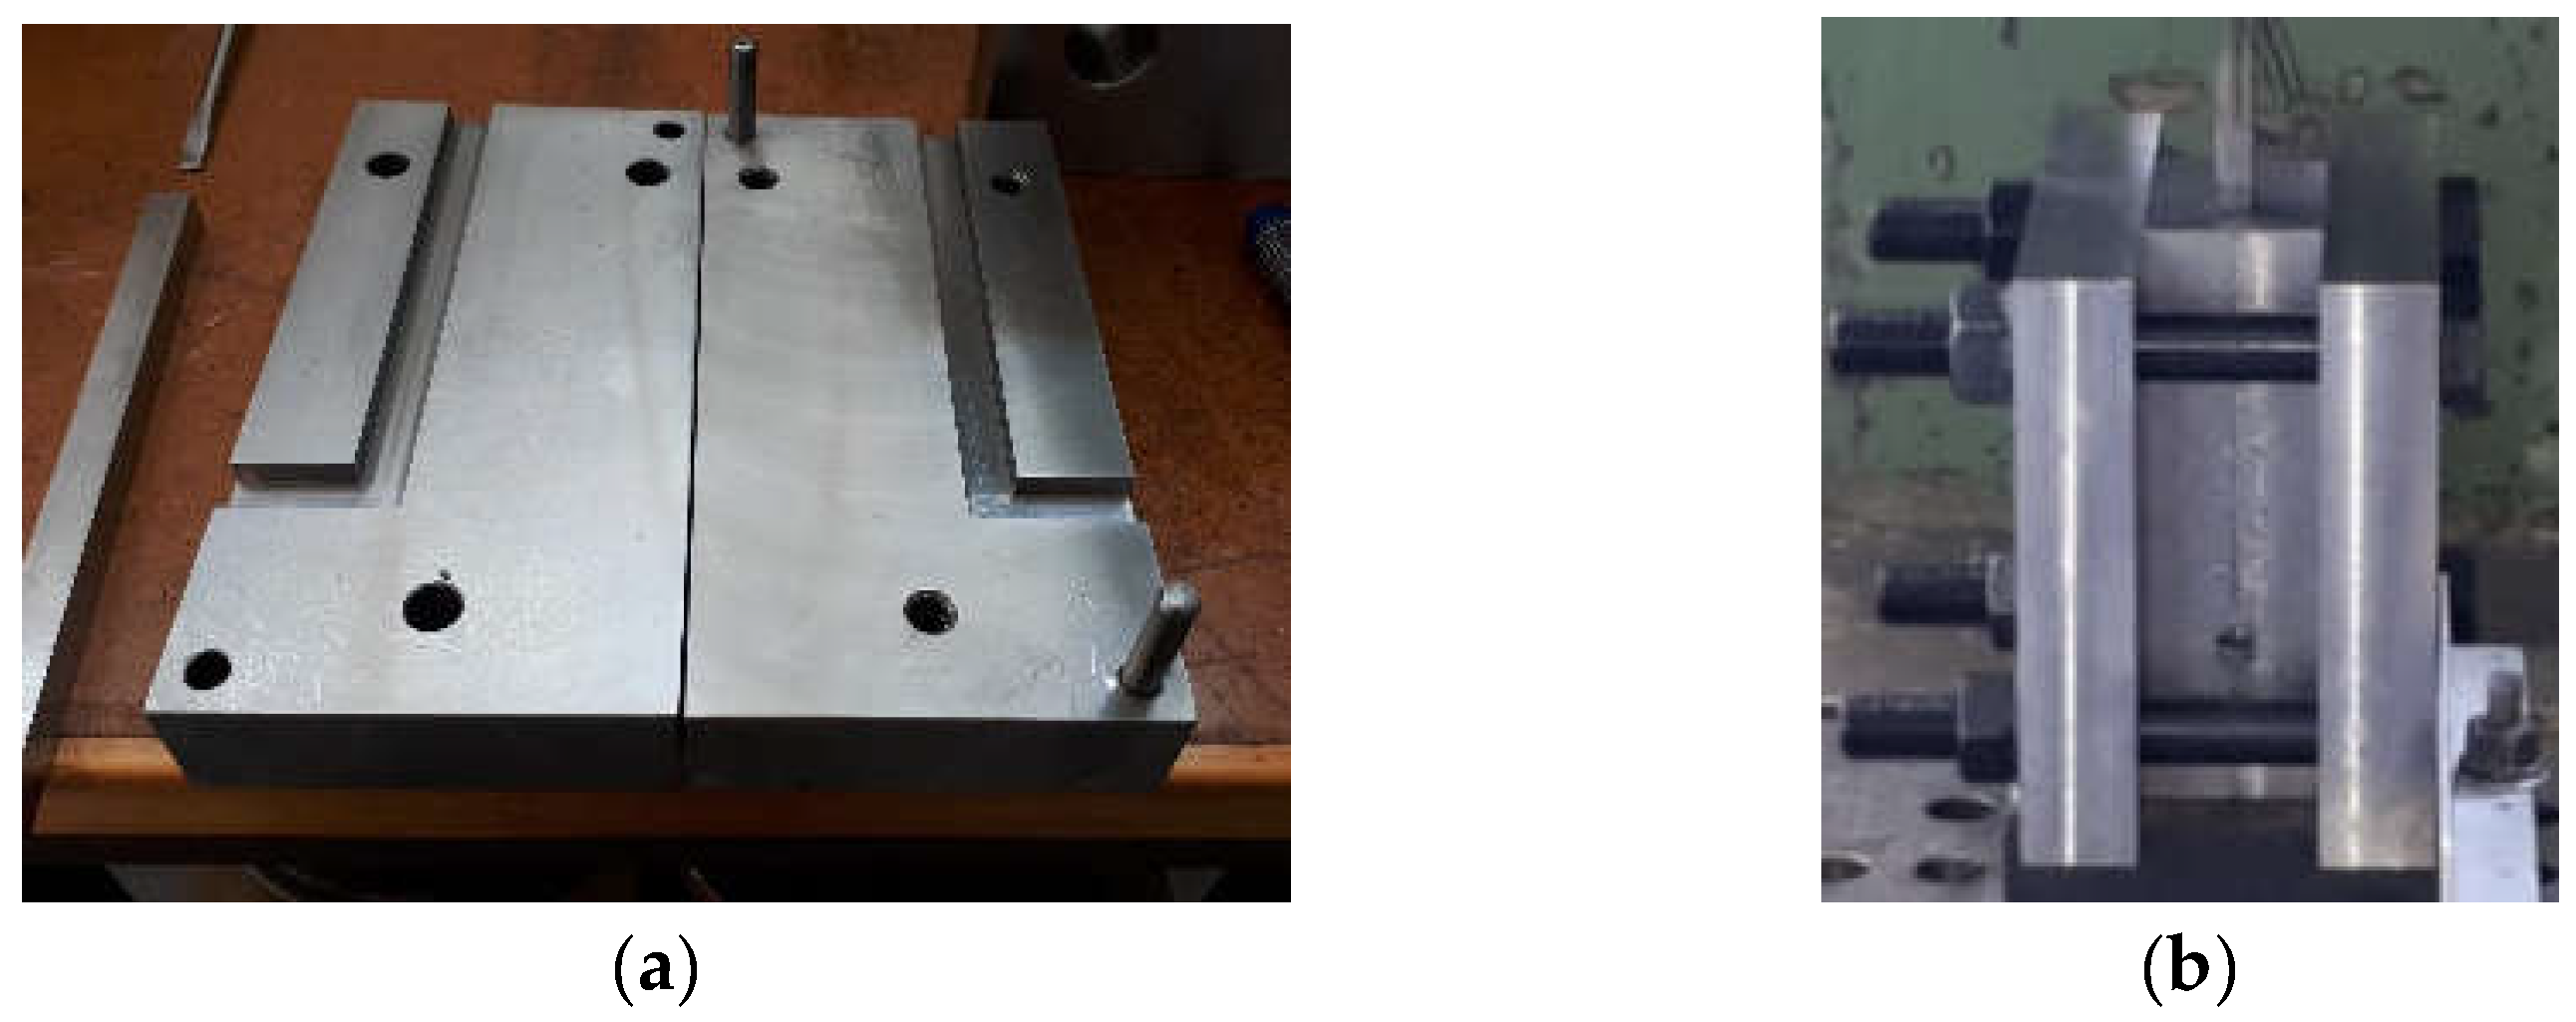
Composite A356 + 6%FA can be machined by ECAP in a square tool and in several passes.
After each pass of ECAP, the microstructure of the composite is improved and FA is additionally incorporated into the matrix.
ECAP influences the hardness of the material intensively: after each ECAP pass, Vickers hardness is increased.
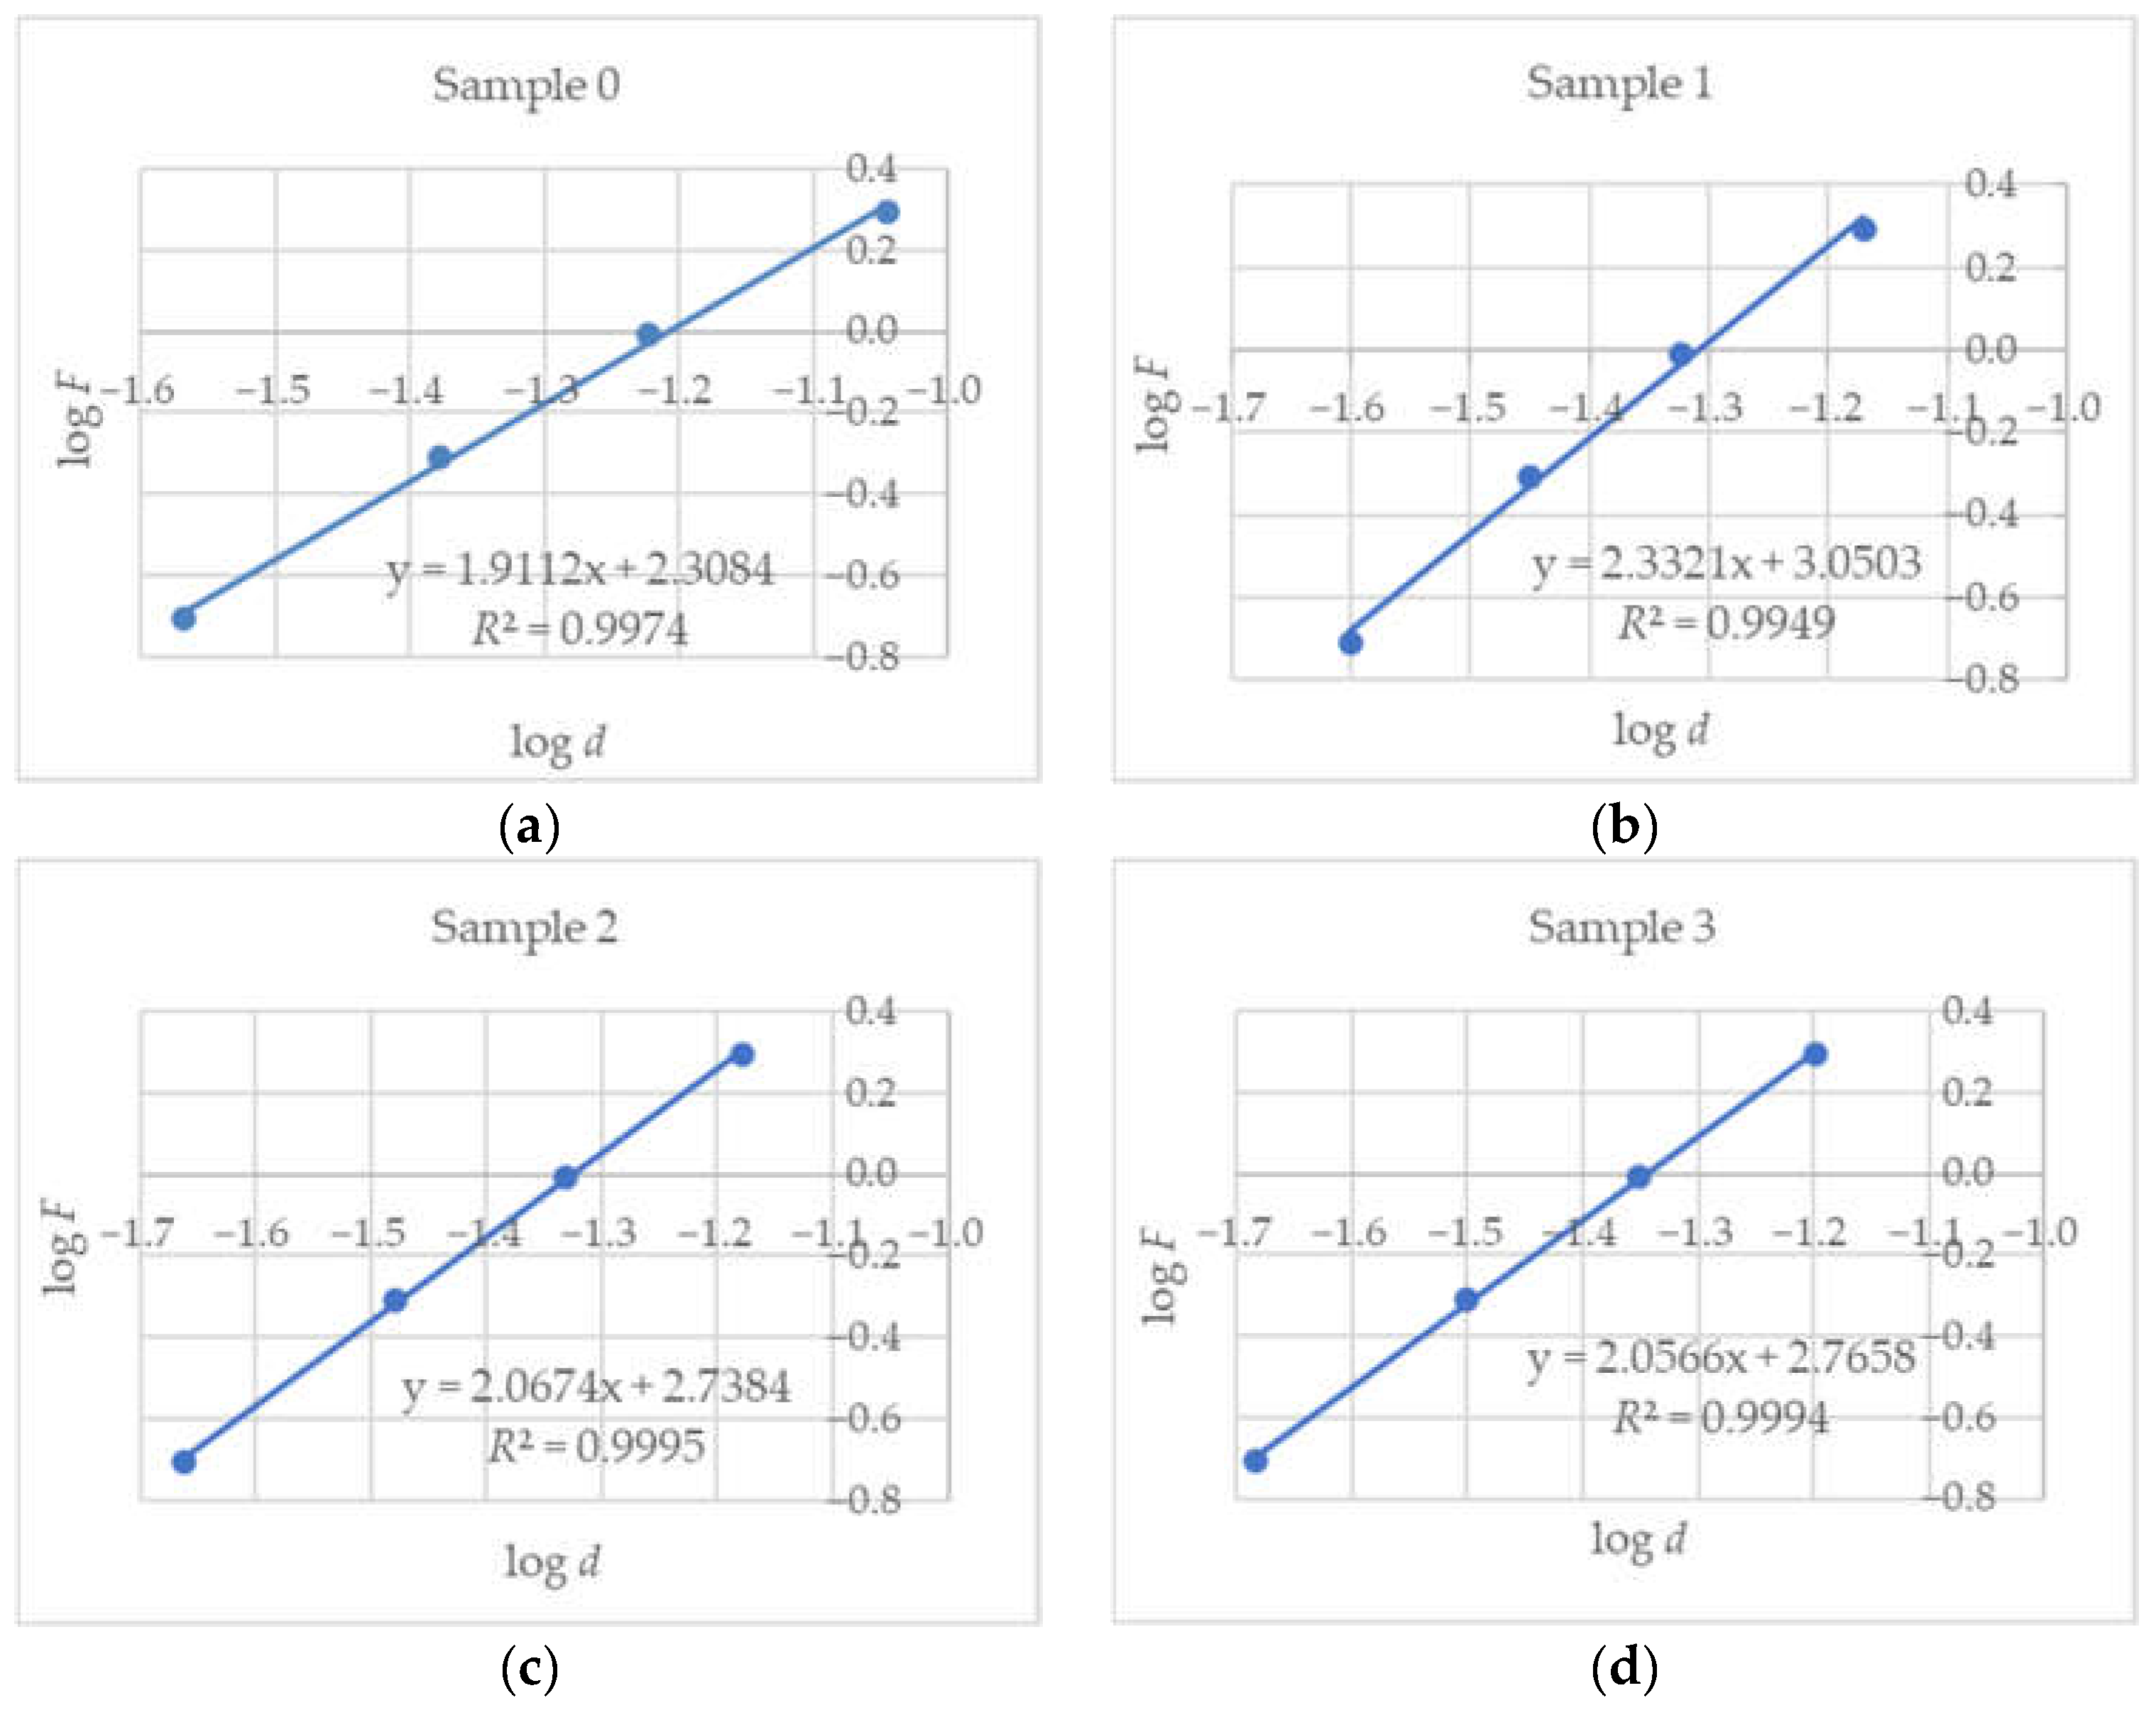
Applied load in the Vickers hardness test has an influence on the results, which can be well described by the mathematical model named Meyer’s law.
Dissipation of the hardness value for pressed samples generally decreases with increasing indentation load.
According to Meyer’s law and the acquired measurement results, the cast composite shows normal ISE, while samples machined with ECAP show reverse ISE-RISE.

Author Contributions

Conceptualization, V.R. and M.M.; methodology, V.R. and V.M.; software, L.O.; validation, V.R. and V.M.; formal analysis, M.M. and L.O.; investigation, M.M. and L.O.; resources, M.M. and V.M.; data curation, M.M. and V.M.; writing—original draft preparation, M.M.; writing—review and editing, V.R., V.M. and M.M; visualization, M.M. and L.O.; supervision, V.R. and V.M.; project administration, L.O.; funding acquisition, M.M. All authors have read and agreed to the published version of the manuscript.

Funding

This research received no external funding.

Institutional Review Board Statement

Not applicable.

Informed Consent Statement

Not applicable.

Data Availability Statement

Not applicable.

Acknowledgments

This research was partially supported by the Federal Ministry of Education and Science, Bosnia and Herzegovina.

Conflicts of Interest

The authors declare no conflict of interest.

References

  1. Pan, S.; Jin, K.; Wang, T.; Zhang, Z.; Zheng, L.; Umehara, N. Metal matrix nanocomposites in tribology: Manufacturing, performance, and mechanisms. Friction 2022, 10, 1–39. [Google Scholar] [CrossRef]
  2. Pan, S.; Wang, T.; Jin, K.; Cai, X. Understanding and designing metal matrix nanocomposites with high electrical conductivity: A review. J. Mater. Sci. 2022, 57, 6487–6523. [Google Scholar] [CrossRef]
  3. Ramanathan, A.; Krishnan, P.K.; Muraliraja, R. A review on the production of metal matrix composites through stir casting—Furnace design, properties, challenges, and research opportunities. J. Manuf. Process. 2019, 42, 213–245. [Google Scholar] [CrossRef]
  4. Sharma, A.K.; Bhandari, R.; Pinca-Bretotean, C. A systematic overview on fabrication aspects and methods of aluminum metal matrix composites. Mater. Today Proc. 2021, 45, 4133–4138. [Google Scholar] [CrossRef]
  5. Ružić, J.; Simić, M.; Stoimenov, N.; Božić, D.; Stašić, J. Innovative processing routes in manufacturing of metal matrix composite materials. Metall. Mater. Eng. 2021, 27, 1–13. [Google Scholar] [CrossRef]
  6. Dwivedi, S.P.; Sharma, S.; Mishra, R.K. A356 Aluminum Alloy and applications—A Review. IJAMMC 2014, 4, 81–86. [Google Scholar] [CrossRef]
  7. Dwivedi, A.; Jain, M.K. Fly Ash—Waste management and overview: A Review. Recent Res. Sci. Technol. 2014, 6, 30–35. [Google Scholar]
  8. Kurda, R.; Silvestre, J.D.; de Brito, J. Toxicity and environmental and economic performance of fly ash and recycled concrete aggregates use in concrete: A review. Helyion 2018, 4, e00611. [Google Scholar] [CrossRef]
  9. Energy Education—Fly Ash. Available online: https://energyeducation.ca/encyclopedia/Fly_ash (accessed on 29 October 2019).
  10. Razzaq, A.M.; Majid, D.L.; Basheer, U.M.; Aljibori, H.S.S. Research Summary on the Processing, Mechanical and Tribological Properties of Aluminium Matrix Composites as Effected by Fly Ash Reinforcement. Crystals 2021, 11, 1212. [Google Scholar] [CrossRef]
  11. Roomey, R.K.; Haque, E.; Akhter, S. Development and analysis of fly ash reinforced aluminum alloy matrix composites. AJER 2017, 6, 334–339. [Google Scholar]
  12. Razzaq, A.M.; Majid, D.L.; Manan, N.H.; Ishak, M.R.; Basheer, U.M. Effect of Fly Ash Content and Applied Load on Wear Behaviour of AA6063 Aluminium Alloy. Mater. Sci. Eng. 2018, 429, 012038. [Google Scholar] [CrossRef]
  13. Maksimović, V.; Devečerski, A.; Došen, A.; Bobić, I.; Erić, M.; Volkov-Husović, T. Comparative Study on Cavitation Erosion Resistance of A356 Alloy and A356FA5 Composite. Trans. Indian Inst. Met. 2017, 70, 97–105. [Google Scholar] [CrossRef]
  14. Muslić, M.; Maksimović, V.; Bobić, I. Casting an Al alloy 2024+4 % fly ash composite suitable for processing by plastic deformation. In Proceedings of the 17th International Foundrymen Conference—Hi-Tech Casting Solution and Knowledge Based Engineering, Opatija, Croatia, 16–18 May 2018. [Google Scholar]
  15. Selvam, J.D.R.; Smart, D.R.; Dinaharan, I. Synthesis and characterization of Al6061-fly Ashp-SiCp composites by stir casting and compocasting methods. Energy Procedia 2013, 34, 637–646. [Google Scholar] [CrossRef] [Green Version]
  16. Segal, V. Equal-Channel Angular Extrusion (ECAE): From a Laboratory Curiosity to an Industrial Technology. Metals 2020, 10, 244. [Google Scholar] [CrossRef] [Green Version]
  17. Skrotzki, W. Deformation heterogeneities in equal channel angular pressing. Mater. Trans. 2019, 60, 1331–1343. [Google Scholar] [CrossRef] [Green Version]
  18. Muslić, M.; Rede, V.; Maksimović, V. Solid particle erosion resistance of Al alloy and Al alloy-fly ash composite subjected to equal-channel angular pressing. Metall. Mater. Eng. 2021, 27, 15–26. [Google Scholar] [CrossRef]
  19. Bhandakkar, A.; Singh, K.; Limay, P.K.; Sastry, S.M.L. Wear behaviour of equal chanel angular pressed aluminium AA2024 flay ash metal matrix composites. IJTRD 2016, 3, 688–695. [Google Scholar]
  20. Sekhar, A.P.; Nandy, S.; Ray, K.K.; Debdulal, D. Hardness—Yield strength relation of Al-Mg-Si alloys. Mater. Sci. Eng. 2018, 338, 012011. [Google Scholar] [CrossRef]
  21. Matyunin, V.M.; Abusaif, N.; Marchenkov, A.Y. Analysis of the indentation size effect on the hardness measurements of materials. J. Phys. Conf. Ser. 2019, 1399, 044016. [Google Scholar] [CrossRef] [Green Version]
  22. Petrík, J.; Blaško, P.; Mihaliková, M.; Vasilňáková, A.; Mikloš, V. The relationship between the deformation and the indentation size effect (ISE). Metall. Res. Technol. 2019, 116, 622. [Google Scholar] [CrossRef]
  23. Renjo, M.M.; Rede, V.; Ćurković, L. Reverse indentation size effect of a duplex steel. Met. Mater. 2014, 52, 299–304. [Google Scholar] [CrossRef] [Green Version]
  24. Ćurković, L.; Lalić, M.; Šolić, S. Analysis of the indentation size effect on the hardness of alumina ceramics using different models. Met. Mater. 2009, 47, 89–93. [Google Scholar] [CrossRef]
  25. Petrík, J.; Blaško, P.; Bidulská, J.; Guzanová, A.; Sinaiová, I. The automatic testers in microhardness measurement and ISE effect. Acta Metall. Slovaca 2016, 22, 195–205. [Google Scholar] [CrossRef] [Green Version]
  26. Csehová, E.; Andrejovská, J.; Limpichaipanit, A.; Dusza, J.; Todd, R. Hardness and indentation load-size effect in Al2O3-SiC nanocomposites. Met. Mater. 2011, 49, 119–124. [Google Scholar] [CrossRef]
Figure 1. Scanning Electron Microscope (SEM) image of the Fly Ash (FA) used for composite production.
Metals 12 00821 g001
Figure 2. Material and Equal Channel Angular Pressing (ECAP): (a) Cast ingot of composite; (b) Samples of composite machined and prepared for ECAP and (c) after one ECAP pass.
Metals 12 00821 g002
Figure 3. ECAP tool: (a) die and (b) in process.
Metals 12 00821 g003
Figure 4. Vickers hardness measurement: (a) indentation prints and (b) schematic.
Metals 12 00821 g004
Figure 5. Microstructure of A356 + 6%FA composite (a) before ECAP cast, (b) after 1 ECAP pass, (c) after 2 ECAP passes and (d) after 3 ECAP passes.
Metals 12 00821 g005
Figure 6. Vickers hardness versus the number of ECAP passes.
Metals 12 00821 g006
Figure 7. Dependance of HV on applied load F (N): (a) Sample 0; (b) Sample 1; (c) Sample 2; and (d) Sample 3. Every measurement result is marked with different color to illustrate scattering, and the bigger blue dots represent arithmetical mean values.
Metals 12 00821 g007
Figure 8. The Vickers hardness data according to Meyer’s law: (a) Sample 0; (b) Sample 1; (c) Sample 2; and (d) Sample 3.
Metals 12 00821 g008
Table 1. Results of linear regression by Meyer’s law.
SamplenLog KK (N mm−n)R2
01.91122.30842030.9974
12.33213.050311230.9949
22.06742.73845840.9995
32.05662.76585830.9994
Publisher’s Note: MDPI stays neutral with regard to jurisdictional claims in published maps and institutional affiliations.

