Article

Observing the Effect of Grain Refinement on Crystal Growth of Al and Mg Alloys during Solidification Using In-Situ Neutron Diffraction

by
Abdallah Elsayed
1,*,
Francesco D’Elia
2,
Comondore Ravindran
3 and
Dimitry Sediako
4
1
School of Engineering, University of Guelph, Guelph, ON N1G 2W1, Canada
2
Division of Biomedical Engineering, Uppsala University, SE-751 05 Uppsala, Sweden
3
Centre for Near-Net-Shape Processing of Materials, Ryerson University, Toronto, ON M5B 2K3, Canada
4
High Performance Powertrain Materials, University of British Columbia, Kelowna, BC V1V 1V7, Canada
*
Author to whom correspondence should be addressed.
Metals 2022, 12(5), 793; https://doi.org/10.3390/met12050793
Submission received: 5 April 2022 / Revised: 26 April 2022 / Accepted: 28 April 2022 / Published: 4 May 2022

Abstract

:
The present research uses in-situ neutron diffraction to examine the effect of grain refinement on grain growth during solidification of Al-5 wt.% Cu and Mg-5 wt.% Zn alloys. The alloys were grain refined through additions of Al-5Ti-1B and Zr, respectively. The in-situ neutron diffraction experiments were carried out by heating the alloys to temperatures above the liquidus and subsequently cooling in 5 or 10 °C temperature steps to temperatures below solidus, while being irradiated by thermal neutrons. With the addition of grain refiners, grain size reductions of 92% were observed for both the Al-5 wt.% Cu and Mg-5 wt.% Zn alloys. The refined and unrefined Al-5 wt.% Cu alloys contained α-Al with Al2Cu along the grain boundary regions. Differences in Al2Cu morphology were observed in the grain refined alloys. The Mg-5 wt.% Zn alloy contained MgZn intermetallic phases with primary Mg. The refined Mg-5 wt.% Zn-0.7 wt.% Zr alloy contained Mg, MgZn and Zn2Zr phases. In-situ neutron diffraction enabled quantification of individual plane solid fraction growth for the α-Al and Al2Cu phases in the Al-Cu alloys, and for α-Mg in the Mg alloys. For the unrefined Al-5 wt.% Cu, the coarse microstructure resulted in a rapid solid fraction rise at temperatures just below liquidus followed by a gradual increase in solid fraction until the sample was fully solid. The grain-refined Al-5 wt.% Cu alloys showed a columnar to equiaxed microstructure transition and a more gradual growth in fraction solid throughout solidification. For the Mg-5 wt.% Zn alloy, the more packed ( 0002 ) and ( 10 1 ¯ 1 ) α-Mg plane intensities grew at a slower rate than the ( 10 1 ¯ 0 ) plane intensity, resulting in an irregular grain structure. With the addition of the Zr grain refiner, the Mg-5 wt.% Zn-0.7 wt.% Zr alloy had ( 10 1 ¯ 0 ) , ( 0002 ) and ( 10 1 ¯ 1 ) planes intensities all increasing at similar rates, especially at the early stages of solidification. FactSage™ (version 6.4, Montréal, QC, Canada) equilibrium solidification models followed the fraction solid curves developed by tracking the fastest growing planes of the Mg alloys.

1. Introduction

An improvement in the strength and ductility of aluminum (Al) and magnesium (Mg) alloys is required for their consideration as weight saving transportation materials for wheels, suspensions, battery trays and motor casings. Some of these components are difficult to produce by means other than permanent mold casting or sand casting where a fine cast grain structure cannot be readily achieved due to relatively low cooling rates [1]. The use of grain refiners is therefore essential to achieve this goal.
Grain refinement improves mechanical properties [2], enables uniform distribution of solute and secondary phases [3], decreases solution heat treatment times [4], increases pressure tightness [5] and increases feeding while reducing segregation, porosity and hot tearing [4,5,6,7]. On a processing level, grain refinement provides consistent mechanical properties after heat treatment, improved machinability [5] and formability [8] by weakening texture [9]. Unlike solid solution strengthening, precipitation hardening and work hardening, grain refinement imparts improvements in strength without hindering ductility [10,11].

1.1. Grain Refinement of Al Alloys Using Al-Ti-B Refiners

The grain refinement of Al alloys has been a curiosity for researchers since the 1940s [12] due to both scientific interest in the underlying mechanisms and the significant practical benefits grain refinement imparts on castings. The grain refining mechanism for Al using Al-Ti-B based refiners has been recently attributed to the formation of a layer of TiAl3 on TiB2 particles [13,14], which aids in the potency for nucleating α-Al. A monolayer of ( 112 ) TiAl3 on the ( 0001 ) plane of TiB2 was found to have a lattice misfit with an α-Al of 0.09%, significantly lower than the 4.22% of TiB2 alone [13]. This results in an undercooling of only 0.3 K when the size of the nucleant particles is 2 µm [15,16]. The size distribution of such nucleating particles is important for achieving effective grain refinement. Effective nucleant sizes are typically 1–5 µm [17,18,19], and with such sizes, achieving a sufficient number of nucleants for grain refinement is possible, since only 1% of added nucleants are generally active [20,21]. In addition, Al alloys require sufficient solute to achieve fine, equiaxed grain structures. The presence of many potent nucleants with low solute results only in fine, columnar structures, while, on the contrary, sufficient solute with only a few nucleants results in coarse, equiaxed structures [13]. Sufficient solute can be achieved by added Ti due to its high solute restricting effect in Al [19,21]. In terms of relative contribution to grain refinement, doubling the amount of solute has a much greater refining effect than doubling the number of potent nucleants in a system with sufficient nucleants [21]. The solute effect is also sufficient to maintain equiaxed structures even in still, low thermal gradient melts that have appreciable solid and liquid phase density differences such as Al-Cu alloys [22].

1.2. Grain Refinement of Al Free, Mg Alloys Using Zr

The extraordinary grain refining effect of Zr was discovered in the late 1930’s [23,24] and observed for Mg alloys free of Al [1,18,25,26,27,28,29,30,31,32,33,34,35,36,37,38,39,40]. The refinement mechanism of Zr is due to Zr solute and appropriately sized insoluble Zr particles [1,32,33,34]. The soluble Zr accounts for 70% of the grain refinement contribution [32] with its growth restriction factor (Q) being 38.29 K/wt.% [6,28,40]. The growth restriction factor for any solute in any alloy is calculated using Equation (1), where m is the liquidus line slope in °C/wt.% on the equilibrium binary phase diagram, Co is the solute concentration in wt.% and k is the equilibrium distribution coefficient calculated as the ratio of solute in the solid divided by the solute in the liquid [40].
Q = m C o [ k 1 ]
The insoluble Zr acts as a nucleant [35] on the Mg basal ( 0002 ) or prismatic ( 10 1 ¯ 0 ) planes [41], with the planar disregistry between Zr and Mg being 0.5% [39]. Active Zr nucleants were typically 1–5 μm. The undercooling with a 1 μm sized Zr particle for nucleation to start and continue is only 0.15–0.58 K. The most active nucleants are ~2 μm in size, while particles > 5 μm were ineffective and < 1 μm particles had poor refining efficiencies [31,42]. Zirconium rich cores (<15 μm) are usually observed from a peritectic reaction [40] at 653.56 °C with 0.45 wt.% Zr [39]. The cores are nearly pure Zr and are typically circular or elliptical and found within grains or at grain boundaries [35]. Improvements in Zr grain refinement can be made by introducing more appropriately sized Zr particles that are able to act as potent nucleants [38] and increased understanding of Zr cores [43] to maximize Zr recovery and reduce refining costs. The addition of Zr at temperatures between 680 to 780 °C also has a negligible influence on Zr recovery [33].
The addition of Zr to Mg alloys containing Al, Mn, Si, Fe, Ni, Co, Sn and Sb forms stable intermetallics [1,26,40,44] with Zr, which are ineffective in grain refining. Increasing the Zn addition improves Zr solubility up to concentrations of ~4 wt.%, beyond which Zn-Zr intermetallics form [27]. The grain structure will be columnar if a sufficient temperature gradient exists and few nucleation events are present [42]; the addition of 0.22 wt.% Zr to a Mg-Zn based alloy demonstrated sufficient solute for providing a columnar to equiaxed grain transition [37].
Zirconium is nearly the perfect grain refiner because of its good lattice matching and high growth restriction [38], and it is the most powerful grain refining agent for Mg alloys in commercial use [45]. However, the exceptional refining effect of Zr has never been documented using in-situ neutron diffraction.

1.3. Neutron Diffraction as a Tool for Materials Characterisation

Neutron diffraction is a powerful technique for characterising materials [46], as neutrons are electrically neutral and are only scattered by atomic nuclei, giving them high penetration depths, unlike X-rays and electrons that are scattered by electron clouds. The literature on in-situ neutron diffraction for solidification analysis was recently reviewed by [47]. Studies examining the early stages of solidification showed that TiB2 addition increased the nucleation rate of Al by an order of magnitude for Al alloys as compared to a pure Al sample [48,49]. In-situ neutron diffraction has also been utilized to quantify the growth of primary Si and Al independently in an Al-19 wt.% Si alloy [50,51] as well as to detect Al2Cu in Al-Cu alloys for hot tearing studies [52,53,54]. In-situ solidification studies of Al alloys using X-rays have been very useful because of their high resolution but are limited to the investigation of localized areas with attendant difficulties in producing sufficient elemental contrast in Al-Si based systems [55]. More recent in-situ neutron diffraction research on Al alloys has examined the 319 alloy system [56], Si modification with Sr [57,58] and crystallographic parameters [59].
Previous literature on Mg alloys using in-situ neutron diffraction has focused on deformation studies [60,61,62,63,64,65,66] or the solidification of Mg-6 and 9 wt.% Al [67,68], AZ91D [69] and Mg-Zn alloys [70,71]. The existing literature helped determine the appropriate procedures and conditions required for effective in-situ neutron diffraction analysis.

1.4. Present Study

The present study is an attempt to examine grain refinement of Al-Cu and Mg-Zn alloys utilizing neutron diffraction, as it may offer new perspectives in the understanding of nucleation and growth. This research is not an attempt to further demonstrate the already well documented refining potential of Al-5Ti-1B and Zr additions to Al and Mg alloys, respectively, but to characterise grain refinement using in-situ neutron diffraction. The in-situ neutron diffraction results will also be compared to FactSage™ (version 6.4, Montréal, QC, Canada) simulations.

2. Materials and Methods

2.1. Casting of Al-Cu and Mg-Zn Alloys

The Al-5 wt.% Cu (denoted Al-Cu), Al-Cu-0.02 wt.% Ti (denoted Al-Cu-02Ti) and Al-Cu + 0.05 wt.% Ti (denoted Al-Cu-05Ti) alloys were prepared using virgin ingots of commercial purity Al, and additions of Cu were made using an Al-20 wt.% Cu master alloy. Additions of Ti for grain refinement were carried out via an Al-5 wt.% Ti-1 wt.% B master alloy. The added B using the Al-5 wt.% Ti-1 wt.% B master alloy to the Al-Cu-02Ti alloy was 0.004 wt.% B; it was 0.01 wt.% B for the Al-Cu-05Ti alloy. In the case of the Mg alloys, the target Mg-5 wt.% Zn (denoted Mg-Zn) and Mg-5 wt.% Zn-0.7 wt.% Zr (denoted Mg-Zn-Zr) alloys were prepared using virgin ingots of commercial purity Mg (99.8 wt.%) and Zn (99.9 wt.%). Additions of Zr were made using a Mg-30 wt.% Zr master alloy. A zirconium addition level of 0.7 wt.% was used, as it falls into the range utilized in previous studies is beyond the peritectic concentration of 0.45 wt.% and is similar to commercial ZK60 alloy.
Al-Cu samples were prepared by first melting the Al and Al-Cu master alloy in a SiC crucible at 760 °C. The alloy was degassed at 760 °C using 0.25 wt.% sodium fluorosilicate. In the case of the Ti-refined alloys, the Al-Ti-B master alloy was added to the melt at 760 °C prior to degassing. For the Mg-Zn alloys, the required amounts of alloy elements were melted in a low carbon steel crucible at 750 °C.
The melts for both alloys were then held for five minutes before being mechanically stirred for 60 s at 200 RPM using a hand drill. Finally, the melts were skimmed and poured at 720 °C into rod-shaped steel moulds preheated to 300 °C. The Mg-Zn alloy was protected under a cover gas of CO2 + 0.5 vol.% SF6 during melting and pouring. The compositions of the prepared alloys were verified using average values of three scans on an optical emission spectrometer. The compositions of the alloys are shown in Table 1.

2.2. In-Situ Neutron Diffraction

The procedures with accompanying figures for the in-situ neutron diffraction experiments are described in detail in previous publications [56,58,68]. For the current research, the sample sizes were 10 mm in diameter and 40 mm in length and were placed in a graphite crucible with a wall thickness of 1 mm. The in-situ neutron diffraction experiments were performed using the C2 powder diffractometer at the Canadian Neutron Beam Centre in Chalk River, Ontario, Canada. Monochromatic thermal neutrons with a wavelength of 2.37 Å were collected for diffraction angles (2θ) ranging from 30 to 110°. A Si single crystal with (311) reflection was used as a monochromator.
The Al-Cu and Mg-Zn alloys were heated to 660 °C and cooled to 440 °C or 200 °C in temperature steps while being subjected to neutron diffraction for 60 min at each temperature step. Cooling between temperature steps took ~10 min, with each temperature step being 5 or 10 °C. This gives an effective cooling rate between temperature steps of about 0.5–1 °C/min.
The alloys were protected from oxidation using an Ar cover gas maintained at a positive pressure of 3.5–7 kPa within the furnace chamber. During the neutron diffraction experiments, the entire furnace assembly was oscillated over a 36° range, and a vibratory motor connected to the crucible holder was used to agitate the sample. The oscillation and agitation prevented solute settling and reduced variations in lower intensity planes at different temperatures, as was observed in a previous study [71].
The neutron gauge volume was the entire cylindrical (diameter: 10 mm and length: 40 mm) volume. To remove background contributions from the experimental apparatus (thermocouple, furnace walls and crucible) to the diffraction plot, an empty crucible was also examined at the same temperatures and time durations to represent the background. FactSage™ software was used for comparative equilibrium solidification simulations.

2.3. Microstructure Characterisation

The Al-Cu and Mg-Zn alloys were sectioned, ground and polished to carry out optical microscopy (OM) and scanning electron microscopy (SEM) characterisation. Final polishing was conducted using 0.05 μm colloidal silica. The Al-Cu samples were then etched by immersion in a solution of Keller’s reagent for 30 s. Following immersion, they were rinsed with both ethanol and distilled water. The Mg-Zn alloys were etched in a solution of 10 mL ethanol, 10 mL acetic acid, 70 mL distilled water and 6 g of picric acid for 15 s followed by ethanol and water rinses. Grain size measurements were finally carried out on both alloys using the linear intercept method over a minimum of 50 grains.

3. Results

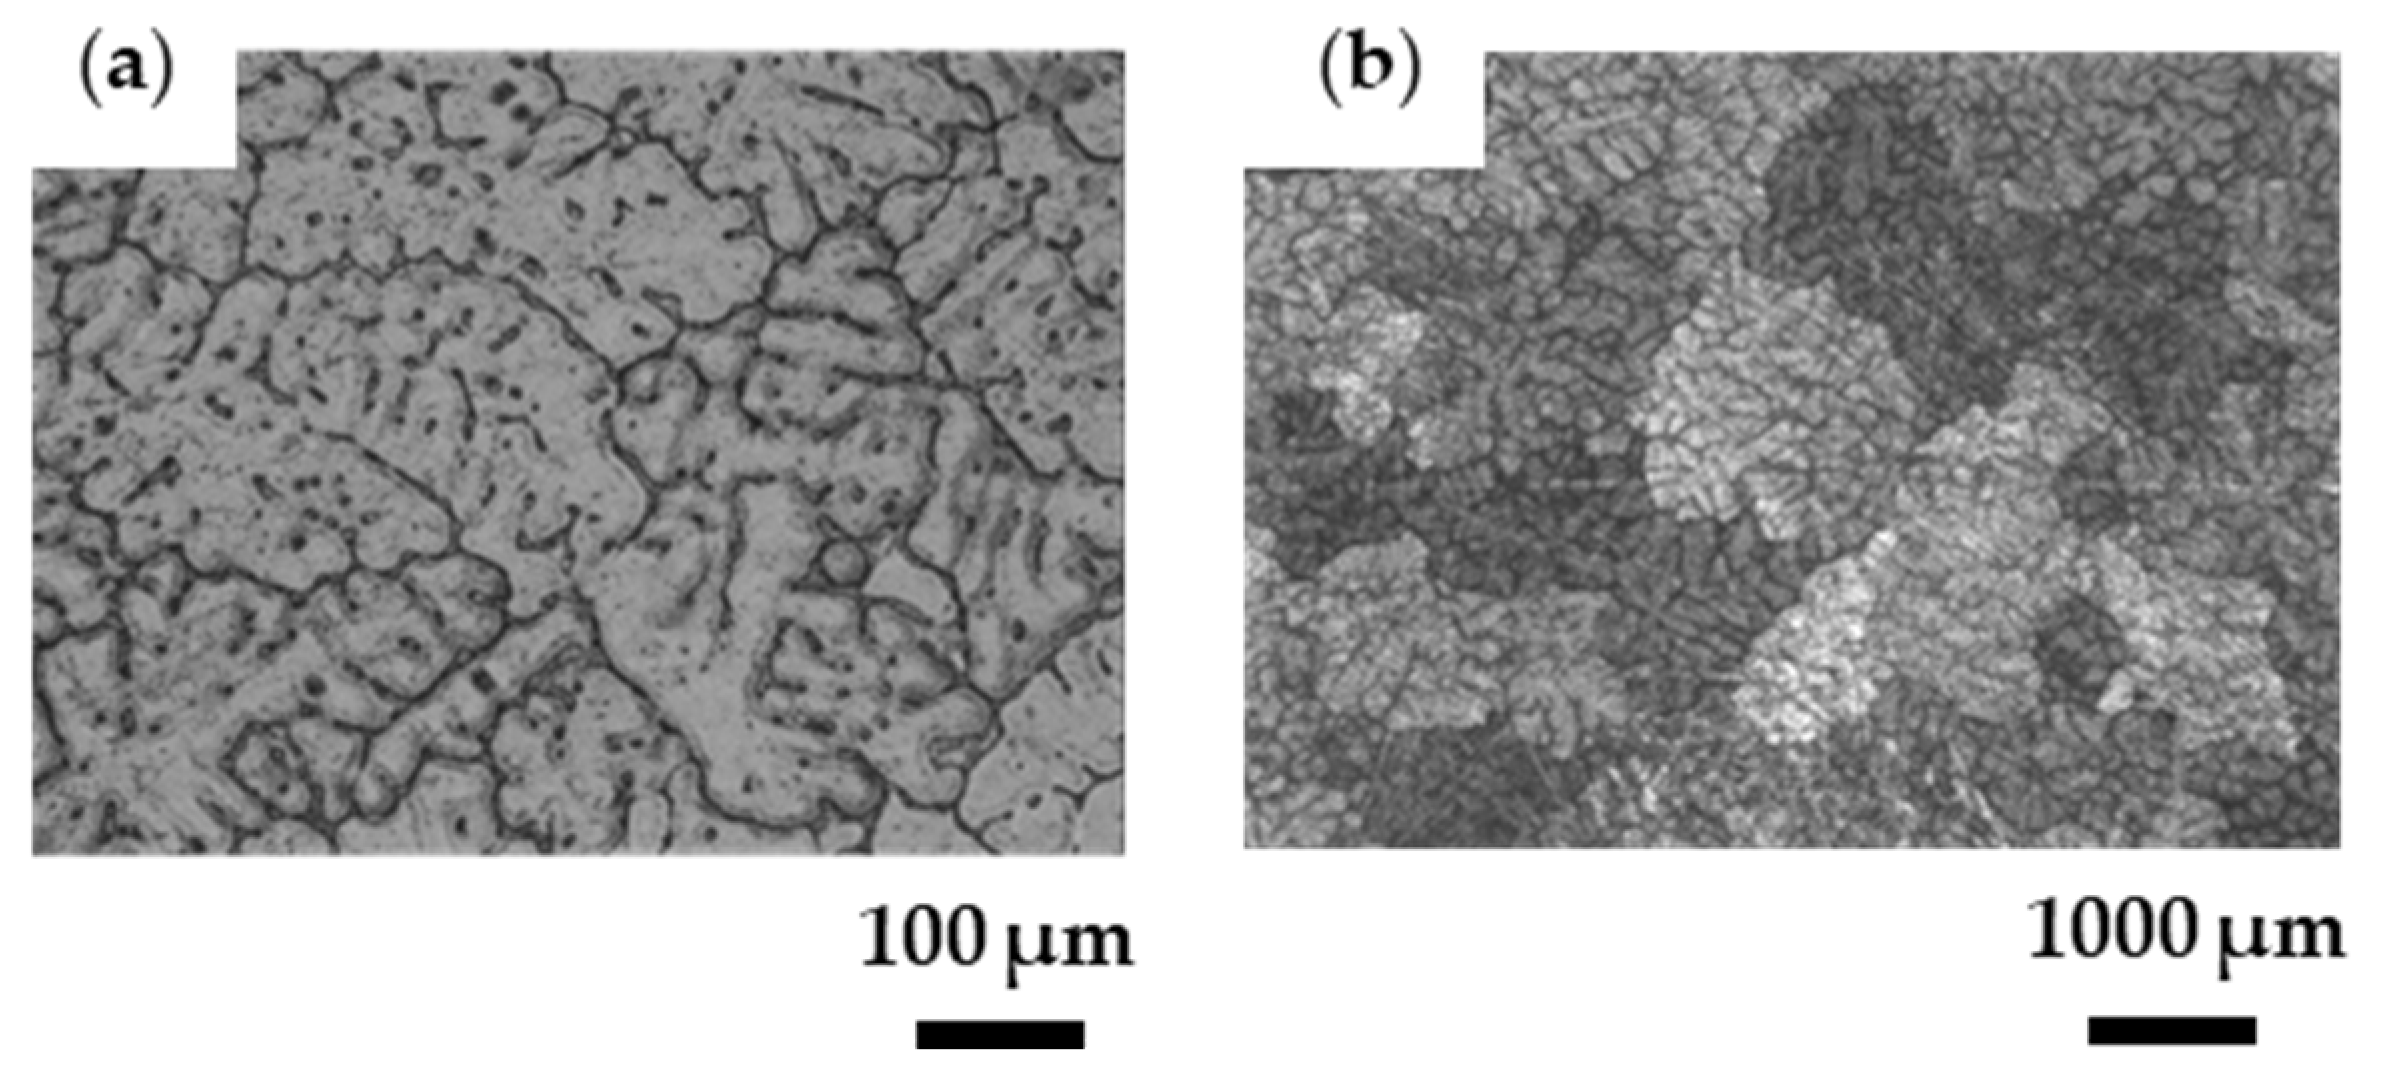
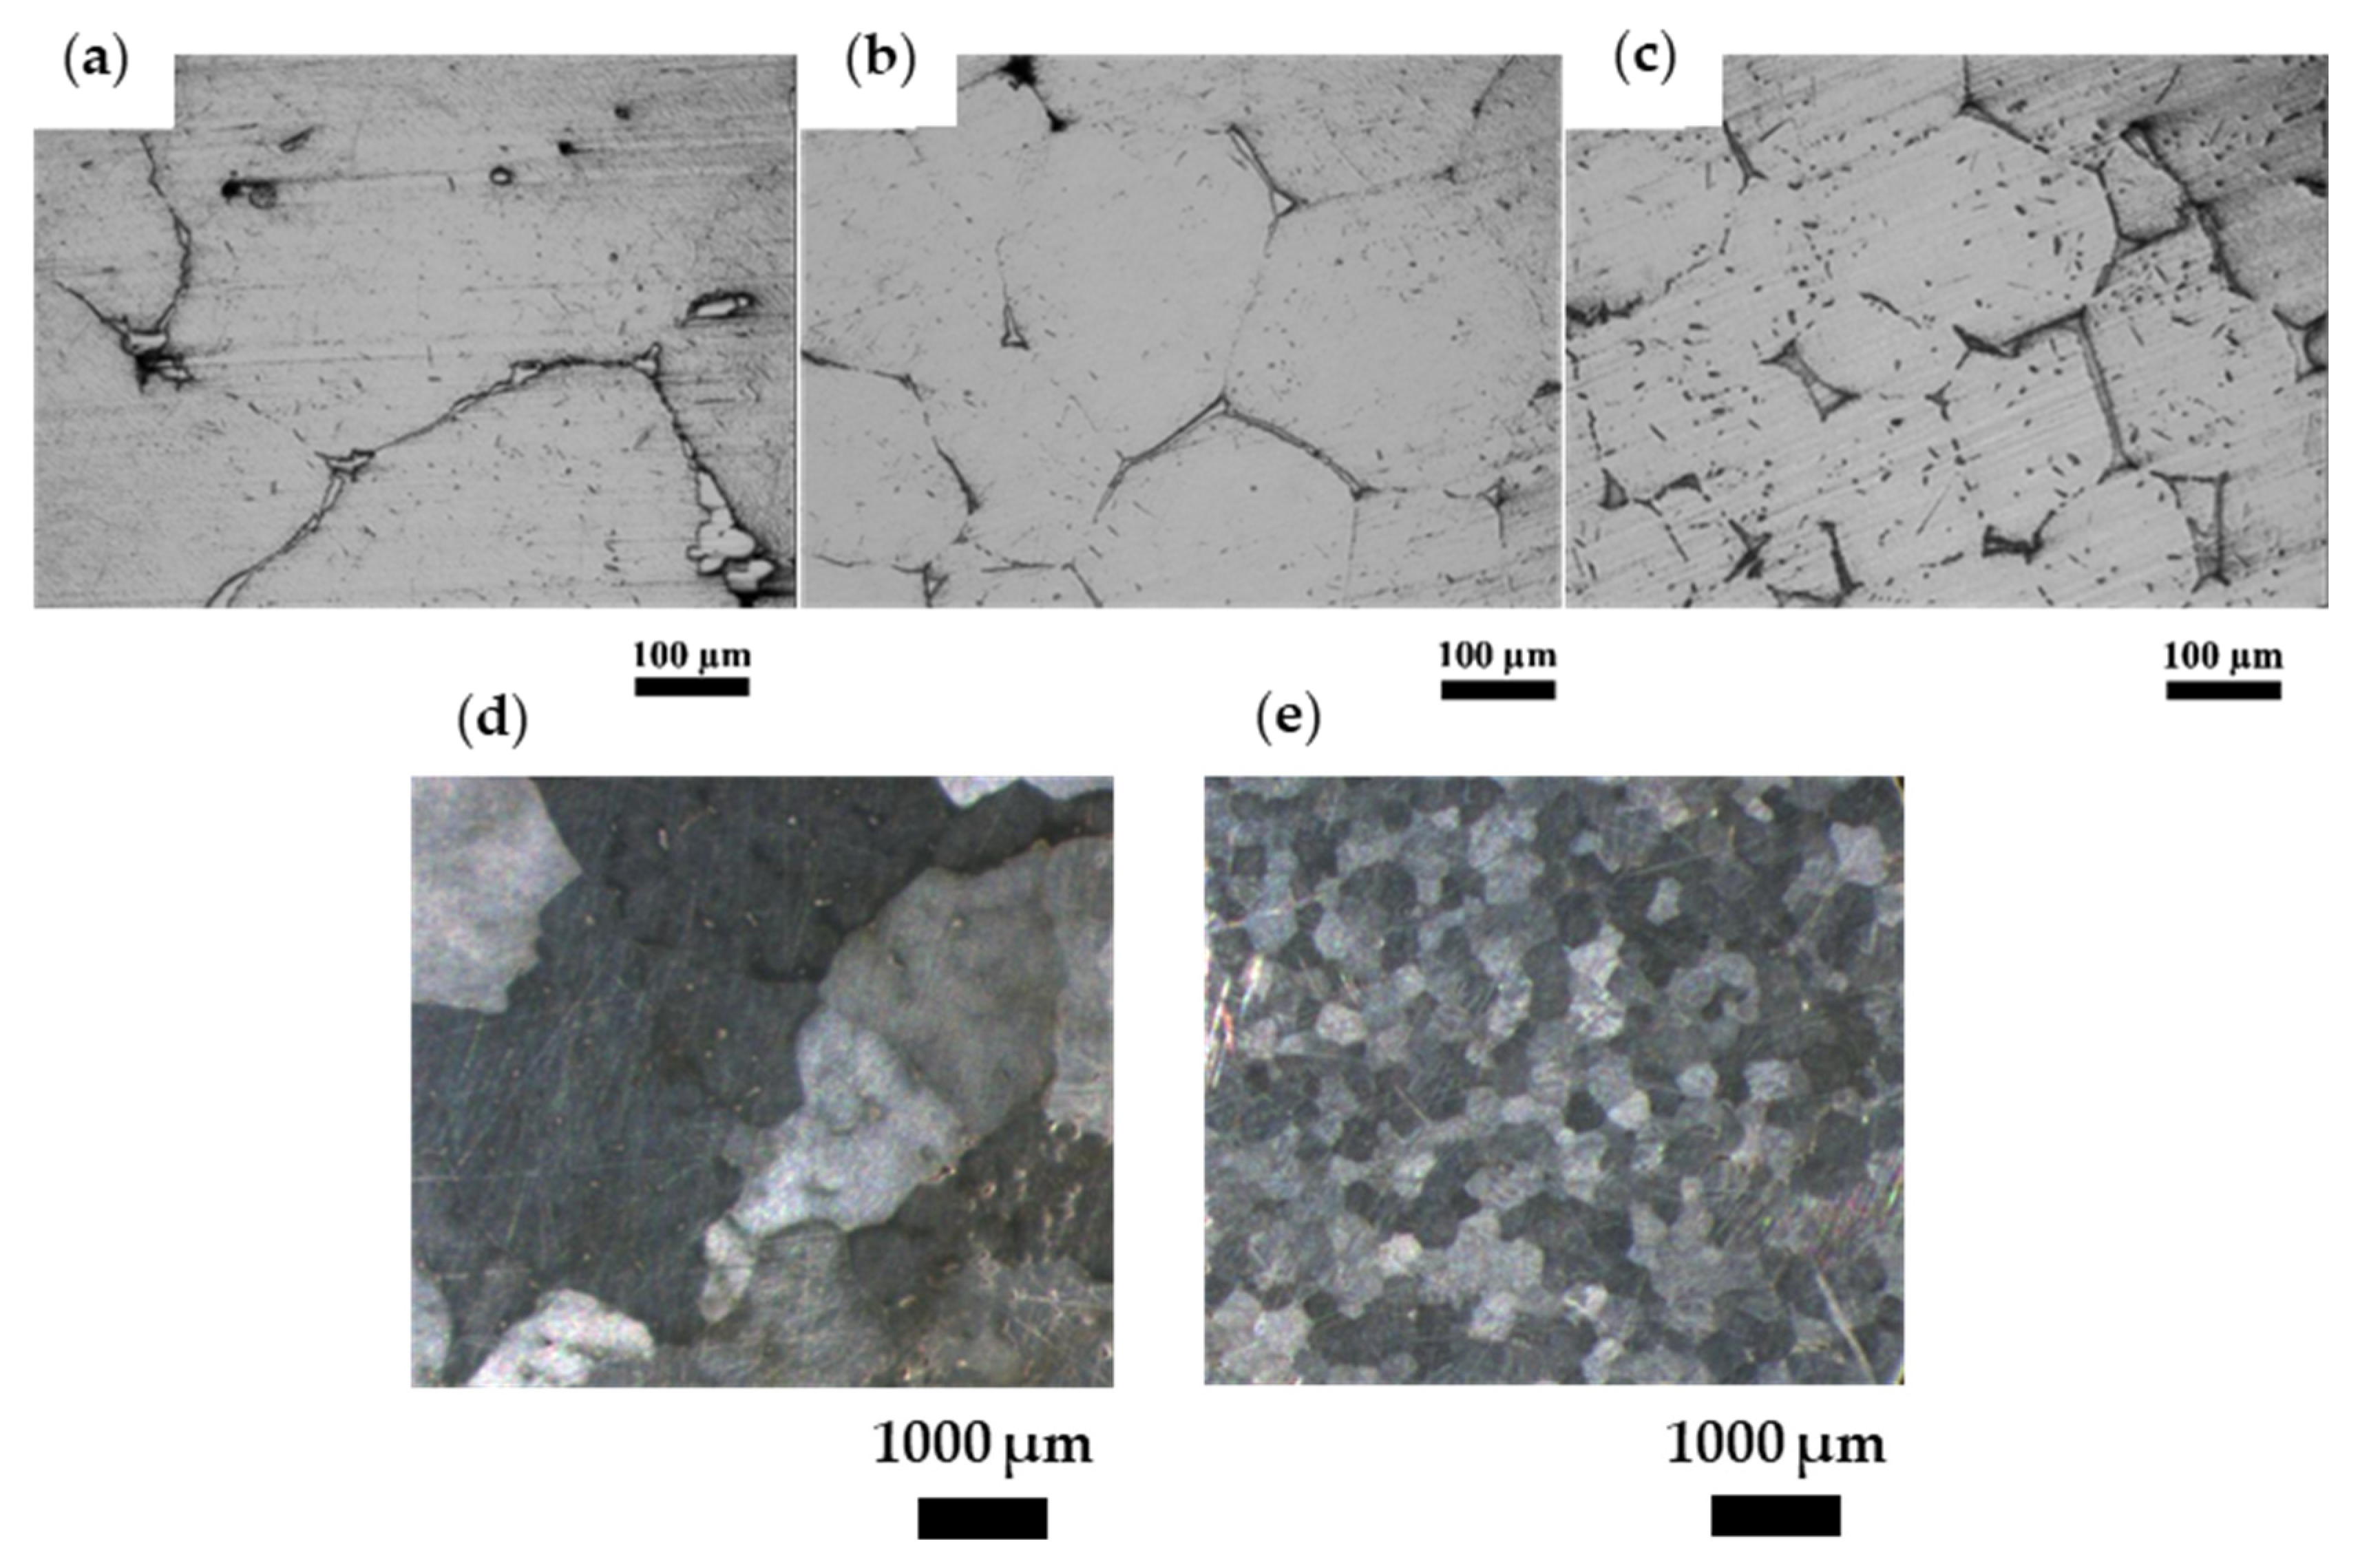
3.1. Microstructure of Al-Cu and Mg-Zn Alloys with Grain Refinement

Figure 1 contains OM of the unrefined Al-Cu and Mg-Zn alloys before in-situ neutron diffraction. The unrefined Al-Cu alloy shows a characteristic dendritic structure. The unrefined Mg-Zn alloy, while coarser than the Al-Cu alloy, has an irregular shaped grain structure that does not show dendritic features as pronouncedly as the one seen for the Al-Cu alloy.
Figure 2 has OM of the Al-Cu and Mg-Zn alloys with and without grain refinement after in-situ neutron diffraction. The corresponding grain size measurements for both alloys are listed in Table 2. The Al-Cu alloys (Figure 2a–c) demonstrate the transformation from a coarse columnar grain structure for the Al-Cu sample to a more refined spongy microstructure for the Al-Cu-02Ti sample and finally to a more equiaxed globular grain structure for the Al-Cu-05Ti sample. A 68% and 92% reduction in grain size was measured for the Al-Cu-02Ti and Al-Cu-05Ti samples, respectively.
The Mg-Zn alloy (Figure 2d,e) had a coarse irregular grain structure, as observed along many areas along the sample length, that was refined by 92% with the addition of Zr. The addition of Zr also changed the grain morphology from a coarse irregular shape to an equiaxed structure, similar to the observations of Qian and Das [37].
Scanning electron micrographs of the Al-Cu and Mg-Zn alloys following in-situ neutron diffraction are shown in Figure 3. The SEM micrograph for the Al-Cu sample (Figure 3a) depicts coarse primary Al with intermetallic Al2Cu distributed along the interdendritic regions. In the case of the Al-Cu-05Ti sample (Figure 3b), equiaxed primary Al grains are visible, thereby confirming the transformation in grain structure, with Al2Cu distributed along grain boundary regions. Here, both a blocky and eutectic morphology of Al2Cu is visible, while only blocky Al2Cu was visible in the Al-Cu alloy. A similar result to that for Al-Cu-05Ti was observed for the Al-Cu-02Ti sample; hence it is not depicted here. The reader is referred to the publication by D’Elia et al. [53] for EDX spot analysis of the phases in the Al-Cu alloys.
Figure 3c shows the Mg-Zn alloy with α-Mg matrix and a Mg-Zn based intermetallic phase. The Mg-Zn-Zr alloy contained Zn-Zr and Mg-Zn intermetallic phases typically at the grain boundaries and Zr rich particles within the centre of grains, as shown in Figure 3d. Zirconium addition provided heterogeneous nucleation sites and grain growth restriction [1,32,33,34]. Both phenomena were observed within the microstructures shown in Figure 3d. Excess undissolved Zr reacted with Zn to form Zn-Zr intermetallic particles, as observed by Hildebrand et al. [27]. Elemental spot analysis over ten particles indicated that the Mg-Zn phase corresponded to MgZn, while the Zn-Zr phase composition corresponded to Zn2Zr.

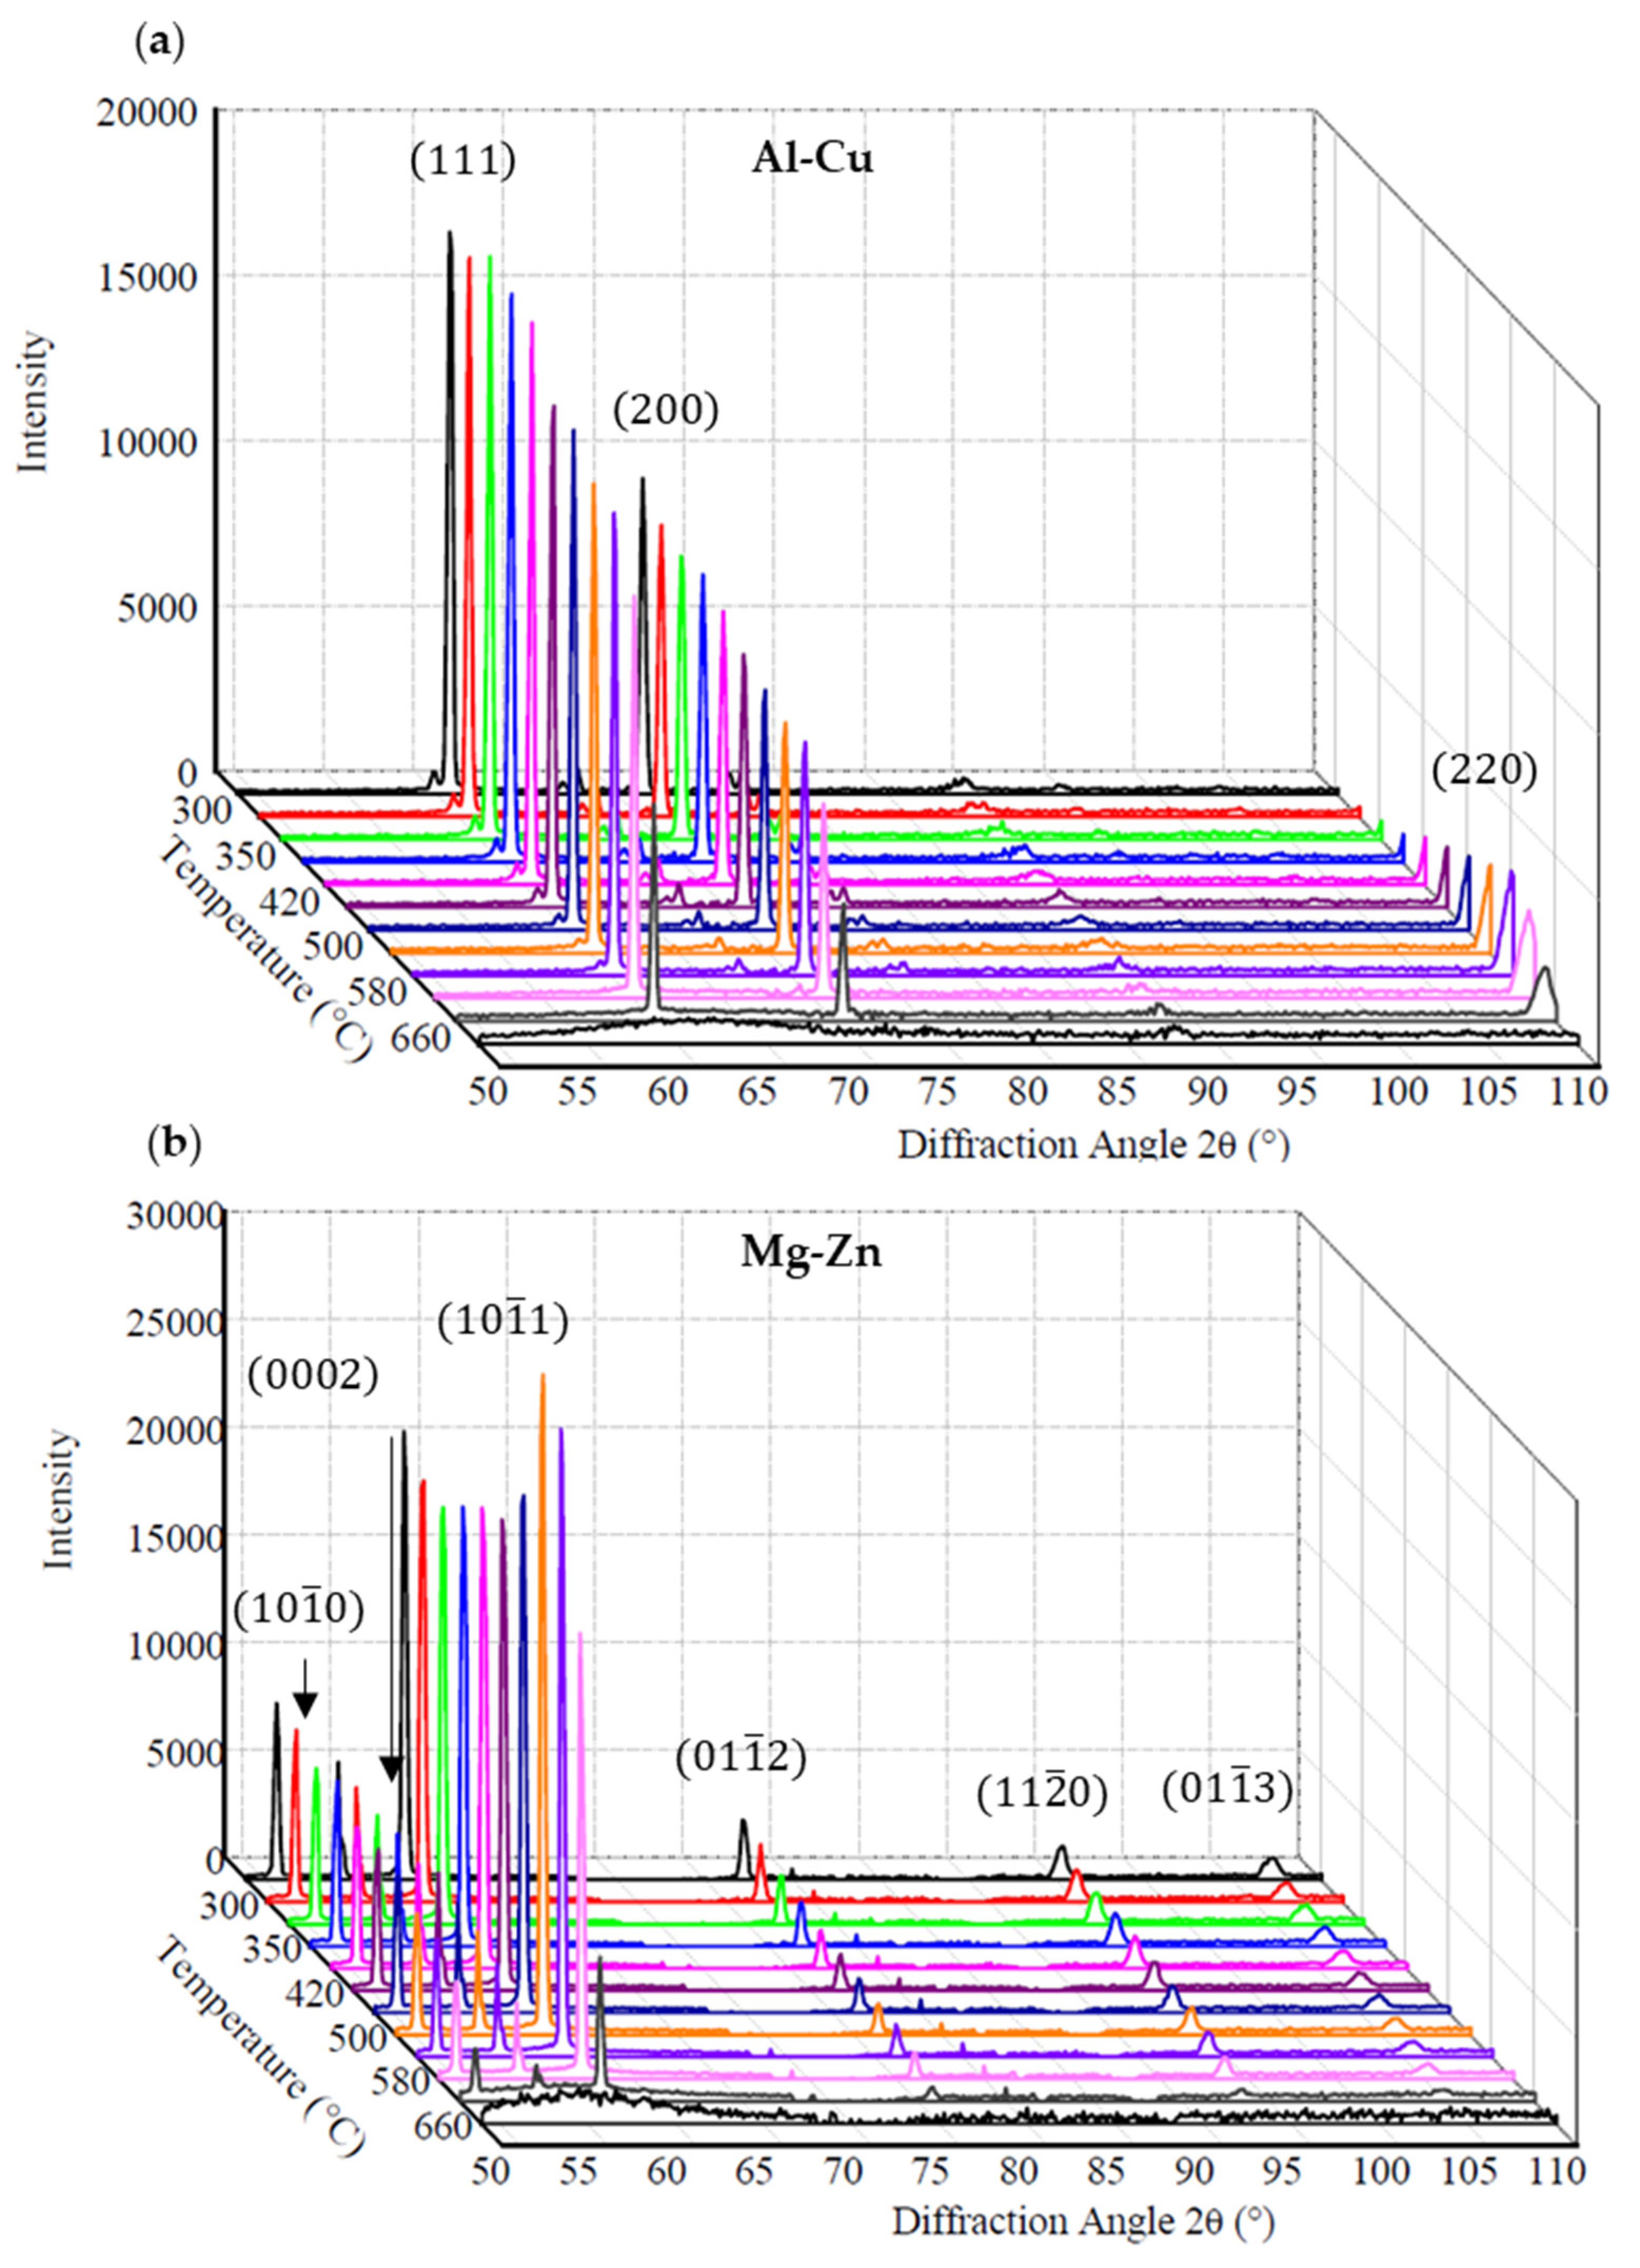
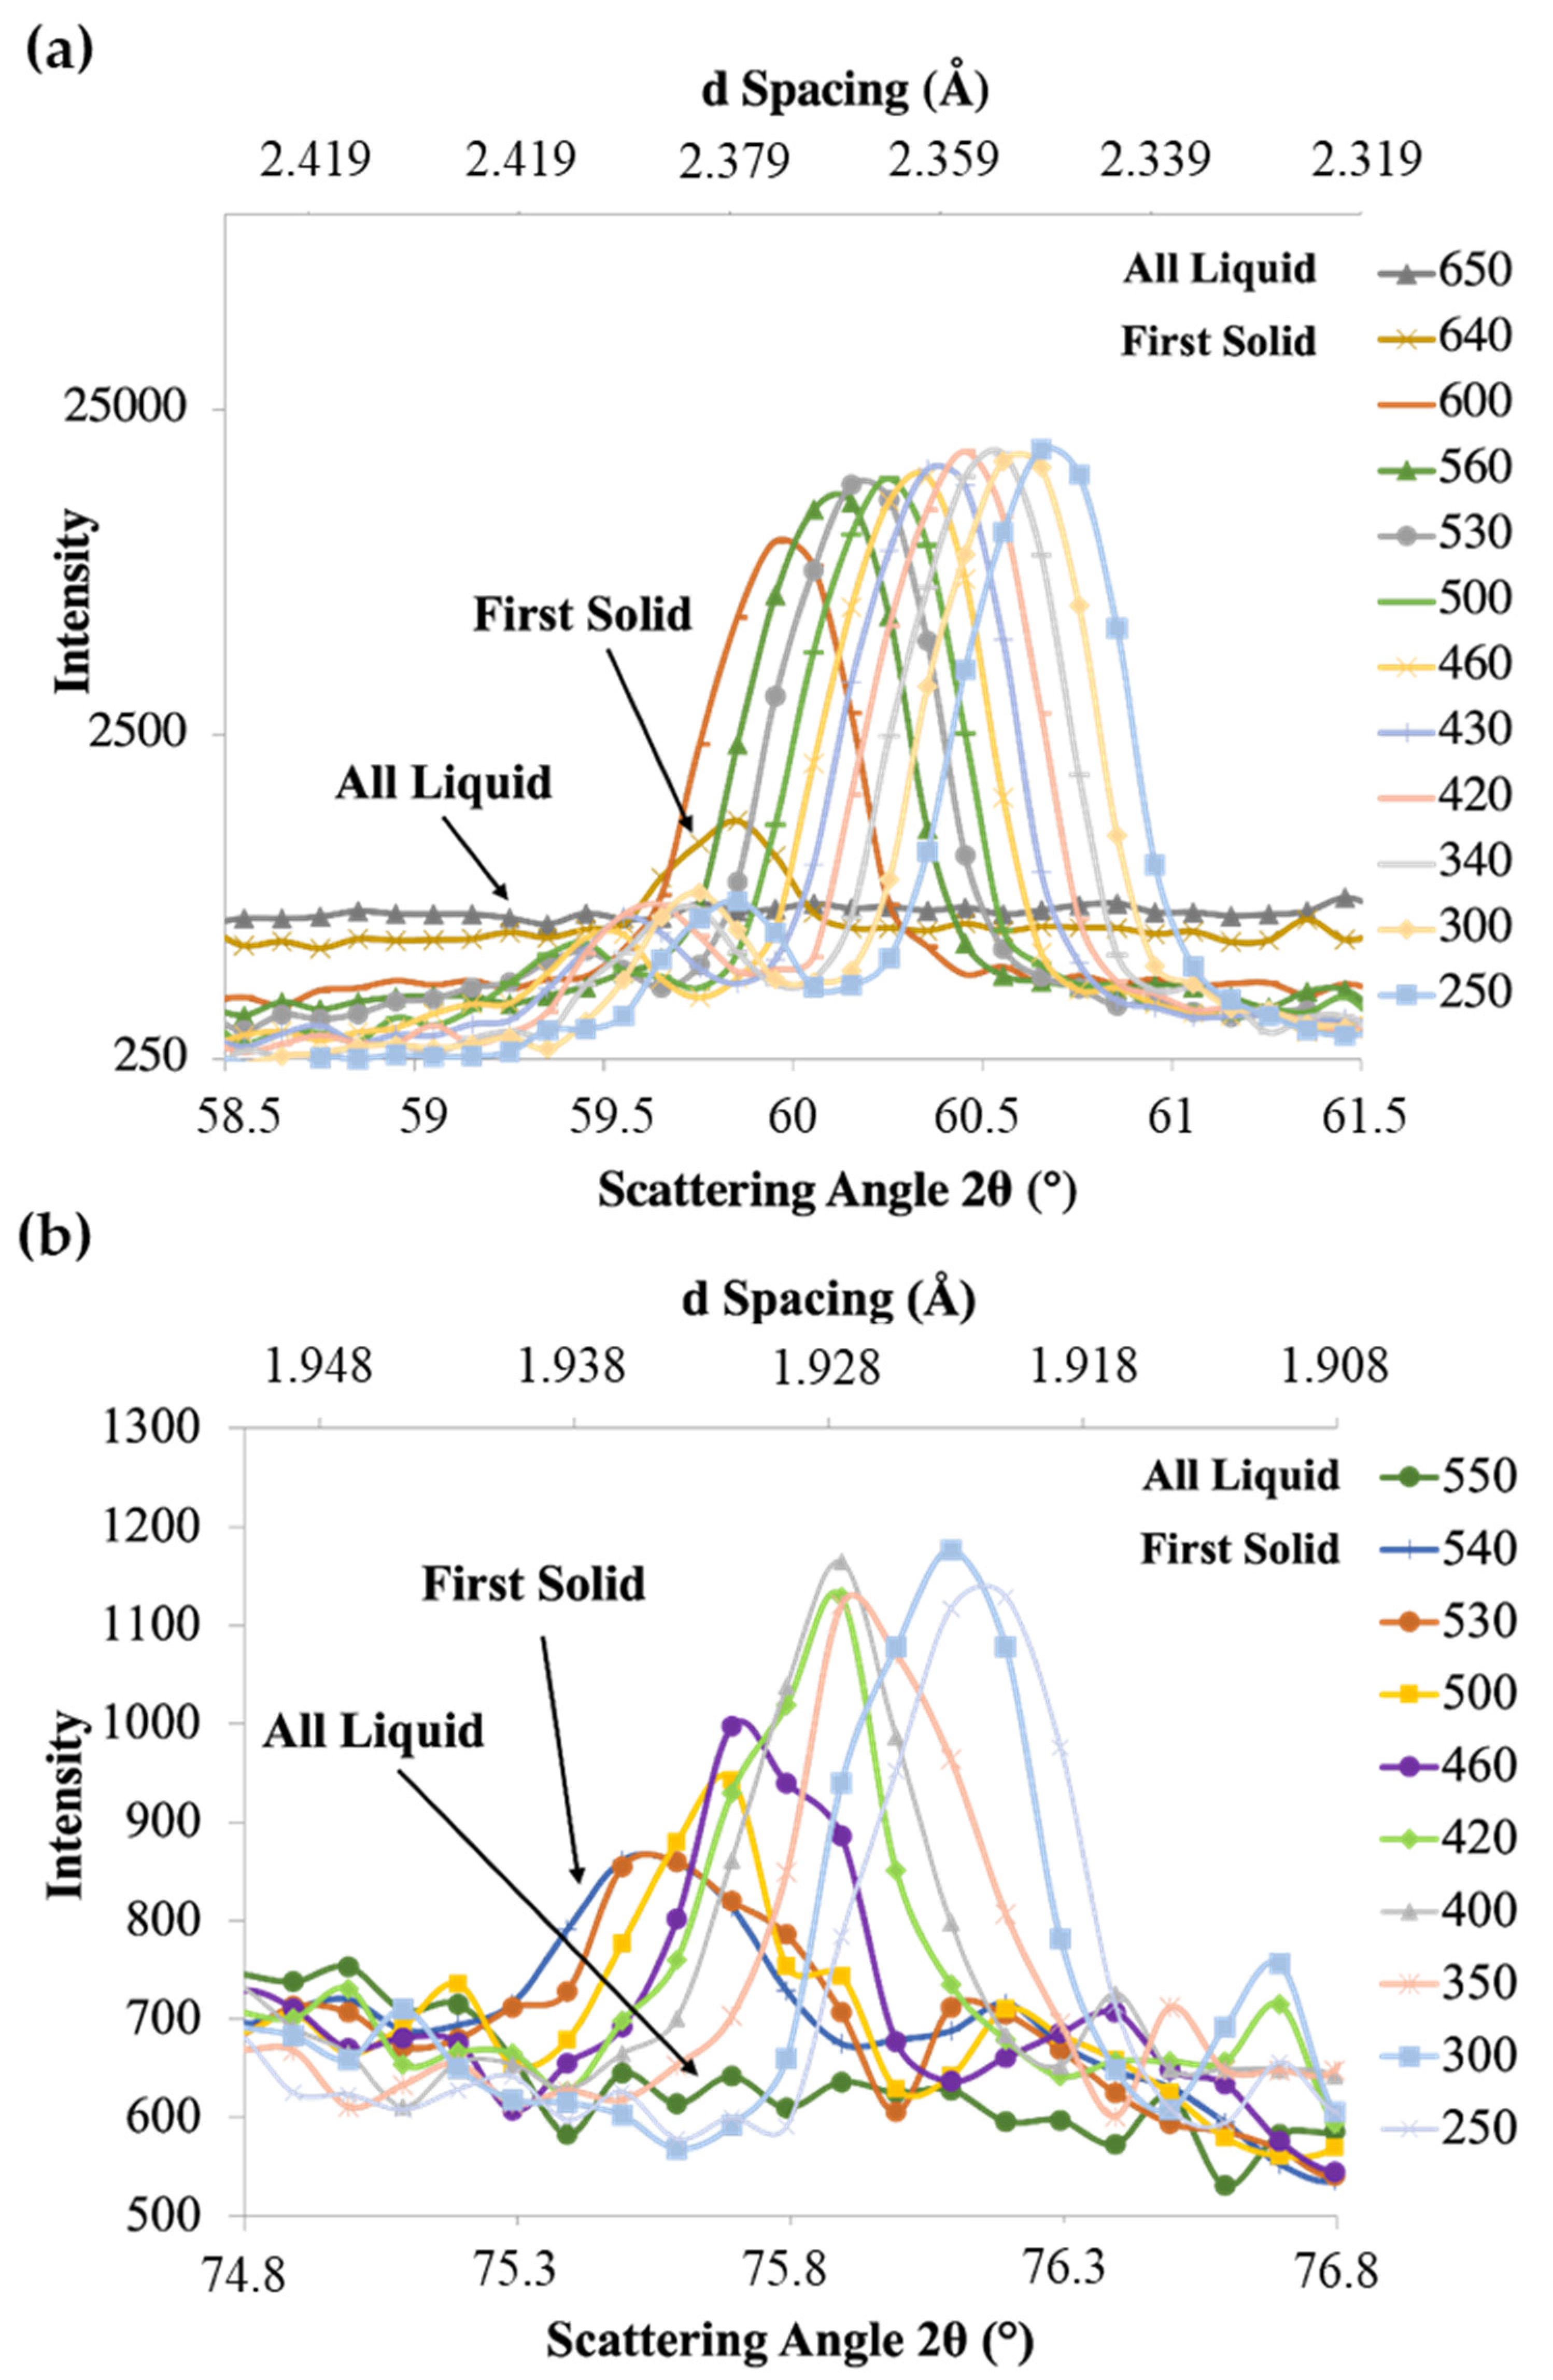
3.2. In-Situ Neutron Diffraction of Al-Cu and Mg-Zn Alloys

The in-situ neutron diffraction plots of the Al-Cu and Mg-Zn alloys at different temperatures are shown in Figure 4 with some temperature isotherms removed for clarity. Similar plots were observed for the Al-Cu-Ti and Mg-Zn-Zr alloy except with varying peak intensities between temperatures. Each plane was indexed using Equation (2) [59], with λ, d, and θ representing the neutron wavelength (2.37 Å), interplanar spacing and half angle of diffraction, respectively. The interplanar spacing was determined using Equation (3) [59] for FCC Al and Equation (4) [59] for HCP Mg with pure Al lattice parameters of a = 0.405 nm [72] and pure Mg lattice parameters of a = 0.320 nm and c = 0.520 nm [26].
n λ = 2 d s i n θ
d 2 = a 2 h 2 + k 2 + l 2
1 d 2 = 4 3 ( h 2 + h k + k 2 a 2 ) + l 2 c 2
For both the Al-Cu and Mg-Zn alloys in Figure 4, the Al and Mg peak areas increase rapidly to a near maximum at the first few temperature steps and then fluctuate in intensity with decreasing temperature. In a previous study by the current authors examining a similar Mg-Zn alloy [70,71] with and without Zr, it was reasoned that the large grains within the melt could influence the diffraction intensity. At one temperature step, a grain could be highly favourable for diffraction, while at a lower temperature step it can translate/rotate to a position that is less favourable for diffraction despite the grain having grown larger because of the lower temperature [70,71]. Irregular grain sized Al-Cu (Figure 2a) and Mg-Zn (Figure 2d) alloys were more susceptible to in-situ neutron diffraction intensity variations due to the incident beam diffracting from a smaller number of grain orientations, as a result of the fewer, larger grains present. This is in contrast to the fine structured, equiaxed Al-Cu-05Ti (Figure 2c) and Mg-Zn-Zr alloys (Figure 2e) that provided a much higher number of grains for diffraction, thereby resulting in sharp peaks with higher intensity.
In addition to the primary Al or Mg phases, efforts were made for in-situ neutron diffraction experiments to detect the additional phases observed in the SEM micrographs (Figure 3). For the Al-Cu alloys, detection of Al2Cu was possible, while MgZn, MgZn2, and ZnZr2 phases in the Mg alloys were not detected reliably, given their low weight fractions, and so they will not be discussed further. In addition, a better understanding of the diffraction intensity variation during solidification can be gained by closely examining individual peaks of the unrefined and refined Al and Mg alloys.
A magnified view of the diffraction plot for the ( 111 ) plane from the Al-Cu alloy is shown in Figure 5a. Similar plots were obtained for the ( 200 ) and ( 220 ) planes, as well as for the Al-Cu-Ti alloys. At 650 °C, the Al-Cu alloy was completely molten, and all the neutrons were undergoing inelastic scattering with the liquid alloy spread evenly across all angles, since there were no solid planes for diffraction. This isotherm is labelled as “All Liquid” in Figure 5a. Under equilibrium conditions, the Al-Cu alloy has liquidus and solidus temperatures of ~646 °C and ~548 °C, respectively, with the Al2Cu phase formation temperature at 548 °C [73]. In Figure 5a, at 640 °C, the first solid α-Al forms resulting in a broad peak centred near 60° as shown by the labelled isotherm “First Solid” (Figure 5a). As solidification progressed, the peak intensity continuously increased as more solid was contributing to elastic scattering, while the areas around the peak, representing the background, continuously decreased, as less liquid was available for inelastic scattering. The peak centre also shifted to higher diffraction angles with decreasing temperature due to the thermal contraction of Al and change in composition similar to observations in previous investigations utilizing in-situ neutron diffraction [51,68,70]. Figure 5b shows the diffraction plot for Al2Cu with labels of “All Liquid” and “First Solid”. The first solid Al2Cu appears at 540 °C and is centred near 75.5°.
A magnified view of the diffraction plot for the ( 10 1 ¯ 0 ) plane from the Mg-Zn-Zr alloy is shown in Figure 6. Similar plots were obtained from the ( 0002 ) and ( 10 1 ¯ 1 ) planes for both the Mg-Zn and Mg-Zn-Zr alloys. Similar to the Al-Cu alloy in Figure 5a, at 660 °C the Mg-Zn-Zr alloy was completely molten and undergoing inelastic scattering with the liquid metal evenly across all angles. Under equilibrium conditions, the Mg-Zn alloy has liquidus and solidus temperatures of ~635 and ~400 °C, respectively [74], and the Mg-Zn-Zr alloy is expected to have a similar solidus point but with a higher liquidus because of the peritectic reaction [40] at 653.56 °C with 0.45 wt.% Zr [29]. At 635 °C, the first detected solid α-Mg formed, resulting in a broad peak centred at 49.8°. Similar to the Al alloy in Figure 5a, as solidification progressed, the peak intensity continually increased, while the areas around the peak representing the background continually decreased.
By tracking the growing areas of the diffraction peaks at each temperature step, a fraction solid plot for each plane of each phase in the Al and Mg alloys versus temperature can be produced. It can be noted in Figure 5a that below the equilibrium solidus temperature of ~548 °C, the peak area continually increased in size with decreasing temperature. This same effect was observed for the Mg alloy in Figure 6. At elevated temperatures, increased atomic motion gave a reduction in peak area for all peaks and more so for peaks at higher diffraction angles [59]. Therefore, even after solidification is complete, the peak areas continued to grow with decreasing temperature. When determining fraction solid, this thermal agitation effect was accounted for and will be described in further detail in the next section.

3.3. Fraction Solid Determination Using In-Situ Neutron Diffraction

The areas under the diffraction peaks for the Al and Mg alloys were determined using the trapezoidal rule for each measured diffraction angle to calculate the fraction solid. By subtracting the background at each selected temperature, a ratio between the diffraction area was normalized using limits between the alloy being fully liquid (liquidus) and fully solid (solidus), with every intermediate temperature between these two extremes representing the Al and Mg alloy undergoing solidification. The background consists of both the contribution from the liquid and the diffraction set-up. When the alloy was fully solid, no liquid was available for inelastic scattering and the background neutron count dropped significantly, as shown in Figure 5 and Figure 6. Reference values of 548 °C [73] and 400 °C [74] were utilized for the equilibrium α-Al (for Al-5 wt.% Cu) and α-Mg (for Mg-5 wt.% Zn) solidus temperatures, respectively. The equilibrium solidus temperatures were considered to be appropriate due to the very slow cooling that the samples underwent. The fraction solid of the remaining temperatures were determined by calculating the ratio of their diffraction peak areas to that of the solidus temperature peak area. These steps of calculating the peak area and iterating were conducted for each plane and phase examined in the Al-Cu and Al-Cu-Ti alloys (for ( 111 ) , ( 200 ) and ( 220 ) of the α-Al phase and (310) and (110) for the Al2Cu phase, as well as the Mg-Zn and Mg-Zn-Zr alloys (for ( 10 1 ¯ 0 ) , ( 0002 ) and ( 10 1 ¯ 1 ) , planes of α-Mg).
Any temperatures above the liquidus point would contain no peak and represent a zero fraction of solid. Once solidification was complete, the sample was still at an elevated temperature, and thermal agitation of the sample was present. This thermal agitation shifted the diffraction peaks and gave a reduction in peak intensity [59]. Therefore, the neutron diffraction peak area of a solid material would continually increase with the decreasing temperature without any further liquid-to-solid phase change taking place.
To account for this thermal agitation and correct the diffraction data, the change in diffraction area at temperatures below the solidus temperature was used as a baseline and extrapolated to the liquidus point in an iterative manner. The adjusted fraction solid curves for the Al-Cu and Al-Cu-Ti alloys are shown in Figure 7. In the case of the Al-Cu alloy, α-Al fraction solid development was detected for the ( 111 ) , ( 200 ) and ( 220 ) planes, while Al2Cu was detected for both the ( 310 ) and ( 110 ) planes. For the Al-Cu-Ti alloys, however, measurements were unsuccessful at detecting all three planes for α-Al, and only the ( 310 ) plane was detected for the Al2Cu phase. The adjusted fraction solid curves for the ( 10 1 ¯ 0 ) , ( 0002 ) and ( 10 1 ¯ 1 ) planes of α-Mg from the Mg-Zn and Mg-Zn-Zr alloys are in Figure 8. Fraction solid versus temperature FactSage™ equilibrium solidification simulations for the primary phases in the Al and Mg alloys are also included in Figure 7 and Figure 8, respectively. The error associated with the calculated fraction solid curves in Figure 7 and Figure 8 was determined by examining the variation in background intensity at each temperature step and were typically 12% using a t-student test with a 95% confidence level. The background error and fluctuation in peak area due to temperature were the causes of some fraction solid curves fluctuating above and below 100% after solidus was reached. However, it is expected that additional sampling at and below the solidus temperature will better characterise the influence of elevated temperature on the diffraction intensities of the alloys and will ultimately aid in minimizing fluctuations in the fraction solid curves.
The growth of α-Al and Al2Cu for the Al-Cu alloy is depicted in Figure 7a for temperatures between 660 °C and 250 °C and 580 °C and 250 °C, respectively. Overall, only minor differences in growth profiles were observed for α-Al and Al2Cu using the diffraction peak areas along the various crystallographic planes. The α-Al was found to first nucleate at 650 °C along the (220) plane and at 640 °C along both the (111) and (200) planes. It is difficult to obtain the exact solidus temperature of the Al-Cu alloy, as the neutron diffraction measurements were carried out in 5 or 10 °C increments of temperature over the solidification range. Nevertheless, the range of 640–650 °C agrees with the known solidus temperature of 646 °C for this alloy. As the temperature decreased, the α-Al evolved steadily, and most rapidly along the (220) plane, reaching a fraction solid of about 80% at 600 °C along the (220) plane, and at 590 °C along the (200) and (111) planes. Beyond these temperatures, the growth in α-Al dendrites was more gradual and finally reached 100% solid at 550 °C as observed along the peak area of the (220) plane. In contrast, 100% fraction solid was measured at 540 °C along the peak areas of the (111) and (200) crystallographic planes, indicating an increase in peak area growth rate along these planes over the last 20% of the remaining fraction solid. In the case of Al2Cu intermetallic, low amounts were first detected at 570 °C along the peak area of the (310) plane and at 550 °C along the (110) crystallographic plane. Similar growth profiles were observed along the two planes until the final measured temperature of 250 °C, with only a slight increase in growth rate seen beyond 400 °C along the (110) plane.
The phase evolution of α-Al could not be detected along the peak area of the (220) plane for both the Al-Cu-02Ti and Al-Cu-05Ti alloys. In addition, the (200) plane was also undetectable for the Al-Cu-02Ti alloy. The final temperature of analysis was 420 °C for the Ti-containing alloys, due to restrictions in beam time. Primary α-Al growth in the Al-Cu-02Ti (Figure 7b) and Al-Cu-05Ti (Figure 7c) was significantly more gradual with respect to that in the Al-Cu alloy. The first evidence of α-Al solid solution nucleation (>1%) was measured at 650 °C along the peak area of the (220) plane, while along the (111) plane, the first detection of α-Al was at 640 °C for both alloys. The α-Al in the Al-Cu-05Ti alloy then continued to evolve to ~40% at 620 °C, where it then became almost stagnant along the peak area of the (111) plane until 590 °C, and until 610 °C along the (200) plane. In the case of the Al-Cu-02Ti alloy, the α-Al increased more rapidly between the temperatures of 630 °C and 610 °C. At this point, the growth of α-Al became stagnant for this alloy as well until 580 °C. The reason for these stagnant growth regions in both alloys is not completely understood but may be attributed to the onset of dendrite (or grain) coherency. Once the α-Al grains began to impinge on one another, the growth likely stalled. However, further investigations are necessary to confirm this hypothesis. Following the region of stagnancy, the α-Al grains in both refined alloys continued to grow quasi linearly to 100% solid at 540 °C. In the case of Al2Cu, similar growth profiles were observed along the peak area of the (310) crystallographic plane for both Ti-containing alloys. The intermetallic was first detected at 550 °C in both alloys and then developed steadily until the final measured temperature at 420 °C. Upon precipitation of Al2Cu along the (310) plane, the α-Al in both refined alloys was <90% solid, as demonstrated in Figure 7b,c. This was not the case for the Al-Cu alloy, as once precipitation of Al2Cu along the peak area of the (310) plane initiated, the α-Al was nearly completely developed (Figure 7a).
For the Mg-Zn alloy in Figure 8a, the more packed ( 0002 ) and ( 10 1 ¯ 1 ) α-Mg planes peak areas grew at a slower rate than the ( 10 1 ¯ 0 ) plane. The FactSage™ model representing equilibrium solidification for the Mg-Zn alloy tended to follow the most rapidly growing peak area ( 10 1 ¯ 0 ) plane in Figure 8a. Additionally, the solidification of the sample closely matched the FactSage™ models. It can also be observed that the ( 10 1 ¯ 1 ) plane had the largest fluctuations in its fraction solid curve and went beyond 100% at 500 °C. For the Mg-Zn alloy at 635 °C, the ( 10 1 ¯ 0 ) , ( 0002 ) and ( 10 1 ¯ 1 ) α-Mg planes had fraction solids of 17, 5 and 3%, respectively. This wide range in fraction solids at such an early stage of solidification indicated that the Mg-Zn grains were undergoing a very asymmetrical growth, resulting in the coarse, irregular grain structure shown in Figure 2d.
For the Mg-Zn-Zr alloy in Figure 8b, the addition of Zr promoted nucleation on the ( 10 1 ¯ 0 ) and ( 0002 ) planes [41], while Zr growth restriction regulated grain growth. The growth of the peak areas of the Mg-Zn-Zr ( 10 1 ¯ 0 ) , ( 0002 ) and ( 10 1 ¯ 1 ) planes in Figure 8b at 635 °C shows that the planes had nearly identical fraction solids of 15%, 12% and 14%, respectively. The growth of the peak area of the ( 10 1 ¯ 1 ) and ( 10 1 ¯ 0 ) planes closely matched the equilibrium solidification model from FactSage™ (Figure 8b). This uniform growth of the ( 10 1 ¯ 0 ) , ( 0002 ) and ( 10 1 ¯ 1 ) planes resulted in the fine equiaxed grain structure, as shown in Figure 2e.

4. Discussion on Solidification of Al and Mg Alloys

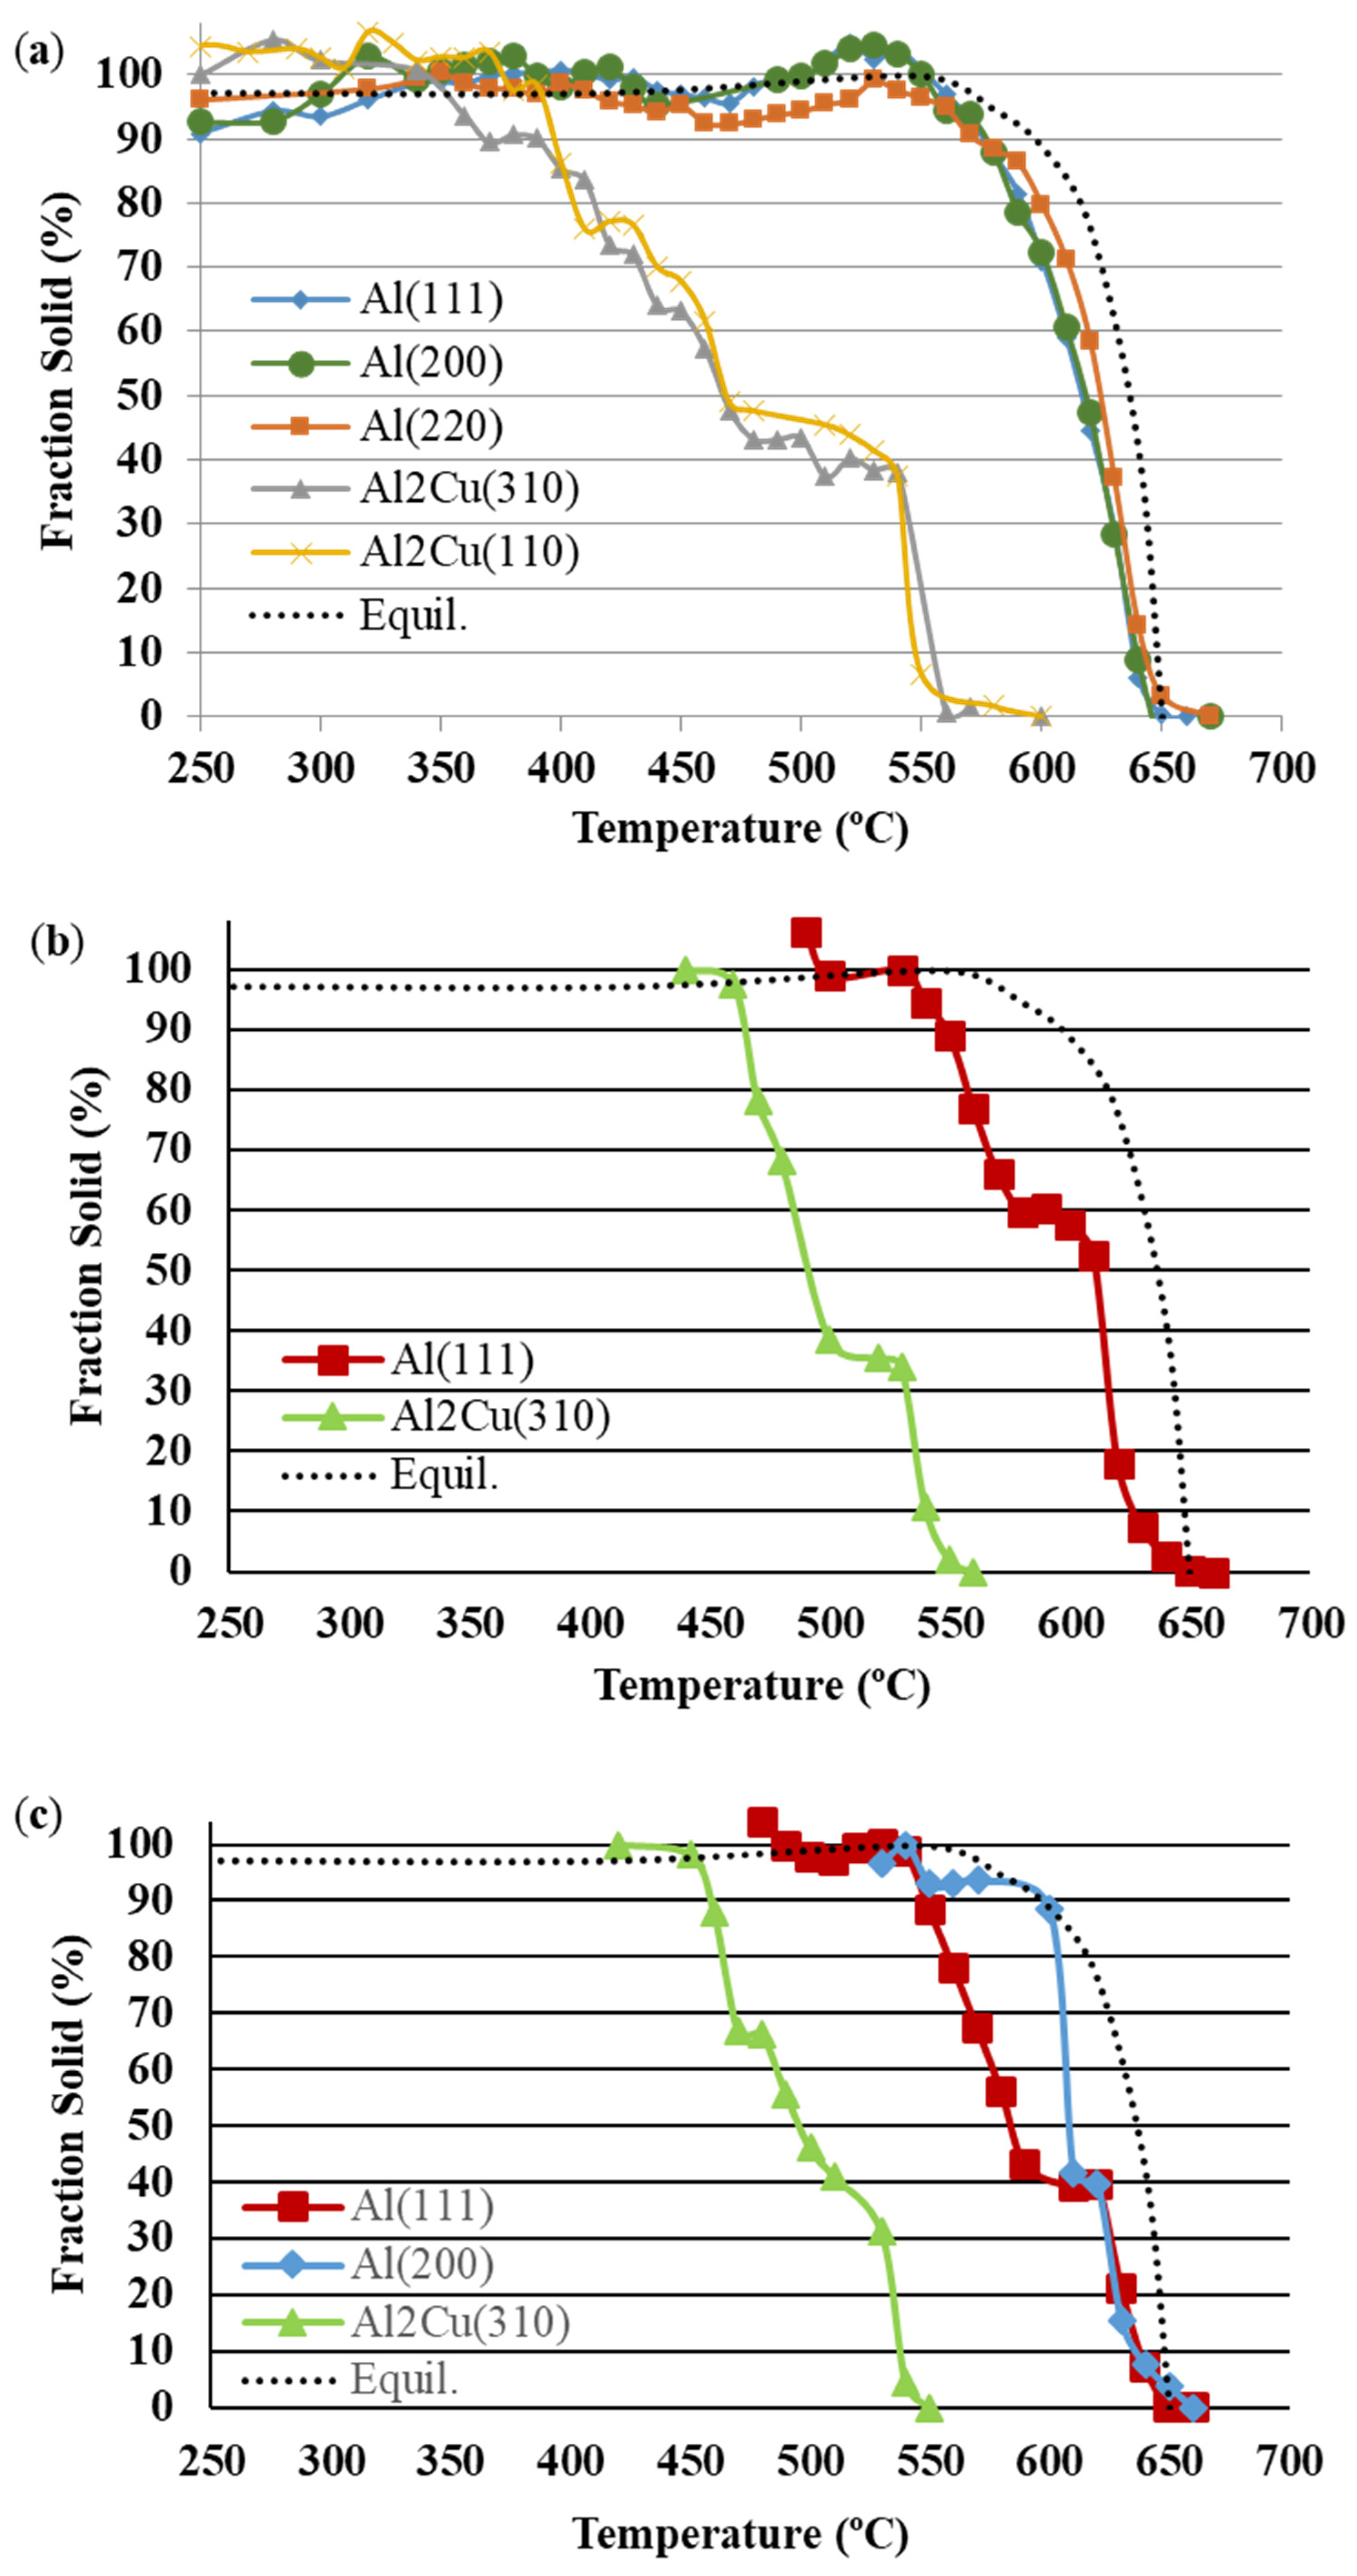
4.1. Solidification of Al-Cu and Al-Cu-Ti Alloys

Addition of Ti-B master alloy to the Al-Cu alloy had a distinct influence on grain structure, as depicted in Figure 2. The coarse-grained Al-Cu alloy was transformed into a more globular and equiaxed grain morphology with increased additions of Ti. The variation observed in the development of an α-Al solid solution for the unrefined Al-Cu and refined Al-Cu-02Ti and Al-Cu-05Ti alloys was directly attributed to their differences in alloy grain morphology. The coarse dendrites present in the unrefined Al-Cu alloy likely nucleated during solidification along the cooler mold walls before propagating rapidly towards the warmer centre of the casting. Such rapid growth of the dendrites correlates with the development of an α-Al solid solution illustrated in Figure 7a. In the case of the refined alloys, however, it was not required for nucleation to originate from the mold wall, as Ti-based nucleating particles were added to the melt via the Al-Ti-B master alloy. These nucleating particles subsequently promoted heterogeneous nucleation, which thereby enabled uniform grain growth, resulting in equiaxed grain morphologies. This is confirmed by the quasi-linear development of an α-Al solid solution in Figure 7b,c, for the Al-Cu-02Ti and Al-Cu-05Ti alloys, respectively. The slight differences observed between the two refined alloys could also be attributed to their respective grain size and morphology. The larger and less globular grain structure of the Al-Cu-02Ti alloy were likely the result of a faster initial growth of the α-Al due to the presence of fewer nucleating particles.
The in-situ phase evolution of Al2Cu intermetallic was also influenced by alloy grain structure. In the unrefined Al-Cu alloy, the nucleation of Al2Cu (along the (310) plane) did not commence until a nearly 100% solid α-Al was formed, as shown in Figure 7a. Thus, a continuous rigid network of α-Al dendrites was fully developed in the unrefined alloy, thereby limiting the Al2Cu to small interdendritic regions. Further, this likely had an impact on the morphology of Al2Cu. The intermetallic Al2Cu phase is usually present as two different morphologies: blocky and eutectic [75]. The blocky morphology is a result of solid-state precipitation, while the eutectic morphology precipitates via the eutectic reaction. In the case of the unrefined alloy, since Al2Cu precipitated after the α-Al was nearly complete, this suggests that the majority of Al2Cu development was through solid-state precipitation, resulting in mostly blocky Al2Cu in the alloy. The SEM micrograph in Figure 3a demonstrates the significant presence of blocky Al2Cu. In the case of the refined alloys, the α-Al solid solution was less developed (relative to the unrefined alloy) at the instant Al2Cu began to precipitate. Thus, there was a greater amount of liquid at eutectic composition (at the instant of Al2Cu nucleation) present in the refined alloys, which underwent the eutectic reaction and thereby resulted in enhanced precipitation of eutectic Al2Cu (vs. blocky Al2Cu). The SEM micrographs in Figure 3b illustrate the presence of both eutectic and blocky Al2Cu in Al-Cu-05Ti. A similar result was also observed for the Al-Cu-02Ti alloy.

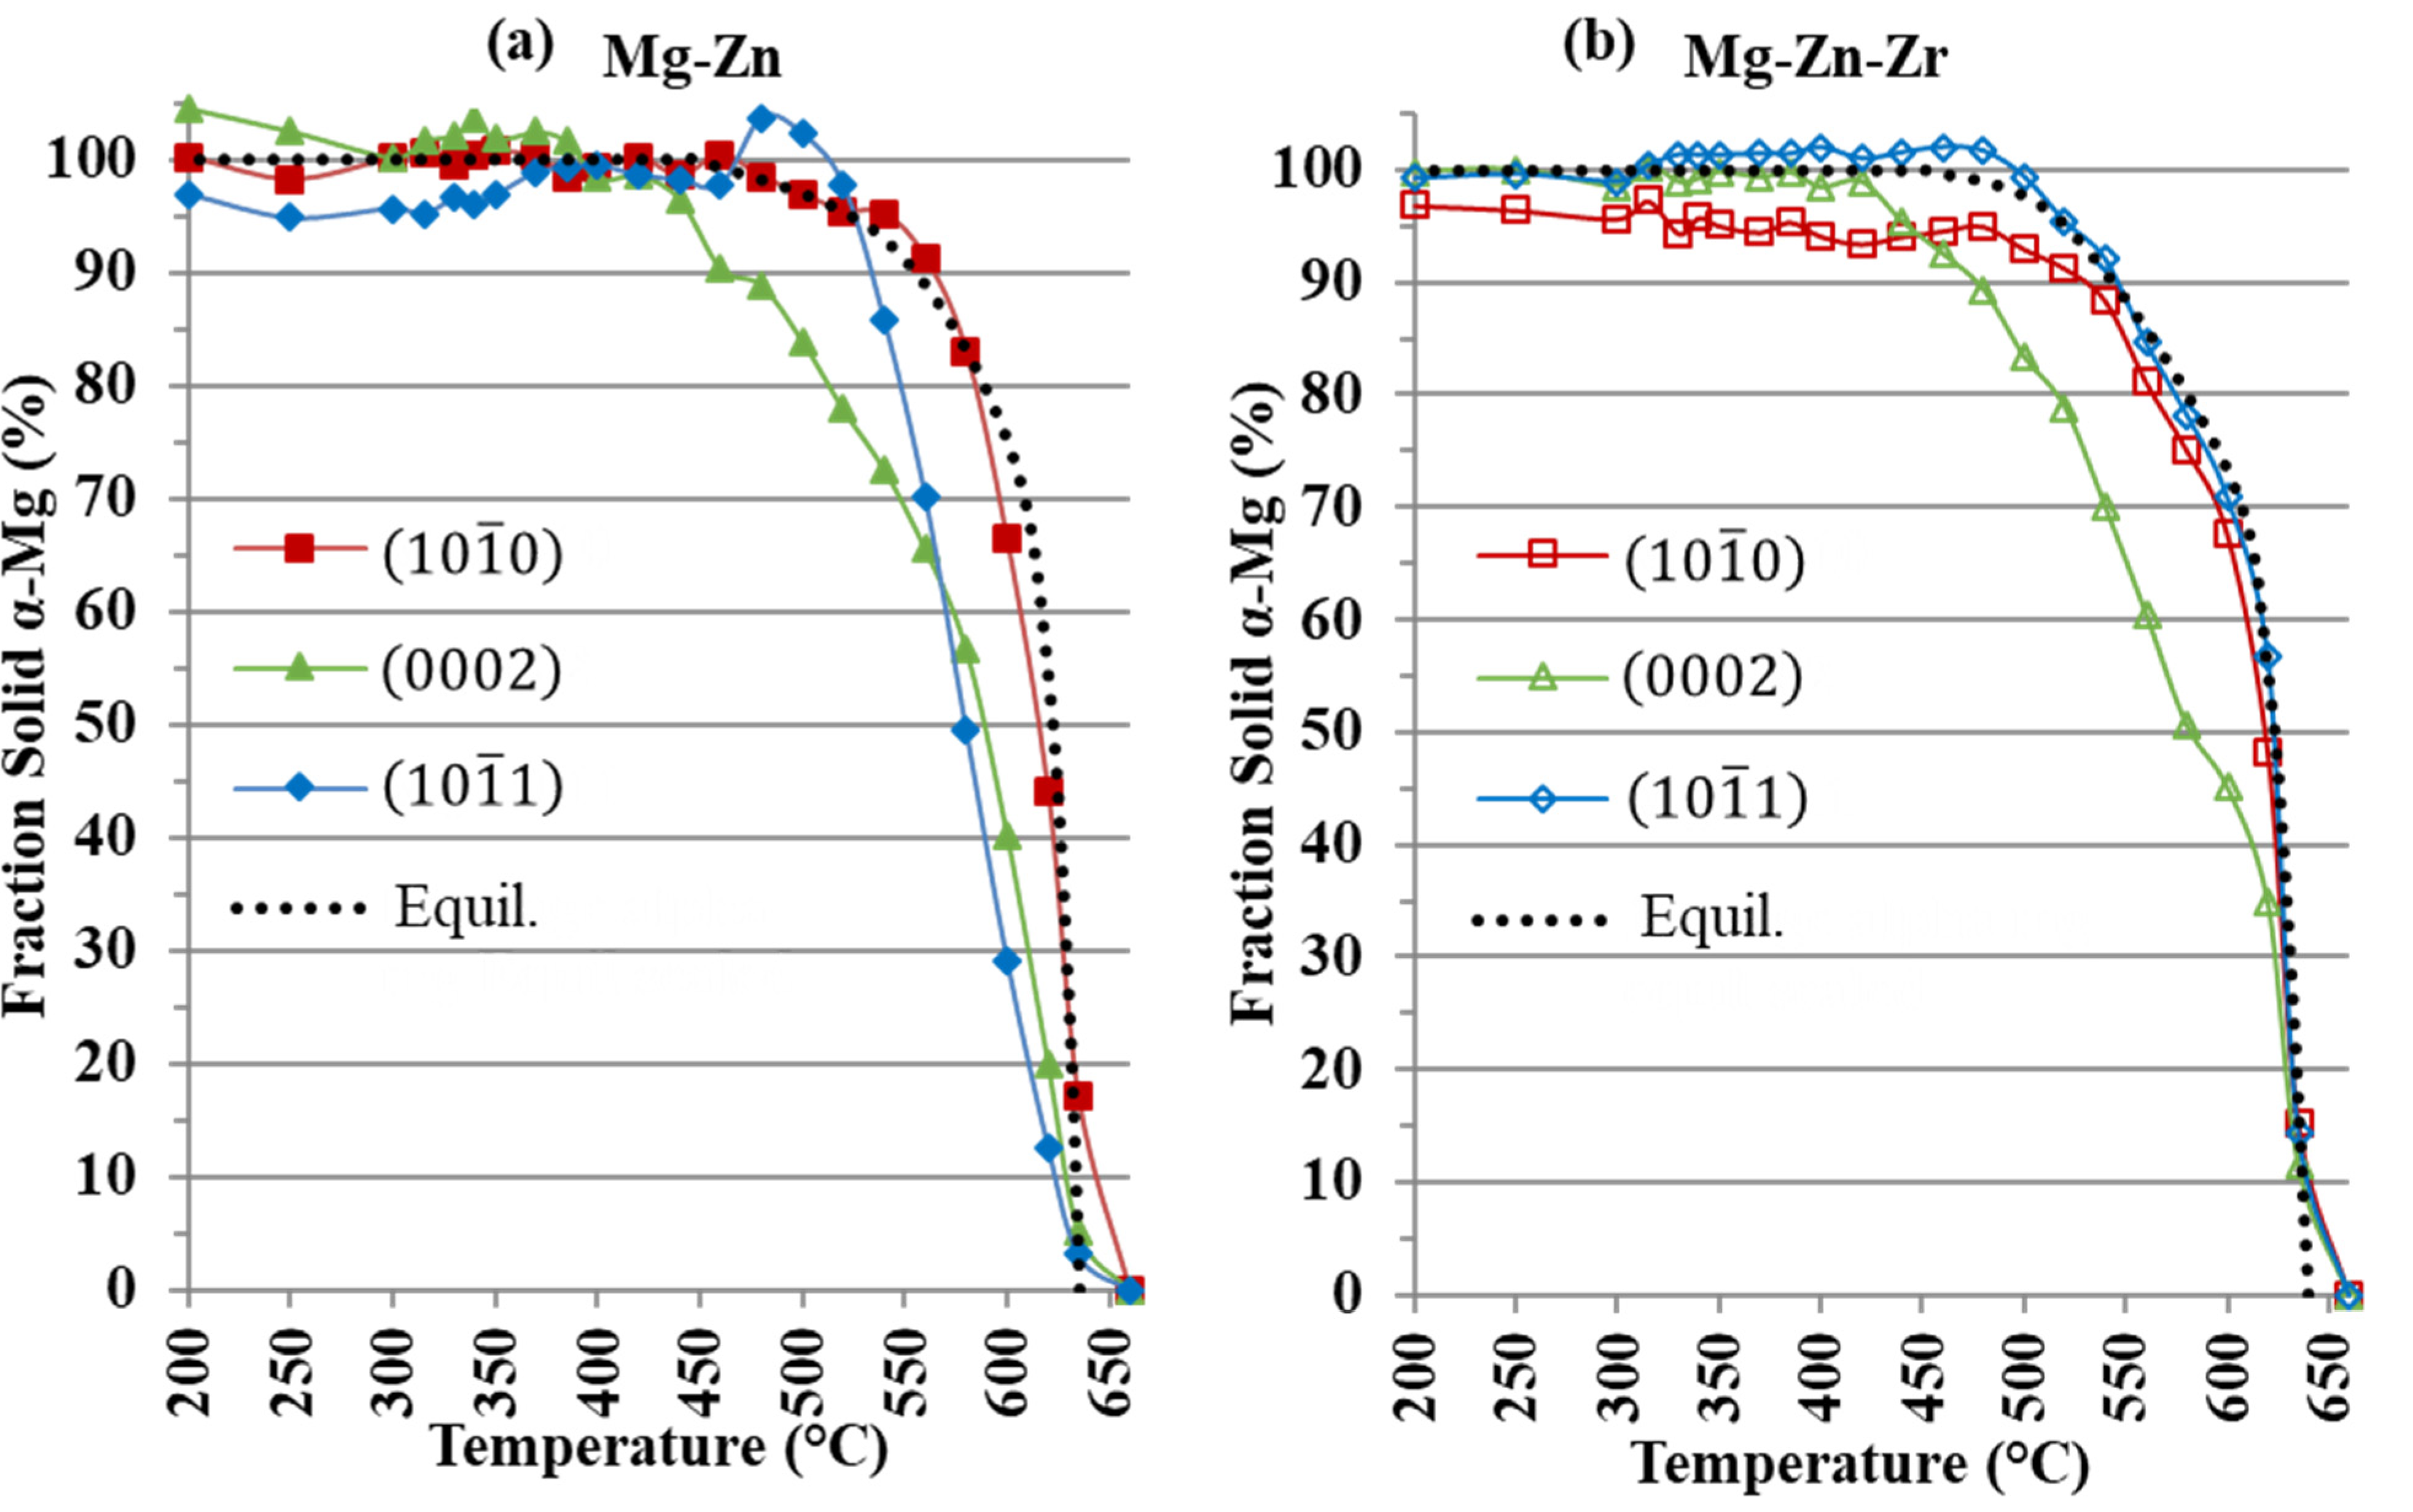
4.2. Solidification of Mg-Zn and Mg-Zn-Zr Alloys

The use of in-situ neutron diffraction enabled observation of the growth of peak areas of individual α-Mg planes in the Mg-Zn and Mg-Zn-Zr alloys. During solidification of the Mg-Zn and Mg-Zn-Zr alloys, grains would grow, translate and rotate within the melt as the temperature decreased, resulting in a variation in scattering intensity. In the coarse-grained Mg-Zn alloy, irregular, coarse grains would translate and rotate within the melt, resulting in large fluctuations in fraction solid measurements from the peak areas of the ( 10 1 ¯ 0 ) ,   ( 0002 ) and ( 10 1 ¯ 1 ) planes in Figure 8, possibly misrepresenting the actual amount of solid phases present in the melt.
The grain refinement achieved by the addition of Zr resulted in a Mg-Zn-Zr alloy with an equiaxed, fine grain structure. The grain refining effect of Zr ensured that both the ( 10 1 ¯ 1 ) and ( 10 1 ¯ 0 ) planes’ peak areas were growing nearly identically, and each plane for the Mg-Zn-Zr alloy showed little fluctuation between temperature steps at the early stages of solidification. This uniform grain structure provided a moderated diffraction intensity and resulted in similar peak area growth between each plane at the onset of solidification (Figure 8).
The Mg-Zn and Mg-Zn-Zr alloys examined were 10 mm in diameter and 40 mm in length. The sampling volume encompassed the entire sample equaling to ~2.9 × 10³ grains for the Mg-Zn alloy and ~5 × 10⁶ grains for the Mg-Zn-Zr alloy, a difference of three orders of magnitude assuming spherical grains. During a previous study of the current authors [70], examination of a coarse-grained sample led to missing peaks; this was corrected in this study by examining larger samples and oscillating the sample during analysis. Additionally, for the current study, the high number of grains examined in the Mg-Zn-Zr alloy provided sufficient counting statistics and offered a clear representation of the solidifying sample.
While the fraction solid curves were much smoother in the grain refined Mg-Zn-Zr alloy (Figure 8b), there is still a source of fluctuations in fraction solid. These fluctuations are due to the competition between neighbouring grains as they grow and consume each other, as this was a possible source of neutron diffraction intensity fluctuations during a study on Al and Al-Ti-B alloys by Iqbal et al. [48,49].
For both the Mg-Zn and Mg-Zn-Zr alloys, the FactSage™ models would tend to follow the fastest growing peak area plane but were unable to determine which plane this represented and its relation to other planes. The independent plane solidification analysis offered by in-situ neutron diffraction provided unique insight into changes in Mg-Zn solidification with the addition of Zr that would not have been possible using traditional thermal analysis or modelling approaches.

4.3. Differences in Mg and Al Alloy Solidification

Using the data in Table 3, the growth restriction factor (Q) of the examined alloys was calculated. As seen from Table 3, the examined Al-Cu and Mg-Zn systems with their respective Ti and Zr grain refiners have similar compositional characteristics. Both Al-Cu and Mg-Zn are eutectic systems with similar m and k values for added Cu and Zn, respectively. Using 5 wt.% of each addition then provides a very useful comparison for both alloy systems. For both systems, they show significant grain refinement with added Ti (in the form of Al-5Ti-1B), and Zr. Both Al-Ti and Mg-Zr systems are peritectic, and although the growth restriction factor (Q) is not simply additive for multi-component alloys due to changes in solute distribution coefficient (k), solute concentration (Co) and liquidus slope (m) [76], the added Ti and Zr provide significant Q, with the Mg alloys having higher overall Q.
The implications of the values in Table 3 are that both Al-Cu and Mg-Zn with their respective Ti and Zr additions fulfil all the necessities needed to be excellent grain refiners. The reasoning can be explained by the Interdependence theory [15,55,77,78], where both potency of nucleants and growth of a constitutional undercooled solidification front is necessary to obtain a fine grain size. A good grain refiner is then one that is potent by having a good lattice match, is of the correct size distribution to act as a substrate and is in sufficient number in the melt, while also providing high growth restriction [15,55,77,78]. Another key parameter is a Q/k that provides a measure of the amount of undercooling possible for a given system. If the required undercooling for nucleation is larger than the Q/k that can be provided, then no new nucleants can be activated, and a resulting columnar structure will result [76]. The value of Q/k for the Al-Cu-02Ti alloy is 0.58 K; it is 1.45 K for the Al-Cu-05Ti alloy. For the Al-Cu-02Ti alloy, the Q/k is only marginally larger than the required 0.3 K for nucleation, indicating that further nucleation events might not occur, and a columnar grain structure can result. With 0.05 wt.% Ti, the higher Q/k provided sufficient undercooling in order to activate nucleants, resulting in an equiaxed structure. For the Mg-Zn-Zr alloys, the high Q/k of 4.05 K enables sufficient undercooling to activate many nucleants. Finally, a plot of Grain size vs. 1/Q offers comparative analysis of the grain refinement of Al and Mg and is shown in Figure 9. From Figure 9, both alloys have a very small or even negligible y-intercept that indicates a sufficient number of nucleants [78]. In addition, the steeper slope of the Mg alloys indicates that more constitutional undercooling is provided with Zr. That is, Zr is an effective refiner because the undercooling required is small and it can build a large solute layer that ensures activation of nucleants. In addition, the high solubility of Zr in Mg enables a high concentration of addition to provide a large solute layer. For Ti in Al alloys, at low Ti levels, there is insufficient Q to generate adequate constitutional undercooling to activate nucleants, resulting in a lack of new nucleating sites and a final columnar grain structure. With additional Ti, sufficient undercooling is generated, activating nucleants that result in an equiaxed grain structure. For the Mg-Zn alloys, sufficient Q for an equiaxed grain structure was available with the 5 wt% Zn. The addition of Zr then introduced additional solute and nucleants to reduce the size of the resulting grains. This helps explain why both the refined and unrefined Mg-Zn alloys had equiaxed grain structures while the Al-Cu alloy only showed a columnar to equiaxed transition after sufficient Ti was introduced.

5. Conclusions

In-situ neutron diffraction was used to examine the solidification behaviours of Al-Cu and Mg-Zn alloys with Ti and Zr grain refiners, respectively. The key conclusions were:
  • With sufficient addition of grain refining agents, the Mg-Zn alloy transitioned from a large, mainly equiaxed grain structure to a fine equiaxed grain structure, while the Al-Cu alloy transitioned from an initial columnar grain structure to that of a fine globular one.
  • The fraction solid curves for the Mg-Zn alloy were highly fluctuating and varied widely between planes because of the large grain structure and unregulated growth of peak areas of planes. The planes for the Mg-Zn-Zr alloy showed little variation in peak areas and fraction solid, as the added Zr grain refiner provided regulation of solidification, resulting in the uniform growth of grains.
  • The fraction solid curves for α-Al showed distinct profiles for the three investigated Al-Cu alloy conditions. Overall, the growth of α-Al was slower and more uniform for the refined alloys, which was consistent with the globular, equiaxed grain structure observed for these alloys. In addition, precipitation of Al2Cu varied between the unrefined and refined alloy conditions, leading to differences in phase morphology.

Author Contributions

Conceptualization, A.E., F.D. and D.S.; methodology, A.E., F.D. and D.S.; writing—original draft preparation, A.E. and F.D.; writing—review and editing, D.S. and C.R.; supervision, D.S. and C.R.; project administration, D.S. and C.R.; funding acquisition, D.S. and C.R. All authors have read and agreed to the published version of the manuscript.

Funding

The authors acknowledge the financial support of the Natural Sciences and Engineering Research Council of Canada (NSERC, RGPIN-2019-04169).

Institutional Review Board Statement

Not applicable.

Informed Consent Statement

Not applicable.

Data Availability Statement

Not applicable.

Acknowledgments

The authors would like to thank the staff at the Canadian Nuclear Laboratories, for their allotment of beam time and setup assistance necessary for this research. The authors also thank G. Marzano (Haley Industries) for the Mg ingots and staff at CMQ (TroisRivières, QC) for composition analysis and A. Danaei formerly at the University of Toronto for diffraction support. Finally, the authors would like to thank former members of the Centre for Near-net-shape Processing of Materials at Ryerson University, in particular A. Lombardi, and technical staff, A. Machin, J. Amankrah and Q. Li.

Conflicts of Interest

The authors declare no conflict of interest.

References

  1. Qian, M.; Graham, D.; Zheng, L.; StJohn, D.H.; Frost, M.T. Alloying of Pure Magnesium with Mg-33.3 wt-%Zr Master Alloy. Mater. Sci. Technol. 2003, 19, 156–162. [Google Scholar] [CrossRef]
  2. Du, J.; Yang, J.; Kuwabara, M.; Li, W.; Peng, J. Effect of Strontium on the Grain Refining Efficiency of Mg-3Al Alloy Refined by Carbon Inoculation. J. Alloy. Compd. 2009, 470, 228–232. [Google Scholar] [CrossRef]
  3. Kim, Y.M.; Yim, C.D.; Kim, Y.H.; You, B.S. The Role of Carbon for Grain Refinement in Mg-Al Base Alloys. In Proceedings of the TMS Annual Meeting and Exhibition Magnesium Technology Symposium, Orlando, FL, USA, 25 February–1 March 2007; pp. 121–126. [Google Scholar]
  4. Davis, J.A.; Eastwood, L.W.; DeHaven, J. Grain Refinement of Magnesium Casting Alloys. Trans. Am. Foundrymen’s Soc. 1945, 53, 352–362. [Google Scholar]
  5. Ramachandran, T.R.; Sharma, P.K.; Balasubramanian, K. Grain Refinement of Light Alloys. In Proceedings of the 68th World Foundry Congress, Chennai, India, 7–11 February 2008; pp. 189–193. [Google Scholar]
  6. Lee, Y.C.; Dahle, A.K.; StJohn, D.H. Grain Refinement of Magnesium. In Proceedings of the TMS Annual Meeting and Exhibition Magnesium Technology Symposium, Nashville, TN, USA, 12–16 March 2000; Kaplan, H.I., Hryn, J.N., Clow, B.B., Eds.; pp. 211–218. [Google Scholar]
  7. Jin, Q.; Eom, J.P.; Lim, S.G.; Park, W.W.; You, B.S. Effects of C2Cl6 Addition on Grain Refinement and Mechanical Properties of AZ31 Magnesium Alloy. Met. Mater. Int. 2003, 9, 453–458. [Google Scholar] [CrossRef]
  8. Du, J.; Yang, J.; Kuwabara, M.; Li, W.; Peng, J. Effects of Carbon and/or Alkaline Earth Elements on Grain Refinement and Tensile Strength of AZ31 Alloy. Mater. Trans. 2008, 49, 2303–2309. [Google Scholar] [CrossRef] [Green Version]
  9. Huang, Y.; Hort, N.; Anopuo, O.; Kainer, K.U.; Vidrich, G.; Schiffl, A.; Liu, Y. Microstructural Investigations of Mg-Al Alloys Containing Small Amount of SiC Nucleants. In Proceedings of the TMS Annual Meeting and Exhibition Magnesium Technology Symposium, Orlando, FL, USA, 25 February–1 March 2007; pp. 421–426. [Google Scholar]
  10. Feng, X.; Wenwen, D.; Yangshan, S. Microstructure Refinement of Magnesium Based Alloy. In Proceedings of the International Conference on Magnesium—Science, Technology and Applications, Beijing, China, 20–24 September 2004; Volume 488–489, pp. 143–146. [Google Scholar]
  11. Duan, Z.C.; Sun, Y.S.; Wei, Y.; Du, W.W.; Xue, F.; Zhu, T.B. Microstructure and Tensile Properties of Magnesium Alloy Modified by Si/Ca Based Refiner. Trans. Nonferrous Met. Soc. China 2005, 15, 878–883. [Google Scholar]
  12. Cibula, A. The Mechanism of Grain Refinement of Sand Castings in Aluminium Alloys. J. Inst. Met. 1949, 76, 321–360. [Google Scholar]
  13. Fan, Z.; Wang, Y.; Zhang, Y.; Qin, T.; Zhou, X.R. Grain refining mechanism in the Al/Al–Ti–B system. Acta Mater. 2015, 84, 292–304. [Google Scholar] [CrossRef]
  14. Wang, X.; Han, Q. Grain Refinement Mechanism of Aluminum by Al-Ti-B Master Alloys. Light Met. 2016, 2016, 189–193. [Google Scholar]
  15. Qian, M.; Cao, P.; Easton, M.A.; McDonald, S.D.; StJohn, D.H. An Analytical Model for Constitutional Super-cooling-driven Grain Formation and Grain Size Prediction. Acta Mater. 2010, 58, 3262–3270. [Google Scholar] [CrossRef]
  16. Chalmers, B. Principles of Solidification; Springer: Boston, MA, USA, 1970. [Google Scholar]
  17. Günther, R.; Hartig, C.; Bormann, R. Grain Refinement of AZ31 by (SiC)P: Theoretical Calculation and Experiment. Acta Mater. 2006, 54, 5591–5597. [Google Scholar] [CrossRef]
  18. Sun, M.; Easton, M.A.; StJohn, D.H.; Wu, G.; Abbott, T.B.; Ding, W. Grain Refinement of Magnesium Alloys by Mg-Zr Master Alloys: The Role of Alloy Chemistry and Zr Particle Number Density. Adv. Eng. Mater. 2013, 15, 373–378. [Google Scholar] [CrossRef]
  19. Quested, T.E.; Greer, A.L. The Effect of the Size Distribution of Inoculant Particles on As-cast Grain Size in Aluminium Alloys. Acta Mater. 2004, 52, 3859–3868. [Google Scholar] [CrossRef]
  20. Greer, A.L.; Bunn, A.M.; Tronche, A.; Evans, P.V.; Bristow, D.J. Modelling of Inoculation of Metallic Melts: Application to Grain Refinement of Aluminium by Al-Ti-B. Acta Mater. 2000, 48, 2823–2835. [Google Scholar] [CrossRef]
  21. Greer, A.L. Overview: Application of Heterogeneous Nucleation in Grain-refining of Metals. J. Chem. Phys. 2016, 145, 211704. [Google Scholar] [CrossRef] [PubMed]
  22. Prasad, A.; Liotti, E.; McDonald, S.D.; Nogita, K.; Yasuda, H.; Grant, P.S.; StJohn, D.H. Real-time Synchrotron X-ray Observations of Equiaxed Solidification of Aluminium Alloys and Implications for Modelling. In IOP Conference Series: Materials Science and Engineering; 2015; Volume 84, p. 012014. [Google Scholar]
  23. Sauerwald, F. Process for the Production of Magnesium-Zirconium Alloys. US Patent US2228781A, 14 January 1941. [Google Scholar]
  24. Saunders, W.P.; Strieter, F.P. Alloying Zirconium to Magnesium. Trans. Am. Foundrymen’s Soc. 1952, 60, 581–594. [Google Scholar]
  25. Cao, P.; Qian, M.; StJohn, D.H.; Frost, M.T. Uptake of Iron and its Effect on Grain Refinement of Pure Magnesium by Zirconium. Mater. Sci. Technol. 2004, 20, 585–592. [Google Scholar] [CrossRef] [Green Version]
  26. Emley, E.F. Principles of Magnesium Technology; Pergamon Press Ltd.: Oxford, NY, USA, 1966. [Google Scholar]
  27. Hildebrand, Z.; Qian, M.; StJohn, D.H.; Frost, M.T. Influence of Zinc on the Soluble Zirconium Content in Magnesium and the Subsequent Grain Refinement by Zirconium. In Proceedings of the TMS Annual Meeting and Exhibition Magnesium Technology Symposium, Charlotte, NC, USA, 14–18 March 2004; pp. 241–245. [Google Scholar]
  28. Lee, Y.C.; Dahle, A.K.; StJohn, D.H. The Role of Solute in Grain Refinement of Magnesium. Metall. Mater. Trans. A 2000, 31, 2895–2906. [Google Scholar] [CrossRef]
  29. Qian, M.; Hildebrand, Z.; StJohn, D.H. The Loss of Dissolved Zirconium in Zirconium-refined Magnesium Alloys after Remelting. Metall. Mater. Trans. A 2009, 40, 2470–2479. [Google Scholar] [CrossRef]
  30. Qian, M.; StJohn, D.H.; Frost, M.T. New Zirconium-Rich Master Alloy for the Grain Refinement of Magnesium Alloys. In Magnesium Alloys and Their Applications; Kainer, K.U., Ed.; Wiley-VCH Verlag GmbH & Co. KGaA: Weinheim, Germany, 2005; pp. 706–712. [Google Scholar]
  31. Qian, M.; StJohn, D.H.; Frost, M.T. Heterogeneous Nuclei Size in Magnesium-zirconium Alloys. Scr. Mater. 2004, 50, 1115–1119. [Google Scholar] [CrossRef]
  32. Qian, M.; StJohn, D.H.; Frost, M.T. Effect of Soluble and Insoluble Zirconium on the Grain Refinement of Magnesium Alloys. Mater. Sci. Forum 2003, 419–412, 593–598. [Google Scholar] [CrossRef]
  33. Qian, M.; StJohn, D.H.; Frost, M.T. Zirconium Alloying and Grain Refinement of Magnesium Alloys. In Proceedings of the TMS Annual Meeting and Exhibition Magnesium Technology Symposium, San Diego, CA, USA, 2–6 March 2003; pp. 209–214. [Google Scholar]
  34. Qian, M.; StJohn, D.H.; Frost, M.T.; Barnett, M.R. Grain Refinement of Pure Magnesium Using Rolled Zirmax® Master Alloy (Mg-33.3Zr). In Proceedings of the TMS Annual Meeting and Exhibition Magnesium Technology Symposium, San Diego, CA, USA, 2–6 March 2003; pp. 215–220. [Google Scholar]
  35. Qian, M.; StJohn, D.H.; Frost, M.T. Characteristic Zirconium-rich Coring Structures in Mg-Zr Alloys. Scr. Mater. 2002, 46, 649–654. [Google Scholar] [CrossRef]
  36. Qian, M.; Zheng, L.; Graham, D.; Frost, M.T.; StJohn, D.H. Settling of Undissolved Zirconium Particles in Pure Magnesium Melts. J. Light Met. 2001, 1, 157–165. [Google Scholar] [CrossRef]
  37. Qian, M.; Das, A. Grain Refinement of Magnesium Alloys by Zirconium: Formation of Equiaxed Grains. Scr. Mater. 2006, 54, 881–886. [Google Scholar] [CrossRef]
  38. StJohn, D.H.; Easton, M.A.; Qian, M.; Taylor, J.A. Grain Refinement of Magnesium Alloys: A Review of Recent Research, Theoretical Developments, and their Application. Metall. Mater. Trans. A 2012, 44, 2935–2949. [Google Scholar] [CrossRef] [Green Version]
  39. StJohn, D.H.; Easton, M.A.; Qian, M. An Inverse Growth Restriction Model for Predicting Solidified Grain Size. In Proceedings of the 12th International Conference on Modeling of Casting, Welding, and Advanced Solidification Processes, Vancouver, BC, Canada, 7–14 July 2009; pp. 477–484. [Google Scholar]
  40. StJohn, D.H.; Qian, M.; Easton, M.A.; Cao, P.; Hildebrand, Z. Grain Refinement of Magnesium Alloys. Metall. Mater. Trans. A 2005, 36, 1669–1679. [Google Scholar] [CrossRef]
  41. Saha, P.; Viswanathan, S. An Analysis of the Grain Refinement of Magnesium by Zirconium. In Proceedings of the TMS Annual Meeting and Exhibition Magnesium Technology Symposium, San Diego, CA, USA, 27 February–3 March 2011; pp. 175–180. [Google Scholar]
  42. Qian, M. Heterogeneous Nucleation on Potent Spherical Substrates during Solidification. Acta Mater. 2007, 55, 943–953. [Google Scholar] [CrossRef]
  43. Vinotha, D.; Raghukandan, K.; Pillai, U.T.S.; Pai, B.C. Grain Refining Mechanisms in Magnesium Alloys—An Overview. Trans. Indian Inst. Met. 2009, 62, 521–532. [Google Scholar] [CrossRef]
  44. Bamberger, M. Structural Refinement of Cast Magnesium Alloys. Mater. Sci. Technol. 2001, 17, 15–24. [Google Scholar] [CrossRef]
  45. Flemings, M.C. Solidification Processing; McGraw-Hill: New York, NY, USA, 1974. [Google Scholar]
  46. Vogel, S.C.; Carpenter, J.S. Brief Introduction to Neutron Scattering and Global Neutron User Facilities. JOM 2012, 64, 104–111. [Google Scholar] [CrossRef]
  47. Lombardi, A.; Vandersluis, E.; Sediako, D.; Ravindran, C. Neutron Diffraction Analysis of Light Alloys: A Review. In Proceedings of the 9th International Conference on Processing and Manufacturing of Advanced Materials THERMEC 2016, Graz, Austria, 29 May–3 June 2016; Volume 879, pp. 1558–1563. [Google Scholar]
  48. Iqbal, N.; Van Dijk, N.H.; Verhoeven, V.W.J.; Montfrooij, W.; Hansen, T.; Katgerman, L.; Kearley, G.J. Experimental Study of Ordering Kinetics in Aluminum Alloys During Solidification. Acta Mater. 2003, 51, 4497–4504. [Google Scholar] [CrossRef]
  49. Iqbal, N.; Van Dijk, N.H.; Verhoeven, V.W.J.; Hansen, T.; Katgerman, L.; Kearley, G.J. Periodic Structural Fluctuations During the Solidification of Aluminum Alloys Studied by Neutron Diffraction. Mater. Sci. Eng. A 2004, 367, 82–88. [Google Scholar] [CrossRef]
  50. Sediako, D.; Kasprzak, W.; Swainson, I.; Garlea, O. Solidification Analysis of Al-Si Alloys Modified with Addition of Cu Using In-situ Neutron Diffraction. In Proceedings of the TMS Annual Meeting and Exhibition Materials Fabrication, Properties, Characterization and Modelling Symposium, San Diego, CA, USA, 27 February–3 March 2011; Volume 2, pp. 279–289. [Google Scholar]
  51. Kasprzak, W.; Sediako, D.; Walker, M.; Sahoo, M.; Swainson, I. Solidification Analysis of an Al-19 Pct Si Alloy Using In-situ Neutron Diffraction. Metall. Mater. Trans. A 2011, 42, 1854–1862. [Google Scholar] [CrossRef] [Green Version]
  52. D’Elia, F.; Ravindran, C.; Sediako, D.; Donaberger, R. Solidification Analysis of Al-5 wt-%Cu Alloy Using In-Situ Neutron Diffraction. Can. Metall. Q. 2014, 54, 9–15. [Google Scholar] [CrossRef]
  53. D’Elia, F.; Ravindran, C.; Sediako, D.; Kainer, K.U.; Hort, N. Hot Tearing Mechanisms of B206 Aluminum-Copper Alloy. Mater. Des. 2014, 64, 44–55. [Google Scholar] [CrossRef]
  54. Drezet, J.M.; Mireux, B.; Szaraz, Z.; Pirling, T. In-situ Neutron Diffraction during Casting: Determination of Rigidity Point in Grain Refined Al-Cu Alloys. Materials 2014, 7, 1165–1172. [Google Scholar] [CrossRef] [Green Version]
  55. Easton, M.A.; Qian, M.; Prasad, A.; StJohn, D.H. Recent Advances in Grain Refinement of Light Metals and Alloys. Curr. Opin. Solid State Mater. Sci. 2016, 20, 13–24. [Google Scholar] [CrossRef] [Green Version]
  56. Lombardi, A.; Elsayed, A.; Sediako, D.; Ravindran, C. Analysis of the Solidification Characteristics of a 319 type Al Alloy Using In-situ Neutron Diffraction. J. Alloy. Compd. 2017, 695, 2628–2636. [Google Scholar] [CrossRef]
  57. Vandersluis, E.; Ravindran, C.; Sediako, D.; Elsayed, A.; Byczynski, G. Strontium-modification in the Stepwise Solidification of A319 Al Alloy: An In-situ Neutron Diffraction Study. J. Alloy. Compd. 2019, 792, 240–249. [Google Scholar] [CrossRef]
  58. Vandersluis, E.; Sediako, D.; Ravindran, C.; Elsayed, A.; Byczynski, G. Analysis of Eutectic Silicon Modification during Solidification of Al-6Si Using In-situ Neutron Diffraction. J. Alloy. Compd. 2018, 736, 172–180. [Google Scholar] [CrossRef]
  59. Cullity, B.D. Elements of X-ray Diffraction; Addison-Wesley: Reading, PA, USA, 1956. [Google Scholar]
  60. Siebert-Timmer, A.; Fletcher, M.; Bichler, L.; Sediako, D. Creep Performance of Wrought AX30 and EZ33 Magnesium Alloys. Can. Metall. Q. 2013, 52, 430–438. [Google Scholar] [CrossRef]
  61. Wu, W.; Liaw, P.K.; An, K. Unraveling Cyclic Deformation Mechanisms of a Rolled Magnesium Alloy using In-situ Neutron Diffraction. Acta Mater. 2015, 85, 343–353. [Google Scholar] [CrossRef] [Green Version]
  62. Aizawa, K.; Gong, W.; Harjo, S.; Abe, J.; Iwahashi, T.; Kamiyama, T. In-situ Neutron Diffraction Study on Tensile Behavior of LPSO Mg-Zn-Y Alloys. Mater. Trans. 2013, 54, 1083–1086. [Google Scholar] [CrossRef] [Green Version]
  63. Stanford, N.; Cottam, R.; Davis, B.; Robson, J. Evaluating the Effect of Yttrium as a Solute Strengthener in Magnesium using In-situ Neutron Siffraction. Acta Mater. 2014, 78, 1–13. [Google Scholar] [CrossRef]
  64. Lee, S.Y.; Wang, H.; Gharghouri, M.A.; Nayyeri, G.; Woo, W.; Shin, E.; Wu, P.D.; Poole, W.J.; Wu, W.; An, K. Deformation Behavior of Solid-solution-strengthened Mg-9 wt.% Al Alloy: In situ Neutron Diffraction and Elastic-viscoplastic Self-consistent Modeling. Acta Mater. 2014, 73, 139–148. [Google Scholar] [CrossRef]
  65. Lee, S.Y.; Gharghouri, M.A. Pseudoelastic Behavior of Magnesium Alloy during Twinning-Dominated Cyclic Deformation. Mater. Sci. Eng. A 2013, 572, 98–102. [Google Scholar] [CrossRef]
  66. Muránsky, O.; Barnett, M.R.; Carr, D.G.; Vogel, S.C.; Oliver, E.C. Investigation of Deformation Twinning in a Fine-grained and Coarse-grained ZM20 Mg Alloy: Combined In-situ Neutron Diffraction and Acoustic Emission. Acta Mater. 2010, 58, 1503–1517. [Google Scholar] [CrossRef]
  67. Elsayed, A.; Sediako, D.; Ravindran, C. Solidification of Mg-9Al Alloy using In-situ Neutron Diffraction. In Proceedings of the Materials Science and Technology Conference and Exhibition, Montréal, QC, Canada, 27–31 October 2013; Volume 2, pp. 972–979. [Google Scholar]
  68. Elsayed, A.; Sediako, D.; Ravindran, C. Investigation of the Solidification Behaviour of Mg-6Al and Mg-9Al Alloys Using In-situ Neutron Diffraction. Can. Metall. Q. 2015, 54, 16–23. [Google Scholar] [CrossRef]
  69. Davis, T.; Bichler, L.; Sediako, D.; Balogh, L. Solidification Analysis of Grain Refined AZ91D Magnesium Alloy via Neutron Diffraction. Miner. Met. Mater. Ser. 2018, F7, 425–428. [Google Scholar]
  70. Elsayed, A.; Sediako, D.; Ravindran, C. Solidification Behavior of Mg-Zn and Mg-Zn-Zr Alloys Using In-situ Neutron Diffraction. J. Mater. Eng. Perform. 2015, 24, 2250–2255. [Google Scholar] [CrossRef]
  71. Elsayed, A.; Sediako, D.; Ravindran, C. Solidification Analysis of a Magnesium-zinc Alloy Using In-situ Neutron Diffraction. In Proceedings of the TMS Annual Meeting and Exhibition Shape Casting Symposium, Nashville, TN, USA, 14–16 February 2016; pp. 167–174. [Google Scholar]
  72. Nakashima, P.N.H. The Crystallography of Aluminum and Its Alloys. In The Encyclopedia of Aluminum and Its Alloys; Totten, G., Tiryakioglu, M., Kessler, O., Eds.; CRC Press: Boca Raton, FL, USA, 2019; pp. 488–586. [Google Scholar]
  73. Davis, J.R. Aluminum and Aluminum Alloys; ASM International: Materials Park, OH, USA, 1993. [Google Scholar]
  74. Avedesian, M.; Baker, H. Magnesium and Magnesium Alloys; ASM International: Materials Park, OH, USA, 1999. [Google Scholar]
  75. Colley, L.J.; Wells, M.A.; MacKay, R.; Kasprzak, W. Dissolution of Second Phase Particles in 319-Type Aluminum Alloy. In Proceedings of the 26th ASM Heat Treating Society Conference, Cincinnati, OH, USA, 31 October–2 November 2011; pp. 189–198. [Google Scholar]
  76. Easton, M.A.; StJohn, D.H. A Model of Grain Refinement Incorporating Alloy Constitution and Potency of Heterogeneous Nucleant Particles. Acta Mater. 2001, 49, 1867–1878. [Google Scholar] [CrossRef]
  77. StJohn, D.H.; Easton, M.A.; Qian, M.; Cao, P.; Birmingham, M.J. Introduction to the Interdependence Theory of Grain Formation and its Application to Aluminium, Magnesium and Titanium Alloys. Mater. Sci. Forum 2011, 690, 206–209. [Google Scholar] [CrossRef]
  78. StJohn, D.H.; Qian, M.; Easton, M.A.; Cao, P. The Interdependence Theory: The Relationship between Grain Formation and Nucleant Selection. Acta Mater. 2011, 59, 4907–4921. [Google Scholar] [CrossRef]
Figure 1. Grain structures of unrefined (a) Al-Cu and (b) Mg-Zn prior to in-situ neutron diffraction experiments.
Metals 12 00793 g001
Figure 2. Grain structures of (a) Al-Cu, (b) Al-Cu-02Ti, (c) Al-Cu-05Ti, (d) Mg-Zn and (e) Mg-Zn-Zr after in-situ neutron diffraction experiments.
Metals 12 00793 g002
Figure 3. SEM images of (a) Al-Cu, (b) Al-Cu-05Ti, (c) Mg-Zn and (d) Mg-Zn-Zr alloys after in-situ neutron diffraction experiments.
Metals 12 00793 g003
Figure 4. In-situ neutron diffraction plots of (a) Al-Cu and (b) Mg-Zn at different temperatures (°C, select isotherms omitted for clarity).
Metals 12 00793 g004
Figure 5. In-situ neutron diffraction plot of (a) Al-Cu alloy ( 111 ) plane and (b) Al2Cu ( 310 ) plane in Al-Cu alloy at different temperatures (°C, select isotherms omitted for clarity).
Metals 12 00793 g005
Figure 6. In-situ neutron diffraction plot of Mg-Zn-Zr alloy ( 10 1 ¯ 0 ) plane at different temperatures (°C, select isotherms omitted for clarity).
Metals 12 00793 g006
Figure 7. Fraction solid (%) versus temperature of (a) α-Al and Al2Cu for Al-Cu, (b) α-Al for Al-Cu-02Ti, and (c) α-Al and Al2Cu for Al-Cu-05Ti.
Metals 12 00793 g007
Figure 8. Fraction solid (%) versus temperature of (a) α-Mg for Mg-Zn and (b) α-Mg for Mg-Zn-Zr.
Metals 12 00793 g008
Figure 9. Grain size versus 1/Q for Al and Mg alloys.
Metals 12 00793 g009
Table 1. Compositions of prepared Al-Cu and Mg-Zn alloys (wt.%).
AlloyAlCuFeSiTi
Al-CuBal.5.20.090.060.007
Al-Cu-02TiBal.5.20.130.080.02
Al-Cu-05TiBal.5.20.110.100.05
MgZnAlMnZr
Mg-ZnBal.5.70.150.010
Mg-Zn-ZrBal.6.10.150.010.5
Table 2. Grain sizes of unrefined and refined Al-Cu and Mg-Zn alloys.
AlloyGrain Size (µm)% Reduction
Al-Cu (unrefined)1154 ± 238-
Al-Cu-02Ti (refined)366 ± 6168
Al-Cu-05Ti (refined)94 ± 1492
Mg-Zn (unrefined)1272 ± 227-
Mg-Zn-Zr (refined)104 ± 2292
Table 3. Equilibrium Phase Diagram Properties of Solute in Al and Mg [73,74] with Calculated Q Values for Examined Al and Mg Alloys.
Liquidus Slope (m, °C/wt.%)Solute Partition Coefficient (k, (wt.%/wt.%)Solute Conc. (Co, wt.%)AlloyGrowth Restriction Factor (Q, °C) *%Increase in Q Relative to Ti or Zr Free Alloy1/Q
Al Alloys
Cu−3.40.175Al-Cu14.1-0.071
Al-Cu-02Ti18.6320.054
Ti33.37.80.02 or 0.05Al-Cu-05Ti25.4800.039
Mg Alloys
Zn−6.040.125Mg-Zn25.6-0.037
Zr6.96.550.7Mg-Zn-Zr53.21080.019
* The growth restriction factor (Q) is typically not additive for multi-component alloys but the values in the table illustrate the large constitutional effect Ti and Zr provide.
Publisher’s Note: MDPI stays neutral with regard to jurisdictional claims in published maps and institutional affiliations.

