Article

Effect of Prior Cold Reduction of C–Si–Mn Hot-Rolled Sheet on Microstructures and Mechanical Properties after Quenching and Partitioning Treatment

1
The State Key Laboratory of Refractories and Metallurgy, Wuhan University of Science and Technology, Wuhan 430081, China
2
Key Laboratory for Ferrous Metallurgy and Resources Utilization of Ministry of Education, Wuhan University of Science and Technology, Wuhan 430081, China
*
Author to whom correspondence should be addressed.
Metals 2022, 12(5), 799; https://doi.org/10.3390/met12050799
Submission received: 10 April 2022 / Revised: 29 April 2022 / Accepted: 3 May 2022 / Published: 5 May 2022
(This article belongs to the Special Issue Advances in High-Strength Low-Alloy Steels)

Abstract

:
This paper studies the microstructures and mechanical properties of quenching and partitioning (Q&P) samples prepared with 35% and 75% cold reduction sheets at an annealing temperature of 810 °C (intercritical temperature). The results indicate that prior cold reduction could significantly influence the ferrite recovery and recrystallization during intercritical annealing, which changes the size and distribution of the ferrite and retained austenite in the Q&P samples. Compared with the 75%—Q&P sample, the 35%—Q&P sample had smaller recrystallized ferrite and retained austenite grains, a higher volume fraction of retained austenite, and a more uneven size distribution of retained austenite. The 35%—Q&P sample presented better total elongation and a higher product of strength and elongation (PSE) than the 75%—Q&P sample. The higher total elongation was related to the higher content and uneven size distribution of retained austenite for they strengthened the TRIP effect and improved the uniform elongation of the sample. The results proved that Q&P steel prepared with a cold-rolled sheet with lower reduction exhibits a better combination of strength and plasticity due to the fact that lower reduction can delay the growth rate of austenite and recrystallized ferrite grains during the intercritical annealing stage.

1. Introduction

The demand for improved passenger safety and fuel efficiency in the global automobile industry has led to the development of new advanced high-strength steels (AHSS). Third-generation AHSS are attractive, particularly due to their strength-ductility combinations, which are significantly better than those exhibited by first-generation AHSS and cost significantly less than those required by the second-generation AHSS [1]. Quenching and partitioning (Q&P) processing, initially proposed by Speer et al. [2,3], is one of the most promising and innovative heat treatments for the preparation of third-generation AHSS. The Q&P process starts with partial or full austenization, followed by interrupted quenching at a temperature between the martensite start temperature (Ms) and the martensite finish temperature (Mf), to obtain a predetermined combination of martensite and austenite (or ferrite). Next, the steel undergoes an isothermal treatment at the same temperature or a higher temperature to migrate carbon from the supersaturated martensite to the untransformed austenite. Finally, the steel is quenched to room temperature, and the austenite with sufficiently enriched carbon is retained at room temperature. The impact of such a treatment on mechanical properties depends strongly on the transformation-induced plasticity (TRIP) effect, which is controlled by the volume fraction and stability of the retained austenite [4,5,6].
Due to its enhanced ductility and strength, Q&P steel can be used in thinner gauges, reducing body-in-white weight and, consequently, improving fuel efficiency. The thin-gauge sheet used in preparing Q&P steel is generally prepared by the hot rolling and cold rolling processes, and the final thickness of the sheet is determined by cold reduction. The prior cold rolling breaks the microstructure and increases the storage energy of sheet. Both the defect density and the storage energy of the steel increases with the increase of cold reduction. Some studies indicated that the defects and storage energy induced by cold rolling can influence ferrite recrystallization and austenite formation during intercritical annealing, thereby changing the morphology and distribution of austenite before quenching [7,8,9]. The carbon partitioning and the retained austenite stability in Q&P steel are significantly influenced by the morphology and distribution of austenite [10,11,12]. Therefore, microstructures induced by prior cold reduction may influence the microstructures and mechanical properties of Q&P steel. Nevertheless, the effect of prior cold reduction on the microstructures and mechanical properties of Q&P steel remains unknown and needs further investigation.
In this study, the 35% and 75% cold reduction 0.2C–1.7Si–1.9Mn wt% thin-gauge sheets were treated with intercritical annealing, quenching, and partitioning. The influence of prior cold reduction on the microstructures and mechanical properties of Q&P steels was investigated.

2. Experimental Procedure

The material was received as ~2 mm, commercial, hot-rolled 0.2C–1.7Si–1.9Mn wt% steel. The 35% CR and 75% CR sheets were prepared by subjecting the as-received steel to 35% and 75% cold reduction in thickness, respectively. The expansion curve of the hot–rolled 0.2C–1.7Si–1.9Mn wt% steel during heating and cooling was measured with a Gleeble 3500 type dilatometer, as shown in Figure 1a. The Ac1, Ac3, Ms, and Mf temperatures of the as-received steel were 662 °C, 895 °C, 358 °C, and 213 °C, respectively. According to the measured Ac1, Ac3, Ms, and Mf temperatures, the annealing, quenching, and partitioning temperatures of Q&P treatment were formulated, as shown in Figure 1b. The 35% CR and 75% CR sheets were rapidly heated to 810 °C in a muffle furnace and held for 180 s before undergoing an immediate quenching (first quenching) to 260 °C for 15 s in a salt bath and being transferred into another salt bath at 400 °C for 50 s. Last, the samples were quenched (second quenching) in water to room temperature.
The samples for the optical microscope (OM, Axioplan2 Imagine, Zeiss, Göttingen, Germany) and scanning electron microscope (SEM, Nova nano 400, FEI Company, Hillsboro, OR, USA) studies were mechanically polished and then etched in 4 vol% nital solution for 10 s. The electron backscatter diffraction (EBSD, Apreo S HiVac, Thermofisher, Waltham, MA, USA) samples were electrochemically etched in 5% perchloric acid alcohol operated at 25 °C with a current of 0.6 A and voltage of 28 V for about 30 s. EBSD measurement was carried out at 15 kV and at a step size of 50 nm. The transmission electron microscope (TEM, JEM-2100, Tokyo, Japan) samples were thinned to a thickness of 60 μm and then punched into 3 mm diameter discs. The discs were finally electro-polished in a twin-jet machine at −25 °C in a solution of perchloric acid and alcohol. The volume fractions of retained austenite in the samples were measured by X-ray diffraction (XRD, Panslytical, Almelo, The Netherlands) with Cu Kα radiation. The integrated intensities of the (200)γ, (220)γ, (311)γ, (200)α, and (211)α peaks were used to quantify the volume fraction of the retained austenite as in Equation (1) [13].
V = 1 1 + G I α I γ
where V is the volume fraction of retained austenite, Iγ is the integrated intensity of the fcc reflection peaks, and Iα is the integrated intensity of the bcc reflection peaks.
According to the GB/T228.1-2010 standard, the gauge length of a tensile sample is related to the thickness. Therefore, the tensile samples of 35%CR—Q&P steel and 75%CR—Q&P steel were machined to a profile of 93 × 20 mm and 89 × 20 mm, respectively. The gauge lengths of the 35%CR—Q&P steel and 75%CR—Q&P steel were 30 mm and 26 mm, respectively. The gauge width of all samples was 12.5 mm. Tensile tests were conducted at a strain rate of 5 × 10⁻⁴ s−1 using a CMT5304 (Shenzhen SUNS Technology Stock Co., Ltd., Shenzhen, China) tensile machine at room temperature.

3. Results

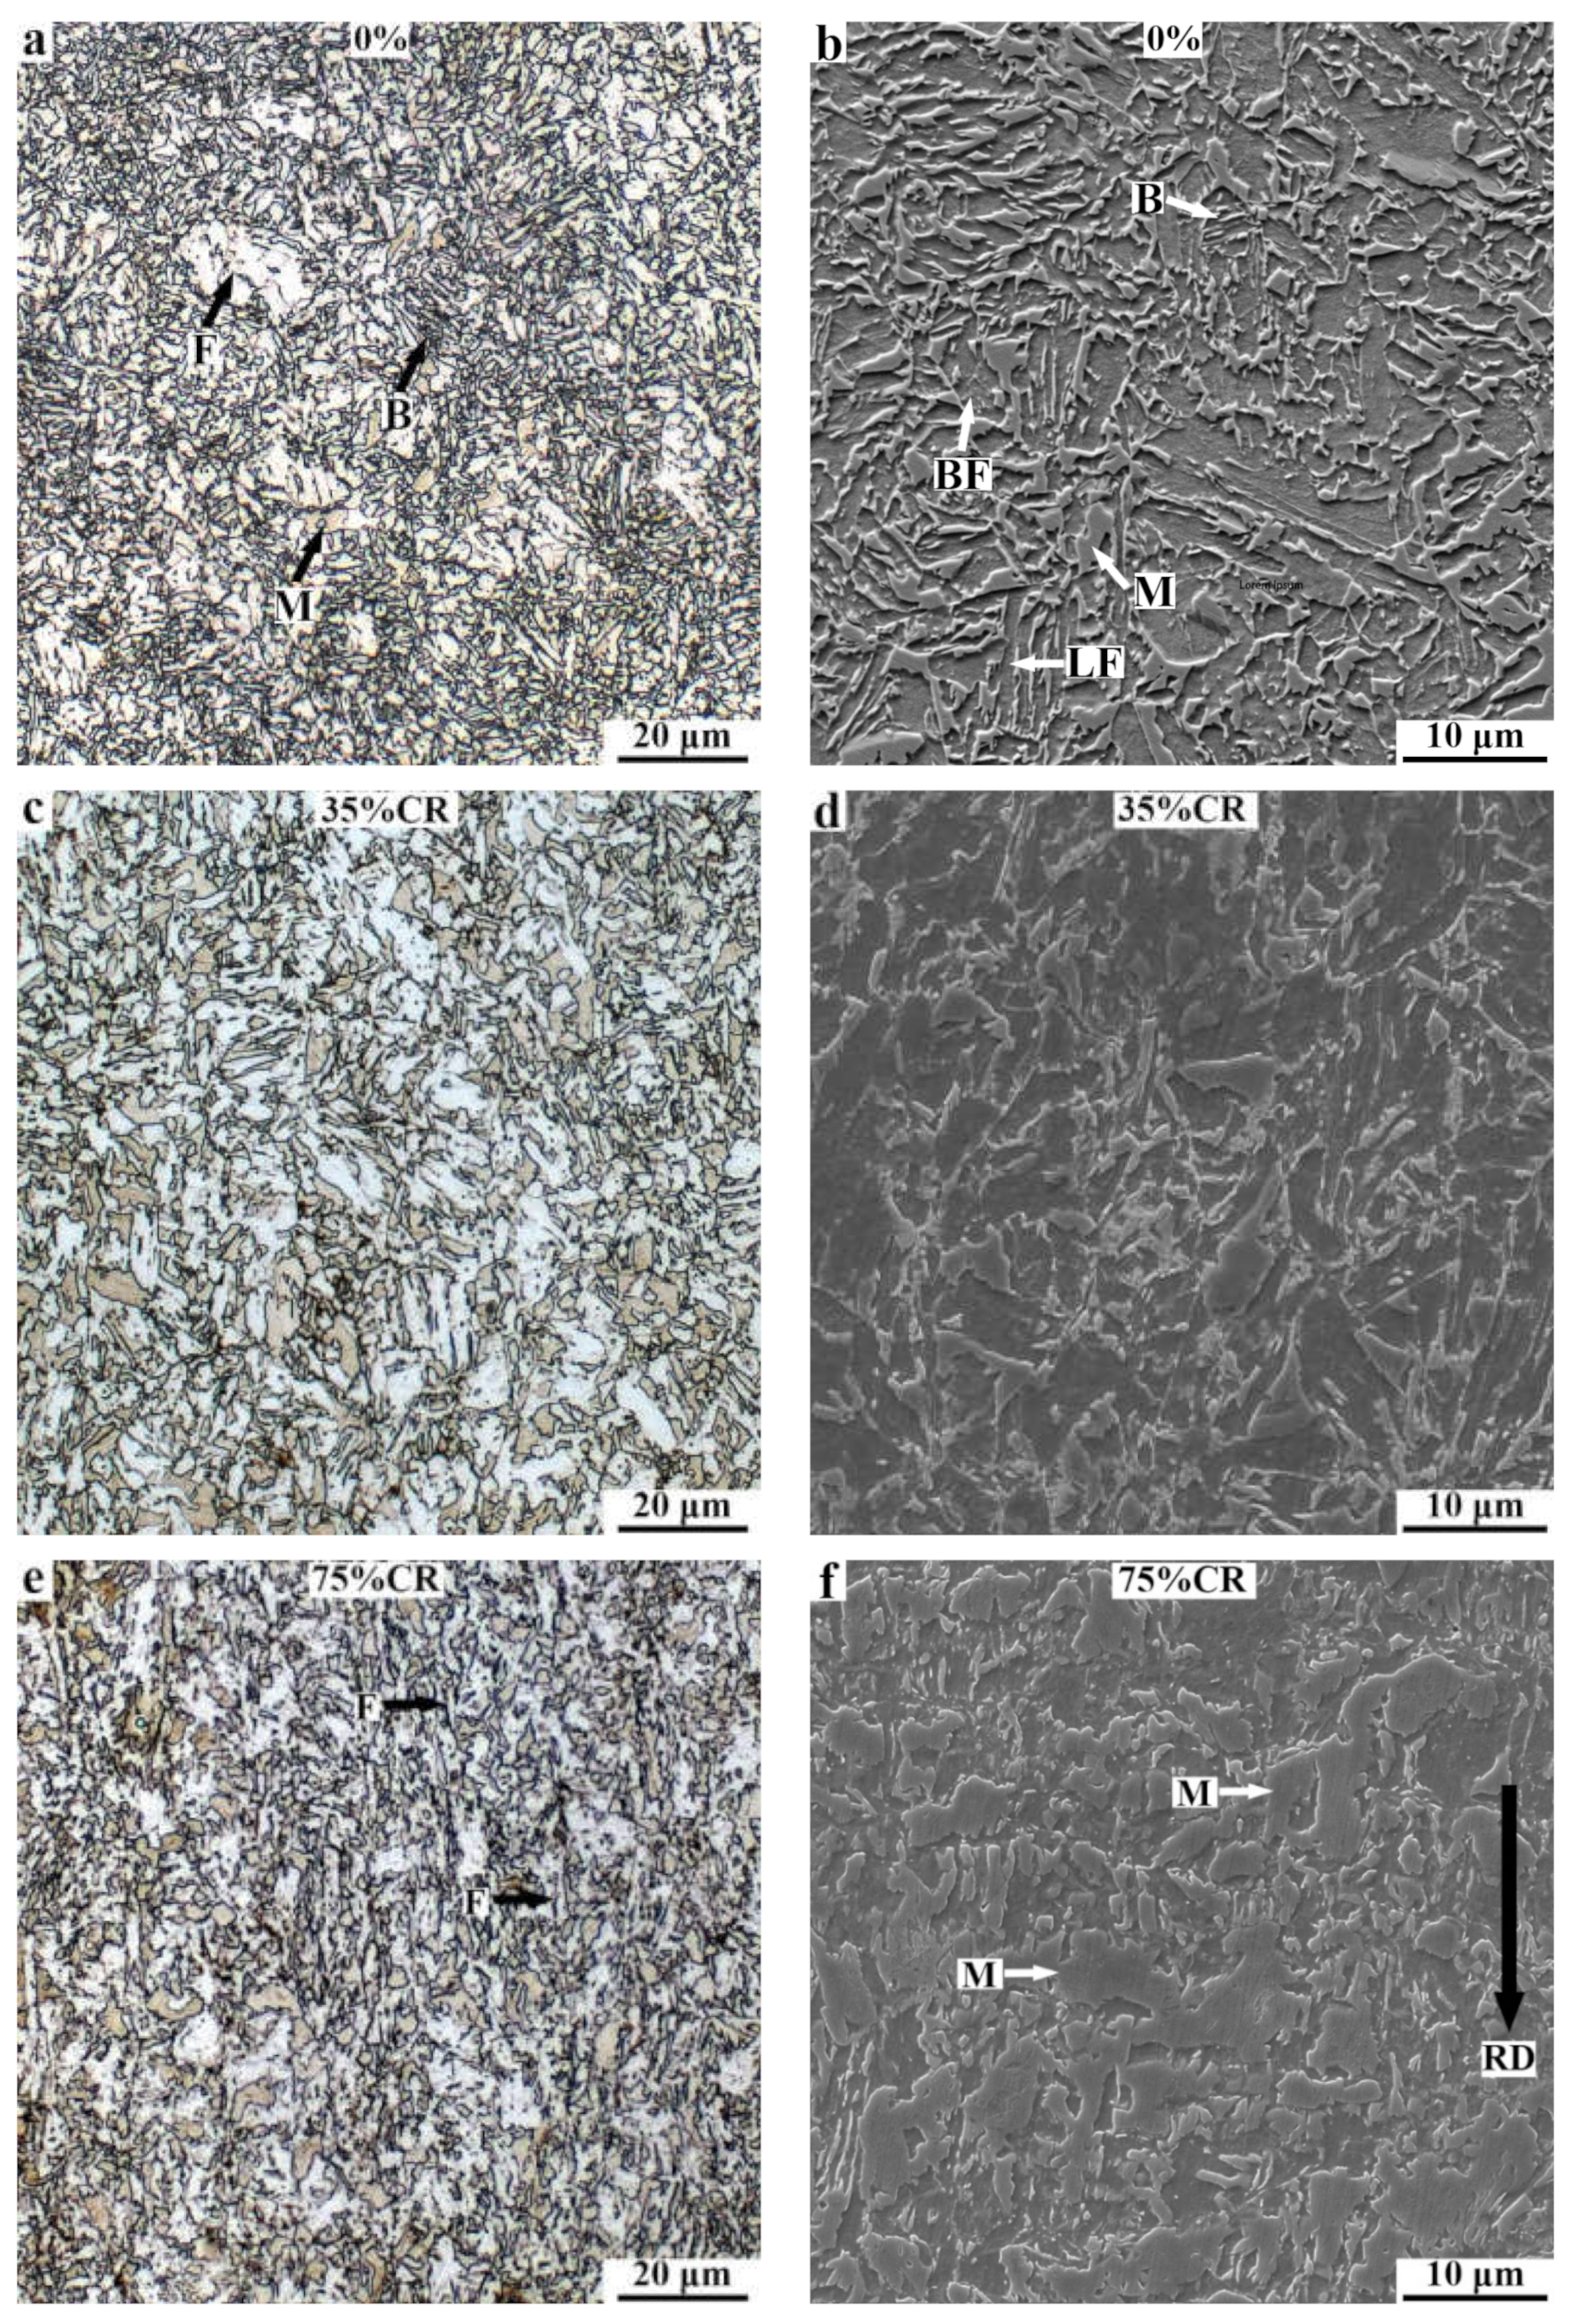
3.1. Initial Microstructures of 0.2C–1.7Si–1.9Mn wt% Steel

The OM and SEM micrographs of the initial microstructures of 0.2C–1.7Si–1.9Mn wt% steel with different cold reductions are shown in Figure 2. Due to the fast cooling rate and high content of Mn in steel, it is difficult for the pearlite transformation to occur during cooling. The microstructures of the as-received steel were mainly composed of bainite, ferrite, and martensite (Figure 2a,b). After 35% cold rolling, the morphological changes in the microstructures were tiny (Figure 2c,d). When the cold reduction was increased to 75%, the ferrite (white area in Figure 2e) was obviously elongated along the rolling direction. However, the martensite, as a hard phase, did not undergo obvious deformation but maintained its equiaxed morphology, as shown in Figure 2f.

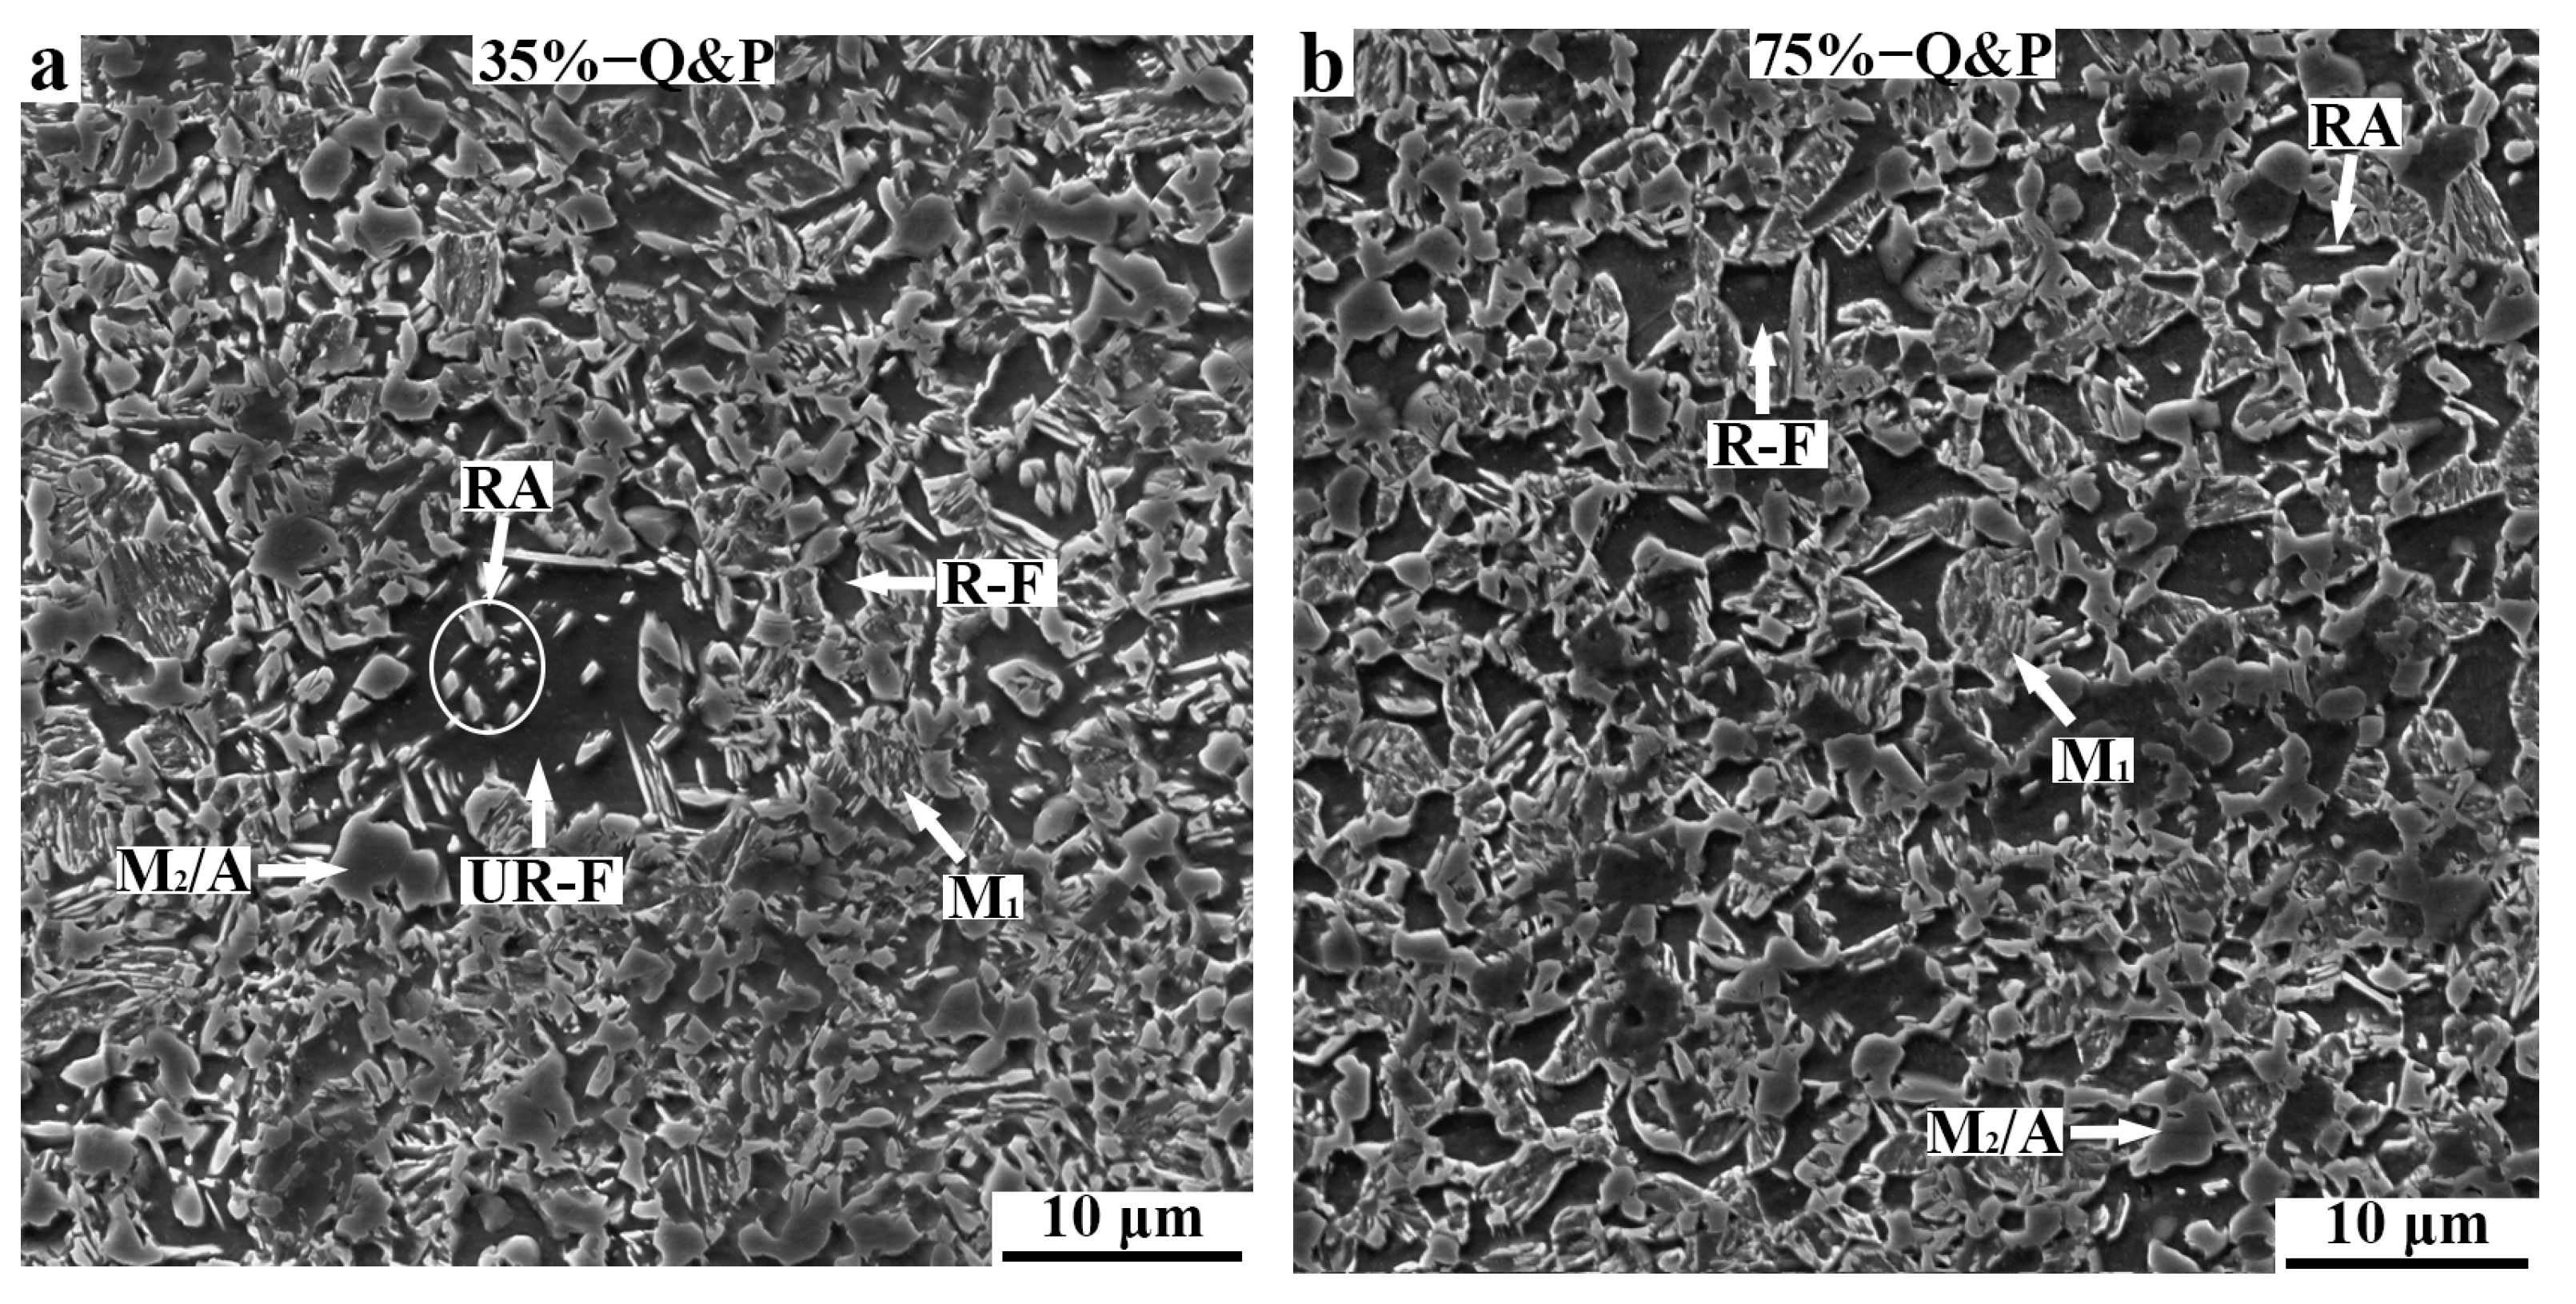
3.2. Microstructures of Q&P Samples

Figure 3 illustrates the SEM micrographs of the Q&P samples prepared with 35% and 75% cold reduction sheets at the austenitizing temperature of 810 °C. UR–F, R–F, and RA refer to the unrecrystallized ferrite, recrystallized ferrite, and retained austenite, respectively. M1 refers to the primary martensite, which was formed during first quenching and was tempered in the partitioning region. The M2/A island refers to the secondary martensite/carbon-enriched retained austenite. The second martensite was formed at the stage of second quenching to room temperature. Compared with M1, M2 was not tempered in partitioning, thus, it exhibited higher strength and low plastic deformation ability [14]. The ferrite, M1, retained austenite, and M2/A island could be identified by their different responses [15,16]. The results indicate that abundant, small-size recrystallized ferrite grains and a handful of large-size unrecrystallized ferrite grains were discovered in the 35%—Q&P sample. Some granular (or block) retained austenite grains existed in the unrecrystallized ferrite grains. In addition, some M1 and M2/A islands were present in the sample (Figure 3a). The microstructures of the Q&P sample prepared with the 75% CR sheet were different from those of the Q&P sample prepared with the 35% CR sheet. Large-size unrecrystallized ferrite was not discovered in the 75%—Q&P sample, and the size of recrystallized ferrite grain in the 75%—Q&P sample was larger than that in the 35%—Q&P sample (Figure 3b). Moreover, the content of M1 in the 35%—Q&P sample was higher than that in the 75%—Q&P sample.
The image-quality micrographs of the 35%—Q&P sample and 75%—Q&P sample analyzed by EBSD are shown in Figure 4. Austenite with a fcc crystal structure is highlighted in green. Ferrite and M1 with a bcc crystal structure are in gray. The light gray refers to ferrite, and the dark gray represents M1. The dark region refers to M2 for its high defect densities, and large quantities of substructures result in low image quality [17]. The results indicate that the prior cold reduction had significant effects on the morphology and grain size of ferrite and retained austenite. The effects can be summarized in the following aspects. Firstly, ferrite recrystallization occurred in the 35%—Q&P and 75%—Q&P samples; but, the grain size of the recrystallized ferrite in the 35%—Q&P sample was significantly smaller than that in the 75%—Q&P sample. Secondly, the contents of M1 and M2 in the 75%—Q&P sample were higher than those in the 35%—Q&P sample. Thirdly, abundant, small-size retained austenite and some large-size retained austenite coexisted in the 35%—Q&P sample, but the size of the retained austenite in the 75%—Q&P sample was more uniform (Figure 4a,b). The size distribution of the retained austenite in the 35%—Q&P sample and the 75%—Q&P sample is shown in Figure 4c. The results indicate that the percentages of retained austenite with a size below 0.05 μm2 and over 0.25 μm2 in the 35%—Q&P sample were both higher than those in the 75%—Q&P sample. The average size of retained austenite in the 35%—Q&P sample was smaller than that in the 75%—Q&P sample (0.112 μm2 vs. 0.123 μm2).
Figure 5 shows the typical TEM microstructures of the 35%—Q&P sample and 75%—Q&P sample. The TEM micrographs indicate that the large-size unrecrystallized and small-size recrystallized ferrite grains coexisted in the 35%—Q&P sample (Figure 5a,b), which is consistent with the EBSD results. Meanwhile, the retained austenite with irregular morphology and M2/A islands were distributed in the ferrite grain and at the grain boundary, respectively. Recrystallized ferrite, retained austenite, and M2/A islands were also present in the 75%—Q&P sample (Figure 5c). However, some M1 laths were discovered in the sample (Figure 5d).
The XRD patterns of the 35%—Q&P sample and 75%—Q&P sample prepared with 35% and 75% cold reduction sheets are shown in Figure 6. The patterns indicate that the intensities of (200)γ, (220)γ, and (311)γ of the two samples were similar, but the intensities of (200)α and (211)α of the 35%—Q&P sample were less than those of the 75%—Q&P sample. The integrated intensities of the (200)γ, (220)γ, (311)γ, (200)α, and (211)α peaks were used to quantify the volume fraction of the retained austenite. The results indicate that the volume fraction of the retained austenite in the 35%—Q&P sample was higher than that in the 75%—Q&P sample (14.0% vs. 11.0%).

3.3. Mechanical Properties

The engineering stress-strain plots of the 35%—Q&P sample and 75%—Q&P sample are shown in Figure 7. The mechanical properties are summarized in Table 1. The plots of the Q&P samples indicate that the engineering stresses first increased rapidly (elastic deformation) and then slowly (plastic deformation), before declining at the necking stage with the strain being increased. Compared with the 75%—Q&P sample, the 35%—Q&P sample had higher maximal strength and strain to fracture. The tensile strength and total elongation of the 35%—Q&P sample were higher than those of the 75%—Q&P sample (1194 MPa vs. 1164MPa, 19.18% vs. 18.11%). The product of strength and elongation (PSE) of the 35%—Q&P sample was as high as 24.37 GPa·%: 15.6% higher than that of the 75%—Q&P sample.
To further study the effect of prior cold reduction on the plasticity of Q&P steel, the true stress-strain plots and strain-hardening rate plots of the 35%—Q&P sample and 75%—Q&P sample are presented in Figure 8. The true stress-strain plots of the Q&P samples indicate that the true stresses first increased rapidly and then slowly before declining with the strain increased (Figure 8a). The strain-hardening rate (SHR) plots were calculated from the true stress-strain plots. The results indicate that the SHRs first decreased rapidly and then slowly with the true strain increased (Figure 8b). The criterion for necking [18,19] is shown as Equation (2). Necking occurs when the SHRs are equal to the true stress.
d σ T / d ε T = σ T   at   ε T = ε U
where d σ T / d ε T is the SHR, σ T is true stress, and ε T is true strain. ε U is the value of true strain corresponding to the beginning of necking. The corresponding true strain range of the uniform plastic deformation zone and necking zone of the Q&P samples is illustrated in Table 2. The results indicate that the true strain range of the uniform plastic deformation zone in the 35%—Q&P sample was larger than that in the 75%—Q&P sample. However, the true strain range of the necking zone in the 35%—Q&P sample was smaller than that in the 75%—Q&P sample. The results indicate that the higher total elongation of the 35%—Q&P sample was related to its better uniform elongation.
The SEM micrographs of the fracture surface of the 35%—Q&P sample and 75%—Q&P sample are shown in Figure 9. The fracture morphology of the two samples was dominated by voids, indicating that the fracture mode of the Q&P samples was ductile fracture. However, there were subtle but distinct differences in the fracture morphology of the two samples. Compared with the 75%—Q&P sample, the 35%—Q&P sample had more microcracks on the fracture surface, as shown by the red arrow in Figure 9a,c. Furthermore, the high-magnification fractography of the two samples indicate that the size of the voids in the 35%—Q&P sample was smaller than that in the 75%—Q&P sample (Figure 9b,d).

4. Discussion

4.1. Effect of Prior Cold Reduction on Microstructures of Q&P Samples

The hardness and strength of ferrite phase are lower than those of martensite phase. Deformation bands and other substructures form in ferrite grain after cold rolling, which can increase the total grain boundary area [20]. Meanwhile, cold rolling can increase the stored energy of the material due to the high dislocation density. The total ferrite grain boundary area and stored energy increase with the increase of cold reduction. The ferrite grain boundary and stored energy can provide nucleation sites and driving force, respectively, for the ferrite recovery and recrystallization upon intercritical annealing. Subsequently, the recrystallized ferrite grains grow. Compared with the 35% cold reduction sheet, the 75% cold reduction sheet could reduce the activation energy and temperature for ferrite recrystallization due to its higher stored energy and grain boundary density, thus, accelerating the ferrite recrystallization and growth [7,20]. Therefore, the grain size of recrystallized ferrite in the 75%—Q&P sample was coarser than that in the 35%—Q&P sample.
The austenite formation during intercritical annealing is significantly influenced by ferrite recovery and recrystallization, which affects the distribution and size of austenite [20,21,22]. The study of Yang et al. [20] indicates that austenite first forms on boundaries between elongated unrecrystallized ferrite grains during intercritical annealing, resulting in the band-like distribution of some austenite in steel parallel to the rolling direction. Some researchers proposed that complete recrystallization of the deformed structure in DP steel before austenite formation provides a random distribution of austenite; but, incomplete recrystallization gives rise to the formation of banded austenite grains [21,22]. However, the ferrite grains in the 35% and 75% cold reduction sheets grew into equiaxed shape through recovery and recrystallization at intercritical annealing, resulting in the retained austenite mainly presenting as blocky (or granular) type in the 35%—Q&P sample and 75%—Q&P sample. The grain size of the retained austenite is influenced by ferrite recovery and recrystallization. It is believed that the ferrite-austenite transformation is controlled by C diffusion [23]. When ferrite recrystallization occurs during intercritical annealing, the refined ferrite grain reduces the diffusion path of C from the ferrite grain to the grain boundary. The grain size of the recrystallized ferrite in the 35%—Q&P sample was smaller than that in the 75%—Q&P sample, which was conducive to the diffusion of C and promoted the homogenization of C distribution in austenite grains. The uniform distribution of C in the austenite grains can inhibit the occurrence of the austenite-martensite transformation at the local C-poor region within austenite grains during quenching. This may explain why the percentage of retained austenite with a size over 0.25 μm2 in the 35%—Q&P sample was higher than that in the 75%—Q&P sample. Meanwhile, the study of Ding et al. [24] indicates that small-sized recrystallized ferrite grains can inhibit the growth of adjacent austenite grains and refine the austenite grain size. The finer, recrystallized ferrite grains in the 35%—Q&P sample led to a percentage of retained austenite with size below 0.05 μm2, higher than that in the 75%—Q&P sample.
Furthermore, the prior cold rolling can directly influence the kinetics of austenite formation during intercritical annealing. It was considered that phase transformation in deformed ferrite was faster than recrystallization [25]. Compared with the 35% cold reduction sheet, the 75% cold reduction sheet with higher storage energy was more prone to ferrite-austenite transformation during intercritical annealing. This led to a larger grain size of austenite in the 75% cold reduction sheet than in the 35% cold-rolled sheet after intercritical annealing. In addition, the finer recrystallized ferrite grains in the 35% cold-rolled sheet also refined the adjacent austenite grains. The coarser austenite grains in the 75% cold reduction sheet had lower thermal stability, which led to the transformation of more austenite to M1 during the primary quenching. Meanwhile, the coarser austenite in the 75% cold reduction sheet was not conducive to C diffusion, which led to the uneven distribution of C in the austenite grains after the partitioning process. M2 formed in the C-poor region within the austenite grains at the second quenching stage, resulting in the formation of M2/A islands. This is the reason why the amount of retained austenite in the 35%—Q&P sample was higher than that in the 75%—Q&P sample.

4.2. The Relationship between Microstructure and Mechanical Properties of Q&P Steel

The austenite transforms to strain-induced martensite (transformation-induced plasticity, TRIP) during plastic deformation, which can reduce the local stress concentration and delay the formation of microcracks, thereby improving the uniform elongation of the material [26]. In addition, the formed strain-induced martensite as a hard phase can increase the strength. Therefore, the TRIP effect is considered the key factor for Q&P steel with a good combination of strength and ductility [4,5,6]. The TRIP effect is influenced by the volume fraction and mechanical stability of austenite [4,5,6]. The 35%—Q&P sample with a higher content of retained austenite strengthened the TRIP effect, thereby improving the uniform elongation and tensile strength of the 35%—Q&P sample. In addition, some studies indicated that retained austenite with a different mechanical stability is conductive to continuous transformation and expands the range of the TRIP effect [27,28,29]. It is believed that morphology and size have great impact on the mechanical stability of retained austenite [4]. The study of Xiong et al. [10] indicated that film-type retained austenite distributed between martensite laths presents higher mechanical stability than that of blocky-type retained austenite. However, the retained austenite in the 35%—Q&P and 75%—Q&P samples mainly presented as blocky type. Therefore, the mechanical stability of the retained austenite in these two samples was mainly affected by grain size. The percentages of retained austenite with a size below 0.05 μm2 and over 0.25 μm2 in the 35%—Q&P sample were higher than those in the 75%—Q&P sample. Large-size retained austenite with low mechanical stability transforms to martensite at low strain, which can produce strain hardening and stimulate the transformation of small-size retained austenite with high stability to martensite at large strain, thus, strengthening the TRIP effect. Therefore, the uniform elongation of the 35%—Q&P sample was higher than that of the 75%—Q&P sample and is related to the higher volume fraction of retained austenite. Additionally, the uneven grain size of the retained austenite in the 35%—Q&P steel improved the uniform elongation.
The necking zone reflects the post-necking elongation on the stress-strain plots. The necking zone is mainly controlled by the stress concentration, the local microcrack initiation, and the crack propagation [30]. The necking zone of the 35%—Q&P sample was smaller than that of the 75%—Q&P sample, which may be related to the finer recrystallized ferrite grains in the 35%—Q&P sample. Stress concentration and void nucleation usually occur at the phase interface or the grain boundary [31]. The study of Rykavets et al. [32] also indicated that the microcracks are mainly located at the phase interface. A smaller grain size with higher grain boundary density is conductive to dimple nucleation at the grain boundary [33]. The voids form along the interface, and the microcracks are formed. The finer recrystallized ferrite grains in the 35%—Q&P sample facilitated the formation of voids and microcracks, explaining why the necking zone range in the 35%—Q&P sample was smaller than that in the 75%—Q&P sample. In addition, more void nucleation points reduced the average dimple size of fracture [33], resulting in the void size of the 35%—Q&P sample being less than the 75%—Q&P sample.

5. Conclusions

  • Compared with the 75%—Q&P sample, the 35%—Q&P steel had finer recrystallized ferrite grains and smaller average grain size of retained austenite, as well as a more uneven size distribution.
  • The 35%—Q&P sample had better total elongation (19.18% vs. 18.11%) and higher PSE (24.37 GPa·% vs. 21.09 GPa·%) than the 75%—Q&P sample.
  • The higher PSE of the 35%—Q&P sample may be related to the higher content and uneven size distribution of retained austenite, which can strengthen the TRIP effect and improve its uniform elongation.

Author Contributions

Conceptualization, G.Z. and D.X.; methodology, D.X.; investigation, Y.C.; data curation, Y.C. and S.B.; writing—original draft preparation, D.X.; writing—review and editing, S.B. and G.Z. All authors have read and agreed to the published version of the manuscript.

Funding

This research was funded by Postdoctoral Science Foundation of China (grant No. 2020M682494) and Natural Science Foundation and Major Technology Innovation of Hubei Province (grant No. 2017AAA113).

Institutional Review Board Statement

Not applicable.

Informed Consent Statement

Not applicable.

Data Availability Statement

Data sharing is not applicable.

Acknowledgments

Authors would like to thank Zhen Wang at the Analytical & Testing Center of Wuhan University of Science and Technology for the help on EBSD analysis.

Conflicts of Interest

The authors declare no conflict of interest.

References

  1. Matlock, D.K.; Speer, J.G. Third Generation of AHSS: Microstructure Design Concepts. In Proceedings of the International Conference on Micrstructure and Texture in Steels and Other Materials, Jamshedpur, India, 5–7 February 2008; Haldar, A., Suwas, S., Bhattacharjee, D., Eds.; Springer: Jamshedpur, India, 2008; pp. 185–205. [Google Scholar]
  2. Speer, J.G.; Matlock, D.K.; Cooman, B.C.D. Carbon partitioning into austenite after martensite transformation. Acta Mater. 2003, 51, 2611–2622. [Google Scholar] [CrossRef]
  3. Speer, J.G.; Matlock, D.K.; Cooman, B.C.D. Comments on “On the definitions of paraequilibrium and orthoequilibrium”. Scr. Mater. 2004, 50, 697–699. [Google Scholar]
  4. Tan, X.D.; Xu, Y.B.; Ponge, D.; Yang, X.L.; Hu, Z.P.; Peng, F.; Ju, X.W.; Wu, D.; Raabe, D. Effect of intercritical deformation on microstructure and mechanical properties of a low-silicon aluminum-added hot-rolled directly quenched and partitioned steel. Mater. Sci. Eng. A 2016, 656, 200–215. [Google Scholar] [CrossRef]
  5. Liu, L.; He, B.B.; Cheng, G.J.; Yen, H.W.; Huang, M.X. Optimum properties of quenching and partitioning steels achieved by balancing fraction and stability of retained austenite. Scr. Mater. 2018, 150, 1–6. [Google Scholar] [CrossRef]
  6. Finfrock, C.B.; Clarke, A.J.; Thomas, G.A.; Clarke, K.D. Austenite stability and strain hardening in C–Mn–Si quenching and partitioning steels. Metall. Mater. Trans. A 2020, 51, 2025–2034. [Google Scholar] [CrossRef]
  7. Ueji, R.; Tsuji, N.; Minamino, Y.; Koizumi, Y. Effect of rolling reduction on ultrafine grained structure and mechanical properties of low-carbon steel thermomechanically processed from martensite starting structure. Sci. Technol. Adv. Mater. 2004, 5, 153–162. [Google Scholar] [CrossRef] [Green Version]
  8. Mazaheri, Y.; Kermanpur, A.; Najafizadeh, A.; Kalashami, A.G. Kinetics of ferrite recrystallization and austenite formation during intercritical annealing of the cold-rolled ferrite/martensite duplex structures. Metall. Mater. Trans. A 2016, 47, 1040–1051. [Google Scholar] [CrossRef]
  9. Wang, F.; Qian, D.S.; Lu, X.H. Effect of prior cold deformation on the stability of retained austenite in GCr15 bearing steel. Acta Metall. Sin. 2019, 32, 107–115. [Google Scholar] [CrossRef] [Green Version]
  10. Xiong, X.C.; Chen, B.; Huang, M.X.; Wang, J.F.; Wang, L. The effect of morphology on the stability of retained austenite in a quenched and partitioned steel. Scr. Mater. 2013, 68, 321–324. [Google Scholar] [CrossRef]
  11. Mandal, G.; Ghosh, S.K.; Bera, S.; Mukherjee, S. Effect of partial and full austenitisation on microstructure and mechanical properties of quenching and partitioning steel. Mater. Sci. Eng. A 2016, 676, 56–64. [Google Scholar] [CrossRef]
  12. Kang, T.; Zhao, Z.; Liang, J.; Guo, J.; Zhao, Y. Effect of the austenitizing temperature on the microstructure evolution and mechanical properties of Q&P steel. Mater. Sci. Eng. A 2020, 771, 1–8. [Google Scholar]
  13. Su, Y.Y.; Chiu, L.H.; Chuang, T.L.; Huang, C.L.; Wu, C.Y.; Liao, K.C. Retained austenite amount determination comparison in JIS SKD11 steel using quantitative metallography and X-ray diffraction methods. Adv. Mater. Res. 2018, 482, 1165–1168. [Google Scholar] [CrossRef]
  14. De Knijf, D.; Petrov, R.; Föjer, C.; Kestens, L.A. Effect of fresh martensite on the stability of retained austenite in quenching and partitioning steel. Mater. Sci. Eng. A 2014, 615, 107–115. [Google Scholar] [CrossRef]
  15. Santofimia, M.J.; Zhao, L.; Sietsma, J. Microstructural evolution of a low-carbon steel during application of quenching and partitioning heat treatments after partial austenitization. Metall. Mater. Trans. A 2009, 40, 46–57. [Google Scholar] [CrossRef] [Green Version]
  16. Santofimia, M.J.; Petrov, R.H.; Zhao, L.; Sietsma, J. Microstructural analysis of martensite constituents in quenching and partitioning steels. Mater. Charact. 2014, 92, 91–95. [Google Scholar] [CrossRef]
  17. HajyAkbary, F.; Sietsma, J.; Miyamoto, G.; Kamikawa, N.; Petrov, R.H.; Furuhara, T.; Santofimia, M.J. Analysis of the mechanical behavior of a 0.3 C–1.6 Si–3.5 Mn (wt%) quenching and partitioning steel. Mater. Sci. Eng. A 2016, 677, 505–514. [Google Scholar] [CrossRef]
  18. Abbaschian, R.; Abbaschian, L.; Reed-Hill, R.E. Physical Metallurgy Principles, 4th ed.; Cengage Learning: Stamford, CT, USA, 2009; pp. 149–151. [Google Scholar]
  19. Saeglitz, M.; Krauss, G. Deformation, fracture, and mechanical properties of low-temperature-tempered martensite in SAE 43xx steels. Metall. Mater. Trans. A 1997, 28, 377–387. [Google Scholar] [CrossRef]
  20. Yang, D.; Brown, E.; Matlock, D.; Krauss, G. Ferrite recrystallization and austenite formation in cold-rolled intercritically annealed steel. Metall. Trans. A 1985, 16, 1385–1391. [Google Scholar] [CrossRef]
  21. Huang, J.; Poole, W.J.; Militzer, M. Austenite formation during intercritical annealing. Metall. Mater. Trans. A 2004, 35, 3363–3375. [Google Scholar] [CrossRef]
  22. Barbier, D.; Germain, L.; Hazotte, A.; Gouné, M.; Chbihi, A. Microstructures resulting from the interaction between ferrite recrystallization and austenite formation in dual-phase steels. J. Mater. Sci. 2015, 50, 374–381. [Google Scholar] [CrossRef]
  23. Speich, G.R.; Demarest, V.A.; Miller, R.L. Formation of austenite during intercritical annealing of dual-phase steels. Metall. Mater. Trans. A 1981, 12, 1419–1428. [Google Scholar] [CrossRef]
  24. Ding, R.; Tang, D.; Zhao, A.; Guo, H.; He, J.; Zhi, C. Effect of ultragrain refinement on quenching and partitioning steels manufactured by a novel method. Mater. Des. 2015, 87, 640–649. [Google Scholar] [CrossRef]
  25. Peranio, N.; Li, Y.J.; Roters, F.; Raabe, D. Microstructure and texture evolution in dual-phase steels: Competition between recovery, recrystallization, and phase transformation. Mater. Sci. Eng. A 2010, 527, 4161–4168. [Google Scholar] [CrossRef]
  26. Bhandarkar, D.; Zackay, V.F.; Parker, E.R. Stability and mechanical properties of some metastable austenitic steels. Metall. Trans. 1972, 3, 2619–2631. [Google Scholar] [CrossRef] [Green Version]
  27. Yi, H.L.; Chen, P.; Bhadeshia, H. Optimizing the morphology and stability of retained austenite in a δ-TRIP steel. Metall. Mater. Trans. A 2014, 45, 3512–3518. [Google Scholar] [CrossRef]
  28. Zhou, Q.; Qian, L.; Tan, J.; Meng, J.; Zhang, F. Inconsistent effects of mechanical stability of retained austenite on ductility and toughness of transformation-induced plasticity steels. Mater. Sci. Eng. A 2013, 578, 370–376. [Google Scholar] [CrossRef]
  29. Xie, Z.J.; Ren, Y.Q.; Zhou, W.H.; Yang, J.R.; Shang, C.J.; Misra, R.D.K. Stability of retained austenite in multi-phase microstructure during austempering and its effect on the ductility of a low carbon steel. Mater. Sci. Eng. A 2014, 603, 69–75. [Google Scholar] [CrossRef]
  30. Xu, Y.; Tan, X.; Yang, X.; Hu, Z.; Peng, F.; Wu, D.; Wang, G. Microstructure evolution and mechanical properties of a hot-rolled directly quenched and partitioned steel containing proeutectoid ferrite. Mater. Sci. Eng. A 2014, 607, 460–475. [Google Scholar] [CrossRef]
  31. Wang, Z.; Huang, M.X. Optimising the strength-ductility-toughness combination in ultra-high strength quenching and partitioning steels by tailoring martensite matrix and retained austenite. Inter. J. Plast. 2020, 134, 102851. [Google Scholar] [CrossRef]
  32. Rykavets, Z.M.; Bouquerel, J.; Vogt, J.B.; Duriagina, Z.A.; Kulyk, V.V.; Tepla, T.L.; Bohun, L.I.; Kovbasyuk, T.M. Investigation of the microstructure and properties of TRIP 800 steel subjected to low-cycle fatigues. Prog. Phys. Met. 2019, 20, 620–633. [Google Scholar] [CrossRef]
  33. Xu, D.; Wan, X.; Yu, J.; Xu, G.; Li, G. Effect of cold deformation on microstructures and mechanical properties of austenitic stainless steel. Metals 2018, 8, 522. [Google Scholar] [CrossRef] [Green Version]
Figure 1. (a) Expansion curve of hot-rolled 0.2C–1.7Si–1.9Mn wt% steel during heating and cooling processes and (b) Q&P treatment adopted in this study.
Metals 12 00799 g001
Figure 2. OM and SEM micrographs of (a,b) initial HR, (c,d) 35%, and (e,f) 75% cold reduction 0.2C–1.7Si–1.9Mn wt% sheets. B, F, and M refer to bainite, ferrite, and martensite, respectively. The rolling direction (RD) is shown in (f).
Metals 12 00799 g002
Figure 3. SEM micrographs of (a) 35%—Q&P sample and (b) 75%—Q&P sample. M1, M2/A, R–F, UR–F, and RA in figures refer to primary martensite, secondary martensite/retained austenite, recrystallized ferrite, unrecrystallized ferrite, and retained austenite, respectively.
Metals 12 00799 g003
Figure 4. The image quality micrographs of (a) 35%—Q&P sample and (b) 75%—Q&P sample analyzed by EBSD, (c) grain size distribution of retained austenite in 35%—Q&P sample and 75%—Q&P sample.
Metals 12 00799 g004
Figure 5. The TEM micrographs of (a,b) 35%—Q&P sample and (c,d) 75%—Q&P sample.
Metals 12 00799 g005
Figure 6. XRD spectra of 35%—Q&P sample and 75%—Q&P sample. The volume fractions of retained austenite of the two samples are presented in the figure.
Metals 12 00799 g006
Figure 7. The engineering stress-strain plots of 35%—Q&P sample and 75%—Q&P sample.
Metals 12 00799 g007
Figure 8. (a) True stress-strain plots and (b) strain-hardening rate plots of 35%—Q&P sample and 75%—Q&P sample.
Metals 12 00799 g008
Figure 9. Low and high magnification fractography of fracture surfaces of (a,b) 35%—Q&P sample and (c,d) 75%—Q&P sample.
Metals 12 00799 g009
Table 1. The yield strength (YS), tensile strength (TS), total elongation (EL), and product of strength and elongation (PSE) of 35%—Q&P sample and 75%—Q&P sample.
SamplesYS/MPaTS/MPaEL/%PSE/GPa·%
35%—Q&P513119419.1824.37
75%—Q&P536116418.1121.09
Table 2. The true strain (εT) ranges of uniform plastic deformation zone and necking zone of 35%—Q&P sample and 75%—Q&P sample.
SampleUniform Plastic Deformation ZoneNecking Zone
35%—Q&PεT < 0.1450.145 < εT < 0.159
75%—Q&PεT < 0.1370.137 < εT < 0.156
Publisher’s Note: MDPI stays neutral with regard to jurisdictional claims in published maps and institutional affiliations.

